Abstract
The interaction of disinfectants with bromide/iodide ions and natural organic matter (NOM) generates brominated/iodinated disinfection byproducts (Br/I-DBPs), known for their heightened cytotoxicity and genotoxicity relative to chlorinated DBPs. This study investigated Br/I-DBP formation during sodium hypochlorite (NaClO) disinfection of lignin-containing synthetic water by quantifying adsorbable organic halogens (AOX) and trihalomethanes (THMs). Disinfection of bromide-containing water yielded a bromide ion (Br−) to adsorbable organic bromine (AOBr) conversion rate of approximately 60%, with bromine within THMs accounting for about 30% of the total AOBr, indicating significant brominated DBP formation where THMs represent a major fraction. Conversely, iodide ion (I−) conversion to adsorbable organic iodine (AOI) is minimal, suggesting negligible iodinated DBP formation under NaClO disinfection. Examination of key parameters revealed that brominated THM (Br-THM) formation decreased with increasing lignin concentration, while iodinated THM (I-THM) formation increased. The effect of chlorine dose differed: Br-THM formation exhibited an initial increase followed by a decrease at higher doses, whereas I-THM formation consistently decreased. Both Br-THM and I-THM formation increased with higher bromide or iodide ion concentration and with increasing pH. These results highlight the distinct pathways and influencing factors governing brominated versus iodinated DBP formation in lignin-containing waters disinfected with hypochlorite.
1. Introduction
Disinfection is an important drinking water treatment to protect people from infectious pathogenic microorganisms [1]. Sodium hypochlorite (NaClO) is more and more widely used for disinfectants in drinking water treatment plants because of its safety, easy operation, and high effectiveness for microorganism inactivation and residual biocidal effect. However, chlorine disinfectants react with natural organic matter (NOM) in the water to form chlorinated disinfection byproducts (Cl-DBPs) [2]. Additionally, bromide ion (Br−) and iodide ion (I−) in source water leads to the formation of brominated and iodinated disinfection byproducts (Br-DBPs and I-DBPs), posing adverse health effects to humans [3,4,5]. Mammalian cell toxicity results have shown that iodoform (CHI3) is 60 and 146 times more cytotoxic than bromoform (CHBr3) and chloroform (CHCl3), respectively [6,7]. In recent years, many researchers have utilized the comprehensive parameter Adsorbable Organic Halogens (AOX) to assess the formation of halogenated DBPs in water after disinfection. AOX refers to the fraction of organic halogens that can be adsorbed by activated carbon, encompassing AOCl, AOBr, and AOI, but excluding fluorine compounds [8]. AOX is a collective parameter and does not represent the concentration of any single specific compound. The vast majority of AOX compounds possess some level of toxicity. THMs constitute one of the major components of AOX and are currently regulated in China’s standard for drinking water quality. Therefore, investigating the formation mechanisms of trihalomethanes during disinfection holds significant practical importance for ensuring drinking water safety.
Model organic compounds such as substituted phenols, humic acid, fulvic acid, and amino acids are viewed as surrogates of NOM and used to investigate the DBP formation mechanisms. The humic substances in terrestrial NOM are largely lignin-derived [9]. Lignin in NOM have often been associated with the tendency to form halogenated DBPs upon chlorination [10]. Due to the ubiquitous presence of lignin in the terrestrial environment, its recalcitrant nature, and its activated aromatic structures which are known to react readily with chlorine may lead to high production of DBPs in drinking water [11]. Therefore, a better understanding of the role of lignin in the formation of DBPs is acquired to better manage DBP precursors in source water and reduce the DBP formation during drinking water treatment.
In this study, the total formation of halogenated disinfection byproducts during NaClO disinfection is measured. Based on this measurement, the proportion of THMs among all DBPs is calculated to verify whether THMs constitute the predominant DBPs during chlorination. Finally, the formation patterns of THMs during NaClO disinfection are investigated, exploring the effects of organic matter concentration, halide ion concentration, disinfectant dosage, and pH on THMs formation.
2. Materials and Methods
2.1. Materials
The lignin is obtained from Aladdin (Shanghai, China). KI and KBr are obtained from Hengxing Chemical Preparation Co., Ltd. (Tianjin, China). The methyl tert-butyl ether (MTBE) is obtained from Mallinckrodt Baker (Phillipsburg, NJ, USA). The exception of the sodium hypochlorite solution (10~15% active chlorine, Sigma-Aldrich (St. Louis, MO, USA), reagent grade). The experimental water is provided by Milli-Q ultrapure system Merck (Darmstadt, Germany). All chemical reagents used in tests are analytical grade. The solution pH is adjusted using a buffer solution prepared from phosphoric acid and phosphate salts (purchased from, Merck (Darmstadt, Germany)).
2.2. Experimental Procedure
A certain amount of lignin, Br−, and I− are added to deionized water to simulate filtered raw water. Disinfectant is performed with free available chlorine (FAC, sum of [HOCl] and [ClO−]) by using a specific dosage of NaClO, in darkness at 25 °C for 72 h [12]. Residual chlorine is quenched with Na2SO3 before measuring disinfection byproduct concentrations. While maintaining other constant parameters, the concentrations of lignin, Br−, available chlorine, and pH are individually varied in the mixed system. THMs generated during disinfection are analyzed to investigate the impact of these four variables on THM formation. All experiments were performed at least three times in parallel, with standard deviation of replicates <6.5%, LOQ = 1 μg/L, LOD = 0.2 μg/L.
2.3. Pretreatment Method
The ten THMs are pretreated using liquid–liquid extraction. Prior to sample pretreatment, reducing agent Na2SO3 is added to quench oxidants and terminate reactions. An amount of 30 mL of the quenched water sample and 6 g anhydrous Na2SO4 are transferred to a vial with a rubber septum. After Na2SO4 dissolving completely, 3 mL of methyl tert-butyl ether (MTBE) is added as the extraction solvent and extraction time is 15 min. Following 15 min of phase separation, approximately 1 mL of the upper organic phase is transferred to an GC vial (Agilent, St. Clara, CA, USA).
2.4. Analytical Method
The generated AOX are pyrolyzed into hydrogen halide gases (HX) using a MultiX 2500 Total Organic Halogen Analyzer (Analytik Jena, Jena, Germany). The generated gases are completely transferred and absorbed in a 200 mg/L Na2S solution. The halide ion concentration in the absorption solution is subsequently measured using Thermo Fisher Scientific Integrion Multifunctional High-Pressure Ion Chromatograph (Thermo Fisher, Waltham, MA, USA). The AOX formation level is then determined based on these measurements.
The THMs can be detected using an Agilent 7890A gas chromatography (Agilent, St. Clara, CA, USA) equipped with a micro-electron capture detector (μ-ECD), due to their high volatility and the presence of halogen atoms with strong electronegativity. The calibration curves of Br-THMs (CHCl3/CHCl2Br/CHClBr2/CHBr3) and I-THMs (CHCl2I/CHBr2I) can be found in Supplementary Materials.
2.5. Utilization Factors and Insertion Factor
During chlorination disinfection, inorganic bromine/iodine undergoes transformation into organic brominated/iodinated compounds. To investigate conversion extent, two parameters are introduced: halogen utilization factors (HUFs) and halogen incorporation factors (HIFs). Fang et al. [13] employed these parameters to examine the formation of halogenated disinfection byproducts. The calculation formulas are defined as follows, with results expressed as percentages.
To investigate the conversion of inorganic halogens ion into organic halogens, the HUFs are introduced and categorized as bromine utilization factor (BUF) and iodine utilization factor (IUF) depending on the halide ion involved.
To investigate the conversion of inorganic halide ion into THMs, the HIFs are introduced and categorized as the bromide insertion factor (BIF) and iodide insertion factor (IIF), depending on the halide ion involved.
3. Results and Discussions
3.1. The Formation of AOBr and AOI
NaClO disinfection experiments are performed on lignin solutions (5 mg-C/L) containing varying concentrations of Br− to investigate the formation of AOBr. The results are shown in Figure 1. As bromide ion concentration increases, the formation of AOBr gradually rises, while the BUFAOBr progressively decreases. When Br− dosage increases from 5 μmol/L to 25 μmol/L, AOBr production rises from 3.2 μmol/L to 11.9 μmol/L, whereas BUFAOBr declines from 64.6% to 47.6%.
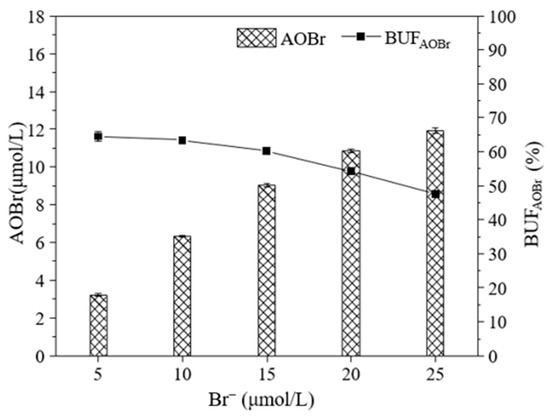
Figure 1.
The generation of AOBr when disinfected with NaClO. Experimental conditions: lignin = 5 mg-C/L; FAC = 15 mg/L; pH = 7.0 ± 0.2.
NaClO possesses strong oxidizing capacity. According to Deborde and von Gunten [14], at pH 7.0, the rate constant for Br− oxidation to HOBr/BrO− by HOCl/ClO− reaches 1.2 × 10³ M−1s−1, enabling rapid conversion of Br− to HOBr/BrO−. HOBr exhibits high electrophilic substitution activity, readily reacting with active sites on NOM to form Br-DBPs. Westerhoff et al. [15] confirmed this mechanism through comparative analysis of 13C-NMR spectra demonstrating distinct reactivity differences between HOCl and HOBr with NOM. Moreover, HOBr can generate bromine molecular (Br2) during reactions with NOM, which subsequently displaces chlorine atoms in Cl-DBPs through halogen exchange reactions [16]. Consequently, NaClO disinfection achieves high conversion efficiency from Br− to Br-DBPs. However, at elevated Br− concentrations, the dosage of NaClO limits the conversion of Br− to HOBr/BrO−, resulting in the observed decrease in BUFAOBr with increasing Br− levels.
Figure 2 illustrates the proportion of Br-THMs within AOBr during sodium hypochlorite disinfection. As shown, when Br− dosage increased from 5 μmol/L to 25 μmol/L, the Br-THMs/AOBr ratio rose from 20.2% to 38.4%. Although Br-THMs constitute a significant portion of Br-DBPs, 60–80% of Br-DBPs exist in other forms. According to Hossein Pourmoghaddas et al. [17], the ratio of haloacetic acids (HAAs) to adsorbable organic halogens (AOX) approximates 30% during NaClO disinfection. Conversely, Hua et al. [18] reported that dihaloacetonitriles (DHANs) exhibit higher bromine utilization efficiency compared to THMs and HAAs in chlorinated systems. Viewing the diverse opinions on the conversion of inorganic halide ion, this study only focuses on the formation of THMs.
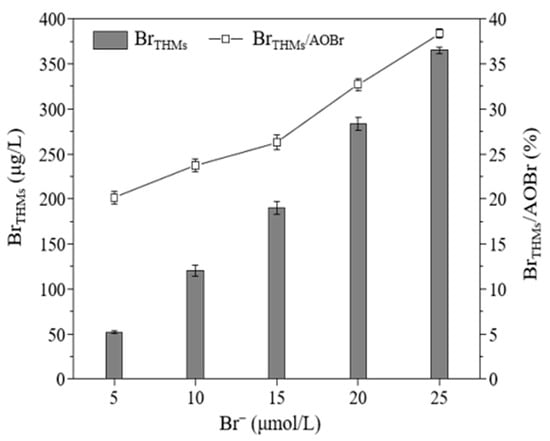
Figure 2.
The formation of Br-THMs and their proportion in AOBr when disinfected with NaClO. Experimental conditions: lignin = 5 mg-C/L; FAC = 15 mg/L; pH = 7.0 ± 0.2.
To investigate the formation of AOI after 72 h NaClO disinfection, lignin solutions containing I− concentrations of 1 μmol/L, 2 μmol/L, 3 μmol/L, 4 μmol/L, and 5 μmol/L are disinfected. Experimental conditions including lignin concentration, NaClO dosage, and pH are maintained consistently with AOBr.
In this experiment, no AOI is detected at any I− dosage level, indicating negligible formation of I-DBPs during NaClO disinfection. Although HOCl/ClO− rapidly oxidizes I− to reactive iodine species HOI/OI− with a rate constant of 1.08 × 10⁸ M−1s−1 (pH 7.0)—theoretically favoring substantial I-DBP generation—further oxidation of HOI/OI− to stable iodate (IO3−) occurs at 1.4 × 10² M−1s−1 [19]. This rapid IO3− conversion pathway effectively suppresses I-DBP formation. Concurrently, HOCl/ClO− and HOBr/OBr− competitively displace iodine atoms in nascent I-DBPs through halogen exchange reactions, exhibiting high-rate constants of 3.5 × 10⁸ M−1s−1 (chlorination) and 4.0 × 10⁸ M−1s−1 (bromination) at pH 7.0 [20]. These secondary reactions further deplete potential I-DBPs.
THMs formation exhibits divergent patterns under varying disinfection conditions. Therefore, this following study focuses on investigating the impact of key process parameters on THMs generation during sodium hypochlorite disinfection.
3.2. Determination of THMs Formation from Lignin Chlorination Containing Only Br−
3.2.1. The Effect of the Lignin Concentration on the Formation of THMs
Disinfection experiments are conducted with the Br− concentration, NaClO dosage (free available chlorine), and pH held constant, while varying the lignin concentration. The formation of THMs and BIF are determined under different lignin concentration conditions. The results in Figure 3a shows that as lignin concentration increases from 4 to 20 mg-C/L, the total formation of Br-THMs (comprising four species: CHCl3, CHBrCl2, CHBr2Cl, CHBr3) decreased by 78.4%. Notably, CHCl3 production increases slightly before stabilizing, while CHBrCl2, CHBr2Cl, and CHBr3 declined by 51.0%, 87.6%, and 97.4%, respectively. BIF concurrently decreases by 79.4%.
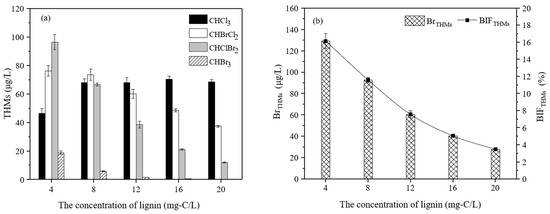
Figure 3.
The effect of lignin concentration on the formation of Br-THMs during NaClO disinfection. (a) Concentrations of different THMs and (b) concentrations of Br-THMs and BIF. Experimental conditions: Br− = 10 μmol/L; FAC = 15 mg/L; pH = 7.0 ± 0.2.
This reduction stems from competitive reaction pathways: HOCl/OCl− derived from NaClO hydrolysis reacts directly with NOM to form c Cl-DBPs, while simultaneously oxidizing Br− to form HOBr/OBr−. Elevated lignin concentration intensifies Cl-DBP formation but suppresses HOBr/OBr− generation. Consequently, Cl-DBP production increases, whereas Br-DBP formation decreases significantly.
3.2.2. The Effect of the NaClO Dosage on the Formation of THMs
Disinfection experiments are conducted by varying the NaClO dosage while maintaining constant lignin concentration, Br− concentration, and pH. The formation of THMs and BIF are determined under different free available chlorine concentrations. The results in Figure 4 show that as NaClO dosage increases from 5 to 25 mg/L, both total Cl-Br-THMs formation and BIF demonstrate an initial increase followed by a decline, peaking at 15 mg/L. Among the four byproduct species, CHCl3 exhibits sustained growth with a 15-fold increase; CHBrCl2 and CHBr2Cl show initial rises then declines, maximizing at 15 mg/L; and CHBr3 displays a marginal decrease.
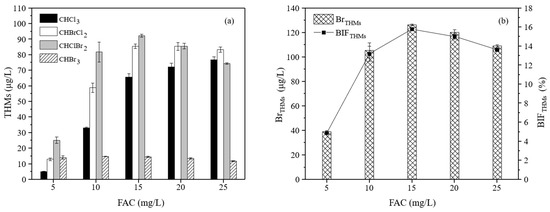
Figure 4.
The effect of dosage of NaClO on the formation of Br-THMs during NaClO disinfection. (a) Concentrations of different THMs and (b) concentrations of Br-THMs and BIF. Experimental conditions: lignin = 5 mg-C/L; Br− = 10 μmol/L; pH = 7.0 ± 0.2.
This pattern arises from dual reaction pathways: HOBr/OBr− primarily reacts with specific organic intermediates to form Br-DBPs. Elevated chlorine dosage initially enhances intermediate production, boosting Br-DBPs. However, further chlorine increase (>15 mg/L) promotes transformation of these intermediates into more stable end products, consequently reducing Br-DBP formation.
3.2.3. The Effect of the Br− Concentration on the Formation of THMs
Disinfection experiments are conducted by varying the bromide ion (Br−) concentration while maintaining constant lignin concentration, NaClO dosage, and pH. The formation of THMs and BIF are determined under different Br− concentrations. As presented in Figure 5, when the Br− concentration increased from 5 μmol/L to 25 μmol/L, the formation of CHCl3 decreased by 88.1%. The formation of CHBrCl2 exhibited an initial increase followed by a decrease, reaching its maximum at 15 μmol/L. Conversely, the formation of CHBr2Cl and CHBr3 increased by 7-fold and 80-fold, respectively.
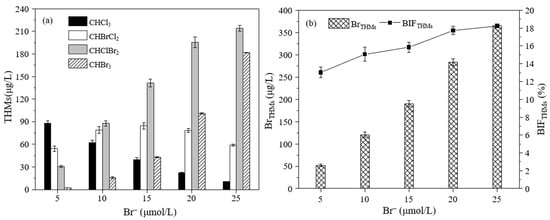
Figure 5.
The effect of the concentration of Br− on the formation of Br-THMs during NaClO disinfection. (a) Concentrations of different THMs and (b) concentrations of Br-THMs and BIF. Experimental conditions: lignin = 5 mg-C/L; FAC = 15 mg/L; pH = 7.0 ± 0.2.
The increasing Br− concentration promotes the formation of HOBr/OBr−, consequently increasing the generation of Br-DBPs. Simultaneously, higher Br− concentrations facilitates the transformation of Cl-THMs into Br-THMs, which aligns with the findings of Liu et al. [21]. Calculations of the bromine incorporation fraction within the THMs reveal that both Br-THMs and BIFTHMs increase with rising Br− concentrations. This suggests that elevated Br− concentration not only enhances the formation of Br-THMs but also promotes the conversion of other types of Br-DBPs into Br-THMs, thereby increasing the BIFTHMs.
3.2.4. The Effect of pH on the Formation of THMs
Disinfection experiments are conducted by varying pH while maintaining constant lignin concentration, Br− concentration, and dosage of NaClO. The formation of THMs and BIF are determined under different pH. The results in Figure 6 show that as the pH increases, the formation of all THMs shows an upward trend. As pH increases from 6.0 to 9.0, the formation of CHCl3, CHBrCl2, CHBr2Cl, and CHBr3 significantly increases by factors of 1.31, 1.94, 2.96, and 6.43, respectively. Concurrently, both total Br-THM concentration and the BIF exhibit linear increases with rising pH. The Br-THM concentration rises from 74.5 μg/L to 215.9 μg/L, while the BIF value increases from 9.3% to 27.0%.
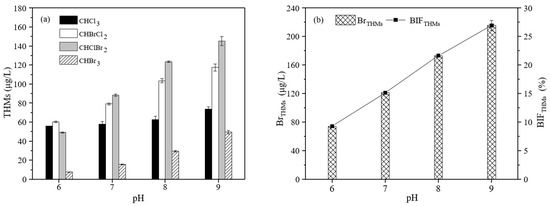
Figure 6.
The effect of pH on the formation of Br-THMs during NaClO disinfection. (a) Concentrations of different THMs and (b) concentrations of Br-THMs and BIF. Experimental conditions: lignin = 5 mg-C/L; FAC = 15 mg/L; Br− = 10 μmol/L.
According to Deborde and von Gunten [14], the rate constant for the oxidation of Br− by HOCl to form HOBr/OBr− is 1550 M−1s−1, whereas the rate constant for oxidation by OCl− is significantly slower at 9 × 10⁻⁴ M−1s−1. Higher pH values favor the OCl− species over HOCl, theoretically leading to reduced generation of HOBr/OBr− and consequently lower formation of both Cl-DBPs and Br-DBPs. Supporting this, research by Pourmoghaddas et al. [17] demonstrated that the proportion of haloacetic acids (HAAs) among DBPs decreases with increasing pH. This shift suggests a transformation of other Br-DBP species towards Br-THMs, ultimately explaining the observed significant increase in both Br-THM formation and BIF at higher pH.
3.3. Determination of THMs Formation from Lignin Chlorination Containing Br− and I−
3.3.1. The Effect of the Lignin Concentration on the Formation of THMs
Based on the conditions described in Section 3.2.1, disinfection experiments are conducted with an additional spike of 2 μmol/L I− to simulate the disinfection of source water containing coexisting bromide and iodide. As presented in Figure 7, the formation patterns of the four Cl/Br-containing THMs are generally consistent with those observed when only Br− is added, all decreasing as the lignin concentration increases. Analysis of I-THMs reveals that no I-THMs are detected at lower lignin concentrations. When the lignin concentration increases from 12 mg-C/L to 20 mg-C/L, only CHCl2I is formed, with its concentration rising from 2.6 μg/L to 7.0 μg/L.
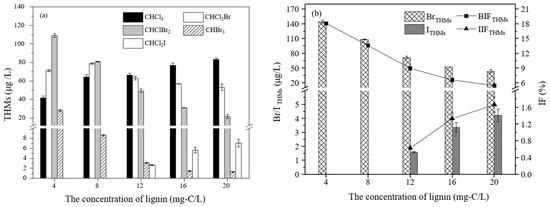
Figure 7.
The effect of lignin concentration on the formation of Br-THMs and I-THMs during NaClO disinfection. (a) Concentrations of different THMs and (b) concentrations of Br/I-THMs, BIF and IIF. Experimental conditions: Br− = 10 μmol/L; I− = 2 μmol/L; FAC = 15 mg/L; pH = 7.0 ± 0.2.
Calculation and analysis of the total formation of Br-THMs and I-THMs show that only Br-THMs are generated when the lignin concentration is below 12 mg-C/L, and both the Br-THMs concentration and BIF decrease continuously. When the lignin concentration increases from 12 mg-C/L to 20 mg-C/L, the Br-THMs concentration and BIF continue to decline, while the I-THMs concentration and IIF increase steadily. However, the IIF is consistently lower than the BIF.
HClO/ClO− is a strong oxidant capable of effectively oxidizing Br− to HOBr/BrO−, generating substantial Br-DBPs. It can also oxidize I− to HOI/IO−, theoretically enabling significant I-DBPs formation. The second-order kinetic constant for the oxidation of HOI by HOCl/OCl− reaches 8.3 ± 0.8 × 10⁴ M−1s−1 [22], surpassing by orders of magnitude the reaction rate constants with NOM. Therefore, HClO/ClO− further oxidizes HOI/IO− to IO3−. This process competes with I-DBPs formation, and its faster reaction rate means the pathway leading to I-DBPs is outcompeted. This explains why I-THMs formation is much lower than Br-THMs formation under NaClO disinfection. As the lignin concentration increases, more HClO/ClO− is consumed in reactions with NOM to form Cl-DBPs. Consequently, the competing processes generating HOBr/OBr− and IO3− are weakened, resulting in less HOBr/OBr− and IO3− formation. This leads to reduced Br-DBPs formation and relatively increased I-DBPs formation.
3.3.2. The Effect of the NaClO Dosage on the Formation of THMs
Based on the conditions described in Section 3.2.2, disinfection experiments are conducted with an additional spike of 2 μmol/L I− to simulate the disinfection of source water containing coexisting bromide and iodide. As shown in Figure 8, the formation of Br-THMs is consistent with the scenario when only bromide is added, showing an initial increase followed by a decrease as the disinfectant dosage increases. However, the decreasing trend is less pronounced compared to when bromide is added alone. This attenuation in the decrease may be attributed to partial consumption of HClO/ClO− by I−. In contrast, I-THMs are only detected at a chlorine dosage of 5 mg/L, with two species identified: CHCl2I at 0.83 μg/L and CHBr2I at 2.6 μg/L. The IIF for these is only 0.63%.
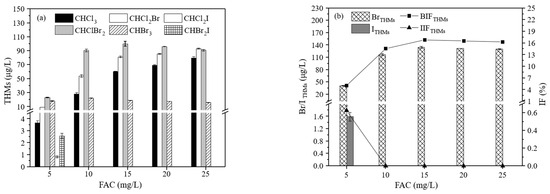
Figure 8.
The effect of dosage of NaClO on the formation of Br-THMs and I-THMs during NaClO disinfection. (a) Concentrations of different THMs and (b) concentrations of Br/I-THMs, BIF and IIF. Experimental conditions: lignin = 5 mg-C/L; Br− = 10 μmol/L; I− = 2 μmol/L; pH = 7.0 ± 0.2.
At lower chlorine dosages, after HClO/ClO− oxidizes I− to HOI/OI−, the residual amount of HClO/ClO− is insufficient to fully oxidize the generated HOI/OI− to IO3−. Consequently, I-THMs are detected. Conversely, when the chlorine dosage increases, HClO/ClO− oxidizes HOI/OI− to IO3−, thereby limiting the formation of I-DBPs. BIF continues to decline, while the I-THMs concentration and the IIF increase steadily. However, the IIF is consistently lower than the BIF.
3.3.3. The Effect of the Ratio of Br− and I− on the Formation of THMs
Figure 9 illustrates the formation of Br-THMs and I-THMs under varying bromide-to-iodide (Br−/I−) ratios. As the proportion of I− in the added halogens increases, the formation of CHCl3 gradually increases, while the formation of the three Br-THMs (CHBrCl2, CHBr2Cl, CHBr3) gradually decreases. Among the I-THMs, only CHCl2I is detected, and this occurred only in the two groups with the smallest Br: I ratios. An increase in the iodide proportion leads to greater generation of HOI/OI−, consequently increasing the formation of I-THMs. This aligns with the findings of Zhang et al. [23]. Conversely, as the proportion of Br− decreases, the formation of HOBr/OBr− also decreases. This weakens the process by which HOBr/OBr− transforms Cl-DBPs, resulting in the detection of more Cl-DBPs and fewer Br-DBPs.
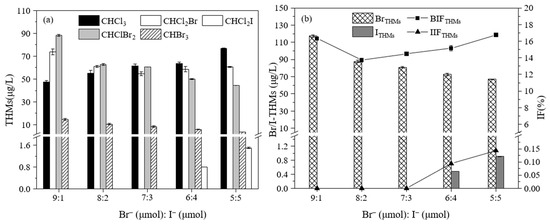
Figure 9.
The effect of the ratio of Br− and I− on the formation of Br-THMs and I-THMs during NaClO disinfection. (a) Concentrations of different THMs and (b) concentrations of Br/I-THMs, BIF and IIF. Experimental conditions: lignin = 5 mg-C/L; FAC = 15 mg/L; pH = 7.0 ± 0.2.
Calculation of IIF and BIF reveals that the BIF initially decreases and then increases as the Br−:I− ratio decreases, while the IIF exhibits a continuous upward trend. This is consistent with the research results of Postigo et al. [24], where I-THMs formation increases as the Br/I ratio decreases.
The rise in Br− concentration promotes the formation of HOBr/OBr−, consequently increasing the generation of Br-DBPs. Simultaneously, higher Br− concentrations facilitates the transformation of Cl-THMs into Br-THMs, which aligns with the findings of Liu et al. [25]. Calculations of the bromine incorporation fraction within the THMs reveal that both Br-THMs and BIFTHMs increased with rising Br− concentrations. This suggests that elevated Br− levels not only enhanced the formation of Br-THMs but also promoted the conversion of other types of Br-DBPs into Br-THMs, thereby increasing the BIFTHMs.
3.3.4. The Effect of pH on the Formation of THMs
Figure 10 depicts the formation of Br-THMs and I-THMs under varying pH. As the pH increases, the formation of all THMs shows an upward trend. When the pH rose from 6 to 9, the formation of CHCl3, CHBrCl2, CHBr2Cl, and CHBr3 increased by factors of 1.05, 2.16, 3.16, and 7.67, respectively. This trend is consistent with that observed when only bromide ions are added. I-THMs commenced formation at pH = 9.0, specifically 0.96 μg/L of CHCl2I and 1.0 μg/L of CHBr2I.
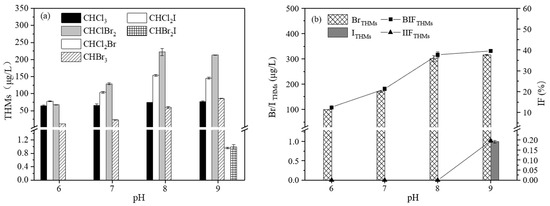
Figure 10.
The effect of pH on the formation of Br-THMs during NaClO disinfection. (a) Concentrations of different THMs and (b) concentrations of Br/I-THMs, BIF and IIF. Experimental conditions: lignin = 5 mg-C/L; FAC = 15 mg/L; Br− = 10 μmol/L; I− = 2 μmol/L.
Calculation and analysis of Br-THMs concentration and BIF revealed that both increased with rising pH. Between pH 6 and 8, Br-THMs and BIF still increased approximately linearly, aligning with the trend observed under bromide-only conditions. However, when the pH reached 9, the rate of increase for both Br-THMs and BIF slowed. Concurrently, I-THMs began to form, with a concentration of 1.0 μg/L and IIF of 0.2%.
The increase in Br-THMs formation is attributed to the conversion of other types of DBPs into THMs at higher pH levels. The rise in I-THMs formation, however, stems from the increasing proportion of OCl−, which has weaker oxidizing capacity, at elevated pH. At pH = 9.0, OCl− accounted for 97% of the chlorine species, resulting in greater accumulation of HOI/OI− and its subsequent reaction with NOM to form I-DBPs.
4. Conclusions
During NaClO disinfection, approximately 60% of the Br− in the water are converted to AOBr, whereas I− are minimally converted to AOI. Analysis of the generated THMs reveals that bromine and iodine incorporated within THMs constituted a significant proportion of the AOBr and AOI, respectively, indicating that THMs are a major category of Br/I-DBPs.
The influence of organic matter concentration on the formation of Br-THMs and I-THMs differed. Br-THM formation decreased with increasing organic matter concentration, while I-THM formation increased. Similarly, the effect of chlorine dose on Br-THM and I-THM formation is distinct: Br-THM formation exhibited an initial increase followed by a decrease as the chlorine dose increased, whereas I-THM formation consistently decreased with increasing chlorine dose. Under NaClO disinfection, elevated Br− concentration promoted Br-THM formation, with a particularly pronounced increase observed for THM species containing more bromine atoms. Increased I− concentration also enhanced I-THM formation; however, only CHClI2 is detected among the iodinated THMs. In contrast, pH exerted a parallel effect on both Br-THM and I-THM formation: their generation increased with rising pH during NaClO disinfection.
Based on the integrated findings, NaClO disinfection demonstrates particular suitability for water containing high I− levels. Notably, disinfectant dosage and NOM concentration exhibit divergent impacts on the formation of Br-THMs versus I-THMs, necessitating context-specific optimization of dosing strategies. Regarding pH regulation, maintenance within the lower range of 6.0–7.0 is strongly recommended to minimize THMs generation potential.
Supplementary Materials
The following supporting information can be downloaded at: https://www.mdpi.com/article/10.3390/w17172563/s1, Figure S1: The calibration curves of I-THMs(CHCl2I/CHBr2I); Figure S2: The calibration curves of Br-THMs(CHCl3/CHCl2Br/CHClBr2/CHBr3).
Author Contributions
Validation, Y.S. and Y.G.; Formal Analysis, C.F. and T.L.; Investigation, C.F.; Resources, J.S.; Writing—Original Draft Preparation, C.F. and T.L.; Writing—Review and Editing, J.S. and L.Y.; Funding Acquisition, J.S., L.Y. and Y.G. All authors have read and agreed to the published version of the manuscript.
Funding
The work is supported by the National Key Research and Development Program of China (Grant No. 2022YFC3203702), the State Key Laboratory of Urban Water Resource and Environment (Harbin Institute of Technology) (No. 2025TS41), the Heilongjiang Academy of Science Fund for Distinguished Young Scholars (Grant No. JQ2024ZR01) and Science and Technology Project of Shaanxi Province, China (Grant No. 2024JC-YBQN-0393).
Data Availability Statement
The original contributions presented in this study are included in the article. Further inquiries can be directed to the corresponding author.
Conflicts of Interest
The author declares no conflicts of interest.
References
- Wan, D.; Wang, H.; Sharma, V.K.; Selvinsimpson, S.; Dai, H.; Luo, F.; Wang, C.; Chen, Y. Mechanistic Investigation of Enhanced Photoreactivity of Dissolved Organic Matter after Chlorination. Environ. Sci. Technol. 2021, 55, 8937–8946. [Google Scholar] [CrossRef]
- Dong, H.; Cuthbertson, A.A.; Plewa, M.J.; Weisbrod, C.R.; McKenna, A.M.; Richardson, S.D. Unravelling High-Molecular-Weight DBP Toxicity Drivers in Chlorinated and Chloraminated Drinking Water: Effect-Directed Analysis of Molecular Weight Fractions. Environ. Sci. Technol. 2023, 57, 18788–18800. [Google Scholar] [CrossRef]
- Gao, Z.-C.; Lin, Y.-L.; Xu, B.; Xia, Y.; Hu, C.-Y.; Zhang, T.-Y.; Qian, H.; Cao, T.-C.; Gao, N.-Y. Effect of bromide and iodide on halogenated by-product formation from different organic precursors during UV/chlorine processes. Water Res. 2020, 182, 116035. [Google Scholar] [CrossRef] [PubMed]
- Komaki, Y.; Ibuki, Y. Inhibition of nucleotide excision repair and damage response signaling by dibromoacetonitrile: A novel genotoxicity mechanism of a water disinfection byproduct. J. Hazard. Mater. 2022, 423, 127194. [Google Scholar] [CrossRef]
- Lau, S.S.; Bokenkamp, K.; Tecza, A.; Wagner, E.D.; Plewa, M.J.; Mitch, W.A. Toxicological assessment of potable reuse and conventional drinking waters. Nat. Sustain. 2023, 6, 39–46. [Google Scholar] [CrossRef]
- Plewa, M.J.; Wagner, E.D.; Muellner, M.G.; Hsu, K.-M.; Richardson, S.D. Comparative Mammalian Cell Toxicity of N-DBPs and C-DBPs. In Disinfection By-Products in Drinking Water; ACS Symposium Series; American Chemical Society: Washington, DC, USA, 2008; Volume 995, pp. 36–50. [Google Scholar]
- Plewa, M.J.; Kargalioglu, Y.; Vankerk, D.; Minear, R.A.; Wagner, E.D. Mammalian cell cytotoxicity and genotoxicity analysis of drinking water disinfection by-products. Environ. Mol. Mutagen. 2002, 40, 134–142. [Google Scholar] [CrossRef]
- Wu, D.-X.; Wang, W.-L.; Du, Y.; He, L.; Wu, Q.-Y. Changes in toxicity and adsorbable organic bromine concentrations in ozonated reclaimed water irradiated with sunlight. Water Res. 2023, 230, 119512. [Google Scholar] [CrossRef] [PubMed]
- Ertel, J.R.; Hedges, J.I.; Perdue, E.M. Lignin signature of aquatic humic substances. Science 1984, 223, 485–487. [Google Scholar] [CrossRef]
- Kraus, T.E.C.; Anderson, C.A.; Morgenstern, K.; Downing, B.D.; Pellerin, B.A.; Bergamaschi, B.A. Determining Sources of Dissolved Organic Carbon and Disinfection Byproduct Precursors to the McKenzie River, Oregon. J. Environ. Qual. 2010, 39, 2100–2112. [Google Scholar] [CrossRef] [PubMed]
- Hua, G.H.; Kim, J.; Reckhow, D.A. Disinfection byproduct formation from lignin precursors. Water Res. 2014, 63, 285–295. [Google Scholar] [CrossRef]
- Federation, W.E.; Association, A. Standard Methods for the Examination of Water and Wastewater; American Public Health Association (APHA): Washington, DC, USA, 2005. [Google Scholar]
- Fang, C.; Krasner, S.W.; Chu, W.; Ding, S.; Zhao, T.; Gao, N. Formation and speciation of chlorinated, brominated, and iodinated haloacetamides in chloraminated iodide-containing waters. Water Res. 2018, 145, 103–112. [Google Scholar] [CrossRef] [PubMed]
- Deborde, M.; von Gunten, U. Reactions of chlorine with inorganic and organic compounds during water treatment—Kinetics and mechanisms: A critical review. Water Res. 2008, 42, 13–51. [Google Scholar] [CrossRef]
- Westerhoff, P.; Chao, P.; Mash, H. Reactivity of natural organic matter with aqueous chlorine and bromine. Water Res. 2004, 38, 1502–1513. [Google Scholar] [CrossRef] [PubMed]
- Liu, C.; Ersan, M.S.; Plewa, M.J.; Amy, G.; Karanfil, T. Formation of regulated and unregulated disinfection byproducts during chlorination of algal organic matter extracted from freshwater and marine algae. Water Res. 2018, 142, 313–324. [Google Scholar] [CrossRef]
- Pourmoghaddas, H.; Stevens, A.A. Relationship between trihalomethanes and haloacetic acids with total organic halogen during chlorination. Water Res. 1995, 29, 2059–2062. [Google Scholar] [CrossRef]
- Hua, G.; Reckhow, D.A. Evaluation of bromine substitution factors of DBPs during chlorination and chloramination. Water Res. 2012, 46, 4208–4216. [Google Scholar] [CrossRef] [PubMed]
- Lengyel, I.; Li, J.; Kustin, K.; Epstein, I.R. Rate Constants for Reactions between Iodine- and Chlorine-Containing Species: A Detailed Mechanism of the Chlorine Dioxide/Chlorite-Iodide Reaction. J. Am. Chem. Soc. 1996, 118, 3708–3719. [Google Scholar] [CrossRef]
- Zhu, X.; Zhang, X. Modeling the formation of TOCl, TOBr and TOI during chlor(am)ination of drinking water. Water Res. 2016, 96, 166–176. [Google Scholar] [CrossRef]
- Liu, R.; Tian, C.; Hu, C.; Qi, Z.; Liu, H.; Qu, J. Effects of bromide on the formation and transformation of disinfection by-products during chlorination and chloramination. Sci. Total Environ. 2018, 625, 252–261. [Google Scholar] [CrossRef]
- Bichsel, Y.; von Gunten, U. Oxidation of Iodide and Hypoiodous Acid in the Disinfection of Natural Waters. Environ. Sci. Technol. 1999, 33, 4040–4045. [Google Scholar] [CrossRef]
- Zhang, T.-Y.; Xu, B.; Hu, C.-Y.; Lin, Y.-L.; Lin, L.; Ye, T.; Tian, F.-X. A comparison of iodinated trihalomethane formation from chlorine, chlorine dioxide and potassium permanganate oxidation processes. Water Res. 2015, 68, 394–403. [Google Scholar] [CrossRef] [PubMed]
- Postigo, C.; Richardson, S.D.; Barceló, D. Formation of iodo-trihalomethanes, iodo-haloacetic acids, and haloacetaldehydes during chlorination and chloramination of iodine containing waters in laboratory controlled reactions. J. Environ. Sci. 2017, 58, 127–134. [Google Scholar] [CrossRef] [PubMed]
- Liu, S.; Li, Z.; Dong, H.; Goodman, B.A.; Qiang, Z. Formation of iodo-trihalomethanes, iodo-acetic acids, and iodo-acetamides during chloramination of iodide-containing waters: Factors influencing formation and reaction pathways. J. Hazard. Mater. 2017, 321, 28–36. [Google Scholar] [CrossRef]
Disclaimer/Publisher’s Note: The statements, opinions and data contained in all publications are solely those of the individual author(s) and contributor(s) and not of MDPI and/or the editor(s). MDPI and/or the editor(s) disclaim responsibility for any injury to people or property resulting from any ideas, methods, instructions or products referred to in the content. |
© 2025 by the authors. Licensee MDPI, Basel, Switzerland. This article is an open access article distributed under the terms and conditions of the Creative Commons Attribution (CC BY) license (https://creativecommons.org/licenses/by/4.0/).