Article

From Raw Water to Pipeline Water: Correlation Analysis of Dynamic Changes in Water Quality Parameters and Microbial Community Succession

1
College of River and Ocean, Chongqing Jiaotong University, Chongqing 400074, China
2
College of Environmental Science and Engineering, Tongji University, Shanghai 200092, China
*
Author to whom correspondence should be addressed.
Water 2025, 17(17), 2555; https://doi.org/10.3390/w17172555
Submission received: 18 July 2025 / Revised: 18 August 2025 / Accepted: 24 August 2025 / Published: 28 August 2025

Abstract

Understanding the spatiotemporal dynamics of water quality parameters and microbial communities in drinking water distribution systems (DWDS) and their interrelationships is critical for ensuring the safety of tap water supply. This study investigated the diurnal, monthly, and annual variation patterns of water quality and the stage-specific succession behaviors of microbial communities in a DWDS located in southeastern China. Results indicated that hydraulic shear stress during peak usage periods drove biofilm detachment and particle resuspension. This process led to significant diurnal fluctuations in total cell counts (TCC) and metal ions, with coefficients of variation ranging from 0.44 to 1.89. Monthly analyses revealed the synergistic risks of disinfection by-products (e.g., 24.5 μg/L of trichloromethane) under conditions of low chlorine residual (<0.2 mg/L) and high organic loading. Annual trends suggested seasonal coupling: winter pH reductions correlated with organic acid accumulation, while summer microbial blooms associated with chlorine decay and temperature increase. Nonlinear interactions indicated weakened metal–organic complexation but enhanced turbidity–sulfate adsorption, suggesting altered contaminant mobility in pipe scales. Microbial analysis demonstrated persistent dominance of oligotrophic Phreatobacter and prevalence of Pseudomonas in biofilms, highlighting hydrodynamic conditions, nutrient availability, and disinfection pressure as key drivers of community succession. These findings reveal DWDS complexity and inform targeted operational and microbial risk control strategies.

Graphical Abstract

1. Introduction

With the acceleration of industrialization and urbanization, water quality security has emerged as a critical global concern [1,2]. Water quality parameters serve as crucial indicators for assessing aquatic health. Their dynamic variations not only directly impact human health and ecological security but also reflect a water body’s self-purification capacity, pollution level, and environmental stress [3]. The quality of drinking water delivered to consumers through DWDS is jointly constrained by multiple factors, including source water quality, treatment processes, and the distribution network itself, each directly influencing the final tap water quality [4,5,6]. While significant progress has been made, most existing studies focus on single time scales (e.g., diurnal [7] or seasonal [8]) or specific parameters (e.g., disinfection by-products [9]). However, comprehensive analyses integrating diurnal, monthly, and annual dynamics remain scarce. Particularly, the succession mechanisms of microbial communities within DWDS from source to consumer tap remain poorly understood, thereby limiting our microbial-level understanding of drinking water quality safety changes [10,11,12,13]. Consequently, an in-depth investigation into the variation patterns of water quality parameters and their interrelationships represents a valuable research direction.
This study aims to comprehensively investigate the interrelationships and variation characteristics of water quality parameters from raw water, through effluents, to distributed tap water within the network. Through diurnal, monthly, and annual monitoring campaigns, we analyze the patterns of parameter variations and their interconnections while elucidating the drivers of microbial community succession. The research employs a series of refined and rigorous experimental methodologies and technical approaches, including meticulous sampling strategies, strict physicochemical parameter determination, biomass analysis, and high-throughput DNA sequencing, to ensure data accuracy and reliability.

2. Materials and Methods

2.1. Sample Collection

This study was conducted in a southeastern city in China. Raw surface water was treated through conventional processes including coagulation, sedimentation, filtration, and disinfection at water treatment plant XWP before distribution to residential communities. Raw surface water was treated through conventional processes including coagulation, sedimentation, filtration, and disinfection at water treatment plant XWP before distribution to communities for public consumption. To comprehensively investigate the interrelationships of water quality parameters from source to tap, samples were collected from the same DWDS supplied by this surface water source each time. Due to limitations in experimental conditions and sampling frequency, daily sampling points were mainly set up within a residential building supplied by this DWDS. Monthly and annual data were sourced from local monitoring records. Water taps used for sampling were all located in kitchens or bathrooms within residential buildings and constructed of cast iron pipes. Tap water samples were randomly collected from the 1st to 5th floors (below the 5th floor) to avoid potential secondary contamination from rooftop storage tanks and mitigate seasonal influences on microbial communities within the distribution network. Sampling was performed according to three distinct schemes: daily, monthly, and annual. This yielded 24 daily samples, 4 monthly samples, and 12 annual samples.
To obtain fresh tap water samples from the community network, each tap was flushed at maximum flow rate for at least 5 min prior to collection [14]. Samples were collected in sterile 1 L HDPE bottles (individually packaged). Daily sampling commenced at 08:00 on the first day, with samples taken hourly for 24 consecutive hours. Monthly sampling involved collection once weekly for four consecutive weeks. Annual sample data spanned 12 months from March 2024 to March 2025, sourced from municipal network water monitoring records. Immediately after collection, 0.8 mg/L sodium thiosulfate solution was added to samples to quench residual disinfectant for transport to the laboratory. A portion of each sample was transferred to a 4 °C pharmaceutical refrigerator to slow microbial community decay; these samples were analyzed within 15 days of collection.

2.2. Physicochemical Parameter Analysis and Instrumentation

Levels of pH were measured using a portable pH meter. Turbidity was determined with a turbidity meter (HACH 2100AN, Loveland, CO, USA); permanganate index (CODMn) was analyzed following the ISO 8467-1986 standard (Water quality—Determination of permanganate index) [15]; total organic carbon (TOC) was quantified using a TOC analyzer (Multi N/C, Jena, Thüringen, Germany); total dissolved solids (TDS) were measured by gravimetric method (GB/T 5750.4-2006 8.1) [16]; chloride (Cl), sulfate (SO42−), and nitrate (NO3) were analyzed via ion chromatography (Dionex ICS-2000, San Jose, CA, USA); monthly and annual data for these metal ions were sourced from local monitoring records; and metal ions (Mn, Zn, Al, Fe, Cu, As, Pb) were measured using ICP-OES (Agilent, Santa Clara, CA, USA). Due to the high sampling frequency and short time span inherent to daily monitoring, the monitoring frequency was reduced compared to the monthly/annual monitoring system.

2.3. Biomass Analysis

Biomass analysis included total cell concentration (TCC) and intact cell concentration (ICC). Firstly, 5 μL SYBR Green I of SYBR Green I stock solution was diluted 1:100 with dimethyl sulfoxide (DMSO) filtered through a 0.22 μm filter to prepare a working stock solution. Then, 500 μL of the water sample was stained in the dark by adding 5 μL of the working stock solution and 5 μL of propidium iodide (PI) dye solution. TCC and ICC were subsequently measured using a flow cytometer (Agilent NovoCyte, Santa Clara, CA, USA). Biofilm was collected from pipe walls using sterile swabs. Swabs were placed in sterile centrifuge tubes containing phosphate-buffered saline (PBS) and subjected to ultrasonic oscillation for 3 min; this process was repeated three times to dislodge microorganisms into the PBS, creating a microbial suspension. TCC and ICC of the suspension were then measured using the same flow cytometric method described above.

2.4. DNA Extraction and Sequencing

Microorganisms from water samples and pipe wall biofilms were concentrated onto Millipore 0.22 μm filters using a vacuum filtration apparatus. The filter funnels and cups of the apparatus were pre-rinsed three times sequentially with tap water and ultrapure water, followed by sterilization in an autoclave at 121 °C for 20 min.
Filters obtained from water and biofilm sample filtration were rolled into centrifuge tubes. Microbial DNA was extracted from these filters using the DNeasy® PowerWater® Kit (QIAGEN, Germantown, MD, USA), yielding 100 μL of DNA extract, which was stored at −80 °C. DNA samples underwent high-throughput sequencing on the Illumina MiSeq platform using primers 338F and 806R. Raw sequencing data were processed on the Majorbio platform for quality control, paired-end read merging, optimization, and noise reduction. This generated amplicon sequence variant (ASV) representative sequences and abundance tables, enabling analysis of microbial community structure characteristics.

2.5. Construction of Correlation Analysis Heatmaps

Intra-group correlations were analyzed using Pearson correlation for fifteen water quality parameters in the distributed tap water: pH, turbidity, TOC, TCC, ICC, chloride, nitrate, sulfate, and metal ions (Al, Mn, Fe, Cu, Zn, As, Pb). Hierarchical cluster analysis, using the Pearson correlation coefficients as the similarity measure, was then applied to these parameters to construct an intra-group correlation heatmap for visualizing clusters. Similarly, Pearson correlation analysis was used for inter-group correlation to compare water quality parameters between distributed tap water and raw water, and between distributed tap water and treated (finished) water. Heatmaps visually represented correlation magnitudes through color gradients from light blue (negative) to light red (positive).

2.6. Statistics Analysis

All biological and physicochemical parameters were analyzed in triplicate, with mean values and standard deviations calculated. Prior to significance testing, data normality was verified using the Shapiro–Wilk test. Multiple comparison corrections were applied via the Benjamini–Hochberg procedure to control the false discovery rate (FDR). Statistical analyses were performed using SPSS software (version 24.0) and R statistical environment (version 4.0.2). The coefficient of variation (CV), defined as the ratio of standard deviation to mean, was analyzed through Levene’s test for homogeneity of variances, one-way analysis of variance (ANOVA), and Tukey’s honestly significant difference post hoc test. Significance thresholds were set at p < 0.05 for mean comparisons. Ninety-five percent confidence intervals were calculated assuming normal distribution based on standard deviations and sample sizes.

3. Results

3.1. Diurnal, Monthly, and Annual Variation Characteristics of Water Quality

3.1.1. Diurnal Variation Characteristics of Water Quality

To investigate the dynamic variations and potential influencing factors of residential drinking water quality, a 24 h continuous monitoring campaign was conducted in a residential area. Hourly sampling of pipeline network water was performed to analyze diurnal fluctuation patterns of pH, chloride, nitrate, sulfate, TCC, and heavy metal ions. As illustrated in Figure 1, pH (7.50 ± 0.12), chloride (16.94 ± 0.59 mg/L), nitrate (6.25 ± 0.27 mg/L), and sulfate (23.07 ± 0.26 mg/L) exhibited minimal fluctuations (coefficient of variation, CV < 0.1, p < 0.05), indicating high stability. In contrast, TCC (1000–44,600 cells/mL) and metal ions including Al (0–145.9 μg/L), Mn (1.0–6.6 μg/L), Fe (12.3–62.8 μg/L) demonstrated significant variations (CV = 0.44–1.89, p < 0.05). Diurnal patterns revealed that most parameters fluctuated minimally during nighttime (20:00–5:00; e.g., pH variation ≤ 0.2), while daytime (6:00–19:00) TCC concentration of 4.46 × 10⁴ cells/mL with synchronized fluctuations in manganese and iron concentrations (increasing from 6:00 to 10:00, decreasing from 12:00 to 16:00).
Intra-group correlation analysis based on 24 h averaged water quality parameters (Figure 2) revealed generally weak overall correlations among parameters, though significant associations existed between specific physicochemical and microbial indicators. An extremely strong positive correlation (r = 0.99, p < 0.001) existed between total cell count (TCC) and intact cell count (ICC). Chloride demonstrated a strong negative correlation with sulfate (r = −0.75, p < 0.001) but a strong positive correlation with nitrate (r = 0.72, p < 0.001). Moderate positive correlations existed between turbidity and pH, TCC, and ICC (r = 0.45, p < 0.01), while total organic carbon (TOC) showed a weaker positive correlation with turbidity (r = 0.36, p < 0.05). Most heavy metals exhibited positive inter-correlations, notably a strong positive correlation between Pb and Fe (r = 0.82, p < 0.001); moderate correlations (r = 0.24–0.52, p < 0.01) were identified between Al and Mn, Fe, As, Pb, and between Mn and Zn.

3.1.2. Intramonthly Variation Characteristics of Water Quality

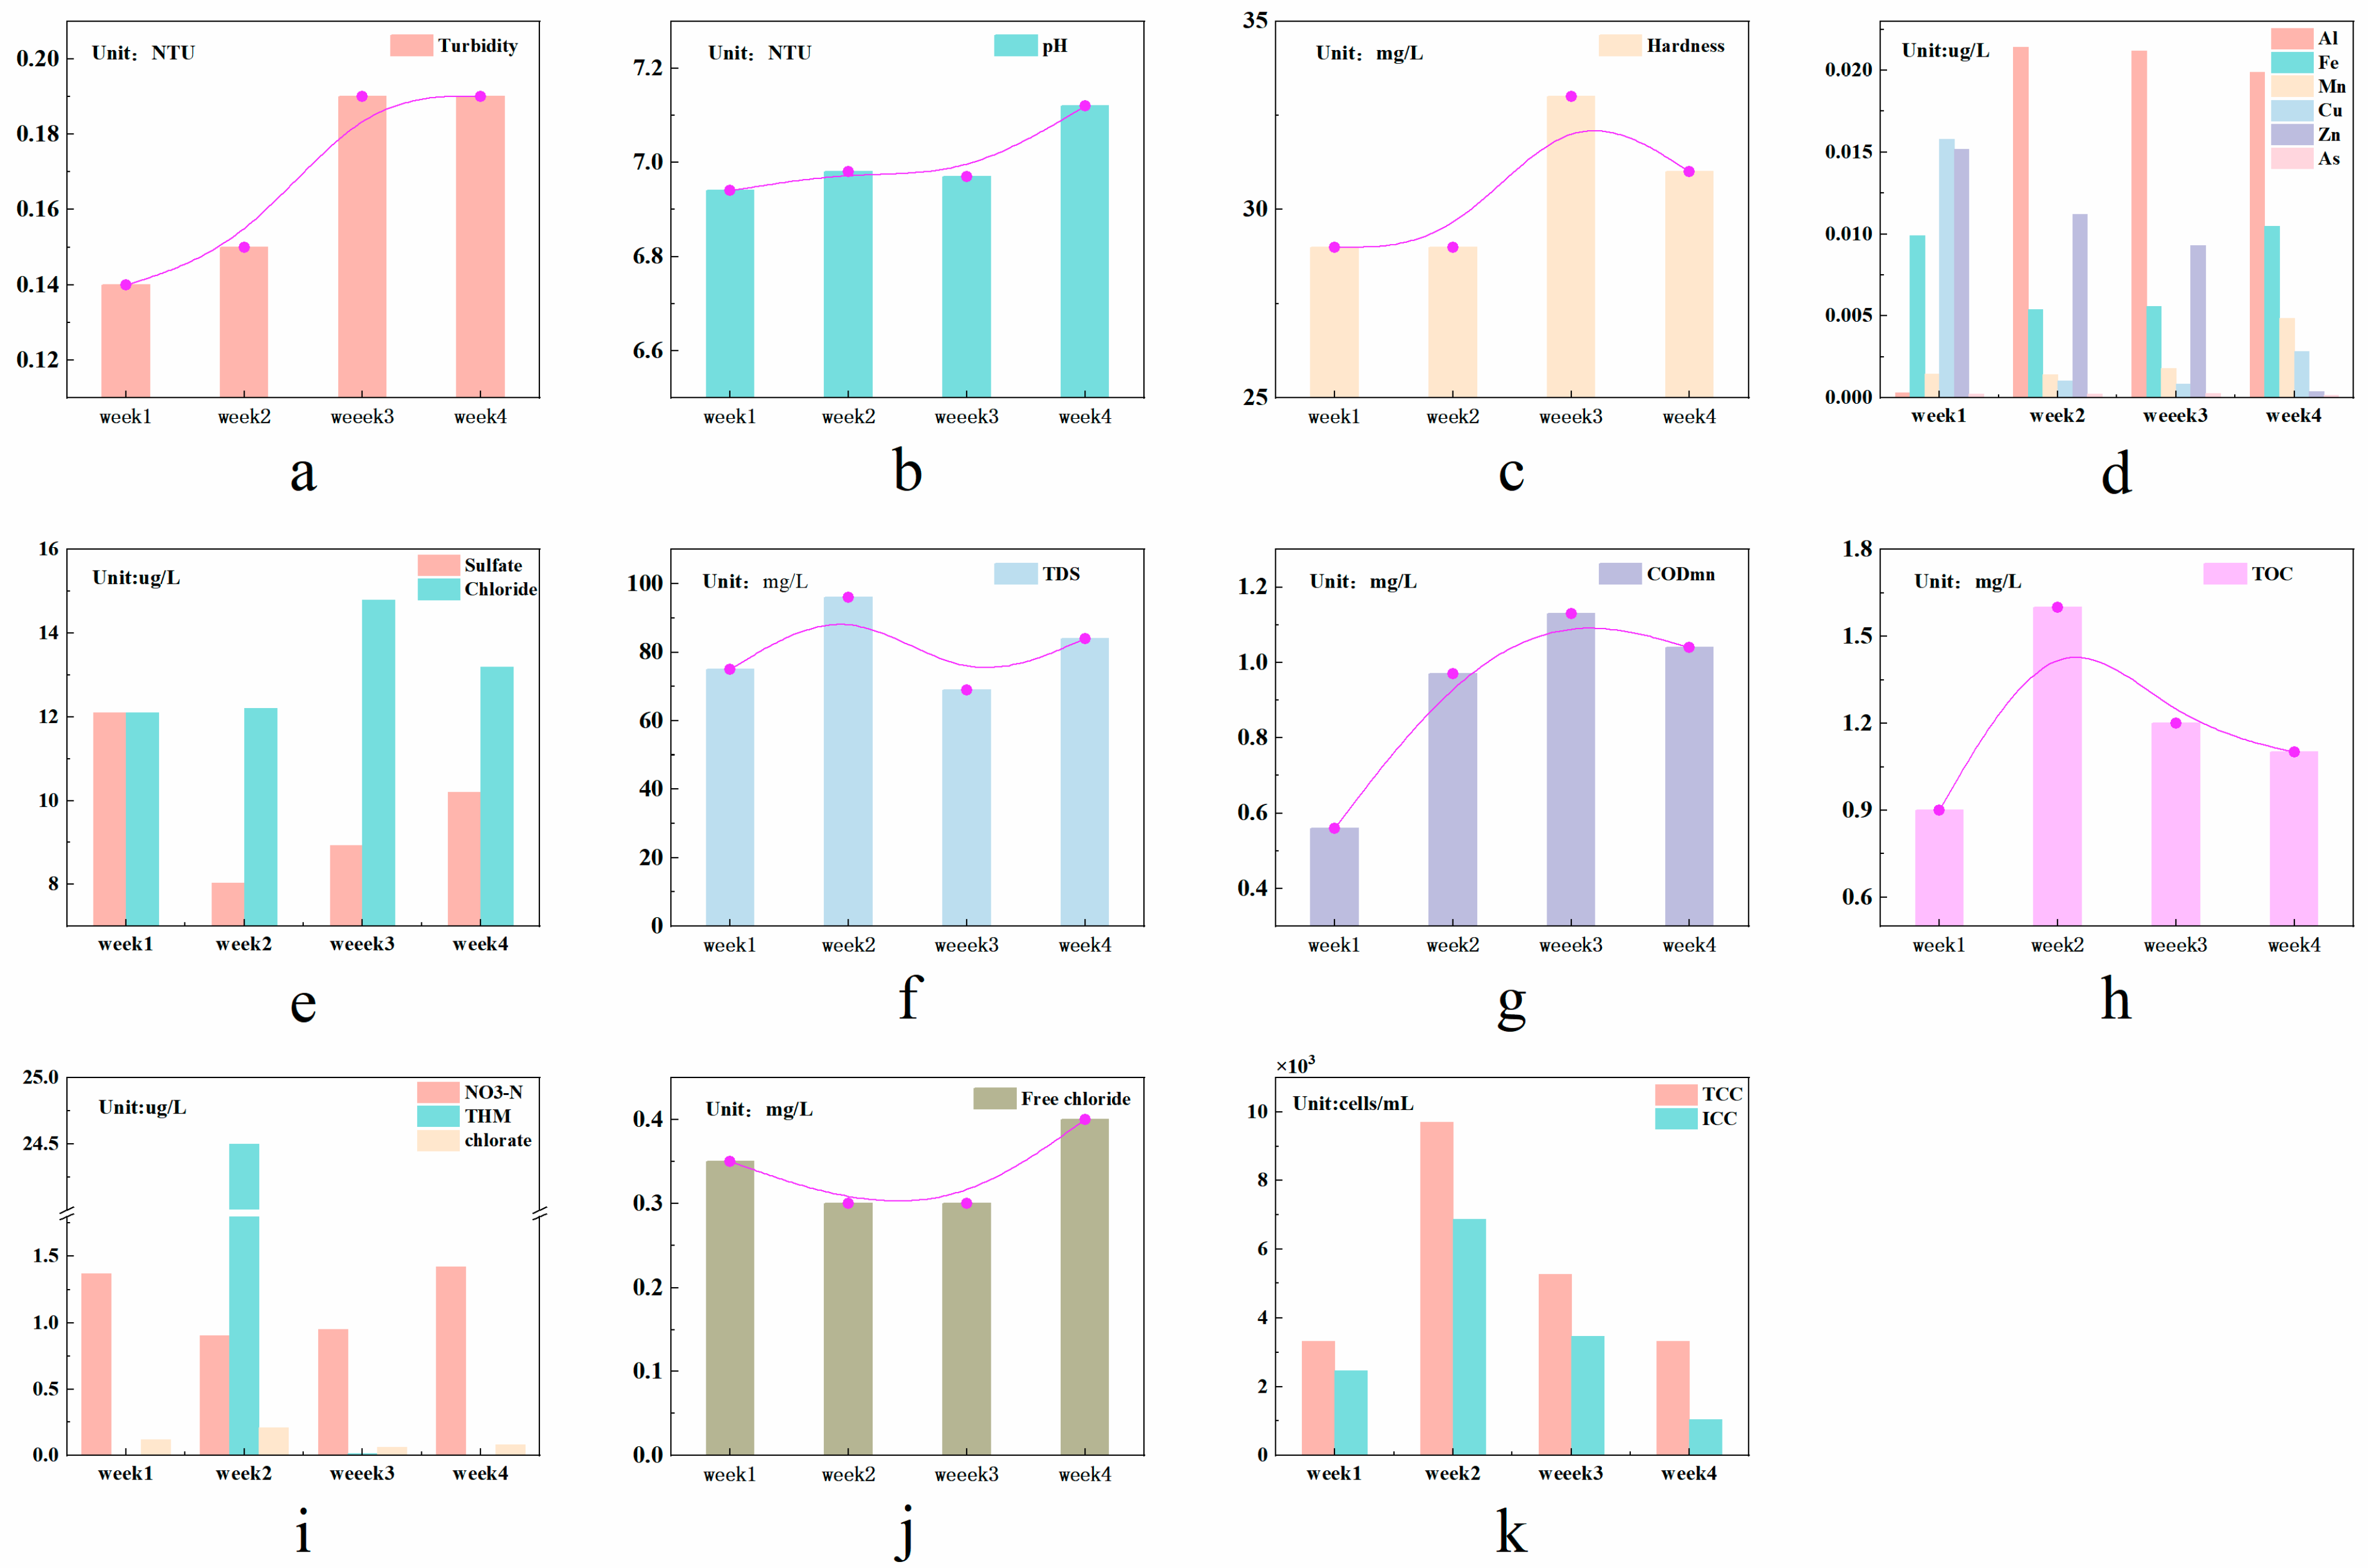
Based on data from four consecutive weekly samplings within the same month (Figure 3), physicochemical parameters exhibited limited fluctuations. Turbidity varied within a narrow range (0.14–0.19 NTU, Figure 3a), while pH showed a slight increasing trend (6.94 to 7.12, Figure 3b). Metal concentrations displayed significant inter-week variations. Aluminum concentration (0.0003–0.0214 mg/L) exceeded the WHO guideline value (0.20 mg/L) during the second week (Figure 3d), and iron fluctuated between 0.0054–0.0105 mg/L. Organic pollution indicators, including CODMn (0.56–1.13 mg/L) and TOC (0.90–1.60 mg/L, showed marked elevations in samples collected during Weeks 2–3.
Notably, microbial indicators exhibited abnormal elevation during the second week, with total cell count (TCC: 3325–9700 cells/mL) and intact cell count (ICC: 1042–6870 cells/mL) reaching peak values (Figure 3k). Concurrently, trihalomethane (THM) concentration surged to 24.5 μg/L during Week 2 (Figure 3i).

3.1.3. Annual Variation Characteristics of Water Quality

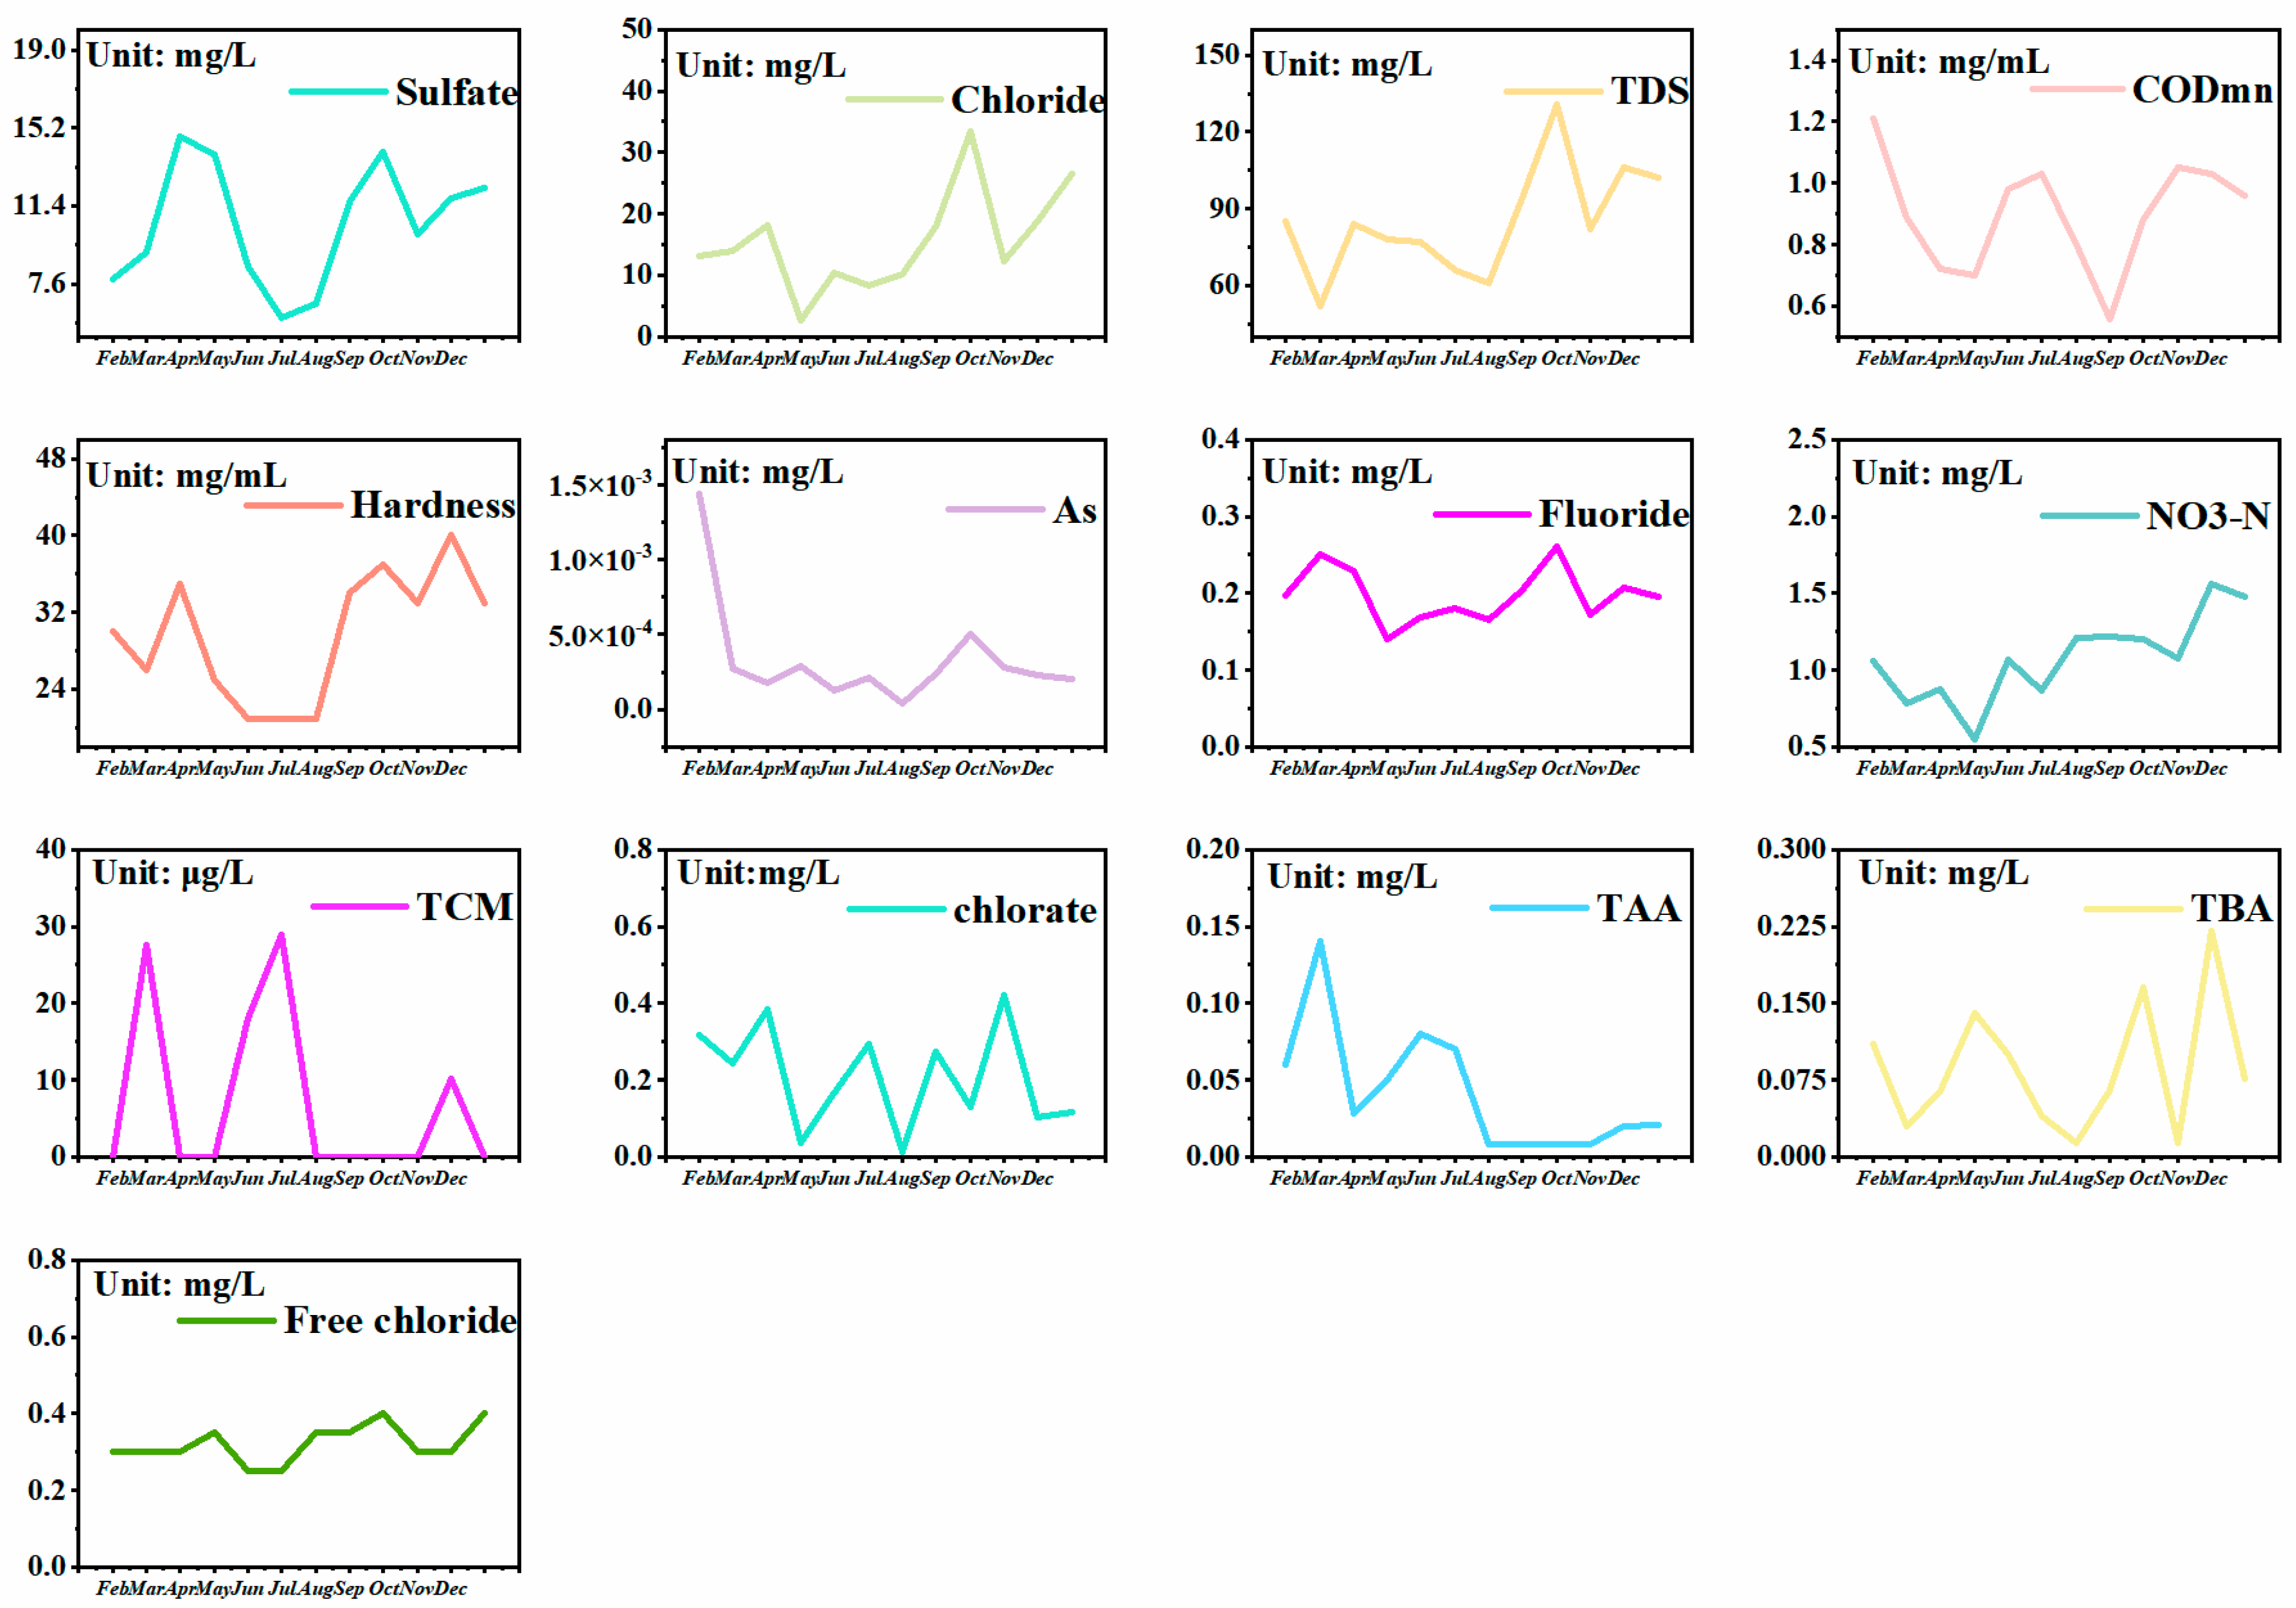
As shown in Figure 4 and Figure S1, pH maintained weakly alkaline conditions throughout the year (7.16 ± 0.24; CV = 0.02, p < 0.05), but exhibited significant seasonal fluctuations. Winter and summer values (December: pH = 6.94) were significantly lower than spring and autumn values (April: pH = 7.40). Turbidity remained stable (0.10–0.35 NTU), consistently below the WHO guideline (1 NTU). Heavy metals displayed substantial annual variations (CV: 0.48–1.64, p < 0.05), with Mn concentrations following water temperature trends, while other metals showed no distinct temporal patterns. Organic pollutants demonstrated synchronized elevation during autumn and winter (January and September), with TOC (1.35 ± 0.45 mg/L) and CODMn (0.885 ± 0.325 mg/L) reaching peak values. Disinfection byproduct monitoring revealed trichloromethane (TCM) peaks in February (27.5 μg/L) and June (28.9 μg/L), showing significant positive association with concurrent high TOC concentrations. In addition, water temperature followed a characteristic unimodal seasonal pattern, peaking in mid-June (34.3 °C) and reaching minima during December–January (5.1 °C), consistent with regional climatic characteristics.
Microbial indicators showed extreme anomalies in September (TCC = 860,981 cells/mL; ICC = 757,910 cells/mL) and October (TCC = 666,299 cells/mL). These TCC values exceeded the WHO recommended limit (<10,000 cells/mL) by 66–86 times, while all other water quality parameters remained within safe thresholds.

3.1.4. Association Characteristics of Water Quality Variations

As observed in Table 1, biomass in distributed water exhibited substantial temporal fluctuations (TCC: 4.7 ± 9.1 vs. 5.7 ± 3.0 vs. 16.2 ± 12.8 × 10³ cells/mL). Daily mean concentrations of metals (Al: 33 ± 35.56 μg/L; Mn: 30.1 ± 15.24 μg/L Zn: 28.13 ± 12.48 μg/L) exceeded their monthly and annual averages (Al: 15.7 ± 10.29 vs. 25.9 ± 18.59 μg/L; Mn: 2.39 ± 1.65 vs. 16.62 ± 7.9 μg/L; Zn: 9.03 ± 6.25 vs. 11.23 ± 10.19 μg/L), while Fe and Cu showed weaker temporal variations (Fe: 3.43 ± 1.75 vs. 7.85 ± 2.73 vs. 7.3 ± 5.79 μg/L; Cu: 2.9 ± 1.67 vs. 5.14 ± 7.16 vs. 2.27 ± 3.74 μg/L). Comparatively, non-metallic parameters including pH (7.47 ± 0.07), sulfate (13.15 ± 0.16 mg/L), chloride (16.72 ± 0.34 mg/L), and nitrate (1.24 ± 0.15 mg/L), maintained elevated daily means due to inherent raw water characteristics, though their temporal variability was significantly lower than monthly/annual fluctuations (pH: 7 ± 0.08 vs. 7.08 ± 0.16; sulfate: 9.82 ± 1.76 vs. 10.53 ± 2.98 mg/L; chloride: 13.08 ± 1.25 vs. 15.54 ± 8.3 mg/L; nitrate: 1.16 ± 0.27 vs. 1.08 ± 0.29 mg/L), indicating stronger temporal sensitivity for these indicators.
Coefficient of variation (CV) analysis (Table 2) demonstrated pronounced differences in temporal responsiveness: microbial parameters (TCC, ICC) showed the most extreme fluctuations (0.56 ≤ CV ≤ 2.34), heavy metals (Al, Fe, Mn, Cu, Zn) exhibited moderate variability (0.35 ≤ CV ≤ 1.64), while physicochemical indicators (pH, sulfate, chloride, nitrate) displayed minimal variations (0.01 ≤ CV ≤ 0.53), This reveals differential responses of water quality parameters to pipeline network environmental changes.

3.2. Correlation Characteristics Between Pipeline Network Water and Other Process Waters

3.2.1. Correlation Between Pipeline Network Water and Raw Water Quality

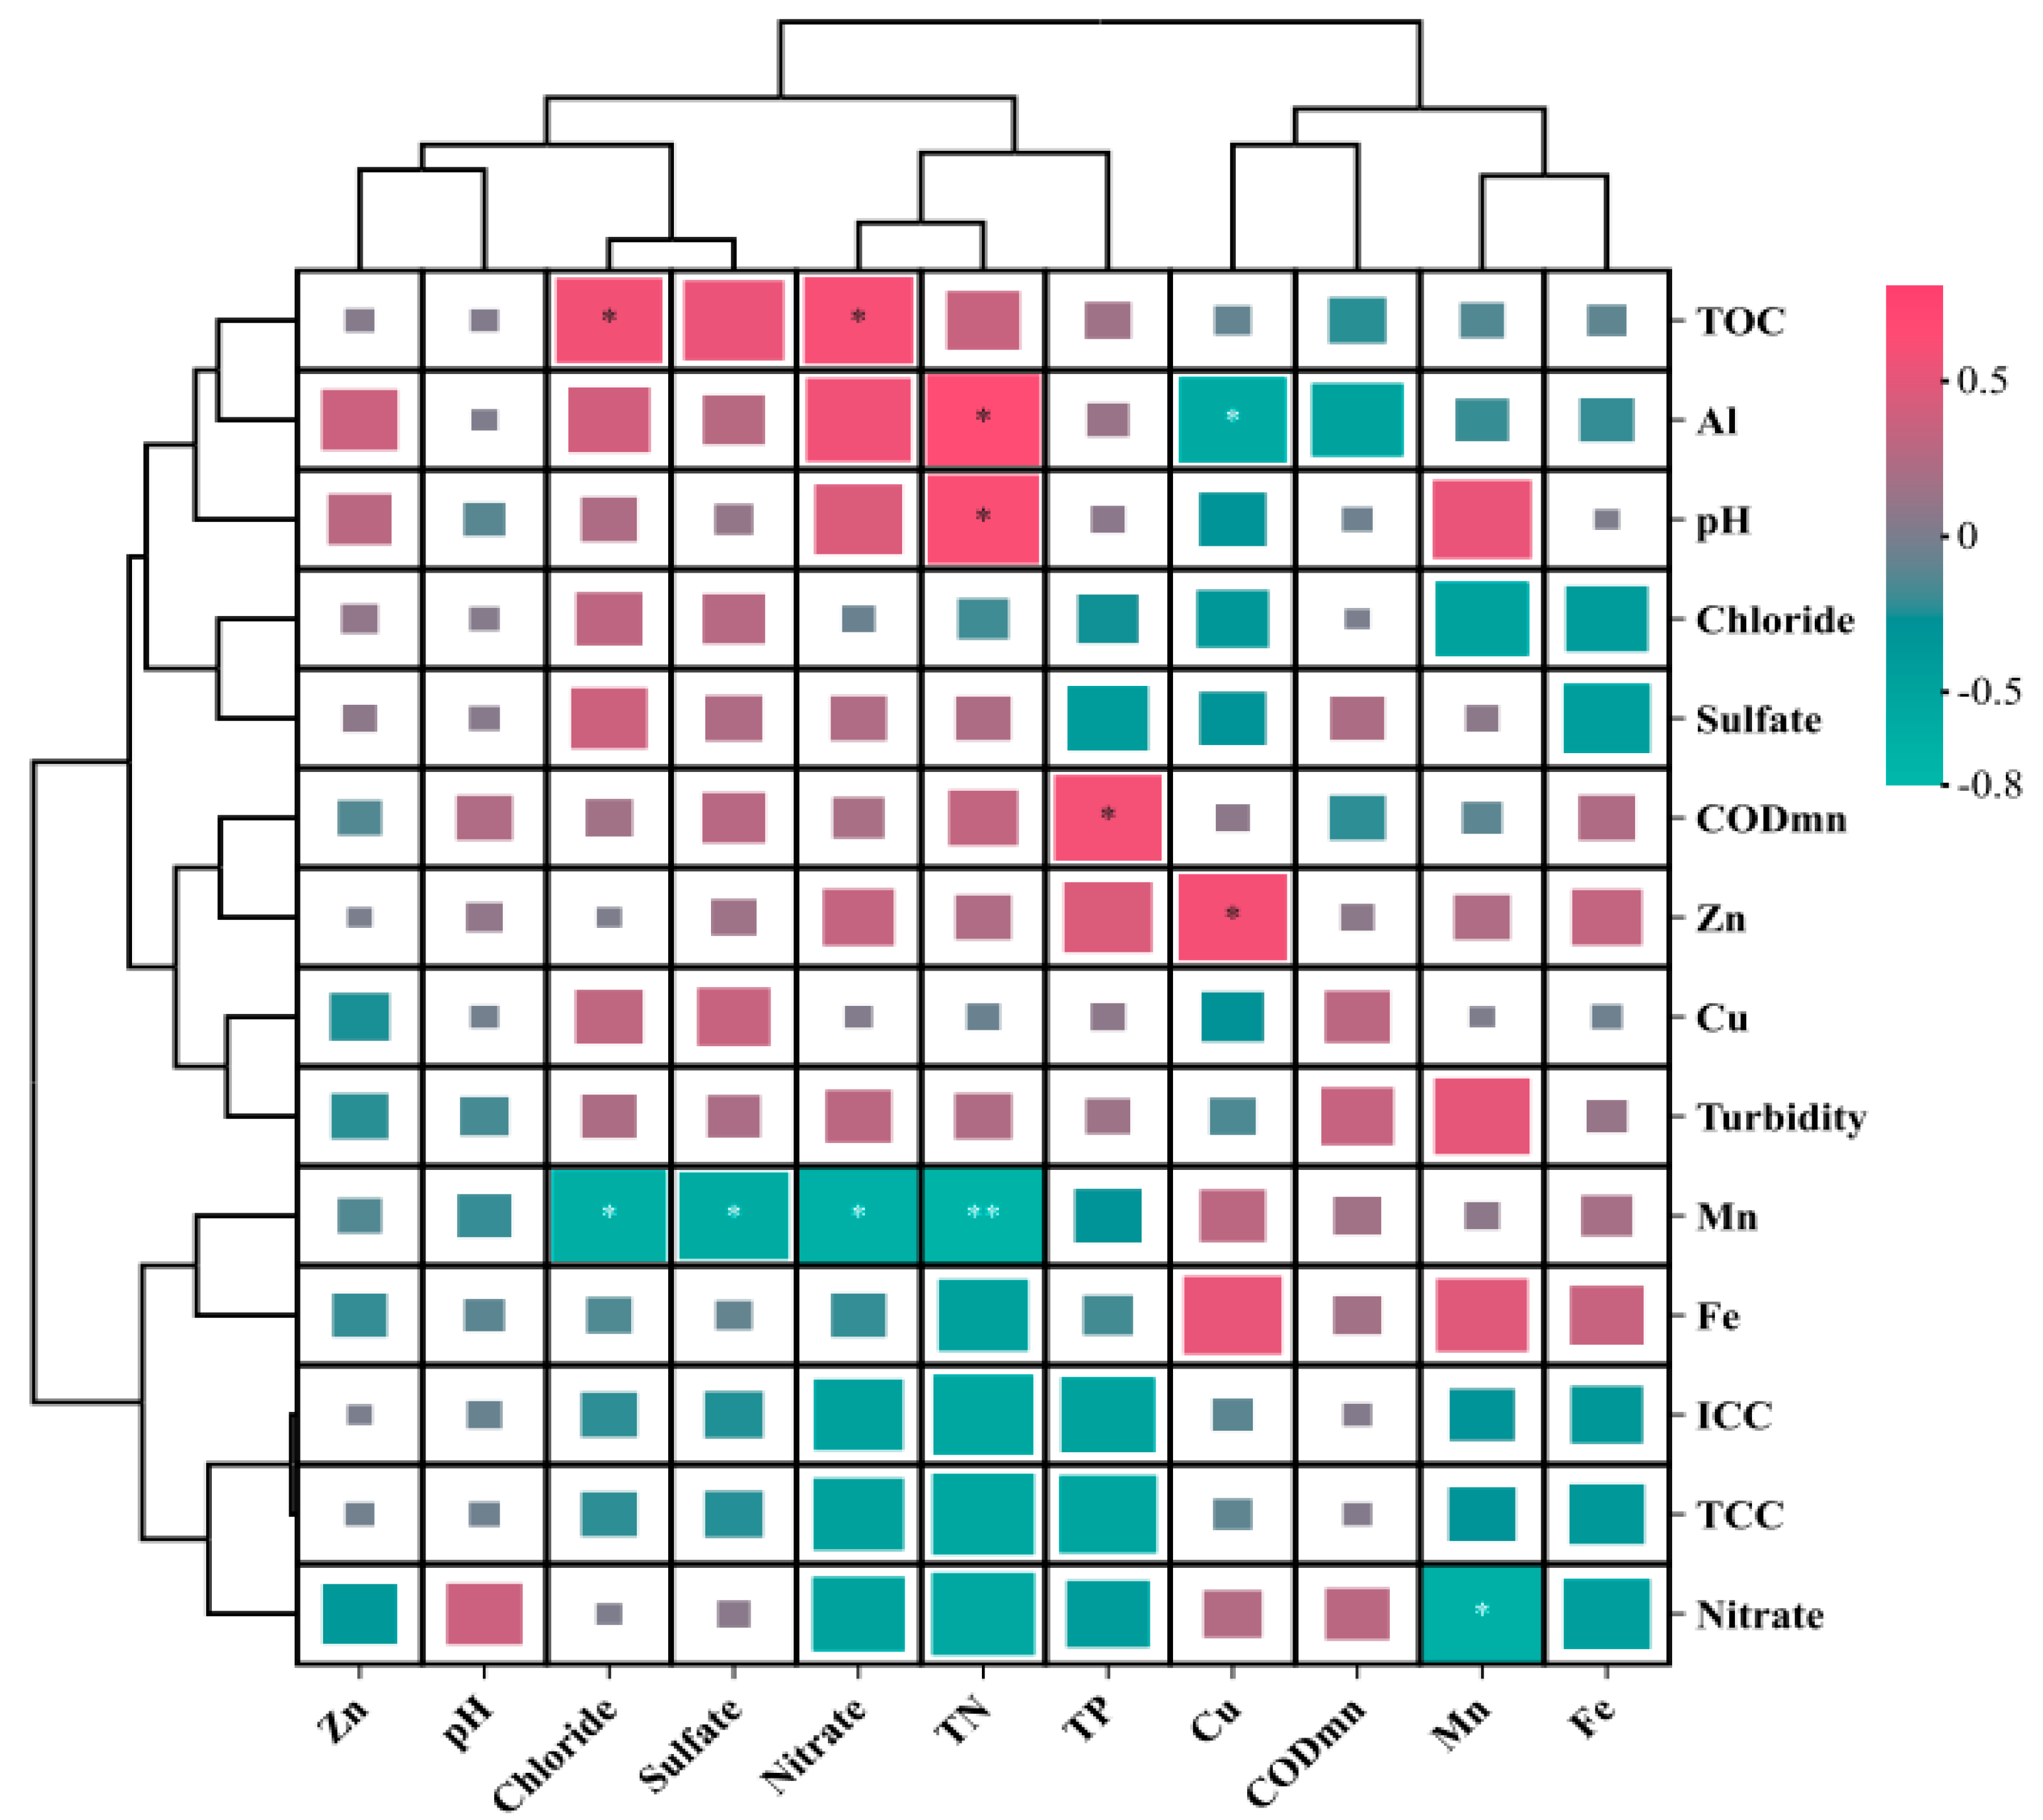
Inter-group correlation analysis of pipeline network water and raw water quality parameters (Figure 5) revealed significant positive correlations between TOC in pipeline network water and chloride (r = 0.58 *) as well as sulfate (r = 0.54 *) in raw water. Raw water total nitrogen (TN) demonstrated notable positive correlations with pipeline network pH (r = 0.62 *) and Al concentration (r = 0.63 *). Additionally, notable positive correlations existed between CODMn and TP (r = 0.58 *), and between Zn and Cu (r = 0.59 *). Notably, heavy metals predominantly exhibited negative correlations. Pipeline network Mn concentrations showed moderate negative correlations with raw water chloride (r = 0.64 *), sulfate (r = 0.60 *), and nitrate (r = 0.67 *), while demonstrating a strong negative correlation with TN (r = 0.71 **). The concentration of Cu in raw water also showed a moderate negative correlation with pipeline network Al concentration (r = 0.58 *).

3.2.2. Correlation Between Pipeline Network Water and Effluent Quality

Intergroup correlation analysis of pipeline network water and effluent quality parameters (Figure S2) revealed the following: pipeline network TCC showed significant positive correlations with effluent Al concentration (r = 0.60 *) and Zn concentration with nitrate (r = 0.62 *), while chloride and pH demonstrated strong positive correlation; among heavy metals, Mn showed notable positive correlations with Cu (r = 0.64 *) and Al (r = 0.66 *). Negative correlations were primarily observed between permanganate index (CODMn) and heavy metals, including significant inverse relationships with Mn (r = −0.63 *) and Fe concentrations (r = −0.60 *).

3.2.3. Continuity Analysis of Water Quality Correlation from Raw Water to Effluents to Pipeline Network Water

Based on Table S1 data, the evolution of water quality parameter correlations from raw water to pipeline network water exhibited significant nonlinear characteristics. Taking the TOC–sulfate system as an example, the correlation coefficient decreased from 0.54 (raw water) to 0.51 (effluents), with a weakening amplitude of Δr = 0.03. Though small, this change revealed the interference mechanism of water treatment processes on organic matter–sulfate synergistic effects. Similar mild weakening occurred in TOC–chloride (r: 0.58 to 0.55, Δr = −0.03), TOC–nitrate (r: 0.60 to 0.45, Δr = −0.15), turbidity–Mn (r: 0.58 to 0.47, Δr = −0.09), Al–Cu (Δr = −0.19), nitrate–Mn (r: −0.67 to −0.52, Δr = 0.15), Mn–sulfate (r: −0.60 to −0.45, Δr = 0.15), and Mn–chloride (r: −0.64 to −0.45, Δr = 0.19). Notable weakening was observed in pH–Mn (r: 0.52 to 0.29, Δr = −0.32), Al–nitrate (r:0.57 to 0.19, Δr = −0.38), Zn–Cu (r: 0.59 to −0.1, Δr = −0.69) and Fe–Cu (r: 0.52 to 0.19, Δr = −0.33).
The turbidity–sulfate system showed weak raw water correlation (r = 0.2) that strengthened to 0.54 post-treatment (Δr = 0.34). Similar reinforcement occurred in Mn–Fe (r: 0.19 to 0.51, Δr = 0.32), Mn–Cu (r: 0.29 to 0.64, Δr = 0.35), Zn–nitrate (r: 0.33 to 0.62, Δr = 0.29),CODMn-Zn (r: −0.14 to −0.51, Δr = −0.37), nitrate–nitrate (r: −0.48 to −0.53, Δr = −0.05), prominent reinforcements included chloride-pH (r: 0.04 to 0.63, Δr = 0.59), CODMn–Fe (r: 0.23 to −0.60, Δr = −0.83), and CODMn–Mn (r: −0.11 to − 0.63, Δr = −0.52). Global analysis revealed that 62% of parameters showed weakening effects (concentrated in metal–organic systems), while 38% exhibited reinforcement (primarily turbidity–anion and metal–biomass interactions). Notably, TCC–Fe correlation reversed from strong negative (r = −0.55) in raw water to strong positive (r = 0.51) in effluents (Δr = 1.06).

3.3. Microbial Community Succession from Raw Water to Effluents to Pipeline Network Water

Microbial sequencing analysis (abundance >1%) was conducted on samples from raw water, effluents, pipeline biofilm, and pipeline network water in the XWP treatment process. As shown in Figure 6, 111 microbial genera were identified. Raw water contained the highest diversity, with dominant genera including Phreatobacter (30.74%), norank_o_Chloroplast (27.54%), CL500-29_marine_group (9.45%), hgcI_clade (3.55%), unclassified_f_Comamonadaceae(2.37%). The dominant genera in the effluents including Phreatobacter (33.90%), norank_o_Chloroplast (22.74%), Undibacterium (14.01%), Herbaspirillum (9.46%), hgcI_clade (1.38%), Curvibacter (1.31%), Luteolibacter (1.11%), Terrimicrobium (1.01%), Peptoclostridium (1.01%). The dominant genera in pipeline biofilm including Pseudomonas (36.28%), Delftia (18.51%), Acinetobacter (14.52%), unclassified_f_Gallionellaceae (8.38%), norank_f_Gallionellaceae (3.86%), unclassified_f_Rhodocyclaceae (3.29%), Bradyrhizobium (2.72%), Sphingomonas (1.24%), Acidovorax (1.01%). The dominant bacterial genera in pipeline water samples including Phreatobacter (60.30%), Chryseomicrobium (15.96%), Acinetobacter (8.12%), unclassified_f_Hyphomonadaceae (3.09%), norank_o_Chloroplast (2.95%).

4. Discussion

4.1. Diurnal, Monthly, and Annual Variation Characteristics of Water Quality

4.1.1. Analysis of Diurnal, Monthly, and Annual Water Quality Characteristics

Based on the analysis of diurnal water quality variations, during peak water consumption periods (7:00–10:00, 20:00–22:00), significant increases were observed in pH, turbidity, biomass, chloride, Fe, and Zn concentrations. This indicates that these parameters are highly sensitive to water flow fluctuations, while other parameters showed minimal changes, suggesting their relatively stable forms within the pipeline network. Turbidity elevation during evening peaks (21:00–22:00) likely stems from sediment resuspension in pipelines, a process driven by increased shear stress from elevated flow velocities and weakened disinfection barriers due to nighttime residual chlorine decay (Cl decline to 16.87 mg/L) [17]. The midday turbidity peak (11:00–12:00; 1.56 NTU) was attributed to transient high shear forces caused by sudden flow acceleration, which disturbed pipeline sediments [18]. Nocturnal TCC surges (e.g., 44,633 cells/mL at 22:00) may result from synergistic biofilm sloughing and microbial proliferation during low-flow periods, with pipe scaling–microbial corrosion interactions further exacerbating turbidity fluctuations [19]. Similar findings by Calero Preciado et al. [20], indicated that intermittent water use alters environmental conditions in partially filled pipelines, where water stagnation reduces dissolved oxygen and disinfectant levels, thereby favoring microbial community shifts and proliferation [21]. Based on flow monitoring in the residential water supply network conducted by the local water utility, the peak flow velocity of cast iron pipes (with a service life of 15–20 years) during peak water consumption periods reaches 1.5 ± 0.3 m/s. This generates a wall shear stress (τ) of 0.9–1.4 Pa, calculated using the following formula:
τ   =   μ v D
where the variables are denoted as follows:
μ —water viscosity at 25 °C ( μ = 0.89 × 10⁻³ Pa·s);
v—velocity (m/s);
D—pipe diameter (D = 0.1 m);
These τ values exceed the critical threshold for biofilm adhesion in aged cast iron [22,23]. It can be inferred that when the system resumes water supply, the sudden increase in pressure and flow rate may dislodge biofilms and associated substances into the water [24], leading to issues such as discoloration, taste/odor problems, and elevated concentrations of metals, inorganic compounds, and pathogens. Our observed moderate positive correlations between turbidity and pH, TCC, ICC, TOC, and heavy metals (r = 0.36–0.45, p < 0.05) corroborate this mechanism.
During evening peaks, elevated Fe and Al concentrations may be linked to galvanic corrosion, where trivalent iron corrosion products act as electron acceptors and undergo reductive dissolution [25]. Furthermore, declining residual chlorine creates reducing conditions that promote microbial growth [26,27], driving the release of Fe, Mn, and Zn. Mn and Zn fluctuations are associated with the resuspension of Fe/Mn oxide colloids and weakened biofilm structures (reduced cohesion under low shear stress). The strong correlation between Fe and Pb (r = 0.82) suggests galvanic corrosion between lead-containing solder or lead-scale deposits and iron pipes. Notably, the midnight surge in Al concentrations (3:00–4:00) may result from residual aluminum salt coagulants or localized corrosion of aluminum pipes under stagnant water conditions [28].
Monthly fluctuations in pH and turbidity may relate to adjustments in waterworks’ chemical dosing or changes in pipeline hydraulic conditions. Studies have shown that metal ion anomalies are closely associated with localized corrosion in long-serving cast-iron pipelines [29,30]. Elevated organic matter indicators (CODMn and TOC) likely reflect seasonal inputs from surface runoff or biofilm proliferation in pipelines. The negative correlation between TCC/ICC and free chlorine concentrations indicates that insufficient disinfectant residuals drive microbial resurgence. The sudden increase in THMs observed in water samples during the second week indicates a strong correlation between THM formation and elevated levels of TOC and CODMn. This finding is consistent with the disinfection by-product formation mechanism investigated by MacKeown et al., highlighting the necessity to optimize disinfection strategies to balance microbial and chemical safety [31,32].
Annual water quality variations exhibit pronounced seasonal patterns. Low winter temperatures reduced pH through three mechanisms: increased carbonic acid dissociation constant (elevated H+ concentrations, pH decrease of 0.3–0.5 units), weakened nitrification (causing nitrate accumulation), and acid production from humic substance inputs (e.g., TOC rising to 1.8 mg/L in January) [33,34,35]. Conversely, in summer, high temperatures accelerated free chlorine decomposition, generating halogenated byproducts like TCM while releasing H+, resulting in abnormally low pH values and simultaneously stimulating microbial proliferation (e.g., August–September TCC/ICC exceeding baseline levels by >100-fold). Additionally, the sampling site in southern China is vulnerable to climatic impacts. The periods of elevated TCC/ICC in September and October coincided with extreme weather events recorded by local meteorological stations (peak rainfall: 160 mm/day on 22 September; 80 mm/day on 7 October). These meteorological conditions likely induced surface runoff carrying organic matter and sediments into source water, potentially reducing treatment efficiency and promoting microbial proliferation within the DWDS [36]. Risk assessment via quantitative microbial risk assessment (QMRA) demonstrates that when TCC in water exceeds 104 cells/100 mL, each exposure event may elevate the probability of gastrointestinal illness [37]. Despite weather influences, the extreme microbial outbreaks during these months highlight the vulnerability of chlorine disinfection, suggesting the need for supplementary disinfectants like chloramine or UV to enhance stability [38].
Elevated TOC in autumn–winter stems from humic substance inputs via surface runoff, which reacts with chlorine to form stable organochlorine compounds, inhibiting CODMn oxidation efficiency [39]. Lower winter temperatures suppress heterotrophic bacterial activity, leading to organic matter accumulation in pipelines and peak CODMn levels [40,41]. Research confirms that rising temperatures enhance microbial activity that promotes manganese release (Mn2+), while colder conditions decelerate Mn2+ redox transformations. This aligns with our observed correlation between Mn concentrations and water temperature fluctuations [42,43]. Spring snowmelt exacerbates pipeline corrosion, as indicated by rising Al and Fe concentrations, while summer heat simultaneously promotes disinfection byproduct formation and biofilm proliferation, causing concurrent increases in TCC/ICC and byproducts.

4.1.2. Correlation Analysis of Water Quality Characteristics

Drastic fluctuations in pipeline biomass may result from annual temperature variations affecting biofilm shedding. Summer heat accelerates biofilm growth, while winter cold inhibits metabolism, causing significant annual biomass variability [44]. Peak-hour flow surges scour biofilms from pipe walls, releasing microorganisms into the water, whereas stagnant zones during off-peak periods serve as ‘refugia’ for biofilm regeneration [45]. Insufficient free chlorine (daily average < 0.3 mg/L) allows chlorine-resistant bacteria to expel chlorine via efflux pumps, forming resistant biofilms and exacerbating microbial outbreaks [46].
Daily average concentrations of Al, Mn, and Zn in pipeline water exceed their monthly and annual averages, likely due to sampling timing and flow variations. Monthly and annual samples are typically collected during non-peak periods, while daily samples include peak hours. Elevated flow velocities during peaks scour corrosion products (e.g., Al/Mn-containing scale layers) from pipe walls, with high shear forces releasing heavy metals into the water. Reduced flow also promotes pollutant release from growth rings. This aligns with Liu et al. [47], where metal release first increases then decreases with rising velocity. Weaker Fe/Cu variations suggest their behavior is more influenced by source water quality or temperature-consistent with Zhang et al. [48] inking Fe release to temperature, chlorine, and pH. At the same time, some studies have found that as Fe is released, the release of heavy metal ions such as Cu also increases, which is consistent with the research results of this paper [49,50].
Non-metal parameters like pH and sulfate show smaller variation ranges and higher daily averages, primarily due to their inherent high concentrations in raw water. Their lower variability compared to monthly and annual averages indicates greater susceptibility to temporal changes [51]. Li et al. confirmed smaller CV for pH and its correlation with sampling sources and temporal variations [52].

4.2. Continuity Analysis of Water Quality Correlations Across Treatment Stages

4.2.1. Correlation Between Pipeline Water and Raw Water

The significant positive correlation between TOC and chloride/sulfate suggests co-migration or shared sources of organic matter and inorganic anions. Liu et al. found that TOC initially correlates positively then negatively with Cl under certain conditions, indicating chloride’s potential role in promoting TOC [53]. Such associations imply risks of organic–inorganic composite pollution in pipelines, such as disinfection byproduct (e.g., trihalomethane) formation. The positive correlation between raw water TN and pipeline water pH/Al (r > 0.6) may stem from residual aluminum coagulants (e.g., Al2(SO4)3) used in treatment. Yang et al. showed that Al3+ hydrolysis at low pH promotes NH4+ adsorption, while high pH enhances NO3 dissolution, requiring verification with treatment process data [54]. The positive CODMn–TP correlation (r = 0.49) suggests co-migration of organic pollutants and nutrients, while the strong Zn–Cu correlation (r = 0.67) likely reflects shared sources from pipeline corrosion or industrial discharge, necessitating isotopic tracing for pathway identification.
The strong negative correlations between Mn and Cl/SO42−/NO3/TP (r < −0.6) may result from redox competition: Mn (IV) oxide reduction to Mn2+ under anaerobic conditions inhibits sulfate-reducing bacteria and promotes phosphate release. The negative Cu–Al correlation (r = −0.58) suggests competitive adsorption on pipe deposits.

4.2.2. Correlation Between Pipeline Water and Effluents

The significant positive correlation between pipeline water TCC and effluents Al suggests that residual aluminum salts (e.g., AlCl3 coagulant) provide attachment sites or nutrients for microorganisms, indicating that excess coagulant may inadvertently amplify microbial regrowth in pipelines [55]. The positive Zn–nitrate correlation may involve zinc oxidation during nitrate reduction [56], while the positive chloride–pH correlation stems from pH fluctuations due to chlorine disinfectant (e.g., NaClO) hydrolysis. Positive Mn–Cu/Al correlations indicate metal co-deposition, such as Mn oxides adsorbing Cu2+ and Al3+.
The negative correlation between pipeline water CODMn and effluents Mn/Fe may result from redox competition: high CODMn (indicating organic oxidation capacity) promotes reduction of Mn(IV)/Fe(III) oxides to soluble Mn2+/Fe2+, reducing their concentrations [57].

4.2.3. Continuity Analysis of Water Quality Correlation from Raw Water to Effluents to Pipeline Network Water

The correlations between water quality parameters from source to pipeline water remain largely unaffected by treatment processes and pipeline pollutant release. Treatment processes weakened metal ion correlations by an average of Δr = 0.26 ± 0.19. For example, reduced Al–nitrate correlation may result from Al3+ forming Al13O4(OH)247+ polymers after PAC dosing, limiting nitrate complexation [58]. Weakened Zn–Cu correlations may stem from Zn2+ adsorption onto Fe(OH)3 colloids, blocking Cu2+ co-migration. Reduced pH–Mn correlation may relate to Mn2+ oxidation to MnO2 by pre-oxidation (e.g., ozone), disrupting pH–solubility equilibrium. Weakened Fe–Cu correlation may result from Fe3+oxidizingCu+ and Cu2+, altering valence synergies.
Conversely, treatment processes strengthened certain correlations (average Δr = 0.44 ± 0.29), particularly between metals, organics, nitrate, and biomass. Enhanced turbidity–sulfate correlation may stem from Al(OH)3 colloids adsorbing SO42− via protonated site. Similar mechanisms explain chloride–pH correlations, where Cl binds to colloid hydroxyl groups through hydrogen bonds, forming pH-dependent adsorption layers. Strengthened Mn–Cu correlation may relate to Mn-oxidizing bacteria (e.g., Pseudomonas spp.SK3) secreting EPS with carboxyl and phosphate groups that chelate both Mn2+ and Cu2+ [59]. The polarity reversal in TCC–Fe correlation suggests that high Fe levels in raw water may inhibit microorganisms through toxicity [60], while effluents Fe speciation changes (e.g., removal via coagulation) and reduced chlorine inhibition allow Fe to become a limiting factor for microbial growth in pipelines, resulting in positive correlation [61].

4.3. Microbial Community Succession from Raw Water to Effluents to Pipeline Network Water

Raw water microbial communities exhibit high diversity typical of natural water sources: high Chloroplast abundance indicates algal inputs, hgcI_clade reflects oligotrophic bacteria with biogeochemical functions (e.g., methylmercury production potential), while elevated CL500-29_marine_group and Comamonadaceae suggest adaptation to eutrophic conditions [62,63]. Phreatobacter dominance confirmed its prevalence in freshwater ecosystems [64].
Treatment processes significantly reshaped effluent microbiota: Phreatobacter abundance increased, while Chloroplast persisted as a core residue, indicating chlorine resistance. Undibacterium and Herbaspirillum proliferated, reflecting the dominance of oligotrophic, chlorine-tolerant taxa after competitor removal. Reduced species diversity and increased dominant genus count confirm strong treatment efficacy in eliminating most raw water bacteria.
Pipeline conditions (biofilm interactions, hydraulic retention, chlorine decay, nutrient limitation) drove further succession: Phreatobacter surged to 60.30% in pipelines, far exceeding effluent levels, highlighting its exceptional adaptability as the dominant planktonic species [65,66]. Chryseomicrobium became the second most abundant genus, likely utilizing biofilm interactions or residual organics as a poor-nutrient aerobe [67]. The persistent presence and biofilm enrichment of opportunistic pathogen Acinetobacter underscores its environmental resilience and biofilm-forming capacity, necessitating monitoring [68]. Chloroplast further declined to 2.95% under sustained chlorine pressure, consistent with prior findings [69].
Notably, pipeline biofilm and water samples differed markedly in microbial composition: biofilms were dominated by Pseudomonas, Delftia, and Acinetobacter, while water samples were Phreatobacter-dominant. Existing research confirms [70] that this differentiation is closely related to biofilm formation and pipe wall microenvironment characteristics. As a typical biofilm-forming bacterium, Pseudomonas can produce extracellular polymeric substances (EPS) to form biofilms or attach to existing biofilms in drinking water distribution systems, thereby resisting hydraulic shear forces and disinfectant effects [71]. This unique ecological adaptation gives it competitive advantage in biofilm microbial communities. The highly mobile, nutrient-poor distributed water favors Phreatobacter due to its oligotrophic adaptability, while facultative anaerobes (Delftia and Acinetobacter) and microaerophiles (Gallionellaceae) likely utilize the microoxic/anoxic zones within biofilms for denitrification or fermentative metabolism. Higher dissolved oxygen levels in water samples favored aerobic bacteria such as Phreatobacter [72,73,74]. Additionally, biofilms typically contain higher nitrate concentrations, and bacteria like Rhodocyclaceae, Bradyrhizobium, Sphingomonas, and Acidovorax possess nitrate respiration capabilities, using nitrates in distributed water as electron acceptors for growth [75]. Meanwhile, residual chlorine in distributed water may inhibit planktonic cells of biofilm-forming bacteria like Pseudomonas, but the EPS barrier effectively protects interior biofilm communities, representing the primary reason for dominant genus differences between biofilms and bulk water.
The microbial succession clearly reveals a synergistic driving mechanism of environmental filtering and biological interactions. The transition from complex raw water communities to single dominant species in distribution systems essentially represents directional evolution of microbial adaptive strategies under extreme environmental pressures. Continuous monitoring of opportunistic pathogens and investigation of biofilm–plankton interaction mechanisms hold significant scientific value for ensuring drinking water biological safety.

5. Conclusions

In summary, this study investigated the variation patterns and interrelationships of water quality parameters and microbial community succession from raw water to effluents to pipeline water. The main conclusions are as follows:
(1)
Diurnal fluctuations in pipeline water quality parameters were primarily caused by biofilm detachment and particle resuspension due to high shear stress from unsteady hydraulic conditions during peak water consumption periods. The significant negative correlation between biomass and free chlorine at monthly scales indicated that insufficient disinfectant residuals were the main driver of microbial resurgence. Annual water quality characteristics exhibited seasonal differences: low winter temperatures reduced pH through humic substance input, while high summer temperatures accelerated disinfectant decomposition and biofilm proliferation, leading to dramatic microbial biomass increases.
(2)
From raw water to pipeline water, metal–organic composite correlations weakened (Δr = 0.26 ± 0.19), while turbidity–sulfate and metal–biomass interactions strengthened (Δr = 0.44 ± 0.29), indicating that water treatment processes reshaped the synergistic mechanisms among water quality parameters.
(3)
The core factors influencing microbial community succession from source to treated to pipeline water were water nutrient status and disinfection pressure. Pseudomonas and other genera in pipe wall biofilms resisted disinfectants, while Phreatobacter dominated planktonic communities via oligotrophic adaptability, reflecting the decisive role of environmental conditions in shaping microbial community structure.

Supplementary Materials

The following supporting information can be downloaded at: https://www.mdpi.com/article/10.3390/w17172555/s1, Figure S1: Line chart of physicochemical and metal parameters of water quality within the year. Figure S2: Inter group correlation analysis between water quality parameters of pipeline network and factory water quality parameters (the statistical significance mark (*) in the heat map indicates a p-value less than 0.05); Table S1: The network parameters of the average well color development (AWCD590nm) and water bacterial community compositions in stagnant and fresh samples.

Author Contributions

Writing—original draft, X.J., W.L., X.S. and Y.Z. All authors have read and agreed to the published version of the manuscript.

Funding

This research was funded by National Natural Science Foundation of China Project (52470012), Research on Water Purification Process and Biological Safety and Control Technology of Reclaimed Water Quality (kh0040020250130) and Fuzhou High Quality Drinking Water Engineering Technology Consulting Service Project (kh0040020211986).

Data Availability Statement

The original contributions presented in this study are included in the article. Further inquiries can be directed to the corresponding author.

Conflicts of Interest

The authors declare no conflicts of interest.

Abbreviations

The following abbreviations are used in this manuscript:
DWDSDrinking water distribution systems
TCCTotal cell counts
ICCIntact cell concentration
TOCTotal organic carbon
WHOWorld Health Organization
THMsTrihalomethanes
TCMTrichloromethane

References

  1. Zhang, X.; Guo, Q.; Shen, X.; Yu, S.; Qiu, G. Water Quality, Agriculture and Food Safety in China: Current Situation, Trends, Interdependencies, and Management. J. Integr. Agric. 2015, 14, 2365–2379. [Google Scholar] [CrossRef]
  2. Zhao, Y.; Jiang, M.; Cheng, J.; Jiang, C. Characteristics and Impact Evaluation of Hydrological and Water Quality Changes in the Northern Plain of Cixi, Eastern China, from 2010 to 2022. Water 2024, 16, 489. [Google Scholar] [CrossRef]
  3. Luo, H.; Nong, X.; Xia, H.; Liu, H.; Zhong, L.; Feng, Y.; Zhou, W.; Lu, Y. Integrating Water Quality Index (WQI) and Multivariate Statistics for Regional Surface Water Quality Evaluation: Key Parameter Identification and Human Health Risk Assessment. Water 2024, 16, 3412. [Google Scholar] [CrossRef]
  4. Olatunde, K.; Patton, S.K.; Cameron, L.; Stankus, T.; Milaham, P.J. Factors Affecting the Quality of Drinking Water in the United States of America: A Ten-Year Systematic Review. Am. J. Water Resour. 2022, 10, 24–34. [Google Scholar] [CrossRef]
  5. Perveen, S. Amar-Ul-Haque Drinking Water Quality Monitoring, Assessment and Management in Pakistan: A Review. Heliyon 2023, 9, e13872. [Google Scholar] [CrossRef]
  6. Price, J.I.; Heberling, M.T. The Effects of Source Water Quality on Drinking Water Treatment Costs: A Review and Synthesis of Empirical Literature. Ecol. Econ. 2018, 151, 195–209. [Google Scholar] [CrossRef]
  7. Rahman, S.; Khan, A.A.; Brake, K.; Tobin, A. Deriving Water Quality Index Using Site-Specific Water Quality Parameter Guidelines for Real-Time Water Quality Stations. Water Qual. Res. J. 2024, 59, 347–367. [Google Scholar] [CrossRef]
  8. Xu, W.; Duan, L.; Wen, X.; Li, H.; Li, D.; Zhang, Y.; Zhang, H. Effects of Seasonal Variation on Water Quality Parameters and Eutrophication in Lake Yangzong. Water 2022, 14, 2732. [Google Scholar] [CrossRef]
  9. Riyadh, A.; Peleato, N.M. Natural Organic Matter Character in Drinking Water Distribution Systems: A Review of Impacts on Water Quality and Characterization Techniques. Water 2024, 16, 446. [Google Scholar] [CrossRef]
  10. Zlatanović, L.; van der Hoek, J.P.; Vreeburg, J.H.G. An Experimental Study on the Influence of Water Stagnation and Temperature Change on Water Quality in a Full-Scale Domestic Drinking Water System. Water Res. 2017, 123, 761–772. [Google Scholar] [CrossRef]
  11. Guo, Y.; Liu, Y.; Li, W.; Cai, X.; Liu, X.; Liao, H. Multi-Scale Impacts of Land Use Change on River Water Quality in the Xinxian River, Yangtze River Basin. Water 2025, 17, 1541. [Google Scholar] [CrossRef]
  12. Zhang, X.; Liu, Y.; Zhou, L. Correlation Analysis between Landscape Metrics and Water Quality under Multiple Scales. Int. J. Environ. Res. Public Health 2018, 15, 1606. [Google Scholar] [CrossRef] [PubMed]
  13. Moeinzadeh, H.; Yong, K.-T.; Withana, A. A Critical Analysis of Parameter Choices in Water Quality Assessment. Water Res. 2024, 258, 121777. [Google Scholar] [CrossRef] [PubMed]
  14. Lehtola, M.J.; Laxander, M.; Miettinen, I.T.; Hirvonen, A.; Vartiainen, T.; Martikainen, P.J. The Effects of Changing Water Flow Velocity on the Formation of Biofilms and Water Quality in Pilot Distribution System Consisting of Copper or Polyethylene Pipes. Water Res. 2006, 40, 2151–2160. [Google Scholar] [CrossRef]
  15. GB/T 11892-1989; Water Quality-Determination of Permanganate Index. National Environmental Protection Bureau Standards Press of China: Beijing, China, 1990.
  16. GB/T 5750.4-2006; Standard Examination Methods for Drinking Water—Part 4: Organoleptic and Physical Indices. Standardization Administration of China Standards Press of China: Beijing, China, 2006.
  17. Aisopou, A.; Stoianov, I.; Graham, N.J.D. In-Pipe Water Quality Monitoring in Water Supply Systems under Steady and Unsteady State Flow Conditions: A Quantitative Assessment. Water Res. 2012, 46, 235–246. [Google Scholar] [CrossRef]
  18. Juncosa, R.; Cereijo, J.L.; Vázquez, R. Physicochemical Parameters in the Generation of Turbidity Episodes in a Water Supply Distribution System. Water 2022, 14, 3383. [Google Scholar] [CrossRef]
  19. Novak Babič, M.; Gunde-Cimerman, N. Water-Transmitted Fungi Are Involved in Degradation of Concrete Drinking Water Storage Tanks. Microorganisms 2021, 9, 160. [Google Scholar] [CrossRef] [PubMed]
  20. Calero Preciado, C.; Husband, S.; Boxall, J.; del Olmo, G.; Soria-Carrasco, V.; Maeng, S.K.; Douterelo, I. Intermittent Water Supply Impacts on Distribution System Biofilms and Water Quality. Water Res. 2021, 201, 117372. [Google Scholar] [CrossRef]
  21. Agudelo-Vera, C.; Blokker, M.; Pieterse-Quirijns, I. Early Warning Systems to Predict Temperature in the Drinking Water Distribution Network. Procedia Eng. 2014, 70, 23–30. [Google Scholar] [CrossRef]
  22. Manuel, C.M.; Nunes, O.C.; Melo, L.F. Dynamics of Drinking Water Biofilm in Flow/Non-Flow Conditions. Water Res. 2007, 41, 551–562. [Google Scholar] [CrossRef]
  23. Douterelo, I.; Sharpe, R.L.; Boxall, J.B. Influence of Hydraulic Regimes on Bacterial Community Structure and Composition in an Experimental Drinking Water Distribution System. Water Res. 2013, 47, 503–516. [Google Scholar] [CrossRef]
  24. Kumpel, E.; Nelson, K.L. Intermittent Water Supply: Prevalence, Practice, and Microbial Water Quality. Environ. Sci. Technol. 2016, 50, 542–553. [Google Scholar] [CrossRef]
  25. Hu, D.; Zeng, J.; Hu, Y.; Fei, X.; Xiao, X.; Feng, M.; Yu, X. A Survey on Heavy Metal Concentrations in Residential Neighborhoods: The Influence of Secondary Water Supply Systems. J. Environ. Sci. 2022, 117, 37–45. [Google Scholar] [CrossRef]
  26. Hu, D.; Hong, H.; Rong, B.; Wei, Y.; Zeng, J.; Zhu, J.; Bai, L.; Guo, F.; Yu, X. A Comprehensive Investigation of the Microbial Risk of Secondary Water Supply Systems in Residential Neighborhoods in a Large City. Water Res. 2021, 205, 117690. [Google Scholar] [CrossRef]
  27. Wang, Y.; Zhang, X.J.; Niu, Z.B.; Chen, C.; Lu, P.P.; Tang, F. Effect of Chloramine Residual on Iron Release in Drinking Water Distribution Systems. Water Supply 2009, 9, 349–355. [Google Scholar] [CrossRef]
  28. Pokrovsky, O.S.; Shirokova, L.S. Diurnal Variations of Dissolved and Colloidal Organic Carbon and Trace Metals in a Boreal Lake during Summer Bloom. Water Res. 2013, 47, 922–932. [Google Scholar] [CrossRef] [PubMed]
  29. Kimbell, L.K.; Wang, Y.; McNamara, P.J. The Impact of Metal Pipe Materials, Corrosion Products, and Corrosion Inhibitors on Antibiotic Resistance in Drinking Water Distribution Systems. Appl. Microbiol. Biotechnol. 2020, 104, 7673–7688. [Google Scholar] [CrossRef] [PubMed]
  30. Urishev, B.; Artikbekova, F.; Kuvvatov, D.; Nosirov, F.; Kuvatov, U. Trajectory of Sediment Deposition at the Bottom of Water Intake Structures of Pumping Stations. IOP Conf. Ser. Mater. Sci. Eng. 2021, 1030, 012137. [Google Scholar] [CrossRef]
  31. MacKeown, H.; Adusei Gyamfi, J.; Schoutteten, K.V.K.M.; Dumoulin, D.; Verdickt, L.; Ouddane, B.; Criquet, J. Formation and Removal of Disinfection By-Products in a Full Scale Drinking Water Treatment Plant. Sci. Total Environ. 2020, 704, 135280. [Google Scholar] [CrossRef]
  32. Valdivia-Garcia, M.; Weir, P.; Frogbrook, Z.; Graham, D.W.; Werner, D. Climatic, Geographic and Operational Determinants of Trihalomethanes (THMs) in Drinking Water Systems. Sci. Rep. 2016, 6, 35027. [Google Scholar] [CrossRef]
  33. Kim, S.; Kim, Y.; Park, B.H.; Lee, J.H.; Kang, J.W. Measurement and Correlation of Solubility of Water in Carbon Dioxide-Rich Phase. Fluid Phase Equilibria 2012, 328, 9–12. [Google Scholar] [CrossRef]
  34. Li, K.; Cao, X.; Zhou, S.; Li, L. Spatial and Temporal Distribution Characteristics of pCO2 and CO2 Evasion in Karst Rivers under the Influence of Urbanization. Environ. Sci. Pollut. Res. 2023, 30, 53920–53937. [Google Scholar] [CrossRef]
  35. Zhou, W.; Zhang, Q.; Wang, B.; Hou, F.; Pang, H.; Guo, Y.; Zhang, L.; Peng, Y. Temperature-Based Strategy for Enhanced Nitrogen Removal in Mainstream via Selectively Strengthening Anammox or Denitrification. npj Clean Water 2025, 8, 23. [Google Scholar] [CrossRef]
  36. Meyneng, M.; Lemonnier, H.; Le Gendre, R.; Plougoulen, G.; Antypas, F.; Ansquer, D.; Serghine, J.; Schmitt, S.; Siano, R. Subtropical Coastal Microbiome Variations Due to Massive River Runoff after a Cyclonic Event. Environ. Microbiome 2024, 19, 10. [Google Scholar] [CrossRef]
  37. Delair, Z.; Schoeman, M.; Reyneke, B.; Singh, A.; Barnard, T.G. Assessing the Impact of Escherichia Coli on Recreational Water Safety Using Quantitative Microbial Risk Assessment. J. Water Health 2024, 22, 1781–1793. [Google Scholar] [CrossRef]
  38. Miklos, D.B.; Remy, C.; Jekel, M.; Linden, K.G.; Drewes, J.E.; Hübner, U. Evaluation of Advanced Oxidation Processes for Water and Wastewater Treatment—A Critical Review. Water Res. 2018, 139, 118–131. [Google Scholar] [CrossRef] [PubMed]
  39. Khatami, S.; Deng, Y.; Tien, M.; Hatcher, P.G. Formation of Water-Soluble Organic Matter through Fungal Degradation of Lignin. Org. Geochem. 2019, 135, 64–70. [Google Scholar] [CrossRef]
  40. Saarinen, T.; Vuori, K.-M.; Alasaarela, E.; Kløve, B. Long-Term Trends and Variation of Acidity, CODMn and Colour in Coastal Rivers of Western Finland in Relation to Climate and Hydrology. Sci. Total Environ. 2010, 408, 5019–5027. [Google Scholar] [CrossRef]
  41. Xi, H.; Zhou, X.; Arslan, M.; Luo, Z.; Wei, J.; Wu, Z.; Gamal El-Din, M. Heterotrophic Nitrification and Aerobic Denitrification Process: Promising but a Long Way to Go in the Wastewater Treatment. Sci. Total Environ. 2022, 805, 150212. [Google Scholar] [CrossRef]
  42. Sparrow, L.A.; Uren, N.C. Manganese Oxidation and Reduction in Soils: Effects of Temperature, Water Potential, pH and Their Interactions. Soil Res. 2014, 52, 483–494. [Google Scholar] [CrossRef]
  43. Paufler, S.; Grischek, T.; Benso, M.R.; Seidel, N.; Fischer, T. The Impact of River Discharge and Water Temperature on Manganese Release from the Riverbed during Riverbank Filtration: A Case Study from Dresden, Germany. Water 2018, 10, 1476. [Google Scholar] [CrossRef]
  44. Yao, M.; Zhang, Y.; Dai, Z.; Ren, A.; Fang, J.; Li, X.; van der Meer, W.; Medema, G.; Rose, J.B.; Liu, G. Building Water Quality Deterioration during Water Supply Restoration after Interruption: Influences of Premise Plumbing Configuration. Water Res. 2023, 241, 120149. [Google Scholar] [CrossRef] [PubMed]
  45. Zhang, K.; Wu, X.; Zhang, T.; Cen, C.; Mao, R.; Pan, R. Pilot Investigation on Biostability of Drinking Water Distribution Systems under Water Source Switching. Appl. Microbiol. Biotechnol. 2022, 106, 5273–5286. [Google Scholar] [CrossRef]
  46. Pan, R.; Zhang, K.; Cen, C.; Zhou, X.; Xu, J.; Wu, J.; Wu, X. Characteristics of Biostability of Drinking Water in Aged Pipes after Water Source Switching: ATP Evaluation, Biofilms Niches and Microbial Community Transition. Environ. Pollut. 2021, 271, 116293. [Google Scholar] [CrossRef]
  47. Liu, J.; Shentu, H.; Chen, H.; Ye, P.; Xu, B.; Zhang, Y.; Bastani, H.; Peng, H.; Chen, L.; Zhang, T. Change Regularity of Water Quality Parameters in Leakage Flow Conditions and Their Relationship with Iron Release. Water Res. 2017, 124, 353–362. [Google Scholar] [CrossRef]
  48. Zhang, H.; Xu, L.; Huang, T.; Yan, M.; Liu, K.; Miao, Y.; He, H.; Li, S.; Sekar, R. Combined Effects of Seasonality and Stagnation on Tap Water Quality: Changes in Chemical Parameters, Metabolic Activity and Co-Existence in Bacterial Community. J. Hazard. Mater. 2021, 403, 124018. [Google Scholar] [CrossRef]
  49. Sun, H.; Shi, B.; Yang, F.; Wang, D. Effects of Sulfate on Heavy Metal Release from Iron Corrosion Scales in Drinking Water Distribution System. Water Res. 2017, 114, 69–77. [Google Scholar] [CrossRef] [PubMed]
  50. Yang, F.; Shi, B.; Bai, Y.; Sun, H.; Lytle, D.A.; Wang, D. Effect of Sulfate on the Transformation of Corrosion Scale Composition and Bacterial Community in Cast Iron Water Distribution Pipes. Water Res. 2014, 59, 46–57. [Google Scholar] [CrossRef]
  51. Kumari, M.; Tripathi, S.; Pathak, V.; Tripathi, B.D. Chemometric Characterization of River Water Quality. Environ. Monit. Assess. 2013, 185, 3081–3092. [Google Scholar] [CrossRef]
  52. Li, S.; Chen, X.; Singh, V.P.; He, Y.; Bai, X. An Improved Index for Water Quality Evaluation in an Estuary Region: A Case Study in the Eastern Pearl River Delta, China. Water Policy 2019, 21, 310–325. [Google Scholar] [CrossRef]
  53. Liu, C.; Li, H.; Zhang, X.; Zheng, S.; Zhang, L.; Guo, Z.; Liu, J.; Tian, J.; Zhang, Y.; Zeng, X. Geochemical Characteristics of the Paleogene and Neogene Saline Lacustrine Source Rocks in the Western Qaidam Basin, Northwestern China. Energy Fuels 2016, 30, 4537–4549. [Google Scholar] [CrossRef]
  54. Yang, Z.; Gao, B.; Yue, Q. Coagulation Performance and Residual Aluminum Speciation of Al2(SO4)3 and Polyaluminum Chloride (PAC) in Yellow River Water Treatment. Chem. Eng. J. 2010, 165, 122–132. [Google Scholar] [CrossRef]
  55. Tahraoui, H.; Toumi, S.; Boudoukhani, M.; Touzout, N.; Sid, A.N.E.H.; Amrane, A.; Belhadj, A.-E.; Hadjadj, M.; Laichi, Y.; Aboumustapha, M.; et al. Evaluating the Effectiveness of Coagulation–Flocculation Treatment Using Aluminum Sulfate on a Polluted Surface Water Source: A Year-Long Study. Water 2024, 16, 400. [Google Scholar] [CrossRef]
  56. Zhang, Z.; Lv, Y.; Gu, Y.; Zhou, X.; Tian, B.; Zhang, A.; Yang, Z.; Chen, S.; Ma, J.; Ding, M.; et al. Dual Zn5−NiS4 Sites in a Redox-Active Metal–Organic Framework Enables Efficient Cascade Catalysis for Nitrate-to-Ammonia Conversion. Angew. Chem. Int. Ed. 2025, 64, e202418272. [Google Scholar] [CrossRef]
  57. Li, Y.; Fan, Y.; Wang, Y.; Zhu, Y.; Zhu, Z.; Mo, S.; Zhou, X.; Zhang, Y. Performance and Mechanism of Co and Mn Loaded on Fe-Metal-Organic Framework Catalysts with Different Morphologies for Simultaneous Degradation of Acetone and NO by Photothermal Coupling. Toxics 2024, 12, 524. [Google Scholar] [CrossRef]
  58. Liao, L.; Zhang, P. Preparation and Characterization of Polyaluminum Titanium Silicate and Its Performance in the Treatment of Low-Turbidity Water. Processes 2018, 6, 125. [Google Scholar] [CrossRef]
  59. Kitjanukit, S.; Takamatsu, K.; Okibe, N. Natural Attenuation of Mn(II) in Metal Refinery Wastewater: Microbial Community Structure Analysis and Isolation of a New Mn(II)-Oxidizing Bacterium Pseudomonas sp. SK3. Water 2019, 11, 507. [Google Scholar] [CrossRef]
  60. Cudowski, A.; Pietryczuk, A. Biochemical Response of Rhodotorula mucilaginosa and Cladosporium herbarum Isolated from Aquatic Environment on Iron(III) Ions. Sci. Rep. 2019, 9, 19492. [Google Scholar] [CrossRef]
  61. Appenzeller, B.M.R.; Yañez, C.; Jorand, F.; Block, J.-C. Advantage Provided by Iron for Escherichia Coli Growth and Cultivability in Drinking Water. Appl. Environ. Microbiol. 2005, 71, 5621–5623. [Google Scholar] [CrossRef] [PubMed]
  62. Ruprecht, J.E.; Birrer, S.C.; Dafforn, K.A.; Mitrovic, S.M.; Crane, S.L.; Johnston, E.L.; Wemheuer, F.; Navarro, A.; Harrison, A.J.; Turner, I.L.; et al. Wastewater Effluents Cause Microbial Community Shifts and Change Trophic Status. Water Res. 2021, 200, 117206. [Google Scholar] [CrossRef]
  63. Wang, B.; Hu, K.; Li, C.; Zhang, Y.; Hu, C.; Liu, Z.; Ding, J.; Chen, L.; Zhang, W.; Fang, J.; et al. Geographic Distribution of Bacterial Communities of Inland Waters in China. Environ. Res. 2024, 249, 118337. [Google Scholar] [CrossRef]
  64. Perrin, Y.; Bouchon, D.; Delafont, V.; Moulin, L.; Héchard, Y. Microbiome of Drinking Water: A Full-Scale Spatio-Temporal Study to Monitor Water Quality in the Paris Distribution System. Water Res. 2019, 149, 375–385. [Google Scholar] [CrossRef]
  65. Ma, X.; Li, G.; Chen, R.; Yu, Y.; Tao, H.; Zhang, G.; Shi, B. Revealing the Changes of Bacterial Community from Water Source to Consumers Tap: A Full-Scale Investigation in Eastern City of China. J. Environ. Sci. 2020, 87, 331–340. [Google Scholar] [CrossRef] [PubMed]
  66. Su, C.; Cui, H.; Wang, W.; Liu, Y.; Cheng, Z.; Wang, C.; Yang, M.; Qu, L.; Li, Y.; Cai, Y.; et al. Bioremediation of Complex Organic Pollutants by Engineered Vibrio Natriegens. Nature 2025, 642, 1024–1033. [Google Scholar] [CrossRef]
  67. Wu, H.; Zhang, Q.; Chen, X.; Zhu, Y.; Yuan, C.; Zhang, C. The Influence Mechanism of DO on the Microbial Community and Carbon Source Metabolism in Two Solid Carbon Source Systems. Environ. Res. 2022, 206, 112410. [Google Scholar] [CrossRef] [PubMed]
  68. Carvalheira, A.; Silva, J.; Teixeira, P. Acinetobacter spp. in Food and Drinking Water—A Review. Food Microbiol. 2021, 95, 103675. [Google Scholar] [CrossRef] [PubMed]
  69. Holinger, E.P.; Ross, K.A.; Robertson, C.E.; Stevens, M.J.; Harris, J.K.; Pace, N.R. Molecular Analysis of Point-of-Use Municipal Drinking Water Microbiology. Water Res. 2014, 49, 225–235. [Google Scholar] [CrossRef]
  70. Vaz-Moreira, I.; Nunes, O.C.; Manaia, C.M. Diversity and Antibiotic Resistance in Pseudomonas Spp. from Drinking Water. Sci. Total Environ. 2012, 426, 366–374. [Google Scholar] [CrossRef]
  71. Sala-Comorera, L.; Blanch, A.R.; Vilaró, C.; Galofré, B.; García-Aljaro, C. Pseudomonas-Related Populations Associated with Reverse Osmosis in Drinking Water Treatment. J. Environ. Manag. 2016, 182, 335–341. [Google Scholar] [CrossRef]
  72. Afonso, A.C.; Gomes, I.B.; Saavedra, M.J.; Simões, L.C.; Simões, M. Drinking-Water Isolated Delftia acidovorans Selectively Coaggregates with Partner Bacteria and Facilitates Multispecies Biofilm Development. Sci. Total Environ. 2023, 875, 162646. [Google Scholar] [CrossRef]
  73. Ren, Y.-X.; Yang, L.; Liang, X. The Characteristics of a Novel Heterotrophic Nitrifying and Aerobic Denitrifying Bacterium, Acinetobacter junii YB. Bioresour. Technol. 2014, 171, 1–9. [Google Scholar] [CrossRef] [PubMed]
  74. Watanabe, T.; Katayanagi, N.; Agbisit, R.; Llorca, L.; Hosen, Y.; Asakawa, S. Influence of Alternate Wetting and Drying Water-Saving Irrigation Practice on the Dynamics of Gallionella-Related Iron-Oxidizing Bacterial Community in Paddy Field Soil. Soil Biol. Biochem. 2021, 152, 108064. [Google Scholar] [CrossRef]
  75. Cao, Q.; Li, X.; Xie, Z.; Li, C.; Huang, S.; Zhu, B.; Li, D.; Liu, X. Compartmentation of Microbial Communities in Structure and Function for Methane Oxidation Coupled to Nitrification–Denitrification. Bioresour. Technol. 2021, 341, 125761. [Google Scholar] [CrossRef] [PubMed]
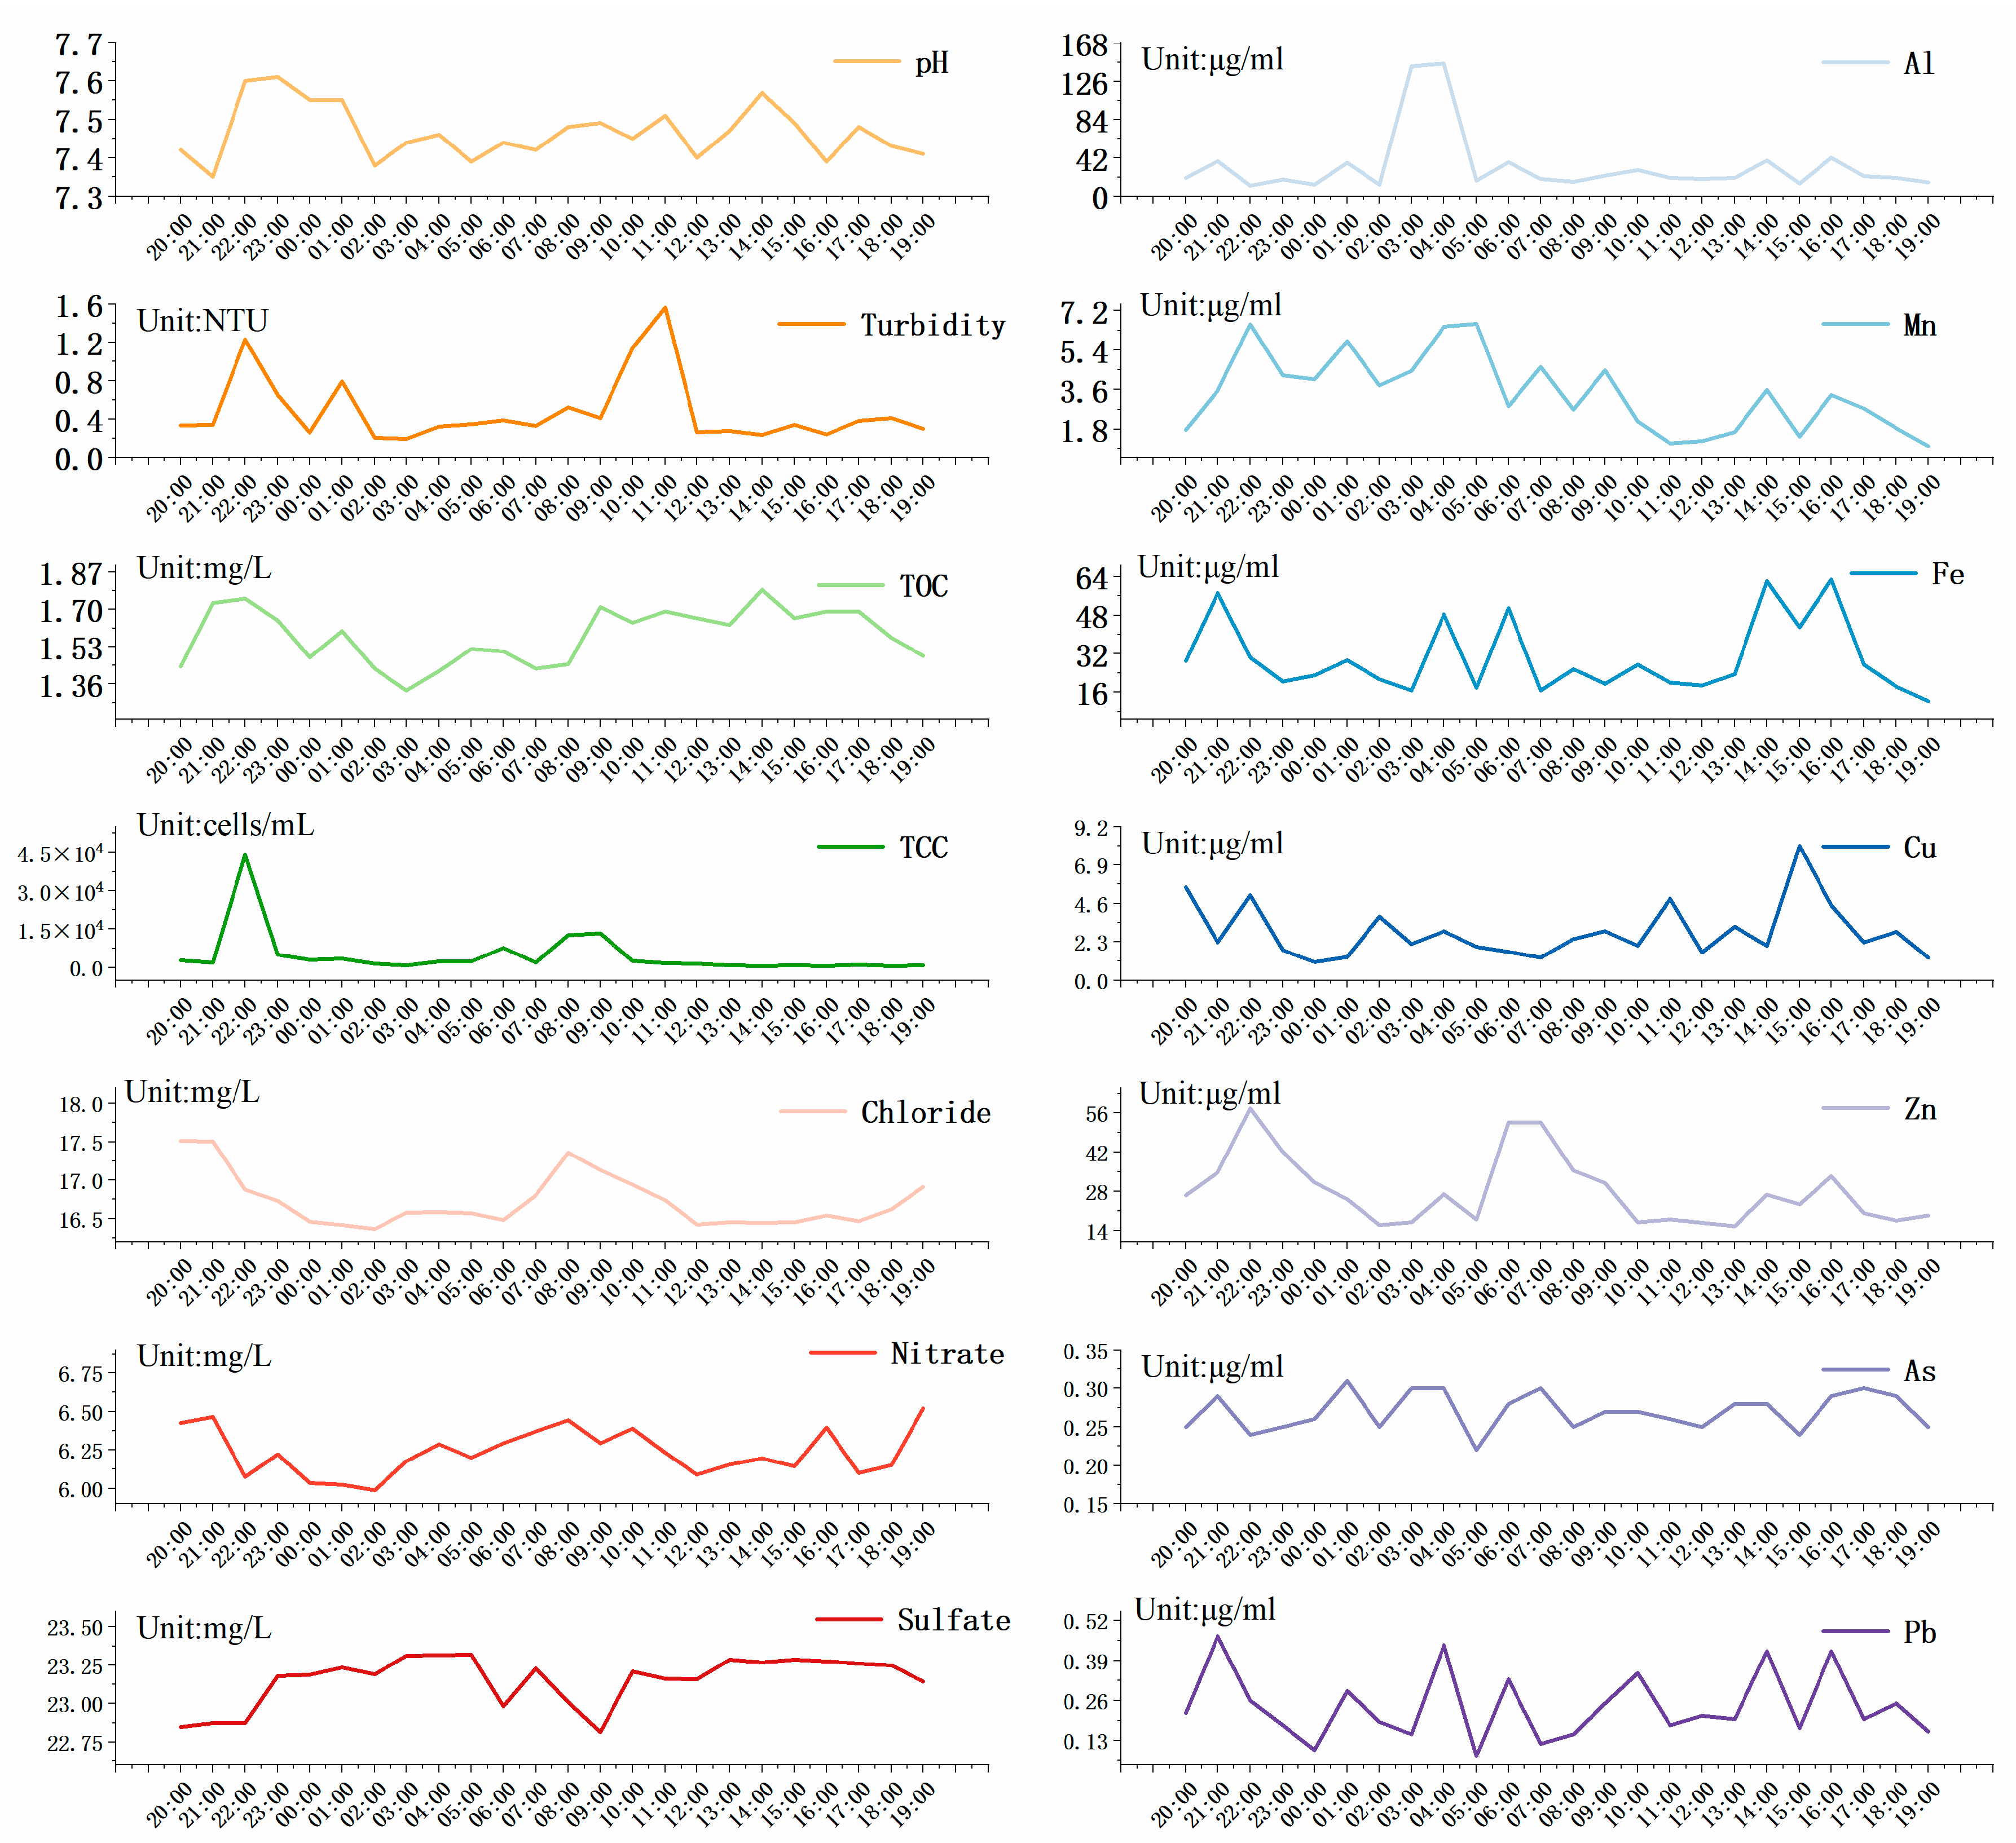
Figure 1. Profiles of diverse water quality indices within 24 h.
Water 17 02555 g001
Figure 2. Heatmap of intra group analysis of water quality parameters for the day.
Water 17 02555 g002
Figure 3. Column chart of water quality parameters: (ak) represent turbidity, pH, hardness, heavy metals (Al, Fe, Mn, Cu, Zn, As), sulfates and chlorides TDS, CODMn, TOC, nitrate ions, chloride ions and THM, free chloride ions, TCC and ICC.
Water 17 02555 g003
Figure 4. Non-metallic parameter line chart of water quality within the past four years.
Water 17 02555 g004
Figure 5. Inter-group correlation analysis between water quality parameters of pipeline network and raw water quality parameters (statistical significance markers (* and **) in the heatmap represent p-values less than 0.05 and p-values less than 0.01, respectively).
Water 17 02555 g005
Figure 6. Microbial community structure characteristics of XWP’s raw water, factory water, pipeline water, and pipeline inner wall.
Water 17 02555 g006
Table 1. Comparison of water quality fluctuations within Days, Months, and Years.
UnitsDaily Variation CharacteristicsMonthly Variation CharacteristicsAnnual Variation Characteristics
TCC103 cells/mL4.7 ± 9.15.4 ± 3.016.2 ± 12.8
ICC103 cells/mL3.4 ± 8.03.5 ± 2.510.1 ± 8.8
Alμg/L33 ± 35.5615.7 ± 10.2925.9 ± 18.59
Feμg/L3.43 ± 1.757.85 ± 2.737.3 ± 5.79
Mnμg/L30.1 ± 15.242.39 ± 1.6516.62 ± 7.9
Cuμg/L2.9 ± 1.675.14 ± 7.162.27 ± 3.74
Znμg/L28.13 ± 12.489.03 ± 6.2511.23 ± 10.19
pH 7.47 ± 0.077 ± 0.087.08 ± 0.16
Sulfatemg/L13.15 ± 0.169.82 ± 1.7610.53 ± 2.98
Chloridemg/L16.72 ± 0.3413.08 ± 1.2515.54 ± 8.3
Nitratemg/L1.24 ± 0.151.16 ± 0.271.08 ± 0.29
TOCmg/L1.58 ± 0.131.2 ± 0.291.33 ± 0.31
Table 2. Classification table of coefficient of variation (CV) similarity of water.
SimilarityWater Quality IndicatorsDaily Variation CharacteristicsMonthly Variation CharacteristicsAnnual Variation Characteristics
highTCC1.890.562.13
ICC2.340.722.2
middleAl1.080.660.72
Fe0.510.350.48
Mn0.510.690.79
Cu0.571.391.64
Zn0.440.690.91
lowpH0.010.010.02
Sulfate0.010.180.28
Chloride0.020.10.53
Nitrate0.020.230.26
TOC0.080.250.23
Notes: The similarity is low if the daily, monthly, and annual CV values are below 0.5, medium if they are between 0.5 and 1.0, and high if they are above 1.0.
Disclaimer/Publisher’s Note: The statements, opinions and data contained in all publications are solely those of the individual author(s) and contributor(s) and not of MDPI and/or the editor(s). MDPI and/or the editor(s) disclaim responsibility for any injury to people or property resulting from any ideas, methods, instructions or products referred to in the content.