Article

Distribution and Source Appointment of Potentially Toxic Elements in Rivers via Self-Organizing Map and Positive Matrix Factorization (Qinghai–Tibet Plateau, China)

1
State Key Laboratory of Plateau Ecology and Agriculture, Qinghai University, Xi’ning 810016, China
2
School of Water and Environment, Chang’an University, Xi’an 710054, China
3
Key Laboratory of Land Surface Pattern and Simulation, Institute of Geographical Sciences and Natural Resources Research, Chinese Academy of Sciences, Beijing 100101, China
4
Technical Centre for Soil, Agriculture and Rural Ecology and Environment, Ministry of Ecology and Environment, Beijing 100101, China
5
Qinghai Provincial Department of Ecology and Environment, Xi’ning 810007, China
*
Authors to whom correspondence should be addressed.
Water 2025, 17(17), 2547; https://doi.org/10.3390/w17172547
Submission received: 15 July 2025 / Revised: 16 August 2025 / Accepted: 21 August 2025 / Published: 28 August 2025
(This article belongs to the Section Water and Climate Change)

Abstract

The fragile ecological environment of the Qinghai–Tibet Plateau (QTP) is significantly affected by human activities. This study employed a self-organizing map (SOM) for cluster analysis and positive matrix factorization (PMF) to trace the source of potentially toxic elements (PTEs) in the surface water of rivers. The results revealed that the average concentration of PTEs in the rivers was generally low. However, at some sampling points, especially in areas near the Qarhan Salt Lake, the content of Cu, Hg, and Ni were high. The water quality index (WQI), contamination factor (CF), and modified contamination index (mCd) identified good water quality, while potential Ni in the Quanji and Golmud River basins were the primary contaminants of concern. The potential ecological risk index (PERI) showed a low ecological risk. The SOM yielded four clusters of water PTEs, including Hg, Cu-Ni, Pb-Cd-Zn, and As. PMF model further revealed PTE sources, with industrial sources (39.73%) as the primary anthropogenic factor, followed by natural weathering (33.44%), vehicle emissions (21.52%), and atmospheric deposition (5.31%). This study laid the foundation for the ecological monitoring of rivers on the QTP and provided a reference for balancing industrial development and ecological protection in Qarhan Salt Lake areas.

1. Introduction

The Qinghai–Tibet Plateau (QTP), often termed the “Third Pole” of the earth, hosts unique ecosystems that play vital roles in global climate regulation and biodiversity conservation [1]. However, environmental transformations and anthropogenic factors are reshaping its fragile ecosystems. Recent studies have indicated that the glaciers are beginning to accelerate melting [2,3], and the continuous melting of frozen soil layers has led to surface subsidence and increased methane emissions [4,5]. Due to overgrazing and reduced precipitation in high-altitude grasslands, the area’s productivity had decreased, and the area of black soil beach had expanded [6]; there is also emerging pollutant accumulation in river basins, particularly involving potentially toxic elements (PTEs) like arsenic (As), chromium (Cr), and mercury (Hg) [7,8]. Cadmium (Cd) and lead (Pb) concentrations in the Yarlung Tsangpo River exceed global average values by 3–10 times [9], and copper (Cu), zinc (Zn), and nickel (Ni) were anomalously enriched in the Salt Lake Basin [10]. These changes threaten regional water security and biodiversity on the QTP.
PTEs are recognized as persistent environmental contaminants posing significant threats to human health, aquatic biodiversity, and ecosystem integrity [11,12]. Their pervasive contamination across atmospheric, lacustrine, and marine matrices has emerged as a critical environmental challenge [13], with even trace concentrations (<0.1 mg/L) demonstrating acute ecotoxicological effects on aquatic organisms [14]. PTEs’ capacity for bioaccumulation and trophic transfer amplifies ecological risks, potentially disrupting watershed ecosystem services and inducing human health hazards through biomagnification pathways [15,16]. The environmental evolution of the QTP stems from synergistic anthropogenic and natural forces. Human activities, including mining operations, tourism activities, and agricultural planting contribute PTEs to aquatic systems [17,18]. Industrial effluents and vehicular emissions release Ni, Pb, and Zn into major rivers like the Yangtze and Yellow River [19,20]. The natural sources of PTEs in rivers mainly include rock weathering, soil erosion, and atmospheric deposition. PTEs (such as Pb and Cd) in geological rocks entered surface water through physical weathering or chemical dissolution [21]; the aerosols carried elements such as Hg and As, which were transported through the atmosphere and were deposited into water [22]; Cu, Ni, and other elements in soil migrate with suspended particles during natural erosion processes [23]. Thus, the coupled anthropogenic emissions and geogenic processes collectively define the PTE contamination patterns in QTP river systems.
Typical methods for studying PTE pollution in rivers include the potential ecological risk index (PERI), comprehensive water quality evaluation methods, self-organizing maps (SOMs), principal component analysis (PCA), cluster analysis (CA), and positive matrix factorization (PMF). Among them, the PERI method quantifies the comprehensive risk to the ecosystem by integrating the degree of PTE pollution and the toxicity coefficient [24,25]. Evaluation methods (such as the single-factor index or water quality index method) were implemented to determine the water quality category and excessive pollutants [26,27]. SOMs cluster complex data through unsupervised learning to reveal the spatial distribution patterns of PTEs [28]; PCA identifies the main pollution factors and their contribution rates through dimensionality reduction techniques, assisting in tracing the key influencing factors [29]; PMF serves as a receptor model to quantitatively distinguish the input ratios of natural sources and anthropogenic sources by analyzing source profiles and contribution ratios [30]. These methods were often used in combination. For example, PCA-SOM combines dimensionality reduction and clustering techniques to optimize pollution zoning, while PMF-PCA coupling can improve the accuracy of source apportionment, ultimately achieving a systematic assessment of PTE pollution sources, migration pathways, and ecological health risks [18,31]. This research systematically collected water samples in typical rivers on the QTP to analysis PTE distribution characteristics, pollution degrees, and the ecological risks of PTEs in aquatic environments. The study established a comprehensive framework for PTE source apportionment and risk assessment through the integrated application of PMF and SOM analytical techniques. The research objectives were (1) a quantitative evaluation of PTE concentrations and hydrochemical characteristics; (2) a systematic assessment of the water quality and ecological risks of rivers; and (3) the precise identification of PTE sources using advanced receptor modeling approaches. The study provided critical baseline reference data for water security management in alpine watersheds.

2. Study Area

The Dongzao, Golmud, Nalenggele, Tora, Wutumeiren, Nuomuhong, Quanji, and Qaidam rivers are situated within the Qaidam Basin along the Kunlun Mountain of the QTP (Figure 1). The Qaidam Basin, flanked by the Kunlun Mountains on the QTP, exhibits a complex geological setting that strongly influences hydrogeochemical processes and the natural release of PTEs. The basin’s stratigraphy comprises thick Cenozoic evaporites such as halite, gypsum, and lacustrine sediments, underlain by Paleozoic–Mesozoic clastic and carbonate rocks, while the adjacent Kunlun Mountains consist of gneiss, schist, and granitic intrusions [32,33]. Active fault systems enhance rock–water interactions, facilitating the weathering and leaching of minerals such as sulfides, carbonates, and evaporites, which contribute dissolved ions and trace metals into river systems. The hyperarid climate further concentrates solutes through evaporation, amplifying the geogenic signature in water chemistry. Consequently, the natural weathering of these diverse lithologies likely plays a dominant role in controlling hydrogeochemical parameters and PTE distribution across the basin’s rivers.
These rivers eventually converge into the Qarhan Salt Lake, which is the China’s largest saline lake and holds the second rank on the global saline lake scale [22]. This region significantly exhibits distinctive climatic conditions characterized by a high altitude (average elevation > 3000 m), extreme aridity (annual precipitation < 100 mm), persistent wind erosion (wind speed > 5 m/s for 200 + days/year), and notable temperature differences (day and night can exceed 15 °C). Annual average temperatures in this region are within a narrow range from 2 °C to 5 °C [34,35]. The hydrological network in this region exhibits distinct anthropogenic interaction patterns. Six of the rivers traverse significant human settlement zones, including the Golmud River that runs through Golmud City (population > 200,000 residents) [36]; the agricultural lifeline Nuomuhong River is the source of water for the Nuomuhong farm, and the Qaidam River sustains Xiangride Town in Dulan County. Concurrently, the Wutumeiren River supports the water supply of Wutumeiren town, while the Quanji River facilitates mining operations near Xitie Mountain. In contrast, the remaining rivers—encompassing the upper Tora River catchment and the entirety of the Nalenggele and Dongzao Rivers—maintain pristine conditions with only sporadic seasonal grazing activities, preserving near-natural hydrological regimes in these undisturbed basin areas.

3. Materials and Methods

3.1. Sample Collection and Analysis

Surface water sampling was conducted in December 2023 across eight river systems, yielding 57 representative samples. Sampling procedures included pre-rinsing polyethylene containers 2–3 times with site-specific water before collection to minimize cross-contamination. A stainless-steel sampling spoon collected surface layer water (0 cm to 50 cm depth) at predetermined GPS coordinates along each river course. Field measurements were immediately performed using an EXO water quality analyzer (YSI Inc., Yellow Springs, OH, USA). The instrument simultaneously recorded five critical parameters, including pH, dissolved oxygen (DO), electronic conductivity (EC), total dissolved solids (TDSs), and salinity (SAL). All samples were maintained at 4 °C during transport to prevent biological degradation and photochemical reactions.
Water chemistry parameters included major cations (K+, Na+, Ca2+, Mg2+) measured via an inductively coupled plasma optical emission spectrometer (ICP-OES, NexION 2000, PerkinElmer Inc., Shelton, CT, USA) with ≤2% permissible error, while anions (CO32−, HCO3, Cl) were quantified through chemical titration, maintaining ≤ 0.3% error tolerance. SO42− determination employed gravimeter analysis with ≤0.5% permissible error. For PTE analysis, As and Hg concentrations were measured using atomic fluorescence spectrometry (AFS-933, Beijing Jitian Instrument Co., Ltd., Beijing, China), while Pb, Cd, Cu, Ni, and Zn were determined by inductively coupled plasma mass spectrometry (ICP-MS, Agilent 7900, Agilent Technologies Inc., Santa Clara, CA, USA). Precision control measures were implemented to guarantee the exactness and accuracy of the experimental steps. All chemical reagents were of analytical purity and formulated with ultra-pure water. In all the experimental results, the relative standard deviations of PTEs were below 5%, and the recovery rates were stable at 90% to 110%.

3.2. Assessment Methods

3.2.1. Evaluation of Surface Water Quality

The WQI is a useful method for a comprehensive assessment of water quality based on multiple indicators. Its calculation formula can be found in Equations (1) and (2) [25,26].
W Q I = W i × C i S i × 100
W i = w i / w i
where w i is the total mass of all parameters,   C i represents the measured concentration of PTEs (μg/L), and   S i is the standard concentration of PTEs (μg/L).
The contamination factor (CF) assesses water pollution based on a single element [37]. The modified contamination index (mCd) realizes the systematic evaluation of the contamination degree of water by considering a variety of PTEs.
C F i = C s i C b i
m C d = 1 n i = 1 n C F i
where C s i is the concentration of PTEs; C b i is the reference value.
The heavy metal pollution index (HPI) and heavy metal evaluation index (HEI) quantify the pollution intensity of PTEs.
HPI = n i = 1 W i Q i n i = 1 W i
W i = 1 S i
Q i = M i S i × 100
HEI = i = 1 n H c H m a c
where M i / H c is the concentration of PTEs;   S i is the standard value; and H m a c represents the maximum permissible concentration. The evaluation criteria involved in this study are detailed in Table S1.

3.2.2. Potential Ecological Risk Index (PERI) Assessment

PERI evaluated the ecological risk of PTEs by considering the concentration and toxicity in water [24].
PERI = i = 1 n T m i × C m i C b i
where   T m i   indicates the toxicity coefficient;   C m i represents the measured content of PTEs; and   C b i is the background value.

3.2.3. Self-Organizing Map (SOM)

An SOM is able to map complex multidimensional data dimensionality reduction to two-dimensional feature planes through competitive learning mechanisms [38]. As an important branch of artificial neural networks, an SOM offers the distinct advantages of high accuracy, visual representation, and minimal manual intervention [39].

3.2.4. Positive Matrix Factorization (PMF) Models

The PMF model has significant application value in the field of multi-source pollution tracing in aquatic systems [30,40]. The algorithm ensures the physical interpretability of the interpretation results by simultaneously processing missing data and providing error estimation and non-negative constraints, and it is thus established as a standard method for resolving PTE pollution sources in environmental research [41]. Detailed formula calculations can be found in the Supplementary Materials.

4. Results and Discussion

4.1. Hydrochemistry Values and PTE Distribution in Surface Water

The hydrochemical characteristics of surface water in Qaidam Basin rivers on the QTP are shown in Table 1. The pH values exhibited alkaline properties, ranging from 8.24 to 10.11 (mean 9.43), and they demonstrated notable spatial homogeneity across sampling stations (CV = 4.0%), suggesting consistent alkaline conditions across the study area’s geogenic factors, such as the weathering of carbonate-rich rocks and evaporative enrichment in arid/semi-arid climates, which is common in the QTP [42]. Another factor is anthropogenic influence. Inputs from industrial/mining activities such as Qarhan Salt Lake’s brine processing may elevate the pH values. Notably, 98% of sampling sites exceeded the WHO drinking water guideline (6.5 to 8.5), with mean pH values surpassing China’s Class I surface water standard (GB3838-2002) [43] by 90.7%, indicating potential ecological influence on sensitive aquatic species adapted to neutral conditions. DO concentrations showed more significant spatial heterogeneity (4.15 mg/L to 13.33 mg/L, mean 8.55 mg/L), with 83% of locations meeting Class III water criteria. As a critical indicator of aquatic ecosystem health and self-purification capacity [44,45], DO values are governed by the synergistic effects of physical (flow velocity, gas exchange), chemical (salinity, organic loading), and environmental controls (altitude, season) [46,47]. As a rule, the colder the temperature, the greater the concentration of the DO values [48,49]. Anomalously low DO levels in the Dongzao River (mean = 7.40 mg/L) and Quanji River (mean = 7.45 mg/L) (Table S2) suggested human influence, potentially linked to the emission of proximal industrial wastes containing oxygen-depleting contaminants. According to relevant water quality standards, when the DO content in river water is below 2 mg/L, the water is classified as severely polluted, which will pose a significant challenge to the organisms in the rivers [50].
EC exhibited extreme variability across sampling sites (0.33 mS/cm to 56.63 mS/cm, mean 3.88 mS/cm), with 48% of measurements surpassing the WHO permissible limit (0.8 mS/cm). The Tora River Basin demonstrated elevated EC values (0.66 mS/cm to 56.63 mS/cm, mean 16.25 mS/cm), attributable to its middle and lower reaches’ proximity to the Qarhan Salt Lake, which is a hypersaline lake. Arid/semi-arid climates such as those with low precipitation, high evaporation, and the concentration of Na+, Cl, SO42− dissolved ions are the key drivers of high EC values [51]. Moreover, the terminal Qarhan Salt Lake acts as a sink, discharging saline groundwater into adjacent rivers. TDS displayed an exceptional five-order magnitude range (4.12 mg/L to 81,420.73 mg/L), with saline-influenced sites near terminal lakes exceeding freshwater thresholds by 3–4 orders of magnitude. The TDS contents in Salt Lake were extremely high, which aligns with the analogous contents in the surface water of the northeastern QTP [7]. Notably, the mean basin salinity (4740 mg/L) substantially surpasses global fluvial averages (97 mg/L) and Yangtze River baselines (140 mg/L to 180 mg/L) [52]. The hydrochemical analysis demonstrated distinct spatial differentiation through the river’s upper reaches to low reaches. Headwater regions proximate to source areas exhibited characteristic low-mineralization features, consistent with mountain spring signatures. Downstream reaches adjacent to the Qarhan Salt Lake displayed elevated mineralization indices, primarily attributed to brine infiltration.
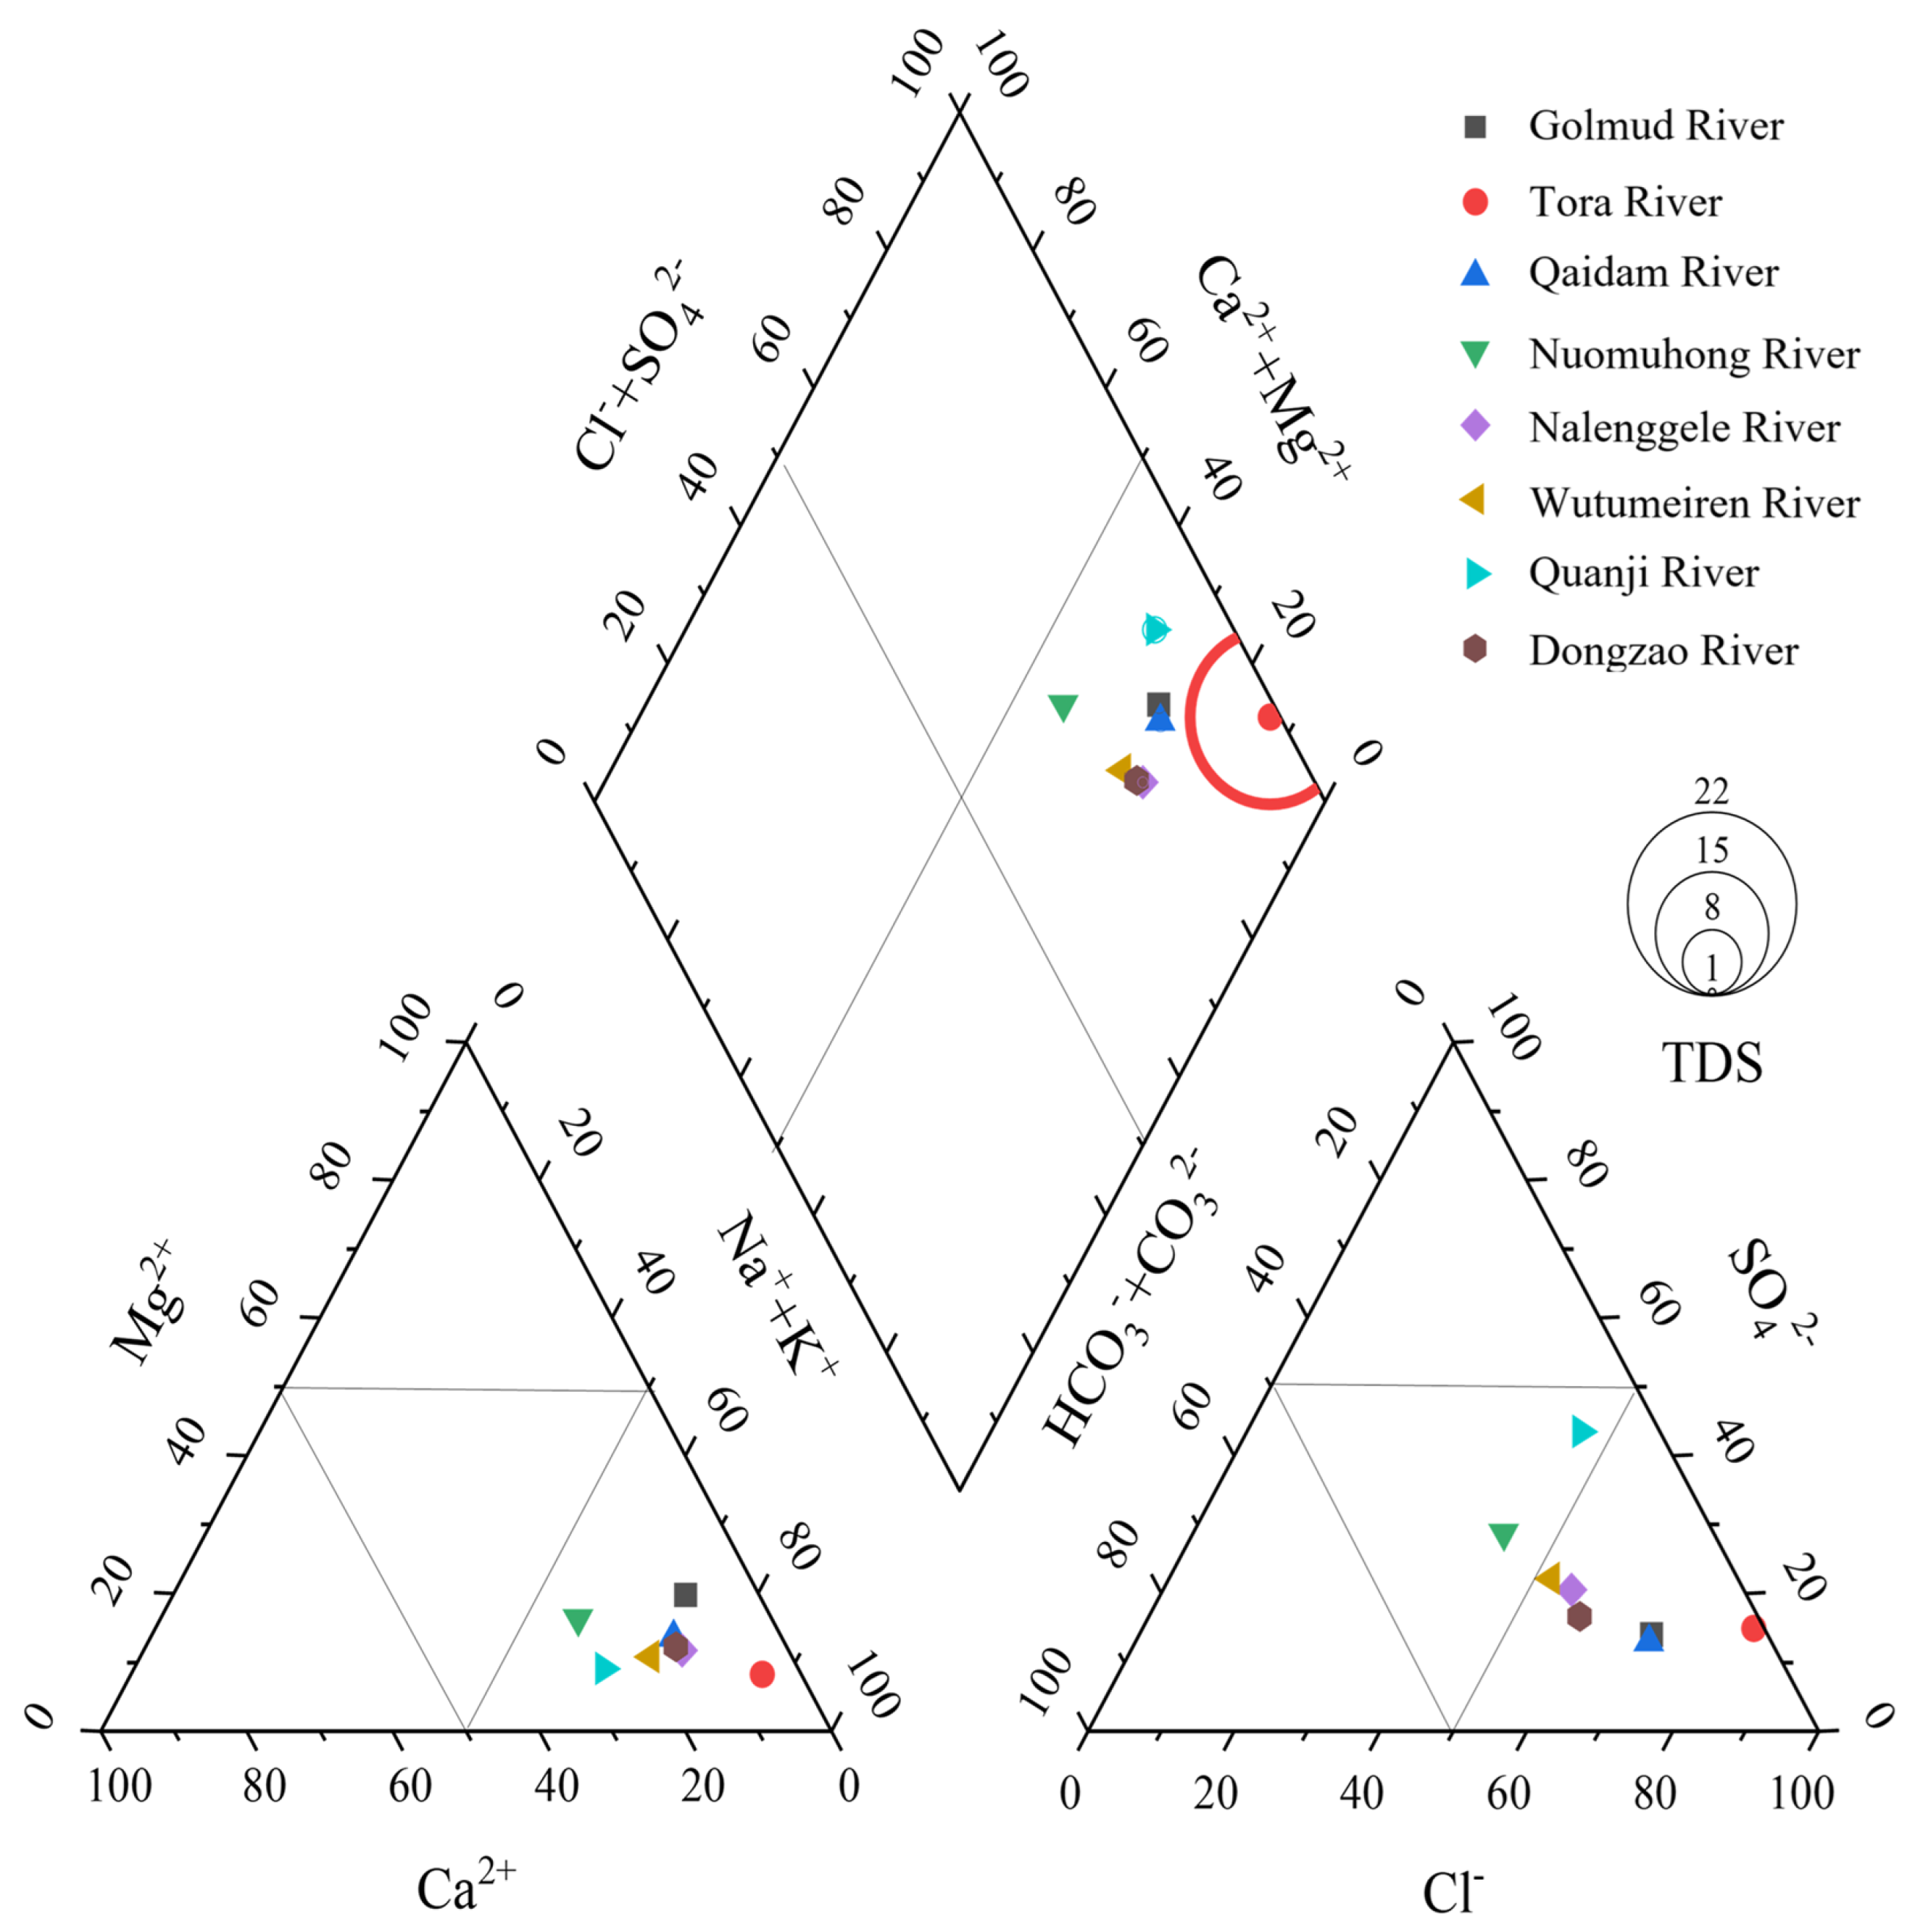
The hydrochemical characterization revealed pronounced ionic disparities in surface water composition. Cationic dominance followed the sequence Na+ > Mg2+ > Ca2+ > K+, while anionic abundance decreased as Cl > SO42− > HCO3 > CO32− (Table S2). The Piper diagram (also known as the Piper trilinear diagram) is a fundamental graphical tool in hydrogeochemistry that enables the visualization and classification of water samples based on their ionic composition and hydrochemical facies. Its ability to represent complex water chemistry data in a simplified, interpretable format makes it indispensable for understanding ion compositions and the hydrochemical types of water [53,54]. The content of Na+ in each river was higher than that of Ca2+ and Mg2+, accounting for 51.8% of the total cations, indicating that Na+ was the principal cation. Among all river samples, Cl accounts for 59.90% of anions, far exceeding HCO3 + CO32− and SO42−, indicating that Cl was the primary conducting anion (Figure 2). Therefore, a distinctive Na-Cl dominated ionic regime was established.
River solute sources primarily derive from four categories, including anthropogenic influences, rock weathering, evaporite dissolution, and atmospheric precipitation [55,56]. The upper reaches of the Kunlun Mountain exhibit minimal anthropogenic disturbance due to their uninhabited nature, and solute in the rivers came from lithological weathering and glacial meltwater inputs [57]. The mid-reaches demonstrate intensified human impacts, particularly along the Golmud and Nuomuhong Rivers, where expanding urban and industrial activities [58] coupled with mining operations near the Quanji River occur [59]. The proximity to Qarhan Salt Lake induces saline infiltration through groundwater interactions, substantially elevating soluble ion concentrations [60,61]. Particularly noteworthy is the Tora River’s anomalous hydrochemistry, where sampling points within Salt Lake industrial zones displaying exceptionally elevated anion and cation levels. These downstream ionic enrichments fundamentally alter the composite hydrochemical signatures of entire river systems.
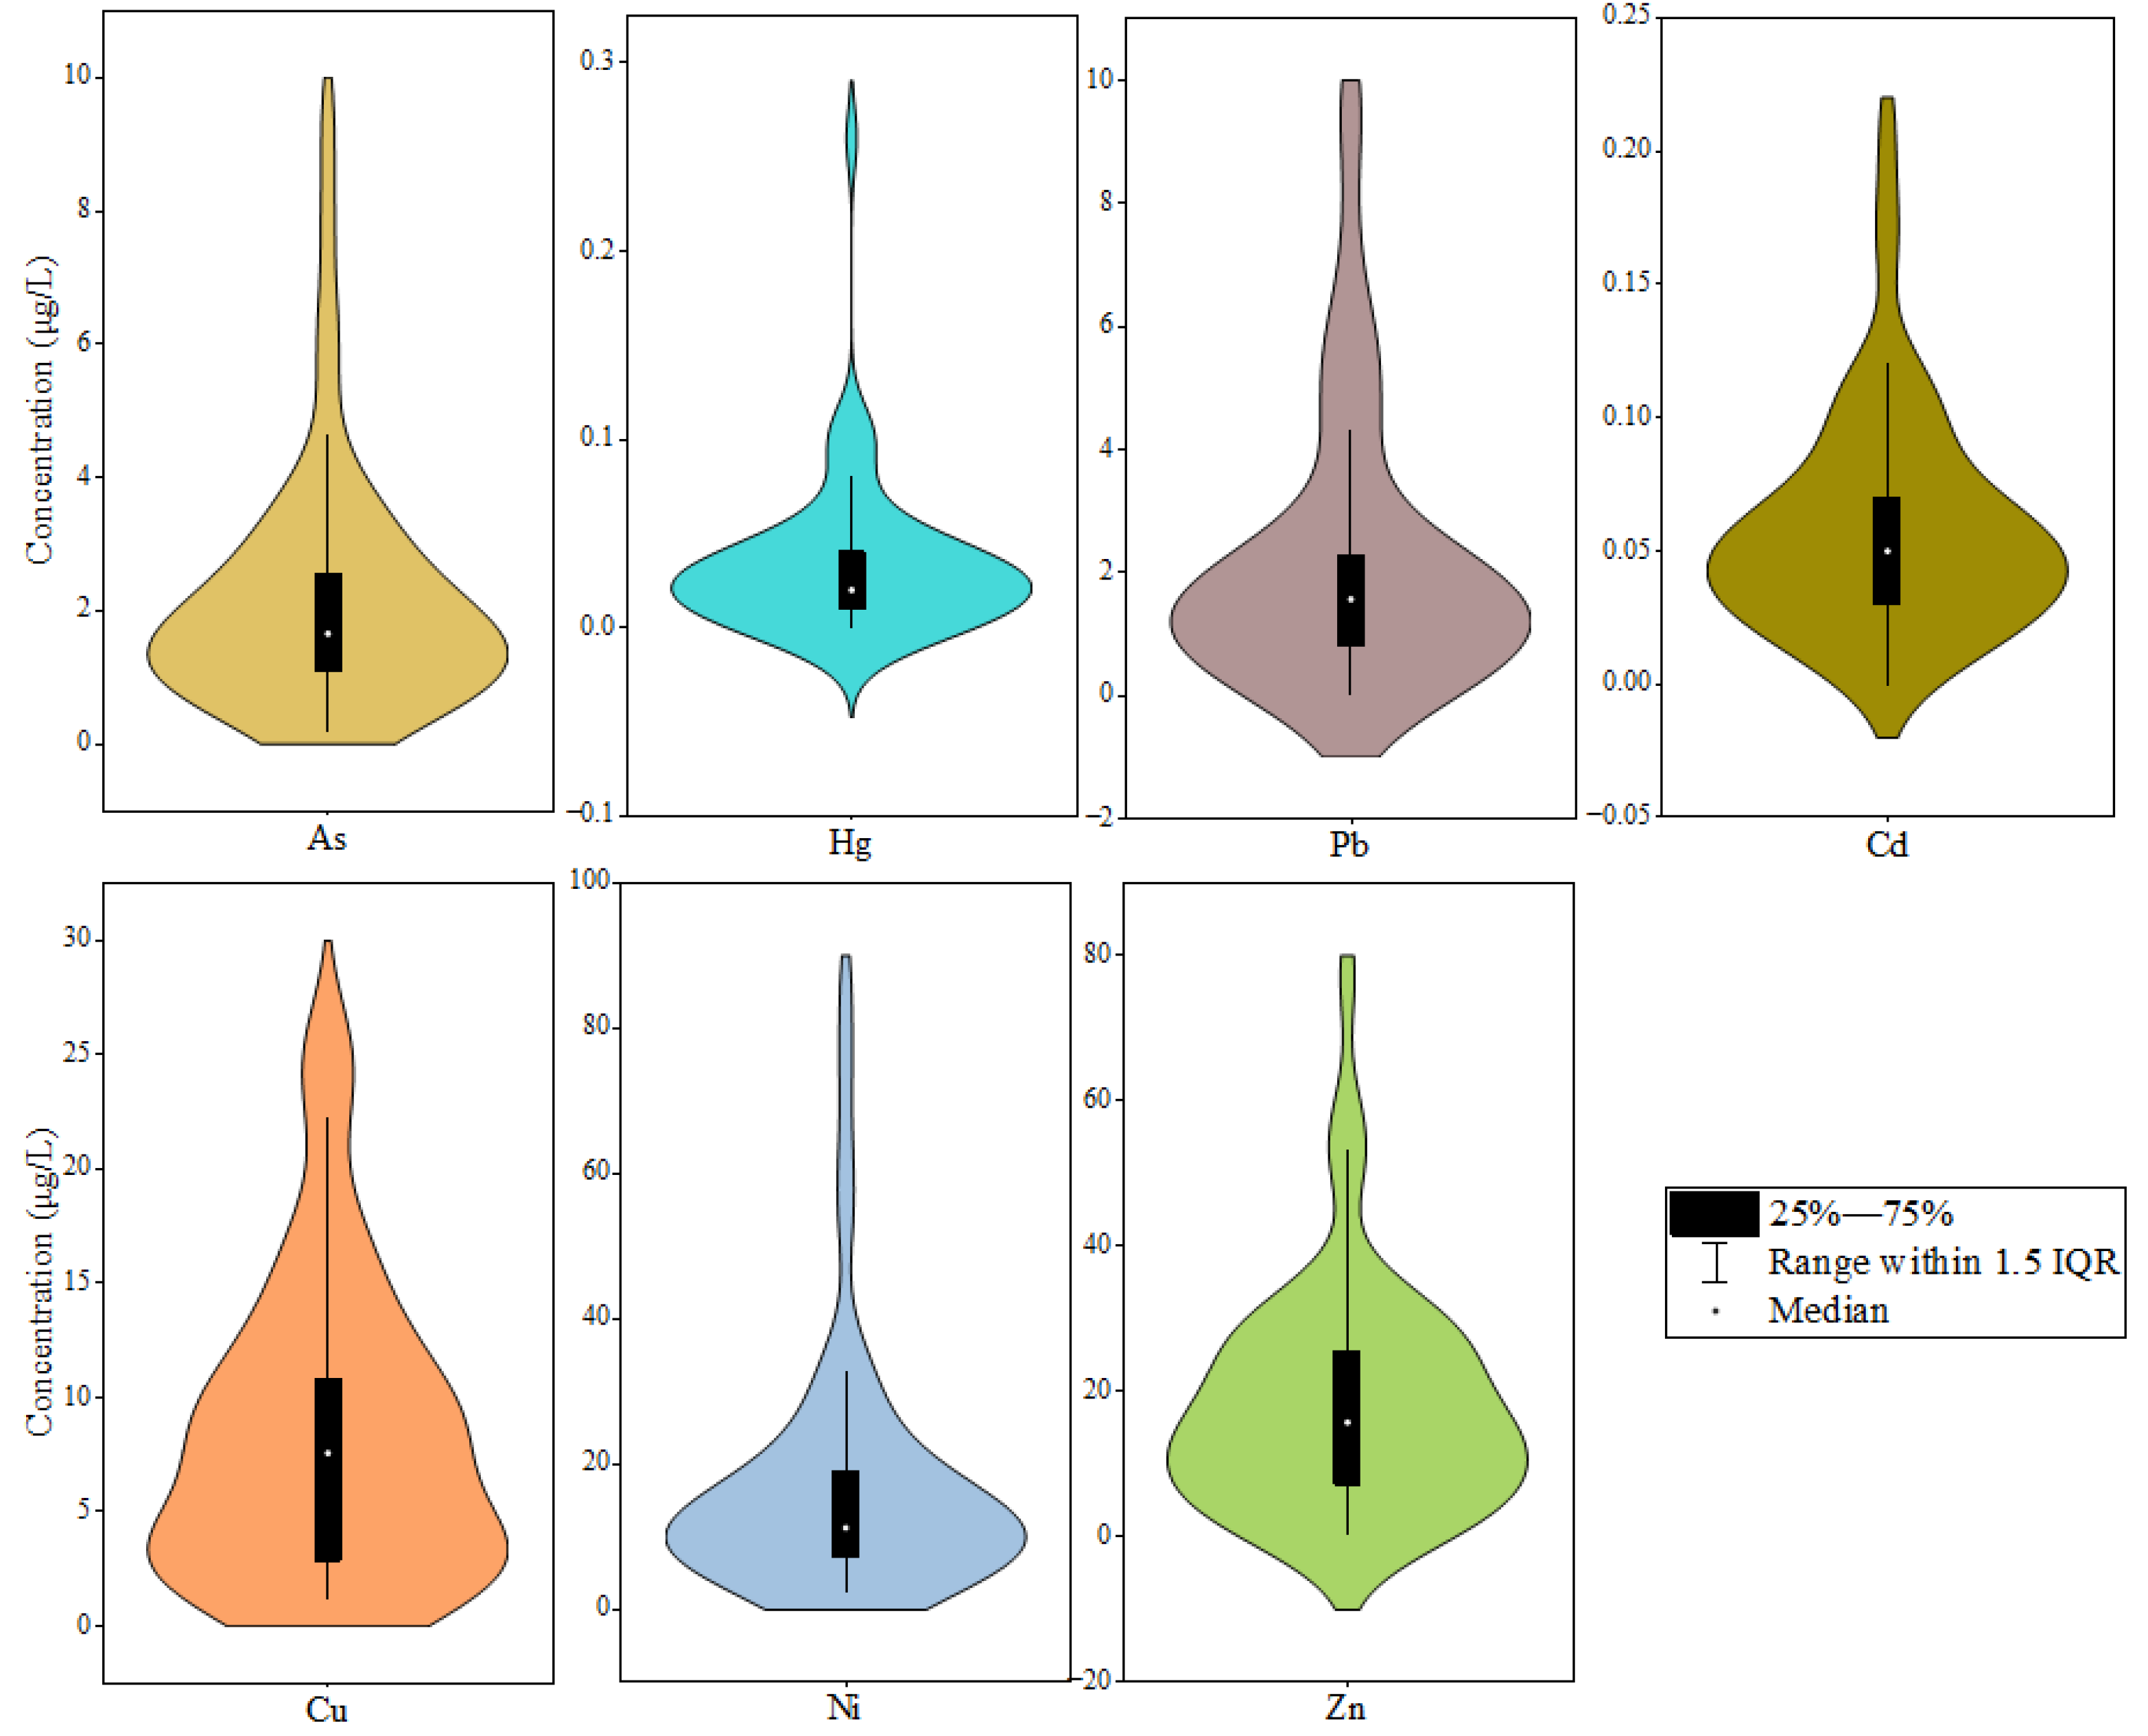
Surface water data revealed generally low concentrations of PTEs across the study area. Ni, As, Pb, Zn, Cd, Hg, and Cu had average levels of 14.95 μg/L, 2.34 μg/L, 2.78 μg/L, 17.21 μg/L, 0.07 μg/L, 0.04 μg/L, and 8.46 μg/L, respectively. All elements met Class I standards under China’s Environmental Quality Standards for Surface Water (GB 3838-2002) [43] (Figure 3), indicating effective ecological conservation and minimal anthropogenic disturbance in the region. Notably, two exceptions were observed, namely Cu levels in the Tora and Dongzao Rivers, which reached Class III standards. At the same time, Hg concentrations in the Nuomuhong River averaged 0.11 μg/L, exceeding thresholds to Class IV levels. The elevated Hg levels likely derived from multiple sources, including domestic wastewater discharge, fuel combustion [62,63], atmospheric deposition [64,65], and improper waste management practices [66,67]. The region’s naturally high geological background values of As and Hg [68], coupled with intensive agricultural activities for Lycium Chinese Miller cultivation and frequent salt storms transporting Hg-laden dust [22], may exacerbate Hg accumulation. Ni concentrations in the Quanji and Golmud Rivers exceed 20 μg/L, indicating obvious industrial impacts [69,70]. The findings underscore the interplay of natural systems and anthropogenic activities in PTE distributions on the QTP’s river networks.

4.2. Water Quality Assessment

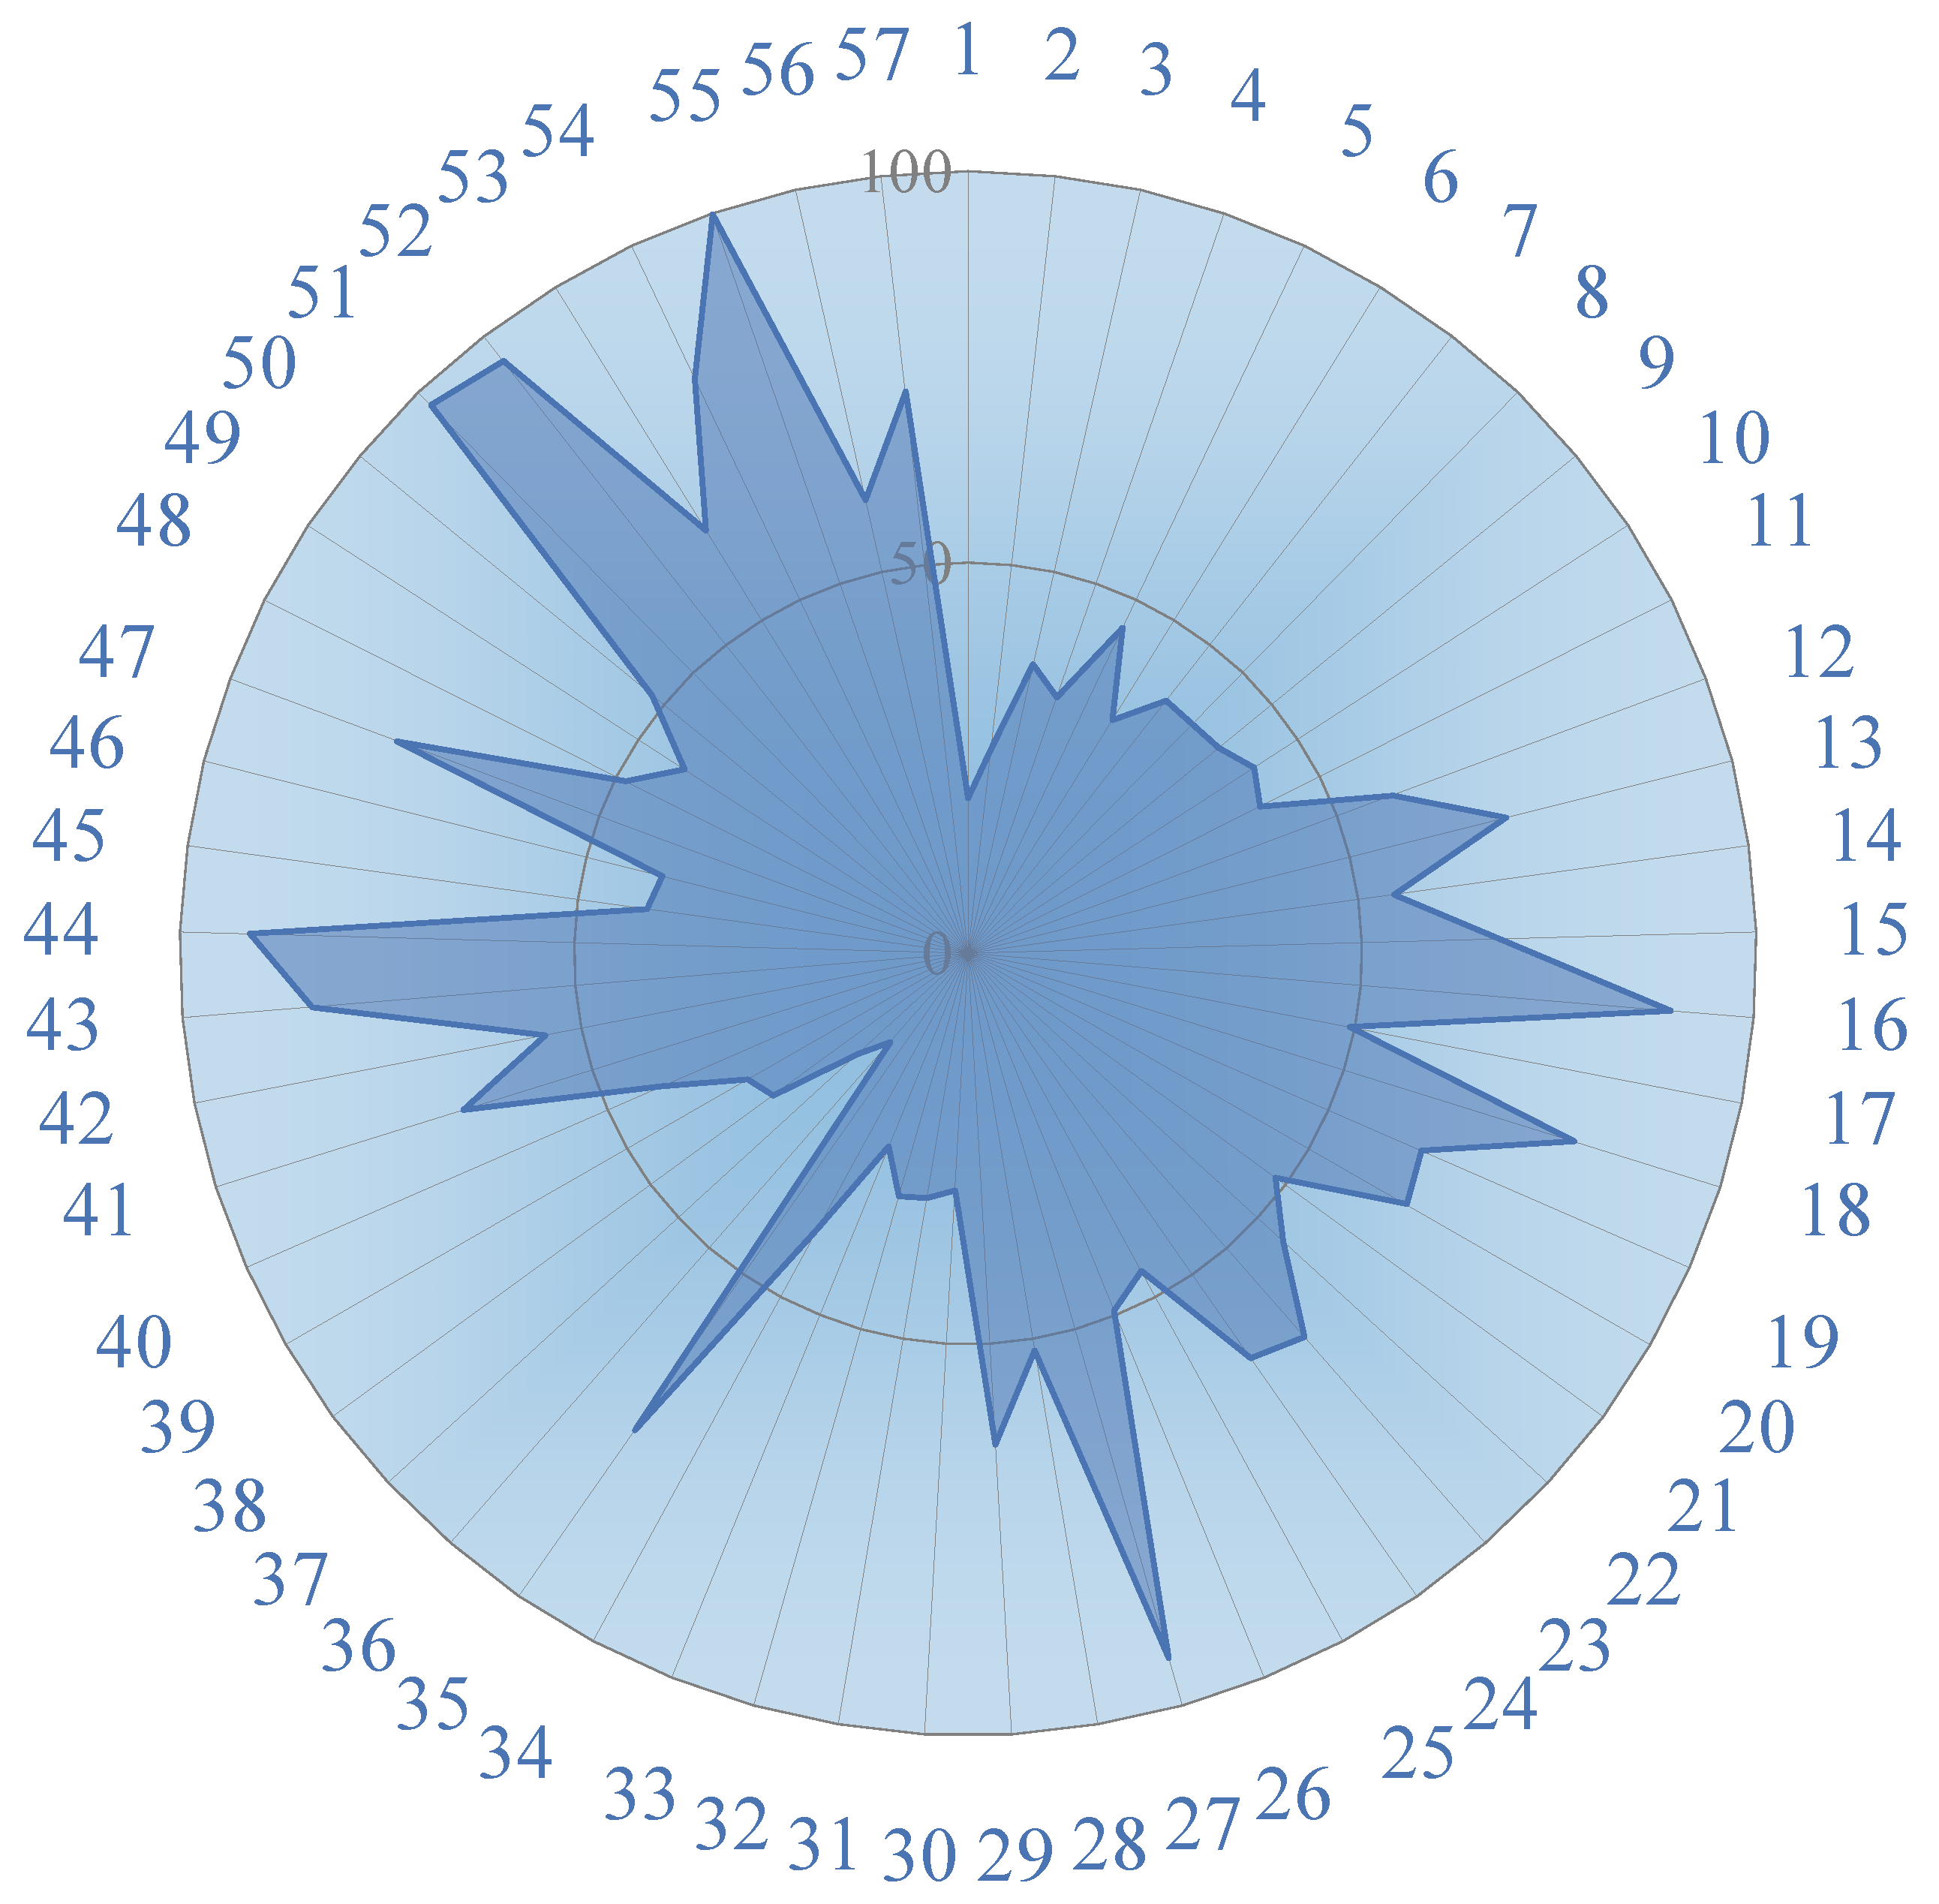
The surface water quality assessment of eight rivers was Quanji River (84.63) > Dongzao River (77.18) > Nalenggele River (62.93) > Tora River (61.17) > Wutumeiren River (55.22) > Nuomuhong River (46.15) > Golmud River (43.80) > Qaidam River (35.61) (Figure 4), with all values remaining below 100. According to the WQI evaluation standards [71,72], three rivers (Golmud River, Qaidam River, and Nuomuhong River) demonstrated “excellent” water quality, while the remaining five rivers (Quanji River, Dongzao River, Nalenggele River, Tora River, and Wutumeiren River) maintained “good” water quality standards. This generally favorable water status can be attributed to its unique hydrological conditions. Among them, the melting snow of surrounding mountain glaciers, as the main winter water source, usually has less anthropogenic pollution characteristics. In the context of the QTP, recent comprehensive assessments using the WQI methodology had yielded consistent findings regarding the region’s water conditions [73,74]. The present study corroborated these earlier findings, confirming that most QTP river systems maintain superior water quality characteristics.
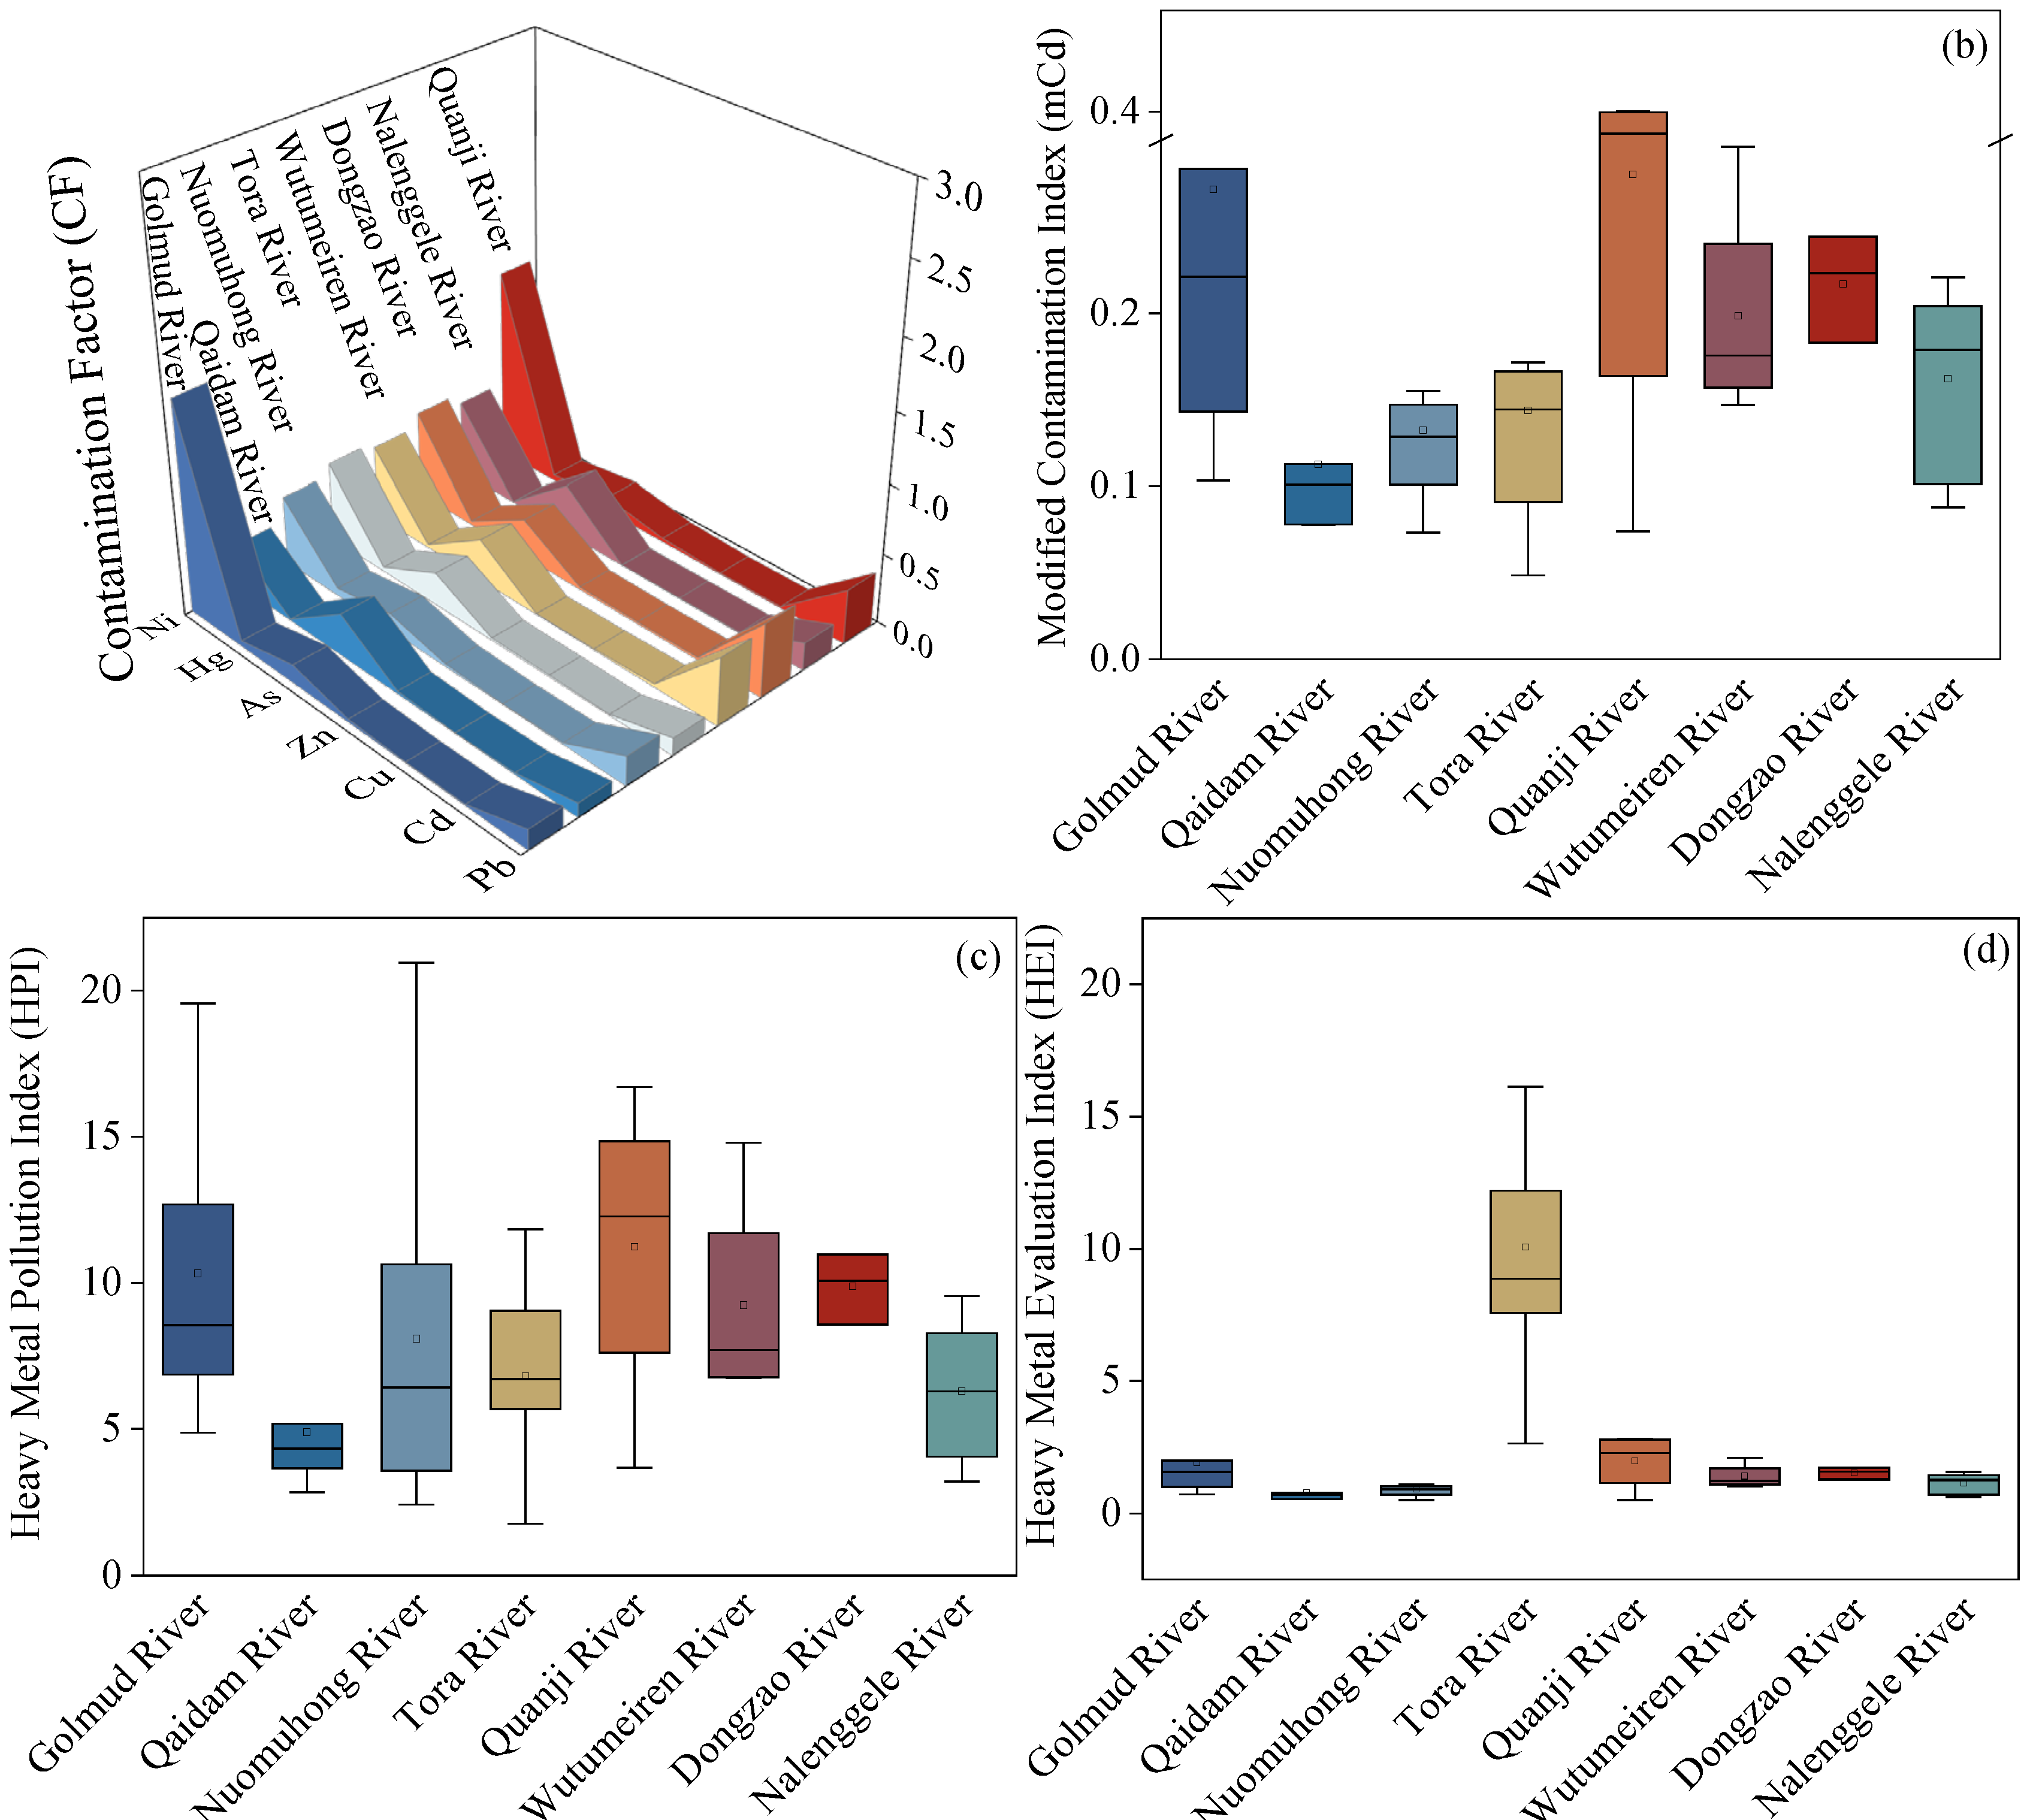
The contamination assessment of PTEs in the eight investigated rivers revealed distinct spatial patterns (Figure 5). The CF values ranged from 0.00 to 1.53 with a mean value of 0.21, with spatial analysis indicating moderate pollution levels (1 ≤ CF < 3) exclusively in the Quanji and Golmud Rivers. In comparison, the remaining six rivers maintained unpolluted status with CF values below the threshold (Figure 5a). This spatial variation was further corroborated by the mCd analysis, with mCd values ranging from 0.05 to 0.67, and the average value was 0.19, showing overall low contamination levels across all basins. Detailed mCd quantification demonstrated subtle inter-river differences as follows: Quanji (0.28) > Golmud (0.27) > Dongzao (0.22) > Wutumeiren (0.20) > Nalenggele (0.16) > Tora (0.14) > Nuomuhong (0.13) > Qaidam (0.11) (Figure 5b), though all values remained significantly below the 1.5 contamination threshold. The HPI values ranged from 1.77 to 20.96, with a mean value of 8.33 and the HEI values from 0.00 to 1.53, with a mean value of 0.19 (Figure 5c,d). Both confirmed non-polluted status across all sampling sites, as their mean values fell substantially below the critical threshold of 100. This multi-indicator assessment consistently demonstrated that the investigated river systems maintain good water quality with negligible PTE contamination.
This study comprehensively assessed PTEs in surface water across eight river systems using four distinct water quality evaluation methodologies. The integrated findings demonstrated that all investigated rivers maintain favorable water quality conditions, with water parameters meeting standards for aquatic ecosystem sustainability and safe human utilization. Through CF analysis, this study revealed potential Ni contamination problems in the Quanji and Golmud River basins, which probably came from industrial emissions [75]. Despite the existence of industrial and mining operations in these basins, our multi-parameter assessment showed that the concentration of PTEs in river water was still below the pollution threshold, indicating that the environmental impact of the current industrial activities is still under control.

4.3. Potential Ecological Risk Assessment

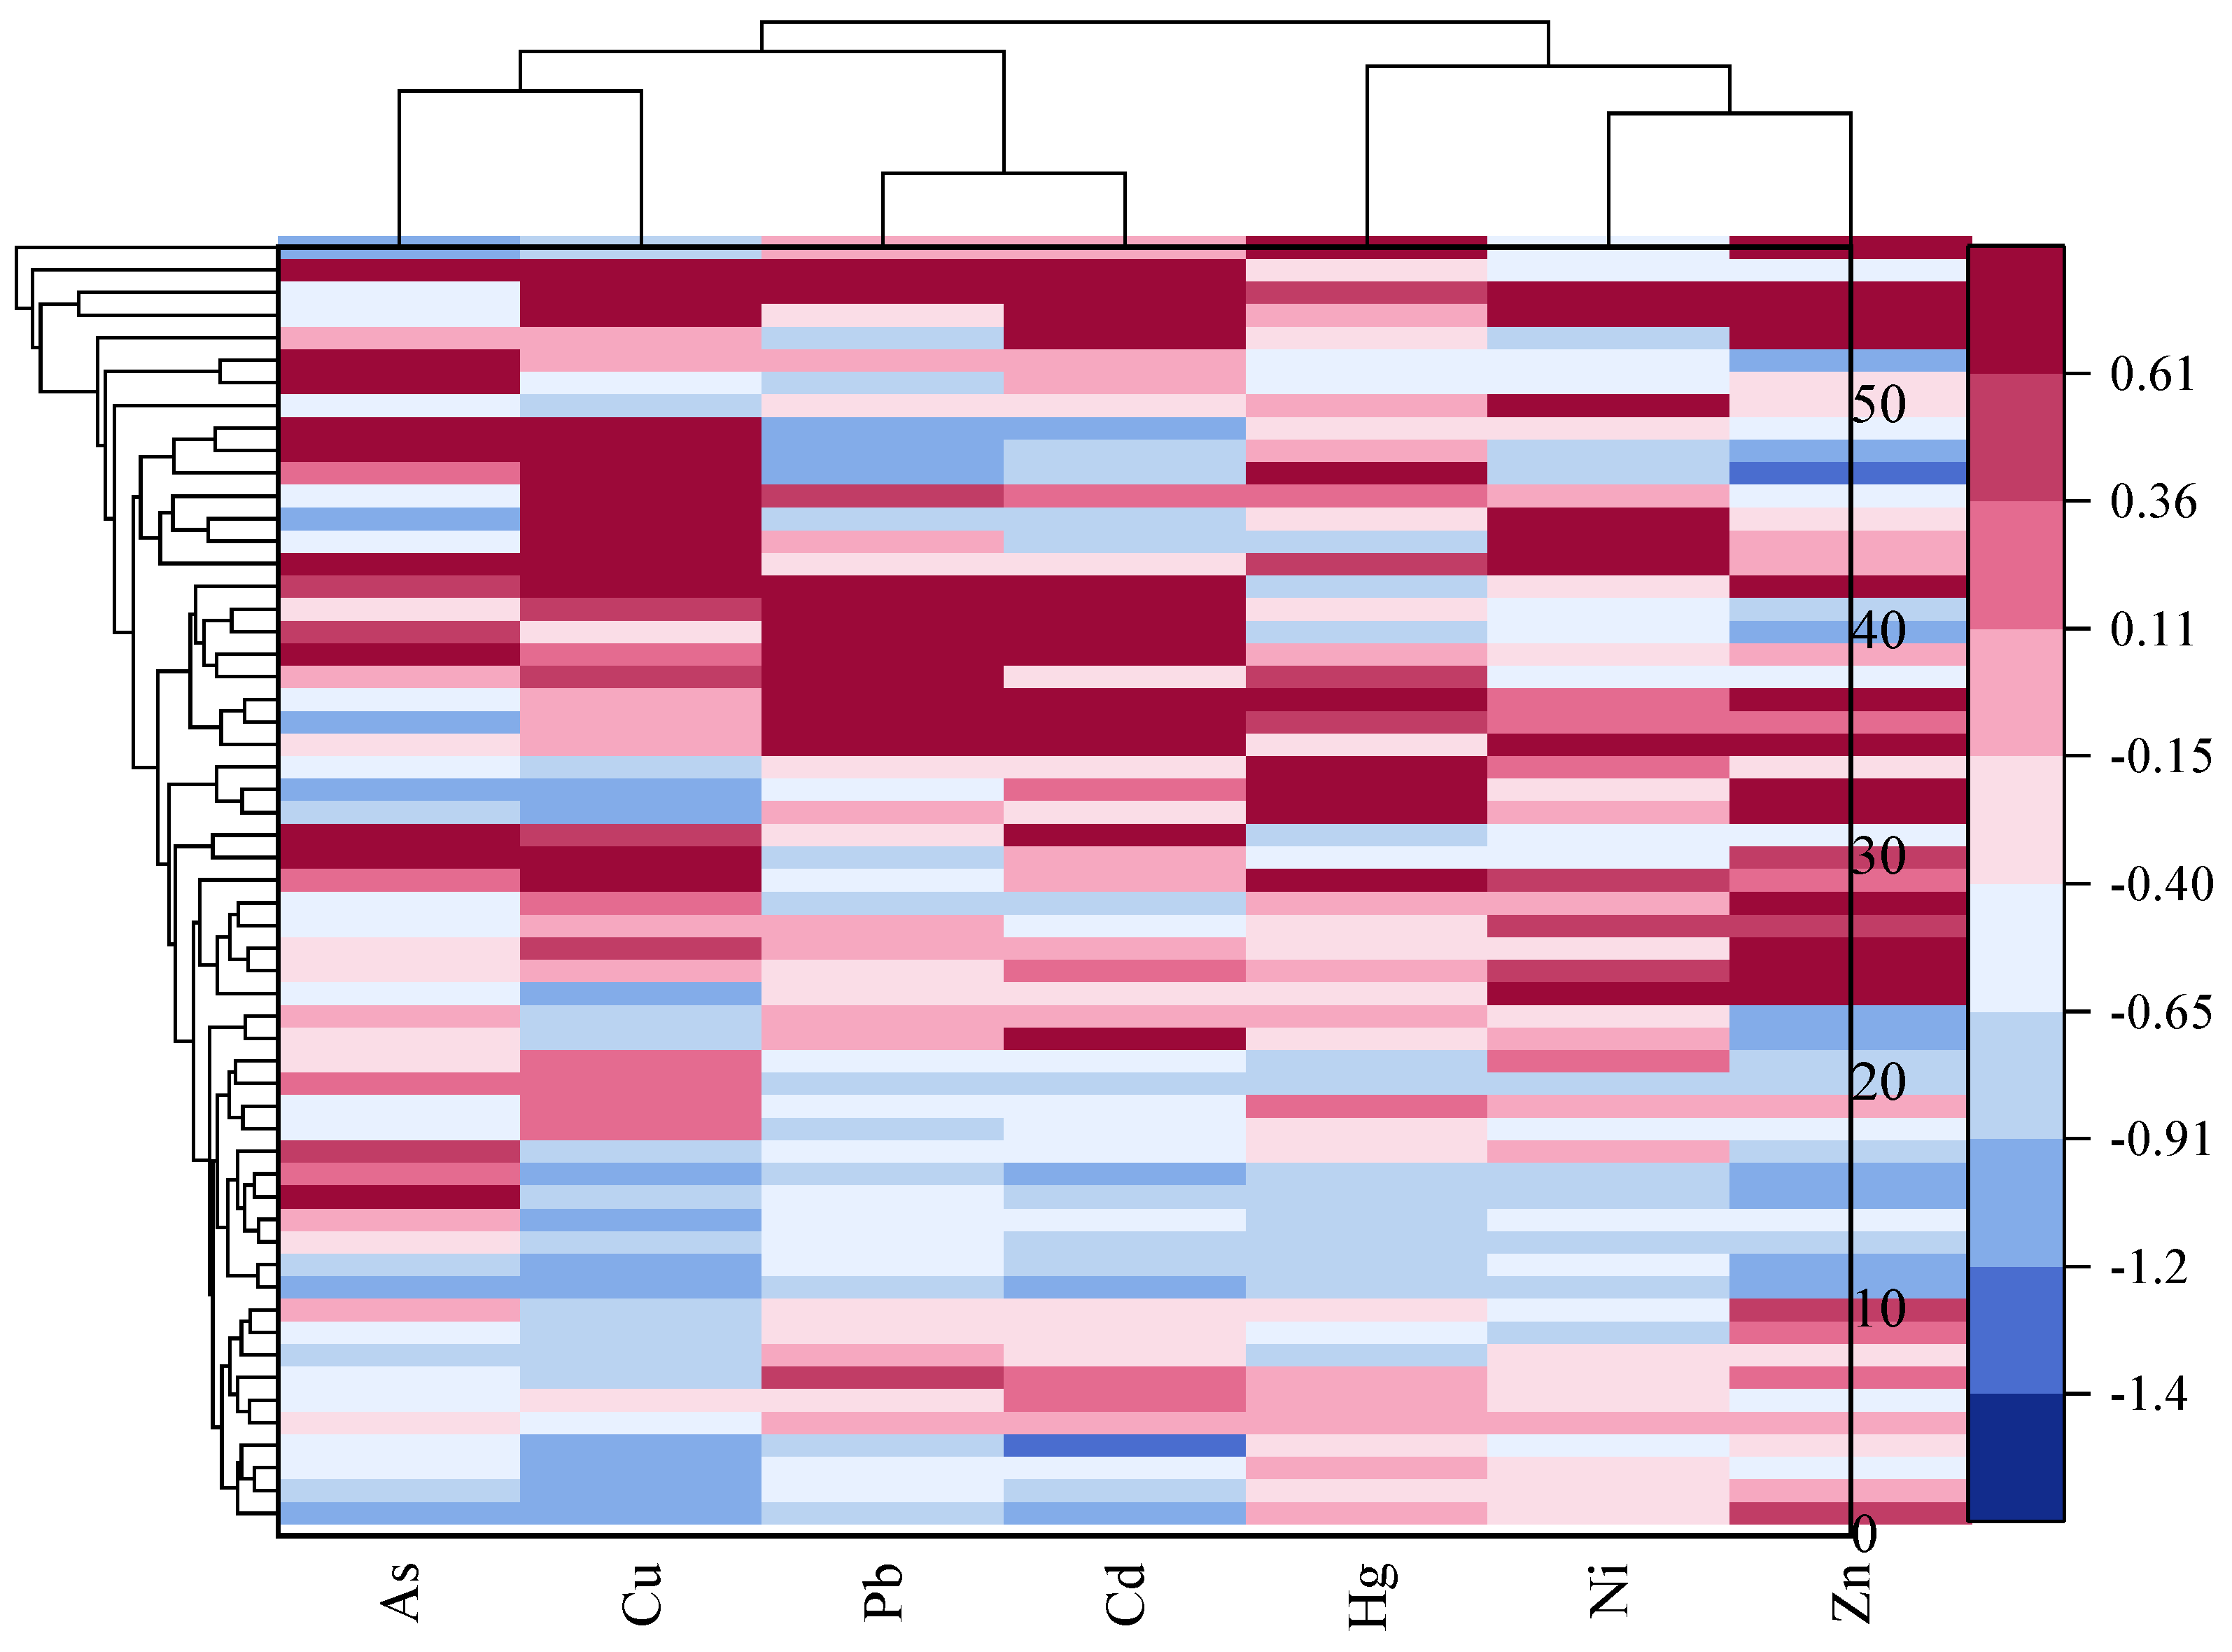
Ecological risk assessment of river ecosystems is an essential method for evaluating the health of aquatic systems and acts as a crucial role in achieving sustainable watershed management and protecting water resources [76,77]. This study determined PERI values through a quantitative analysis of seven PTEs. Our findings revealed distinct spatial variations among eight rivers, with PERI values decreasing as follows: Golmud River (9.99) > Quanji River (9.47) > Dongzao River (5.65) > Nuomuhong River (5.44) > Wutumeiren River (5.11) > Tora River (4.80) > Nalenggele River (3.8) > Qaidam River (2.85) (Figure 6). Element-specific analysis demonstrated that Ni exhibited the highest mean PERI value at 3.74, followed sequentially by Hg (1.19), Cd (0.38), Pb (0.28), As (0.24), Cu (0.04), and Zn (0.01). The predominance of Ni in ecological risk principally stems from its elevated concentration in the rivers. At the same time, Hg’s notable ranking reflected its exceptionally high toxicity coefficient despite lower environmental levels. Importantly, all calculated PERI values remained substantially below the critical threshold (150) established in standard evaluation protocols [78,79]. This comprehensive assessment demonstrated that while spatial and elemental variations exist, the current ecological risks posed by these PTEs in the studied river systems maintain a minimal impact on aquatic ecosystems. This reflected the successful integration of systematic preservation initiatives and adaptive ecosystem management facilitated by collaborative efforts between governmental entities and scientific communities.

4.4. SOM Cluster Analysis

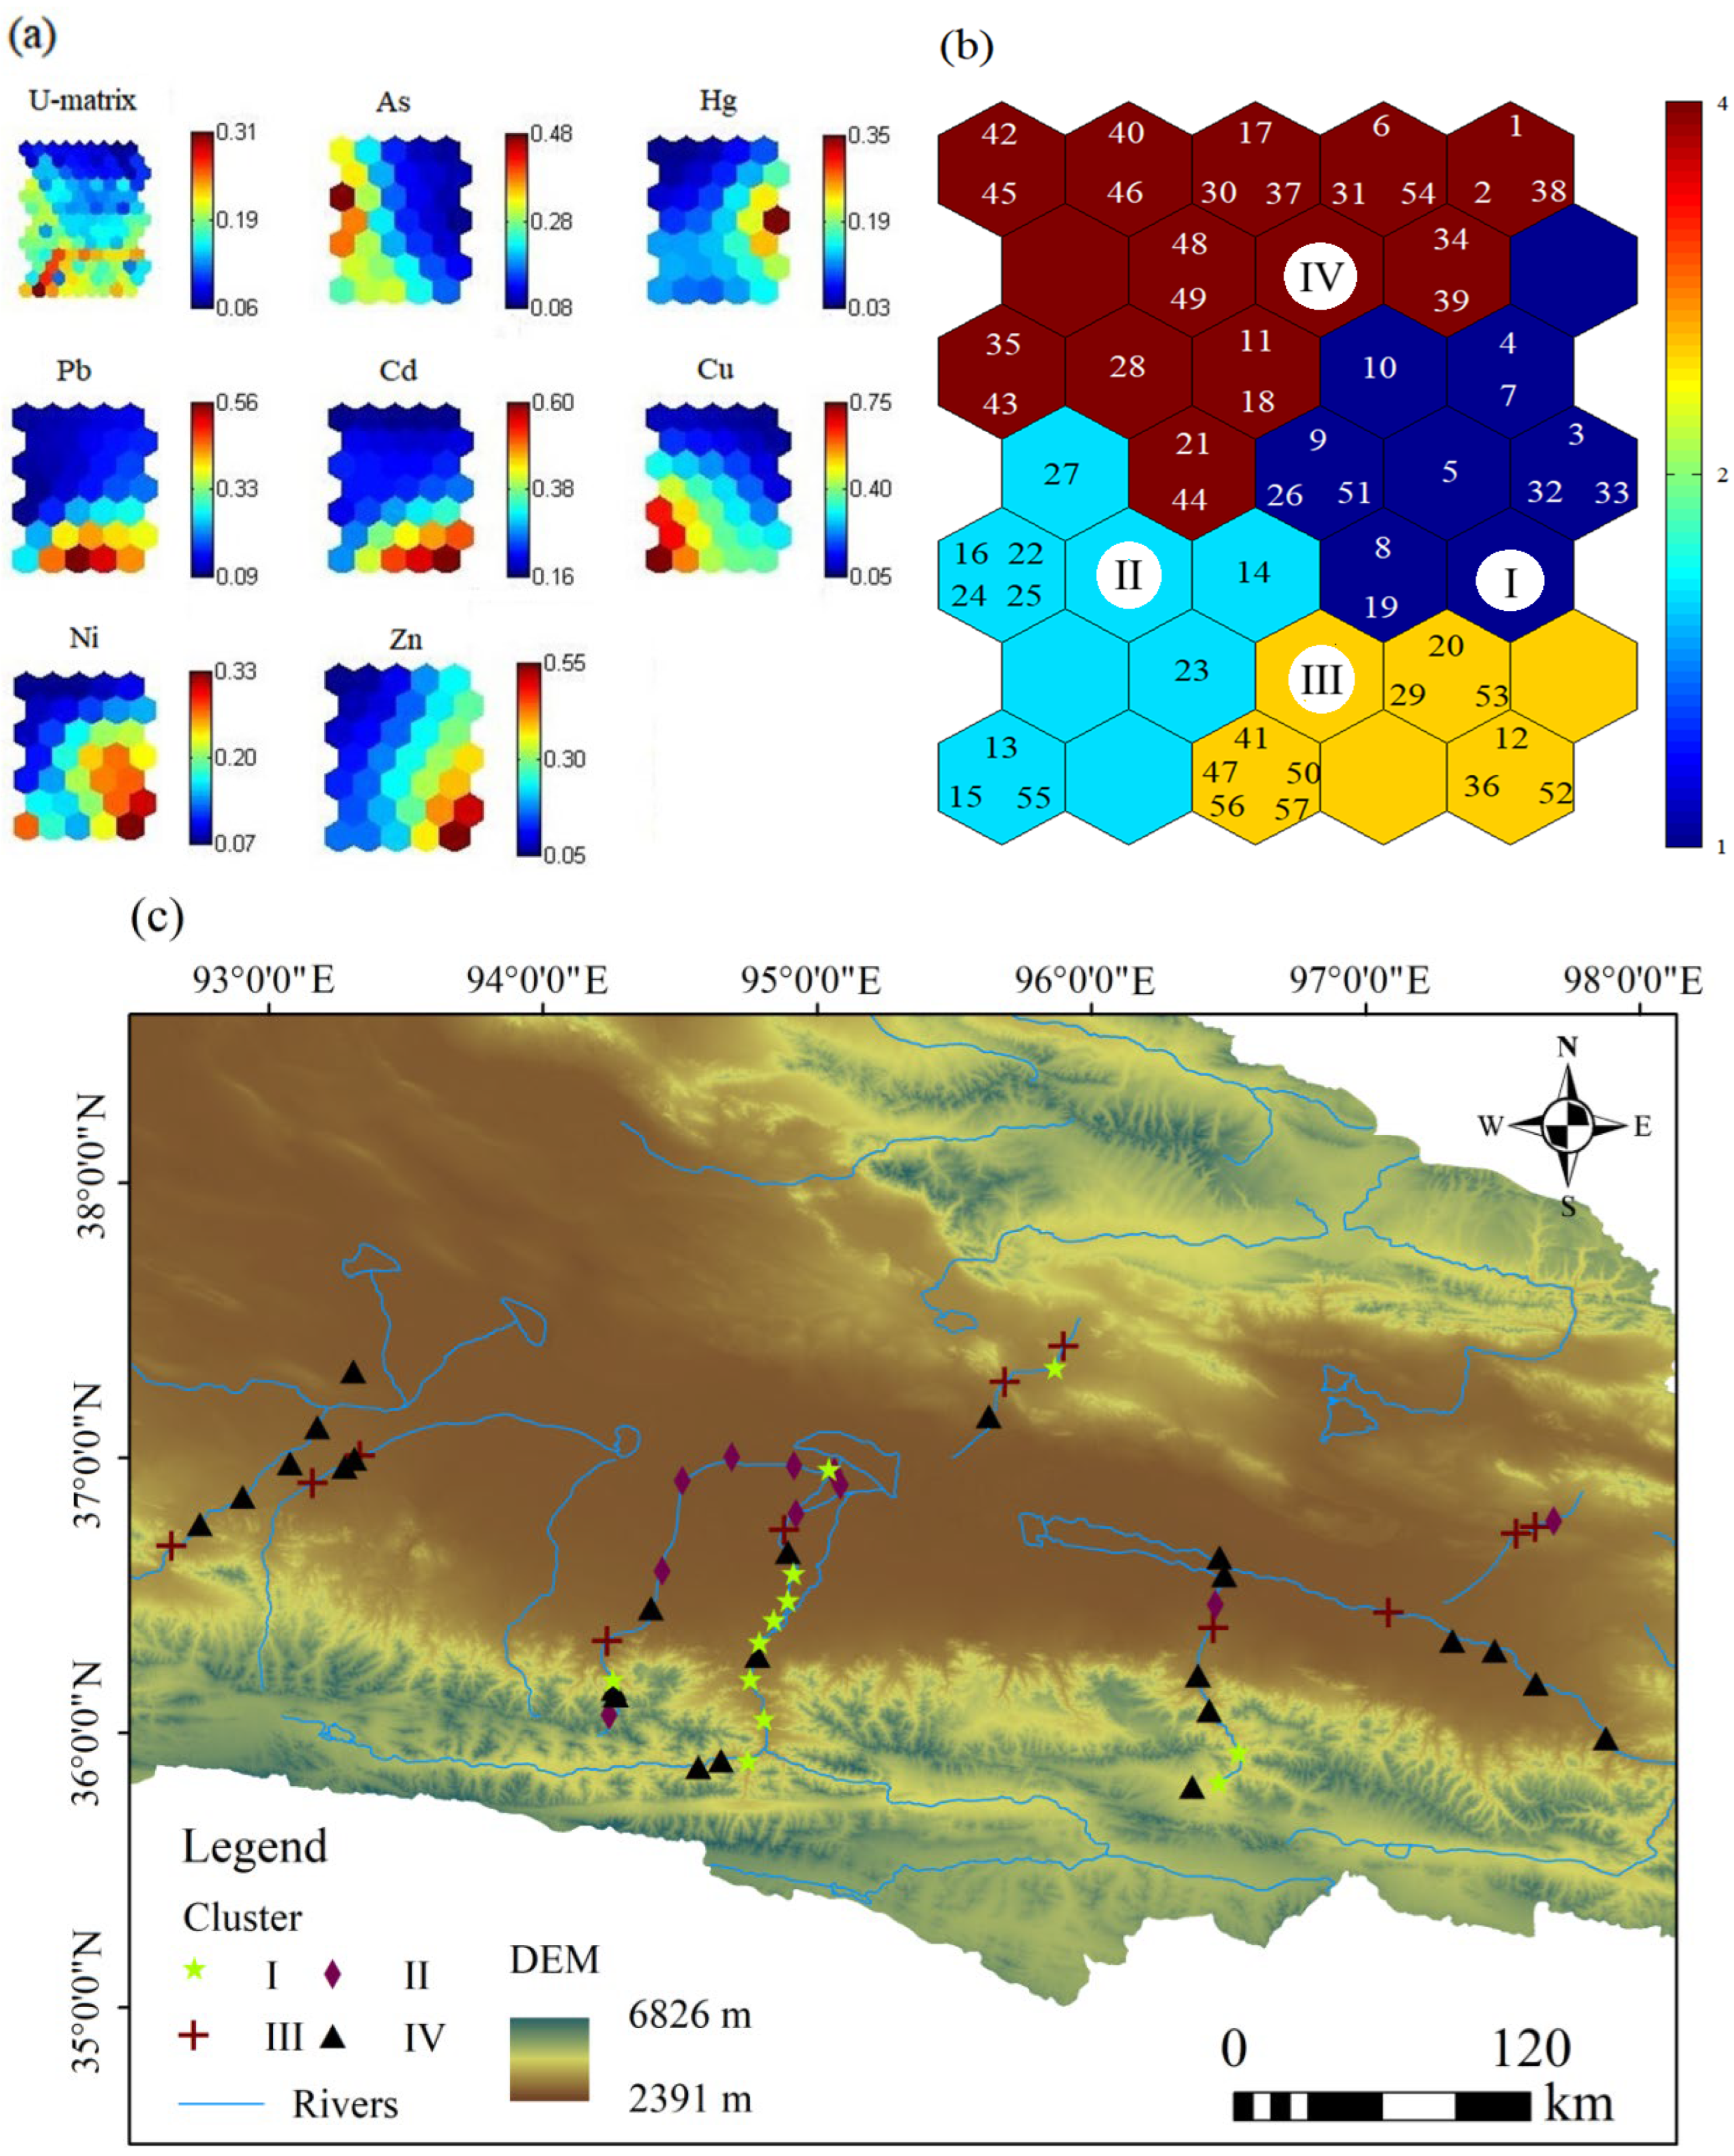
The spatial heterogeneity of PTEs in river water was visualized through a SOM analysis, as depicted in Figure 7. The similar colors represent positive correlations between elements. In contrast, color differences indicate negative correlations [80]. In this research, the SOM clustered the seven analyzed elements into four distinct geochemical groups. Group I elements, represented by As, exhibited a characteristic left-to-right decreasing concentration gradient across the feature plane. In contrast, Hg as Group II demonstrated an inverse spatial pattern with right-to-left diminishing concentrations. Group III comprised Ni, Zn, Cd, and Pb and showed homogeneous coloration patterns with their concentration maxima clustered in the lower-right quadrant. Cu formed an independent Group IV, displaying concentrated high-content zones in the lower-left sector with sharply defined spatial boundaries. This categorical differentiation underscored SOM’s superior pattern recognition capability in deciphering complex elemental distribution patterns within aquatic systems. The visualization outcomes provide critical insights into differential contamination sources governing element distribution in fluvial environments.
The application of k-means clustering quantitatively resolved the spatial heterogeneity across 57 sampling points, categorizing them into four distinct clusters (I–IV; Figure 7b,c), with cluster IV dominating the dataset (n = 24), followed by clusters I (n = 12), III (n = 11), and II (n = 10). Cluster I, predominantly distributed along the Golmud River traversing Golmud City, exhibited anomalous Hg enrichment on SOM feature planes, displaying no significant correlation with other PTEs. Cluster II, localized in the lower-left SOM quadrant, encompassed sampling points along the middle–lower Tora River and exhibited elevated Cu concentrations. Given the absence of agriculture activities in this saline–alkali terrain, the Cu anomaly likely originated from industrial wastewater discharge [81], potentially linked to Salt Lake exploitation activities in the adjacent Qarhan Salt Lake production zone. Cluster III occupied the lower-right SOM sector and showed co-enrichment of Ni, Zn, Cd, and Pb, with urban anthropogenic inputs as the dominant factor. Cluster IV was located in the left corners of the SOM plane, primarily covering all eight rivers. Therefore, cluster IV retained natural environmental features. Also, As had higher concentrations in Cluster IV. To study whether the PTEs in distinct clusters could serve as proxies for pollution source identification, subsequent analyses employed the PMF model to precisely calculate contributions from contamination sources.

4.5. PMF-Based Source Contribution Analysis

PMF can realize the fine traceability analysis of PTE pollution sources [82,83]. In this investigation, elemental concentrations and their associated uncertainties were analyzed using PMF 5.0 with four factors demonstrating   Q R o b u s t / Q T r u e   values stabilized and approaching minimum levels. Residual analysis revealed that approximately 90% of samples fell within the acceptable range of −3 to 3, indicating the validity of the selected factor number for PTE source identification.
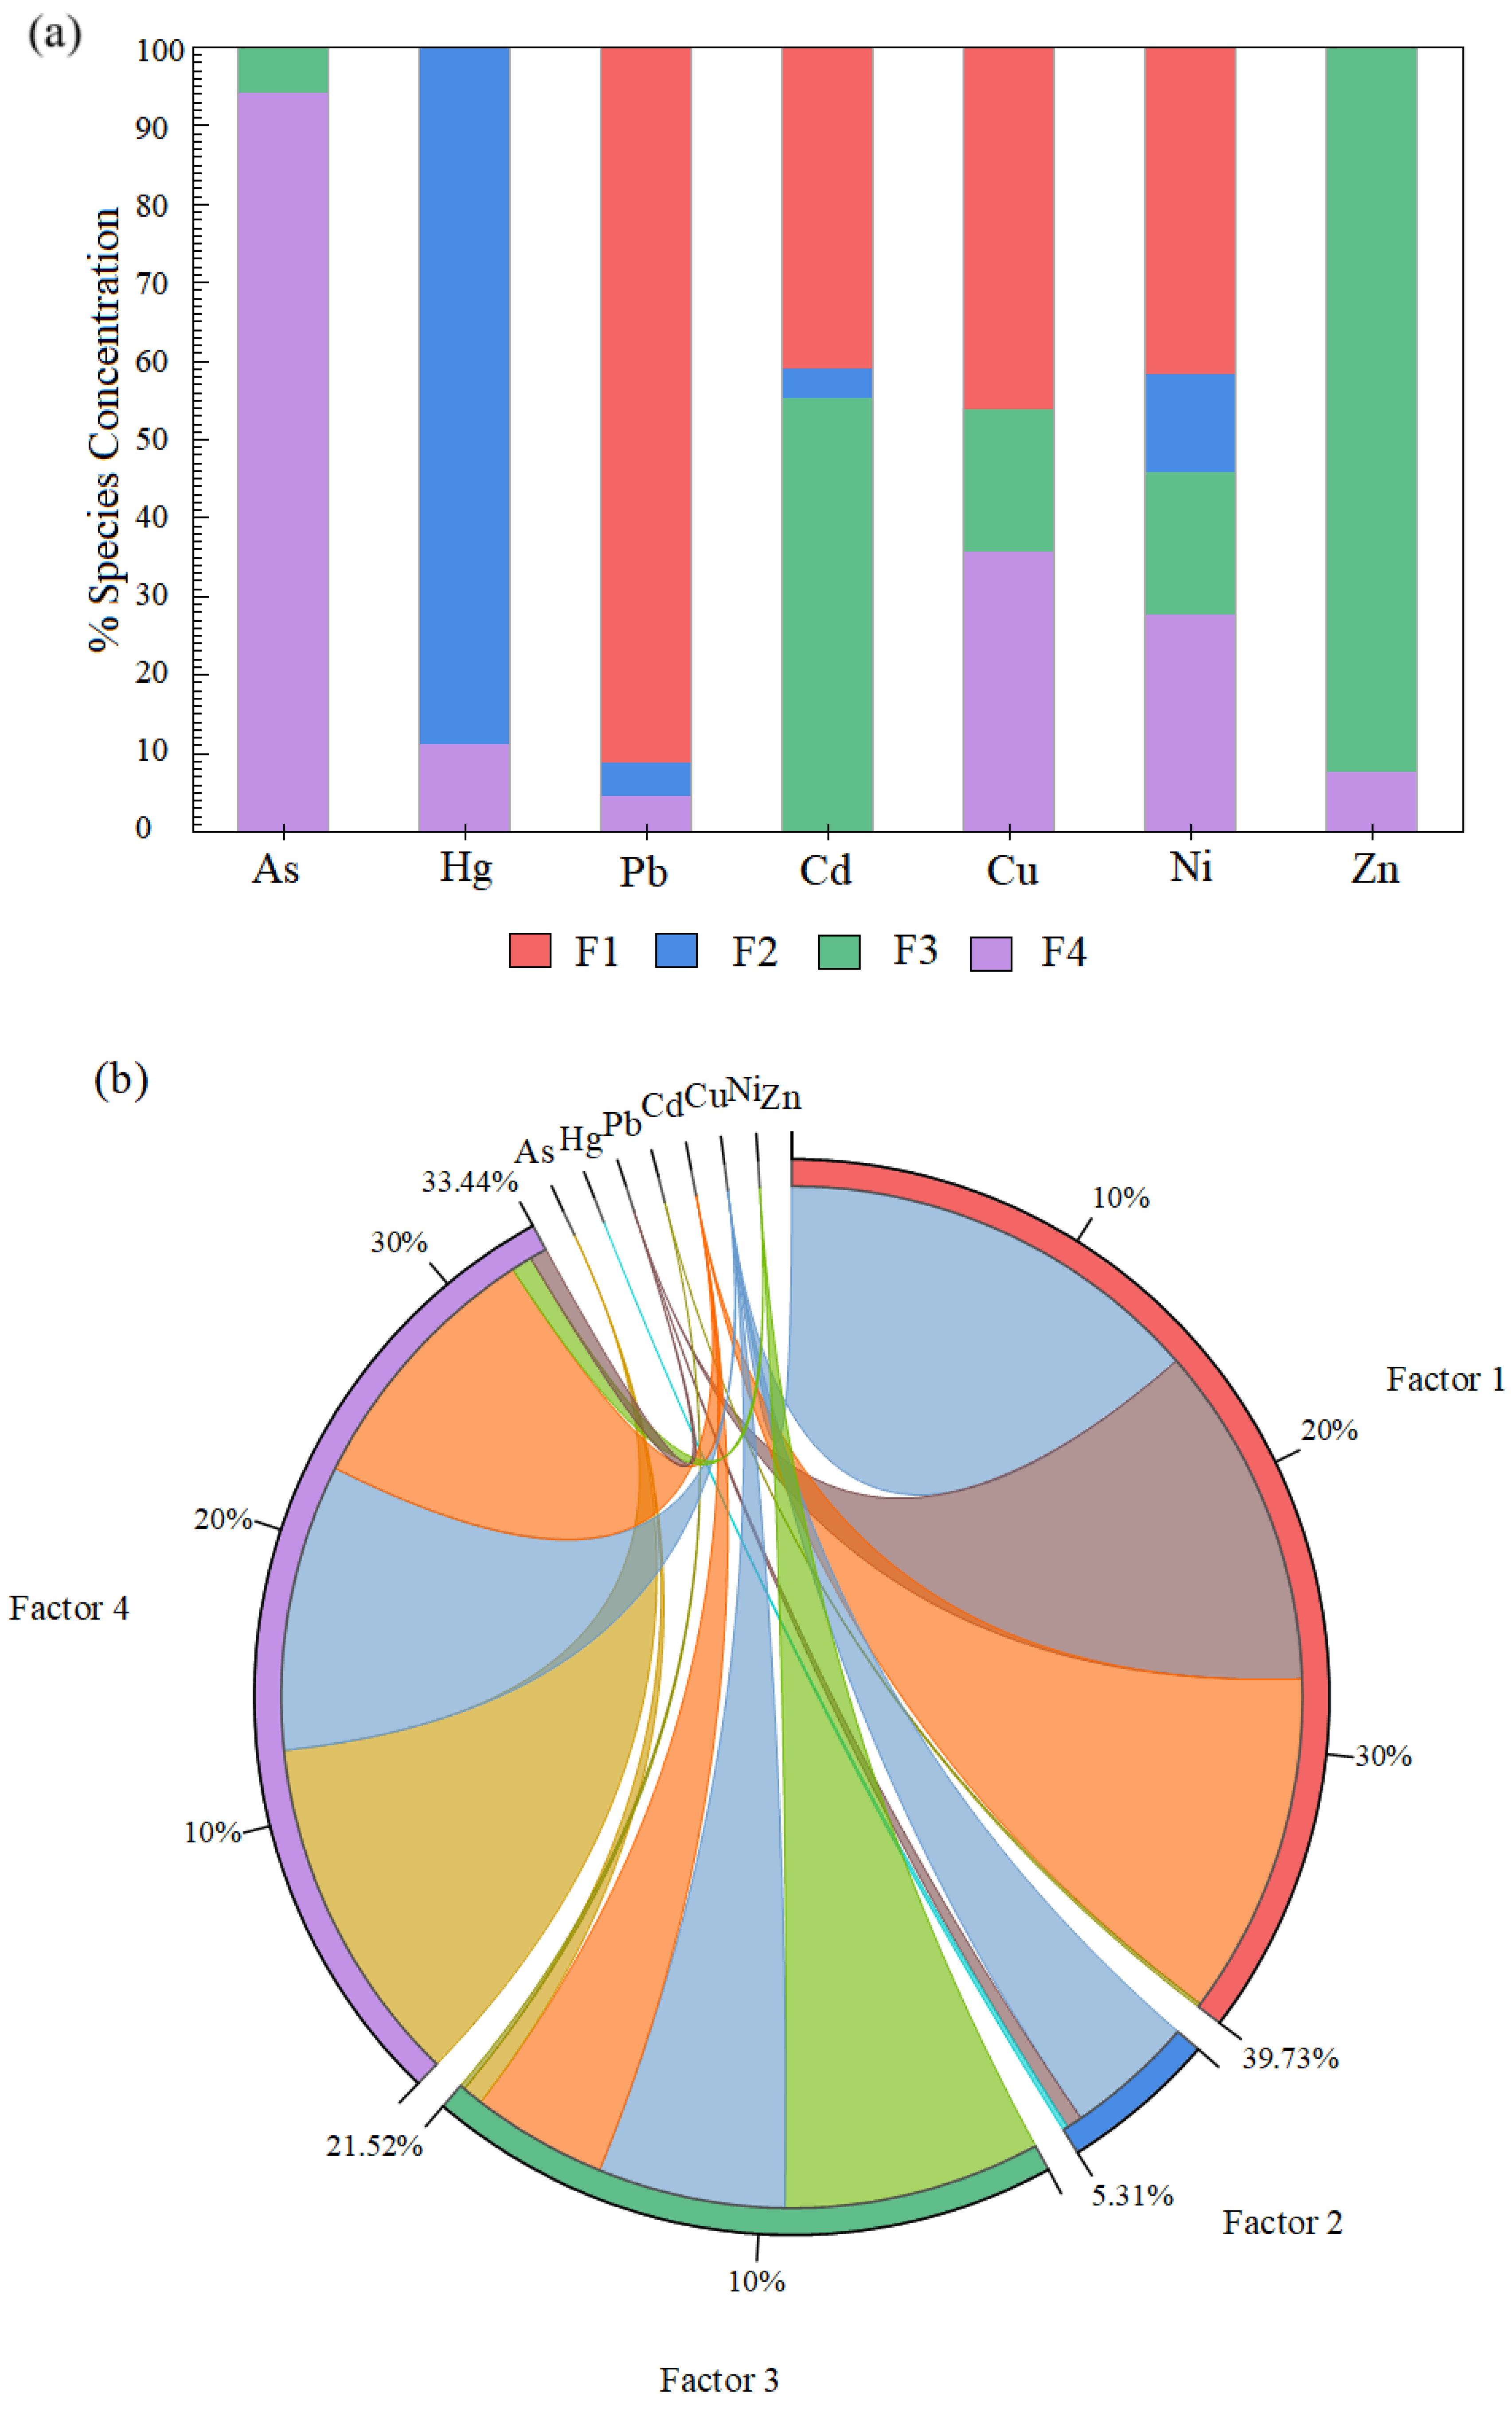
PMF receptor modeling resolved four major PTE sources in the research area (Figure 8a,b). The primary source (Factor 1) accounted for 39.73% of total variance, exhibiting particularly strong associations with Pb (91.20%), along with substantial contributions from Cd (41.00%), Cu (46.00%), and Ni (41.60%). The spatial correlation revealed elevated concentrations near industrial zones, particularly notable for Ni in the Quanji and Golmud Rivers, where concentrations exceeded the 20 μg/L regulatory limit. Ni primarily derives from industrial emissions [75]. Pb-Zn enrichment correlates with vehicular sources—tire wear and exhaust particulates in Golmud City, a regional transportation hub [84]. This factor is strongly correlated with industrial emissions from smelting operations and coal combustion [85]. Factor 2 represented 5.31% of total variance, with Hg demonstrating the strongest loading of 88.70%. Spatial analysis through the SOM revealed Hg’s distinct clustering in the Golmud River, displaying no significant correlation with other PTEs considering the long-distance transmission characteristics of Hg [86]. Long-range transport mechanisms enable Hg emissions from South Asia to infiltrate the QTP via the South Asian monsoon, with observational evidence from Waliguan Station confirming India-derived atmospheric Hg affecting northwestern China through Himalayan-crossing air masses [87,88]. Concurrently, the hyper arid climate on the QTP amplifies Hg cycling through sandstorm processes—dust storms enriched with Hg—bearing aerosols onto glaciers via high-altitude atmospheric transport, subsequently releasing the Hg into fluvial systems during ablation [89].
The third factor (21.52% contribution) showed strong associations with Zn (92.40%) and secondary Cd (55.30%) loadings. These elements exhibited typical traffic-related signatures linked to vehicular tire wear and exhaust emissions. This interpretation aligns with Golmud City’s status as a central transportation hub, where intensive vehicle activities drive these elemental distributions [80]. Factor 4 demonstrated the second highest contribution (33.44%), primarily loading on As (94.30%). Key determinants affecting As levels in environmental systems are geological ones and rock dissolution. Notably, climatic conditions (including key parameters such as temperature, precipitation, and humidity) significantly regulate the environmental transport characteristics of As by changing redox conditions and geochemistry processes [90], indicating this factor corresponds to natural geological sources, likely deriving from regional lithogenic materials and weathering processes.
In view of the contribution rate of each factor based on PMF to the distribution of PTE contents in rivers, the discrimination efficiency of PMF technology in distinguishing the influence of human activities and natural background on PTEs was fully verified, which provided a key theoretical support for the accurate source identification of arid river systems. In addition, the SOM and PMF methodologies exhibited fundamental consistency in classifying seven elements and identifying pollution sources within the study area. This integrated methodological approach synergistically combines the SOM’s pattern recognition capabilities with PMF’s quantitative source resolution, achieving dual analytical advantages.

5. Conclusions

This study comprehensively assessed hydrochemical characteristics, water quality, and sources in river systems within the Qaidam Basin on the QTP. The findings revealed favorable water quality conditions across most sampling sites. However, spatially variable patterns showed significantly elevated concentrations of PTEs at specific stations, particularly in proximal zones adjacent to the terminal Salt Lake. Notably, multivariate analysis identified four principal PTE sources (industrial activities, geogenic origins, transportation, and atmospheric deposition) through factor apportionment. Although anthropogenic disturbances were detected in the study area, their impact on PTE concentrations was largely localized, with only minor effects observed in limited river samplings. Most sampling sites exhibited low PTE levels, primarily influenced by natural geological conditions, while contributions from industrial and transportation activities remained negligible. This study provided critical baseline data for the fragile ecological environment of rivers on the QTP, laying the foundation for the long-term monitoring of high-altitude-sensitive ecosystems. In addition, it deepened our understanding of the interaction between brine and fresh water. It is necessary to strictly control industrial and transportation activities on the QTP.

Supplementary Materials

The following supporting information can be downloaded at: https://www.mdpi.com/article/10.3390/w17172547/s1, Figure S1: Conceptual diagram with the study method and the identification of PTEs sources; Table S1: Evaluation criteria for relevant methods; Table S2: Hydrochemical values of surface water from the eight rivers of the Qaidam Basin on the QTP; Table S3: The major ion concentrations in different rivers (mg/L); Table S4: The concentrations of PTEs in water in the study area (μg/L).

Author Contributions

Methodology, N.C.; software, L.D.; investigation, N.C. and X.L.; writing—original draft preparation, N.C.; writing—review and editing, X.L.; visualization, X.W.; funding acquisition, N.C. All authors have read and agreed to the published version of the manuscript.

Funding

This research was funded by the Open Project of State Key Laboratory of Plateau Ecology and Agriculture in Qinghai University (2025-ZZ-05) and the Qinghai Province “Kunlun Talents High-end Innovation and Entrepreneurial Talents” project (QHKLYC-GDCXCY-2024-295) provided financial support.

Data Availability Statement

The original contributions presented in this study are included in the article/supplementary material. Further inquiries can be directed to the corresponding authors.

Conflicts of Interest

The authors declare no conflict of interest.

References

  1. Yu, H.B.; Deane, D.C.; Zhang, Y.L.; Li, S.C.; Miao, S.Y.; Xie, G.W.; Yin, X.; Favre, A. Integrating multiple indices of geobiodiversity reveals a series of regional species-rich areas worthy of conservation in the region of the Qinghai-Tibet Plateau. Biol. Conserv. 2021, 261, 109238. [Google Scholar] [CrossRef]
  2. Luo, L.H.; Ke, C.Q.; Fan, Y.B.; Wang, Z.F. Accelerated glacier mass loss in the southeastern Tibetan Plateau since the 1970s. Adv. Clim. Change Res. 2023, 14, 372–386. [Google Scholar] [CrossRef]
  3. Pu, T.; Kong, Y.L.; Kang, S.C.; Wang, S.J.; Guo, J.M.; Jia, J.; Wu, K.P.; Shi, X.Y.; Wang, K.; Sun, S.W.; et al. Mercury export from a glacier-fed river of Mt. Meili, southeastern Tibetan Plateau. J. Hazard. Mater. 2024, 477, 135306. [Google Scholar] [CrossRef]
  4. Sun, S.Y.; Liu, S.D.; Liu, Y.X.; Liu, W.; Peter, A.R.; Xia, X.H. Permafrost rivers emit mostly pre-aged carbon on the Qinghai-Tibet Plateau under climate warming. Cell Rep. Sustain. 2025, 2, 100368. [Google Scholar] [CrossRef]
  5. Ruffine, L.; Tang, A.M.; O’Neill, N.; Toffin, L.; Paris, J.D.; Yang, J.H.; Georgiev, V.; Fietzek, P.; Giustiniani, M.; Tinivella, U. Environmental challenges related to methane hydrate decomposition from climate change scenario and anthropic activities: State of the art, potential consequences and monitoring solutions. Earth Sci. Rev. 2023, 246, 104578. [Google Scholar] [CrossRef]
  6. Hao, A.H.; Duan, H.C.; Wang, X.F.; You, Q.G.; Peng, F.; Du, H.Q.; Zhao, G.H.; Liu, F.Y.; Li, C.Y.; Lai, C.M. Different response of alpine meadow and alpine steppe to climatic and anthropogenic disturbance on the Qinghai-Tibetan Plateau. Glob. Ecol. Conserv. 2021, 27, e01512. [Google Scholar] [CrossRef]
  7. Li, L.M.; Wu, J.; Lu, J.; Li, K.X.; Zhang, X.Y.; Min, X.Y.; Gao, C.L.; Xu, J. Water quality evaluation and ecological-health risk assessment on trace elements in surface water of the northeastern Qinghai-Tibet Plateau. Ecotoxicol. Environ. Saf. 2022, 241, 113775. [Google Scholar] [CrossRef]
  8. Guo, M.Z.; Gao, S.L.; Wu, Q.X.; Xia, H.; Wu, P.; Zeng, J.; Wang, W.F. Dissolved trace elements in the upper reaches of Lancang River, southeast Qinghai-Tibet Plateau: Current status and distribution, risk and source. Environ. Res. 2024, 260, 119749. [Google Scholar] [CrossRef]
  9. Qu, B.; Rukumesh, P.; Ramesh, R.P.; Faizan, U.R.Q. Chapter Four—Inorganic components in river waters in the Third Pole. In Water Quality in the Third Pole; Elsevier: Amsterdam, The Netherlands, 2020; pp. 137–178. [Google Scholar] [CrossRef]
  10. Li, Y.L.; Miao, W.L.; He, M.Y.; Li, C.Z.; Gu, H.E.; Zhang, X.Y. Origin of lithium-rich salt lakes on the western Kunlun Mountains of the Tibetan Plateau: Evidence from hydrogeochemistry and lithium isotopes. Ore Geol. Rev. 2023, 155, 105356. [Google Scholar] [CrossRef]
  11. Rehman, K.; Fatima, F.; Waheed, I.; Akash, M.S.H. Prevalence of exposure of heavy metals and their impact on health consequences. J. Cell Biochem. 2018, 119, 157–184. [Google Scholar] [CrossRef] [PubMed]
  12. Alengebawy, A.; Abdelkhalek, S.T.; Qureshi, S.R.; Wang, M.Q. Heavy metals and pesticides toxicity in agricultural soil and plants: Ecological risks and human health implications. Toxics 2021, 9, 42. [Google Scholar] [CrossRef]
  13. Chen, M.S.; Ding, S.M.; Zhang, L.P.; Li, Y.Y.; Sun, Q.; Zhang, C.S. An investigation of the effects of elevated phosphorus in water on the release of heavy metals in sediments at a high resolution. Sci. Total Environ. 2017, 575, 330–337. [Google Scholar] [CrossRef]
  14. Syed, H.I.; Yap, P.S. A review on three-dimensional cellulose-based aerogels for the removal of heavy metals from water. Sci. Total Environ. 2022, 807 Pt 1, 150606. [Google Scholar] [CrossRef]
  15. Angon, P.B.; Islam, M.S.; Shreejana, K.C.; Das, A.; Anjum, N.; Poudel, A.; Suchi, S.A. Sources, effects and present perspectives of heavy metals contamination: Soil, plants and human food chain. Heliyon 2024, 10, e28357. [Google Scholar] [CrossRef]
  16. Sharma, M.; Kant, R.; Sharma, A.K. Exploring the impact of heavy metals toxicity in the aquatic ecosystem. Int. J. Energy Water Res. 2025, 9, 267–280. [Google Scholar] [CrossRef]
  17. Lv, D.W.; Liu, Y.X.; Ren, L.; Huo, J.X.; Zhao, J.; Lu, R.J.; Huang, Y.M.; Duan, L. Assessment of atmospheric heavy metal pollution in Qinghai-Tibet Plateau: Using mosses as biomonitor. J. Hazard. Mater. 2023, 459, 132181. [Google Scholar] [CrossRef]
  18. Cheng, A.Y.; Zuo, Y.P.; Gao, C.L.; Li, H.Y.; Wei, H.C.; Wu, X.S.; Wen, J.X. Potentially toxic elements of lake and wetland in Northeastern Qinghai-Tibet Plateau: Distribution, potential sources and risk assessment. Ecol. Indic. 2024, 166, 112427. [Google Scholar] [CrossRef]
  19. Zou, Y.W.; Lou, S.; Zhang, Z.R.; Liu, S.G.; Zhou, X.S.; Zhou, F.; Radnaeva, L.D.; Nikitina, E.; Fedorova, I.V. Predictions of heavy metal concentrations by physiochemical water quality parameters in coastal areas of Yangtze river estuary. Mar. Pollut. Bull. 2024, 199, 115951. [Google Scholar] [CrossRef]
  20. Zhang, F.; Yuan, Y.; Xi, B.; Lu, H.; Jiang, Y.; Hui, K.; Tan, W.; Wang, H.; Meng, F. Hydrochemistry characteristics and genesis of shallow groundwater in diverse industrial agglomeration areas in typical alluvial plain of the Yellow River. Sci. Total Environ. 2025, 958, 177764. [Google Scholar] [CrossRef]
  21. Jahan, A.; Khan, M.U.; Rai, N.; Kumar, S.; Dar, T.A. Geochemical characterization, its controlling factors, and comparison between the upstream and downstream segments of the Himalayan Satluj River basin, India. Geochemistry 2023, 83, 125974. [Google Scholar] [CrossRef]
  22. Cai, N.; Wang, X.P.; Wang, W.L.; Wang, L.Q.; Tian, S.H.; Zhu, H.X.; Zhang, X.Y. Accumulation, ecological health risks, and source identification of potentially toxic elements in river sediments of the Qinghai-Tibet Plateau, China. Process Saf. Environ. Prot. 2024, 182, 703–718. [Google Scholar] [CrossRef]
  23. Zhang, S.S.; Xue, S.L.; Jian, H.M.; Yang, F.X.; Yao, Q.Z. Artificial water regulation and natural flood processes control heavy metal concentrations and transport in the Yellow River, China. Mar. Pollut. Bull. 2024, 209 Pt A, 117092. [Google Scholar] [CrossRef]
  24. Goswami, A.P.; Das, S.; Kalamdhad, A.S. Assessment of possible pollution risk using spatial distribution and temporal variation of heavy metals in river sediments. Environ. Earth Sci. 2021, 80, 677. [Google Scholar] [CrossRef]
  25. Uddin, R.; Hopke, P.K.; Van Impe, J.; Sannigrahi, S.; Salauddin, M.; Cummins, E.; Nag, R. Source identification of heavy metals and metalloids in soil using open-source Tellus database and their impact on ecology and human health. Sci. Total Environ. 2024, 953, 175987. [Google Scholar] [CrossRef]
  26. Fartas, F.F.; Remini, B.; Sekiou, F.; Marouf, N. The use of PCA and ANN to improve evaluation of the WQI classic, development of a new index, and prediction of WQI, coastel constantinois, northern coast of eastern Algeria. Water Supply 2022, 22, 8727–8749. [Google Scholar] [CrossRef]
  27. Wei, Q.; Li, S.Y.; Xu, J.Z.; Yang, Z.H.; Liu, Z.Y.; Chen, P.; Liu, Y.Z.; Ding, Y.M.; Tan, J.Y.; Li, J.Y. Evaluation of surface water quality in Heilongjiang Province, China: Based on different quantities of water quality indicators. Ecol. Indic. 2023, 154, 110472. [Google Scholar] [CrossRef]
  28. Feng, Z.H.; Xu, C.J.; Zuo, Y.P.; Luo, X.; Wang, L.Q.; Chen, H.; Xie, X.J.; Yan, D.; Liang, T. Analysis of water quality indexes and their relationships with vegetation using self-organizing map and geographically and temporally weighted regression. Environ. Res. 2023, 216 Pt 2, 114587. [Google Scholar] [CrossRef]
  29. Anjana, K.R.; Suresh, A.; Soman, V.; Rahman, K.H. Metal contamination in the Ashtamudi Wetland ecosystem: Source identification, toxicological risk assessment of Ni, Cd, Cr, and Pb and remediation strategies. Mar. Pollut. Bull. 2025, 212, 117534. [Google Scholar] [CrossRef]
  30. Han, X.; Huang, L.; Gan, J.; Yang, M.; Zhu, G.; Li, Y. Hydrochemical Characteristics, Mechanisms of Formation, and Sources of Different Water Bodies in the Northwest Coal-Electricity Agglomeration Area. Water 2024, 16, 1521. [Google Scholar] [CrossRef]
  31. Mohammadpour, A.; Motamed-Jahromi, M.; Abbasi, F.; Hesaruiyeh, F.A.; Shahsavani, E.; Khaneghah, A.M. Evaluation of the concentration and human health risk of nitrate and potentially toxic elements (PTEs) in melons from a southern region of Iran: Identification of pollution sources. Sci. Total Environ. 2024, 926, 171702. [Google Scholar] [CrossRef]
  32. Zhang, S.Y.; Shao, M.; Wang, T.; Pei, Y.; Chen, B. Geochemistry of lacustrine carbonate rocks in southwestern Qaidam: Implications of silicate weathering and carbon burial triggered by the uplift of the Tibetan Plateau. Int. J. Coal Geol. 2022, 265, 104167. [Google Scholar] [CrossRef]
  33. Wang, L.; Jian, X.; Fu, H.J.; Zhang, W.; Shang, F.; Fu, L. Decoupled local climate and chemical weathering intensity of fine-grained siliciclastic sediments from a paleo-megalake: An example from the Qaidam basin, northern Tibetan Plateau. Sediment. Geol. 2023, 454, 106462. [Google Scholar] [CrossRef]
  34. Cui, B.L.; Li, X.Y. The impact of climate changes on water level of Qinghai Lake in China over the past 50 years. Nord. Hydrol. 2016, 47, 532–542. [Google Scholar] [CrossRef]
  35. Wang, Z.G.; Li, X.Y.; Deng, Y.H.; Zhang, Y.Y.; Liu, X. Stable isotope evidence confirms lakes are more sensitive than rivers to extreme drought on the Qinghai-Tibet Plateau, China. J. Hydrol. 2023, 627 Pt B, 130466. [Google Scholar] [CrossRef]
  36. Yang, N.; Wang, G.C.; Hou, E.K.; Guo, L.; Xiong, L.Y.; Song, X.M. Triple isotopes (δD, δ18O, δ17O) characteristic of river water and groundwater in an arid watershed from Qaidam Basin, Northwestern China: Implications for hydrological cycle. Sci. Total Environ. 2024, 927, 172229. [Google Scholar] [CrossRef]
  37. Ferreira, S.L.C.; da Silva, J.B.; dos Santos, I.F.; de Oliveira, O.M.C.; Cerda, V.; Queiroz, A.F.S. Use of pollution indices and ecological risk in the assessment of contamination from chemical elements in soils and sediments- Practical aspects. Trends Environ. Anal. Chem. 2022, 35, e00169. [Google Scholar] [CrossRef]
  38. Ajayakumar, A.; Aju, C.D.; Rajesh, R.; Reji, S.; Krishnan, K.A.; Arya, S. Exploring hydrochemical drivers of drinking water quality in a tropical river basin using self-organizing maps and explainable AI. Water Res. 2025, 284, 123884. Available online: https://wgmktpgxscrjl-s.p.lib.tju.edu.cn/10.1016/j.watres.2025.123884 (accessed on 3 April 2025). [CrossRef] [PubMed]
  39. Rahman, A.T.M.S.; Kono, Y.; Hosono, T. Self-organizing map improves understanding on the hydrochemical processes in aquifer systems. Sci. Total Environ. 2022, 846, 157281. [Google Scholar] [CrossRef] [PubMed]
  40. Zhang, K.Y.; Li, M.H.; Qu, S.; Zhao, Y.Z.; Duan, L.M.; Yang, X.; Li, D.Y.; Liao, Z.L.; Yu, R.H. Spatio-seasonal variability of source contributions to water quality in a large irrigation drainage lake basin based on the entropy weighted quality index, positive matrix factorization, and isotopic tracers. Environ. Pollut. 2025, 382, 126670. Available online: https://wgmktpgxscrjl-s.p.lib.tju.edu.cn/10.1016/j.envpol.2025.126670 (accessed on 3 April 2025). [CrossRef]
  41. Zhang, S.; Wang, S.; Li, F.; Liu, S.; You, Y.; Liu, C. Enhanced Assessment of Water Quality and Pollutant Source Apportionment Using APCS-MLR and PMF Models in the Upper Reaches of the Tarim River. Water 2024, 16, 3061. [Google Scholar] [CrossRef]
  42. Ke, X.M.; Li, Y.J.; Wang, W.; Niu, F.J.; Gao, Z.Y. Hydrogeochemical characteristics and processes of thermokarst lake and groundwater during the melting of the active layer in a permafrost region of the Qinghai-Tibet Plateau, China. Sci. Total Environ. 2022, 851 Pt 2, 158183. [Google Scholar] [CrossRef]
  43. GB 3838-2002; Environmental Quality Standard for Surface Water. National Standard of the People’s Republic of China: Beijing, China, 2002.
  44. Ma, J.X.; Wu, S.Q.; Shekhar, N.V.R.; Biswas, S.; Sahu, A.K. Determination of Physicochemical Parameters and Levels of Heavy Metals in Food Waste Water with Environmental Effects. Bioinorg. Chem. Appl. 2020, 2020, 8886093. [Google Scholar] [CrossRef] [PubMed]
  45. Patra, A.; Das, S.; Mandal, A.; Mondal, N.S.; Kole, D.; Dutta, P.; Ghosh, A.R. Seasonal variation of physicochemical parameters and heavy metal concentration in water and bottom sediment at harboring areas of Digha coast, West Bengal, India. Reg. Stud. Mar. Sci. 2023, 62, 102945. [Google Scholar] [CrossRef]
  46. Zhong, M.; Liu, S.X.; Li, K.; Jiang, H.B.; Jiang, T.; Tang, G.P. Modeling Spatial Patterns of Dissolved Oxygen and the Impact Mechanisms in a Cascade River. Front. Environ. Sci. 2022, 9, 781646. [Google Scholar] [CrossRef]
  47. Ming, D.; Wang, L.Q.; Dai, L.J.; Zhang, Q.; Liang, T. Evaluation of water environment quality in a typical wetland on the Qinghai-Tibet Plateau using positive matrix factorization and self-organizing map. J. Clean. Prod. 2024, 479, 144069. [Google Scholar] [CrossRef]
  48. Rajesh, M.; Rehana, S. Impact of climate change on river water temperature and dissolved oxygen: Indian riverine thermal regimes. Sci. Rep. 2022, 12, 9222. [Google Scholar] [CrossRef]
  49. Zhi, W.; Ouyang, W.; Shen, C.; Li, L. Temperature Outweighs Light and Flow as the Predominant Driver of Dissolved Oxygen in US Rivers. Nat. Water 2023, 1, 249–260. [Google Scholar] [CrossRef]
  50. Zhang, W.Q.; Rong, N.; Jin, X.; Meng, X.; Han, S.J.; Zhang, D.W.; Shan, B.Q. Dissolved oxygen variation in the North China Plain river network region over 2011–2020 and the influencing factors. Chemosphere 2021, 287, 132354. [Google Scholar] [CrossRef]
  51. El-Azhari, A.; Ait Brahim, Y.; Barbecot, F.; Hssaisoune, M.; Berrouch, H.; Laamrani, A.; Hadri, A.; Brouziyne, Y.; Bouchaou, L. Evaluating groundwater salinity patterns and spatiotemporal dynamics in complex endorheic aquifer systems. Sci. Total Environ. 2025, 994, 180055. [Google Scholar] [CrossRef]
  52. Qin, H.H.; Gao, B.; He, L.; Hu, X.H.; Dong, L.; Sanjay, D.; Dong, A.; Sun, Z.X.; Wan, W. Hydrogeochemical Characteristics and Controlling Factors of the Lhasa River under the Influence of Anthropogenic Activities. Water 2019, 11, 948. [Google Scholar] [CrossRef]
  53. Xiang, J.; Zhou, J.J.; Yang, J.C.; Huang, M.H.; Feng, W.; Li, Q.Q.; Xue, D.X.; Zhao, Y.R.; Zhu, G.F. Applying multivariate statistics for identification of groundwater chemistry and qualities in the Sugan Lake Basin, Northern Qinghai-Tibet Plateau, China. J. Mt. Sci. 2020, 17, 448–463. [Google Scholar] [CrossRef]
  54. Miao, W.L.; Zhang, X.Y.; Li, Y.L.; Li, W.X.; Yuan, X.L.; Li, C.Z. Lithium and strontium isotopic systematics in the Nalenggele River catchment of Qaidam basin, China: Quantifying contributions to lithium brines and deciphering lithium behavior in hydrological processes. J. Hydrol. 2022, 614 Pt B, 128630. Available online: https://wgmktpgxscrjl-s.p.lib.tju.edu.cn/10.1016/j.jhydrol.2022.128630 (accessed on 18 April 2025). [CrossRef]
  55. Wu, W.H. Hydrochemistry of inland rivers in the north Tibetan Plateau: Constraints and weathering rate estimation. Sci. Total Environ. 2016, 541, 468–482. [Google Scholar] [CrossRef]
  56. Zhang, X.Y.; Hu, B.X.; Wang, P.; Chen, J.B.; Yang, L.; Xiao, K.; Zhang, X.W. Hydrogeochemical evolution and heavy metal contamination in groundwater of a reclaimed land on Zhoushan Island. Water 2018, 10, 316. [Google Scholar] [CrossRef]
  57. Zhang, X.R.; Fan, Q.S.; Li, Q.K.; Du, Y.S.; Qin, Z.J.; Wei, H.C.; Shan, F.S. The Source, Distribution, and Sedimentary Pattern of K-Rich Brines in the Qaidam Basin, Western China. Minerals 2019, 9, 655. [Google Scholar] [CrossRef]
  58. Huang, J.T.; Wang, W.K.; Cui, X.D.; Wang, D.; Liu, W.H.; Liu, X.M.; Wang, S.B. Environmental risk-based hydroeconomic evaluation for alluvial aquifer management in arid river basin. Sci. Total Environ. 2020, 711, 134655. [Google Scholar] [CrossRef]
  59. Yang, T.H.; Wu, Q.X.; An, Y.L.; Lv, J.M. Major ion compositions, sources and risk assessment of karst stream under the influence of anthropogenic activities, Guizhou Province, Southwest China. PeerJ 2023, 11, e15368. [Google Scholar] [CrossRef]
  60. Li, Q.K.; Fan, Q.S.; Wei, H.C.; Qin, Z.J.; Zhang, X.R.; Du, Y.S.; Shan, F.S. Sulfur isotope constraints on the formation of MgSO4-deficient evaporites in the Qarhan Salt Lake, western China. J. Asian Earth Sci. 2020, 189, 104160. [Google Scholar] [CrossRef]
  61. An, F.Y.; Chen, T.Y.; Li, X.Z.; Liu, X.J.; Wang, Y.X.; Chen, Z.Y.; Chong, Y.E. Formation, mechanism and significance of alluvial-dammed lakes in Golmud River catchment, north-eastern Qinghai-Tibetan Plateau. Earth Surf. Process. Landf. 2021, 46, 2421–2436. [Google Scholar] [CrossRef]
  62. Li, Z.J.; Yang, Q.C.; Xie, C.; Wang, H.; Wang, Y.L. Spatiotemporal characteristics of groundwater quality and health risk assessment in Jinghe River Basin, Chinese Loess Plateau. Ecotoxicol. Environ. Saf. 2022, 248, 114278. [Google Scholar] [CrossRef]
  63. Jia, L.; Cheng, P.; Yu, Y.; Wang, Y.L.; Chen, S.H.; Wang, C.X.; Wang, J.C.; Zhang, J.C.; Fan, B.G.; Jin, Y. Study on the co-combustion process and mercury emission characteristics of sewage sludge-coal slime coupled fuel. J. Mater. Cycles Waste Manag. 2023, 25, 1369–1389. [Google Scholar] [CrossRef]
  64. Brigham, M.E.; VanderMeulen, D.D.; Eagles-Smith, C.A.; Krabbenhoft, D.P.; Maki, R.P.; DeWild, J.F. Long-Term Trends in Regional Wet Mercury Deposition and Lacustrine Mercury Concentrations in Four Lakes in Voyageurs National Park. Appl. Sci. 2021, 11, 1879. [Google Scholar] [CrossRef]
  65. Peng, H.J.; Rong, Y.M.; Chen, D.; Sun, R.Y.; Huang, J.; Ding, H.W.; Olid, C.; Yan, H.Y. Anthropogenic activity and millennial climate variability affect Holocene mercury deposition of an alpine wetland near the largest mercury mine in China. Chemosphere 2023, 316, 137855. [Google Scholar] [CrossRef] [PubMed]
  66. Guo, J.M.; Tripathee, L.; Kang, S.C.; Zhang, Q.G.; Huang, J.; Sharma, C.M.; Chen, P.F.; Paudyal, R.; Rupakheti, D. Atmospheric particle-bound mercury in the northern Indo-Gangetic Plain region: Insights into sources from mercury isotope analysis and influencing factors. Geosci. Front. 2021, 13, 101274. [Google Scholar] [CrossRef]
  67. Li, Z.G.; Chen, X.F.; Liu, W.L.; Li, T.S.; Qiu, G.L.; Yan, H.Y.; Wang, M.M.; Chen, J.; Sun, G.Y.; Wang, Q.F.; et al. Soil and ambient air mercury as an indicator of coal-fired power plant emissions: A case study in North China. Environ. Sci. Pollut. Res. 2021, 28, 33146–33157. [Google Scholar] [CrossRef]
  68. Wu, J.; Lu, J.; Li, L.M.; Min, X.Y.; Luo, Y.M. Pollution, ecological-health risks, and sources of heavy metals in soil of the northeastern Qinghai-Tibet Plateau. Chemosphere 2018, 201, 234–242. [Google Scholar] [CrossRef] [PubMed]
  69. Chen, T.; Chang, Q.R.; Liu, J.; Clevers, J.G.P.W.; Kooistra, L. Identification of soil heavy metal sources and improvement in spatial mapping based on soil spectral information: A case study in northwest China. Sci. Total Environ. 2016, 565, 155–164. [Google Scholar] [CrossRef]
  70. Zhang, Y.Q.; Wang, S.T.; Gao, Z.J.; Zhang, H.R.; Zhu, Z.H.; Jiang, B.; Liu, J.T.; Dong, H.Z. Contamination characteristics, source analysis and health risk assessment of heavy metals in the soil in Shi River Basin in China based on high density sampling. Ecotoxicol. Environ. Saf. 2021, 227, 112926. [Google Scholar] [CrossRef]
  71. Xiao, J.; Wang, L.Q.; Deng, L.; Jin, Z.D. Characteristics, sources, water quality and health risk assessment of trace elements in river water and well water in the Chinese Loess Plateau. Sci. Total Environ. 2019, 650, 2004–2012. [Google Scholar] [CrossRef]
  72. Xu, G.Y.; Wang, Z.C.; Zhao, H.Y.; Bu, Z.J.; Peros, M.; Liu, S.S.; Li, H.K.; Wang, S.Z. Characteristics and Assessment of Trace Elements (Hg, As, Sb, Se, and Bi) in Mire Surface Water from the Changbai Mountains, Northeastern China. Water Air Soil Pollut. 2021, 232, 246. [Google Scholar] [CrossRef]
  73. Li, Y.P.; Wang, Y.; Liu, R.H.; Shao, L.; Liu, X.Y.; Han, K.; Song, P. Variation of mercury fractionation and speciation in municipal sewage treatment plant: Effects of mercury on the atmosphere. Environ. Sci. Pollut. Res. 2022, 29, 36475–36485. [Google Scholar] [CrossRef]
  74. Wang, X.P.; Liu, X.J.; Wang, L.Q.; Yang, J.; Wan, X.M.; Liang, T. A holistic assessment of spatiotemporal variation, driving factors, and risks influencing river water quality in the northeastern Qinghai-Tibet Plateau. Sci. Total Environ. 2022, 851, 157942. [Google Scholar] [CrossRef]
  75. Chen, H.; Yan, Y.L.; Hu, D.M.; Peng, L.; Wang, C. PM 2.5-bound heavy metals in a typical industrial city of Changzhi in North China: Pollution sources and health risk assessment. Atmos. Environ. 2024, 321, 120344. [Google Scholar] [CrossRef]
  76. Ahamad, M.I.; Rehman, A.; Mehmood, M.S.; Mahmood, S.; Zafar, Z.; Lu, H.L.; Feng, W.F.; Lu, S.Q. Spatial distribution, ecological and human health risks of potentially toxic elements (PTEs) in river Ravi, Pakistan: A comprehensive study. Environ. Res. 2024, 263 Pt 3, 120205. [Google Scholar] [CrossRef]
  77. Rezouki, S.; Moubchir, T.; El Hanafi, L.; Flouchi, R.; Zahir, I.; Alzain, M.N.; El Guerrouj, B.; Noman, O.; Shahat, A.A.; Allali, A. Assessment of Ecological Hazards in the Inaouen Wadi and Its Tributaries Using the Presence of Potentially Toxic Elements in Its Sediments. Water 2024, 16, 2936. [Google Scholar] [CrossRef]
  78. Liu, R.; Men, C.; Liu, Y.; Yu, W.; Xu, F.; Shen, Z. Spatial distribution and pollution evaluation of heavy metals in Yangtze estuary sediment. Mar. Pollut. Bull. 2016, 110, 564–571. [Google Scholar] [CrossRef] [PubMed]
  79. Gan, L.; Wang, J.P.; Xie, M.Y.; Yang, B.K. Ecological risk and health risk analysis of soil potentially toxic elements from oil production plants in central China. Sci. Rep. 2022, 12, 17077. [Google Scholar] [CrossRef] [PubMed]
  80. Zeng, J.W.; Liu, K.; Liu, X.; Tang, Z.E.; Wang, X.J.; Fu, R.C.; Lin, X.J.; Liu, N.; Qiu, J.R. Driving factor, source identification, and health risk of PFAS contamination in groundwater based on the self-organizing map. Water Res. 2024, 267, 122458. [Google Scholar] [CrossRef]
  81. Robledo Ardila, P.A.; Álvarez, A.R.; Árcega, C.F.; Durán, V.J.J.; Morales, G.R.; Lamas, C.E.; Oceguera-Vargas, I.; DelValls, A. Assessment and Review of Heavy Metals Pollution in Sediments of the Mediterranean Sea. Appl. Sci. 2024, 14, 1435. [Google Scholar] [CrossRef]
  82. Shi, B.L.; Yang, X.; Liang, T.; Liu, S.Y.; Yan, X.L.; Li, J.C.; Liu, Z.S. Source apportionment of soil PTE in a northern industrial county using PMF model: Partitioning strategies and uncertainty analysis. Environ. Res. 2024, 252 Pt 2, 118855. [Google Scholar] [CrossRef]
  83. Kazapoe, R.W.; Kwayisi, D.; Alidu, S.; Sagoe, S.D.; Umaru, A.O.; Amuah, E.E.Y.; Addai, M.O.; Fynn, O.F. Advanced analysis of soil pollution in southwestern Ghana using Variational Autoencoders (VAE) and positive matrix factorization (PMF). Environ. Sustain. Ind. 2025, 26, 100627. [Google Scholar] [CrossRef]
  84. He, L.; Wang, S.; Huang, W.; Xu, J.; Dong, Y.; Chen, Z.; Liu, Q.; Ning, X. Response of Trace Elements in Urban Deposition to Emissions in a Northwestern River Valley Type City: 2010–2021. Sci. Total Environ. 2024, 913, 169547. [Google Scholar] [CrossRef] [PubMed]
  85. McComb, J.Q.; Han, F.X.; Rogers, C.; Thomas, C.; Arslan, Z.; Ardeshir, A.; Tchounwou, P.B. Trace elements and heavy metals in the Grand Bay National Estuarine Reserve in the northern Gulf of Mexico. Mar. Pollut. Bull. 2015, 99, 61–69. [Google Scholar] [CrossRef] [PubMed]
  86. Yan, J.Y.; Li, R.L.; Wang, C.; Yang, S.C.; Shao, M.Y.; Zhang, L.M.; Li, P.; Feng, X.B. Transport and transformation of colloidal and particulate mercury in contaminated watershed. Water Res. 2025, 278, 123428. [Google Scholar] [CrossRef] [PubMed]
  87. Fu, X.W.; Feng, X.; Liang, P.; Deliger, H.; Zhang, J.J.; Liu, P. Temporal trend and sources of speciated atmospheric mercury at Waliguan GAW station, northwestern China. Atmos. Chem. Phys. 2012, 12, 1951–1963. [Google Scholar] [CrossRef]
  88. Liu, N.T.; Cai, X.Y.; Jia, L.Y.; Wang, X.; Yuan, W.; Lin, C.J.; Wang, D.Y.; Feng, X.B. Quantifying Mercury Distribution and Source Contribution in Surface Soil of Qinghai-Tibetan Plateau Using Mercury Isotopes. Environ. Sci. Technol. 2023, 57, 5903–5912. [Google Scholar] [CrossRef]
  89. Sun, H.; Liu, X.D. Impacts of the uplift of four mountain ranges on the arid climate and dust cycle of inland Asia. Palaeogeogr. Palaeocl. 2018, 505, 167–179. [Google Scholar] [CrossRef]
  90. Ma, K.K.; Li, C.X.; Ai, C.; Zhang, B.; Huang, H.Y.; Xiao, J. Hydrochemical characteristics and water quality assessment of snow cover in the northeastern Tibet plateau. Atmos. Pollut. Res. 2023, 14, 101660. [Google Scholar] [CrossRef]
Figure 1. Geographic localization of studied area: (a) localization of China in Asia; (b) localization of Qinghai–Tibet Plateau (QTP) in China; (c) digital elevation model (DEM) with sampling locations in the Qaidam Basin along the Kunlun Mountains on the QTP.
Water 17 02547 g001
Figure 2. Piper trilinear diagram of rivers in the Qaidam Basin on the QTP.
Water 17 02547 g002
Figure 3. PTE spatial distributions in the surface water of rivers in Qaidam Basin on the QTP.
Water 17 02547 g003
Figure 4. Radar chart of the WQI in water samples collected from eight rivers. Points 1–15 (Golmud River, n = 15), 16–26 (Tora River, n = 11), 27–34 (Nuomuhong River, n = 8), 35–40 (Qaidam River, n = 6), 41–46 (Nalenggele River, n = 6), 47–50 (Wutumeiren River, n = 4), 51–54 (Quanji River, n = 4), and 55–57 (Dongzao River, n = 3).
Water 17 02547 g004
Figure 5. Different quality assessment methods in the surface water of the rivers ((a) the contamination factor for PTEs in each river; (b) modified contamination index for rivers; (c) heavy metal pollution index for each river; (d) heavy metal evaluation index for each river.).
Water 17 02547 g005
Figure 6. Heatmap of the PERI for PTEs in the rivers. Points 1–15 (Golmud River, n = 15), 16–26 (Tora River, n = 11), 27–34 (Nuomuhong River, n = 8), 35–40 (Qaidam River, n = 6), 41–46 (Nalenggele River, n = 6), 47–50 (Wutumeiren River, n = 4), 51–54 (Quanji River, n = 4), and 55–57 (Dongzao River, n = 3).
Water 17 02547 g006
Figure 7. SOM of PTEs in river water. ((a) SOM for PTEs; (b) clustering of sampling points; (c) spatial distribution analysis of sampling points using k-means clustering).
Water 17 02547 g007
Figure 8. (a) Proportion of contribution of individual PTEs to four factors as derived by PMF. (b) Composition of PTEs using four factors.
Water 17 02547 g008
Table 1. Statistical hydrochemistry values of surface water.
ParametersMinMaxMeanMedianSDCV
pH8.2410.119.439.430.330.04
DO (mg/L)4.1513.338.558.631.370.16
EC (mS/cm)0.3356.633.880.8010.102.60
TDS (mg/L)4.1281,420.735002.94940.7913,933.132.78
SAL (ppt)0.3086.494.740.7214.353.03
Disclaimer/Publisher’s Note: The statements, opinions and data contained in all publications are solely those of the individual author(s) and contributor(s) and not of MDPI and/or the editor(s). MDPI and/or the editor(s) disclaim responsibility for any injury to people or property resulting from any ideas, methods, instructions or products referred to in the content.