3.1. The Influence of the Jet and Wake on Stall Formation
The occurrence of stall on the guide vane depends largely on the inflow velocity of the vane.
Figure 9a describes the flow conditions at the runner outlet and the guide vane inlet under the design condition and the low-flow condition. The green and red lines in the figure represent the design condition and the low-flow condition, respectively.
U,
V, and
W represent the circumferential velocity of the runner outlet, the absolute velocity of the runner outlet fluid in the stationary coordinate system, and the relative velocity of the runner outlet flow in the runner rotating coordinate system, respectively. The subscripts
D,
m, and
u, respectively, represent the design working conditions, the axial plane component of the absolute speed, and the circumferential component of the absolute speed.
α,
β,
φ, and
θ represent the angle between the runner outlet flow and the circumferential tangent direction, the runner blade outlet placement angle, the guide vane inlet flow angle, and the guide vane inlet attack angle, respectively. Under the design condition, the guide vane inlet
φD is basically consistent with the guide vane placement angle, so no obvious stall will occur. When the flow rate decreases from the design point, larger
θ is formed between the guide vane inlet flow and the blade placement angle, and stall occurs near the blade. The relative velocity of the runner wake is often lower than that of the mainstream. The analysis of the flow separation of the runner wake at the guide vane inlet is shown in
Figure 9b. In
Figure 9b, the red lines represent the jet and the yellow lines represent the wake. It can be seen that the attack angle
θW is large.
The 0.74
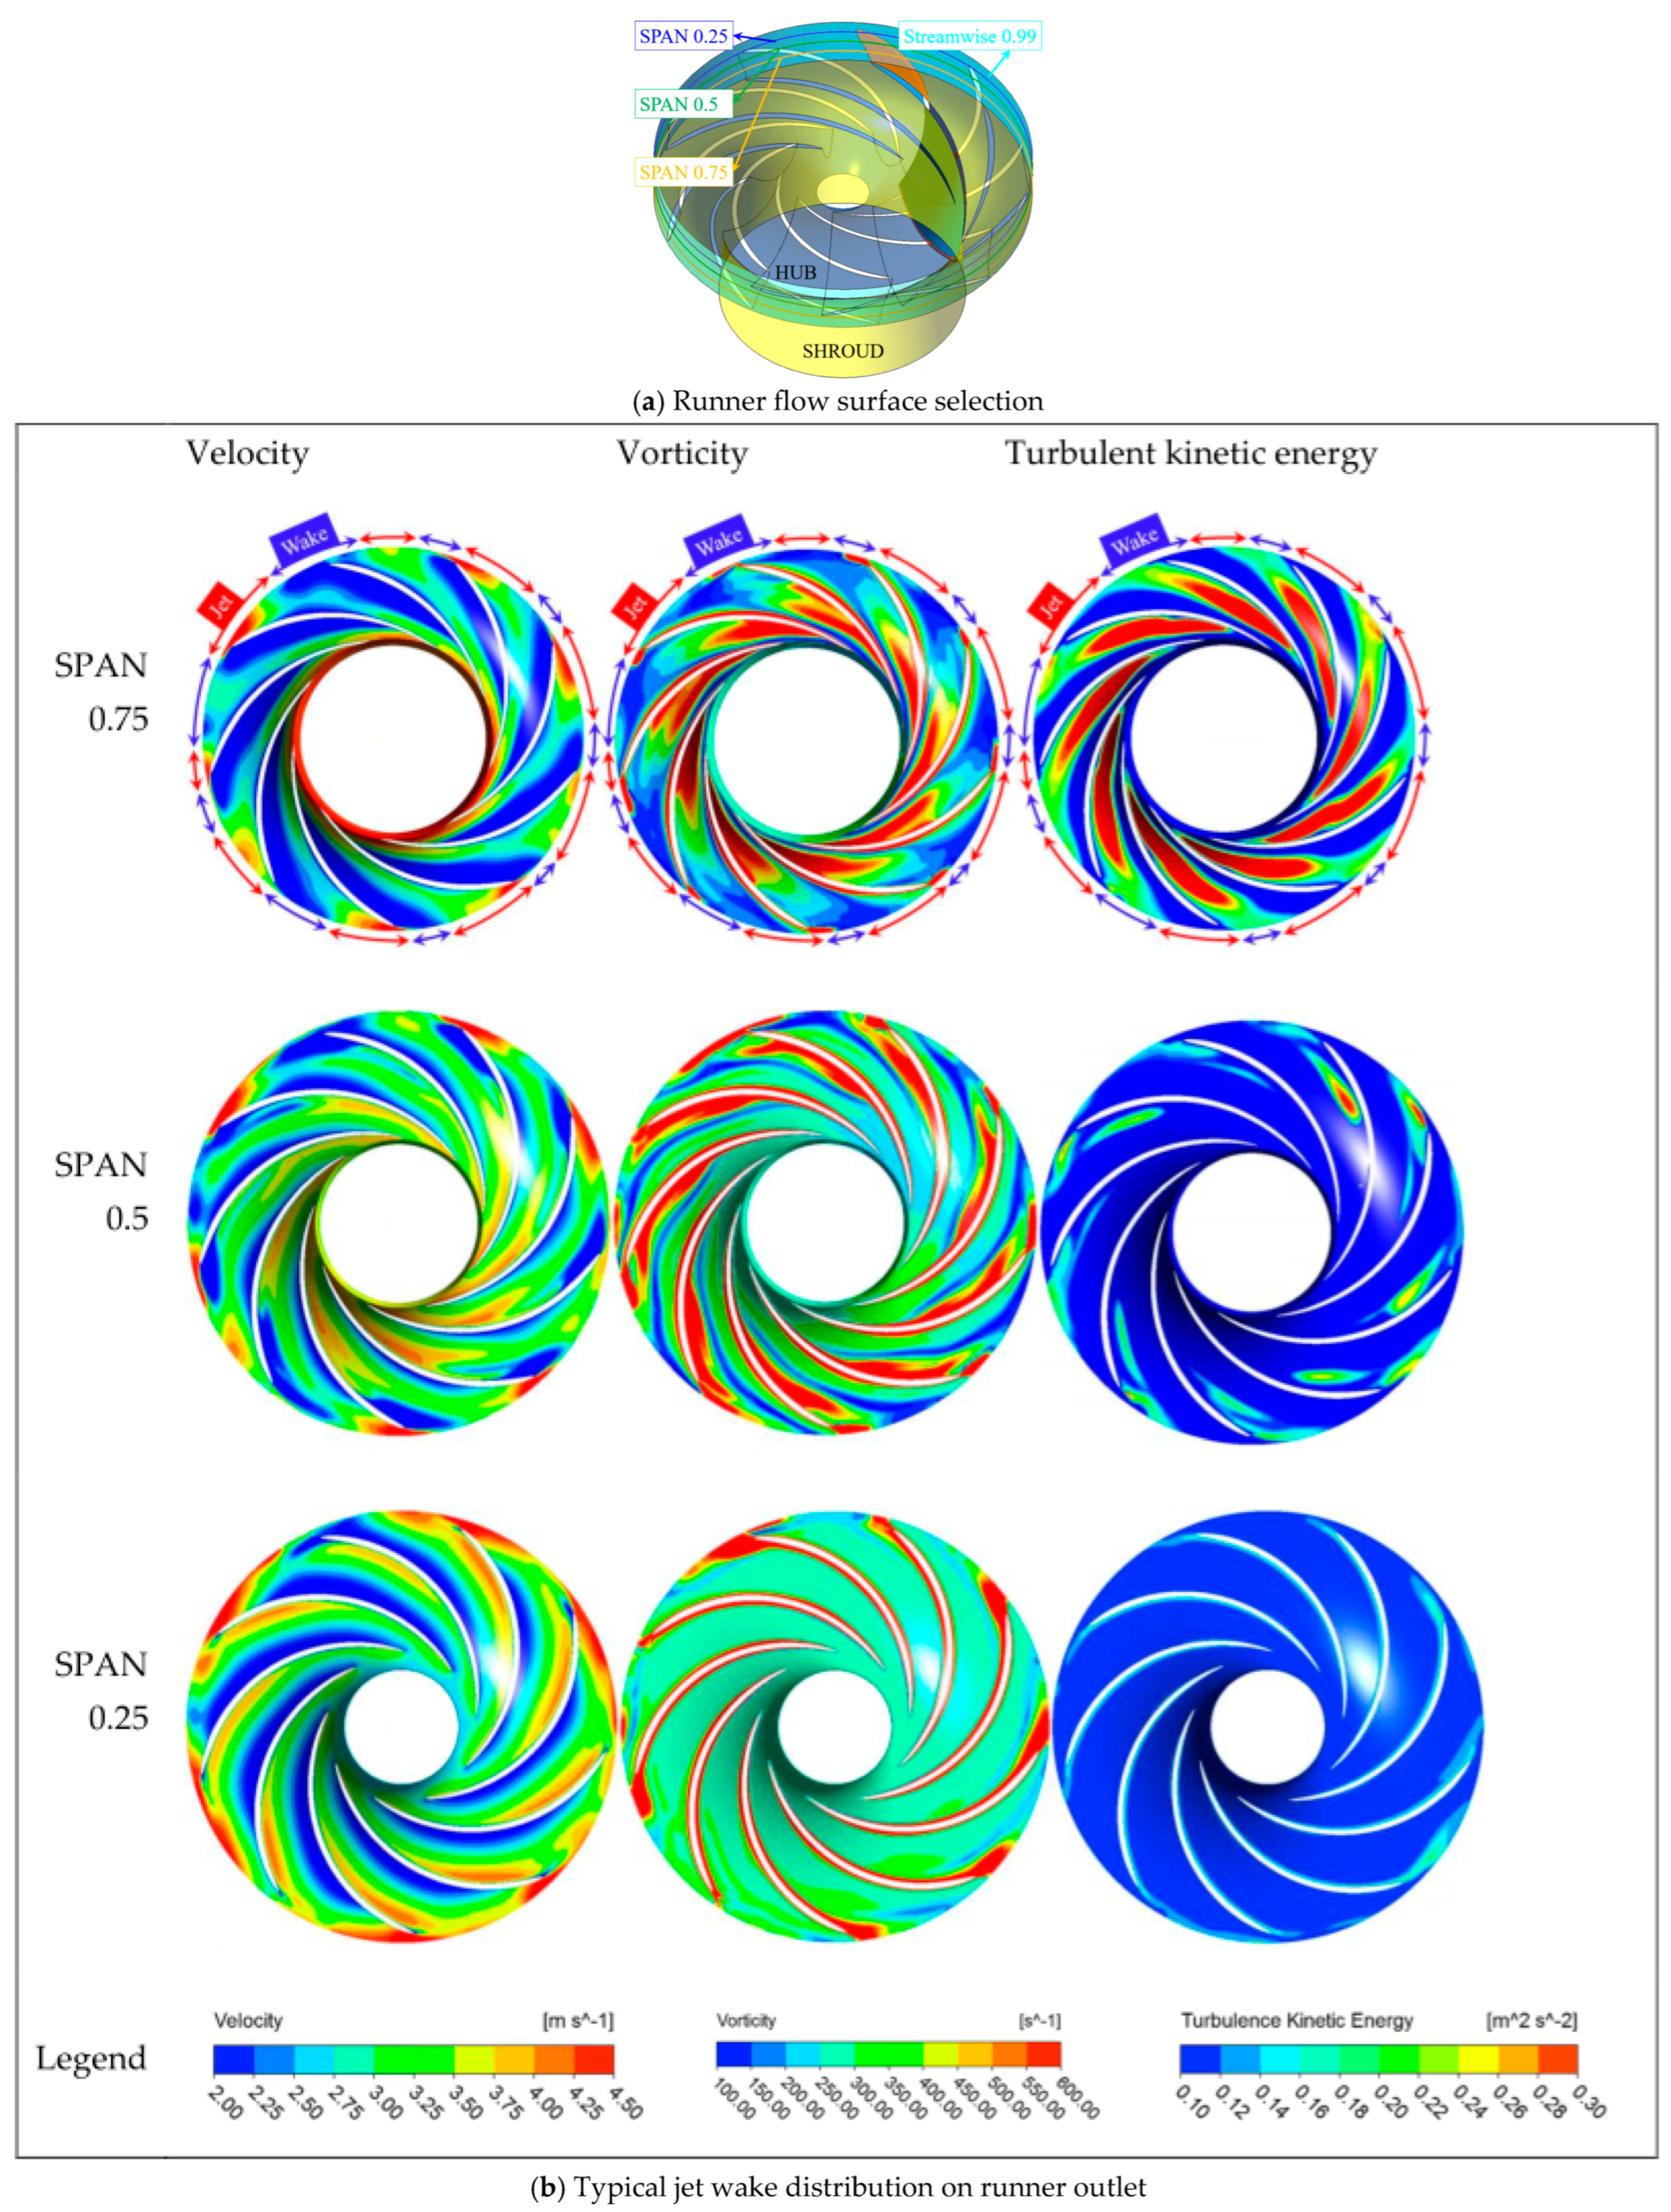
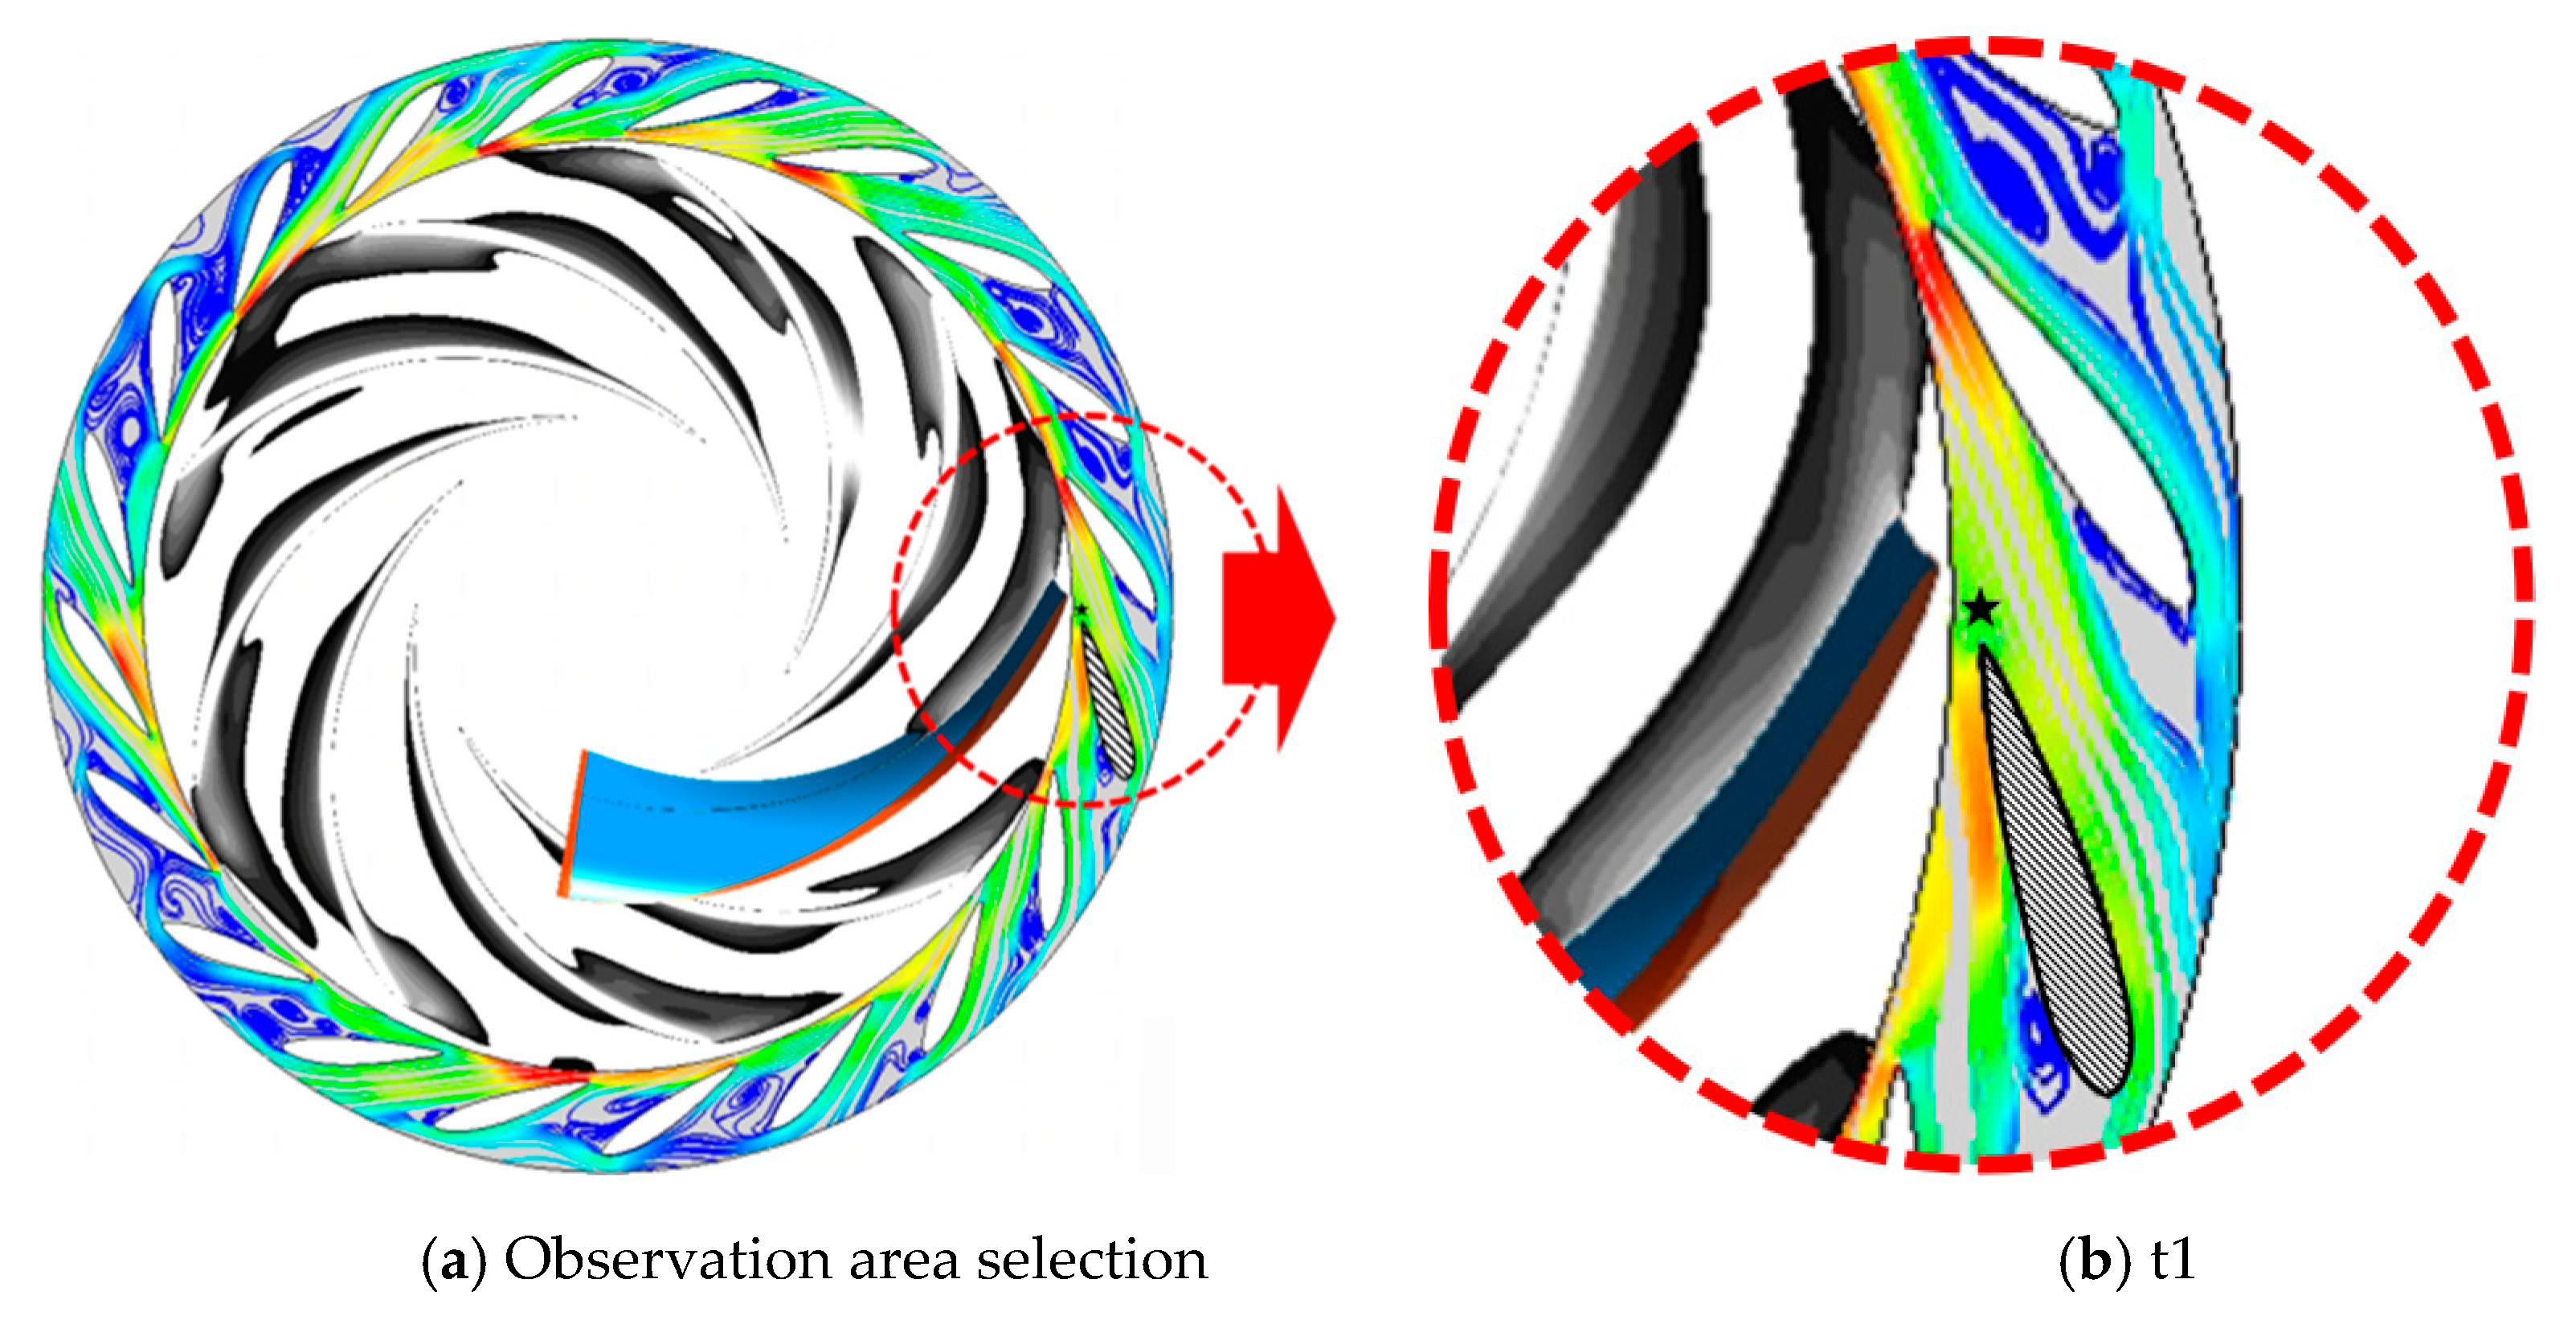
QBEP is selected as an example to analyze the process of stall induced by RSI. The flow distribution at the runner outlet under this condition is shown in
Figure 10. Three target flow surfaces in
Figure 10a are selected to draw the velocity, vorticity, and turbulent kinetic energy cloud diagram as shown in
Figure 10b. On the flow surface near the runner shroud (spanwise position SPAN = 0.75), the runner outlet velocity is unevenly distributed in the circumferential direction, forming an alternating distribution pattern of “high speed-low speed-high speed”. The high-speed area is close to the blade pressure surface, and the low-speed area is close to the blade suction surface. The former is called “jet”, and the latter is called “wake”. From the shroud to the hub, the coverage of the runner outlet wake in the circumferential direction gradually decreases.
The flow section of the runner outlet (streamwise position Streamwise = 0.99) in
Figure 10a is expanded as shown in
Figure 11. In the figure, the horizontal axis represents the circumferential angle of the runner outlet, and the vertical axis represents the blade span height from the runner hub to shroud. The color bar from blue to red represents the dimensionless flow velocity
v′ from low to high. The black dotted line represents the outlet edge of the runner blade. The blue dotted line box is the wake area, the red dotted line box is the jet area, and the blue horizontal dotted line represents the boundary of the wake area at the entire blade height (hereinafter referred to as the wake boundary), where the definition of
v′ is shown in the following formula:
where
v represents the flow velocity, and
represents the average flow velocity on the runner outlet flow section.
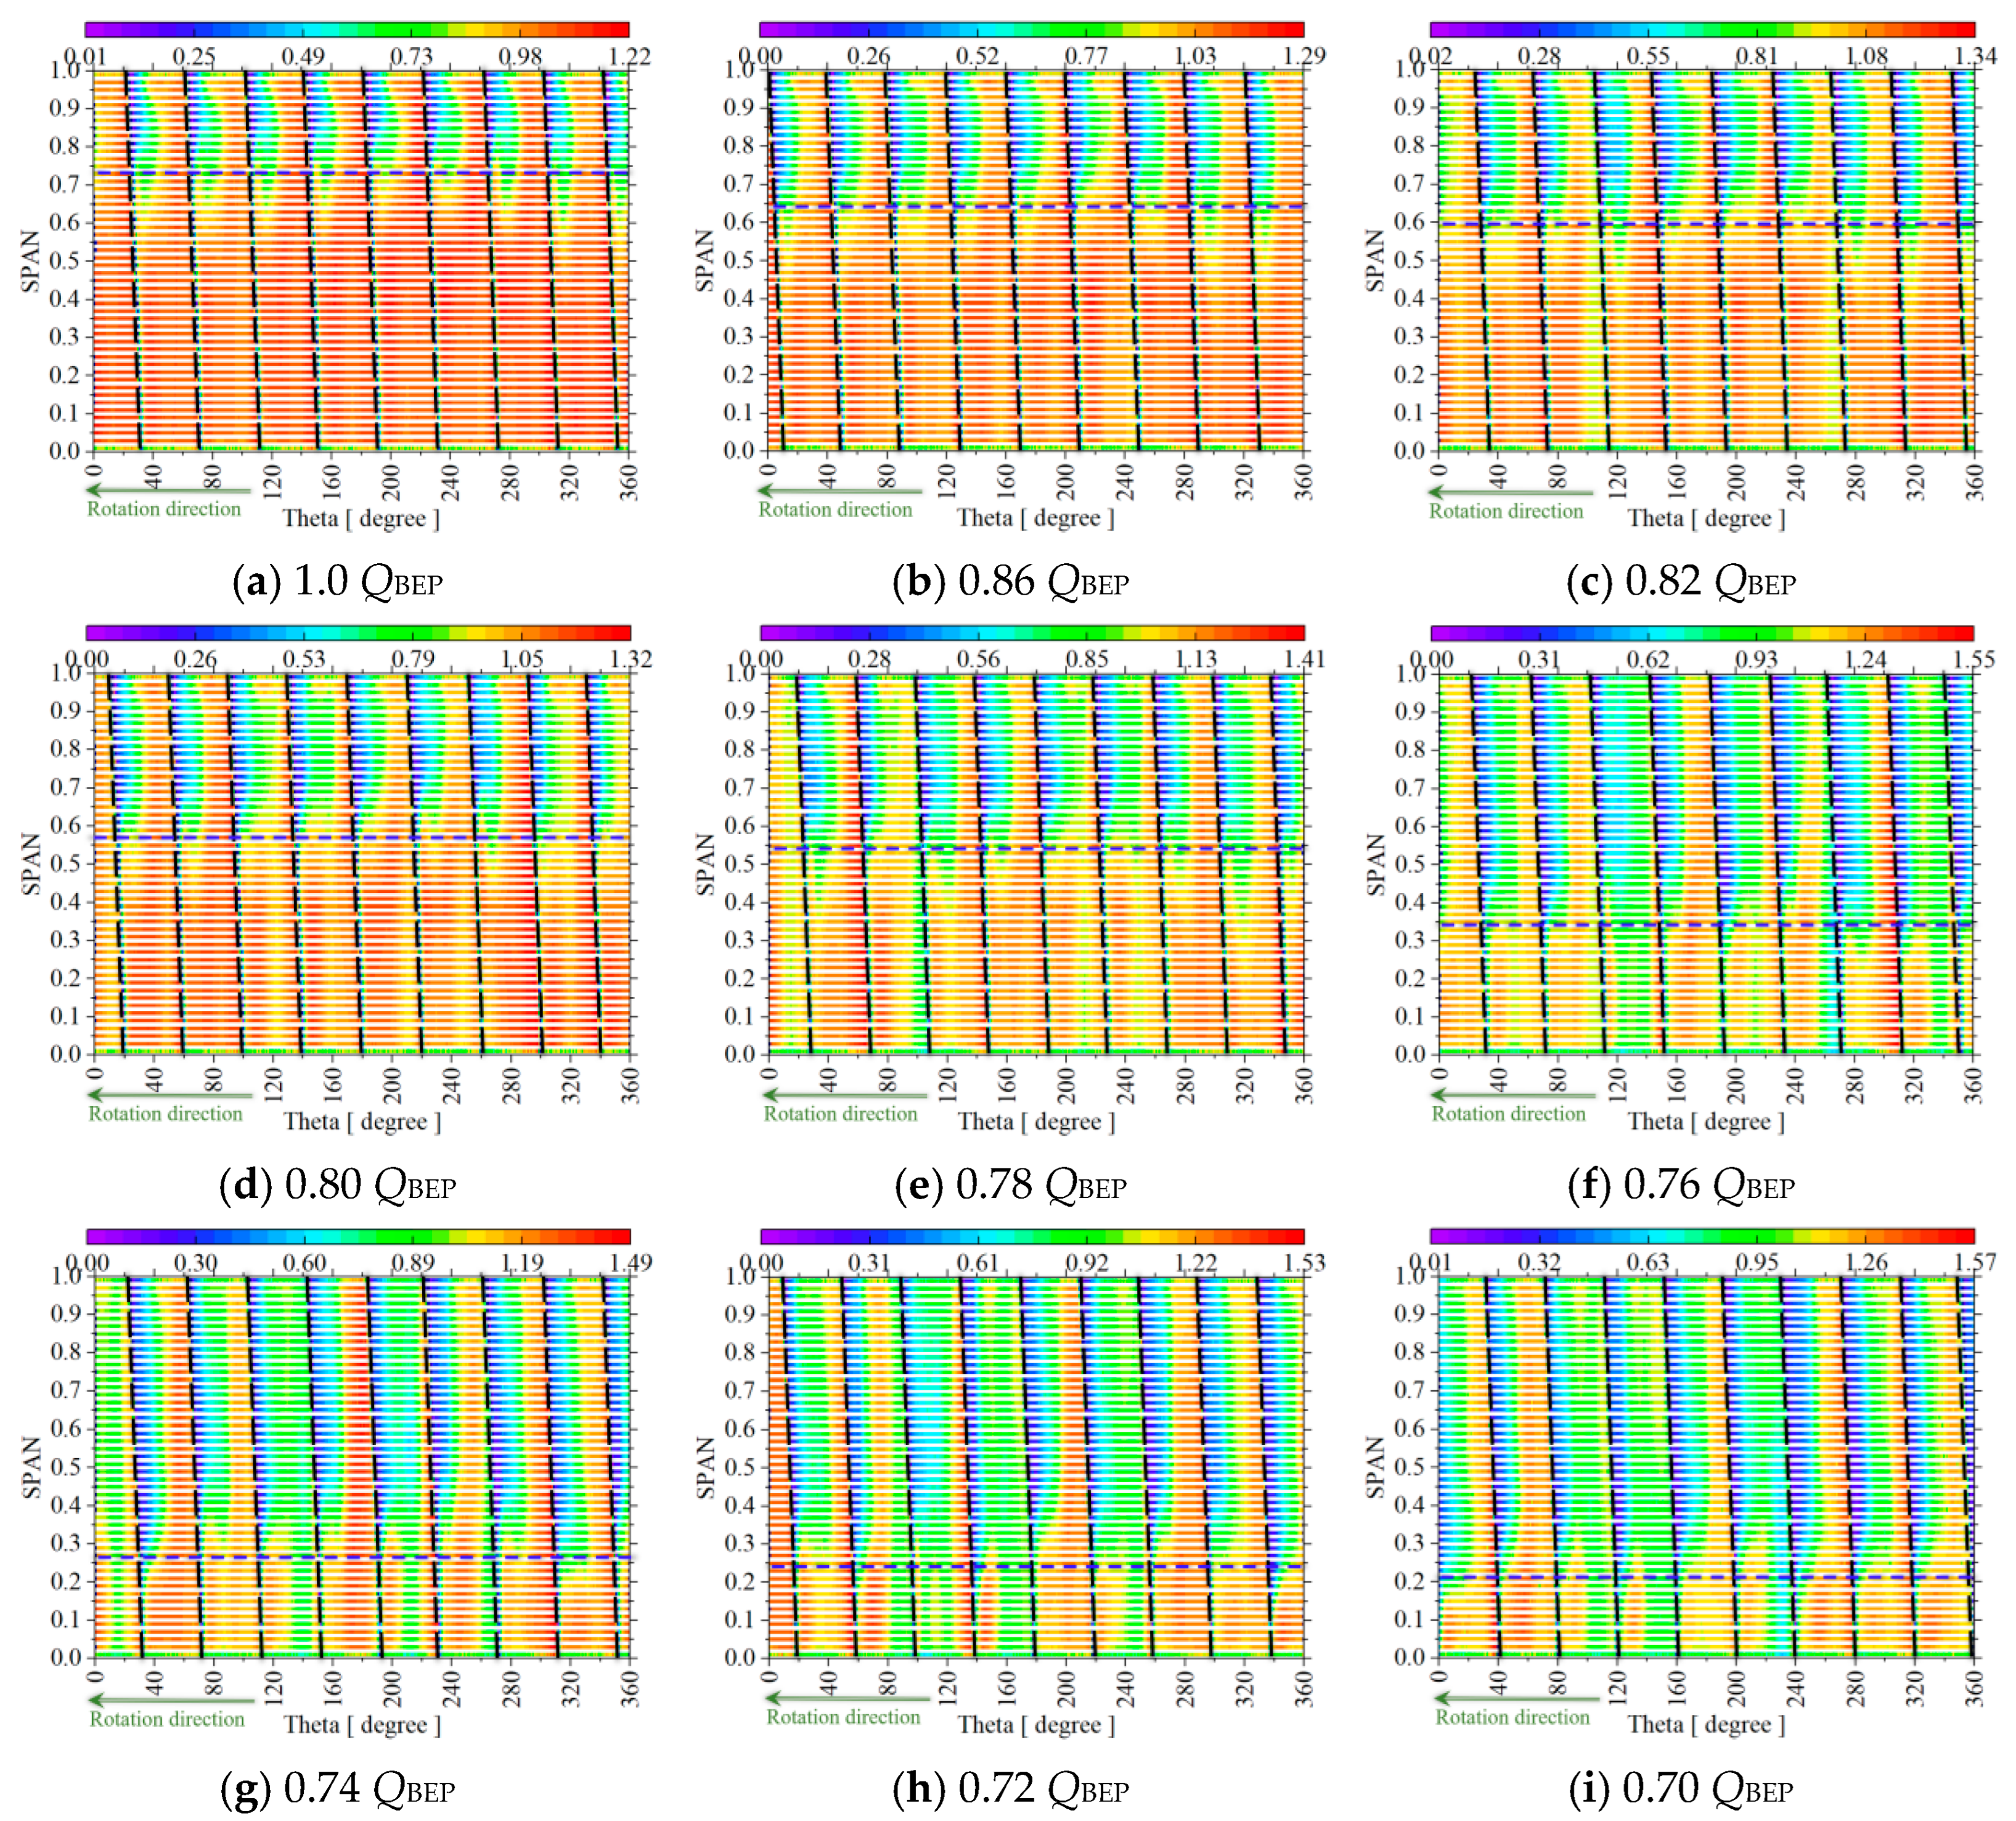
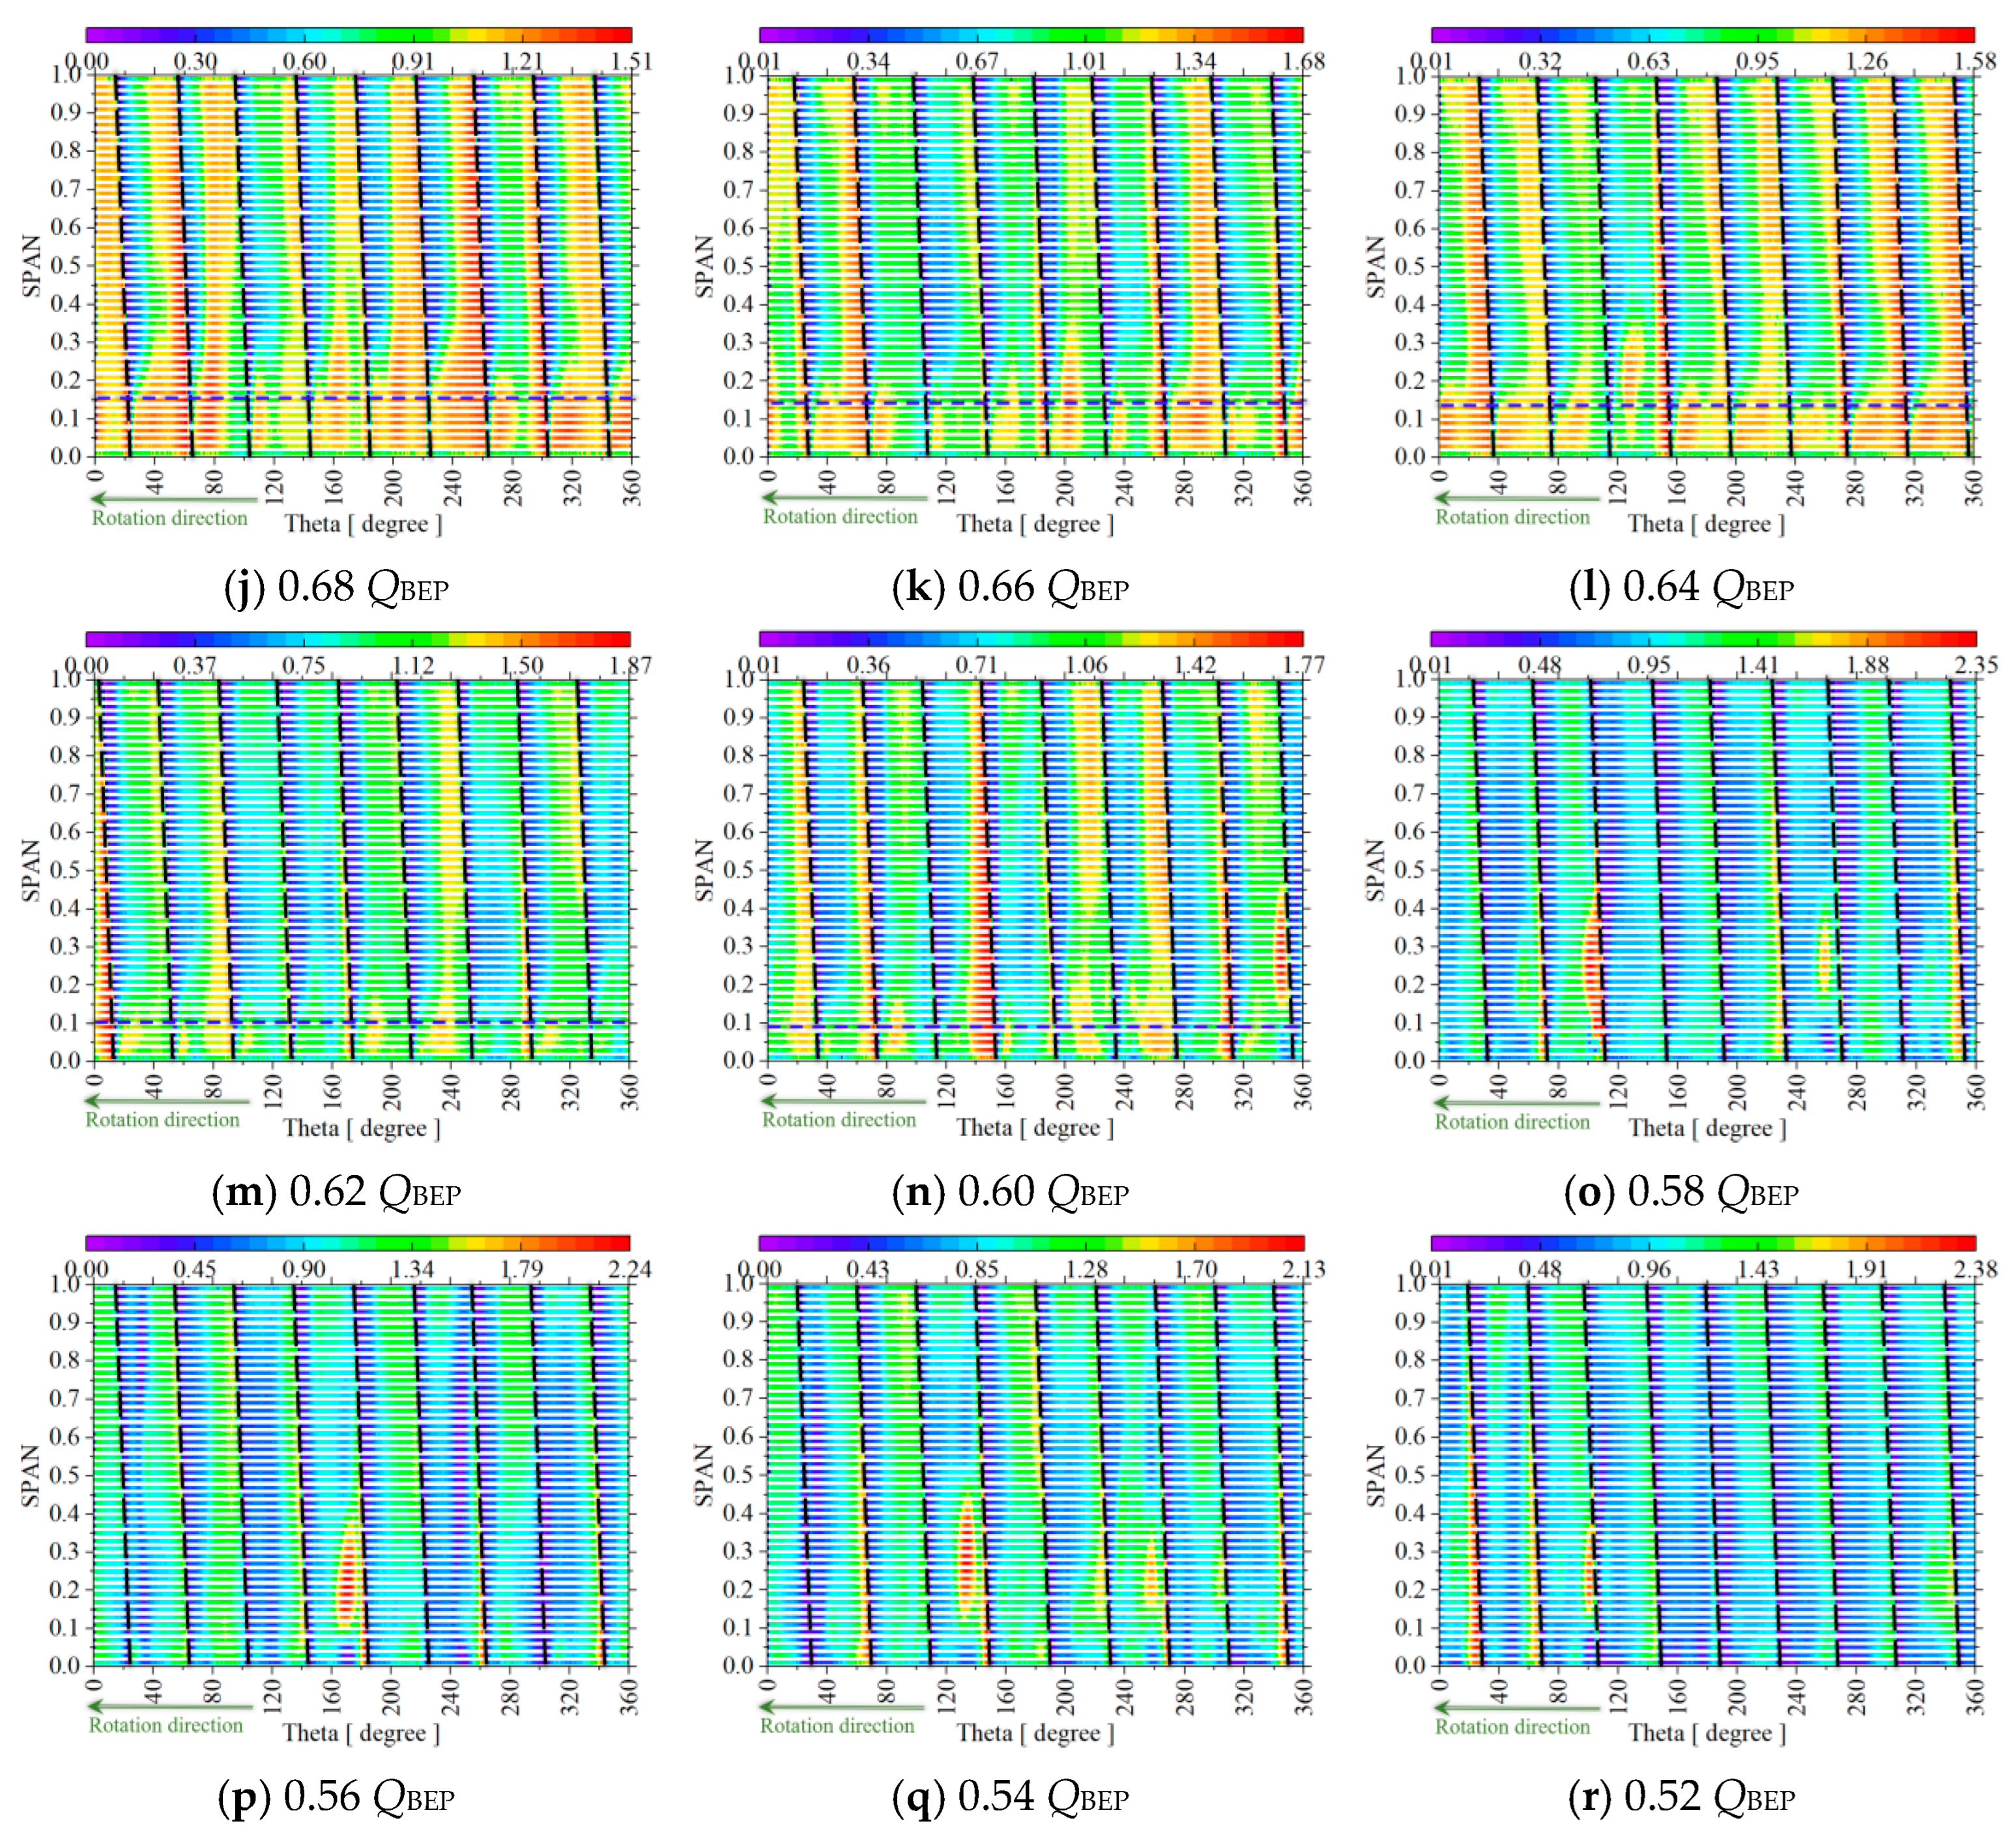
Figure 11 clearly shows the alternating phenomenon of “wake-jet-wake” between adjacent blades at the runner outlet. In the entire blade span height, the wake mainly exists in the range from the runner shroud to the medium blade span height. Similarly, the jet wakes for all operating conditions are analyzed, as shown in
Figure 12. Under the design condition, as shown in
Figure 12a, the wake area is concentrated near the impeller outlet near the front shroud, and the wake size and shape near each blade are similar. As the flow rate decreases, the circumferential coverage of the wake (hereinafter referred to as the wake length) does not increase significantly but gradually extends spanwise toward the rear shroud, with the wake size and shape near each blade remaining relatively similar. Starting from 0.60
QBEP, as the flow rate decreases, the wake rapidly extends spanwise and wake length increases rapidly, gradually covering the entire blade span height, and the low-speed wake area gradually covers the entire flow cross-section.
It can be seen that the flow separation generated on the guide vane surface when the runner jet and wake pass through is different. The wake is likely to cause a greater degree of flow separation and stall cell. The mechanism of RSI inducing stall inside the guide vane is analyzed below.
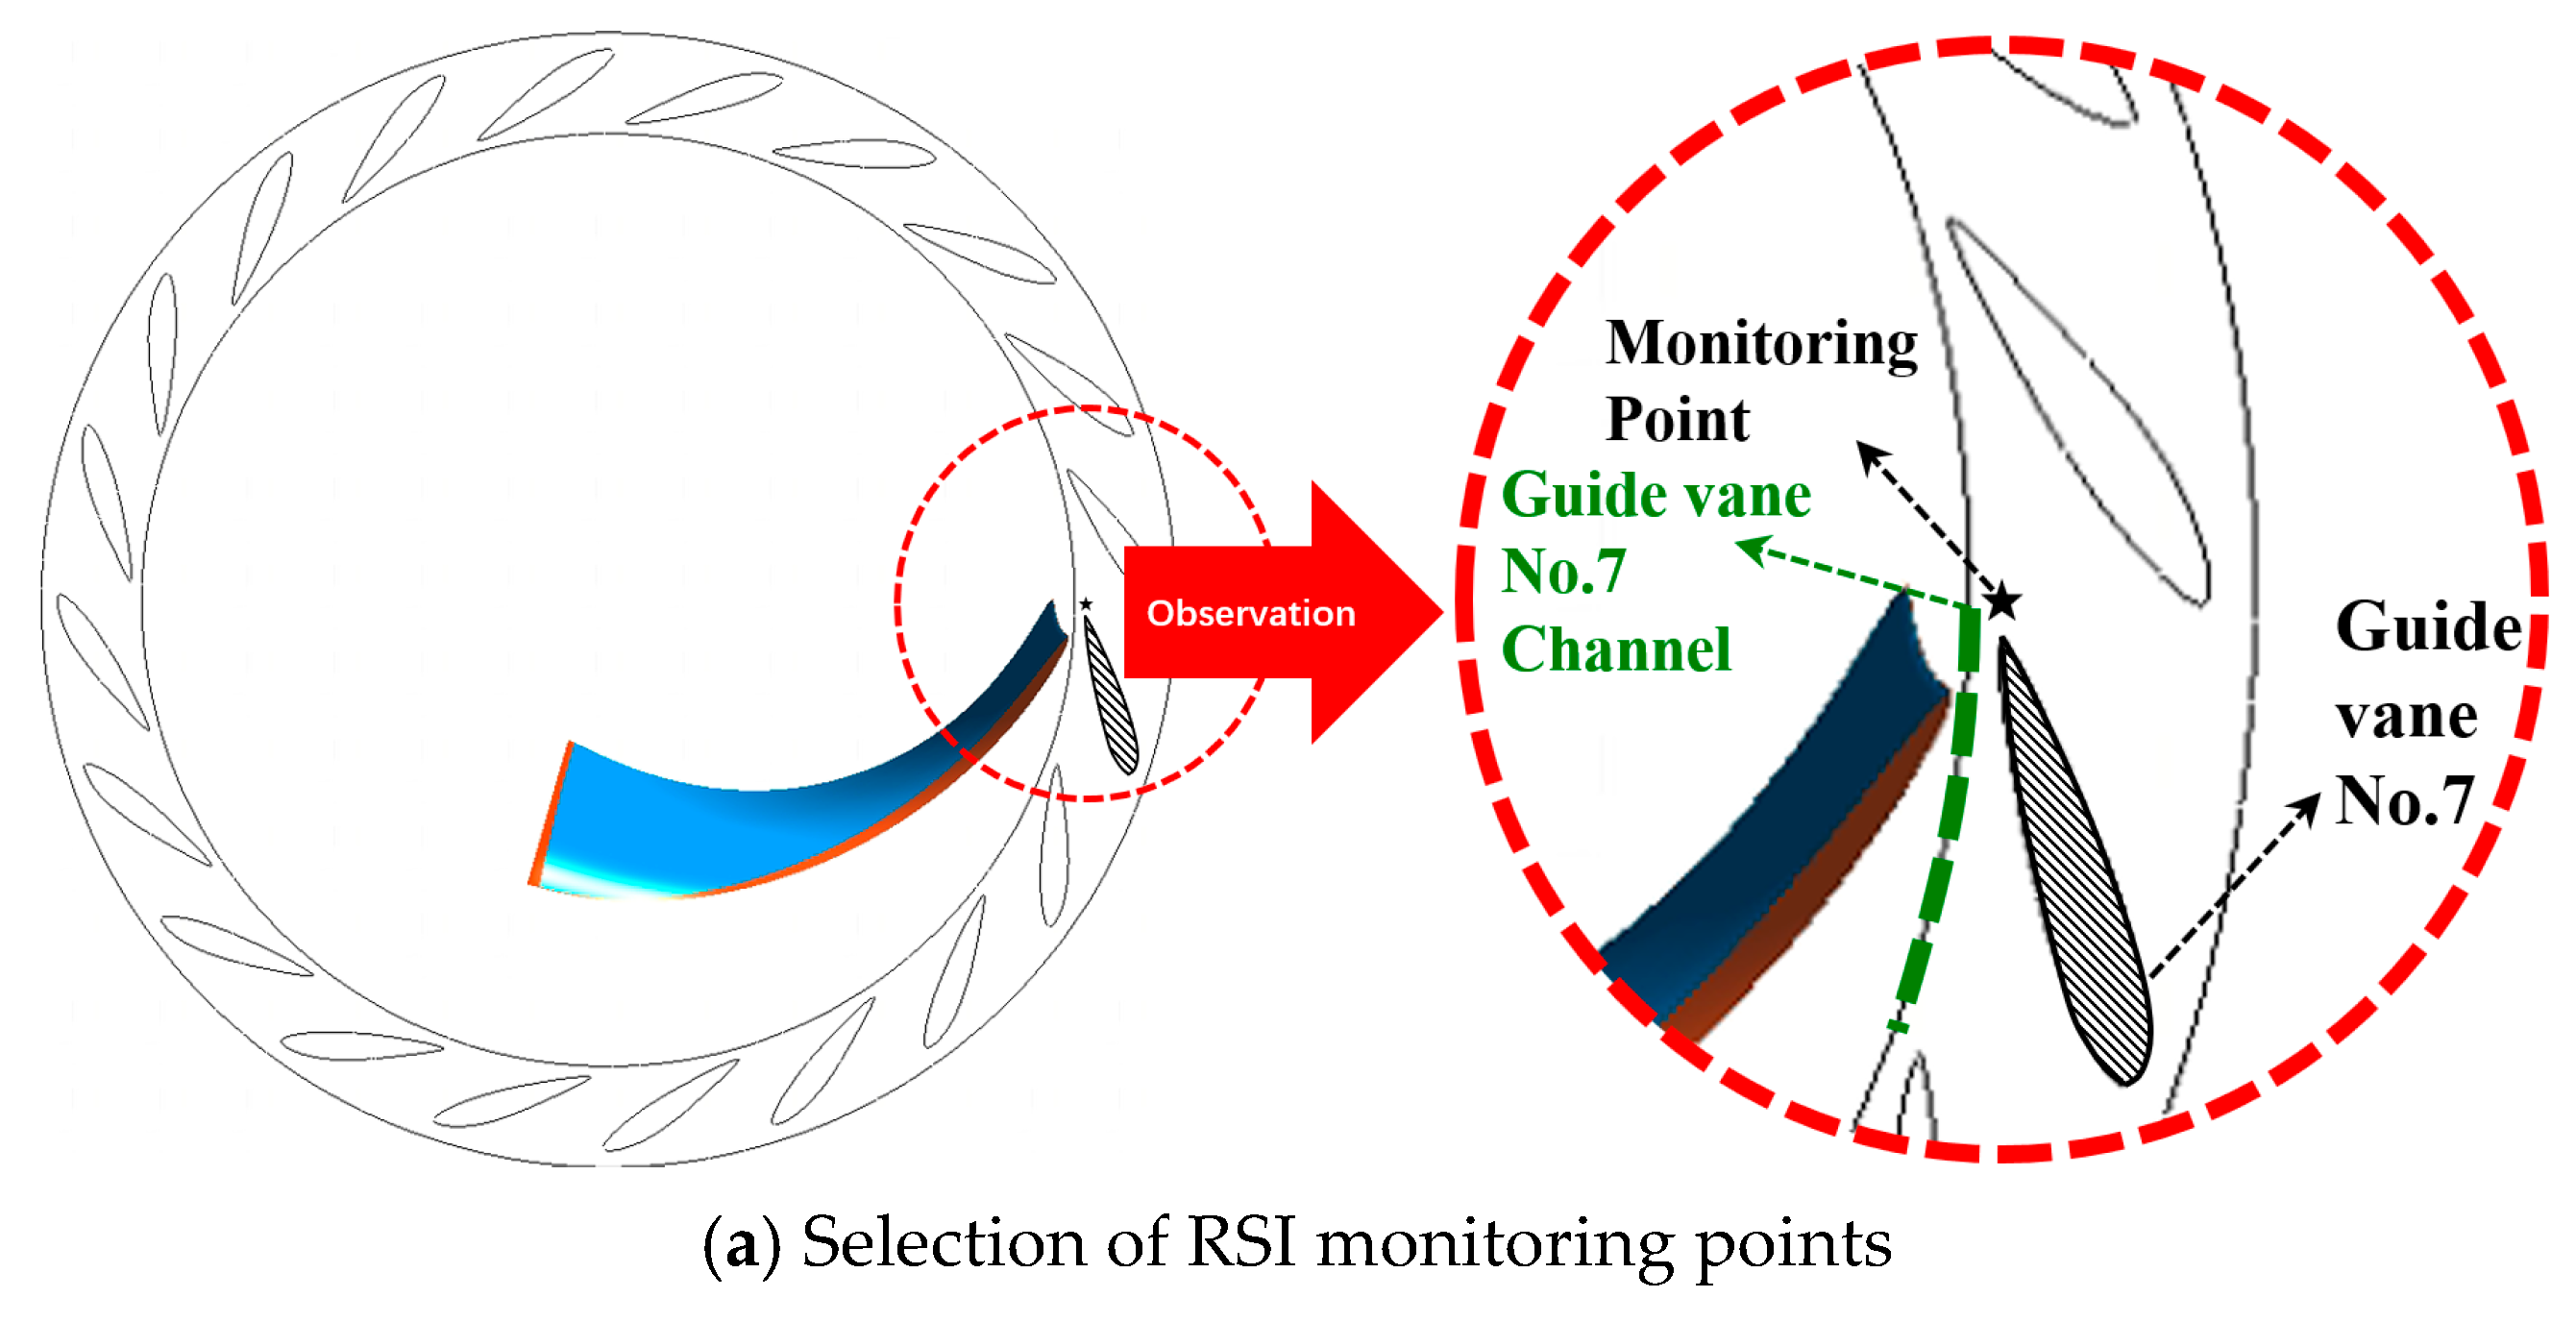
When the runner blade passes over any blade of the guide vane, the latter will interfere with the jet and wake at the runner blade once, respectively. By observing the inlet monitoring point of the active guide vane No. 7 as shown in
Figure 13a, it can be found that the change rules of the inflow angle φ, flow velocity, vorticity, pressure, and turbulence kinetic energy (TKE) at this position during one rotation of the runner are shown in
Figure 13b. The horizontal axis in the figure represents the entire time interval of the 9th rotation of the runner in the simulation calculation. During this process, the 9 runner blades passed the inlet of the guide vane No. 7 in turn, and the inflow angle φ at the monitoring point fluctuated periodically 9 times. The velocity, vorticity, pressure, and turbulent kinetic energy at the monitoring point all undergo the same periodic changes. The orange background area in
Figure 13b is enlarged as shown in
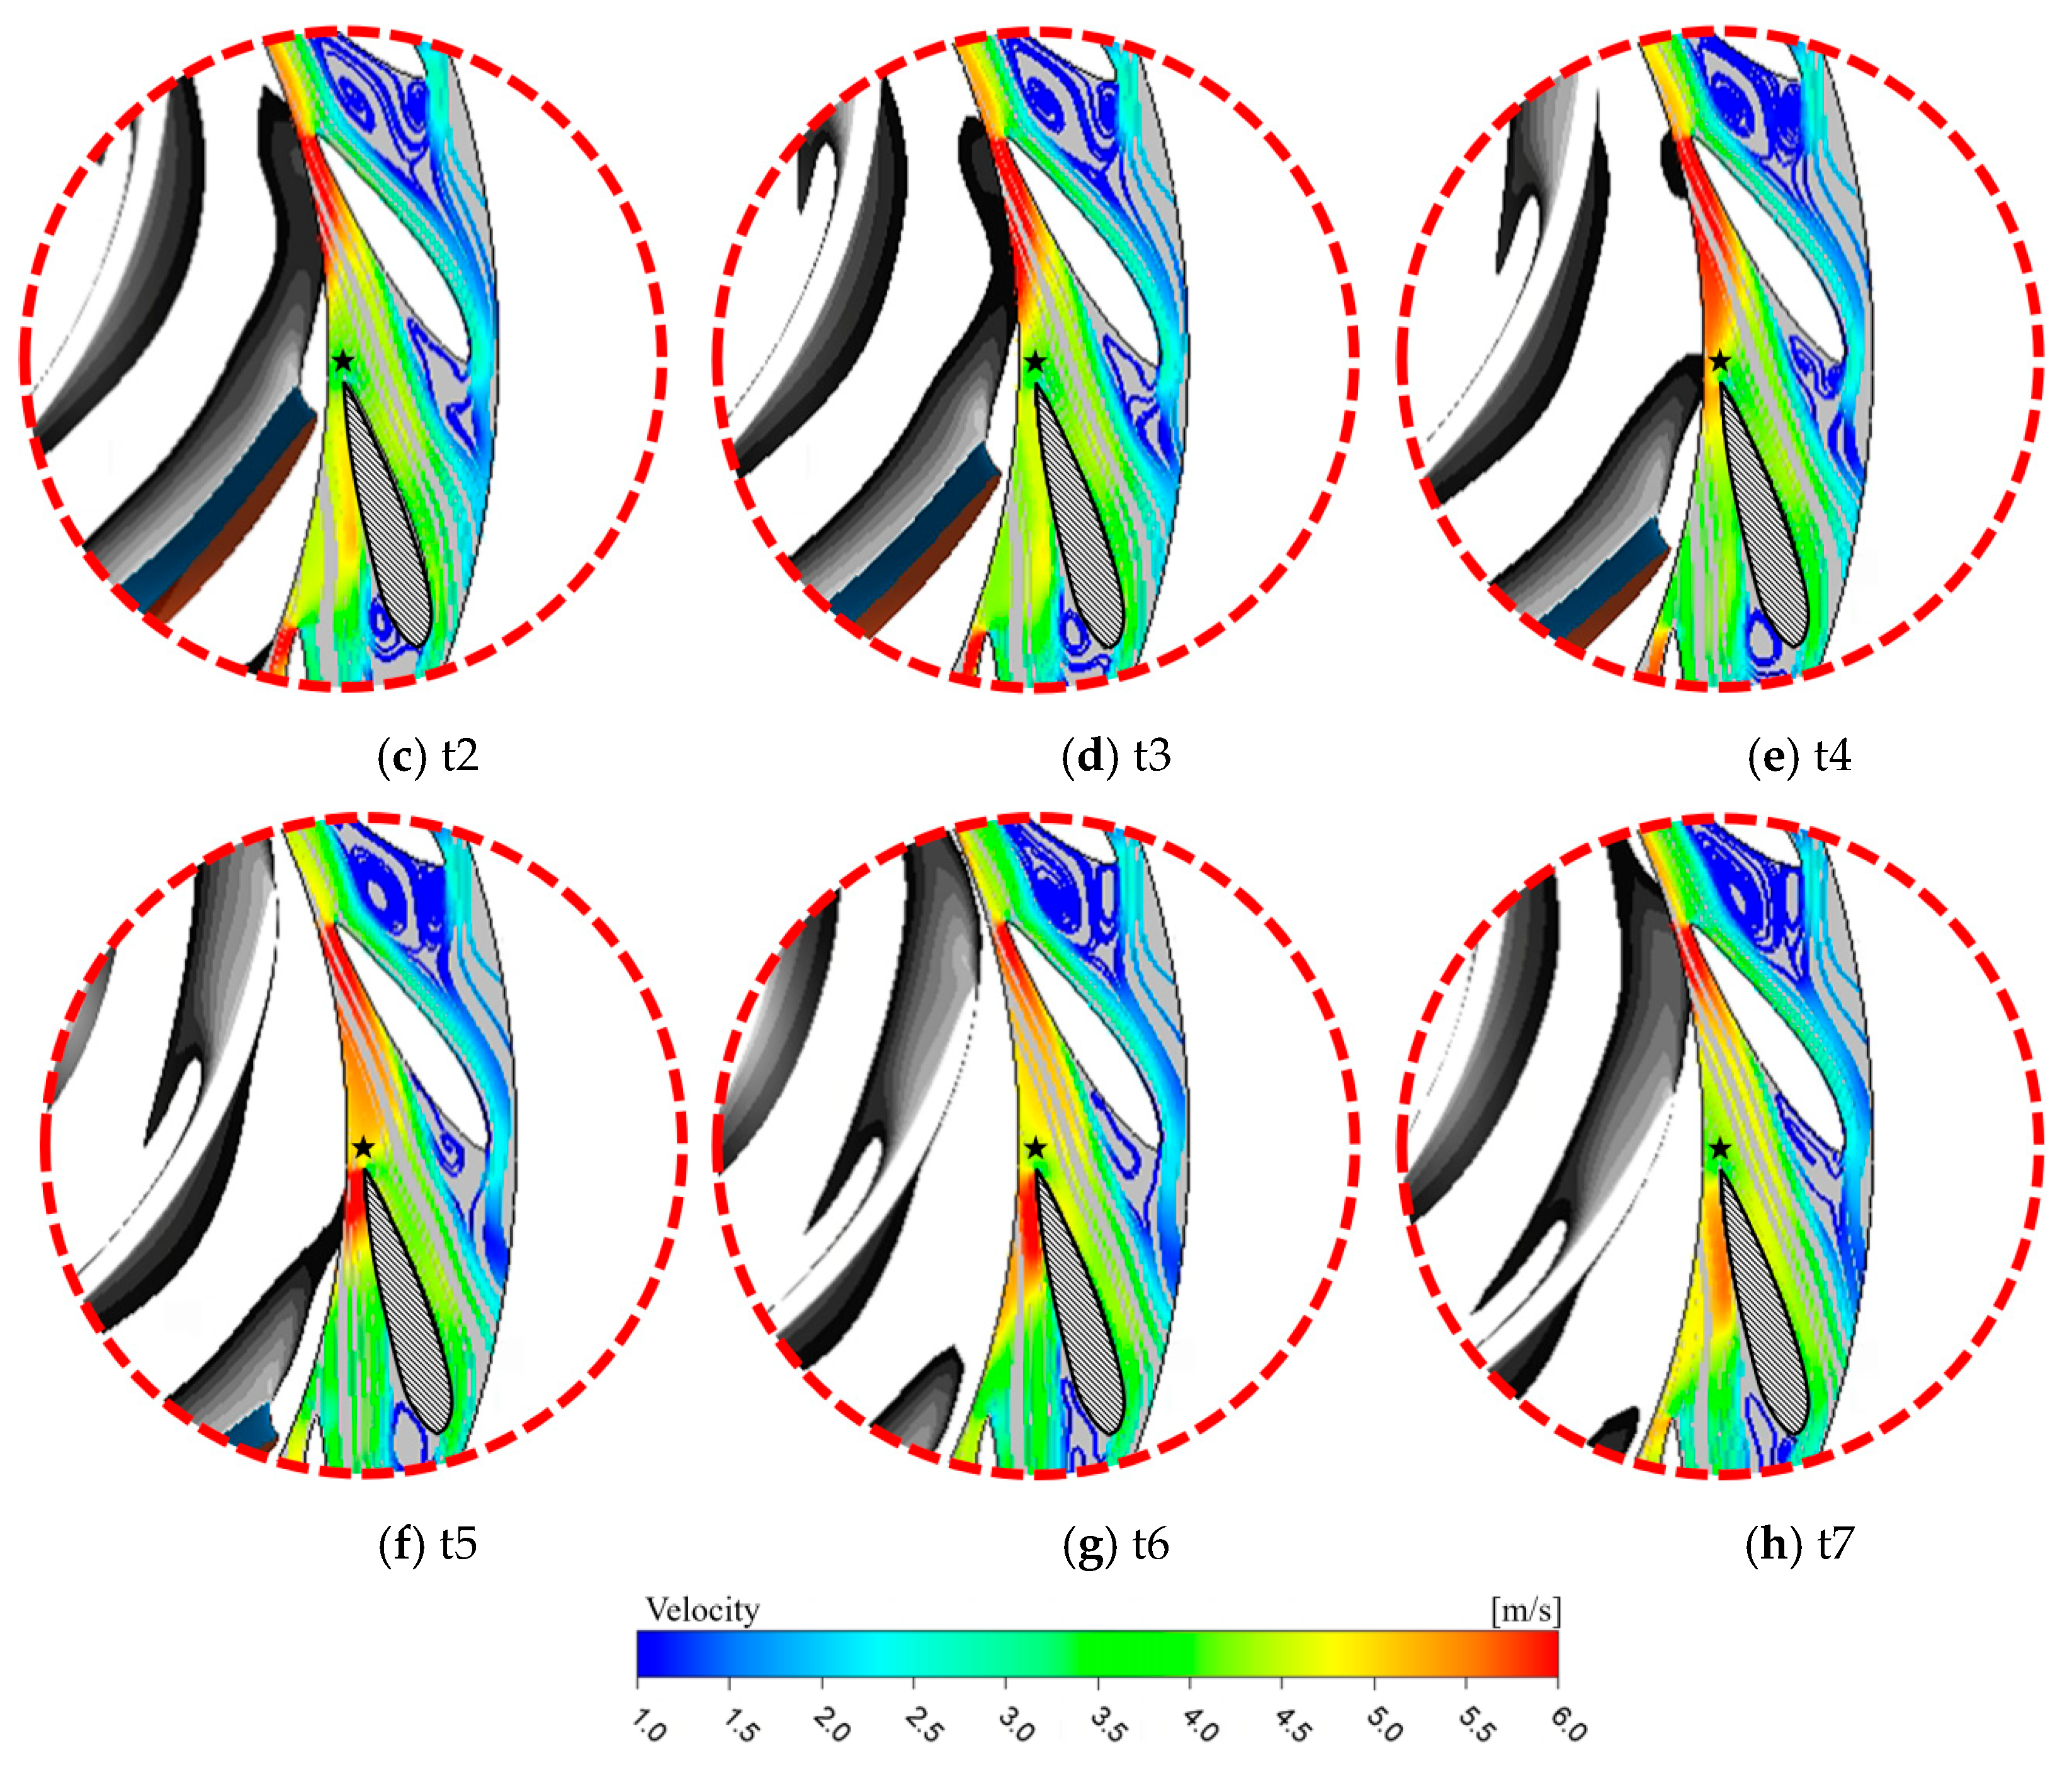
Figure 13c. Seven time points, t1–t7, are selected at equal intervals, and the positional relationship between the runner wake and the monitoring point in the wave cycle is analyzed as shown in
Figure 14.
Combining
Figure 13c and
Figure 14, it is found that at time t1, although the monitoring point is very close to the trailing edge of the runner blade, it is far away from the wake area of the blade. At this time, the monitoring point
φ takes the maximum value in the fluctuation cycle, and the flow velocity, vorticity, static pressure, and turbulent kinetic energy all take the minimum value; Starting from time t2, the wake area continues to approach the monitoring point as the runner blade rotates and completely covers the monitoring point at time t4. In this process,
φ at the monitoring point continues to decrease to the minimum value in the fluctuation cycle, while the pressure, vorticity, and turbulent kinetic energy continue to increase to the maximum value in the fluctuation cycle; from t5 to t7, the wake continues to move away from the monitoring point as the runner rotates, and the next runner blade wake is still far away from the monitoring point. At this time, the monitoring point is least disturbed by the wake. In this process,
φ continues to increase to the maximum value in the fluctuation cycle, and the flow velocity, vorticity, pressure, and turbulent kinetic energy continue to decrease to the minimum value in the fluctuation cycle. After time t7, the next runner blade wake will start a similar interference cycle for the monitoring point.
It can be seen that in one RSI cycle, the guide vane inlet undergoes a complete process of the runner blade wake from approaching to moving away. When the wake is closest, the flow angle at the monitoring point is the smallest, while the flow velocity, pressure, vorticity, and turbulent kinetic energy are the largest. When the wake is farthest, the flow angle at the monitoring point is the largest, while the flow velocity, pressure, vorticity, and turbulent kinetic energy are the smallest. This rule can be clearly observed in all 9 RSI fluctuation cycles in
Figure 13b.
Since the wake area has the characteristics of high vorticity and high turbulent kinetic energy, the vorticity and turbulent kinetic energy at the monitoring point increase and decrease when the wake approaches and moves away. When the low-velocity wake area approaches, the velocity at the inlet of the guide vane increases. The reason is analyzed as shown in
Figure 9b. The subscript
W in the figure represents the wake, and the red line and the yellow line represent the velocity triangles of the non-wake area and the wake area at the runner outlet, respectively. The relative velocity
WW of the wake is smaller than the
W in the non-wake area, and the directions of the two are close. When the wake approaches the guide vane, the
VW formed is larger than the
V of the non-wake, and the inflow angle
φW is smaller. A larger inflow angle
θW is formed at the inlet of the guide vane, which is more likely to cause stall. In
Figure 13b, the 9 red circles on the
φ-
t curve mark the moments when the wakes of each runner blade sweep across the monitoring point. At these moments, a higher flow velocity (about 5 m/s) and a smaller inflow angle (about 8°) are formed at the inlet of the guide vane No. 7, and stall is more likely to occur at these moments than at any other time.
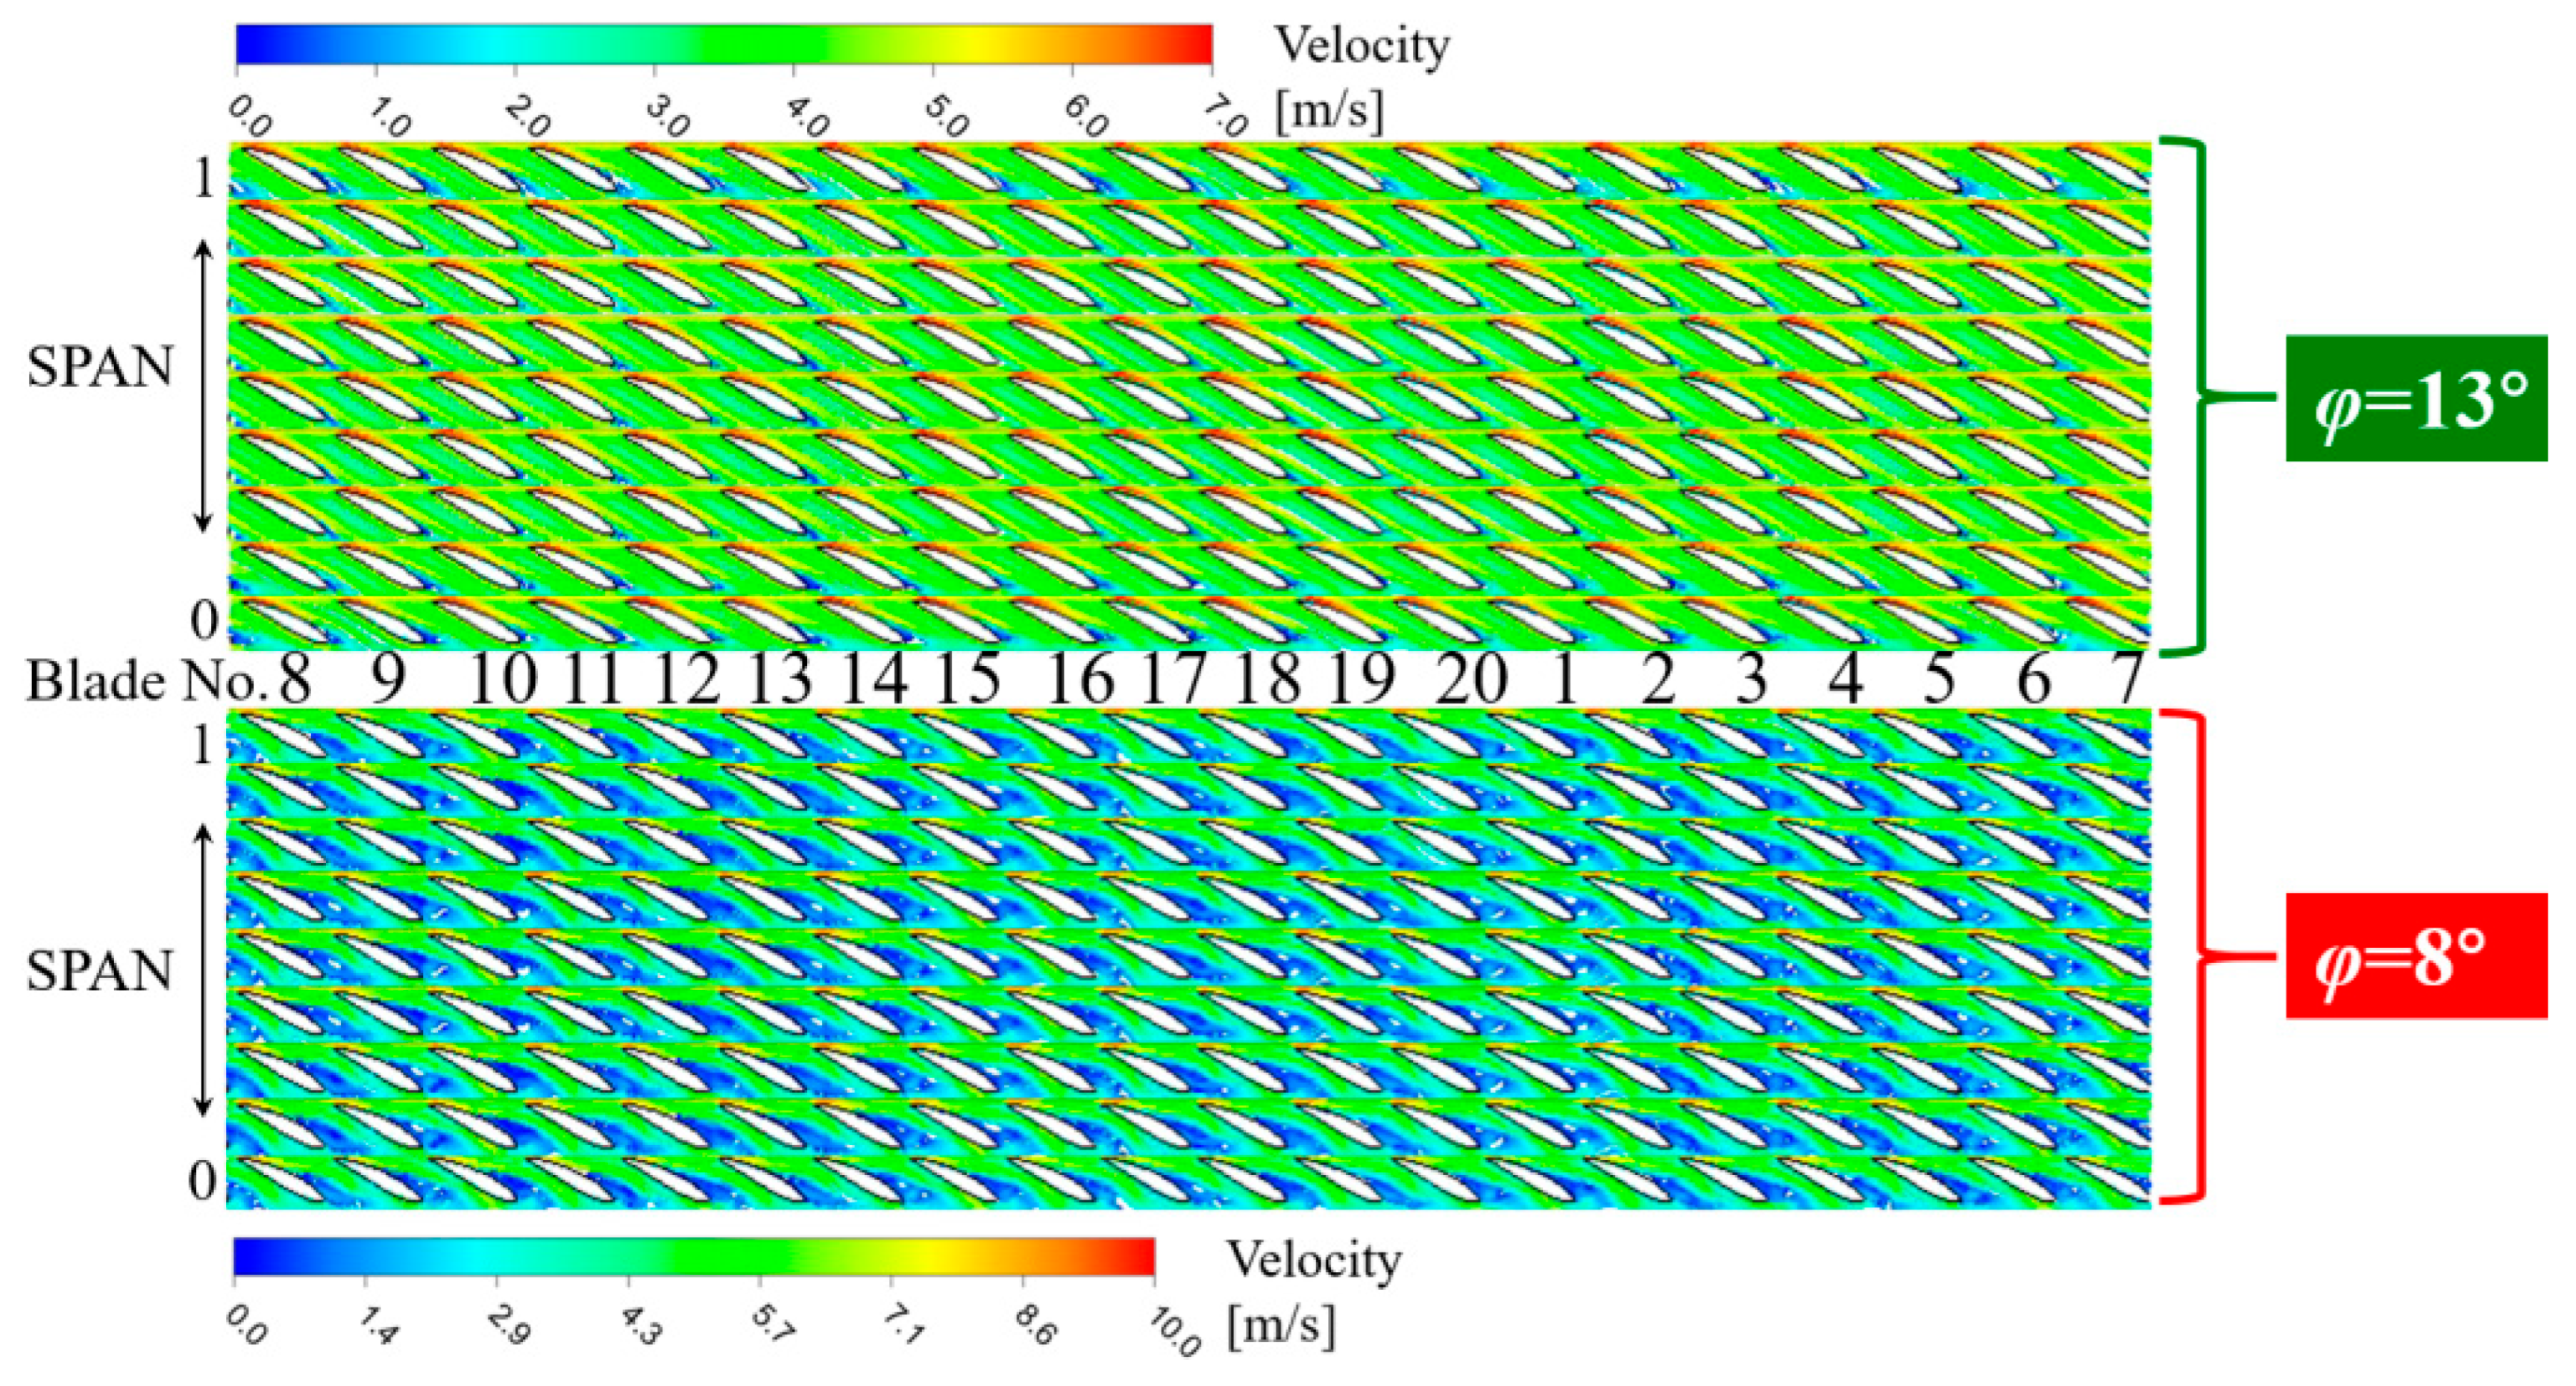
Figure 14 shows that the suction surface of the guide vane No. 7 has stalled. The dark blue vortex representing the stall is clearly visible. In order to analyze the role of RSI in the stall formation, steady flow simulation analysis of the guide vane is performed separately. Under the flow rate of 5 m/s, the flow pattern in the guide vane is calculated using the inflow angles of
φ = 13° and
φ = 8°, respectively, and the results are shown in
Figure 15. When the inflow angle
φ = 13°, there is almost no stall inside the annular grid. When the inflow angle
φ = 8°, a serious stall occurs inside the annular grid.
It can be seen that RSI is an important cause of stall. When the runner wake passes the inlet of the guide vane, the inflow angle is the smallest and the inflow velocity is the largest, and stall is most likely to occur. The stall in the guide vane is formed, maintained and, enhanced under the action of RSI. At any time, each blade of the guide vane is always in different stages of RSI, namely under different inflow conditions. Therefore, the stall degree in each flow channel of the guide vane is always different at any time. RSI is one of the important reasons why the stall conditions of each flow channel of the guide vane are different.
3.2. Effect of the Jet and Wake on Stall Rotation
Stall inside the guide vane often rotates around the pump-turbine shaft. Specifically, the stall cell in one flow channel slowly moves to the adjacent flow channel, which is the phenomenon of rotating stall. Under low-flow conditions, the high-amplitude low-frequency pressure pulsation caused by rotating stall is the main pressure pulsation component in the pump-turbine. In severe cases, it will not only cause abnormal noise but may also couple with the natural frequency of the pump-turbine system to cause system resonance, threatening system safety.
Under the 0.74
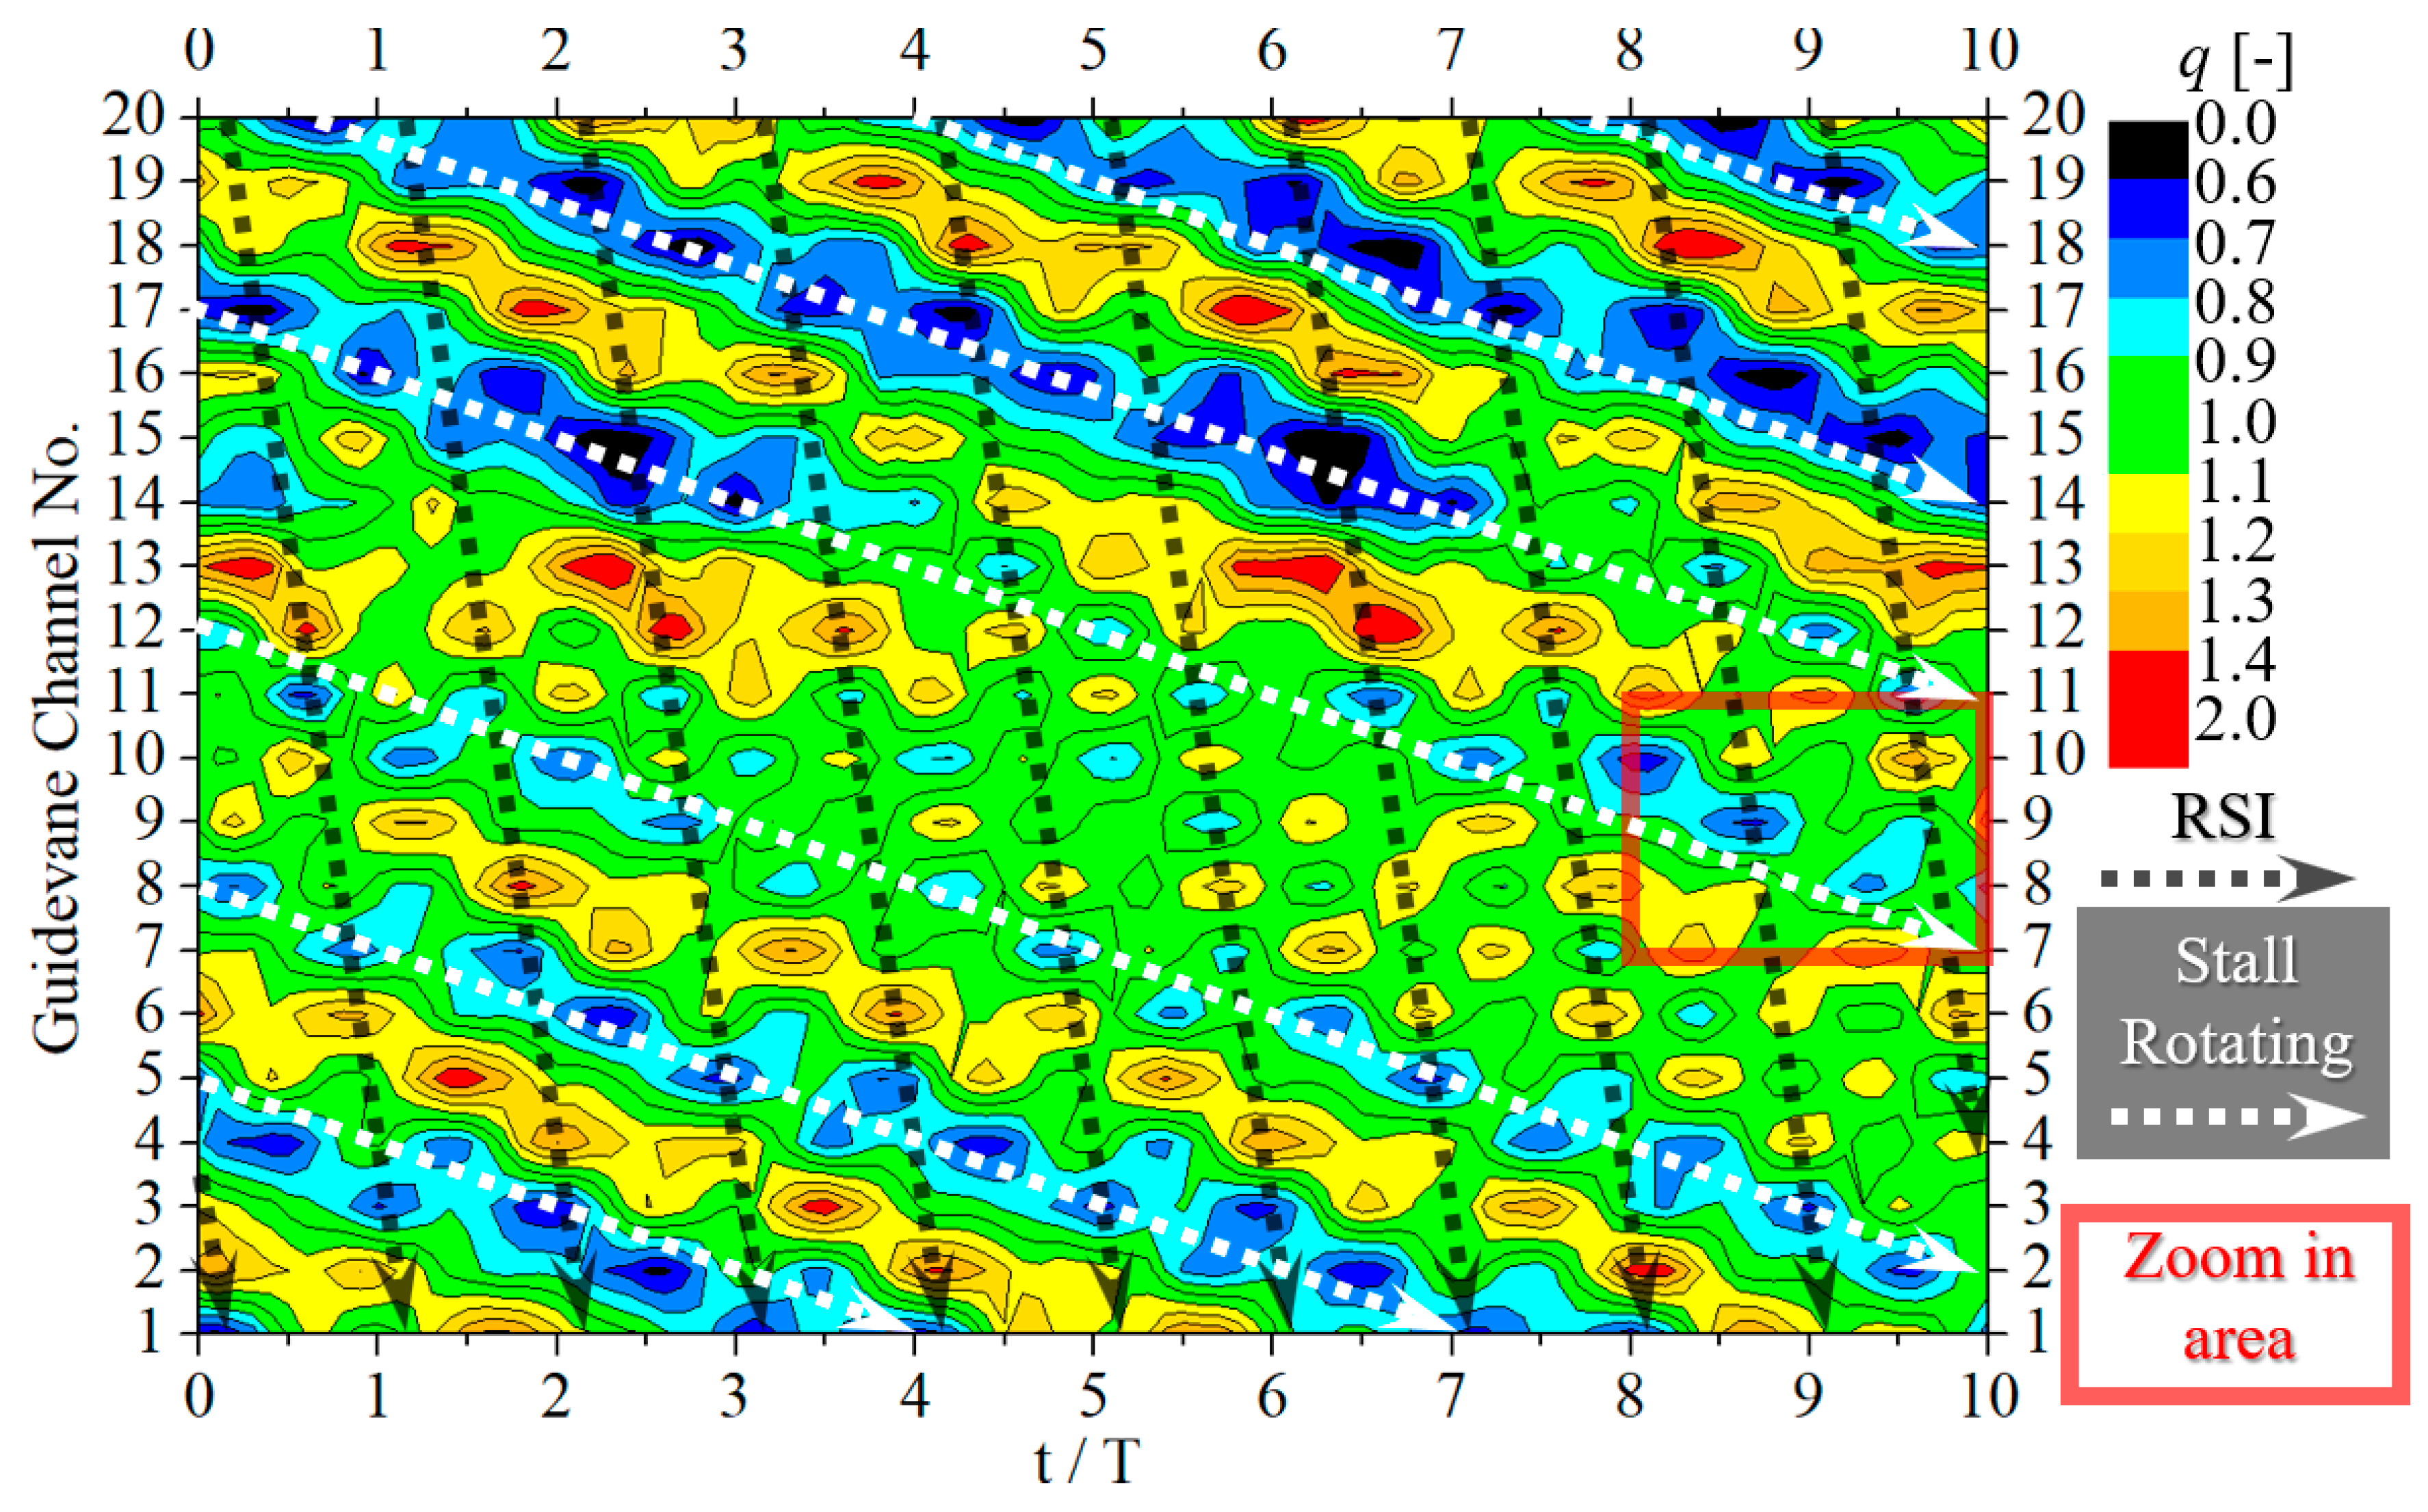
QBEP condition, the change in the inlet flow coefficient q of each flow channel in the guide vane is analyzed as shown in
Figure 16 (the definition of the inlet position is shown in
Figure 13a). The definition of q in
Figure 13a is shown in the following formula:
where
Qi represents the average flow rate in the
i-th flow channel of the guide vane,
Q represents the flow rate in the entire guide vane, and
Zg represents the vane number of the guide vane. The horizontal axis in the figure is the time interval of 10 revolutions of the runner, and the vertical axis represents all 20 flow channels of the guide vane. Different colors represent the flow coefficient q of the flow channel at that moment, and the black dotted line marks the RSI trajectory of the 9 blades of the runner. As can be seen from
Figure 13a, the degree of flow smoothness in each flow channel at any time is different. If the dimensionless parameter q is less than 1, it means that the flow velocity here is lower than the average flow velocity; otherwise it is higher than the average flow velocity. The smaller q is, the more unsmooth the flow is. There is a serious stall in the low-q region from light blue to black, and the flow in the high-q region of yellow and red is relatively smooth. The stalled flow channel and the non-stalled flow channel are distributed alternately, and the stalled flow channel keeps moving over time. The white dotted lines in the figure mark the movement of the five larger stall cells. The white dotted line in the lower left corner shows that during the 4-cycle rotation of the runner, the corresponding stall cell moves from flow channel 5 to flow channel 1. It can be estimated that the moving speed of the stall cell is (5 − 1)/20/4 = 0.05; that is, the rotation frequency of the stall cell is 0.05 times the shaft frequency, and the rotation direction is the same as the runner direction (the runner blades also rotate from blade No. 20 to blade No. 1).
The area in the red box in
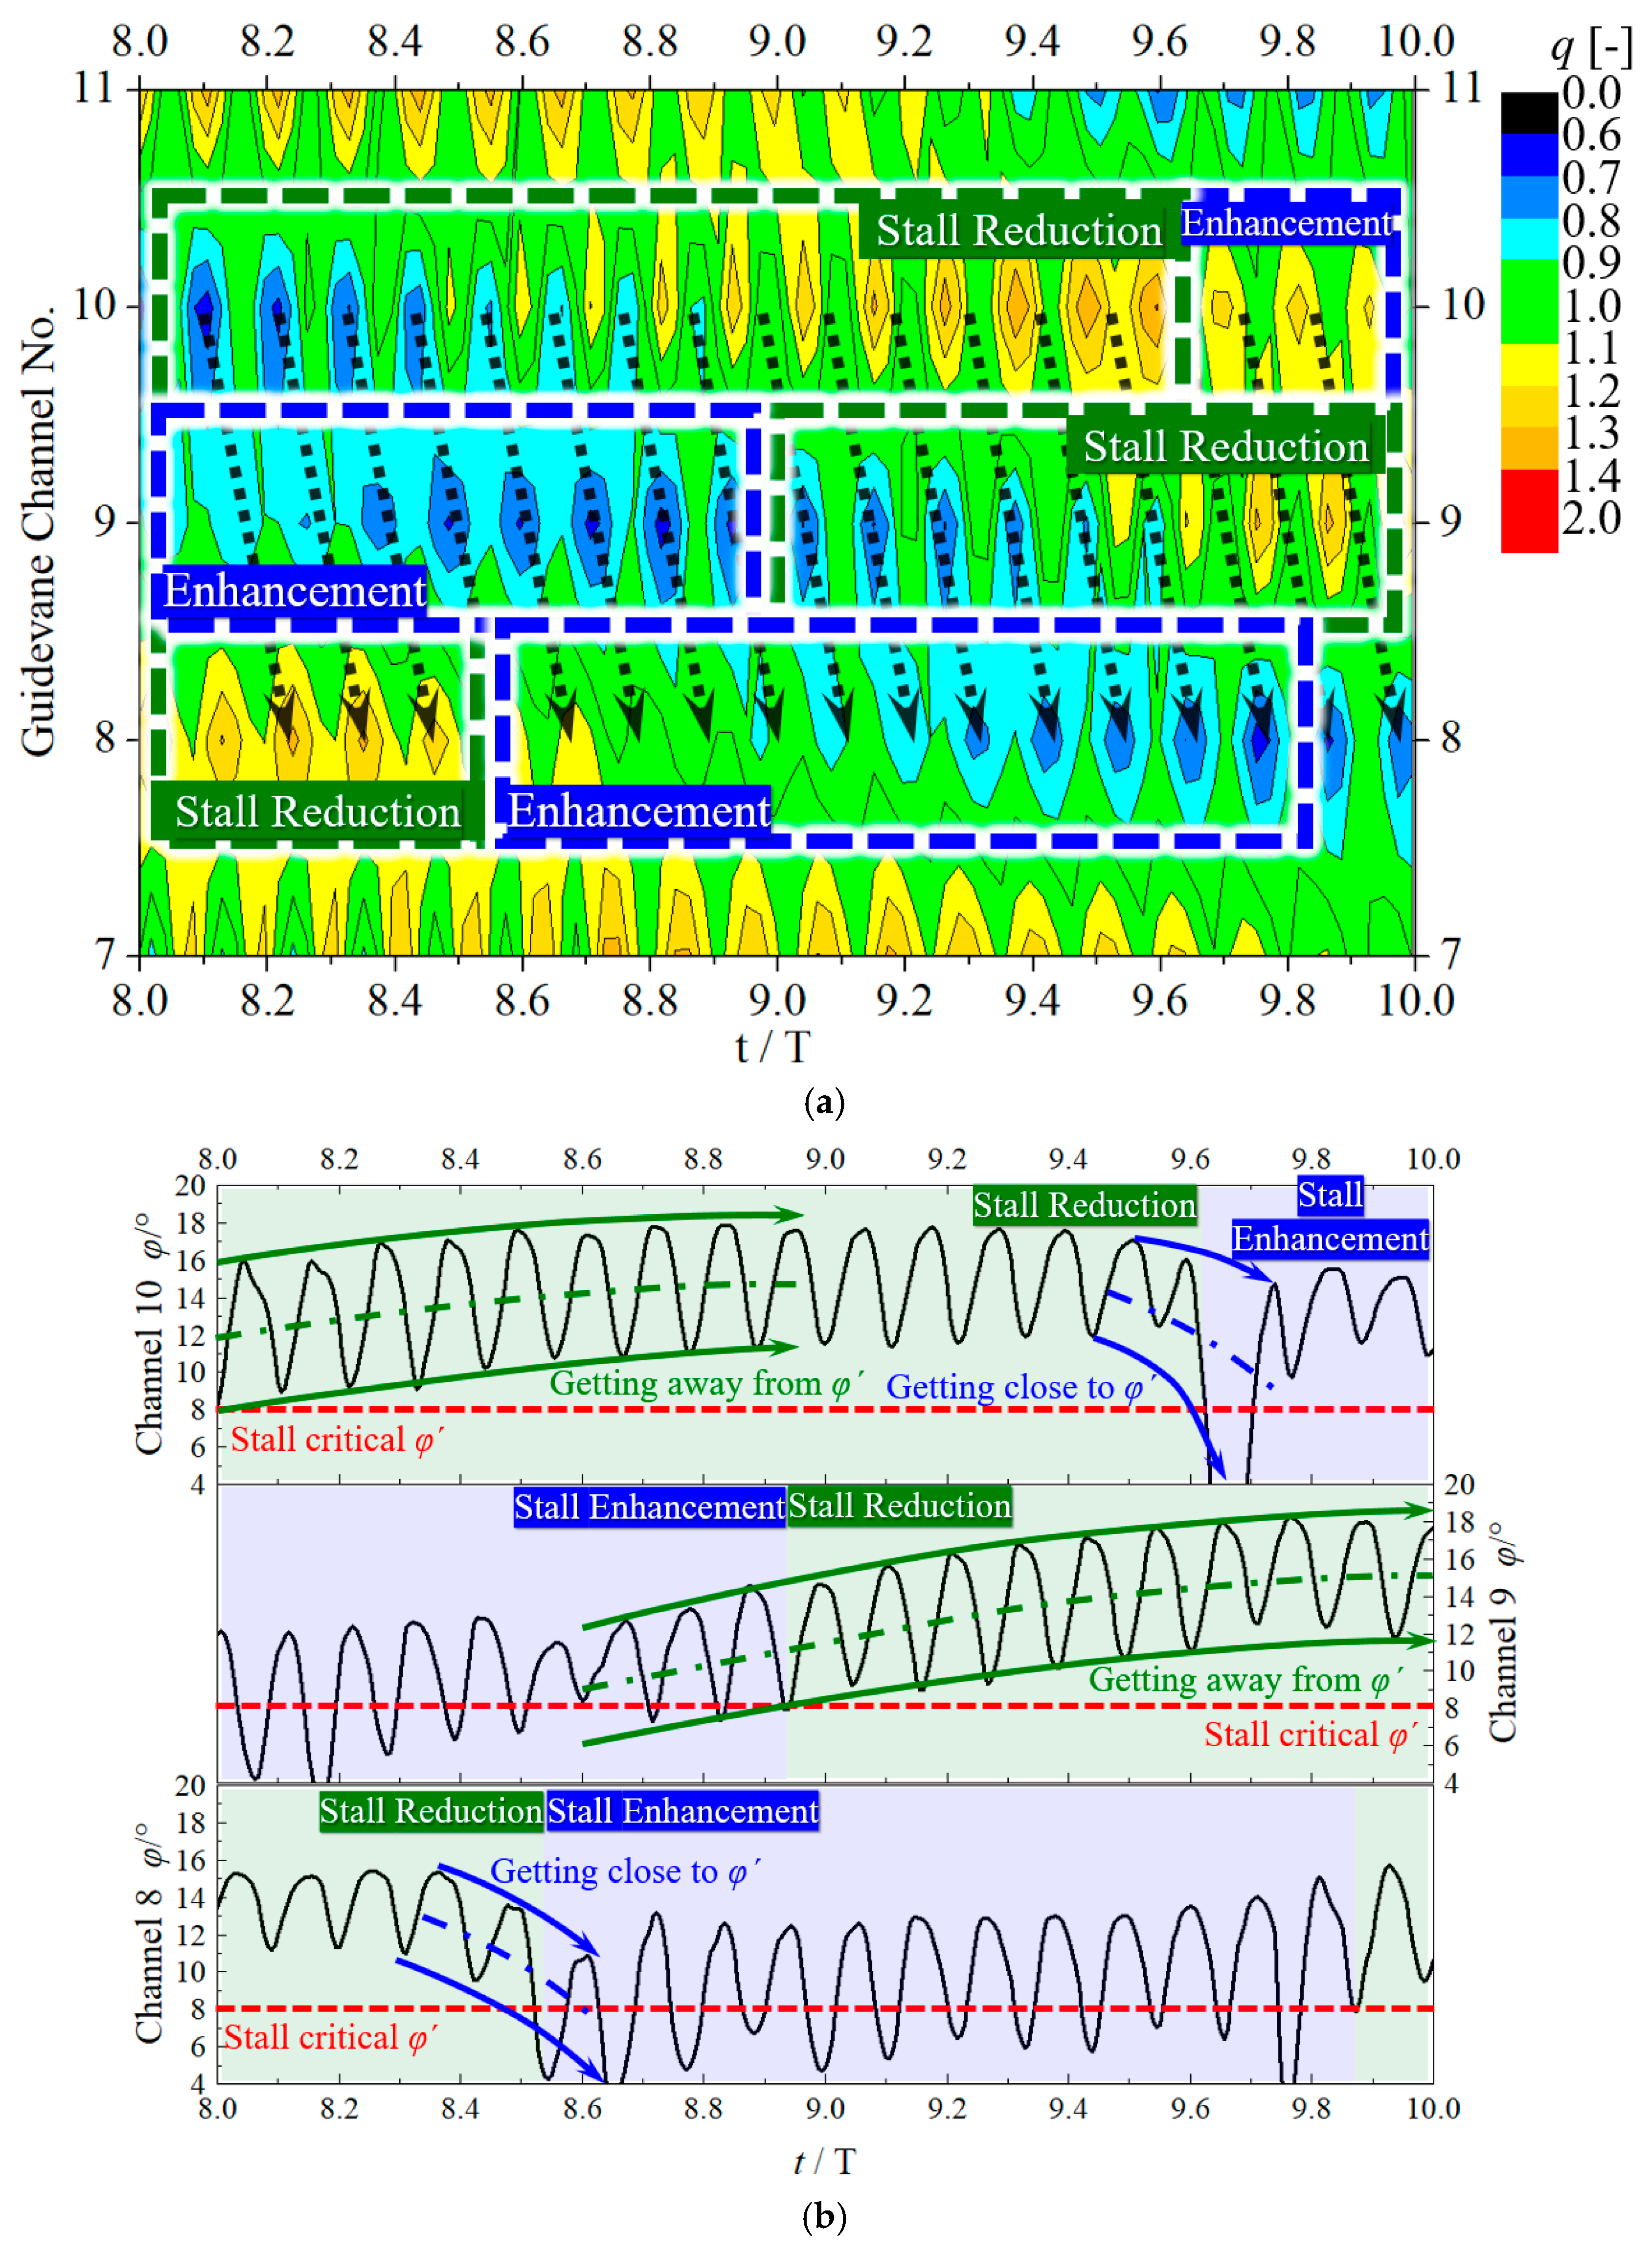
Figure 16 is enlarged as shown in
Figure 17a. The blue dashed box in the figure indicates the area where the stall degree increases, and the green dashed box indicates the area where the stall degree decreases.
Figure 17b shows the time variation in the average inflow angle
φ at the inlet of the guide vanes No. 8, 9, and 10 flow channels in the corresponding period of
Figure 17a. At the initial time of 8.0 T, according to q, it can be seen that there is a serious stall in the No. 10 and No. 9 flow channels, and the flow in the No. 8 flow channel is normal. During the period of 8.0–8.53 T, the inflow angle
φ of the No. 9 flow channel is lower than the critical inflow angle
φ′ of the stall. According to q, the stall degree in the flow channel is increasing. Affected by the stall of flow channel No. 9,
φ of flow channel No. 10 continues to increase and move away from
φ′, and the degree of stall inside the flow channel continues to weaken. At the same time, the
φ of the No. 8 flow channel continues to decrease and approaches
φ′, and q shows a decreasing trend during the period, indicating that stall initiation occurred. During the period of 8.53–9.0 T, affected by the severe stall of the No. 9 flow channel, the
φ of the No. 8 flow channel continues to drop below
φ′, the internal stall degree increases rapidly and begins to react on the No. 9 flow channel. During this period,
φ of flow channel No. 9 begins to rise but is still slightly lower than
φ′, and the internal stall degree increases at a slower rate than in the previous period. Affected by the stall of flow channel No. 9, the
φ of flow channel No. 10 continues to increase and is farther and farther away from
φ′, and the degree of internal stall continues to weaken. During the period of 9.0–9.8 T, the
φ of flow channel 8 remains lower than
φ′ and slowly increases, and the internal stall degree continues to increase. As a result, the
φ of flow channel No. 9 is greater than
φ′ and continues to increase, the internal stall enters a continuous weakening stage, and the impact on channel No. 10 is becoming weaker and weaker. At 9.6 T, the No. 10 flow channel began to show a phenomenon of φ lower than
φ′ due to the stall of the upstream No. 11 flow channel, and the internal stall increased. The
φ′ value is obtained by performing a uniform flow calculation on the guide vane alone.
It can be seen that in the period of 8.0–10.0 T, the stall cell in the guide vane weakened in the No. 10 flow channel and strengthened in the No. 9 flow channel to complete the first rotation. After that, the flow weakens in the No. 9 flow channel and strengthens in the No. 8 flow channel, completing the second rotation. Each stall rotation starts with the stall of the downstream flow channel due to the increase in the stall in the upstream flow channel and ends with the stall of the upstream flow channel being weakened and disappearing due to the continuous increase in the stall in the downstream flow channel.
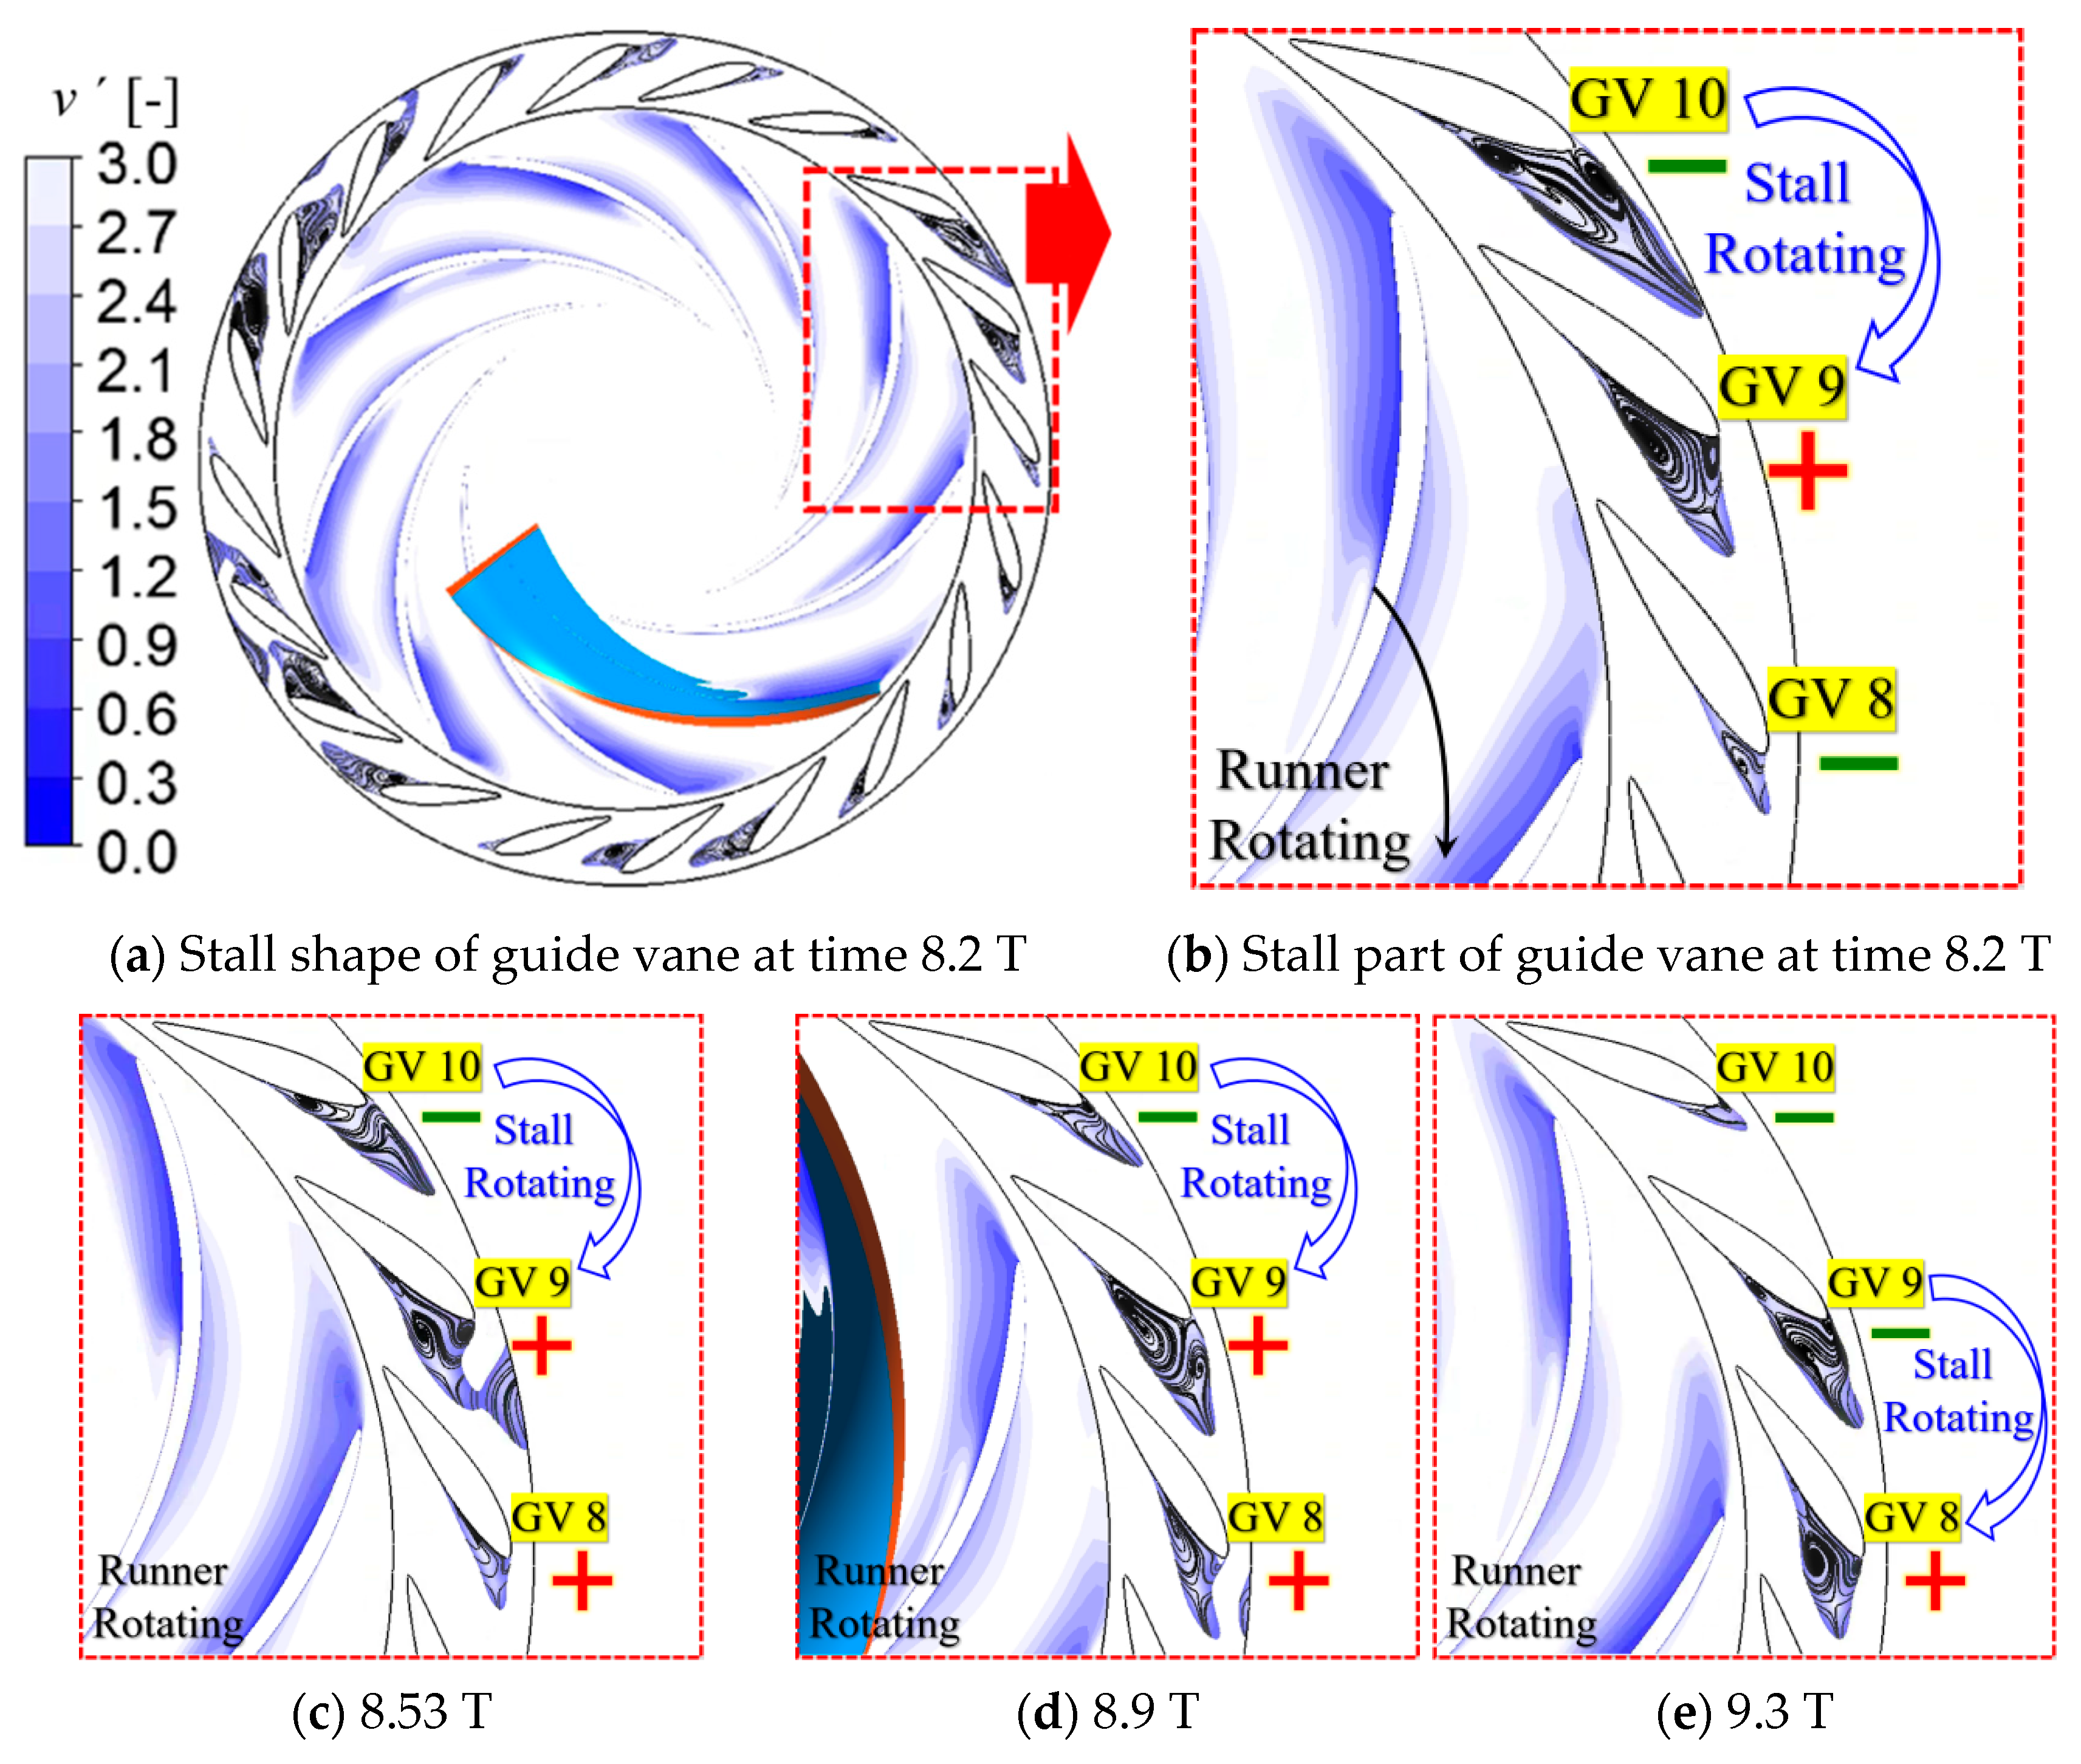
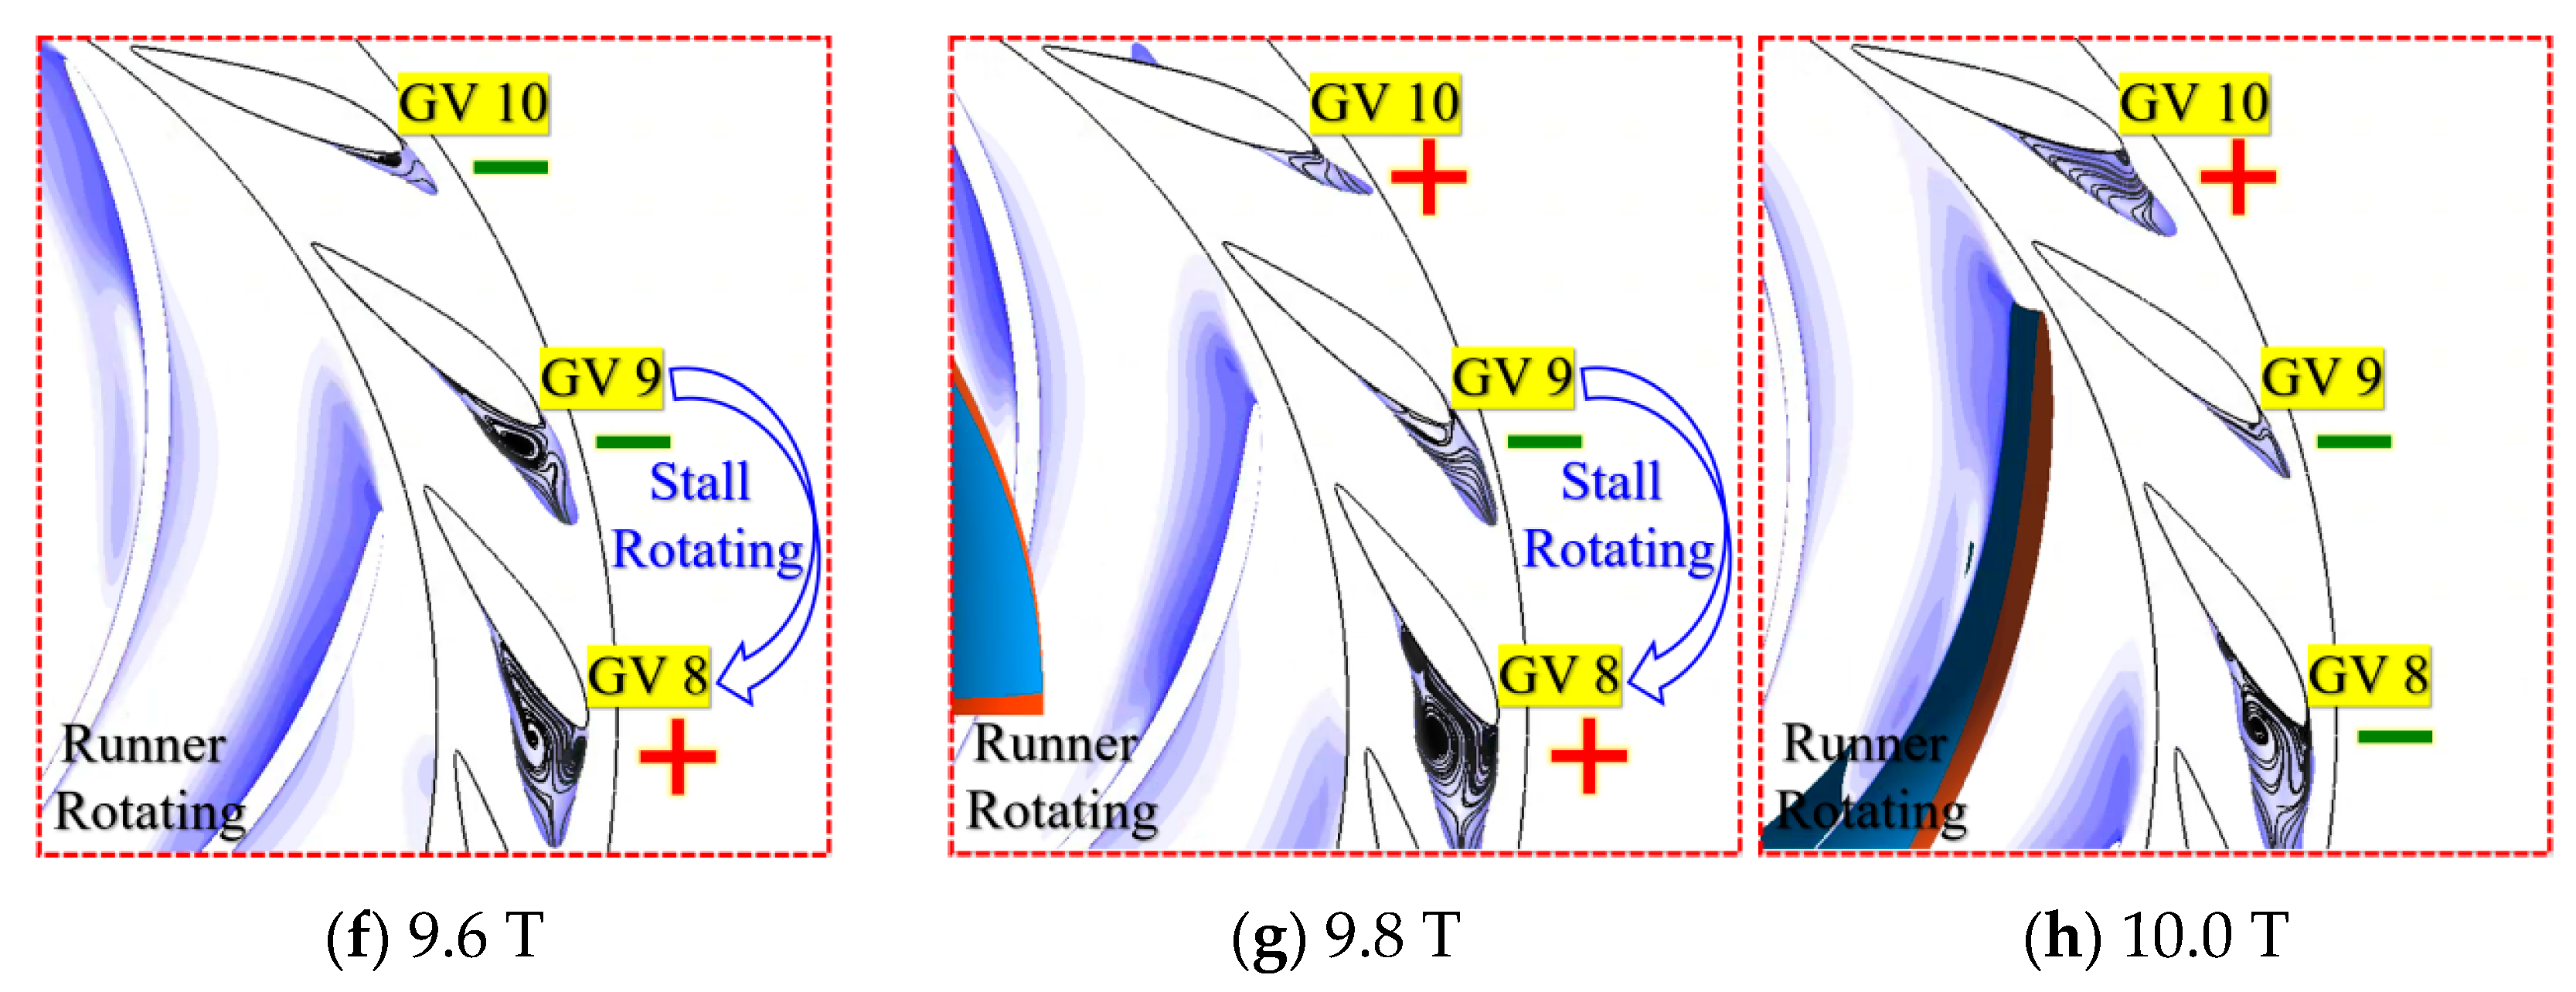
Figure 18 describes the specific flow field performance of the two stall rotations of the guide vane No. 8–10 flow channels during this period. In the 8.0–9.0 T period, the 8.2 T, 8.53 T, and 8.9 T moments shown in
Figure 18a–d are selected for display. It can be clearly seen that the stall of channel No. 10 rapidly weakens until it disappears, the stall of channel No. 9 continues to increase, and the stall cell completes the first rotation from channel No. 10 to No. 9. Selecting the moments of 9.3 T, 9.6 T, 9.8 T, and 10.0 T shown in
Figure 18e–h for display, it can be seen that the changing process of the stall in channel No. 9 gradually weakens and the stall in channel No. 8 gradually strengthens. During this period, the stall cell moves from channel 9 to channel 8 to complete the second rotation.
In the above stall rotation process, RSI plays an important role.
Figure 17b shows that under the influence of RSI, the
φ of any channel of the guide vane always fluctuates. The previous analysis shows that the
φ value is the smallest when the runner wake passes by, and the
φ value is the largest when the jet passes by. The complete process of the
φ value going through “trough-peak-trough” can be called a fluctuation cycle. It can be seen from the figure that the peak-to-peak value of the φ value in the fluctuation cycle is about 8°, accounting for 50–100% of the average value of the fluctuation cycle. By analyzing the change law of the
φ value during the process of flow passage stall enhancement and weakening, it is found that when the minimum
φ value formed when the runner wake passes through the guide vane channel entrance is lower than
φ′, stall can be induced in the flow passage, and the more this minimum
φ value is lower than
φ′, the more serious the stall enhancement caused. When the minimum value of
φ formed by the runner wake passing over the entrance of the guide vane channel is higher than
φ′, the stall in the channel begins to weaken.
As shown in
Figure 17b, the stall in the upstream flow channel does not cause the
φ value of the downstream adjacent flow channel to be lower than
φ′ throughout the entire fluctuation cycle. However, as long as the minimum
φ value caused by wake is lower than
φ′, the stall can be induced in the downstream flow channel, and it can be continuously strengthened, and finally the stall rotation can be completed. RSI will cause
φ to fall periodically, making it easier to complete the stall rotation. When there is no RSI, if the stall in one flow channel is not severe enough, the inflow angle
φ of the adjacent flow channel cannot be reduced to below
φ′, and the stall will have difficulty completing the rotation. RSI can be considered as an important thrust for stall rotation. It greatly reduces the difficulty of a stall in one flow channel causing a stall in an adjacent flow channel, making it easier to rotate the stall.
