Article

Evolution of the Hydrological Regime at the Outlet of West Dongting Lake Since 1955

1
School of Hydraulic and Ocean Engineering, Changsha University of Science & Technology, Changsha 410114, China
2
Key Laboratory of Dongting Lake Aquatic Eco-Environmental Control and Restoration of Hunan Province, Changsha 410114, China
3
School of Civil and Environmental Engineering, Hunan University of Technology, Zhuzhou 412007, China
4
Henan Water Conservancy Migration Affairs Center, Zhengzhou 450000, China
5
College of Civil Engineering, Hunan City University, Yiyang 413002, China
*
Author to whom correspondence should be addressed.
Water 2025, 17(16), 2487; https://doi.org/10.3390/w17162487
Submission received: 30 June 2025 / Revised: 8 August 2025 / Accepted: 19 August 2025 / Published: 21 August 2025

Abstract

To quantitatively evaluate the hydrological regime dynamics in West Dongting Lake over the past seven decades, this study utilizes daily average water level series (1955–2024) from key control stations (Nanzui and Xiaohezui) to analyze variations in water level and discharge through change-point detection methods, adopting the water level difference between Xiaohezui and Nanzui as a pivotal indicator of hydrological changes; the IHA–RVA framework is then applied to comprehensively assess the degree of alteration in hydrological indicators before and after identifying change points, demonstrating the following: (1) declining trends in water level/discharge at both stations—primarily attributable to reduced inflows from the Songzi and Hudu Rivers—underwent abrupt shifts in 1983 and 2003, while the water level difference displayed an increasing trend with a change point in 1991; (2) the overall degree of hydrologic alteration (DHA) was moderate, with enhanced variability during T2 (2003–2024) relative to T1 (1983–2003), notably for discharge at Nanzui and water level at Xiaohezui; (3) reduced discharge in the Songzi and Hudu Rivers primarily drives the decreased outflow from West Dongting Lake. In the Li and Yuan basins during period T1, anthropogenic factors dominated runoff alterations. During T2, anthropogenic contributions accounted for 76.27% and 48.67% of runoff changes, respectively, resulting in reduced runoff volumes under equivalent precipitation inputs. (4) Under fixed water level differences, a significant positive correlation exists between discharges at Xiaohezui and Nanzui stations. Greater discharge flows downstream through the flow channel adjacent to NZ at West Dongting Lake’s outlet. Collectively, these findings establish a technical foundation for assessing the impact of hydrological regimes and aquatic ecological security in Dongting Lake, thereby advancing sustainable water resource utilization across the basin.

1. Introduction

Lakes constitute critical freshwater reservoirs and regional ecological regulators, whose significance permeates all dimensions spanning natural ecosystems and human societal development [1,2]. Against the backdrop of global climate change, anthropogenic activities—particularly water engineering infrastructures, agricultural irrigation, and land-use modifications—have driven substantial ecological and hydrological transformations in lacustrine systems over recent decades [3,4,5,6,7,8]. Large lakes and rivers affected by dams have become focal points of global research due to dam-induced ecological impacts, including degradation of aquatic ecosystems, wetland habitat loss, and altered sediment dynamics [9,10,11,12,13]. Functioning as China’s second-largest freshwater lake (2680 km2) and a critical Yangtze River flood-regulation reservoir, Dongting Lake is situated in the mid-reaches alluvial plain under persistent hydrological transformations driven by intensive anthropogenic interventions [14,15]. Functioning as Dongting Lake’s pivotal hydrological transfer node, alterations to hydrological conditions in West Dongting Lake diminish the efficacy of multiple lake functions: flood mitigation capacity, ecological equilibrium maintenance, water supply reliability, and navigation sustainability. Consequently, research on hydrological changes in West Dongting Lake provides critical insights into evolving river–lake interactions across the Yangtze–Dongting system, underpinning evidence-based conservation strategies and sustainable water resource management.
Multiple metrics characterize hydrological alterations in rivers and lakes, requiring researchers to select region-specific indicators for targeted analysis [16]. The Indicators of Hydrologic Alteration (IHA) method, developed by Richter et al., ranks among the most widely applied frameworks. It employs hydrological metrics spanning five critical dimensions: magnitude, frequency, duration, timing, and rate of change, collectively characterize the majority of key hydrological characteristics [17]. Building on the IHA framework, the Range of Variability Approach (RVA) was developed to quantitatively quantify alteration magnitudes across hydrological indicators [18]. The IHA–RVA framework is extensively employed to assess the impacts of natural hydrological evolution and anthropogenic activities—including dam construction, irrigation practices, and mining operations—on river flow regimes. Representative applications demonstrate the versatility of the following IHA–RVA methodologies: IHA quantifies comprehensive impacts of open-pit mining on flow regimes of small-to-medium rivers [19]; irrigation diversion projects in the Tarim River Basin are evaluated for hydrological alterations using IHA–RVA metrics [20]; dam operations at Isapur and Arunavati significantly alter Penganga River runoff patterns, as determined by IHA analysis [21]; Mekong mainstream flow data from five stations indicate that dam operations reduce wet-season discharge, with substantial effects on low-pulse duration [22]; and hydropower generation severely modifies Eastern River’s hydrological behavior, where alteration magnitude correlates strongly with proximity to reservoirs [23]. Within China, the IHA methodology has been effectively applied to assess regional-scale eco-hydrological alterations, as evidenced by studies in the Yellow River Basin [24], Tarim River Basin [25], Jialing River watershed [26], and Han River Basin [27]. Applied to water level variation analysis, the IHA–RVA indicates moderate alteration at Dongting Lake’s outlet and low alteration at Poyang Lake’s outlet in China [28].
West Dongting Lake, a sub-basin of Dongting Lake (China’s second-largest freshwater lake), occupies the Two-Lake Plain in the middle Yangtze reaches. Its complex hydrological regime arises from the synergistic forcing of the Yangtze River, Yuan River, and Li River. Investigating river-lake interactions across the Yangtze-Dongting system is fundamental for understanding the lake’s hydrological regime shifts. Alterations in water-sediment flux partitioning through the Three Outlets constitute the dominant mechanistic driver of hydrological regime transformations in Dongting Lake [29,30]. The Three Outlets (Songzi, Taiping, and Ouchi), serving as conduits for Yangtze River flow and sediment diversion, undergo a progressive reduction in their diversion capacity under natural evolutionary processes [31]. Concurrently, channel straightening of the Yangtze mainstem and operations of the Gezhouba and Three Gorges Dams have synergistically accelerated the progressive reduction in flow and sediment diversion through the Three Outlets [32,33,34]. Diminished sediment delivery from the Four Tributaries and Three Outlets has critically reshaped Dongting Lake’s depositional–erosion balance [35], further driving substantial transformations in its hydrological regime. The Three Gorges Reservoir (TGR) operations have significantly altered Dongting Lake’s hydrology, manifesting as follows: Dongting Lake area contraction [36], regulation-induced flow and water level modifications [37,38,39], and depositional–erosion shifts from reduced sediment inputs [15,40]. These changes exacerbate flood risks, water scarcity, ecological degradation, and pollution [41,42], prompting adaptive management proposals [43,44]. Systematic assessment of lake hydrological alterations is a fundamental prerequisite for enhancing flood defense capabilities, sustaining ecosystem integrity, and reforming water resource allocation strategies.
Current research on Dongting Lake predominantly focuses on hydrological alterations induced by Three Gorges Reservoir operations or treats the lake as a homogeneous entity, while lacking detailed analysis of hydrological regime changes from the perspectives of sub-lake regions and internal water volume dynamics. Existing studies have not analyzed the two outlets of West Dongting Lake—Nanzui and Xiaohezui—and the relationship between them. Only by simultaneously analyzing water level and flow data can we fully understand changes in the hydrological regime. This study employs the Indicators of Hydrologic Alteration-Range of Variability Approach (IHA–RVA) to quantitatively assess alterations in stage-discharge relationships at the outlet of West Dongting Lake before and after hydrological transitions. We further investigate correlations between stage anomalies and discharge variations at two hydrological stations, elucidating the temporal evolution of runoff partitioning characteristics across distinct periods. This research provides scientific underpinnings for conserving aquatic ecosystem health within the Dongting Lake basin, offering critical insights for adaptive water resource governance strategies.

2. Study Area and Data

Dongting Lake, positioned in northern Hunan Province, represents China’s second-largest freshwater lake by surface area and functions as the primary river-lake confluence system immediately downstream of the Three Gorges Dam on the Yangtze River. Dongting Lake’s inflow system comprises the Three Outlets (Songzi, Taiping, and Ouchi outlets) diverting Yangtze River flows through the Songzi, Hudu, and Ouchi rivers, and the Four Tributaries (Xiang, Yuan, Zi, and Li Rivers) discharging directly into the lake. After hydrological buffering within the lake basin, all waters converge into the Yangtze River at Chenglingji, establishing an intricate river-lake confluence system characterized by dynamic flow exchanges (Figure 1). Dongting Lake exhibits a distinct west-high-east-low topographic gradient, which naturally divides the lake into three sub-basins: East Dongting Lake, South Dongting Lake, and West Dongting Lake.
West Dongting Lake occupies the western sector of the Dongting Lake basin, extending from 111°52′ E to 112°19′ E longitude and 28°48′ N to 29°38′ N latitude. West Dongting Lake receives inflows from the Yuan, Li, Songzi, and Hudu rivers, collectively contributing >50% of Dongting Lake’s total inflow volume. After undergoing hydrological regulation, waters are released downstream through the control sections at the NZ and XHZ hydrological stations.
The Nanzi Hydrological Station—a national benchmark facility—monitors water-sediment fluxes discharged into South Dongting Lake from the Songzi, Hudu, Li, and Yuan rivers through the northern outlet of West Dongting Lake. The XHZ Hydrological Station operates as a national benchmark facility quantifying water-sediment fluxes entering South Dongting Lake via the southern outlet of West Dongting Lake. This study analyzed daily water level and discharge records (1955–2024) from the NZ and XHZ hydrological stations, sourced from the Hunan Provincial Hydrological and Water Resources Survey Center. Spatial distributions are mapped in Figure 1.
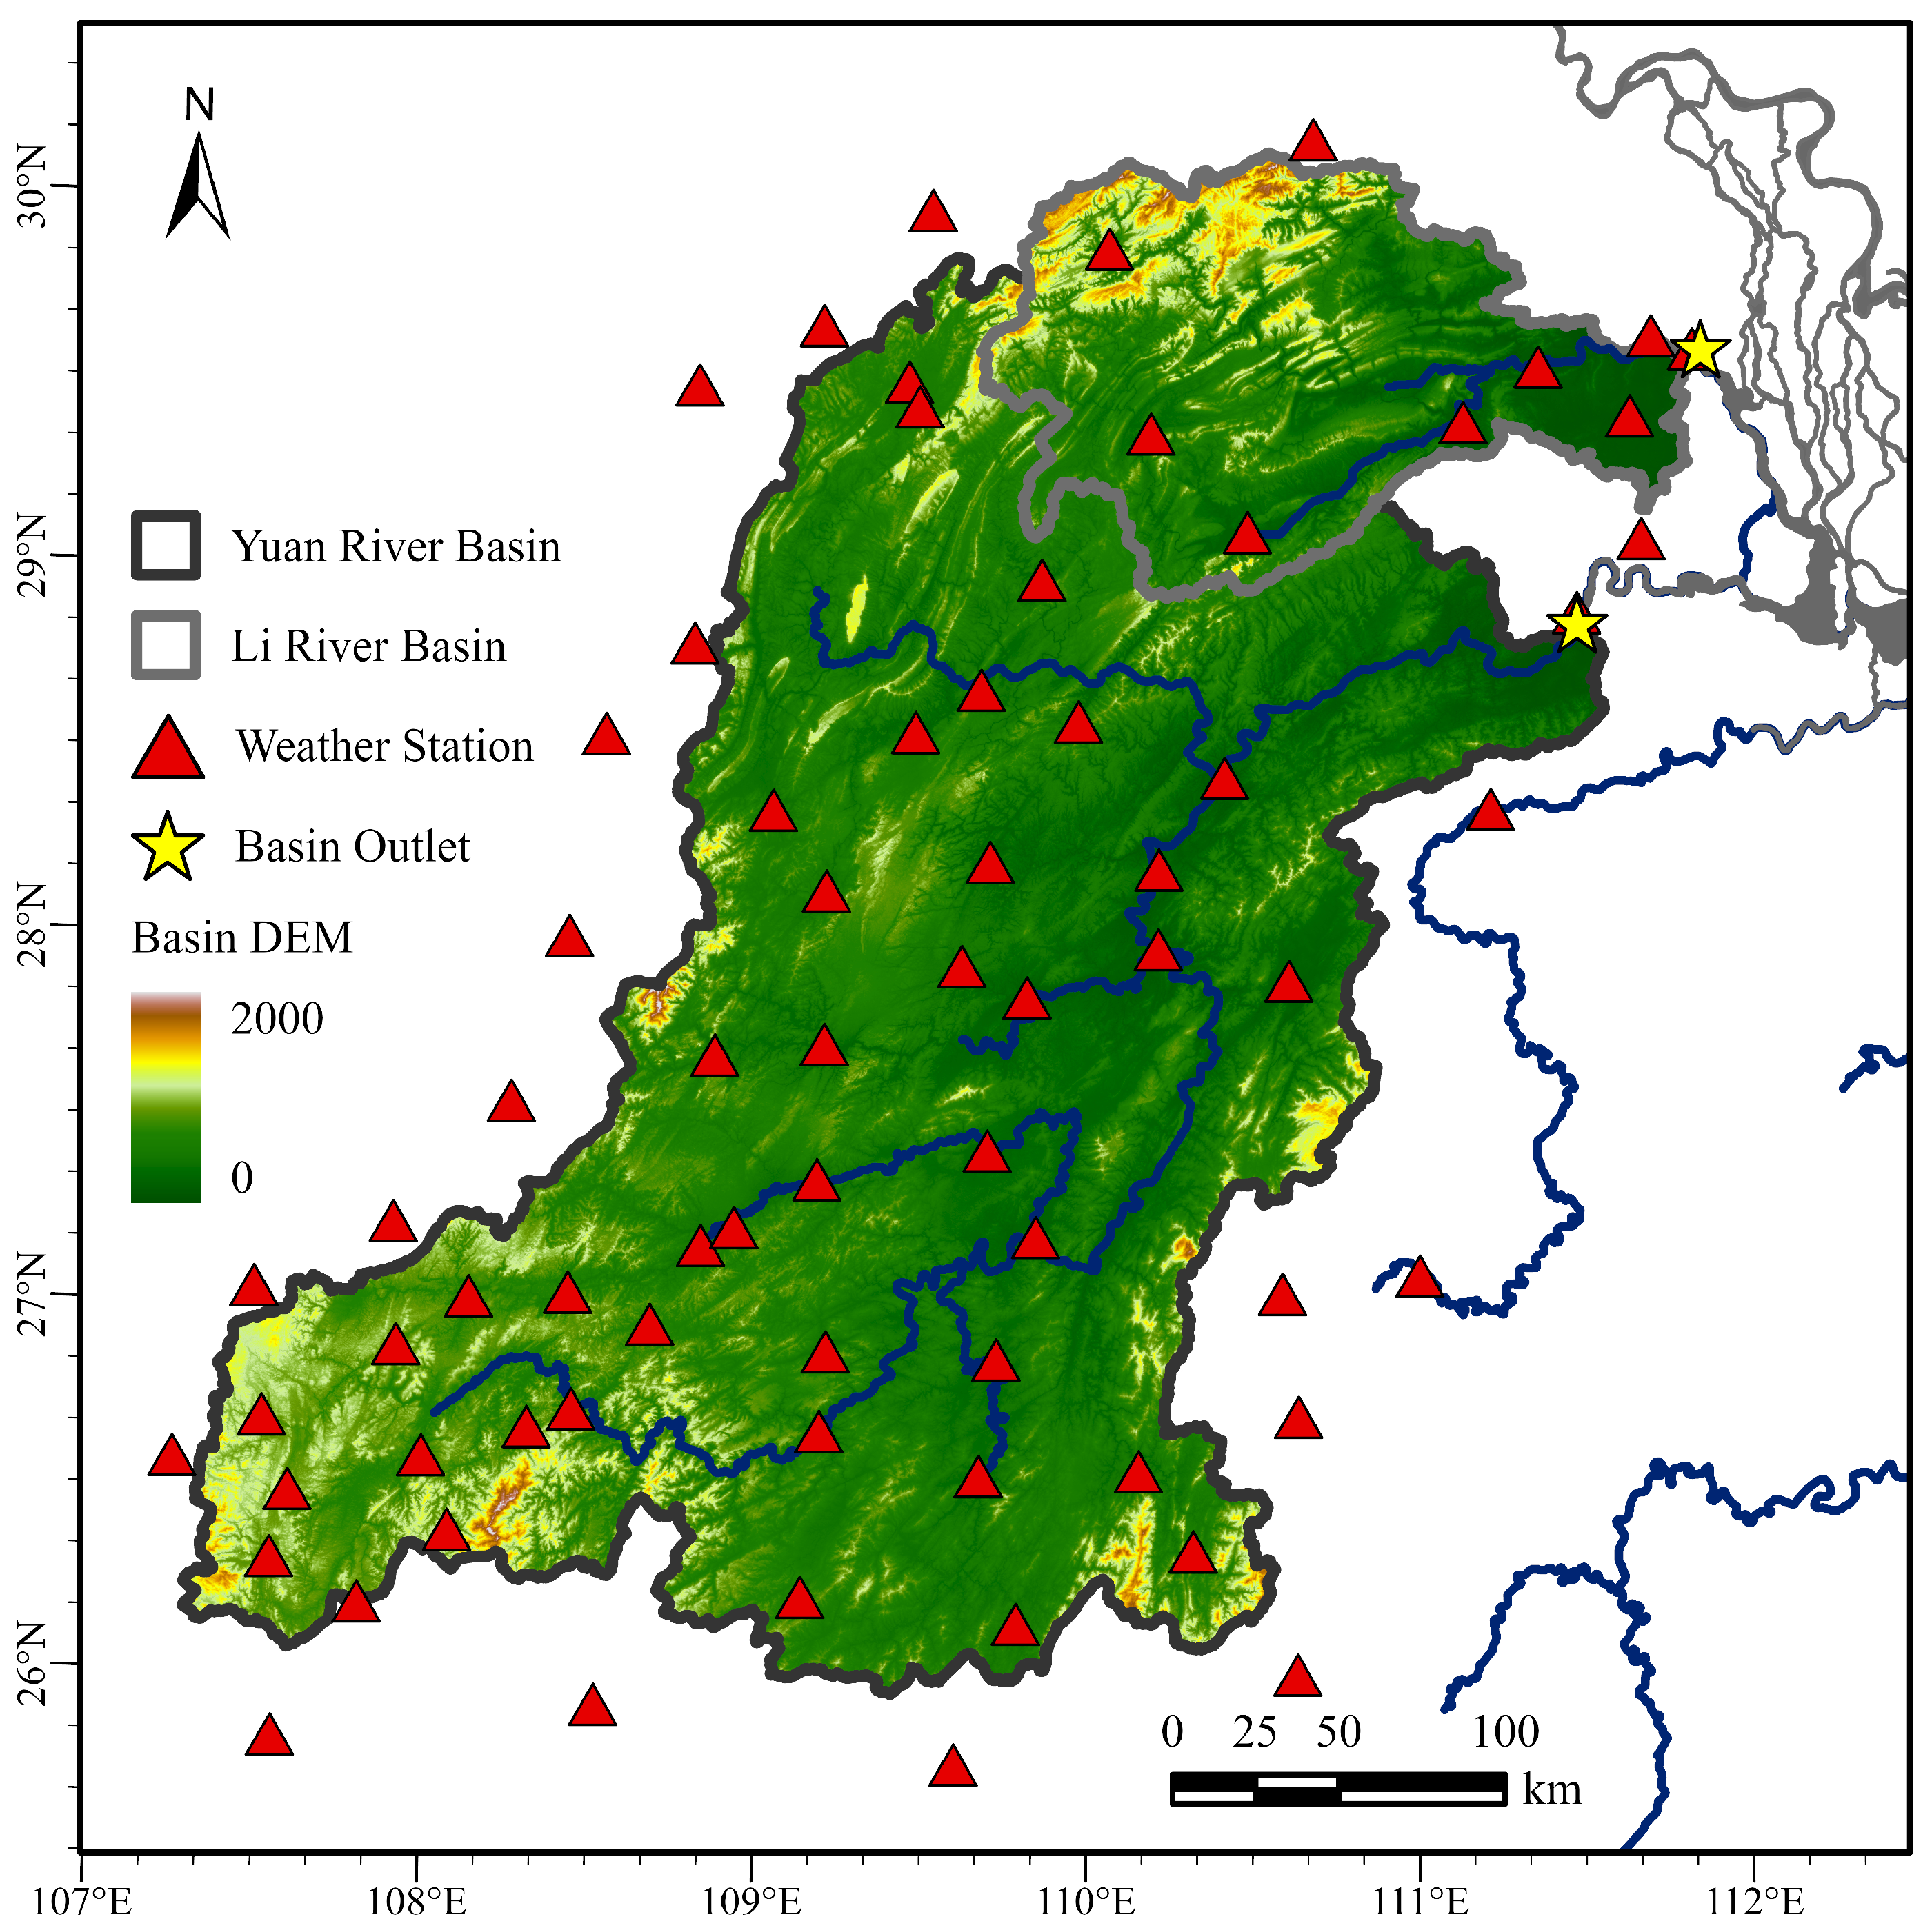
The Dongting Lake basin exhibits a typical subtropical monsoon climate characterized by temporal overlap between peak precipitation and high-temperature periods. The region experiences a mean annual temperature range of 10–18.5 °C with significant interannual precipitation variability, where total annual rainfall ranges from 1148 to 1837 mm. Hydro-meteorological hazards (e.g., droughts and floods) chronically threaten the basin due to its hydro-climatic setting—driven by the coupled effects of the East Asian monsoon system, increased frequency of extreme weather events, and complex topography—posing severe threats to regional ecosystem stability and socioeconomic security [45,46]. To analyze the impact of climate on inflow discharge to the lake, precipitation data from 70 meteorological stations in the Li and Yuan River basins were selected. Considering the significant topographic relief in the study area and the weak spatial representativeness of point data, co-kriging interpolation with elevation as a covariate was used to calculate basin-scale average precipitation. Co-kriging is a multivariate geostatistical interpolation method that utilizes information from a primary variable and one or more auxiliary variables to enhance prediction accuracy. This approach has been empirically validated for spatial interpolation of precipitation datasets. This study used measured meteorological data as the primary variable and digital elevation data of meteorological stations as auxiliary variables. Combining the spatial distribution of stations, variogram models for primary and auxiliary variables were established, ultimately obtaining gridded precipitation data at 10 km spatial resolution. Basin-scale average precipitation was further calculated by integrating with watershed area, providing data support for subsequent analysis of “precipitation-runoff depth changes”. Figure 2 shows the geographical scope of the Lishui and Yuanjiang basins and meteorological station locations.

3. Methodology

3.1. Trend Analysis and Change Point Detection Methods

The Mann–Kendall (MK) test is widely used to identify significant temporal trends in hydrologic time series. This study applied the Mann–Kendall (MK) trend test to detect temporal trends in annual mean water levels, discharge, and water-level difference (ΔH) at XHZ and NZ hydrological stations.
Four extensively applied methods—Mann–Kendall test, cumulative anomaly analysis, sliding t-test, and the Pettitt method—were utilized to identify abrupt hydrological changes and determine change points. Methodological specifications are excluded for brevity given their common usage in hydrology [47,48,49].

3.2. IHA–RVA Framework

We applied the IHA–RVA framework to quantify hydrological alterations in West Dongting Lake. The IHA system (Richter et al., 1996) utilizes daily hydrological data to define 32 flow metrics across five parameter groups: monthly flows, extreme flows, timing of extreme events, frequency/duration of high/low flow pulses, and flow change rates/frequencies [17]. Standard IHA parameters were adapted according to water level, discharge, and water-level difference (ΔH) characteristics. For enhanced quantification of alteration magnitudes, Richter et al. (1997) introduced the Range of Variability Approach (RVA) to evaluate both single-variable and integrated hydrological alterations. The RVA method employs two user-defined quantiles (e.g., 33% and 67% or 25% and 75%) from the pre-alteration period as management target boundaries, termed RVA boundaries [18,50]. Alternative boundaries may be adopted based on regional hydrological characteristics [51]. Most studies utilize the 25th and 75th percentiles of IHA indicators as thresholds for the Range of Variability Approach (RVA) [52,53]. This study adopts this standard protocol, employing these thresholds to quantify the degree of alteration in streamflow metrics. The RVA calculation is as follows:
D i = ( N i o N i e ) N i e × 100 %
N i e = r N T
where Di denotes the alteration degree of the i-th flow metric; Nio represents observed post-impact years with IHA values within RVA bounds; Nie indicates expected post-impact years within RVA bounds; r signifies the pre-impact proportion of IHA values within RVA thresholds (r = 50%); and N corresponds to the total years in the post-impact hydrological series. Hydrological alterations are classified as follows: low (0 ≤ Di < 33%), moderate (33% ≤ Di < 67%), or high (67% ≤ Di ≤ 100%).
The integrated alteration degree provides a comprehensive assessment of hydrological shifts across all indicators before and after anthropogenic disturbances, delivering a single quantifiable value that visually represents the magnitude of hydrological modification. The system-level alteration magnitude (D0) is computed through ecological-weight-based aggregation of individual metric alteration degrees (Di), with the calculation procedure described as follows:
D 0 = 1 33 i = 1 33 D i 2
The alteration degree for individual metrics is denoted as Di, while system-level alteration (D0) is categorized into: low (0 ≤ D0 < 33%), moderate (33% ≤ D0 < 67%), or high (67% ≤ D0 ≤ 100%).
To further quantify hydrological variability, the deviation degree is introduced, and calculated as follows:
P = V post V pre V pre × 100 %
where Vpre signifies IHA values during the reference baseline period devoid of anthropogenic pressures, and Vpost corresponds to values under altered hydrological regimes post-disturbance.

3.3. SCRAQ Method

The Cumulative Slope Change Rate Comparison Method is an analytical approach that quantitatively assesses the impacts of climate and human activities on runoff variations. Cumulative processing amplifies trend signatures, combined with piecewise slope analysis for contribution rate decomposition. This method is widely applied in hydrological studies due to its conceptual simplicity, operational simplicity, and reliance on readily accessible data [26,54]. The rate of change in cumulative runoff (RSR, %) and cumulative precipitation (RSP, %) are calculated as follows:
RSR = 100 × (SR1SR0)/SR0
RSP = 100 × (SP1SP0)/SP0
where SR0 and SR1 denote the slopes of cumulative runoff versus time (units: mm yr−1) before and after the inflection point, respectively, while SP0 and SP1 represent the analogous slopes for cumulative precipitation.
The contribution value of precipitation variability to runoff alteration, denoted as CP (%), is calculated as follows:
CP = 100 × RSP/RSR
The contribution rate of anthropogenically induced runoff alterations, denoted as CH (%), can be calculated via the following formula:
CH = 100 − CHCET
where CET represents the rate of slope change for cumulative evaporation. When evaporation variation is negligible, climatic drivers can be reduced to precipitation effects, yielding CH = 100 − CH.

4. Results

4.1. Trend and Changepoint Analysis

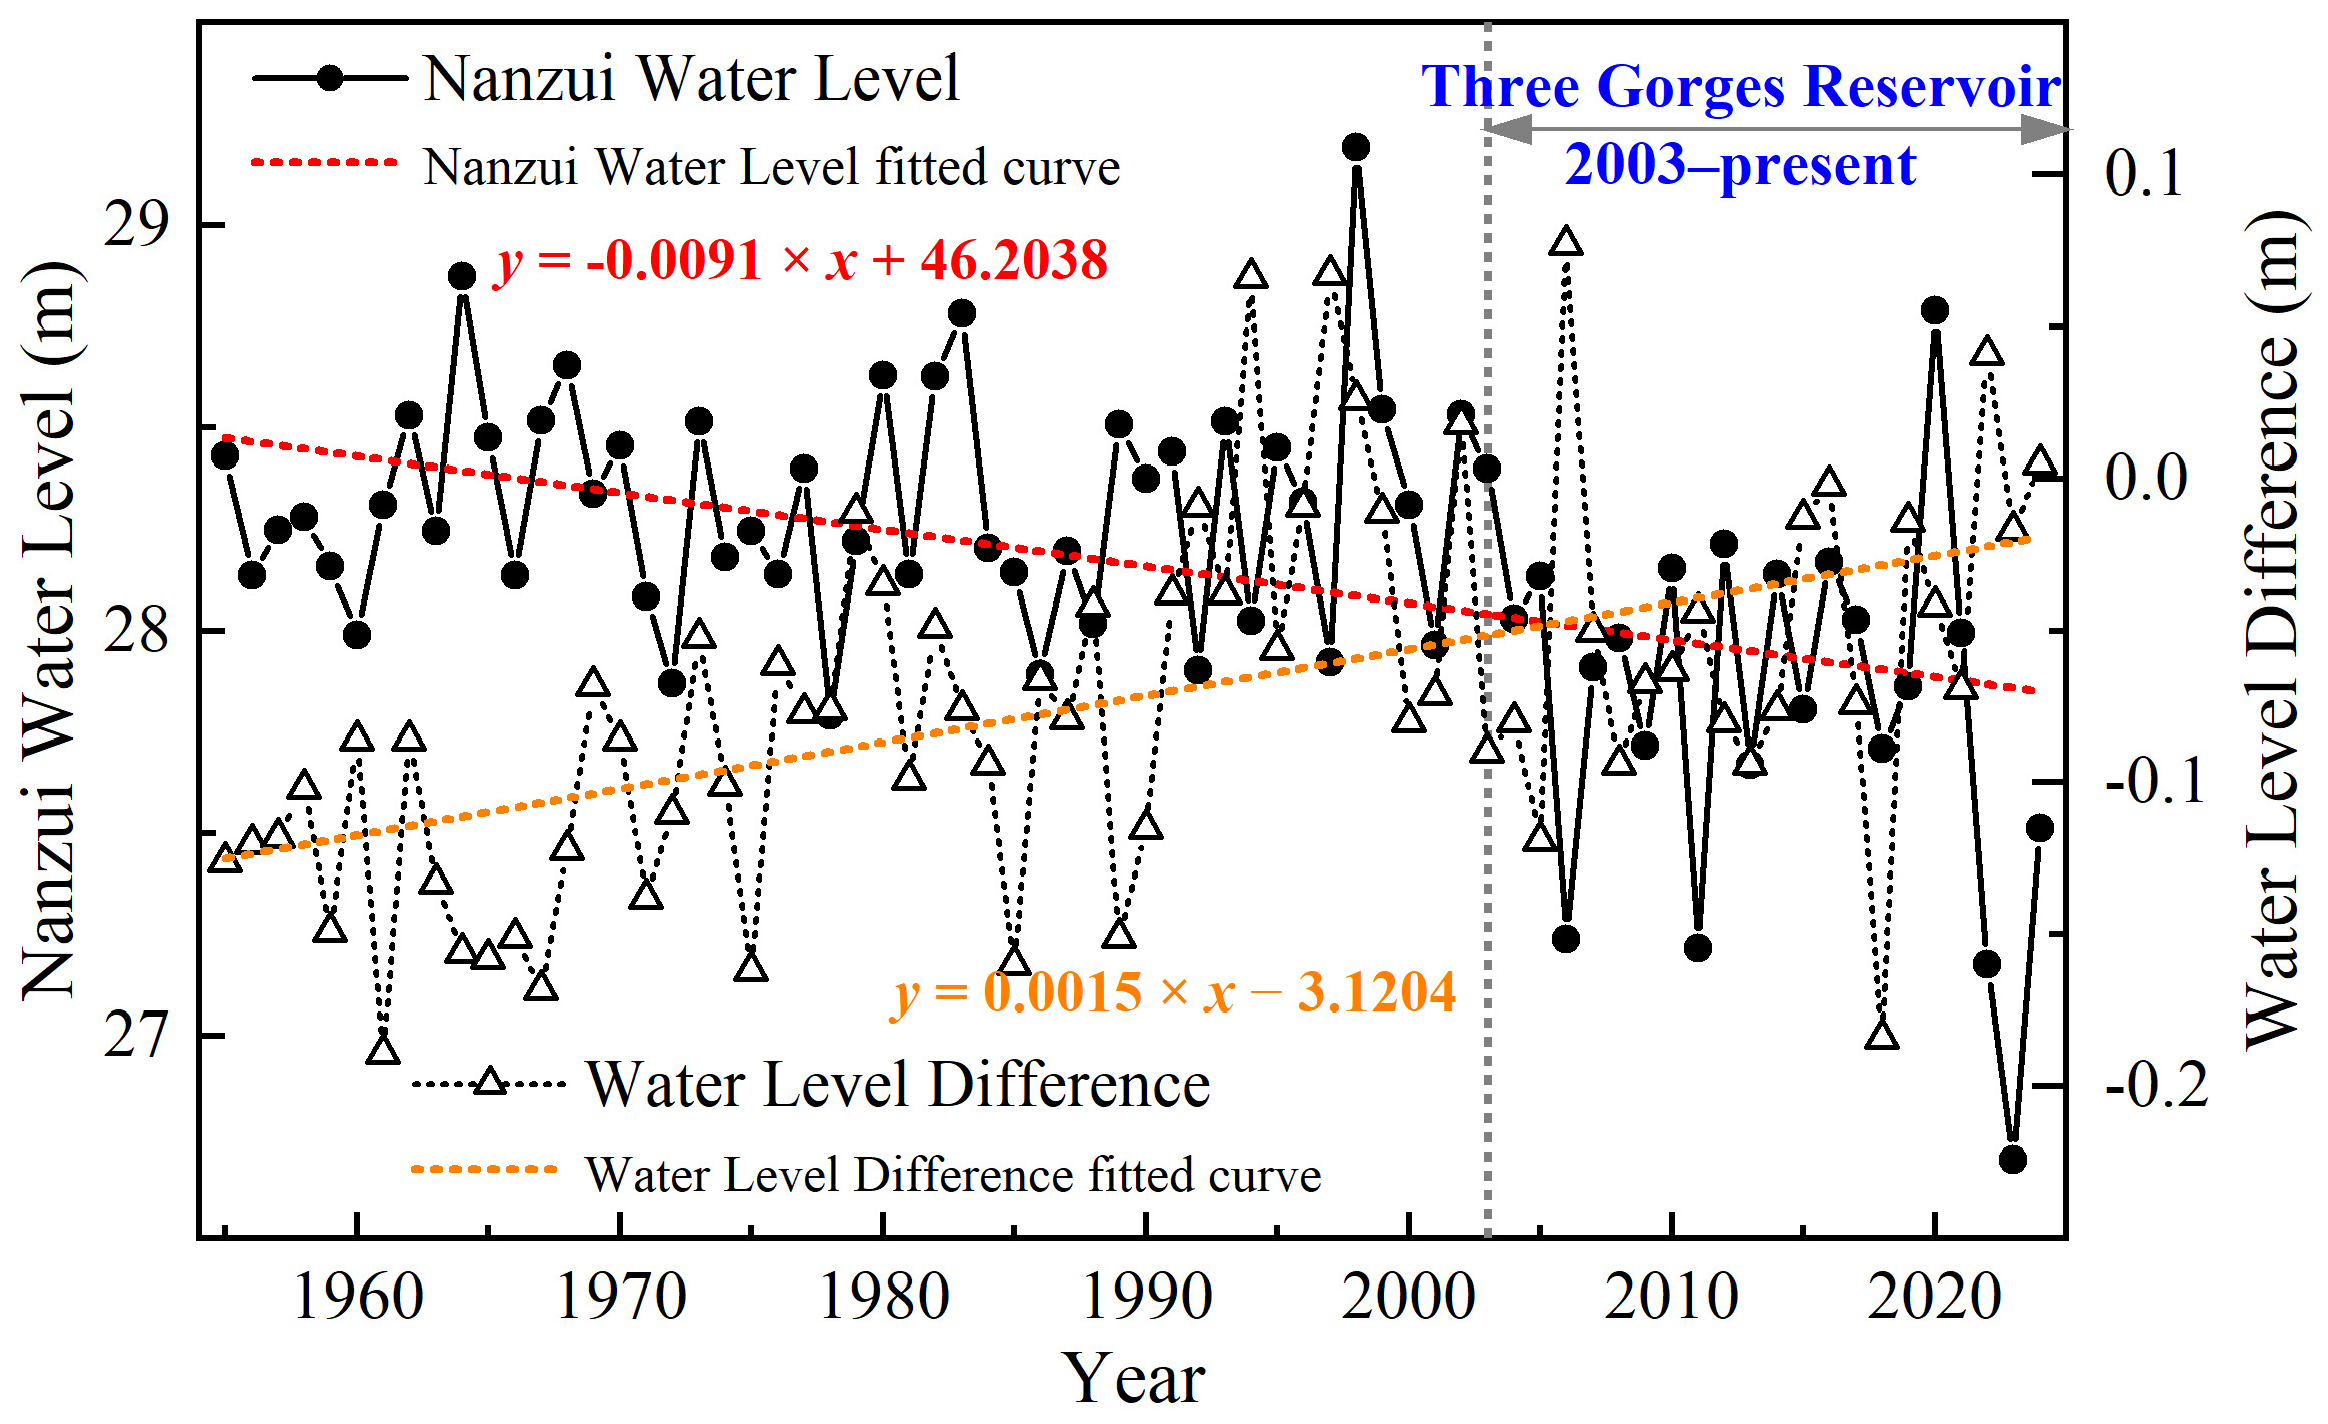
Water levels, discharges, and their difference (ΔH) at XHZ and NZ stations were analyzed to investigate hydrological regime dynamics in West Dongting Lake. Figure 3 plots the annual mean discharge series (1955–2024), and Figure 4 displays the annual mean water level at the NZ station and the water level difference (ΔH = HXHZ − HNZ) between XHZ and NZ stations. As shown in Figure 2, annual discharge at both XHZ and NZ stations exhibits significant variability, with ranges of 1180–3810 m3/s at XHZ and 937–2761 m3/s at NZ. XHZ demonstrates higher annual discharge magnitude and greater discharge variability than NZ, with minimum values recorded at both stations during the Three Gorges Project operational period (2003–2024). Annual discharges at XHZ and NZ stations exhibit statistically significant declining trends during 1955–2024, potentially associated with diminished inflows from the Songzi and Hudu Rivers, which divert Yangtze River flows into West Dongting Lake.
As shown in Figure 4, the NZ station exhibits a pronounced downward trend in annual water levels with significant fluctuations, ranging from 26.69 to 29.19 m. The maximum-minimum difference exceeds 2.0 m, and the minimum value was recorded during the Three Gorges Reservoir operation period (2003–2024). The annual water level difference (ΔH) between XHZ and NZ stations exhibits an overall upward trend, with XHZ annual water levels consistently lower than NZ levels except in certain years.
Mann–Kendall (M-K) tests (Table 1) indicate statistically significant decreasing trends (p < 0.05) in both water levels and discharges at the XHZ and NZ stations. The water level difference (ΔH) shows a statistically significant increasing trend (p < 0.05), based on Mann–Kendall tests (Table 1).
Change-point detection was performed for annual water level, discharge, and water level difference (ΔH) series at Dongting Lake’s key hydrological control stations—NZ and XHZ—using four methods: the Mann–Kendall test, cumulative anomaly (CUSUM), moving t-test, and Pettitt’s method. Changepoint years were determined by synthesizing results from all methods, as documented in Table 2. Changepoint years for annual water levels and discharges at XHZ and NZ stations were identified as 1983 and 2003, while the changepoint for the water level difference (ΔH) occurred in 1991 under integrated hydrological dynamics of both stations. The identified mutation year is attributed to alterations in the Yangtze–Dongting Lake river–lake interactions, which profoundly govern hydrological regime shifts at the outlets of West Dongting Lake. During the 1960s–1970s, one natural cutoff (Shatanzi) and two artificial cutoffs (Zhongzhouzi and Shangchewan) occurred in the Jingjiang reach of the Yangtze River mainstream. These cut-offs induced channel shortening and riverbed incision, which accelerated flow recession in the Songzi and Hudu rivers and caused drastic reductions in sediment–water diversion capacities [32,55]. The construction of multiple water infrastructure projects in the upper reaches of the Yangtze, Yuan, and Li rivers has modified natural flow regimes, consequently altering hydrological dynamics in the outlet region of West Dongting Lake [29,30]. The Three Gorges Reservoir (TGR), China’s largest reservoir, commenced operation in 2003, fundamentally altering hydrological regimes in the middle-lower Yangtze River and Dongting Lake [37,38,39]. Despite phased impoundment elevation increases from 135 m to 175 m during 2003–2008 [56], hydrological responses at West Dongting Lake’s outlets commenced immediately post 2003.

4.2. Hydrological Alteration Degree at West Dongting Lake Outlets

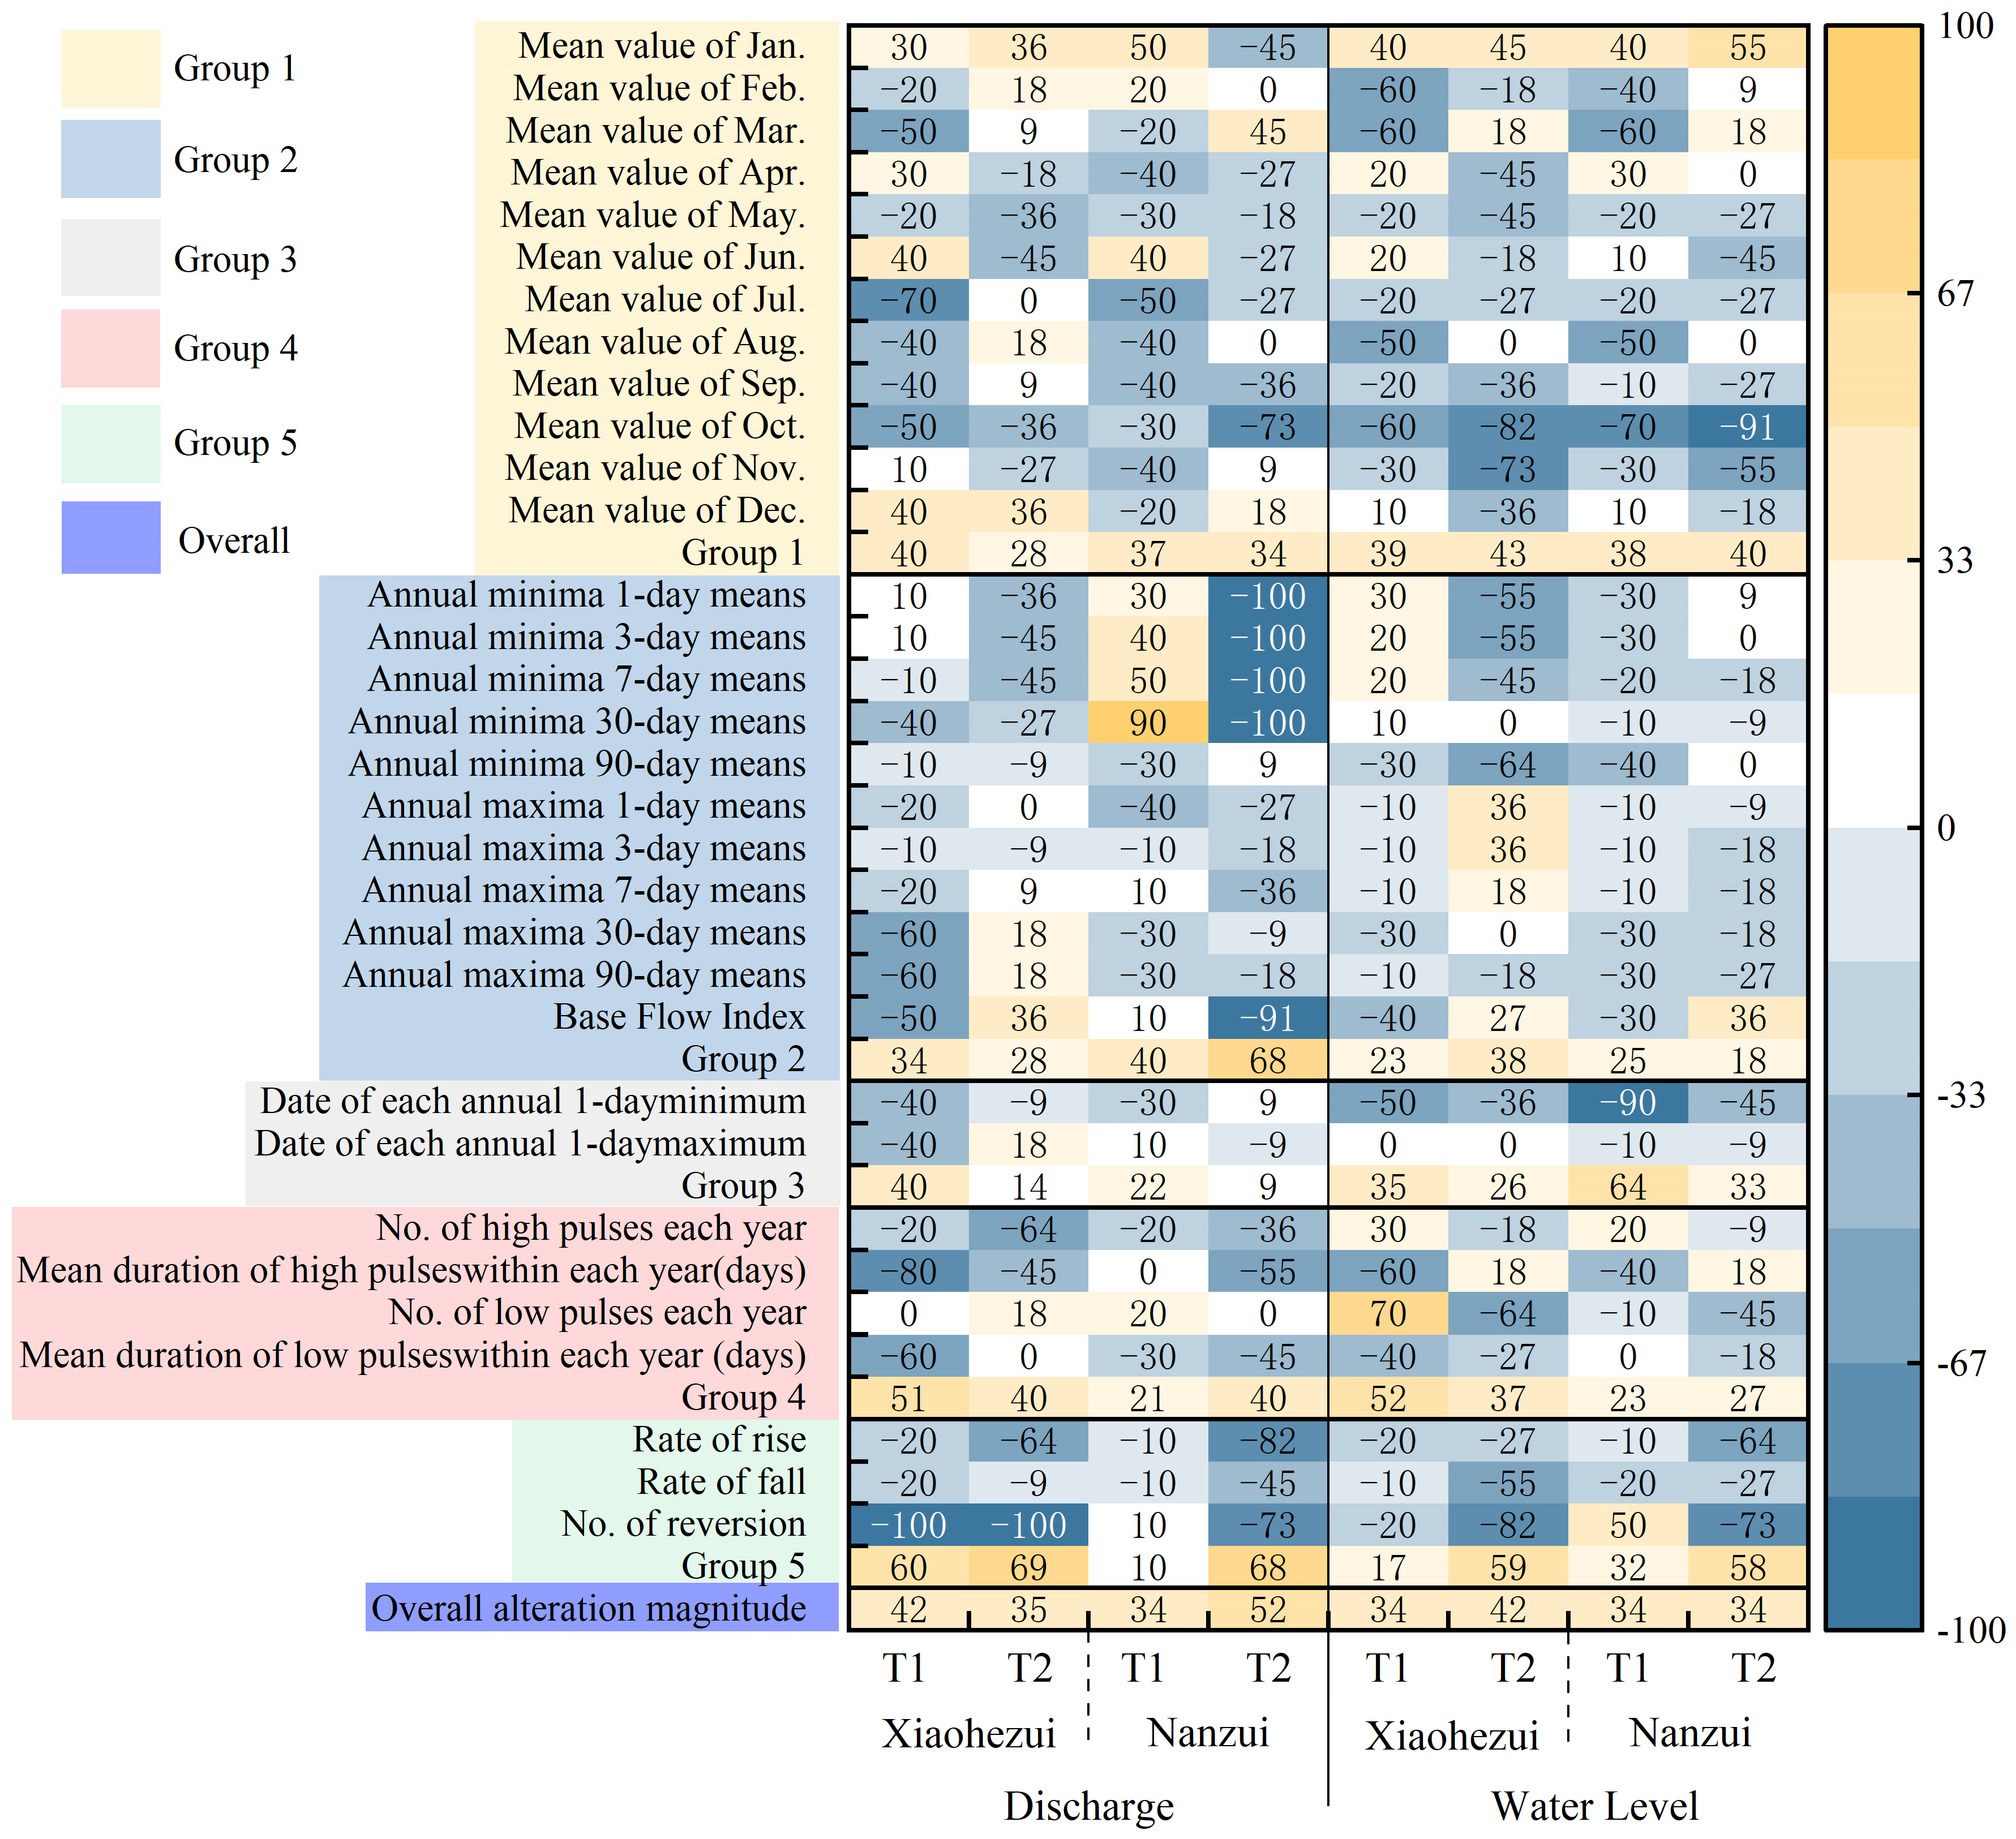
Based on changepoint detection at XHZ and NZ stations, three periods were defined to evaluate hydrological alteration: T0 (1955–1982) as the baseline period, T1 (1983–2002) as the initial alteration period, and T2 (2003–2024) as the advanced alteration period. The Range of Variability Approach (RVA) was employed to quantify alteration magnitudes for 32 hydrological indicators in West Dongting Lake, with the zero-flow days metric excluded given its non-occurrence at XHZ and NZ stations from 1955 to 2024. Figure 5 presents hydrological alteration degrees (HAD) for annual water levels and discharges at XHZ and NZ stations across defined hydrological periods.
For discharges, moderate hydrological alteration occurred at both XHZ and NZ stations during the T1 and T2 periods (XHZ: 42% in T1, 35% in T2; NZ: 34% in T1, 52% in T2), though individual indicators showed heterogeneous alteration magnitudes. In T1, moderate-to-high alteration characterized Group 1 indicators for XHZ discharge during June–October (flood season) and December/March (dry season), peaking as a high alteration in June. NZ exhibited alterations primarily during April, June–September, and January/November. These patterns resulted from significant discharge regime alterations by upstream reservoirs during flood seasons, substantially coupled with diminished inflows from the Songzi and Hudu Rivers. Within Group 2 indicators, XHZ displayed moderate alteration in annual 30-day minimum flows, 30-day maximum flows, 90-day maximum flows, and baseflow index, while all others exhibited low alteration. In contrast, NZ demonstrated high alteration in annual 30-day minimum flows, moderate alteration in 3-day minimum, 7-day minimum, and 1-day maximum flows, with low alteration across other parameters. In Group 3 (extreme flow timing), both stations showed moderate alteration in minimum flow timing, while maximum flow timing exhibited moderate alteration at XHZ versus low alteration at NZ. For Group 4 (high/low-flow frequency/duration), XHZ had moderate-to-high alteration in both flow duration metrics with low alteration elsewhere. In Group 5 (flow change dynamics), high alteration characterized flow reversal occurrences at XHZ, but low alteration prevailed in other parameters.
Distinct discharge alteration patterns emerged at XHZ and NZ stations during T2 relative to T1. For Group 1 indicators, XHZ demonstrated moderate alteration in January, May, June, October, and December, whereas NZ exhibited high alteration notably in October alongside moderate alteration in January, March, September, and October. Within Group 2 indicators, moderate-to-high alterations predominantly occurred in annual minimum flows, with NZ exhibiting significantly greater alteration than XHZ. XHZ demonstrated moderate alteration in annual 3-day, 7-day, and 30-day minimum flows, while NZ exhibited high alteration (100%) specifically in annual 1-day, 3-day, 7-day, and 30-day minimum flows. All Group 3 indicators exhibited low alteration. For Group 4, both XHZ and NZ stations showed moderate alteration in high-flow frequency and duration metrics, with NZ additionally demonstrating moderate alteration in low-flow duration. For Group 5, XHZ exhibited a moderate alteration in flow rising rate and a high alteration in flow reversals, whereas NZ exhibited high alteration in both parameters.
Water levels at both XHZ and NZ stations showed moderate hydrological alteration during T1 (1983–2002) and T2 (2003–2024). Hydrological alteration degrees (HAD) reached 34% in T1 and 42% in T2 at XHZ, whereas NZ sustained a stable HAD of 34% throughout both periods. During T1, monthly mean water levels at XHZ and NZ stations showed moderate-to-high alteration in January, February, March, August, and October, whereas NZ specifically exhibited high alteration in October. For Group 2 annual extreme water level indicators, only the water level index at XHZ and annual 90-day minimum water levels at NZ exhibited moderate alteration, with low alteration in all other parameters; in Group 3, the timing of annual minimum water levels showed moderate alteration at XHZ. For Group 4, XHZ demonstrated low alteration in high-water occurrence frequency but moderate-to-high alteration in the other three metrics, while NZ exhibited moderate alteration in low-water duration and low alteration in the remaining three indicators; regarding Group 5, NZ displayed moderate alteration in water level reversal occurrences with low alteration across all other parameters.
During the T2 period, significant divergences emerged in water level alteration patterns between XHZ and NZ stations. XHZ demonstrated moderate alteration in January, April, May, September, and December but high alteration in October and November, while NZ exhibited moderate alteration in January, June, and November with high alteration specifically in October. For Group 2, XHZ exhibited moderate alteration in annual 1-day, 3-day, 7-day, and 30-day minimum water levels plus 1-day and 3-day maximum levels, whereas NZ showed moderate alteration solely in the water level index with low alteration elsewhere. In Group 3, both stations demonstrated moderate alteration in minimum water level timing metrics, while the two maximum water level-associated indicators exhibited negligible alteration (<10%). In Group 4, both stations exhibited moderate alteration in low-water occurrence frequency alongside low alteration in all other three metrics. For Group 5, high alteration characterized water level reversal occurrences at XHZ and NZ, while XHZ demonstrated moderate alteration in water level falling rate and NZ in rising rate, whereas all remaining parameters exhibited low alteration.
During the T1 period, XHZ exhibited moderate alteration across all five discharge indicator groups, while NZ showed moderate alteration in Group 4 and high alteration in Group 5 with low alteration in Groups 1–3. For water levels, XHZ demonstrated moderate alteration in Groups 1, 3, and 4, whereas NZ exhibited moderate alteration in Groups 1 and 3 with low alteration in all other groups. During the T2 period, XHZ discharge exhibited a moderate alteration in Group 4 and a high alteration in Group 5, while NZ discharge showed a high alteration in Groups 3 and 5 alongside moderate alteration in Groups 1 and 4. For water levels, XHZ demonstrated moderate alteration in all groups except Group 3, which exhibited low alteration, whereas NZ exhibited a moderate alteration exclusively in Groups 1, 3, and 5.
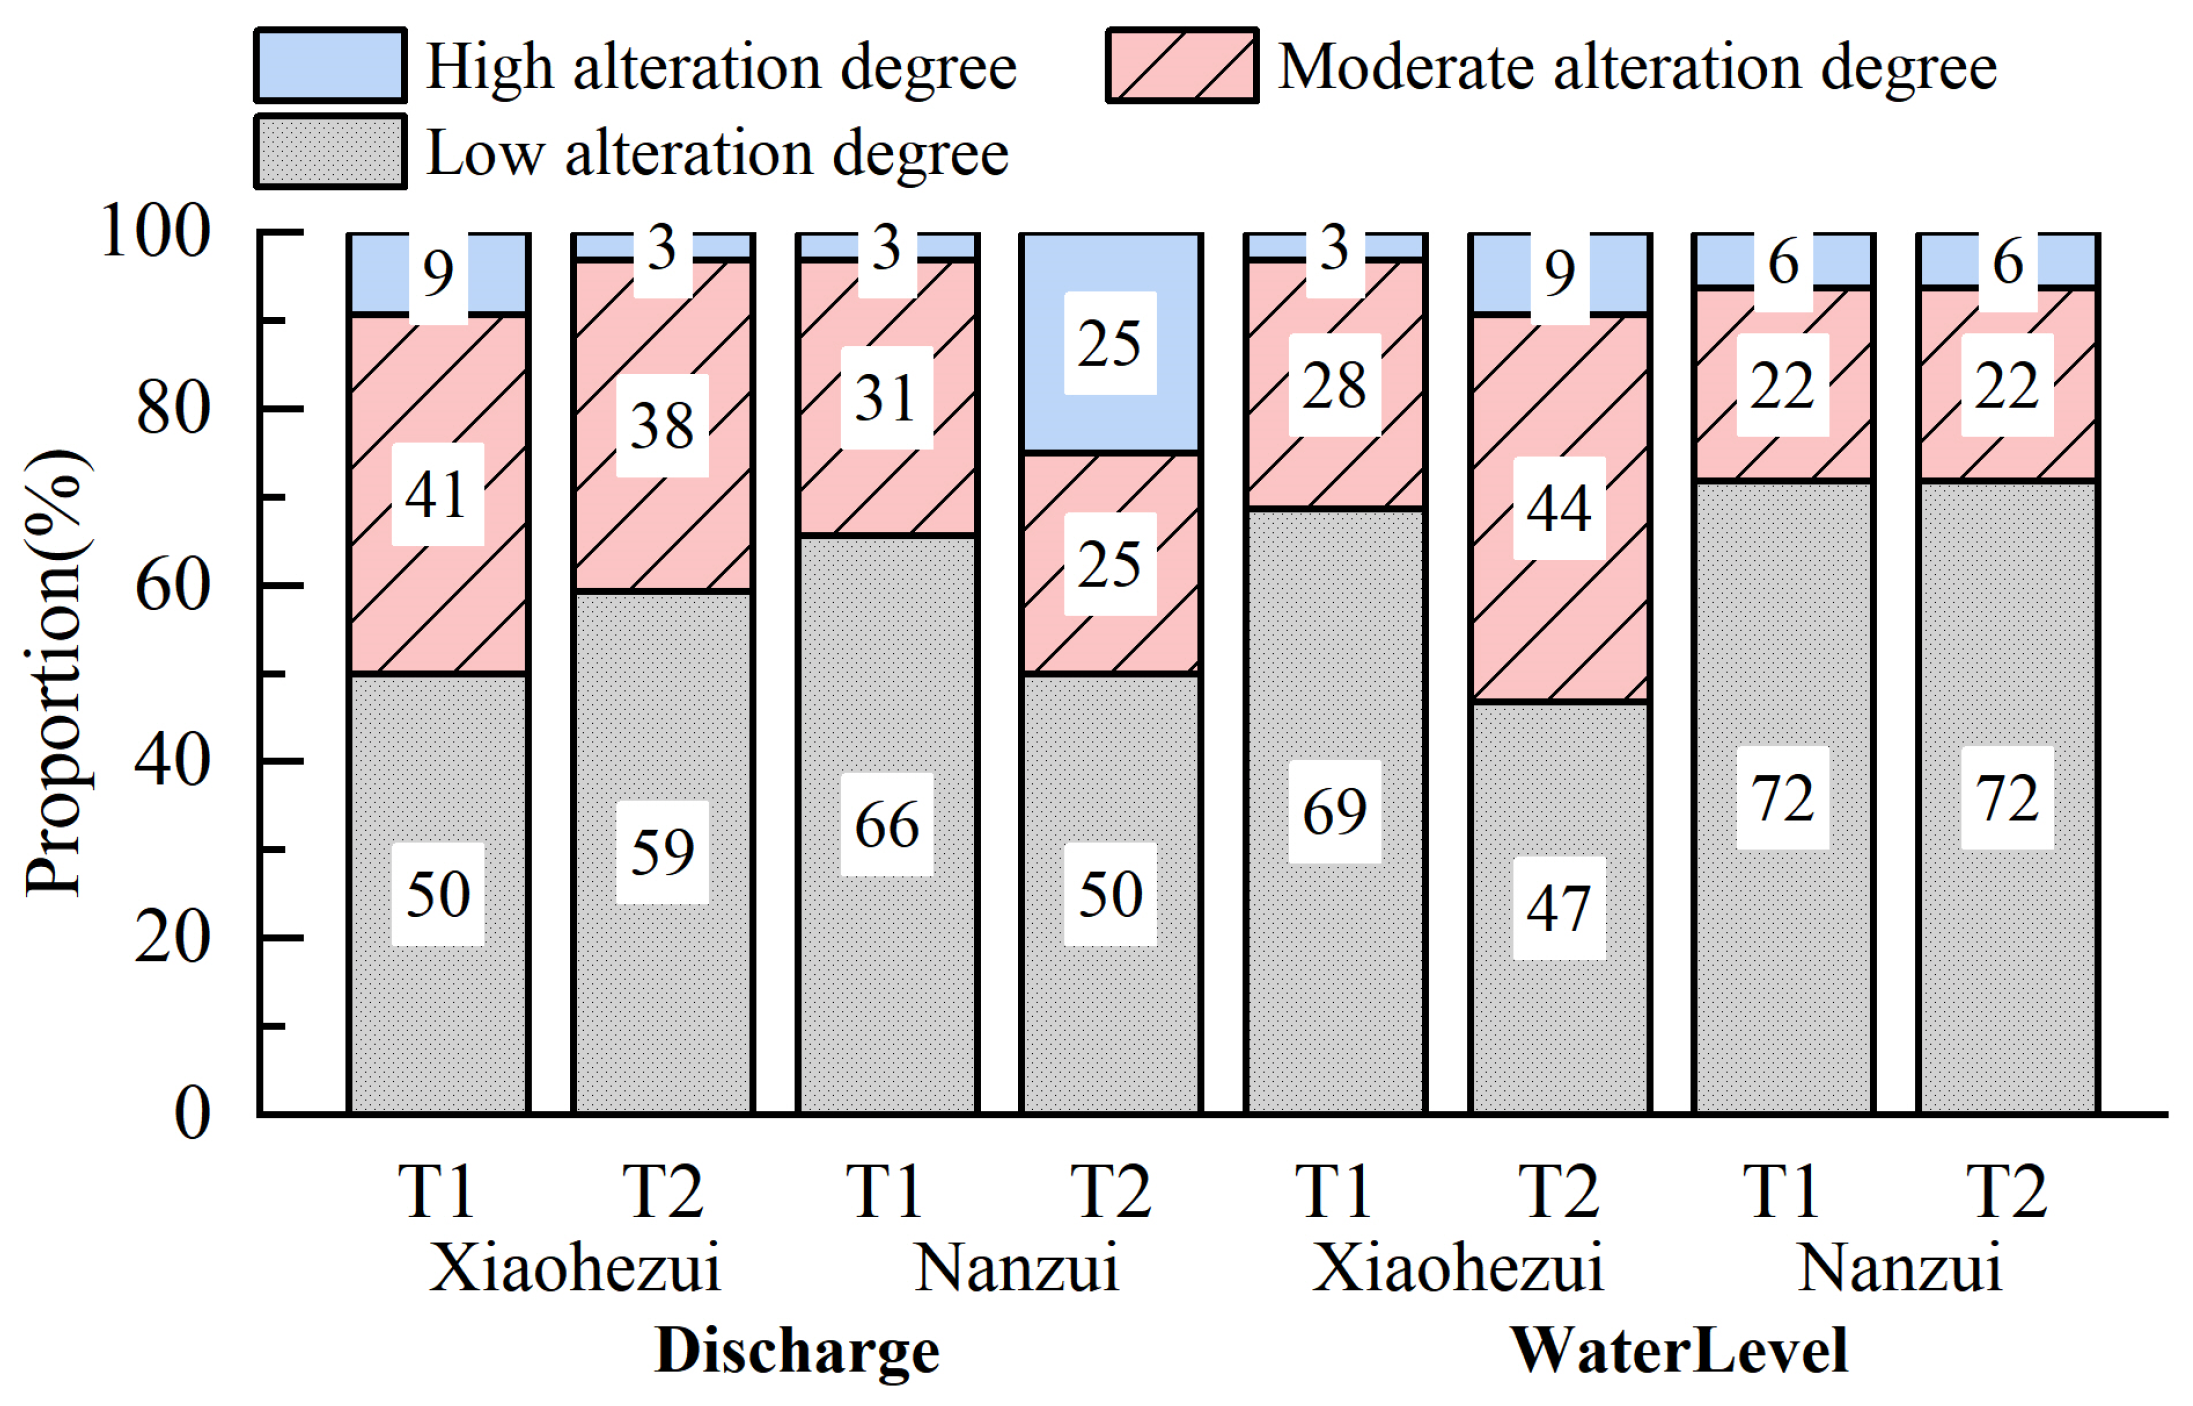
Based on computed hydrological alteration degrees across distinct periods, Figure 6 presents the spatiotemporal distribution of alteration grade proportions for XHZ and NZ stations. For discharge alterations at XHZ during T1, moderate-to-high alteration occurred in 50% of all 32 indicators, with high alteration in 9%. Compared to T1, the proportion of moderate-to-high alteration marginally decreased in T2. In NZ, discharge alterations remained predominantly low alteration during both periods, while moderate alteration declined from 31% in T1 to 25% in T2, and high alteration increased markedly from 3% to 25%. Water level alterations at XHZ exhibited significant inter-period contrasts: During T1, alterations were predominantly low (72%), while T2 featured 9% high alteration and 44% moderate alteration—reflecting a 16% increase in moderate alteration relative to T1. Water level alterations at NZ maintained identical proportional distributions between T1 and T2: low alteration accounted for 72% in both periods, moderate alteration constituted 22%, and high alteration accounted for 6%.

4.3. Alteration Degree of Water Level Difference (ΔH)

Change-point analysis of the water level difference (ΔH) between XHZ and NZ stations identified two alteration periods: 1955–1990 (P1) and 1991–2024 (P2). The IHA baseflow index was adapted to two ΔH-specific indices: ΔH Index 1 (Annual minimum 7-day ΔH/annual mean ΔH) and ΔH Index 2 (Annual maximum 7-day ΔH/annual mean ΔH), with zero-flow days redefined as days when ΔH = 0, expanding the hydrological indicator system to 34 metrics.
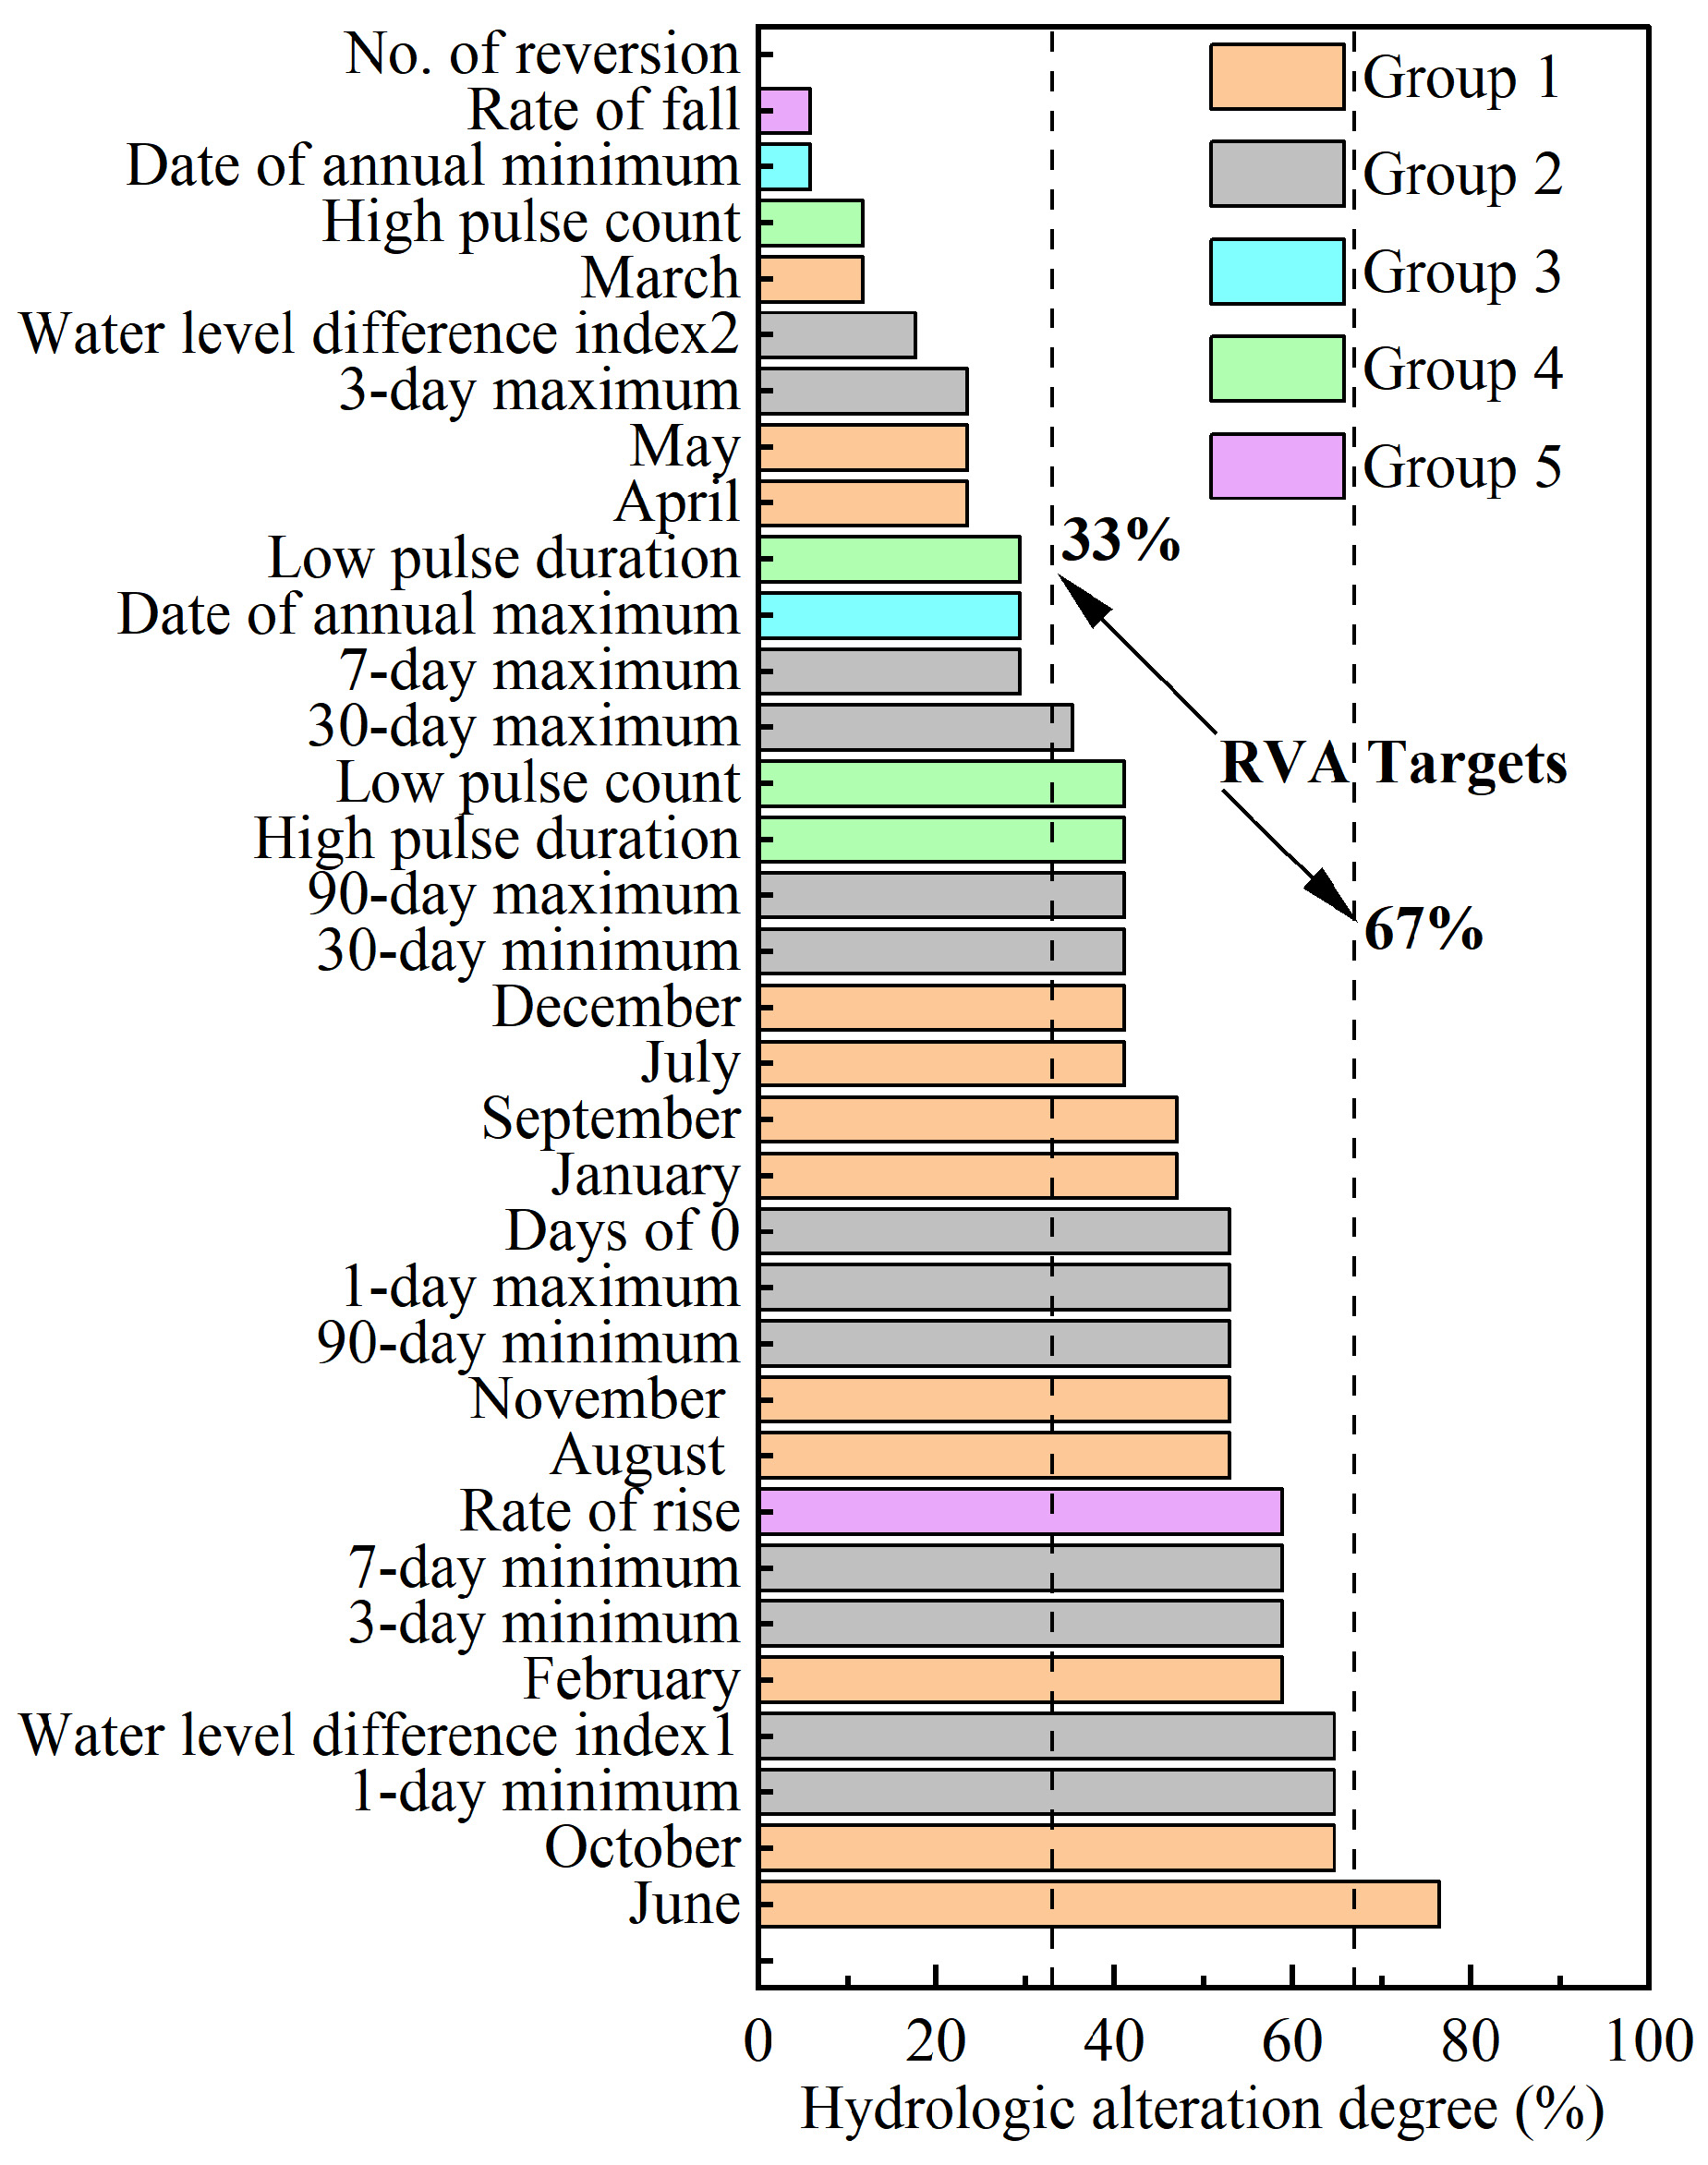
Figure 7 presents the distribution of hydrological alteration grades across 34 indicators. The integrated alteration degree for the water level difference (ΔH) between XHZ and NZ stations reached 44% (moderate alteration), with the June mean ΔH indicator exhibiting high alteration (>66%). Among all metrics, 21 indicators (66%) showed moderate alteration—comprising one rising rate indicator (Group 5) and 16 metrics (Groups 1–2)—while 15 indicators demonstrated low alteration, including all metrics in Group 3.
For monthly mean water level difference (ΔH), statistical analyses of mean relative deviation and alteration degree were conducted for periods P1 (1955–1990) and P2 (1991–2024) (Table 3, Figure 8). Alteration degrees reached moderate-to-high levels for all months except March-May, with June exhibiting high alteration. During the P1 period (1955–1990), monthly mean water level difference (ΔH) maintained negative values from May to November and positive values from January to April and December. In contrast, during P2 (1991–2024), significant sign reversals occurred in May and November, with mean ΔH transitioning from negative to positive values. In P2 (1991–2024), positive relative deviations characterized monthly mean ΔH during April–December. Sign reversals (negative → positive) in May and November drove deviations exceeding 100%, whereas June and October exceeded 60%. Conversely, January–March exhibited consistently negative deviations. Overall, the absolute water level difference (|ΔH|) between XHZ and NZ stations exhibited a decreasing trend, with a more pronounced reduction during flood seasons.
Based on the statistical results of annual extreme water level difference (ΔH) deviations and alteration degrees across durations (Table 4). The five extreme low-water ΔH indicators exhibited relatively small mean relative deviations and negligible magnitude changes between P1 and P2. While all demonstrated moderate alteration degrees, four indicators (excluding the 30-day minimum ΔH) reached alteration degrees >50%. Among the five extreme high-water ΔH indicators, 1-day, 3-day, and 7-day maxima showed positive relative deviations (>50%) with significant magnitude increases, whereas 30-day and 90-day maxima exhibited minor deviations (<50%). Alteration degrees were moderate for 1-day and 90-day maxima but low for the 3-day, 7-day, and 30-day indicators. ΔH Index 1 demonstrated high alteration, while ΔH Index 2 showed only low alteration. This pattern indicates significantly more pronounced hydrological alterations in West Dongting Lake when XHZ water levels were lower than NZ levels.
A zero water-level difference between the NZ and XHZ outlets does not imply flow cessation but indicates equivalent stage elevations and the absence of a significant hydraulic gradient. Figure 9 presents temporal variations in zero water-level difference days (ΔH = 0). During P1 (1955–1990), the index remained stable with limited fluctuations, whereas P2 (1991–2024) exhibited significantly increased zero-ΔH days (mean increase from 15 to 29 days) and enhanced variability. This shift produced a 93% mean relative deviation.
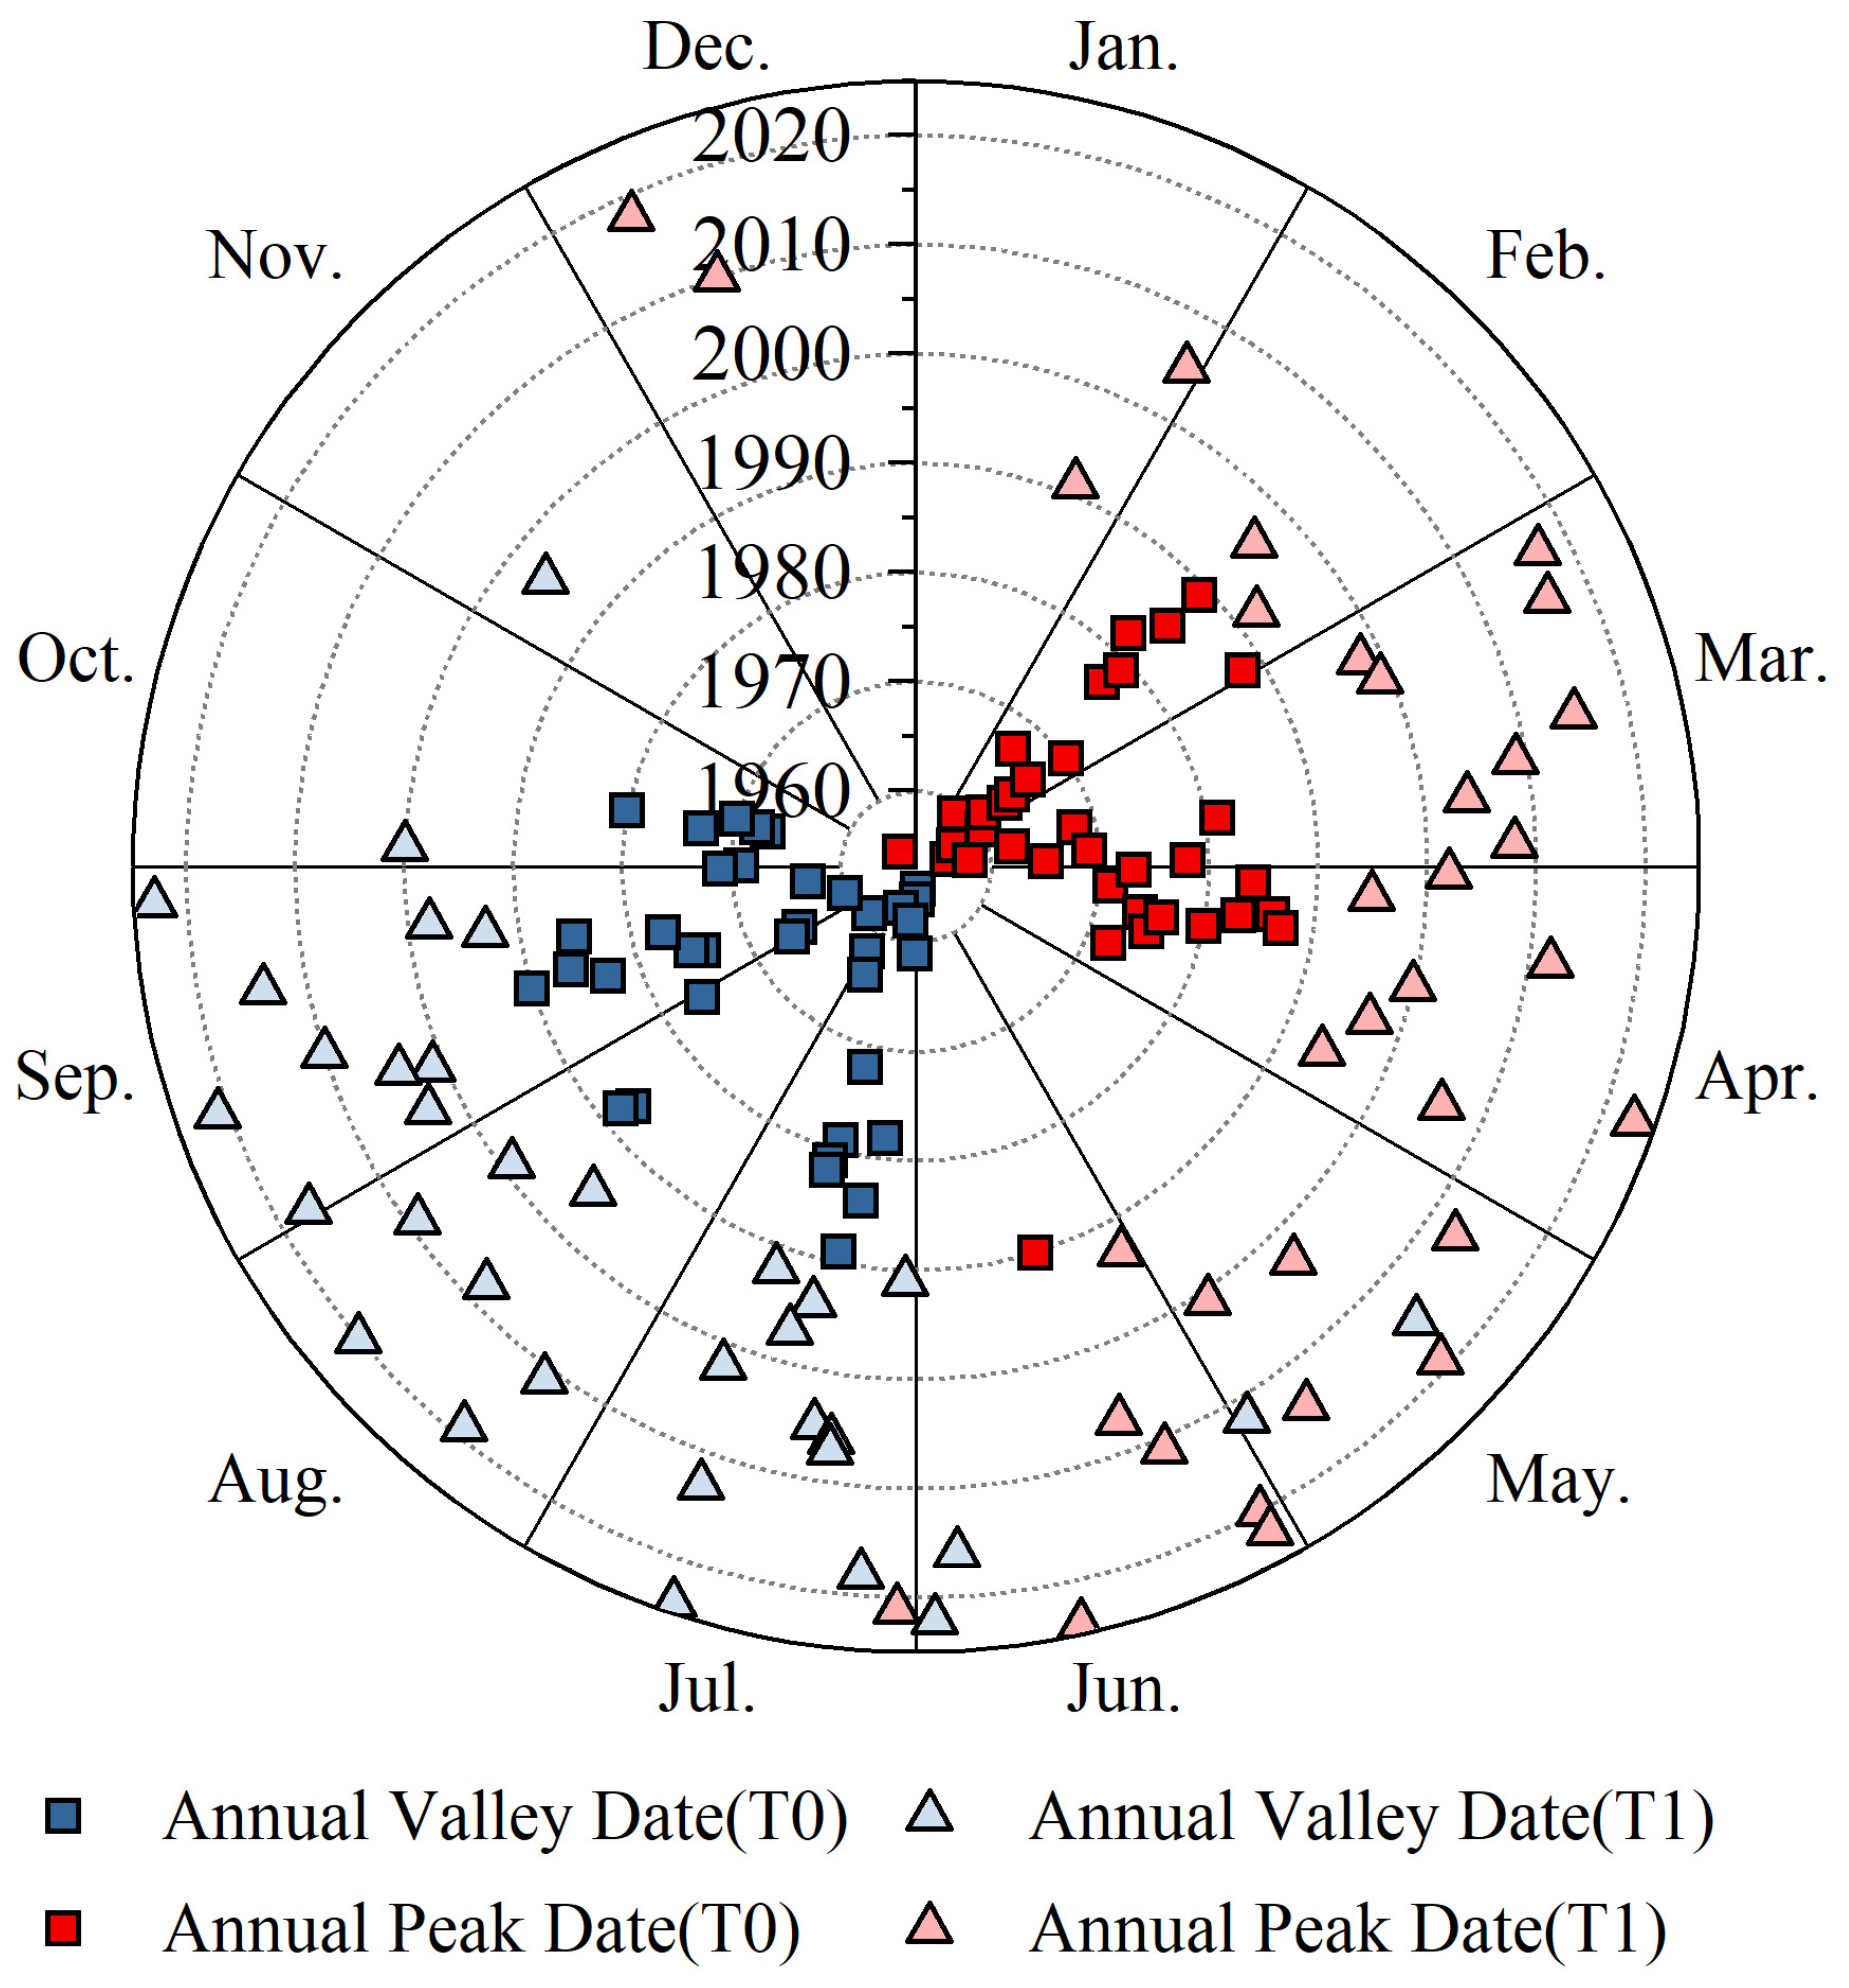
Both timing metrics for annual extreme water-level difference (ΔH) exhibited low alteration degrees. Figure 10 shows that the annual minimum 1-day ΔH timing remained highly stable (predominantly May–October; mean Julian day: 227), with minimal interannual variation across study periods. The annual maximum 1-day water-level difference (ΔH) timing primarily occurred during February–April. Between the P1 (1955–1990) and P2 (1991–2024) periods, the mean Julian day shifted from 72 to 115, with sporadic occurrences in January, May, June, and December, accompanied by significantly increased dispersion. Hydrological alterations collectively exerted more pronounced impacts on the timing of annual maximum 1-day ΔH events than on the other indicator (annual minimum 1-day ΔH).
For pulse frequency and duration metrics (Group 4), moderate alteration characterized the mean duration of high water-level difference (ΔH) events and the number of low ΔH events, whereas low alteration occurred in the number of high ΔH events and mean duration of low ΔH events. As shown in Table 5, P1 to P2 saw the frequency of high ΔH events increase from 5.64 to 9.32 events/year (+63.49%), whereas mean duration decreased from 23.54 to 9.17 days (−61%). Concurrently, the coefficient of variation (Cv) for high ΔH event frequency declined by 40%. The frequency of low ΔH events showed no significant change between P1 (1955–1990) and P2 (1991–2024), whereas mean duration decreased moderately (21.23 to 16.59). Collectively, although both the frequency of high water-level difference (ΔH) events and the mean duration of low ΔH events exhibited low alteration degrees, alterations in their mean values and coefficients of variation (Cv) were still observed. Critically, the alteration magnitudes for these high-ΔH indicators exceeded those of the low-ΔH metrics.
Among Group 5 ΔH metrics, the rising rate demonstrated moderate alteration, whereas the falling rate and reversal frequency exhibited low alteration. Mean values showed minimal changes between P1 (1955–1990) and P2 (1991–2024), with mean relative deviations <5%. Coefficients of variation increased by 60% for rising rates and 32% for falling rates, signaling significantly enhanced variability in rising rates during P2. Reversal frequency remained stable. Collectively, rising rate alterations were the most substantial within Group 5.

5. Discussion

From the perspective of West Dongting Lake or its basin, unlike other lakes or basins, West Dongting Lake features a dual-outlet system (NZ and XHZ). Comprehensive understanding of hydrological regime evolution at these outlets requires concurrent analysis of stage and discharge data for both outlets and their hydraulic connectivity. Located in the upstream section of the Dongting Lake complex, these outlets simultaneously serve as inlets to the downstream lake region. Consequently, hydrological changes at these outlets directly impact not only their immediate upstream areas but also the downstream lake ecosystems.

5.1. Inflow Dynamics to Dongting Lake

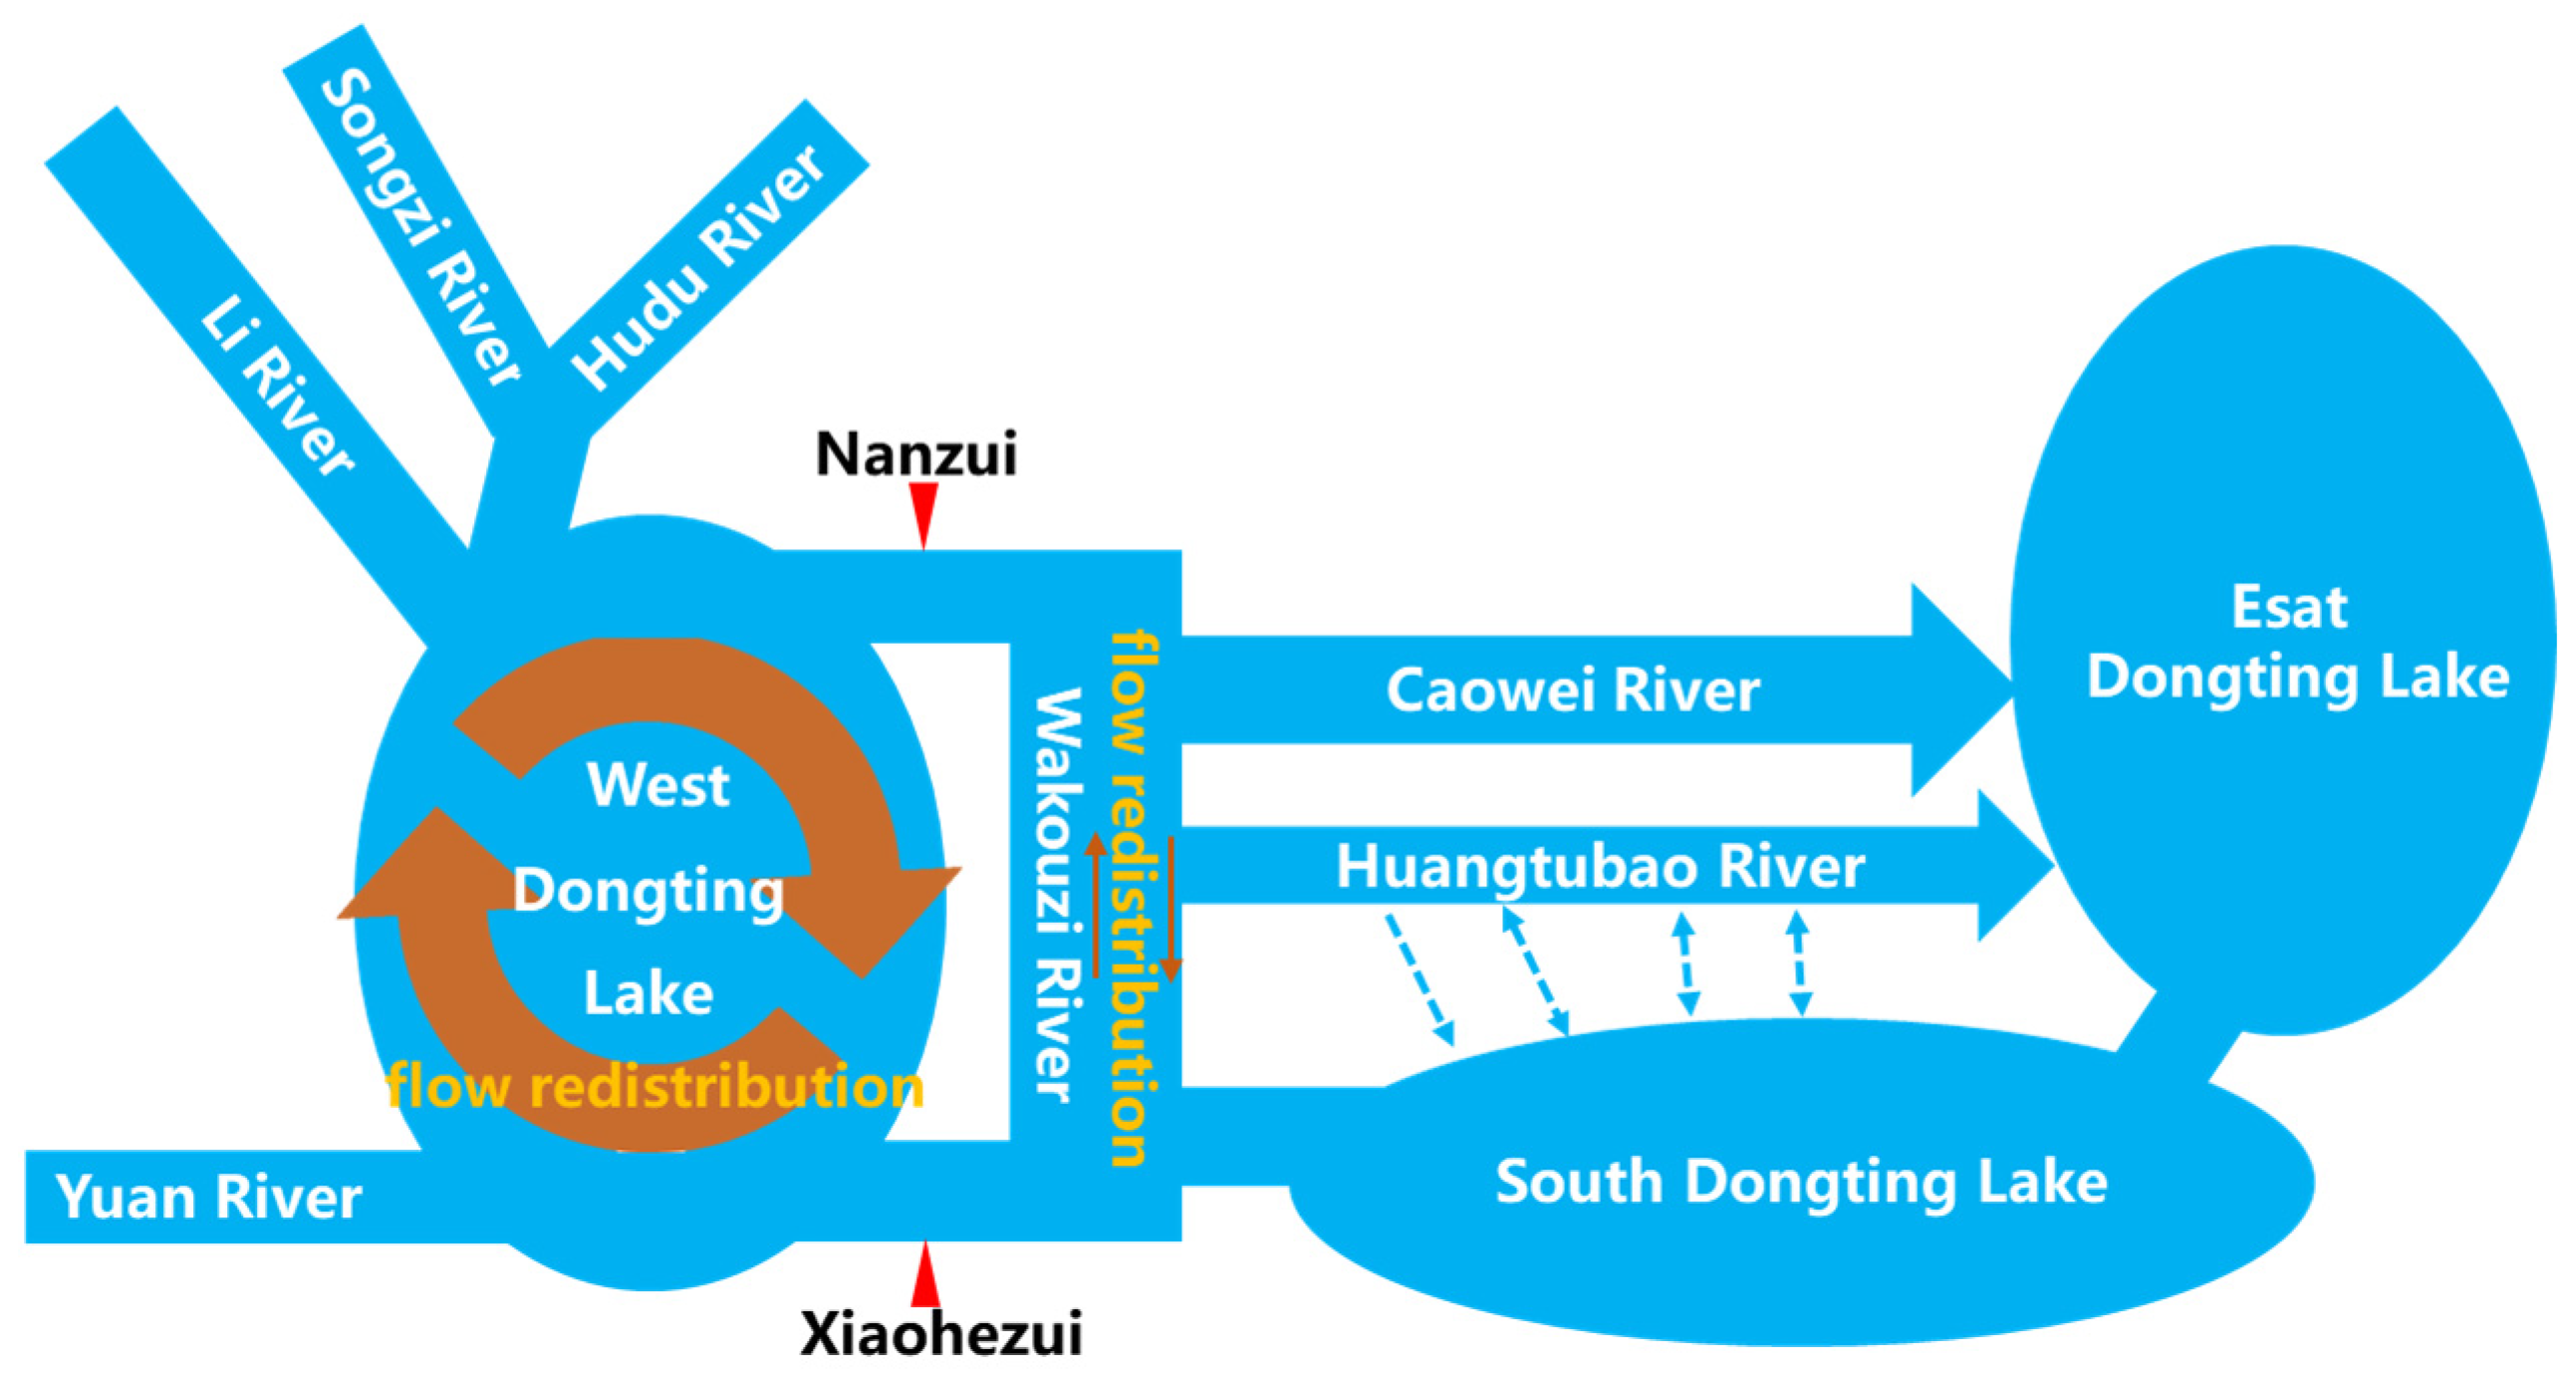
Variations in inflow to West Dongting Lake directly impact water level and discharge at XHZ and NZ outlets. The basin’s water sources comprise two components: (i) allogenic inflow diverted from the Yangtze River via the Songzi and Hudu Rivers and (ii) autogenic runoff generated internally, primarily from the Li and Yuan basins (Figure 11). Upon entering the lake, these discharges undergo hydrological exchange processes. The redistributed flows subsequently exit the lake through two hydraulic control sections, XHZ and NZ. As such, the water levels and discharges observed in these two sections represent the integrated result of upstream inflows after convergence and redistribution within West Dongting Lake, and their variations demonstrate a high degree of internal consistency. However, due to the widespread distribution of sediment-accumulated in-lake bars within West Dongting Lake, whose elevations exceed the dry-season water level, the internal redistribution of flow during the dry season is significantly weakened. Furthermore, the extent of flow redistribution varies throughout the year, resulting in weak consistency in the degree of flow alteration observed at XHZ and NZ across different months.
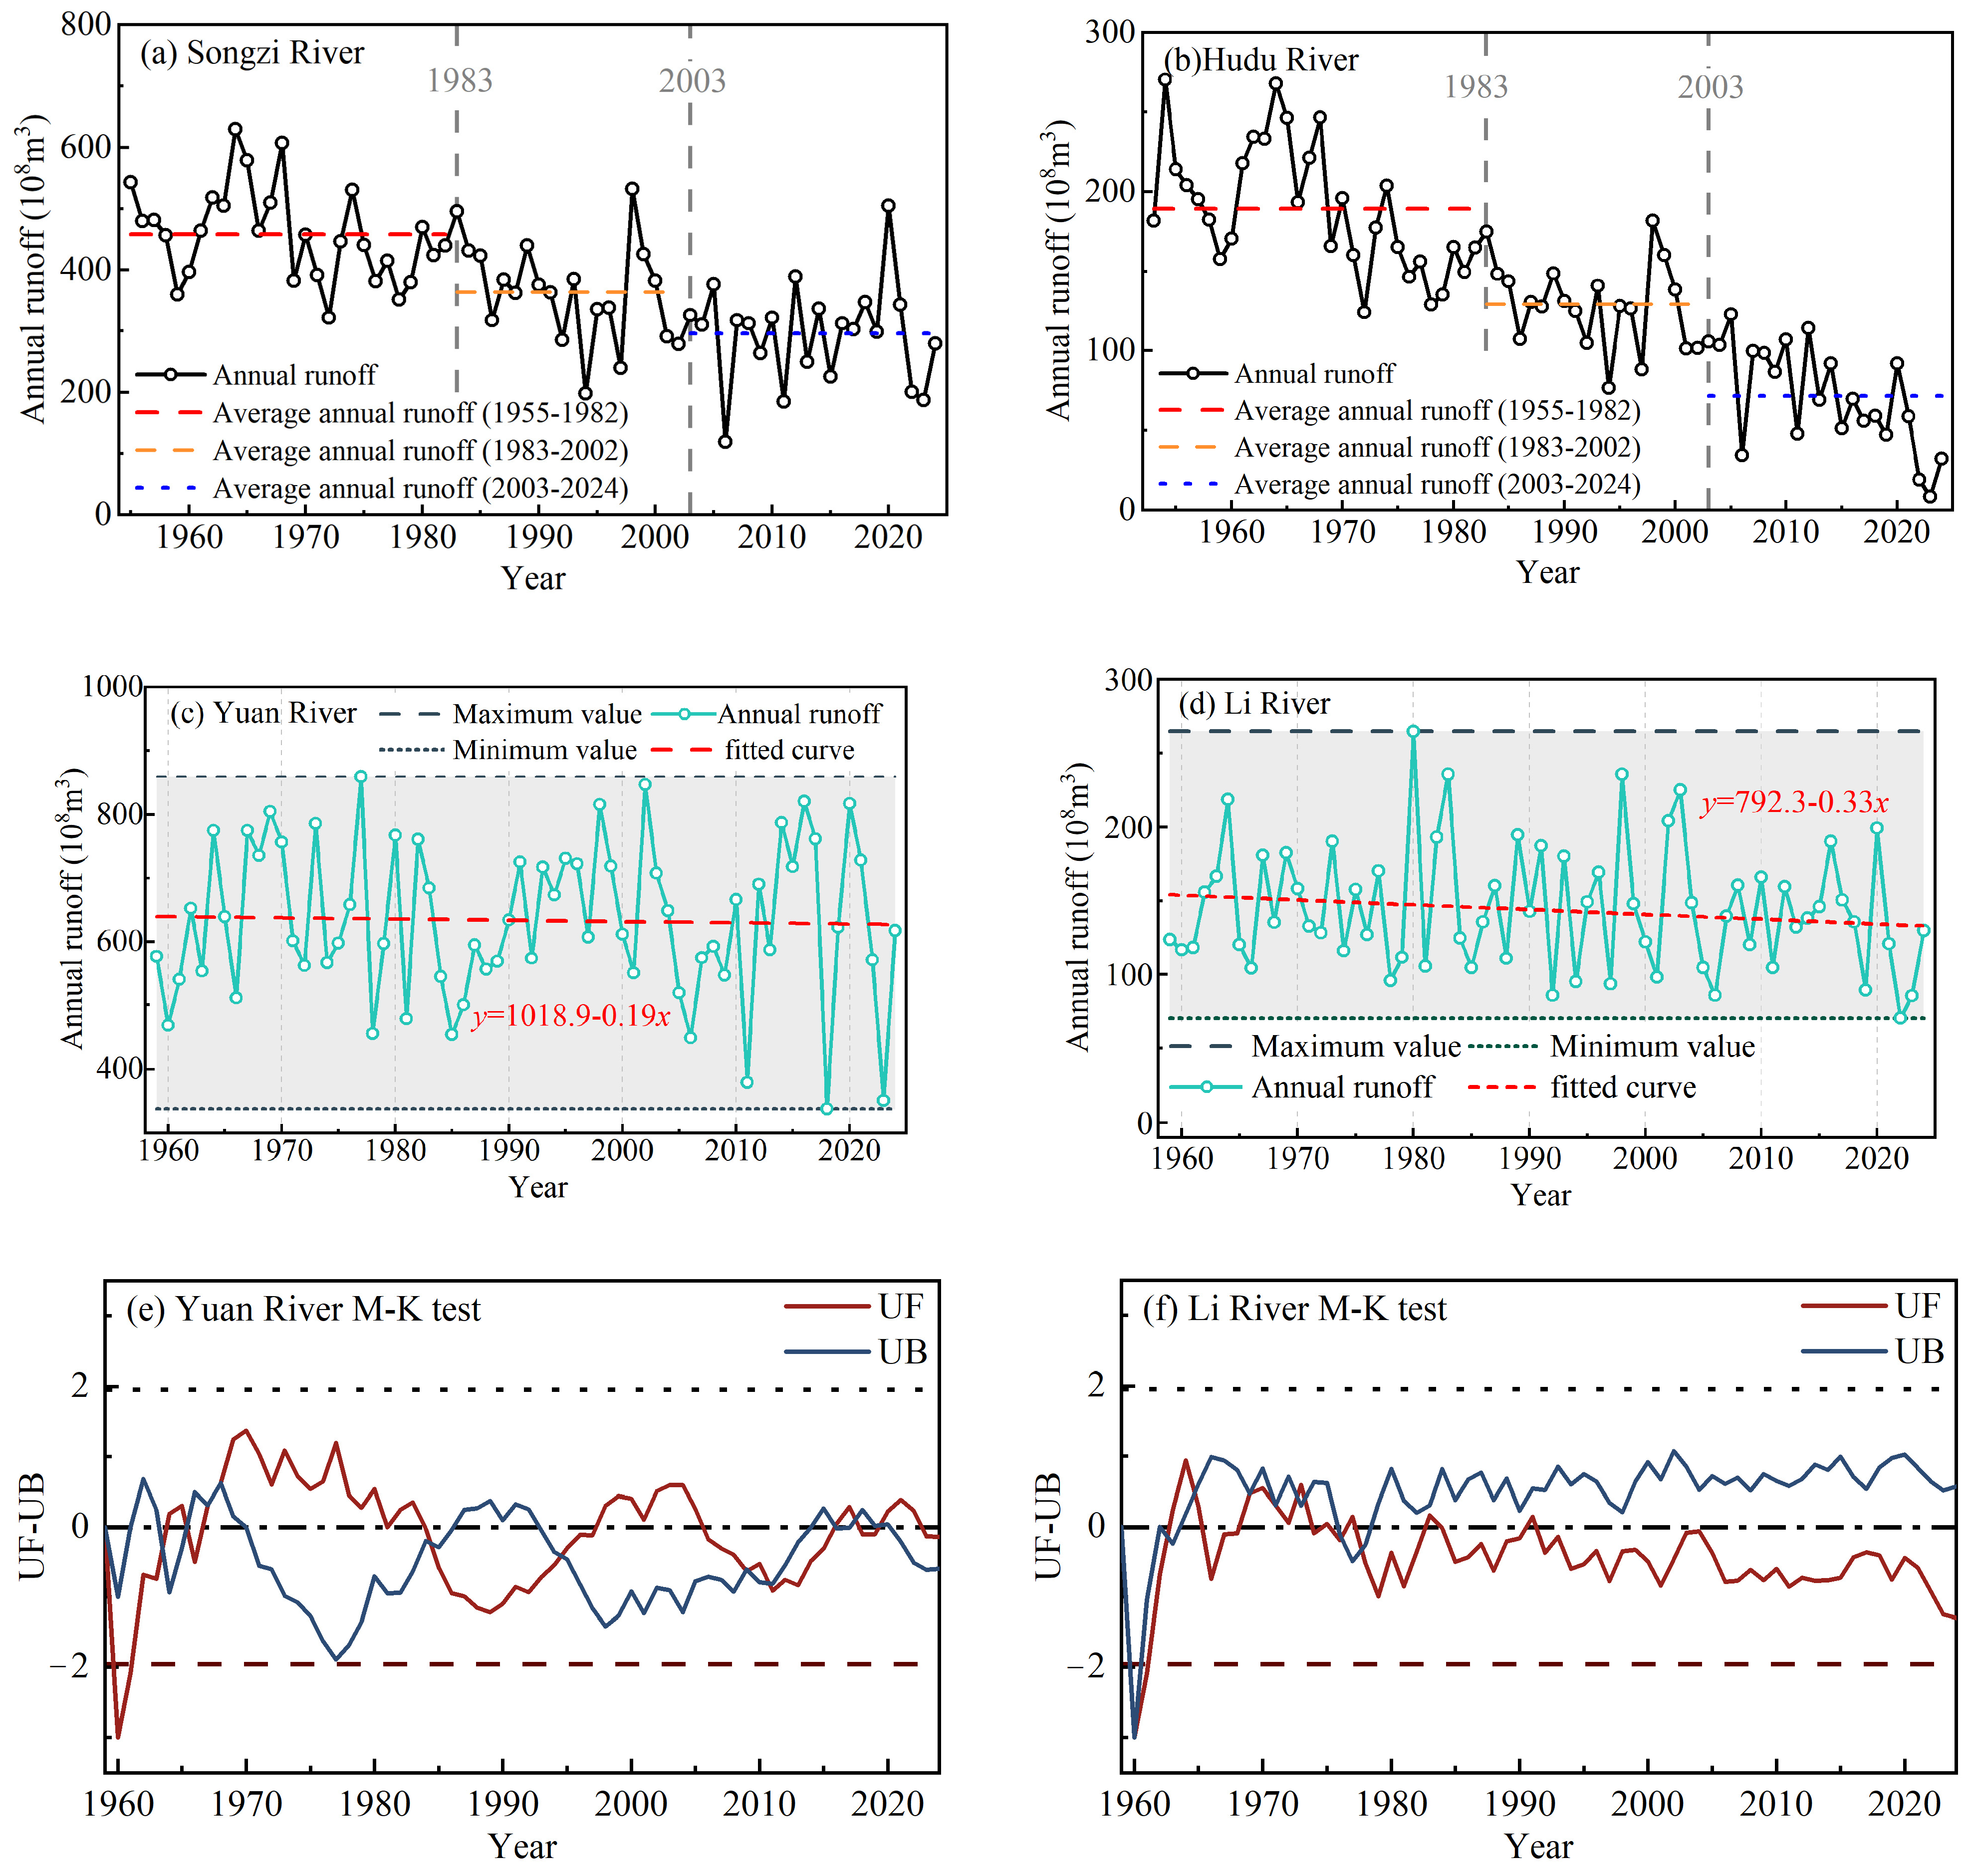
Analysis reveals that synchronous abrupt shifts in water level and discharge occurred at XHZ and NZ stations in both 1983 and 2003, demonstrating strong temporal coherence in hydrological responses. Figure 12 illustrates the temporal variations in annual runoff for rivers discharging into West Dongting Lake, revealing significant declining trends in both the Songzi River (SZR) and Hudu River (HDR). The Songzi River exhibited a significant decreasing trend in annual discharge (slope = −3.21, p < 0.001), while the Hudu River similarly demonstrated a substantial decline (slope = −2.48, p < 0.001). For the SZR, the long-term mean annual runoff (1955–2024) was 38.032 × 10⁹ m3, with values of 45.808 × 10⁹ m3 in T0 and 36.433 × 10⁹ m3 in T1, indicating a reduction of 9.375 × 10⁹ m3 in T1 relative to T0; during T2, the runoff further decreased to 29.589 × 10⁹ m3, representing a decline of 6.844 × 10⁹ m3 compared to T1. Similarly, for the HDR, the long-term mean (1955–2024) was 13.810 × 10⁹ m3, declining from 18.923 × 10⁹ m3 (T0) to 12.935 × 10⁹ m3 (T1) with a reduction of 5.988 × 10⁹ m3, and ultimately reaching 7.151 × 10⁹ m3 in T2, corresponding to a decrease of 5.784 × 10⁹ m3 from T1. As distributary channels, the Songzi and Hudu Rivers undergo progressive functional decline under natural evolution. Concurrently, channel straightening and dam construction on the Yangtze mainstem have triggered bed incision at diversion inlets, accelerating the recession of the Songzi and Ouchi Rivers. Planned river training projects will sustain bifurcation capacity, exerting persistent impacts on West Dongting Lake’s hydrological regimes.
The Yuan River (YR) and Li River (LR) exhibit marked interannual runoff variability. From 1959 to 2024, their long-term mean annual inflows into the lake were 63.349 × 10⁹ m3 and 14.483 × 10⁹ m3, respectively. Minor slopes in fitted curves, coupled with Mann–Kendall (M-K) test results, the Yuan River exhibited a significant decreasing trend in annual discharge (slope = −0.87, p = 0.042), while the Li River demonstrated a statistically significant decline (slope = −0.58, p = 0.027).
The Songzi and Hudu Rivers exhibited significantly greater discharge reduction rates (Songzi: slope = −3.21; Hudu: slope = −2.48) compared to the Yuan (slope = −0.87) and Li Rivers (slope = −0.58). These substantially higher flow reductions suggest that decreased discharges from the Songzi and Hudu Rivers constitute the primary driver of outflow decline in West Dongting Lake. Consequently, hydrological alteration degrees (HAD) at NZ Station exceeded those at XHZ Station due to reduced flow diversion through the SZR and HDR.

5.2. Impacts of Precipitation Changes and Human Activities

Runoff from the Li and Yuan basins contributes over 67% of total inflow to West Dongting Lake (post-Three Gorges Dam completion). Precipitation constitutes the dominant control on runoff variations. Mann–Kendall tests were applied to annual precipitation data from 70 meteorological stations across the Li and Yuan River basins. Station-level analyses revealed divergent trends, while basin-scale assessments demonstrated significant decreasing precipitation trends: Yuan Basin (slope = −1.92, p = 0.016) and Li Basin (slope = −1.85, p = 0.038). Runoff from the Li and Yuan basins contributes over 67% of total inflow to West Dongting Lake (post-Three Gorges Dam completion). Precipitation and anthropogenic activities constitute the dominant driver of runoff variation, necessitating quantitative partitioning of precipitation and anthropogenic impacts on runoff generation across these basins.
Figure 13 presents the temporal evolution of cumulative runoff depth and cumulative precipitation versus calendar year across the Li and Yuan River basins. Per SCRAQ method results, the Li and Yuan basins exhibited increased precipitation but decreased runoff during period T1, with precipitation paradoxically contributing −42.88% and −116.28% to runoff changes, respectively, demonstrating that anthropogenic activities were the dominant driver of hydrological transformations. During period T2, precipitation contributed 23.73% to runoff variations in the Li Basin, while anthropogenic activities accounted for 76.27%—representing a 3.21-fold dominance over precipitation impacts. In the Yuan Basin, precipitation and anthropogenic contributions were 51.33% and 48.67%, respectively, indicating near-equilibrium conditions.
Figure 14 shows the relationship between runoff depth and precipitation across distinct temporal phases in the Li and Yuan River basins. In the Li River Basin, runoff depth and precipitation maintained statistically significant linear relationships across all periods (R2 > 0.88). Regression slopes during T0 and T1 showed minimal differences, while the T2 slope decreased by 0.2401 compared to T1—indicating runoff decreases when precipitation remains identical. In the Yuan River Basin, linear regression between runoff depth and precipitation yielded R2 values > 0.72 across all periods—marginally lower than those in the Li Basin—indicating stronger precipitation control on runoff generation in the latter. Progressive declines in regression slopes occurred over successive periods, likely associated with flow-regulating infrastructure (e.g., reservoirs), agricultural water withdrawals, and intensified land-use changes.
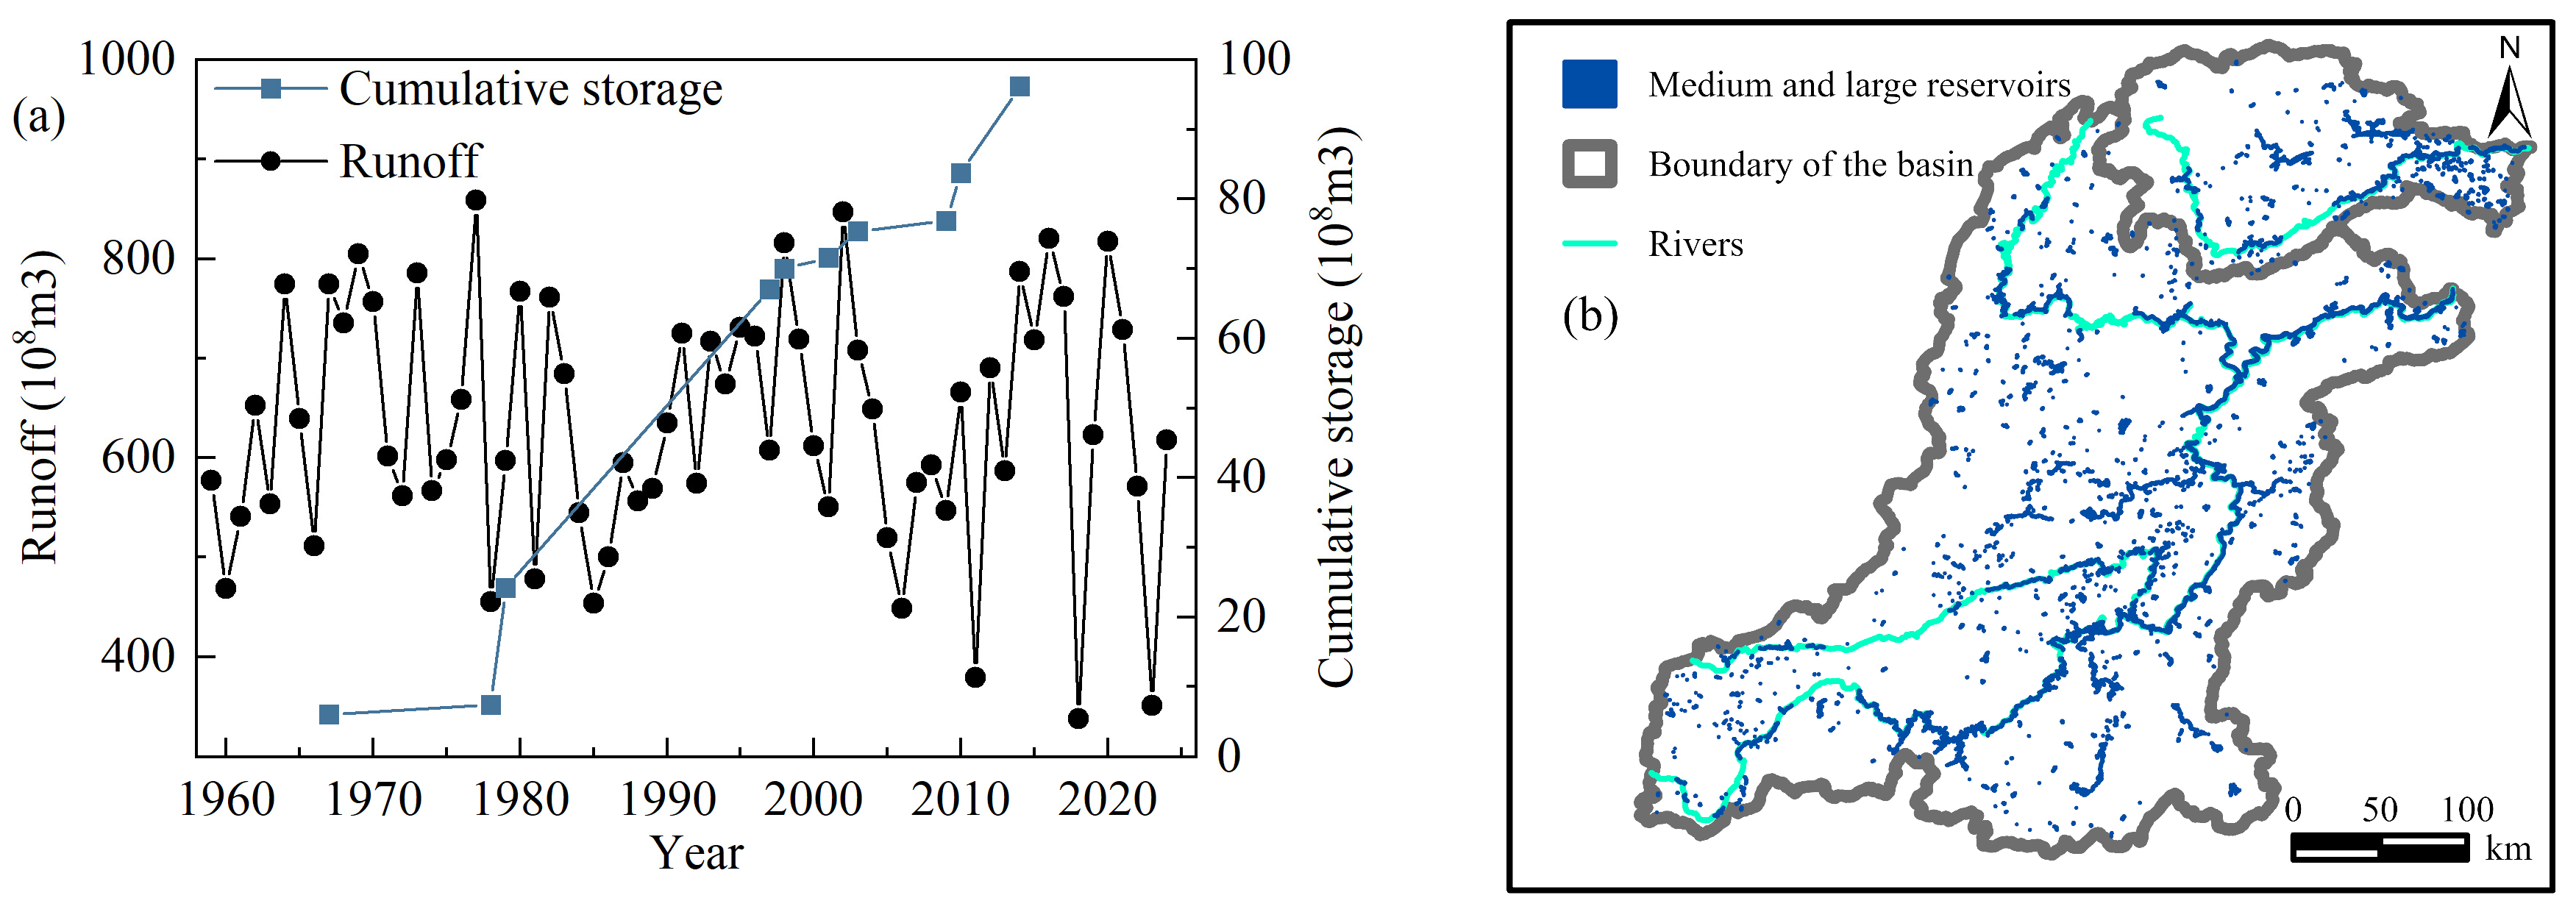
Capitalizing on favorable physiographic conditions—notably pronounced topographic gradients and high precipitation volume—the Dongting Lake Basin has emerged as a vital region for hydraulic infrastructure development in China. To address multifunctional demands including flood mitigation, water resource allocation, and agricultural irrigation, systematic construction of reservoir networks has established an integrated water regulation system. By 2022, over 10,000 reservoirs of varying scales were operational across the basin, forming the foundation for regional water resources governance. Table 6 details operational large-scale reservoirs in the Li and Yuan River basins. Systematic development of these reservoirs since the 1960s has critically enabled the following: (i) spatiotemporal runoff redistribution, (ii) flood hazard mitigation, (iii) guaranteed agricultural water supply, and (iv) ecological security maintenance.
Using the Yuan Basin as a representative case, Figure 15 demonstrates the relationship between cumulative large-reservoir storage capacity and annual runoff volume, large-scale reservoir construction exerts limited influence on annual runoff volumes. As planned reservoirs are gradually constructed within the basin, changes in the underlying surface will increase evaporation, further affecting runoff variation. Reservoir operations primarily redistribute intra-annual runoff patterns. As the storage-to-runoff ratio increases, these systems substantially alter downstream hydrological regimes—particularly affecting monthly low-flow statistics and extreme flow metrics.
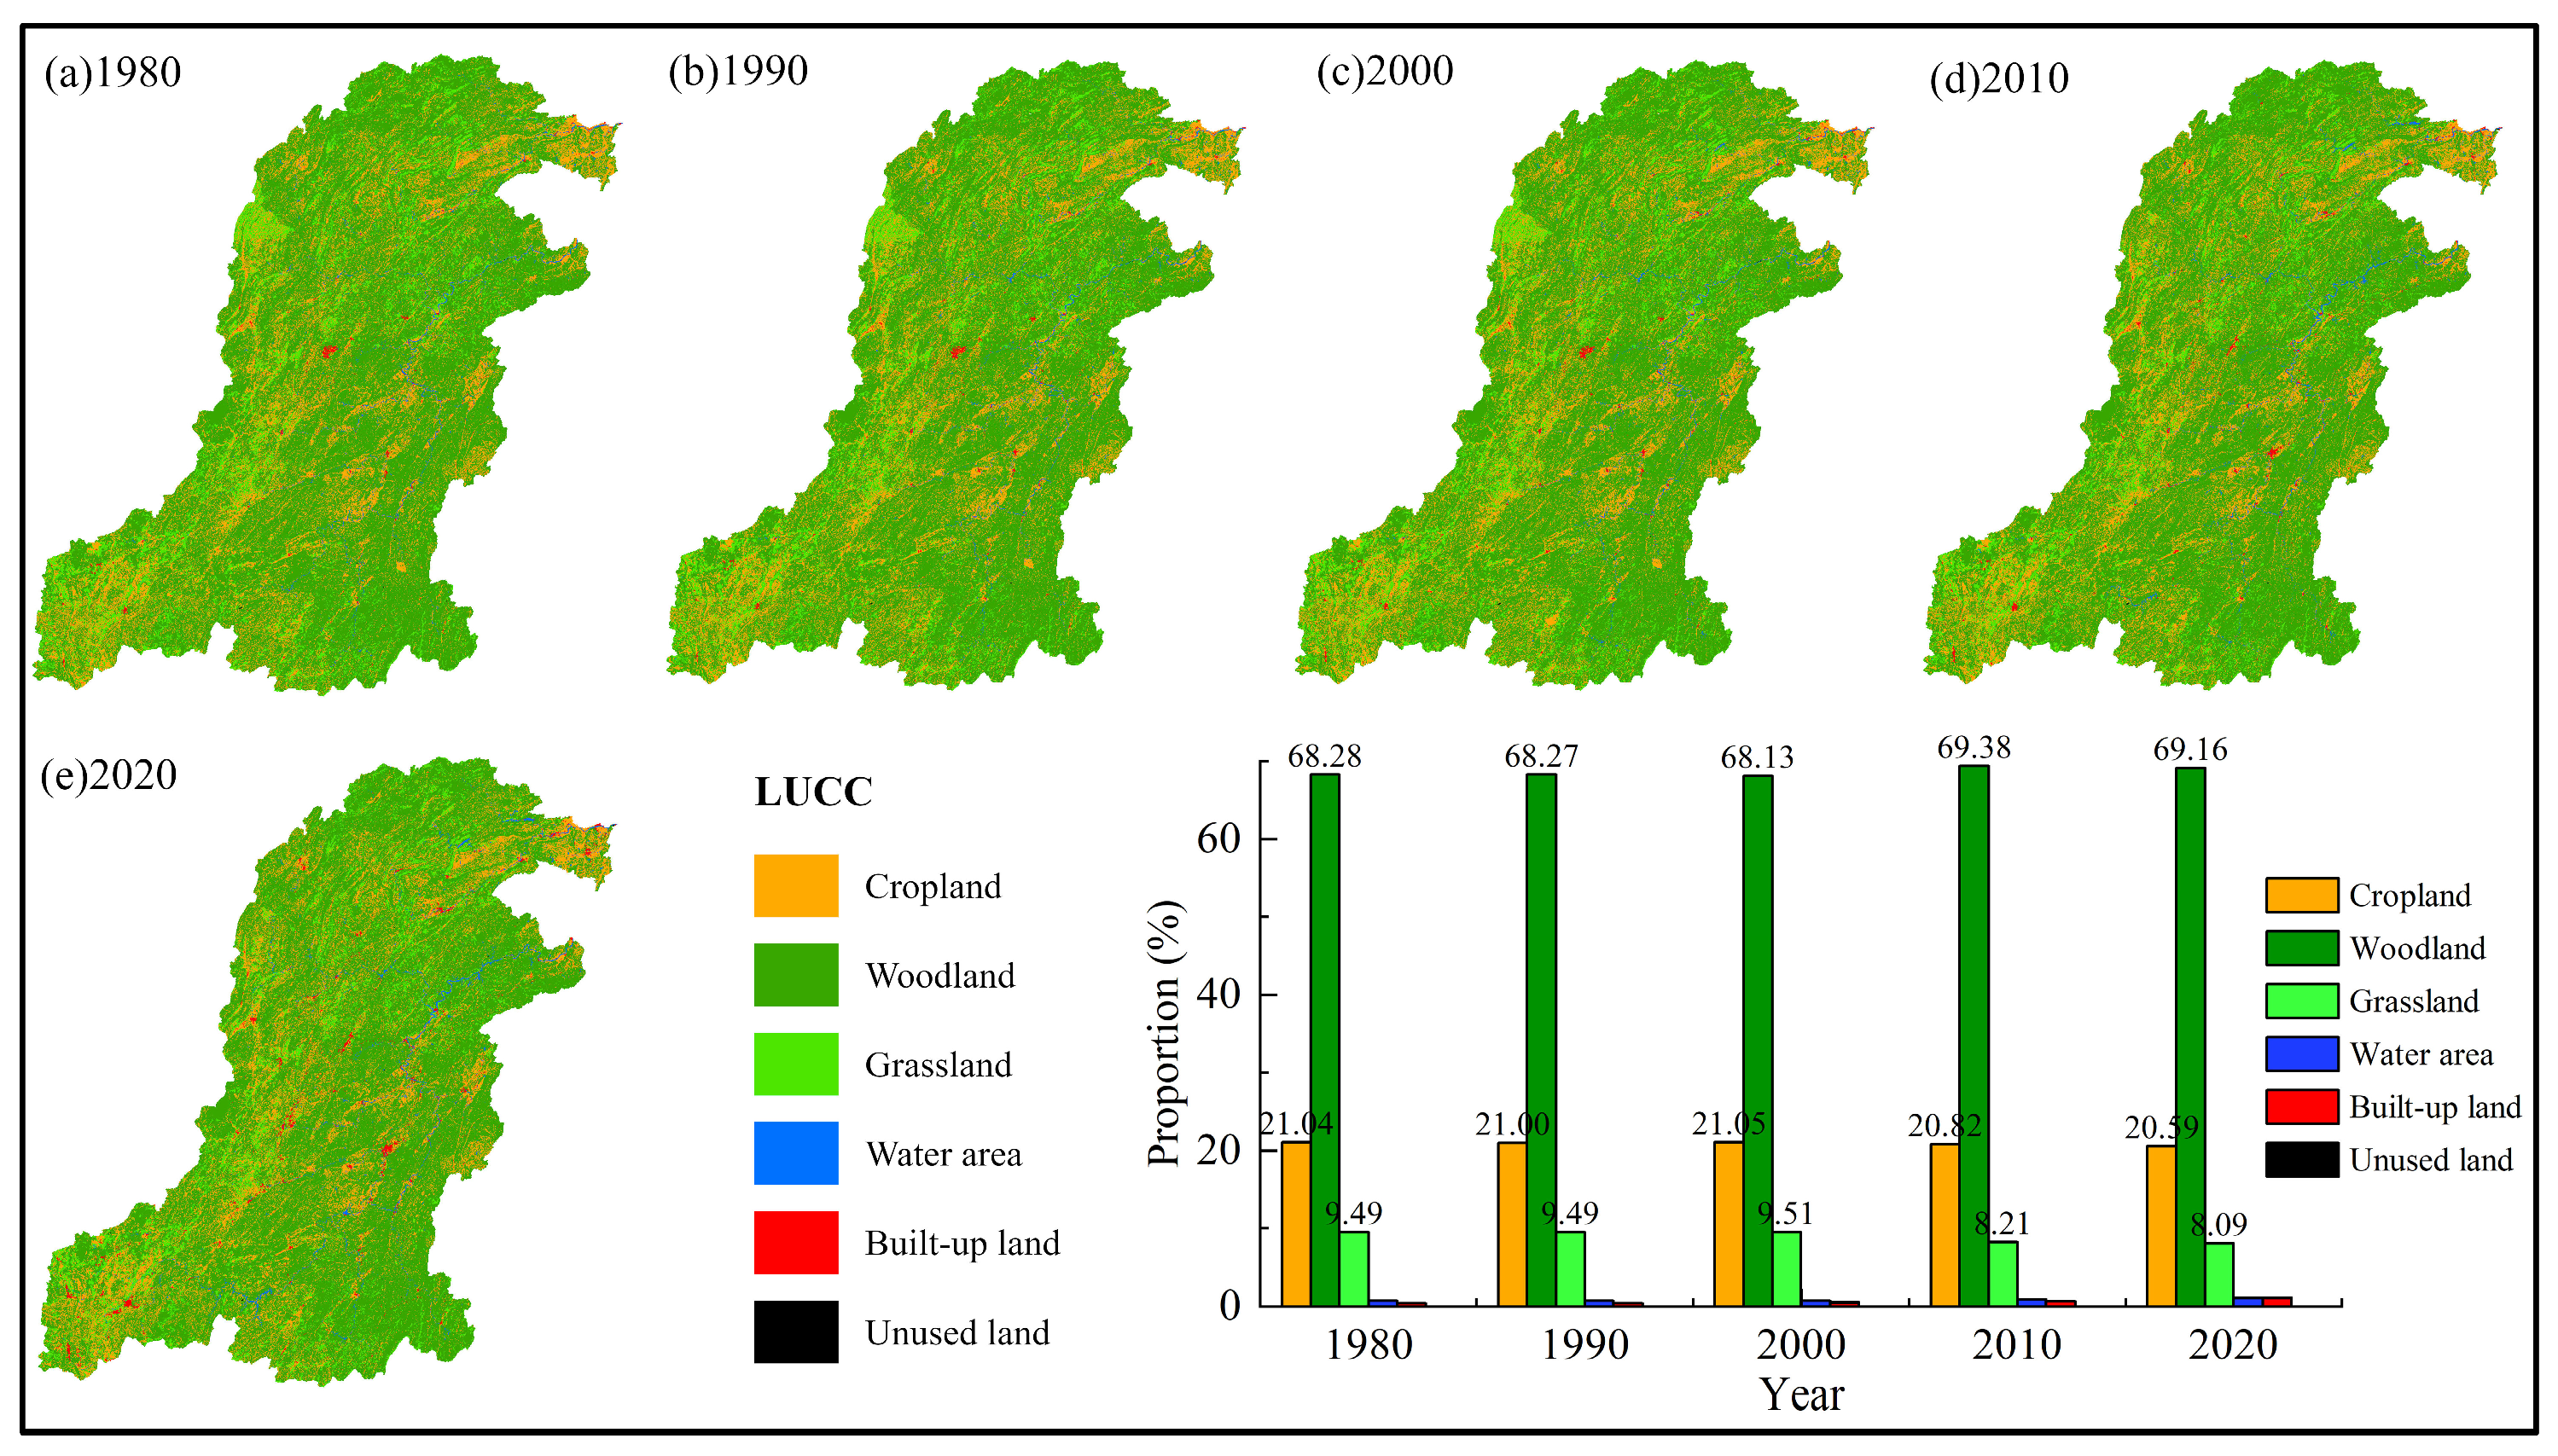
Land-use and land cover change (LUCC) in the Li and Yuan River basins was analyzed for 1980, 1990, 2000, 2010, and 2020 to assess decadal variations. Figure 16 illustrates the spatiotemporal distribution of LUCC patterns and proportional area changes across land-use categories during these periods. The Li and Yuan River basins are characterized predominantly by mountainous and hilly terrain. Forestland and cropland constitute the primary land-use types, collectively accounting for over 89% of the total basin area. Forest coverage has consistently exceeded 68% of the total area across all observed periods, demonstrating its critical role in maintaining regional ecological stability and functional integrity. Overall, forestland, water bodies, and built-up areas exhibit significant expansion trends, while cropland and grassland show substantial reductions. These land-use changes are primarily driven by regional economic development, socio-political interventions, and land management policies, reflecting profound anthropogenic influences on landscape transformation. Although land-use changes occurred across all categories, the overall magnitude of alteration remained limited. Forestland increased by less than 1.5%, while grassland decreased by under 1.5%. Built-up areas expanded by 0.64%, whereas cropland reduction and water body increase both remained below 0.5% during the study period. Due to the geomorphic characteristics of the Li and Yuan basins and the small land-use changes, it can be considered that the impact of land-use changes on runoff is small. Some scholars believe that against the background of small land-use changes, climatic factors (such as precipitation and temperature) are usually the dominant drivers of runoff changes, while the impact of land-use changes is difficult to quantify [57,58].

5.3. Discharge Variation Driven by Water-Level Gradients

Water level variations at XHZ and NZ stations are influenced not only by the aforementioned flow changes but also by downstream backwater effects and topographic alterations. The Hydrological Alteration Degrees (HAD) analysis reveals coherent variation patterns at both stations. This coherence is attributed to strong hydraulic connectivity through their interconnected downstream channels, resulting in mutually influential water level dynamics.
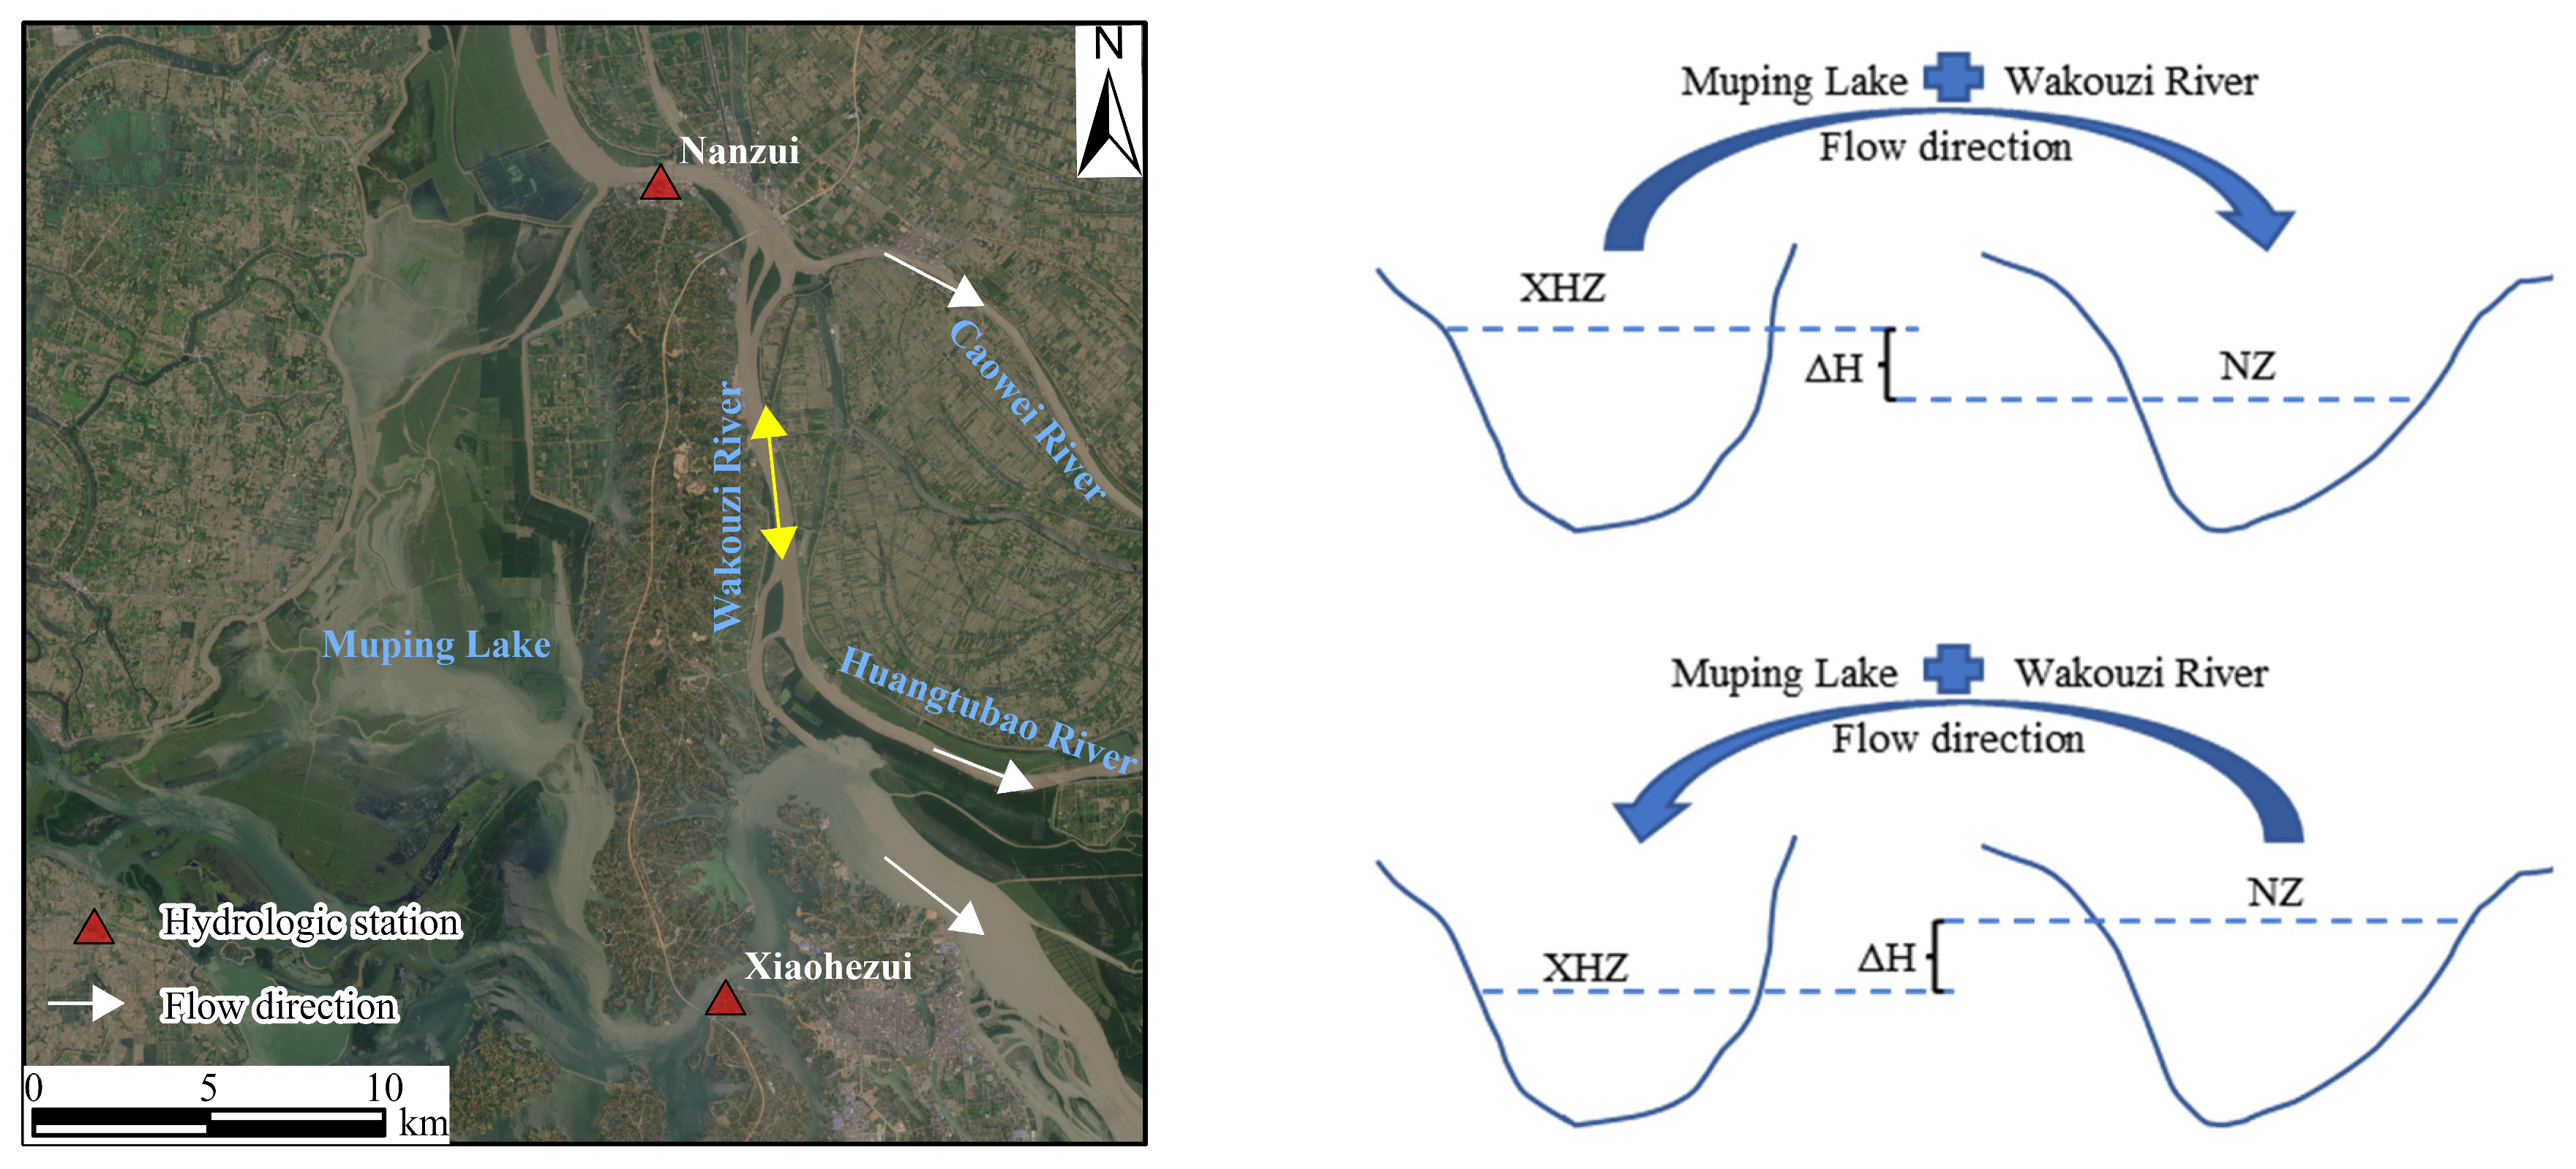
The water level difference between XHZ and NZ stations constitutes a critical indicator for characterizing hydrological regime shifts in West Dongting Lake. A statistically defined changepoint (that is to say, an abrupt shift) in this difference occurred in 1991. This temporal marker exhibited asynchrony with transitional points identified in individual water levels and discharge series at these stations. Such temporal divergence reflects the difference’s composite nature as an integrated metric encompassing synergistic effects—including but not limited to discharge variations, backwater interference, and geomorphic adjustments—stemming from complex lake-river interactions. Flow redistribution occurs through three distributary channels diverging from the Wakouzi River downstream of XHZ and NZ stations. Discharges partition into the following: (1) the Caowei River directly entering East Dongting Lake; (2) the Huangtubao River; and (3) South Dongting Lake. Between pathways (2) and (3), hydrodynamic exchange occurs via anastomosing lacustrine channels before final convergence into East Dongting Lake. The control sections at XHZ and NZ stations are located approximately 5 km and 4 km upstream of their respective downstream distributary nodes. Given the relatively wide lake surface and gentle water surface slope, the variation in water level difference between XHZ and NZ can effectively reflect changes in flow redistribution. The flow direction of the Wakouzi River is determined by the sign of the water level difference (ΔH = HXHJ − HNJ) between XHZ and NZ stations: negative ΔH indicates flow from NZ to XHZ, while positive ΔH indicates flow from XHZ to NZ (Figure 17).
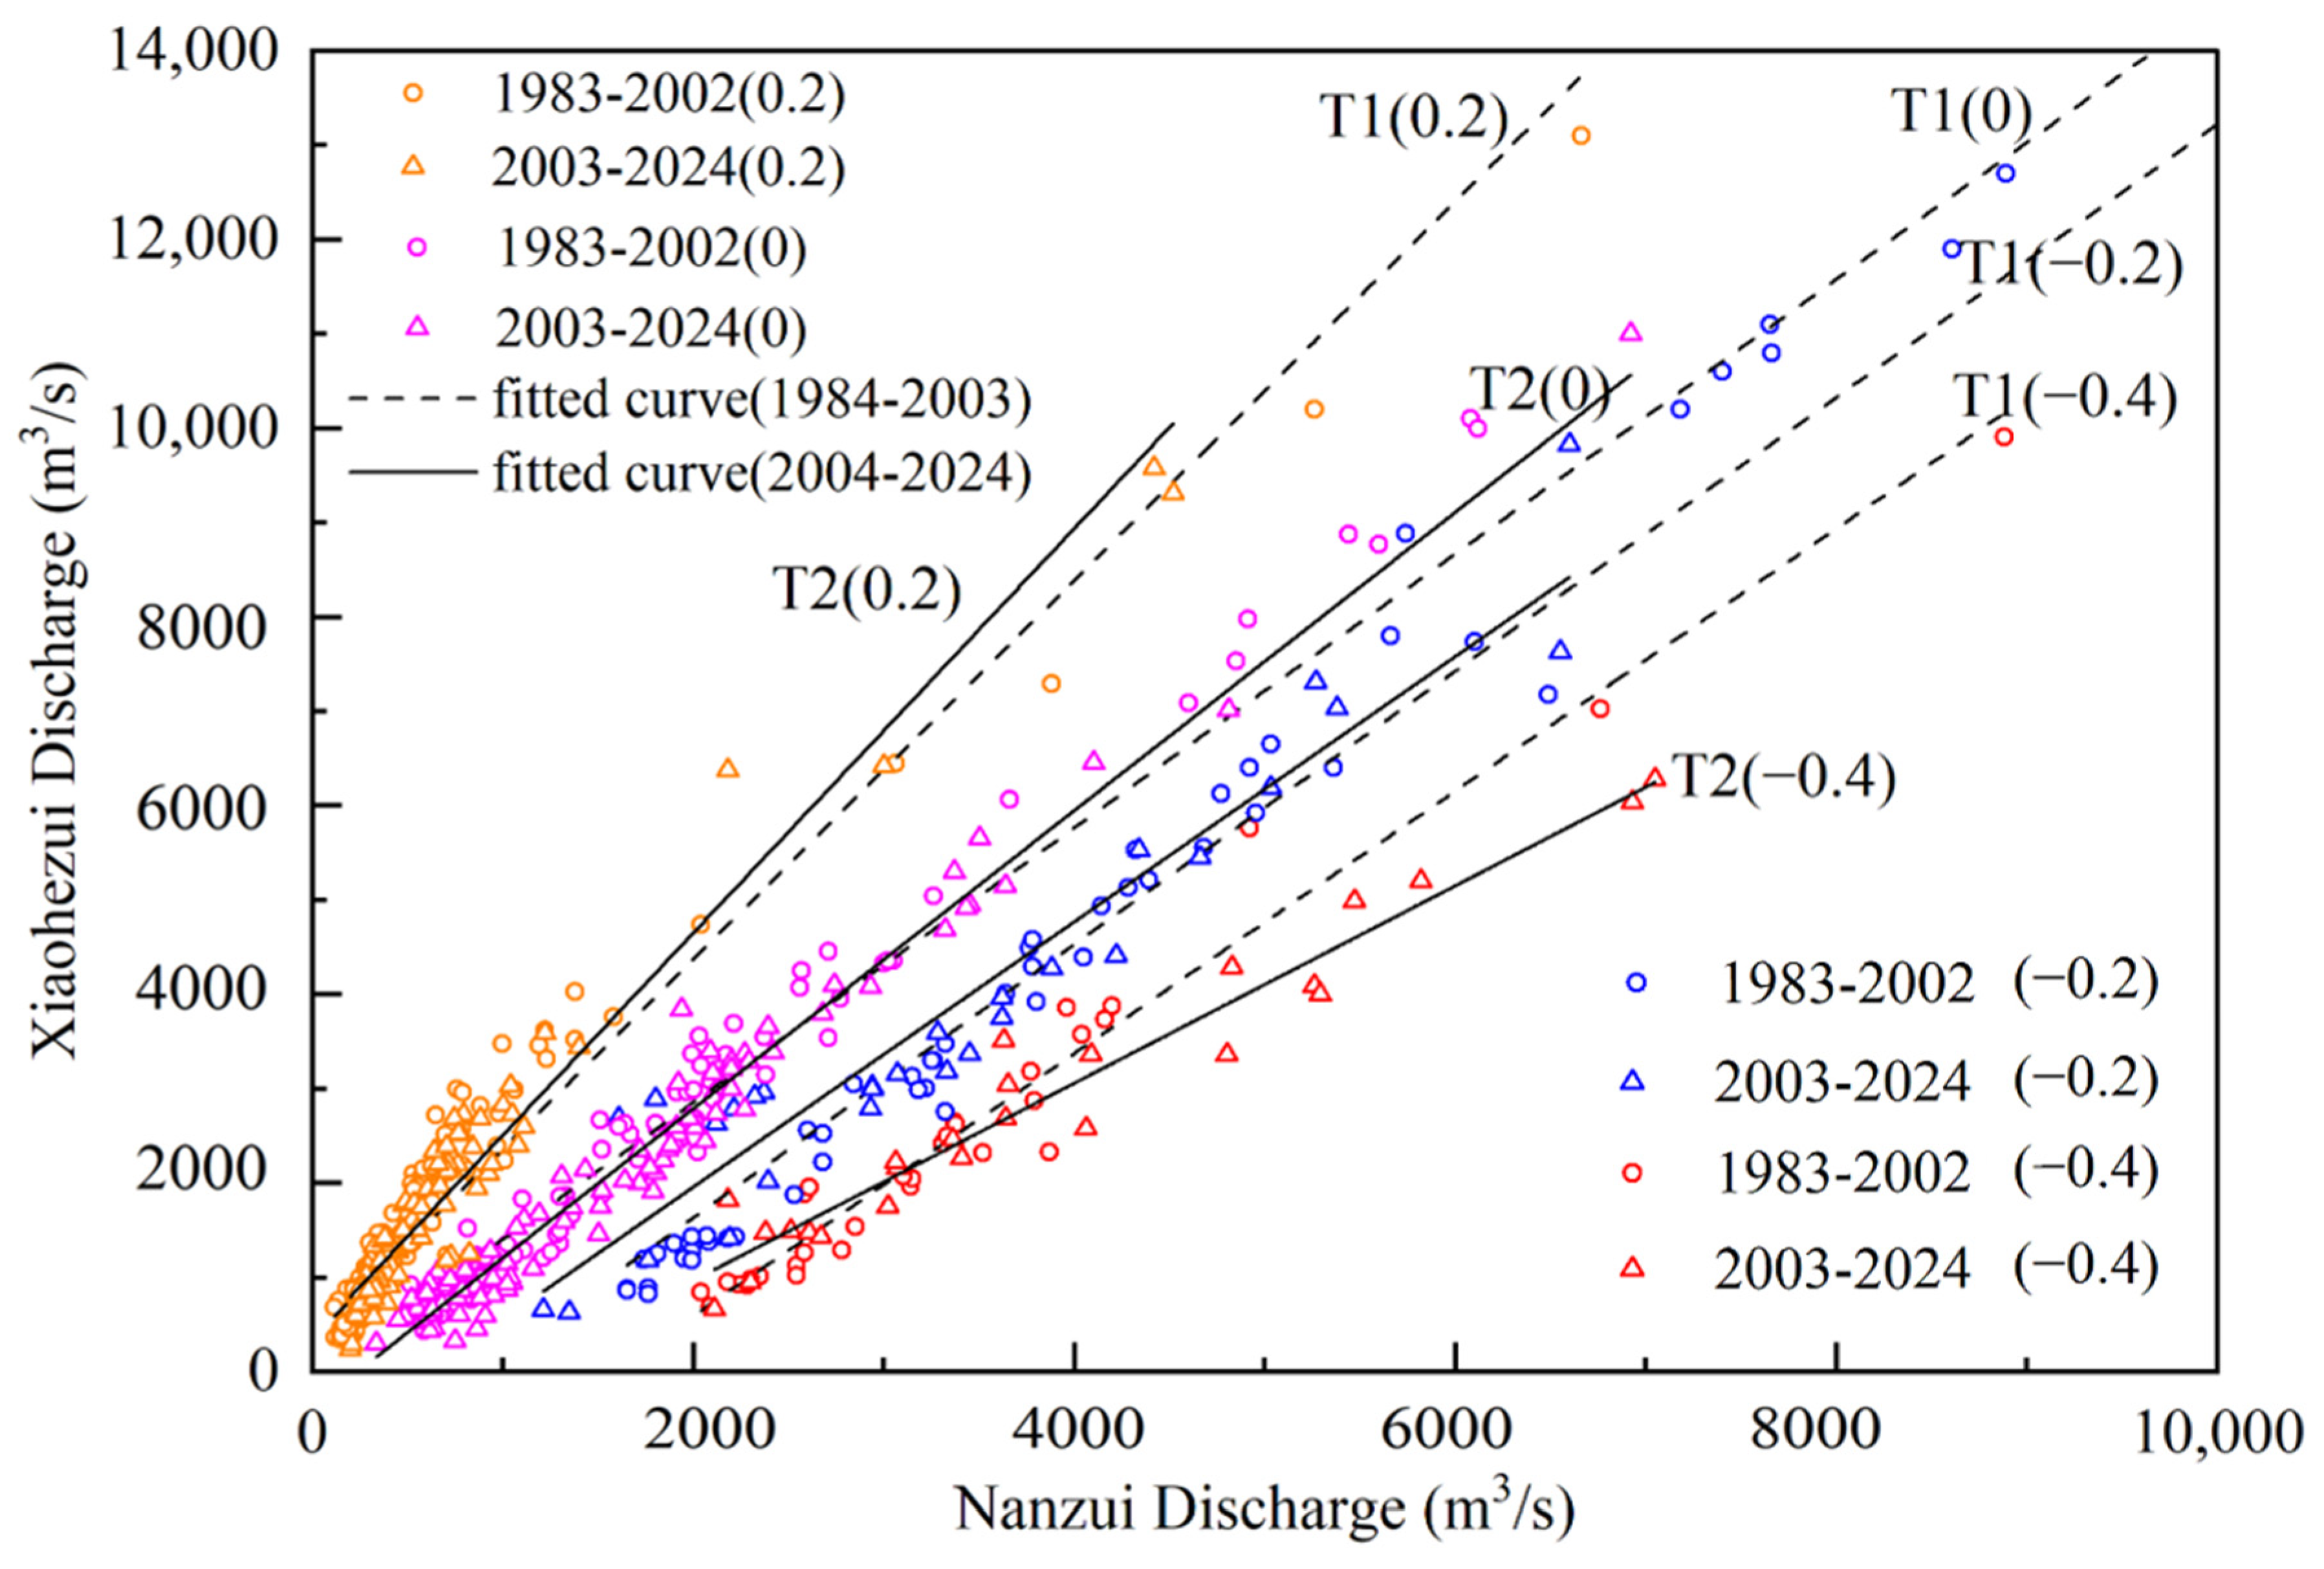
To investigate the relationship between water level difference and discharge at XHZ and NZ stations, discharge values corresponding to varying water level differences during periods T1 (1983–2002) and T2 (2003–2024) were plotted, as shown in Figure 18. When the water level difference (ΔH) is held constant, the discharges at XHZ and NZ stations exhibit a statistically significant positive correlation. The discharge point data corresponding to different water level differences (ΔH) at XHZ and NZ stations exhibit distinct stratification. As the magnitude of ΔH decreases, the discharge points systematically shift rightward in their plotting positions. When discharge at XHZ remains constant, higher discharge at NZ correlates with reduced water level difference (ΔH). At ΔH = 0.2 m and ΔH = 0 m, discharges at both stations are predominantly concentrated in the low- to medium-flow range. When ΔH = 0.4 m, discharge at NZ consistently exceeds 2000 m3/s. Regression analyses of the XHZ-NZ discharge relationship under varied ΔH and periods consistently yield coefficients of determination (R2) > 0.91 for all scenarios, confirming excellent fitting performance of the regression curves (Table 7). The smaller the water level difference (ΔH), the smaller the slope of the linear regression lines. At ΔH = −0.4 m, the slope decreases in T2 relative to T1, indicating higher discharge at NZ under constant XHZ flow; at ΔH = −0.2 m, slopes show minimal variation between periods (T1: 1.41 and T2: 1.45); at ΔH = 0 m and 0.2 m specifically, elevated slopes demonstrate reduced NZ discharge for equivalent XHZ flow conditions. Collectively, when the flow direction is from NZ to XHZ, increased discharge at NZ is required to maintain a given water level difference (ΔH) under constant XHZ flow; conversely, when the flow reverses (XHZ to NZ), reduced NZ discharge occurs. This pattern suggests enhanced water conveyance through downstream channels proximal to NZ, potentially associated with altered hydraulic capacity in water conveyance channels within downstream lake sections.

5.4. Negative Impacts on Ecosystems

In wetland ecosystems, particularly floodplain lakes such as Dongting Lake, dynamic changes in open-water and marsh areas exhibit strong positive correlations with waterbird abundance and species diversity. Water-level fluctuations constitute the central driver of these ecological relationships and are widely recognized as the paramount variable shaping wetland ecological structure and functioning [59]. Cyclical water-level fluctuations constitute not merely hydrological processes but primary drivers that profoundly govern ecosystem successional trajectories [60,61,62]. In Dongting Lake, water-level rise during the mid-dry season significantly alters lacustrine landscape patterns: deep-water zones expand into shallow-water habitats, while shallow-water areas encroach upon mudflat regions, driving statistically significant changes in the proportional coverage of distinct habitat types [63]. Alterations in hydrological regimes (e.g., advanced dry seasons due to Three Gorges Dam impoundment) directly modify wetland inundation conditions [64,65], thereby establishing the primary driver of spatial distribution and areal dynamics for key wetland vegetation species, including short-leaved sedge (Carex breviculmis) and common reed (Phragmites australis). Research indicates that key hydrological variables governing these vegetation dynamics include mean and minimum water levels during the wet season, along with mean, minimum, and maximum water levels during the dry season [66]. Water-level fluctuations significantly regulate vegetation succession trajectories and spatiotemporal carbon sequestration patterns [67] by altering submersion regimes across elevation gradients, which follow Gaussian response relationships with sedge communities exhibiting the widest ecological thresholds [68]. These dynamics also govern propagule bank density in low-elevation floodplains [60]. Collectively, water-level fluctuations govern key wetland ecological processes, particularly land-water interface dynamics, as a core mechanistic driver [62].
Hydrological alterations exert highly complex and species-specific impacts on wetland biodiversity. For waterbirds, cyclical lake-level fluctuations play a pivotal role in driving assemblage patterns [69]. However, such impacts are not universally beneficial. Sustained high water levels during mid-winter compress shallow-water habitats, reduce suitable overwintering areas, and trigger functional turnover in waterbird assemblages [69]. Specifically across taxonomic groups, the advanced dry seasons following Three Gorges Dam operations significantly enhanced habitat suitability for Anatidae (waterfowl), exerted negligible impacts on Charadriidae (plovers) and Ardeidae (herons), and induced marginally significant adverse effects on Laridae (gulls) [70]. Notably, water-level rise during the mid-dry season may exert adverse effects on habitats for Anatidae (waterfowl) and Charadriidae (plovers) [71]. Water-level fluctuations profoundly regulate habitat suitability for migratory birds by altering vegetation distribution patterns across elevation gradients [72]. For instance, wintering habitats of the Siberian crane (Leucogeranus leucogeranus) exhibit high sensitivity to short-term water-level changes: both rising and declining trends may induce habitat loss, whereas fluctuations foster more extensive yet spatially concentrated suitable areas [73]. For fish communities, hydrological conditions are equally critical. Flood pulse events during high-water phases significantly enhance fish dispersal from rivers into floodplain lakes, amplifying both taxonomic and functional diversity [74]. High water levels during flood seasons and in downstream areas critically regulate fish community structure and spatiotemporal distribution patterns in Poyang Lake’s river-lake transition zone, jointly mediated by pH, redox potential, dissolved oxygen, and water-level dynamics [75]. The direction of fish migration exhibits strong correlations with water temperature gradients, water-level fluctuations, and discharge variations [76]. In contrast, small lakes and ponds, characterized by low fish biomass and high macrophyte richness, typically support diverse assemblages including waterbirds, amphibians, invertebrates, and aquatic plants, constituting significant contributors to regional biodiversity [77]. However, hydrological degradation (e.g., declining water levels) promotes terrestrial vegetation encroachment into lacustrine zones and synergistically amplifies eutrophication effects, imposing adverse impacts on wetland vegetation integrity [78]. Such alterations may cascade to species dependent on these plant communities.
Given the governing role of water-level fluctuations on wetland ecosystem structure and function, maintaining natural hydrological regimes and amplitude ranges is imperative for ecosystem resilience. This study definitively reveals critical ecological thresholds in hydrological alterations, beyond which irreversible ecosystem degradation occurs. Specifically, sustained water-level declines—driven by net sediment replenishment persistently below approximately 18 million tons/year—induce severe impacts on lake ecosystems, particularly during drought years [40]. Hydrological degradation has been empirically demonstrated to adversely impact wetland ecosystems [79]. Quantitative analyses reveal that inflow discharge and water levels are pivotal explanatory variables for avian species variance, accounting for 52.13% and 47.87% of explained variance, respectively. This strongly indicates the necessity to maintain minimum inflow and water-level thresholds to ensure suitable waterbird habitats [80]. Therefore, adopting ecologically meaningful indicators—such as the Environmental Flow Components (EFC) method and Range of Variability Approach (RVA)—to assess and restore dynamic flow and water-level regimes is imperative for effective hydrological rehabilitation [79]. This ecologically based water management aims to restore or maintain natural hydrological regimes, encompassing the amplitude, frequency, and duration of water-level fluctuations [60]. Seasonal hydrological variations—such as water-level dynamics—not only influence vegetation and faunal habitats but also profoundly structure trophic networks in floodplain lake food webs and shape overall ecosystem functioning [81]. Protecting Dongting Lake—a critically important waterbird wintering site and migratory corridor in East Asia [70]—and sustaining its pivotal ecosystem functions in hydrological regulation and biodiversity conservation [78,82] ultimately depend on profound understanding and science-informed management of hydrological processes, particularly water-level dynamics. This requires ensuring variations remain within ecological thresholds tolerated by keystone species and communities, including sedges (Carex spp.) [68], waterbirds [69,70,71,72,73], and fish assemblages [74,75,76].
The Hunan Dongting Lake Protection Ordinance, enacted on 1 September 2021, provides the legal foundation for pollution control, ecological restoration, and green development in Dongting Lake. Integrated management frameworks encompass water environmental governance, wetland conservation and restoration, ecological protection of Yangtze finless porpoise (Neophocaena asiaeorientalis) habitats, navigation engineering projects, and water system rehabilitation. These policies collectively address multidimensional challenges, including pollution mitigation, ecosystem recovery, hydraulic optimization, and smart watershed management. Quantified Indicators of Hydrologic Alteration (IHA) are operationally linked to flood season control, dry-season water abstraction, aquatic ecosystem protection, wetland rehabilitation, and water resource allocation, transforming hydrological data into actionable decision-support tools for basin managers.
While this study offers reference insights for rational water resource utilization and governance in the basin by analyzing runoff evolution and water allocation changes at the outlets of West Dongting Lake, several limitations remain. On the one hand, the absence of hydrological stations within West Dongting Lake beyond its outlets impedes direct quantitative analysis of internal water exchange processes. Future research should integrate UAV-LiDAR surveys with high-resolution 2D/3D hydrodynamic modeling to directly assess internal hydrodynamic processes and flow redistribution mechanisms. On the other hand, flow redistribution between NZ and XHZ results from synergistic influences of climatic variability, anthropogenic interventions, and geomorphic adjustments. Subsequent research should integrate meteorological records, hydrological datasets, and bathymetric survey data to quantitatively disentangle these driving mechanisms.

6. Conclusions

Interannual and intra-annual variations in water levels and discharges (1955–2024) at XHZ and NZ stations—the primary outlets of West Dongting Lake—were systematically analyzed. The water level difference (ΔH) between XHZ and NZ stations served as a critical indicator for hydrological regime shifts in West Dongting Lake. Alterations in water levels, discharges, and ΔH across pre- and post-changepoint periods were quantified using the Indicators of Hydrologic Alteration-Range of Variability Approach (IHA–RVA).
Results indicate declining trends in water levels and discharges at both XHZ and NZ stations, with statistically significant changepoints identified in 1983 and 2003. During 1983–2002, hydrological alteration degrees (HAD) for water level and discharge were 34% and 42% at XHZ and 34% for both parameters at NZ, all classified as moderate alteration. From 2003 to 2024, HAD values were 42% (level) and 35% (discharge) at XHZ and 34% (level) and 52% (discharge) at NZ, likewise indicating moderate alteration. West Dongting Lake outlets collectively exhibit moderate hydrological alteration. Compared to the T1 period (1983–2002), the T2 period (2003–2024) demonstrates significantly enhanced alteration intensity, with discharge at NZ and water level at XHZ showing the most substantial parameter-specific changes.
Reduced discharge in the Songzi and Hudu Rivers primarily drives the decreased outflow from West Dongting Lake. In the Li and Yuan basins during period T1, anthropogenic factors dominated runoff alterations. During T2, anthropogenic contributions accounted for 76.27% and 48.67% of runoff changes, respectively, resulting in reduced runoff volumes under equivalent precipitation inputs.
The water level difference (ΔH) between XHZ and NZ stations exhibits an increasing trend, with a statistically significant changepoint in 1991—distinct from changepoints in individual station water levels or discharges. The overall alteration degree of ΔH reaches 44%, indicating moderate alteration. Indicators exhibiting moderate and high alteration predominantly concentrate on monthly mean water level difference metrics and extreme water level difference indices across varying durations. The other three indicator groups exhibit predominantly low alteration, yet still demonstrate discernible changes in mean values and coefficients of variation (CV). The other three indicator groups predominantly exhibit low alteration, yet demonstrate discernible changes in mean values and coefficients of variation (CV), primarily manifested as substantial mean shifts and elevated CV values.
When the water level difference (ΔH) between XHZ and NZ stations is held constant, discharges at these stations exhibit a statistically significant positive correlation. Under constant discharge at XHZ with flow direction from NZ to XHZ in T2 (2003–2024) versus T1 (1983–2002) NZ discharge increases, whereas under reversed flow direction (XHZ to NZ) NZ discharge decreases. Greater discharge flows downstream through the flow channel adjacent to NZ at West Dongting Lake’s outlet.

Author Contributions

Formal analysis, S.Y.; funding acquisition, C.J.; investigation, S.L.; methodology, S.Y.; resources, C.J.; supervision, Y.M.; writing—original draft, S.Y. All authors have read and agreed to the published version of the manuscript.

Funding

This research was funded by the National Natural Science Foundation of China (No.52079010).

Data Availability Statement

The original contributions presented in this study are included in the article. Further inquiries can be directed to the corresponding author(s).

Conflicts of Interest

The authors declare no conflict of interest.

References

  1. Cooley, S.W.; Ryan, J.C.; Smith, L.C. Human alteration of global surface water storage variability. Nature 2021, 591, 78–81. [Google Scholar] [CrossRef]
  2. Xiong, Y.; Mo, S.; Wu, H.; Qu, X.; Liu, Y.; Zhou, L. Influence of human activities and climate change on wetland landscape pattern—A review. Sci. Total Environ. 2023, 879, 163112. [Google Scholar] [CrossRef]
  3. Seyoum, W.M.; Milewski, A.M.; Durham, M.C. Understanding the relative impacts of natural processes and human activities on the hydrology of the Central Rift Valley lakes, East Africa. Hydrol. Process. 2015, 29, 4312–4324. [Google Scholar] [CrossRef]
  4. Huziy, O.; Sushama, L. Lake–river and lake–atmosphere interactions in a changing climate over Northeast Canada. Clim. Dyn. 2017, 48, 3227–3246. [Google Scholar] [CrossRef]
  5. Hecht, J.S.; Lacombe, G.; Arias, M.E.; Dang, T.D.; Piman, T. Hydropower dams of the Mekong River basin: A review of their hydrological impacts. J. Hydrol. 2019, 568, 285–300. [Google Scholar] [CrossRef]
  6. Yao, J.; Chen, Y.; Guan, X.; Zhao, Y.; Chen, J.; Mao, W. Recent climate and hydrological changes in a mountain–basin system in Xinjiang, China. Earth-Sci. Rev. 2022, 226, 103957. [Google Scholar] [CrossRef]
  7. Yao, F.; Livneh, B.; Rajagopalan, B.; Wang, J.; Crétaux, J.-F.; Wada, Y.; Berge-Nguyen, M. Satellites reveal widespread decline in global lake water storage. Science 2023, 380, 743–749. [Google Scholar] [CrossRef]
  8. Jeppesen, E.; Brucet, S.; Naselli-Flores, L.; Papastergiadou, E.; Stefanidis, K.; Noges, T.; Noges, P.; Attayde, J.L.; Zohary, T.; Coppens, J. Ecological impacts of global warming and water abstraction on lakes and reservoirs due to changes in water level and related changes in salinity. Hydrobiologia 2015, 750, 201–227. [Google Scholar] [CrossRef]
  9. Brown, R.L.; Charles, D.; Horwitz, R.J.; Pizzuto, J.E.; Skalak, K.; Velinsky, D.J.; Hart, D.D. Size-dependent effects of dams on river ecosystems and implications for dam removal outcomes. Ecol. Appl. 2024, 34, e3016. [Google Scholar] [CrossRef]
  10. Mahdian, M.; Hosseinzadeh, M.; Siadatmousavi, S.M.; Chalipa, Z.; Delavar, M.; Guo, M.; Abolfathi, S.; Noori, R. Modelling impacts of climate change and anthropogenic activities on inflows and sediment loads of wetlands: Case study of the Anzali wetland. Sci. Rep. 2023, 13, 5399. [Google Scholar] [CrossRef]
  11. Kulik, M.; Urban, D.; Grzywaczewski, G.; Bochniak, A.; Grzywna, A.; Sender, J. Half a century of wetland degradation: The present state and trends of changes in Western Polesie—Long-term wetland degradation. Glob. Ecol. Conserv. 2024, 56, e03324. [Google Scholar] [CrossRef]
  12. Kuczera, G.A. Three Decades of Inundation Dynamics in an Australian Dryland Wetland: An Eco-Hydrological Perspective. Remote Sens. 2024, 16, 3310. [Google Scholar]
  13. Yu, B.; Zang, Y.; Wu, C.; Zhao, Z. Spatiotemporal dynamics of wetlands and their future multi-scenario simulation in the Yellow River Delta, China. J. Environ. Manag. 2024, 353, 120193. [Google Scholar] [CrossRef]
  14. Wang, J.; Gao, M.; Guo, H.; Chen, E. Spatiotemporal distribution and historical evolution of polders in the Dongting Lake area, China. J. Geogr. Sci. 2016, 26, 1561–1578. [Google Scholar] [CrossRef]
  15. Ou, C.; Peng, P.; Deng, C.; Li, J. Impacts of Three Gorges Reservoir’s water storage on flow-sediment characteristics of Dongting Lake. In Proceedings of the 2011 International Conference on Electric Technology and Civil Engineering (ICETCE), Lushan, China, 22–24 April 2011; IEEE: Piscataway, NJ, USA, 2011; pp. 6012–6015. [Google Scholar]
  16. Olden, J.D.; Poff, N. Redundancy and the choice of hydrologic indices for characterizing streamflow regimes. River Res. Appl. 2003, 19, 101–121. [Google Scholar] [CrossRef]
  17. Richter, B.D.; Baumgartner, J.V.; Powell, J.; Braun, D.P. A method for assessing hydrologic alteration within ecosystems. Conserv. Biol. 1996, 10, 1163–1174. [Google Scholar] [CrossRef]
  18. Richter, B.; Baumgartner, J.; Wigington, R.; Braun, D. How much water does a river need? Freshw. Biol. 1997, 37, 231–249. [Google Scholar] [CrossRef]
  19. Habel, M.; Nowak, B.; Szadek, P. Evaluating indicators of hydrologic alteration to demonstrate the impact of open-pit lignite mining on the flow regimes of small and medium-sized rivers. Ecol. Indic. 2023, 157, 111295. [Google Scholar] [CrossRef]
  20. Xue, L.; Zhang, H.; Yang, C.; Zhang, L.; Sun, C. Quantitative assessment of hydrological alteration caused by irrigation projects in the Tarim River basin, China. Sci. Rep. 2017, 7, 4291. [Google Scholar] [CrossRef]
  21. Kumar, A.; Tripathi, V.K.; Kumar, P.; Rakshit, A. Assessment of hydrologic impact on flow regime due to dam inception using IHA framework. Environ. Sci. Pollut. Res. 2023, 30, 37821–37844. [Google Scholar] [CrossRef]
  22. Li, D.; Long, D.; Zhao, J.; Lu, H.; Hong, Y. Observed changes in flow regimes in the Mekong River basin. J. Hydrol. 2017, 551, 217–232. [Google Scholar] [CrossRef]
  23. Zhang, Q.; Xiao, M.; Liu, C.-L.; Singh, V.P. Reservoir-induced hydrological alterations and environmental flow variation in the East River, the Pearl River basin, China. Stoch. Environ. Res. Risk Assess. 2014, 28, 2119–2131. [Google Scholar] [CrossRef]
  24. Wang, B.; Wang, H.; Jiao, X.; Huang, L.; Chen, H.; Guo, W. Runoff change in the Yellow River Basin of China from 1960 to 2020 and its driving factors. J. Arid Land 2024, 16, 168–194. [Google Scholar] [CrossRef]
  25. Wang, H.; Chen, Y.; Deng, H.; Pan, Y. Detecting changes in extreme streamflow in the Tarim River, Northwest China. Quat. Int. 2015, 380, 149–158. [Google Scholar] [CrossRef]
  26. Wang, H.; Ma, Y.; Yang, H.; Hong, F.; Guo, W. Quantitative evaluation of the impact of climate change and human activities on Jialing river runoff changes in the past 60 years, China. J. Water Clim. Change 2023, 14, 590–609. [Google Scholar] [CrossRef]
  27. Wang, H.; Ye, H.; Yuan, W.; Cheng, S.; Bai, X.; Lan, J.; Ma, Y.; Wang, G.; Guo, W. Quantitative evaluation of the evolution of the ecohydrological regime and its drivers in the Han River Basin. J. Water Clim. Change 2024, 15, 4613–4630. [Google Scholar] [CrossRef]
  28. Cheng, J.; Xu, L.; Feng, W.; Fan, H.; Jiang, J. Changes in water level regimes in China’s two largest freshwater lakes: Characterization and implication. Water 2019, 11, 917. [Google Scholar] [CrossRef]
  29. Han, Q. Variation Mechanism of the Relation Between Jingjiang River and Dongting Lake. J. Chang. River Sci. Res. Inst. 2014, 31, 104–112. (In Chinese) [Google Scholar]
  30. Zhang, Y.; Zhang, Y.; Song, Q.; Shen, D.; Xu, J. The history and future of the relationship between the Yangtze River and connected lakes. J. Hydraul. Eng. 2021, 52, 1183–1192. (In Chinese) [Google Scholar]
  31. Li, Y.; Yang, G.; Li, B.; Wan, R.; Duan, W.; He, Z. Quantifying the effects of channel change on the discharge diversion of Jingjiang Three Outlets after the operation of the Three Gorges Dam. Hydrol. Res. 2016, 47, 161–174. [Google Scholar] [CrossRef]
  32. Yu, Y.; Mei, X.; Dai, Z.; Gao, J.; Li, J.; Wang, J.; Lou, Y. Hydromorphological processes of Dongting Lake in China between 1951 and 2014. J. Hydrol. 2018, 562, 254–266. [Google Scholar] [CrossRef]
  33. Wang, H.; Zhu, Y.; Jin, Y.; Guo, W. Quantitative assessment of hydrological alteration over multiple periods caused by human activities at the Jingjiang Three Outlets, China. Water Supply 2022, 22, 264–277. [Google Scholar] [CrossRef]
  34. Zhang, R.; Zhang, S.-h.; Xu, W.; Wang, B.-d.; Wang, H. Flow regime of the three outlets on the south bank of Jingjiang River, China: An impact assessment of the Three Gorges Reservoir for 2003–2010. Stoch. Environ. Res. Risk Assess. 2015, 29, 2047–2060. [Google Scholar] [CrossRef]
  35. Qin, H.; Xie, Y.; Zou, D. Changes of Runoff and Sediment Discharge into Dongting Lake from the Four Rivers in Hunan Province. Geogr. Sci. 2012, 32, 609–615. (In Chinese) [Google Scholar]
  36. Zhou, Y.; Ma, J.; Zhang, Y.; Li, J.; Feng, L.; Zhang, Y.; Shi, K.; Brookes, J.D.; Jeppesen, E. Influence of the three Gorges Reservoir on the shrinkage of China’s two largest freshwater lakes. Glob. Planet. Change 2019, 177, 45–55. [Google Scholar] [CrossRef]
  37. Wang, H.; Zhu, Y.; Zha, H.; Guo, W. Quantitative assessment of water level regime alterations during 1959–2016 caused by Three Gorges Reservoir in the Dongting Lake, China. Water Supply 2021, 21, 1188–1201. [Google Scholar] [CrossRef]
  38. Ou, C.; Li, J.; Zhang, Z.; Li, X.; Yu, G.; Liao, X. Effects of the dispatch modes of the Three Gorges Reservoir on the water regimes in the Dongting Lake area in typical years. J. Geogr. Sci. 2012, 22, 594–608. [Google Scholar] [CrossRef]
  39. Yuan, Y.; Zeng, G.; Liang, J.; Huang, L.; Hua, S.; Li, F.; Zhu, Y.; Wu, H.; Liu, J.; He, X. Variation of water level in Dongting Lake over a 50-year period: Implications for the impacts of anthropogenic and climatic factors. J. Hydrol. 2015, 525, 450–456. [Google Scholar] [CrossRef]
  40. Lai, X.; Chen, H.; Hou, Y.; Finlayson, B.; Li, M.; Chen, J. Lowering water level of Dongting lake of the Mid-Yangtze River in response to large-scale dam construction: A 60-year analysis. Geomorphology 2021, 391, 107894. [Google Scholar] [CrossRef]
  41. Ou, C.; Li, J.; Yu, G.; Yang, Y.; Deng, C.; Zhang, L. Response of Dongting Lake’s System Function Under Changed Water and Silt Process. Geogr. Sci. 2011, 31, 654–660. (In Chinese) [Google Scholar]
  42. Fang, J.; Li, Y.; Wang, D.; Xie, S. Modified Hydrological Regime on Irrigation and Water Supply in Lake Areas: A Case Study of the Yangtze River–Dongting Lake. Front. Earth Sci. 2022, 10, 888729. [Google Scholar] [CrossRef]
  43. Wang, X.; Li, X.; Wu, Y. Maintaining the connected river-lake relationship in the middle Yangtze River reaches after completion of the Three Gorges Project. Int. J. Sediment Res. 2017, 32, 487–494. [Google Scholar] [CrossRef]
  44. Lin, J.; Ding, W.; Zhou, H.; Wang, H. Mitigating adverse impacts of reservoir impoundment on lake ecology: A case study of the Three Gorges Reservoir and Dongting Lake. J. Clean. Prod. 2024, 451, 141835. [Google Scholar] [CrossRef]
  45. Tripathy, K.P.; Mukherjee, S.; Mishra, A.; Mann, M.; Williams, A.P. Climate change will accelerate the high-end risk of compound drought and heatwave events. Proc. Natl. Acad. Sci. USA 2023, 120, e2219825120. [Google Scholar] [CrossRef]
  46. Newman, R.; Noy, I. The global costs of extreme weather that are attributable to climate change. Nat. Commun. 2023, 14, 6103. [Google Scholar] [CrossRef]
  47. Bari, S.H.; Rahman, M.T.U.; Hoque, M.A.; Hussain, M.M. Analysis of seasonal and annual rainfall trends in the northern region of Bangladesh. Atmos. Res. 2016, 176–177, 148–158. [Google Scholar] [CrossRef]
  48. Ahn, K.-H.; Palmer, R.N. Trend and Variability in Observed Hydrological Extremes in the United States. J. Hydrol. Eng. 2016, 21, 04015061. [Google Scholar] [CrossRef]
  49. Hajani, E.; Rahman, A. Characterizing changes in rainfall: A case study for New South Wales, Australia. Int. J. Climatol. J. R. Meteorol. Soc. 2018, 38, 1452–1462. [Google Scholar] [CrossRef]
  50. Suen, J.-P. Potential impacts to freshwater ecosystems caused by flow regime alteration under changing climate conditions in Taiwan. Hydrobiologia 2010, 649, 115–128. [Google Scholar] [CrossRef]
  51. Zheng, X.; Yang, T.; Cui, T.; Xu, C.; Qin, Y. A revised range of variability approach considering the morphological alteration of hydrological indicators. Stoch. Environ. Res. Risk Assess. 2020, 35, 1783–1803. [Google Scholar] [CrossRef]
  52. Ge, J.; Peng, W.; Huang, W.; Qu, X.; Singh, S.K. Quantitative Assessment of Flow Regime Alteration Using a Revised Range of Variability Methods. Water 2018, 10, 597. [Google Scholar] [CrossRef]
  53. Yu, C.; Yin, X.a.; Yang, Z. A revised range of variability approach for the comprehensive assessment of the alteration of flow regime. Ecol. Eng. 2016, 96, 200–207. [Google Scholar] [CrossRef]
  54. Wang, S.; Yan, Y.; Yan, M.; Zhao, X. Quantitative estimation of the impact of precipitation and human activities on runoff change of the Huangfuchuan River Basin. J. Geogr. Sci. 2012, 22, 906–918. [Google Scholar] [CrossRef]
  55. Lai, X.; Zou, H.; Jiang, J.; Jia, J.; Liu, Y.; Wei, W. Hydrological dynamics of the Yangtze river-Dongting lake system after the construction of the three Gorges dam. Sci. Rep. 2025, 15, 50. [Google Scholar] [CrossRef]
  56. Zheng, S. Reflections on the Three Gorges Project since Its Operation. Engineering 2016, 2, 389–397. [Google Scholar] [CrossRef]
  57. Mayou, L.A.; Alamdari, N.; Ahmadisharaf, E.; Kamali, M. Impacts of future climate and land use/land cover change on urban runoff using fine-scale hydrologic modeling. J. Environ. Manag. 2024, 362, 121284. [Google Scholar] [CrossRef]
  58. Wang, Q.; Cai, X.; Tang, J.; Yang, L.; Wang, J.; Xu, Y. Climate feedbacks associated with land-use and land-cover change on hydrological extremes over the Yangtze River Delta Region, China. J. Hydrol. 2023, 623, 129855. [Google Scholar] [CrossRef]
  59. Liu, Y.; Marnn, P.; Jiang, H.; Wen, Y.; Yan, H.; Li, D.; He, C.; Li, L. A study on the response of waterbird diversity to habitat changes caused by ecological engineering construction. Ecol. Eng. 2024, 208, 107358. [Google Scholar] [CrossRef]
  60. Peng, H.; Xia, H.; Shi, Q.; Chen, H.; Chu, N.; Liang, J.; Gao, Z. Monitoring spatial and temporal dynamics of wetland vegetation and their response to hydrological conditions in a large seasonal lake with time series Landsat data. Ecol. Indic. 2022, 142, 109283. [Google Scholar] [CrossRef]
  61. Hu, Y.-x.; Huang, J.-l.; Du, Y.; Han, P.-p.; Wang, J.-l.; Huang, W. Monitoring wetland vegetation pattern response to water-level change resulting from the Three Gorges Project in the two largest freshwater lakes of China. Ecol. Eng. 2015, 74, 274–285. [Google Scholar] [CrossRef]
  62. Gao, Y.; Xie, Y.-h.; Zou, D.-s. Hydrological regime change and its ecological responses in East Dongting Lake, China. Ecohydrol. Hydrobiol. 2020, 20, 142–150. [Google Scholar] [CrossRef]
  63. Wu, H.; Hu, X.; Sun, S.; Dai, J.; Ye, S.; Du, C.; Chen, H.; Yu, G.; Zhou, L.; Chen, J. Effect of increasing of water level during the middle of dry season on landscape pattern of the two largest freshwater lakes of China. Ecol. Indic. 2020, 113, 106283. [Google Scholar] [CrossRef]
  64. Hu, J.-Y.; Xie, Y.-H.; Tang, Y.; Li, F.; Zou, Y.-A. Changes of vegetation distribution in the east Dongting Lake after the operation of the Three Gorges Dam, China. Front. Plant Sci. 2018, 9, 582. [Google Scholar] [CrossRef]
  65. Huang, Y.; Chen, X.-S.; Li, F.; Hou, Z.-Y.; Li, X.; Zeng, J.; Deng, Z.-M.; Zou, Y.-A.; Xie, Y.-H. Community trait responses of three dominant macrophytes to variations in flooding during 2011–2019 in a Yangtze river-connected floodplain wetland (Dongting lake, China). Front. Plant Sci. 2021, 12, 604677. [Google Scholar] [CrossRef]
  66. Liu, Y.; Li, J.; Yan, D.; Chen, L.; Li, M.; Luan, Z. Typical vegetation dynamics and hydrological changes of Dongting Lake wetland from 1985 to 2020. Ecohydrol. Hydrobiol. 2024, 24, 910–919. [Google Scholar] [CrossRef]
  67. Huang, W.; Liu, X.; Tian, L.; Cui, G.; Liu, Y. Vegetation and carbon sink response to water level changes in a seasonal lake wetland. Front. Plant Sci. 2024, 15, 1445906. [Google Scholar] [CrossRef]
  68. Huang, A.; Liu, X.; Peng, W.; Dong, F.; Han, Z.; Du, F.; Ma, B.; Wang, W. Spatiotemporal heterogeneity of inundation pattern of floodplain lake wetlands and impact on wetland vegetation. Sci. Total Environ. 2023, 905, 167831. [Google Scholar] [CrossRef]
  69. Cui, L.; Wei, Z.; Zhou, L.; Cheng, B. Effects of constant high water levels in winter on waterbird diversity in Caizi Lakes: A functional perspective. Glob. Ecol. Conserv. 2024, 52, e02934. [Google Scholar] [CrossRef]
  70. Wu, H.; Chen, J.; Zeng, G.; Xu, J.; Sang, L.; Liu, Q.; Dai, J.; Xiong, W.; Yuan, Z.; Wang, Y. Effects of Early Dry Season on Habitat Suitability for Migratory Birds in China’s Two Largest Freshwater Lake Wetlands after the Impoundment of Three Gorges Dam. J. Environ. Inform. 2020, 36, 82–92. [Google Scholar] [CrossRef]
  71. Wu, H.; Dai, J.; Sun, S.; Du, C.; Long, Y.; Chen, H.; Yu, G.; Ye, S.; Chen, J. Responses of habitat suitability for migratory birds to increased water level during middle of dry season in the two largest freshwater lake wetlands of China. Ecol. Indic. 2021, 121, 107065. [Google Scholar] [CrossRef]
  72. Zhu, Y.; Wang, H.; Guo, W. The impacts of water level fluctuations of East Dongting Lake on habitat suitability of migratory birds. Ecol. Indic. 2021, 132, 108277. [Google Scholar] [CrossRef]
  73. Li, X.; Hu, B.; Qi, S.; Luo, J. The Influence of Short-Term Water Level Fluctuations on the Habitat Response and Ecological Fragility of Siberian Cranes in Poyang Lake, China. Remote Sens. 2024, 16, 4431. [Google Scholar] [CrossRef]
  74. Jiang, Z.; Xie, C.; Chen, S.; Song, Z. Taxonomic and functional response of fish assemblages to flood-triggered water level fluctuations in a large floodplain lake along the Yangtze River. Ichthyol. Res. 2025, 72, 197–207. [Google Scholar] [CrossRef]
  75. Yin, H.; Wang, S.; Yang, J.; Chen, S.; Hua, Q.; Wang, L.; Yang, Q.; Hu, M. Fish community and its relationships with environmental variables in the channel connecting Poyang Lake and the Yangtze River. Aquat. Sci. 2024, 86, 59. [Google Scholar] [CrossRef]
  76. Qin, X.; Gong, Z.; Liu, H. Lateral migration of fish between China’s second largest freshwater lake (Dongting Lake) and the mainstem of the Yangtze River. Environ. Biol. Fishes 2019, 102, 527–539. [Google Scholar] [CrossRef]
  77. Tian, M.; Mao, J.; Wang, K.; Chen, Y.; Gao, H.; Wang, T. Significant expansion of small water bodies in the Dongting Lake region following the impoundment of the Three Gorges Dam. J. Environ. Manag. 2025, 376, 124443. [Google Scholar] [CrossRef]
  78. Wang, H.; Bai, X.; Huang, L.; Hong, F.; Yuan, W.; Guo, W. The spatial variation of hydrological conditions and their impact on wetland vegetation in connected floodplain wetlands: Dongting Lake Basin. Environ. Sci. Pollut. Res. 2024, 31, 8483–8498. [Google Scholar] [CrossRef]
  79. Wang, H.; Huang, L.; Guo, W.; Zhu, Y.; Yang, H.; Jiao, X.; Zhou, H. Evaluation of ecohydrological regime and its driving forces in the Dongting Lake, China. J. Hydrol. Reg. Stud. 2022, 41, 101067. [Google Scholar] [CrossRef]
  80. Zhang, C.; Yuan, Y.; Zeng, G.; Liang, J.; Guo, S.; Huang, L.; Hua, S.; Wu, H.; Zhu, Y.; An, H. Influence of hydrological regime and climatic factor on waterbird abundance in Dongting Lake Wetland, China: Implications for biological conservation. Ecol. Eng. 2016, 90, 473–481. [Google Scholar] [CrossRef]
  81. Zhang, H.; Wang, Y.; Xu, J. Influence of Seasonal Water Level Fluctuations on Food Web Structure of a Large Floodplain Lake in China. Sustainability 2023, 15, 10724. [Google Scholar] [CrossRef]
  82. Yang, L.; Wang, L.; Yu, D.; Yao, R.; Li, C.; He, Q.; Wang, S.; Wang, L. Four decades of wetland changes in Dongting Lake using Landsat observations during 1978–2018. J. Hydrol. 2020, 587, 124954. [Google Scholar] [CrossRef]
Figure 1. Overview and hydrological station map of West Dongting Lake.
Water 17 02487 g001
Figure 2. Spatial distribution of meteorological stations across the Li and Yuan River basins.
Water 17 02487 g002
Figure 3. Annual discharge series at XHZ and NZ stations.
Water 17 02487 g003
Figure 4. Annual water level at NZ station and water level difference (ΔH) between XHZ and NZ stations.
Water 17 02487 g004
Figure 5. Hydrological alteration degrees for water levels and discharges at XHZ and NZ stations across three defined periods.
Water 17 02487 g005
Figure 6. Proportional distribution of hydrological alteration grades at XHZ and NZ stations across distinct periods.
Water 17 02487 g006
Figure 7. Alteration degree of water level difference (ΔH) between XHZ and NZ stations.
Water 17 02487 g007
Figure 8. Monthly mean ΔH variations across distinct hydrological periods.
Water 17 02487 g008
Figure 9. Annual variations in days with zero water-level difference (ΔH = 0).
Water 17 02487 g009
Figure 10. Timing of annual extreme water-level difference (ΔH) events across hydrological periods.
Water 17 02487 g010
Figure 11. Dongting Lake water situation generalization diagram.
Water 17 02487 g011
Figure 12. Annual runoff of rivers flowing into West Dongting Lake and Mann–Kendall test results.
Water 17 02487 g012
Figure 13. Temporal evolution of cumulative runoff depth and precipitation versus calendar year in the Li and Yuan River basins.
Water 17 02487 g013
Figure 14. The relationship between runoff depth and precipitation in the Li and Yuan River basins.
Water 17 02487 g014
Figure 15. (a) Statistical relationship between cumulative reservoir storage capacity and (b) streamflow discharge in the Yuan River Basin, with spatial distribution of major dams in the Yuan and Li River basins.
Water 17 02487 g015
Figure 16. Spatial distribution patterns and proportional changes in dominant land-use types in the Yuan and Li River basins (1980–2020).
Water 17 02487 g016
Figure 17. Schematic diagram of outlets in West Dongting Lake.
Water 17 02487 g017
Figure 18. Discharge at XHZ and NZ stations versus varying water level difference (ΔH).
Water 17 02487 g018
Table 1. Mann–Kendall (M-K) test results for temporal trends in annual means during the study period (1955–2024).
ParameterXHZ DischargeNZ DischargeXHZ Water LevelNZ Water LevelWater Level Difference (ΔH)
Z statistic−2.98−3.09−3.17−3.664.39
Critical Z±1.96±1.96±1.96±1.96±1.96
p-value2.87 × 10−31.98 × 10−31.51 × 10−32.52 × 10−42.81 × 10−6
α Threshold0.050.050.050.050.05
Trenddecreasingdecreasingdecreasingdecreasingincreasing
Table 2. Changepoint detection results using four methods and consensus years.
ParameterMethodsChangepoint Year (s)
M-K TestCUSUMMoving t-TestPettitt’s Test
XHZ Discharge198319831983, 200319831983, 2003
NZ Discharge1985, 199019931983, 2003-1983, 2003
XHZ Water Level200320031983, 200420031983, 2003
NZ Water Level200320031983, 200320031983, 2003
Water Level Difference (ΔH)197619911978, 199119751991
Table 3. Deviation degree and alteration degree of monthly mean water level difference (ΔH).
IndicatorMean (m)ΔH (m)Mean Relative Deviation (%)Alteration Degree (%)
P1P2
January ΔH0.2230.146−0.077−35−47 (M)
February ΔH0.2770.172−0.105−38−59 (M)
March ΔH0.2180.184−0.034−1612 (L)
April ΔH0.1200.1400.0201724 (L)
May ΔH−0.0650.0360.101−155−24 (L)
June ΔH−0.197−0.0620.135−69−76 (H)
July ΔH−0.416−0.3350.081−19−41 (M)
August ΔH−0.471−0.3640.107−23−53 (M)
September ΔH−0.493−0.3220.171−35−47 (M)
October ΔH−0.402−0.1620.240−60−65 (M)
November ΔH−0.1170.0140.131−112−53 (M)
December ΔH0.0910.1050.0141541 (M)
Table 4. Deviation degree and alteration degree of annual extreme water level difference (ΔH) across durations.
IndicatorMean (m)Mean Relative
Deviation (%)
CvCv Relative
Deviation (%)
Alteration
Degree (%)
P1P2P1P2
Annualminima1-daymeans−1.470−1.6009−24.0146.3593−65
Annualminima3-daymeans−1.380−1.367−1−23.6650.21112−59
Annualminima7-daymeans−1.150−1.1470−21.1639.3986−59
Annualminima30-daymeans−0.918−0.9867−20.2827.5636−41
Annualminima90-daymeans−0.734−0.697−5−17.3831.9184−53
Annualmaxima1-daymeans0.2800.180−3621.86−33.5253−53
Annualmaxima3-daymeans0.2670.167−3721.65−33.3754−24
Annualmaxima7-daymeans0.2540.144−4321.24−32.2152−29
Annualmaxima30-daymeans0.1670.108−3523.29−39.7471−35
Annualmaxima90-daymeans0.0900.031−6629.54−45.3053−41
Water level difference index110.23313.50432100.50226.47125−65
Water level difference index2−5.279−6.12316−123.67−274.61122−18
Table 5. Deviation degrees and alteration degrees for Group 4 and Group 5 indicators.
IndicatorMean (m)Mean Relative
Deviation (%)
CvCv Relative
Deviation (%)
Alteration
Degree (%)
P1P2P1P2
Number of high ΔH events5.649.326562.0437.50−40−12
Mean duration of high ΔH events23.549.17−6177.7555.07−29−41
Number of low ΔH events6.675.35−2039.6140.85341
Mean duration of low ΔH events21.2316.59−2256.33115.87106−29
Mean rising rate of ΔH0.0400.038−512.3619.7360−59
Mean falling rate of ΔH−0.046−0.044−4−15.21−20.04326
Number of reversals89.8988.09−210.579.99−50
Table 6. Information on major reservoirs in the Li and Yuan River basins.
River BasinNo.ReservoirGross Reservoir Capacity (108 m3)Flood Storage Capacity (108 m3)Year CompletedCatchment Area (km2)
Li River1Yutan1.240.4719973478
2Jiangya17.417.419993711
3Zaoshi14.47.8320083000
Yuan River1Huangshi61.421967552
2Zhuyuan1.40.531978701.5
3Fengtan16.7572.8197917,500
4Wuqiangxi42.913.6199783,800
5Baiyun2.980.171998556
6Mangtangxi1.530.2220018182
7Wanmipo3.781200310,415
8Youchou1.520.5420094775
9Baishi6.871.202201016,530
10Tuokou12.491.98201424,450
Table 7. Fitting formulas for discharges at XHZ and NZ stations at varying water level differences (ΔH).
Water Level Difference (m)1984–2003 (T1)2004–2022 (T2)
Linear Regression EquationR2Linear Regression EquationR2
−0.4y = 1.39 × x − 21860.97y = 1.05 × x − 11220.95
−0.2y = 1.41 × x − 8490.91y = 1.45 × x − 12610.97
0y = 1.45 × x − 460.97y = 1.58 × x − 3700.97
0.2y = 2.01 × x + 3600.95y = 2.14 × x + 3670.94
Disclaimer/Publisher’s Note: The statements, opinions and data contained in all publications are solely those of the individual author(s) and contributor(s) and not of MDPI and/or the editor(s). MDPI and/or the editor(s) disclaim responsibility for any injury to people or property resulting from any ideas, methods, instructions or products referred to in the content.