Article

Optimal Control of Iron Release in Drinking Water Distribution Systems Fed with Desalinated Water

School of Environmental and Municipal Engineering, Xi’an University of Architecture and Technology, Xi’an 710055, China
*
Author to whom correspondence should be addressed.
Water 2025, 17(16), 2474; https://doi.org/10.3390/w17162474
Submission received: 5 July 2025 / Revised: 4 August 2025 / Accepted: 13 August 2025 / Published: 20 August 2025

Abstract

When desalinated water enters the existing drinking water distribution systems (DWDSs), the balance between water and scale will be destroyed, resulting in the release of iron and water quality problems, causing “yellow water”. This study investigated the inhibitory effects of pH, alkalinity, and phosphate on iron release and the optimal control condition using pipe section reactors with a response surface. For steel pipe, the optimal condition for iron release control was pH = 8.5, alkalinity = 250 mg/L CaCO3, and phosphate = 0.1 mg/L. For cast iron pipe, the optimal condition was pH = 8.0, alkalinity = 250 mg/L CaCO3, and phosphate = 0.1 mg/L. This study can provide theoretical support for subsequent water supply safety and lay a foundation for the water supply safety of the municipal pipe network.

1. Introduction

So far, steel pipe and cast iron pipe are still widely used in water supply systems [1]. During the long-term use of these pipes, pipe scales formed [2]. When hydraulic conditions and water quality change dramatically, pipe scales may be destroyed [3,4,5], and iron oxides/hydroxides within the scales may re-enter the water, resulting in iron release [6], leading to an increase in water turbidity and chromaticity [7], which leads to the phenomenon of “yellow water” [8], with a potential risk to human health [9].
Due to population growth and climate changes, global freshwater sources are becoming increasingly scarce [10,11,12]. In order to solve the problem, desalinated water (DW) has gained a lot of attention and is used in drinking water supply in many countries [13,14,15]. Especially for areas near desalination plants, DW is a good substitute for conventional source water. DW, with the characteristics of low alkalinity, hardness, and pH, high chloride levels, and weak buffering capacity, is quite different from surface water and groundwater [16,17]. Once DW enters existing DWDSs, the stability between bulk water and pipe scales will be broken, subsequently causing the release of iron and water discoloration.
In order to control the release of iron caused by the application of DW, scholars have proposed many methods, such as adjusting water quality parameters like pH, alkalinity, phosphate, etc.
Some scholars have shown that when the pH in the pipe rises, it inhibits the release of iron [18]. Under high-pH conditions, a dense oxide film is easily formed on the surface of pipe scale, which serves to protect the pipe scale, inhibit further corrosion of the pipeline, and reduce the release of iron [19], and increasing the pH value can accelerate the rate of Fe (II) oxidation to Fe (III), thereby making the dense shell of scale more stable and hindering iron release [18].
It is now accepted that water with a higher alkalinity content can sustainably reduce iron release [20,21], with or without the use of inhibitors [15,22]. The reason is that the water in the water supply network is usually weakly alkaline, and bicarbonate will react with substances such as iron and calcium in the water and pipeline. The generated substances such as ferrous carbonate and calcium carbonate will adhere and settle on the surface of the pipe scale, forming a protective film to inhibit iron release. In addition, the increase in alkalinity will enhance the buffering strength of the water body [23,24], strengthen the passivation film on the surface layer of pipe scale, slow down pipeline corrosion, and inhibit iron release.
It is believed that phosphate can be used as an inhibitor to control the release of iron [19,25], and its inhibitory effect may be achieved when the presence of phosphate forms an insoluble iron–phosphate layer; the greater the phosphate concentration, the clearer the inhibitory effect [19]. However, excessive use of phosphate may lead to environmental problems such as eutrophication of water quality [26], and phosphate may react with pipeline materials to form insoluble salts, which are deposited in pipelines. Long-term accumulation may lead to pipeline blockages or reduce the service life of pipelines [27]. Therefore, the amount of phosphate should also be limited.
Although many studies have investigated the control of iron release during desalinated water supply, they mostly focused on the application of a single method. Nevertheless, the potential for a comprehensive control method of iron release in DWDSs with various water quality parameters is not clear. In this paper, the optimal water quality control method for iron release in a water supply pipe section is found, and the influence mechanism of pH, alkalinity, and phosphate on iron release in the water supply pipe section was discussed. Scanning electron microscopy (SEM), X-ray fluorescence spectrometry (XRF), and X-ray diffractometry (XRD) characteristic analysis were also carried out on different pipe sections.

2. Materials and Methods

2.1. Experimental Equipment

A schematic diagram of the experimental reactor used in this experiment is shown in Figure 1. Steel pipe and cast iron pipe, which have been used for more than 20 years, were obtained from Xi’an in China. The obtained pipe sections were cut into 20 cm and 10 cm lengths to establish the pipe section reactors. The upper and lower ends of the reactor are fixed with plexiglass plates, and the rubber gaskets are used to seal the contact between the surface of the pipe section and the plexiglass plate to avoid leakage of the reactor. The plexiglass plates at the upper and lower ends are fixed and supported by 6 screws. A water inlet with a diameter of 25 mm is reserved at the upper end of the reactor, and a water outlet with a diameter of 12 mm is reserved at the lower end. The water outlet is connected with a plastic rubber tube to facilitate the collection of water samples from the outlet.

2.2. Experimental Procedure

2.2.1. Effect of pH, Alkalinity, and Phosphate on Iron Release

The pH, alkalinity, and phosphate corrosion inhibitors were adjusted, respectively, to observe the release of iron in the reaction device of steel pipe and cast iron pipe sections, and the control effect of each method was evaluated.
Prior to commencing the experiment, the equipment was adjusted and stabilized. Every 24 h, we drained the reactor water and refilled it with tap water, while simultaneously testing the total iron content and turbidity of the effluent. Once these parameters stabilized, the experiment proceeded to the next stage.
The pH gradient was adjusted to 6.5, 7.0, 7.5, 8.0, and 8.5, respectively, by 0.5 mol/L sodium hydroxide (NaOH) and 0.5 mol/L hydrochloric acid (HCl). The alkalinity gradient was adjusted to 50 mg/L, 100 mg/L, 150 mg/L, 200 mg/L, and 250 mg/L, respectively, by 0.5 mol/L sodium bicarbonate (Na2CO3) solution. To control the increase in pH by the excessive addition of sodium bicarbonate and maintain an initially relatively constant range of pH with a fluctuation not exceeding 0.2, carbon dioxide gas was exposed to the water. Disodium hydrogen phosphate (Na2HPO4) was used to adjust the phosphate concentration to 0.1 mg/L, 0.2 mg/L, 0.3 mg/L, 0.4 mg/L, and 0.5 mg/L. After each gradient was prepared, the prepared desalinated water was added to the steel pipe and cast iron pipe reactor sections. Samples were taken from the reactor outlet after 8 h, 12 h, 24 h, and 48 h of immersion for each gradient, and the total iron content was measured.

2.2.2. Optimal Control of Iron Release

A three-factor, three-level orthogonal experimental design (Box–Behnken Design) was employed to establish a response surface model. This model was used to observe the combined effects of pH, alkalinity, and phosphate on iron release from desalinated water entering the pipeline network. The optimal conditions for controlling iron release were identified. Design-Expert 8 software was utilized to construct the response surface model.
Seventeen groups of experiments were designed using Design-Expert software, including three factors and three levels (−1, 0, 1): phosphate (0.1 mg/L, 0.3 mg/L, 0.5 mg/L), alkalinity (50 mg/L, 150 mg/L, 250 mg/L), and pH (6.50, 7.50, 8.50). The total of 17 sets of experiments are shown in Table 1.
Y1 = 1.21 + 0.009X1 − 0.1813X2 − 0.06X3 − 0.06X1X2 − 0.09X1X3 + 0.266X2X3 − 0.24X12 − 0.13X22 − 0.22X32
Y2 = 1.10 + 0.031X1 − 0.1479X2 − 0.04X3 − 0.08X1X2 − 0.12X1X3 + 0.274X2X3 − 0.24X12 − 0.16X22 − 0.17X32
Y: iron release rate; Y1: cast iron pipe; Y2: steel pipe; X1: pH; X2: alkalinity (mg/L); X3: phosphate (mg/L).
Analysis of variance (ANOVA) was performed on compare the effects of different water quality parameters on iron release and determine the order of influence of the three factors on total iron concentration using statistical product service solutions (SPSS) software (version 21.0), where p < 0.05 was considered statistically significant.

2.3. Experimental Water and Test Indicators

DW used in the experiment was obtained from Shaanxi Provincial Environmental Key Engineering Laboratory, which was purified using a reverse osmosis membrane through the reverse osmosis process. Table 2 shows the water quality of DW. Measurements of pH was performed with a HACH HQ30D multimeter. (American Hash Company, Ames, IA, USA). Alkalinity was determined by acid-base indicator titration. The concentrations of total iron were measured colorimetrically by the 1,10-phenanthroline method, using a UV visible spectrophotometer (U-3900, Hitachi, Tokyo, Japan) at 510 nm. The content of phosphates was determined by continuous flow-ammonium molybdate spectrophotometry using UV visible spectrophotometer (U-3900, Hitachi, Tokyo, Japan) at 880 nm. In order to ensure the accuracy and reliability of the data, three sets of parallel samples were prepared and measured for each group of data in this experiment, and the experimental operation has been supplemented in this paper. Three sets of parallel samples were prepared.

2.4. Characterization of Pipe Scale

After the iron release in the reactor stabilizes, we scraped off the scale deposits gently from the inner walls of the original pipeline by a scraper, as well as the steel and cast iron pipes in the dynamic reactor after operation. After obtaining intact block samples, then we placed them in a muffle furnace at 120 °C to dry before being bagged for storage. The powdered form was obtained by grinding the lumpy pipe scale in a mortar, then baking it in a muffle furnace at 200 °C for 12 h to remove moisture, followed by bagging for storage.
The scale samples were monitored and analyzed by the following methods: The microstructure of the bulk samples was observed by SEM, and the chemical structure and elemental composition of the scale were analyzed by SEM, XRD, and XRF, respectively.

3. Results and Discussion

3.1. Characteristics of Pipe Scales

3.1.1. Micro-Morphology (SEM)

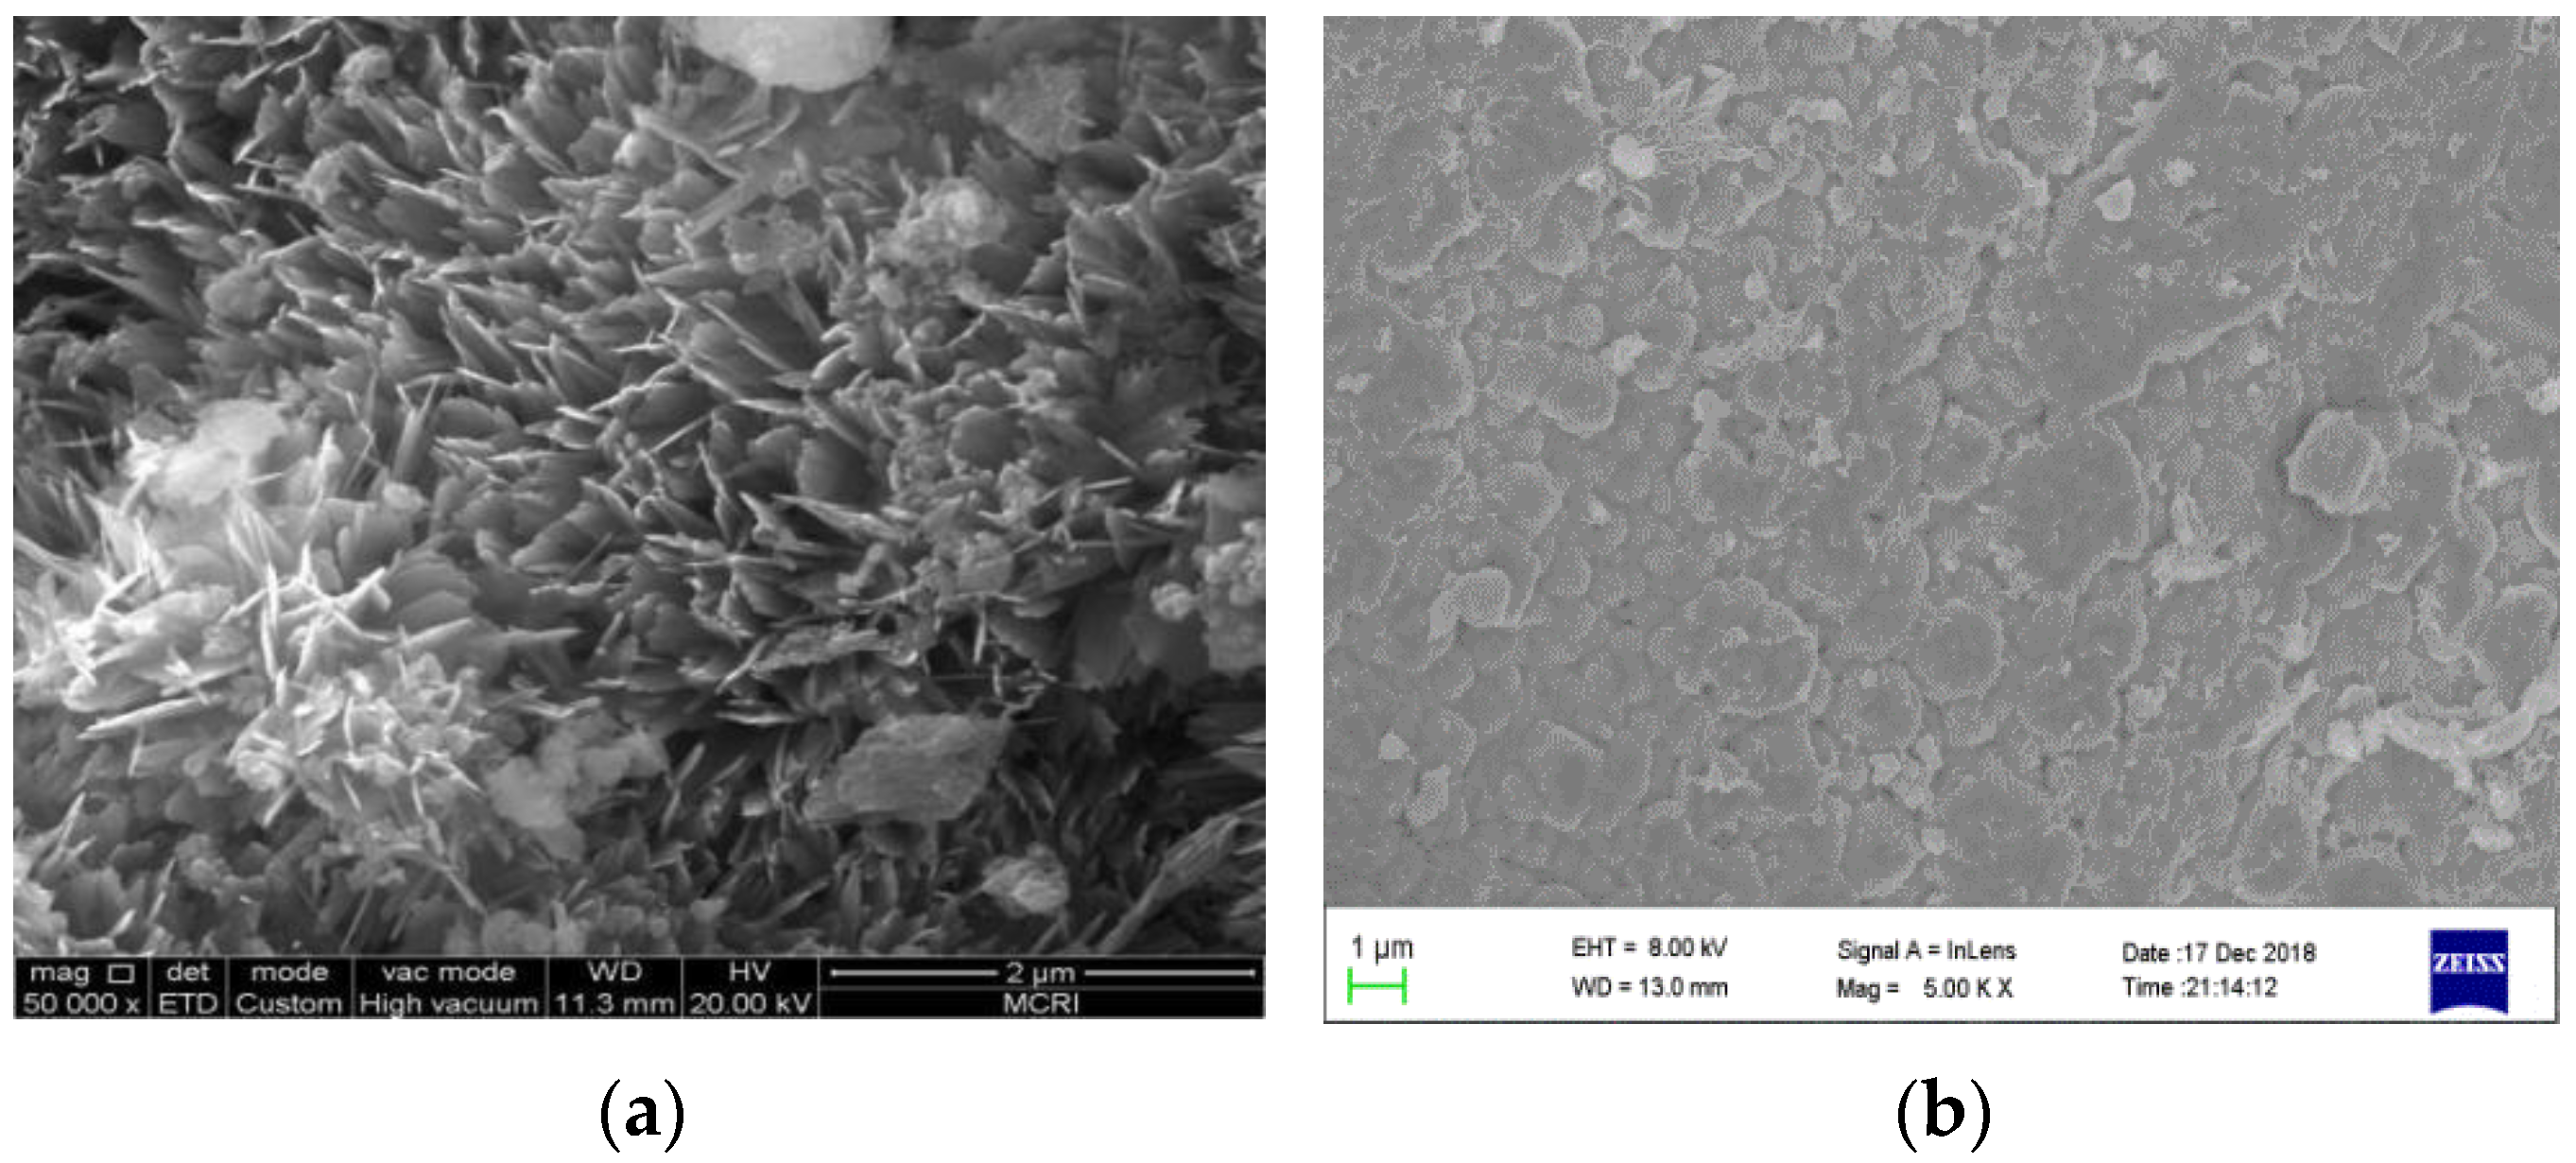
As shown in Figure 2a, before the operation of the reaction device, the inner layer of the steel tube under the scanning electron microscope showed that the needle-like objects were closely connected to each other, forming a regular network structure. In Figure 2b, after the operation of the reaction device, the inner layer of the steel pipe is large and blocky under the scanning electron microscope and attached to it are a small number of needle-like structures. The structure is dense and difficult to obtain.
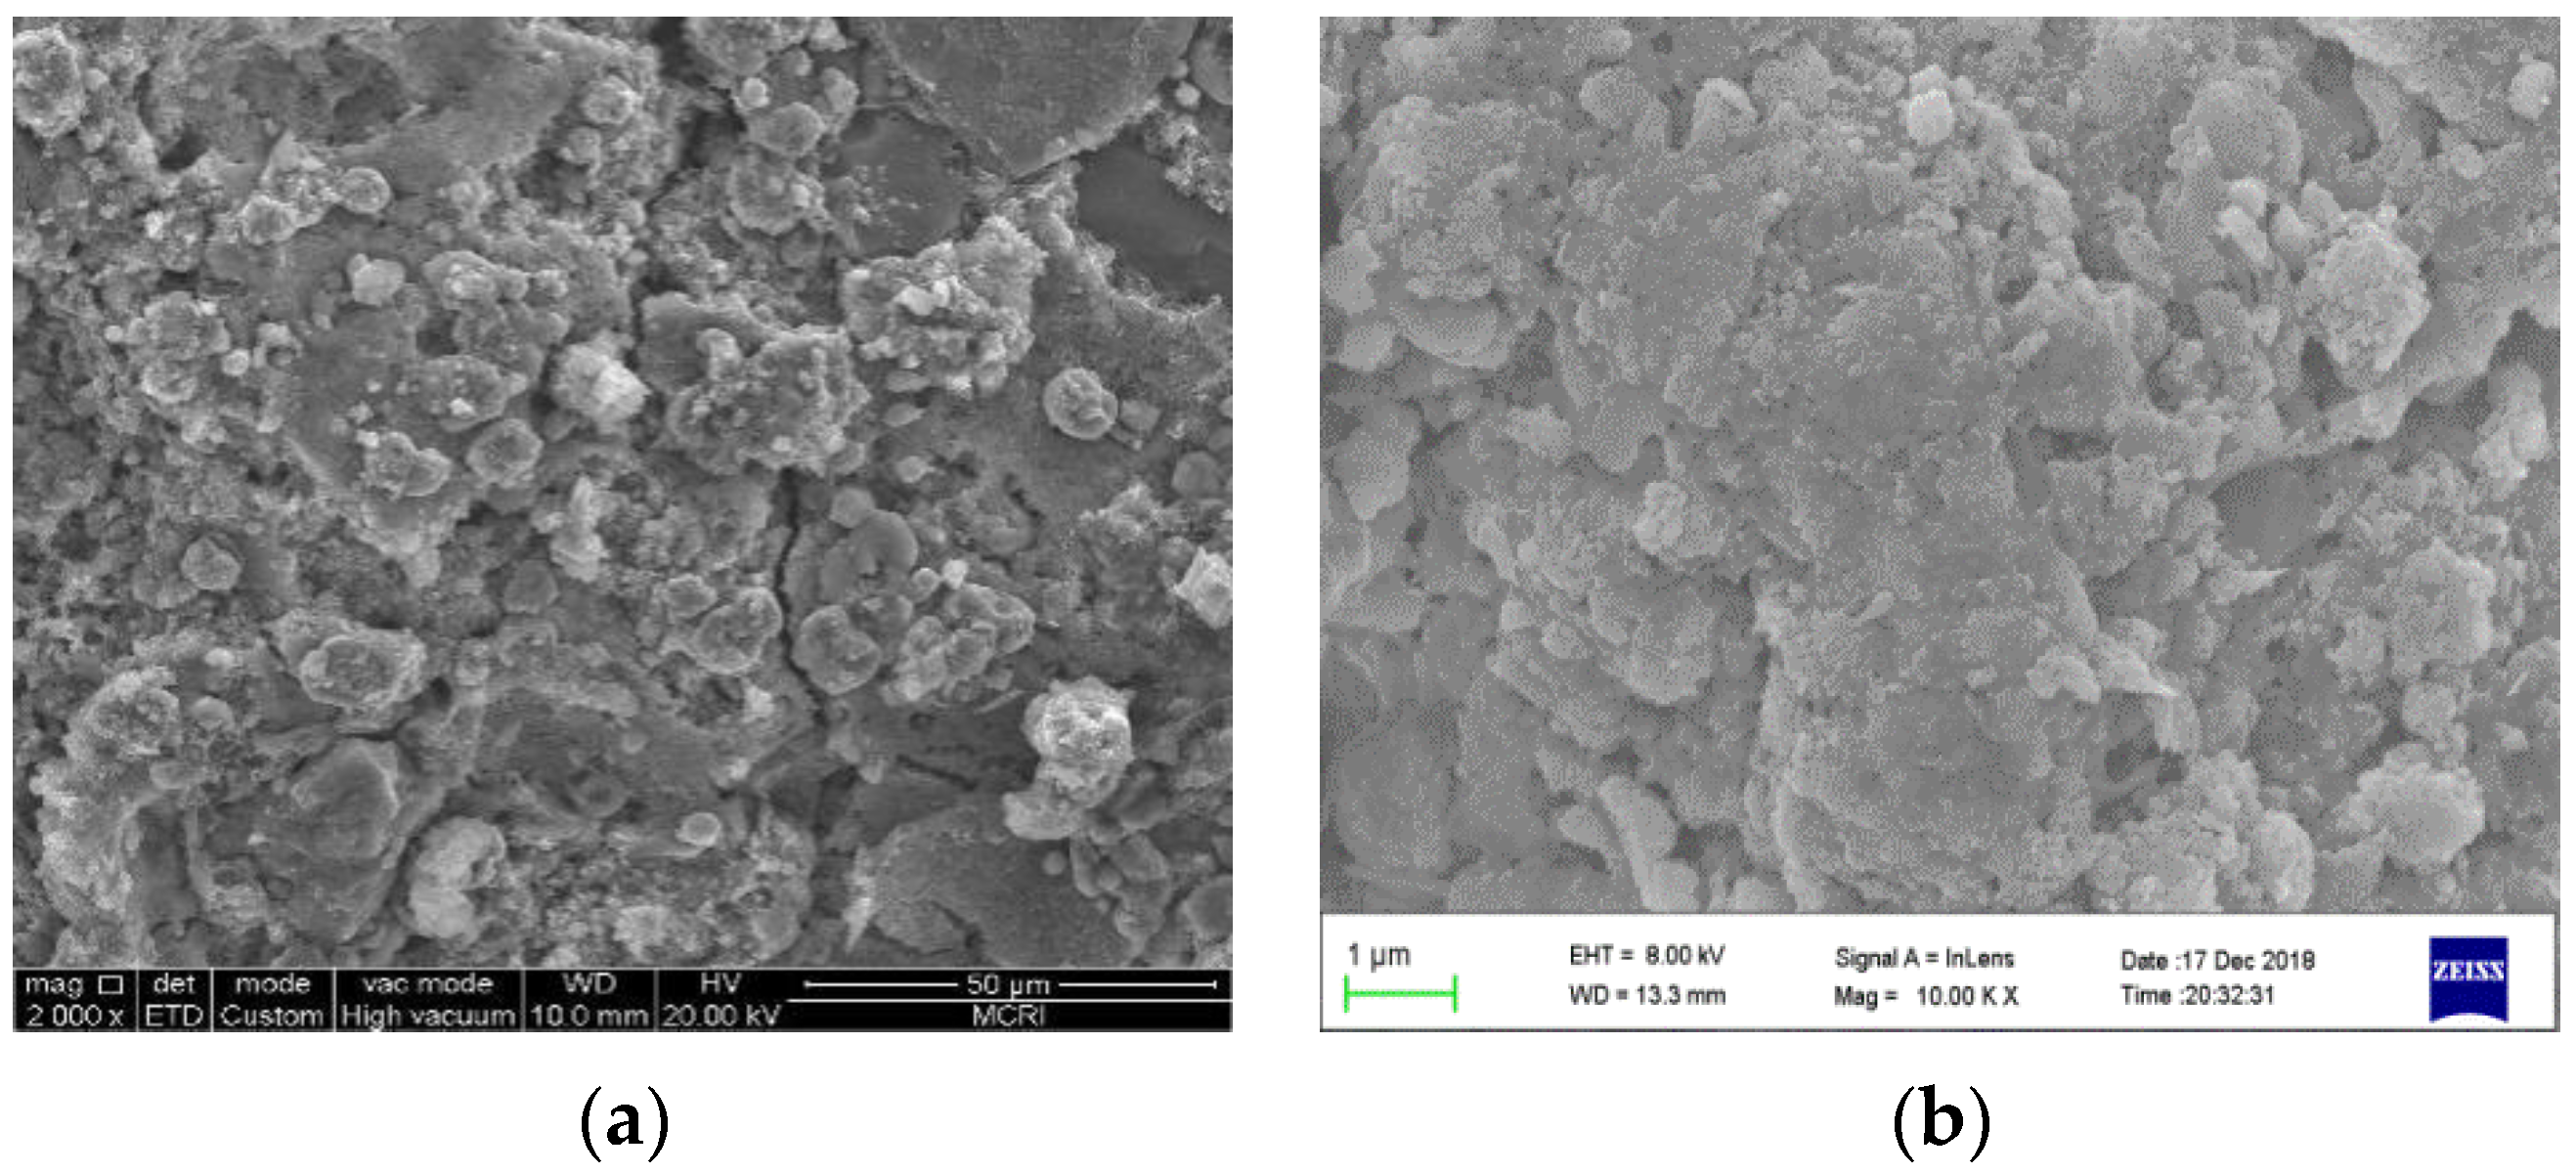
As shown in Figure 3a, before the reaction apparatus was activated, the large crystalline masses within the cast iron tube’s inner layer were tightly bonded with the surface, forming nearly seamless structures. In Figure 3b, post-operation imaging reveals that the inner layer of the cast iron tube maintained its dense, block-like morphology.
Furthermore, by comparing the micro-morphology of cast iron pipe and steel pipe scale before and after the operation of the reaction device, it was found that the inner layer of steel pipe had mainly a block structure, no longer the network structure in Figure 2. The inner layer of cast iron pipe was still mainly a block structure, with little change in Figure 3. The inner layer of cast iron pipe is denser than that of steel pipe in Figure 2 and Figure 3. This indicates that the pipe scale produced by different pipe materials will also vary greatly. The difference in the micro-morphology of pipe scale between the two pipe materials is mainly caused by the difference between the two pipe materials and the long-term water quality conditions.

3.1.2. Elemental Composition (XRF)

The elemental compositions of the pipe scales are shown in Table 3.
When comparing the results of the elemental composition of the pipe scale before and after the operation of the response device, it was found that the content of Fe elements in both the inner and outer layers of the steel pipe increased. The content of Fe elements in the inner layer of the steel pipe increased from 56% to 97.3%, and the outer layer increased from 54.4% to 92.5%. No O elements were detected after the operation. The content of Si, Al, and Cl elements also increased slightly. The increase in the content of Fe in the cast iron pipe was not significant, while the content of Si, Ca, and Al elements decreased. When the water source is switched to desalinated water, the concentration of chloride will change, which will change the protective oxide layer on the surface of iron pipeline, affect the stability of pipe scale, and further affect the release of iron. From the above analysis results, it is evident that the sudden change in the water quality to desalinated water has a certain impact on the elemental composition of the pipe scale.
Overall, the main components of the pipe scale from both types of pipe are iron oxides, with other elements constituting a very small percentage of the composition. The differences in the composition of other minor chemical elements are due to factors such as the type of pipe material itself and the differences in the chemical stability of the water quality over the years.

3.1.3. Chemical Composition (XRD)

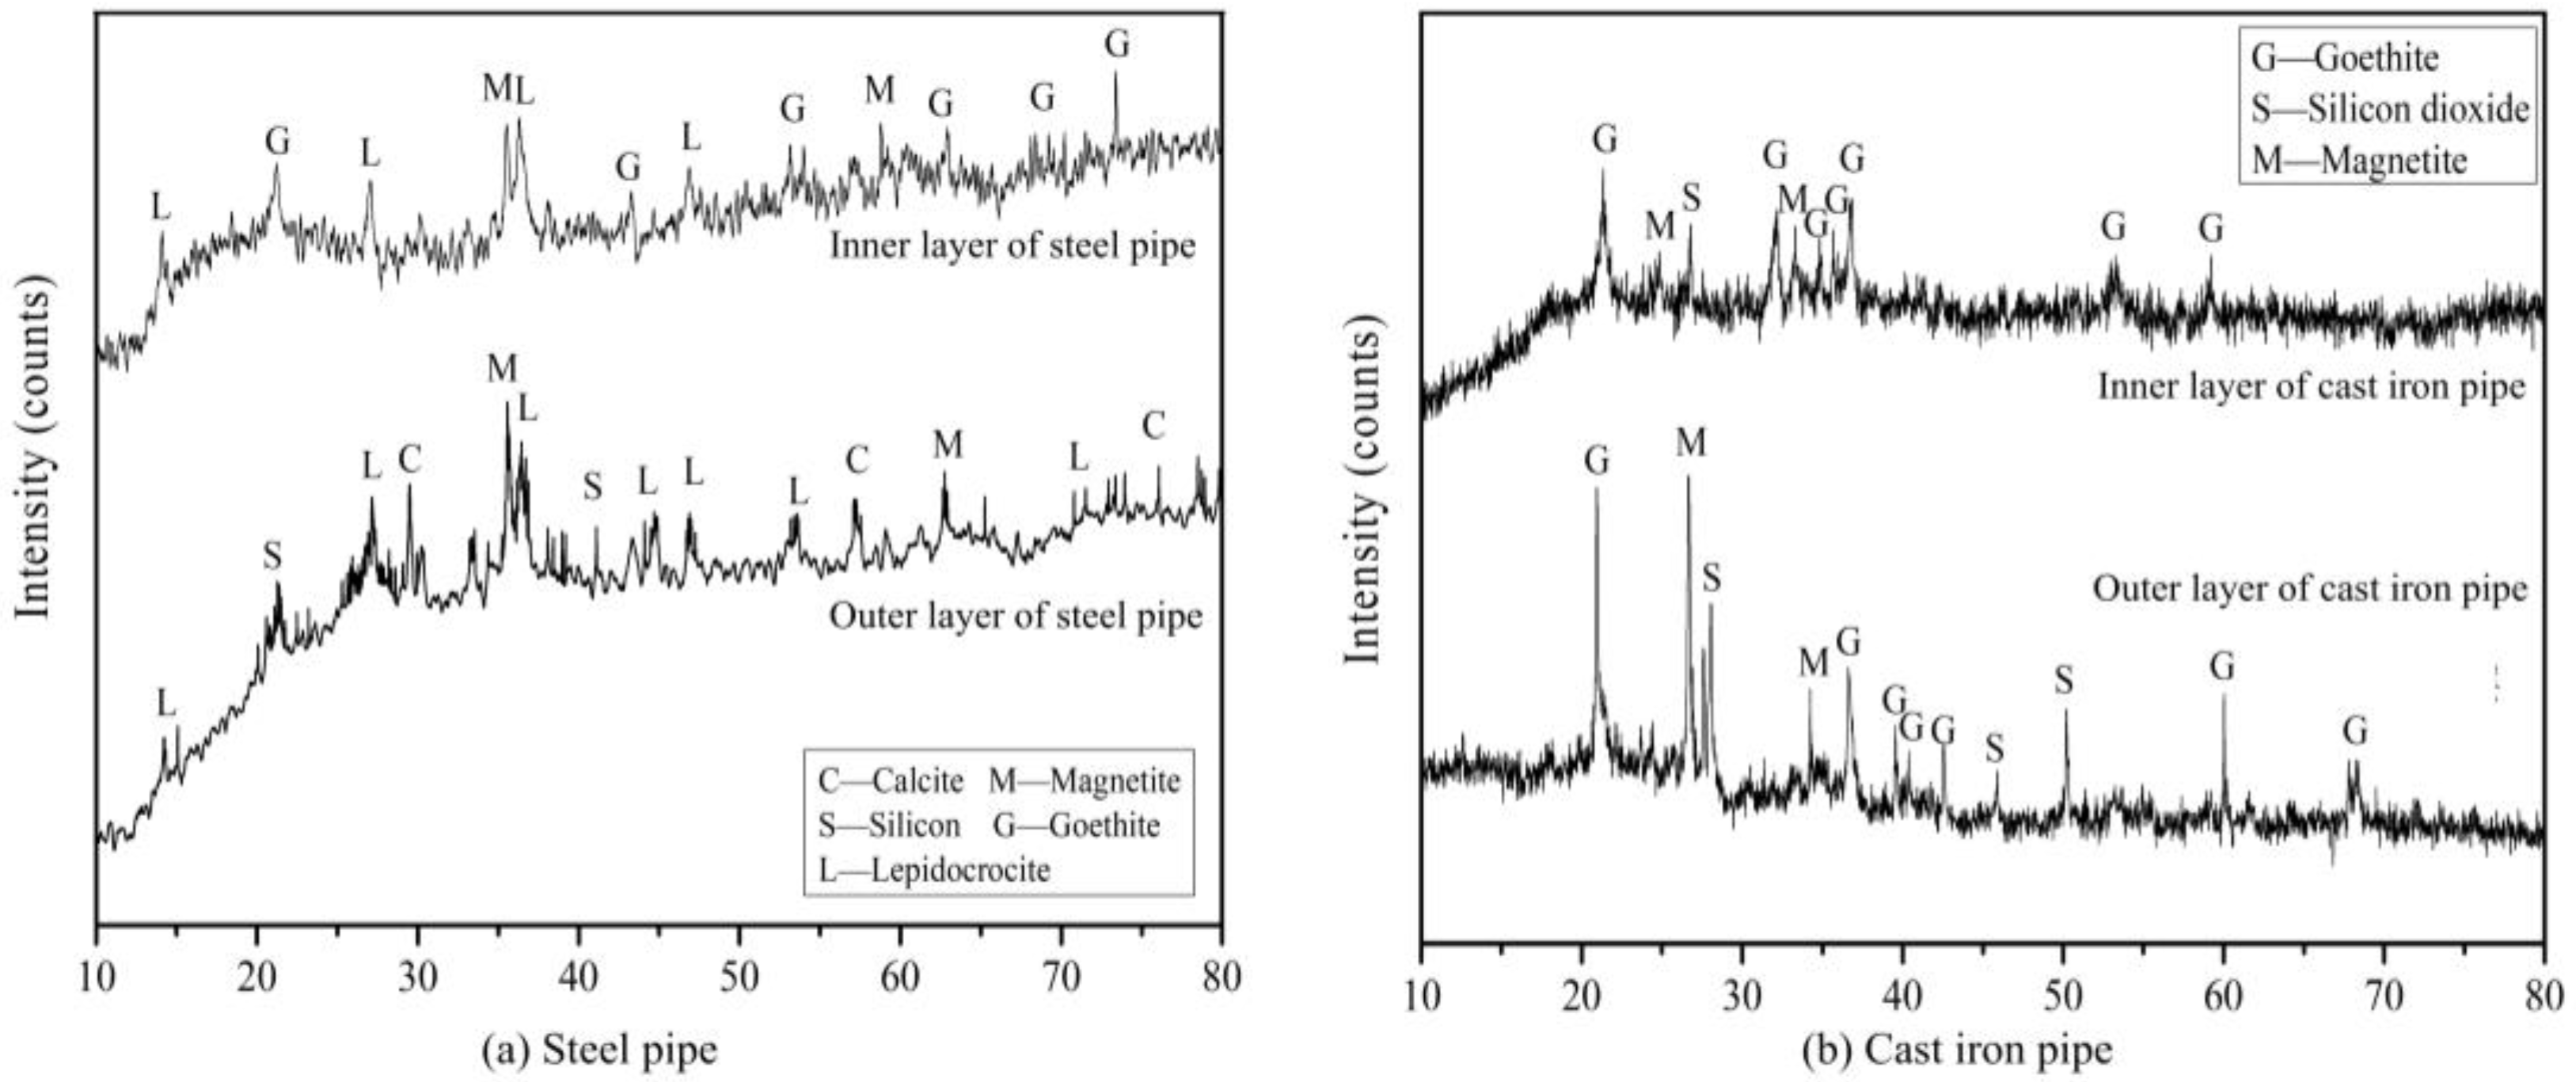
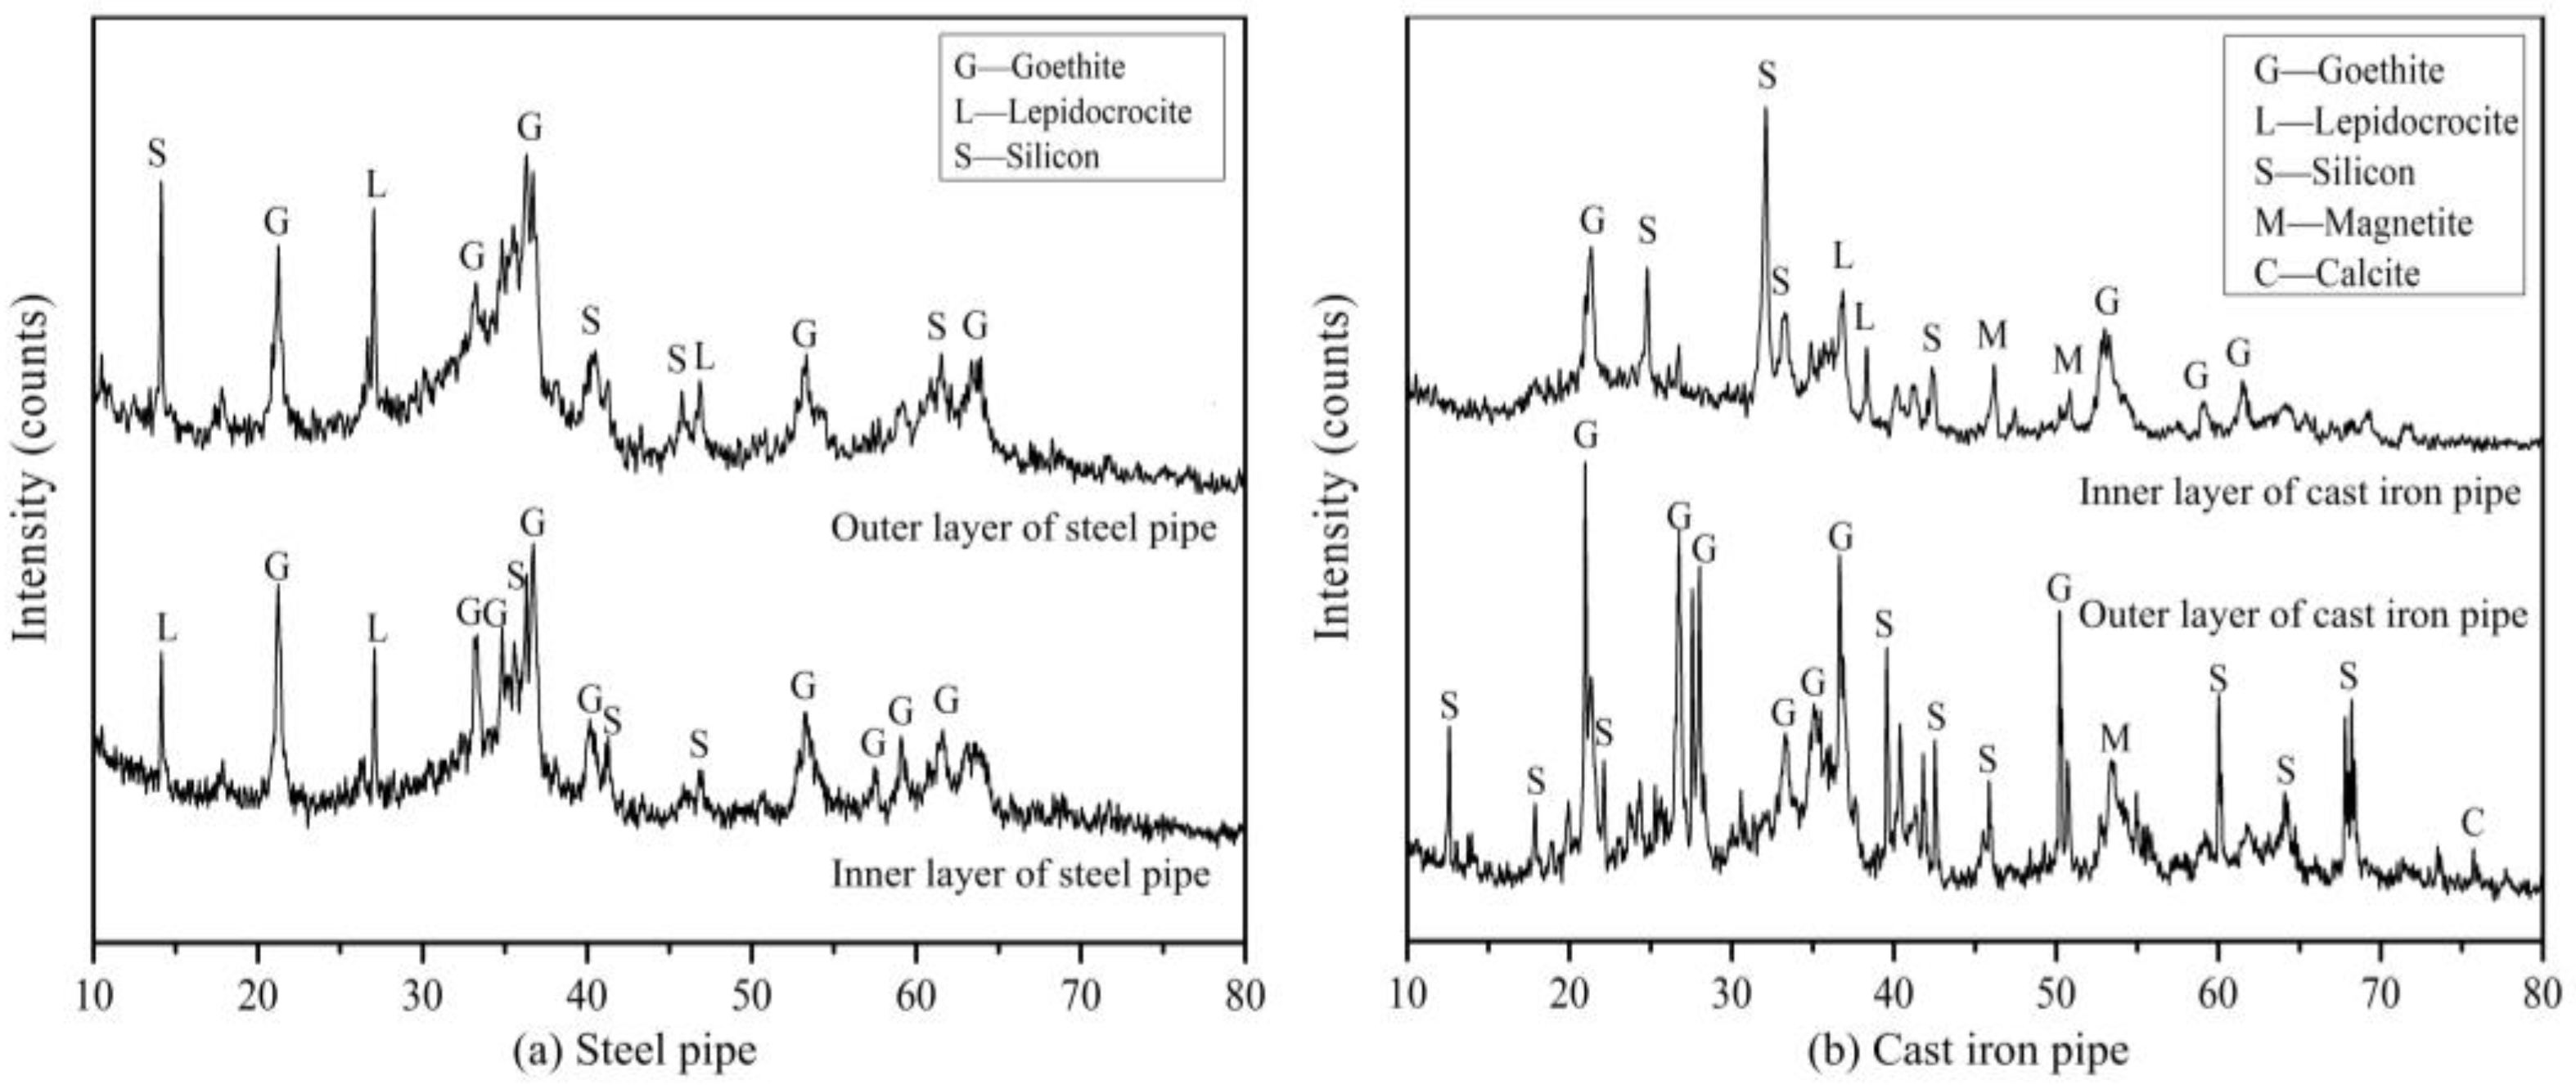
The test results were analyzed and processed with HighScore (plus) (5.1.0)software. The results’ analysis is shown in Figure 4 and Figure 5.
Compared with the crystal structure difference in steel pipe and cast iron pipe, the inner layer of steel pipe and cast iron pipe contains α-FeOOH and Fe3O4, and the outer layer contains SiO2. Fe3O4 is a more stable chemical composition than other iron oxide structures, and it can play the role of a protective layer, indicating that the inner layer structure of the two pipes is denser than the outer layer.
By comparing the difference in chemical composition of pipe scale before and after the operation of the dynamic reaction device, it was found that the inner layer of the steel tube is without Fe3O4, and SiO2 appears; α-FeOOH appears in the outer layer, and CaCO3 appears no longer. In the inner layer of the cast iron pipe, γ-FeOOH appears, and the outer layer no longer contains Fe3O4. The sudden increase in chloride ion concentration in water will promote the spot corrosion of tubular scale, change the tubular scale structure, reduce the stable Fe3O4 structure, and aggravate the release of iron.

3.2. Variations in Total Iron Concentrations Under Different pH, Alkalinity, and Phosphate Levels

3.2.1. pH Influence on the Release of Iron

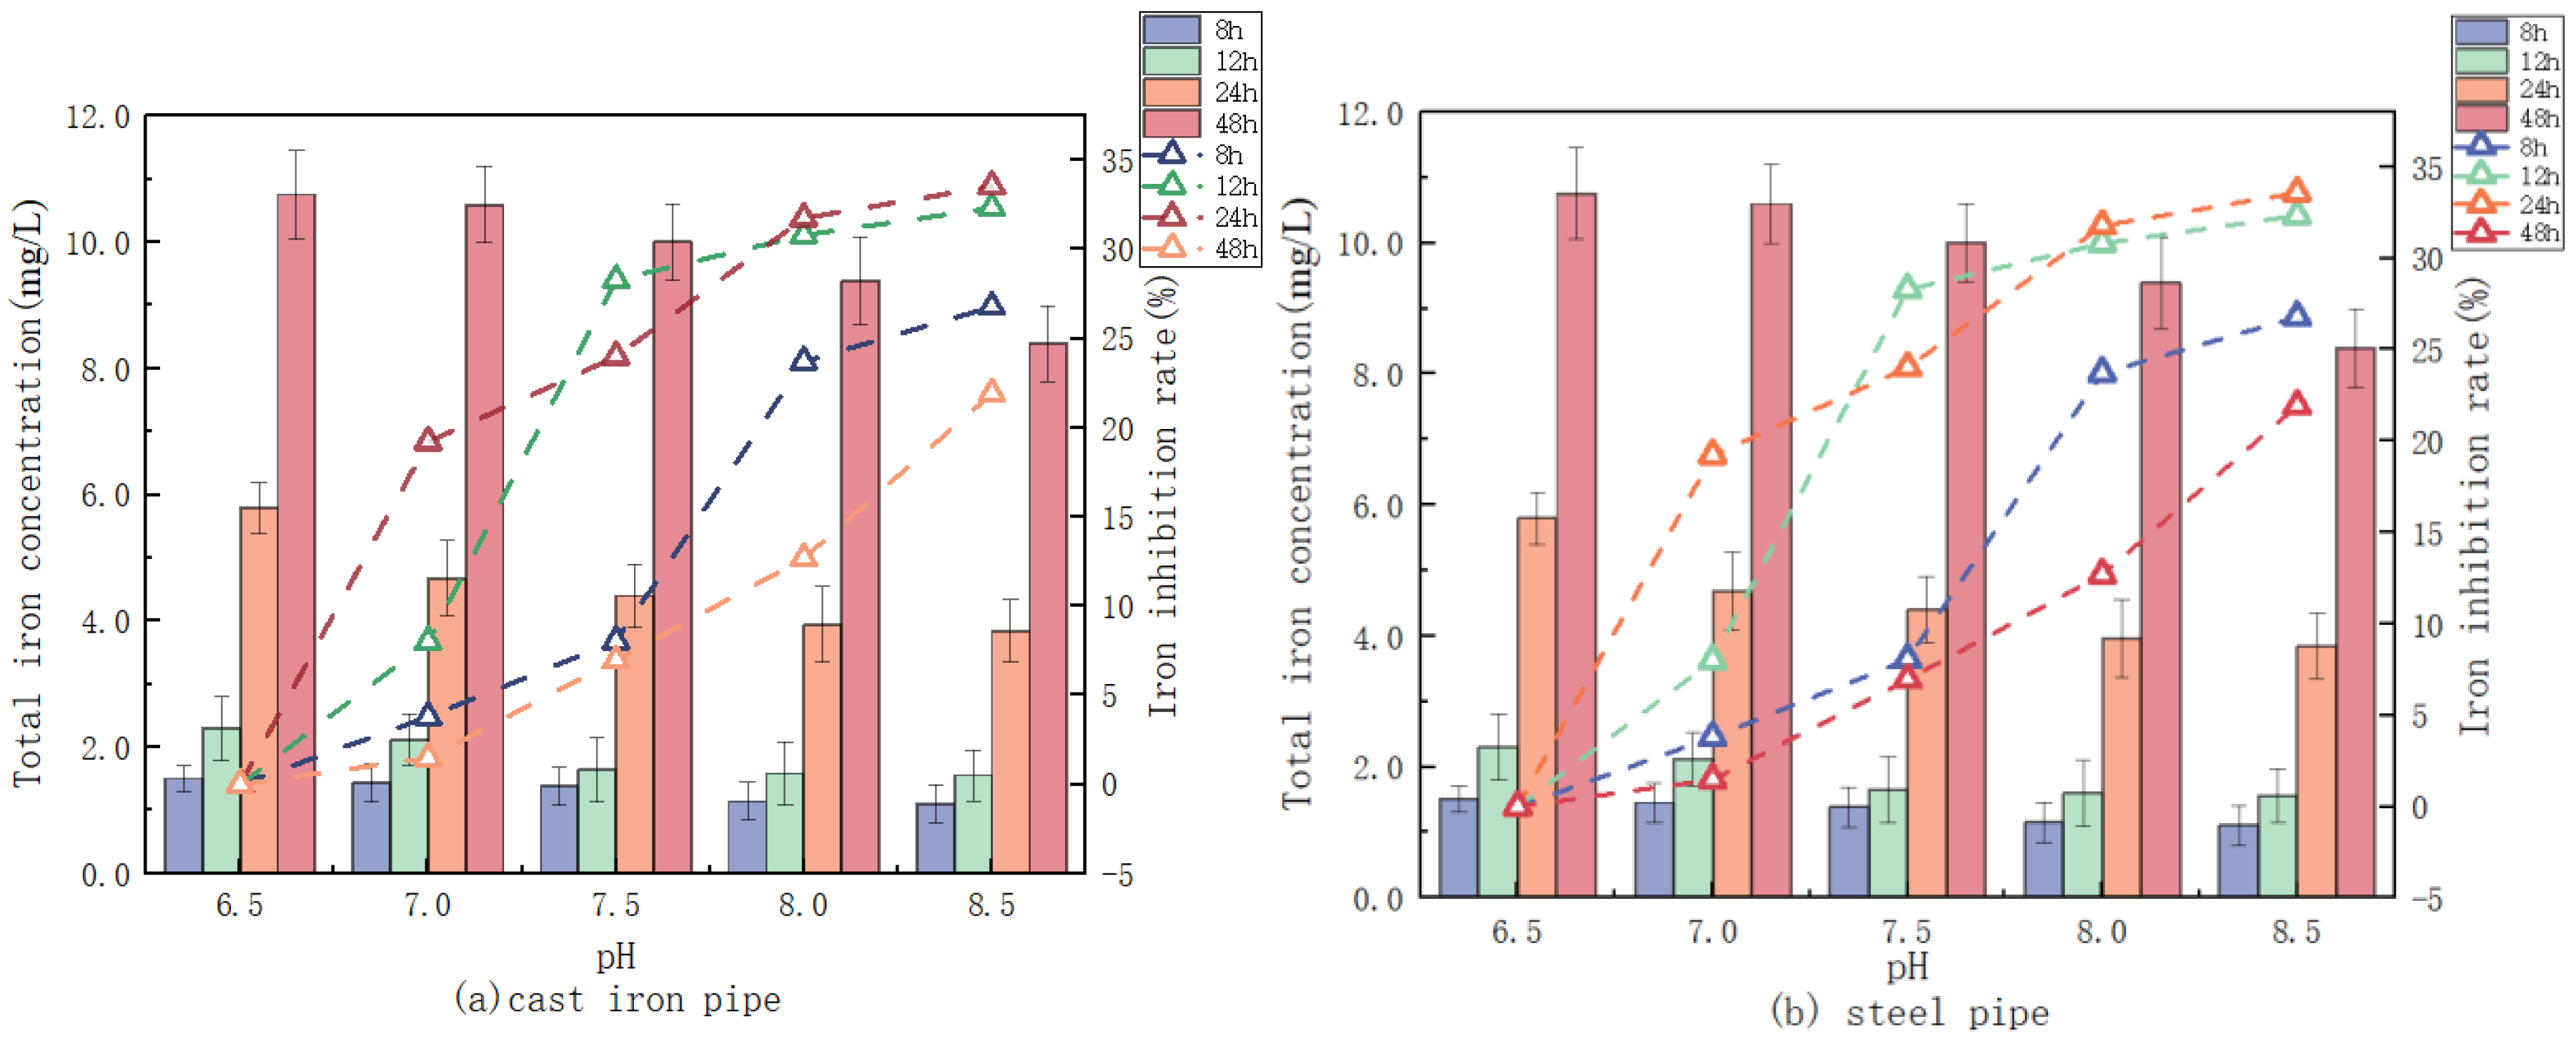
The control of the release of desalinated water iron by regulating pH is shown in Figure 6. Overall, the total iron concentration of steel pipe and cast iron pipe increased significantly with time, especially within 12–48 h, and the release of the total iron concentration accelerated significantly.
With the increase in NaOH injection, pH increased from 6.5 to 8.5, iron release decreased with the increase in the pH, the pipe iron release rate slowed, ad iron release and pipe corrosion could be effectively slowed, which was due to the pH of the water affecting the size of the corrosion potential and the form of corrosion (hydrogen corrosion or oxygen corrosion). When the pH decreases, the concentration of H+ increases, the corrosion of hydrogen evolution intensifies, and the hydrogen depolarization reaction occurs. Moreover, the anodic reaction product is difficult to oxidize to trivalent iron, and it is difficult to form a passivation film, which means the corrosion in the pipe network intensifies and the iron release rate increases. When the pH increases, the solubility of stride on the surface of the pipeline decreases, which will inhibit the reaction of Formulas (1) and (2) from proceeding forward and reduce the release of ferric hydroxide and ferrous carbonate.
Fe(OH)2→Fe2+ + 2OH
FeCO3→Fe2+ + CO32−
Fe2+ + 1/4O2 + 2OH→FeOOH + 1/2H2O
In addition, the higher pH value can promote the reaction of Formula (3), thus accelerating iron oxidation, forming a more stable oxide film on the surface of the pipeline, slowing the release of iron, and reducing the corrosion of the pipeline. pH increase will inhibit corrosion, slow the rate of Fe oxidation to Fe2+ in the pipe, and accelerate the rate of Fe2+ oxidation to Fe3+, so that the tube scale will form a more stable Fe3O4 structure and inhibit iron release. Usually, regulating the pipe network water pH to be weakly alkaline (pH 7.5–8.5) can relieve iron release. Overall, regulating pH is an effective control means to prevent the iron release rate from being too fast and to slow pipeline corrosion.

3.2.2. Alkalinity Influence on the Release of Iron

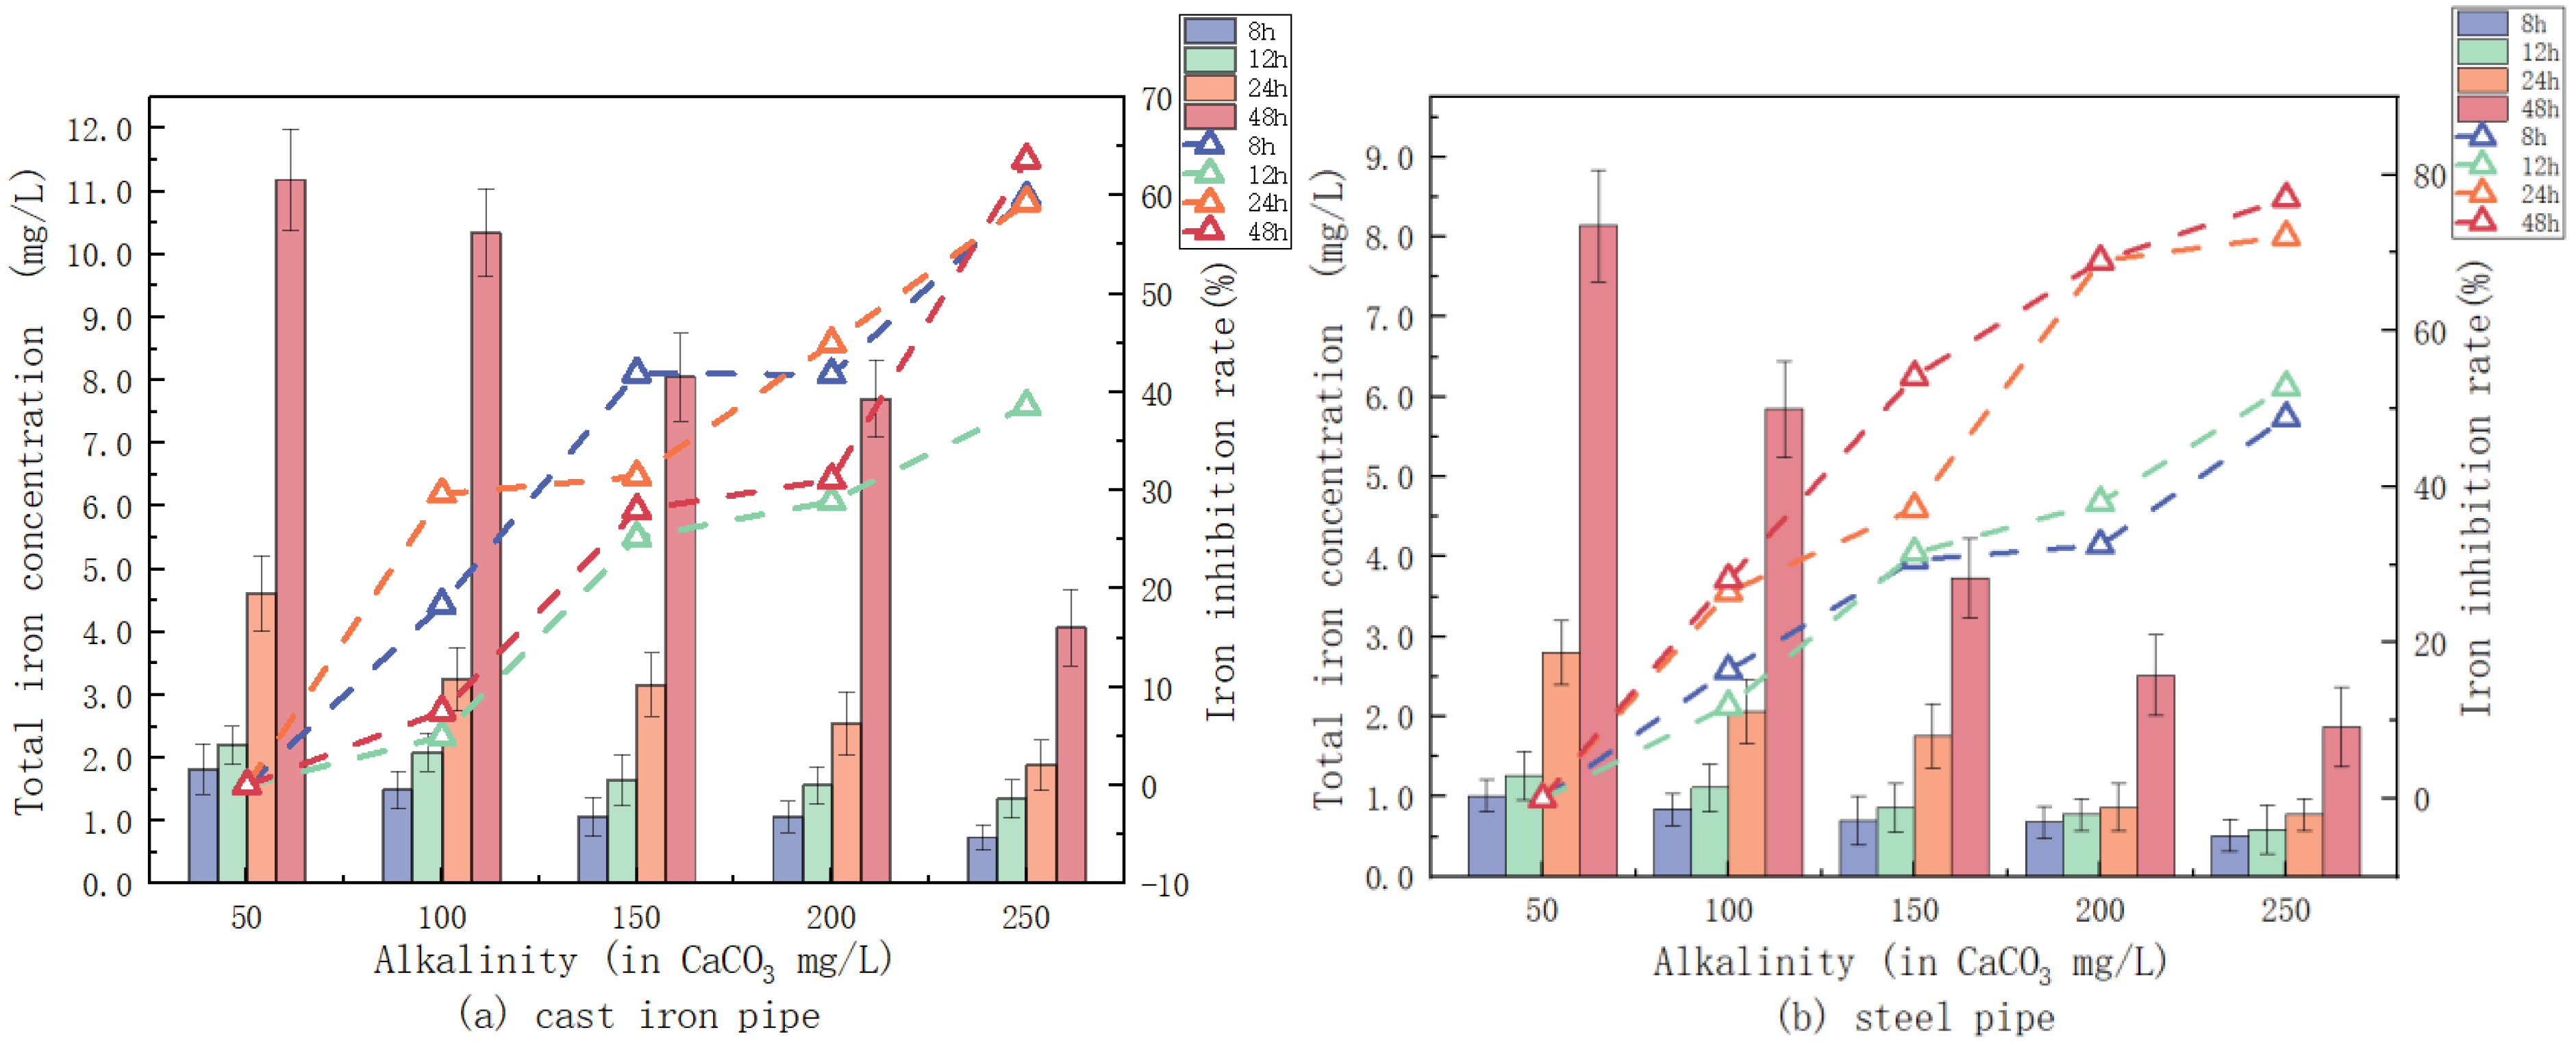
Adjusting for alkalinity only, the control of the release of the desalinated water iron is shown in Figure 7. It can be observed that the total iron concentration in steel pipe is much less than that in cast iron pipe, and the iron release is significantly controlled with increasing alkalinity. The total iron release at 48 h and an alkalinity of 250 mg/L was almost the same as the iron release at 24 h and an alkalinity of 50 mg/L. This shows that the increase in alkalinity compensates to a certain extent for the effect of increased iron release due to hydraulic retention time. Higher alkalinity means a better buffer capacity. The total iron concentration increased rapidly within 24–48 h, and the increase was much higher than 24 h earlier. Especially at 48 h, when the alkalinity increased from 50 mg/L to 250 mg/L, the total iron content in cast iron pipe decreased by 63.6%, and the total iron in steel pipe decreased by 85.4%. Therefore, we conclude that improving the alkalinity of the desalinated water can effectively control the release of iron.
Since the pH of drinking water is generally 6.5~8.5, the water does not contain OH alkalinity; it only contains HCO3 alkalinity. Alkalinity mainly reflects the buffering capacity of water, and the greater the alkalinity, the stronger the buffering capacity. With a strong buffer capacity of high-alkalinity water, corrosion of Fe2+ will generate FeCO3, HCO3 will react with water, pipe iron, calcium, and other substances, and generated FeCO3 and CaCO3 substances will be adsorbed and slow oxidation deposition on the tube scale surface to form a layer of uniform, dense carbonate protective film (see Formulas (4)–(7)), as well as hinder dissolved oxygen diffusion through scale layer corrosion of the control substrate. In addition, when the concentration of HCO3 increases, the Formula (3)–(8) reactions will be inhibited, which can reduce the production of suspended iron hydroxide and avoid the deterioration of water quality. When the alkalinity decreases, the carbonate content in the water decreases, which will promote the dissolution of FeCO3, thus triggering iron release. Therefore, improving alkalinity can effectively inhibit the release of the pipe network.
Ca2+ + HCO3 + OH→CaCO3 + H2O
HCO3→CO32− + H+
2Ca2+ + 2CO32−→2CaCO3
2Fe2+ + 2CO32−→2FeCO3
Fe2+ + 1/4O2 + 2/5H2O→Fe(OH)3 + 2H+

3.2.3. Phosphate Influence on the Release of Iron

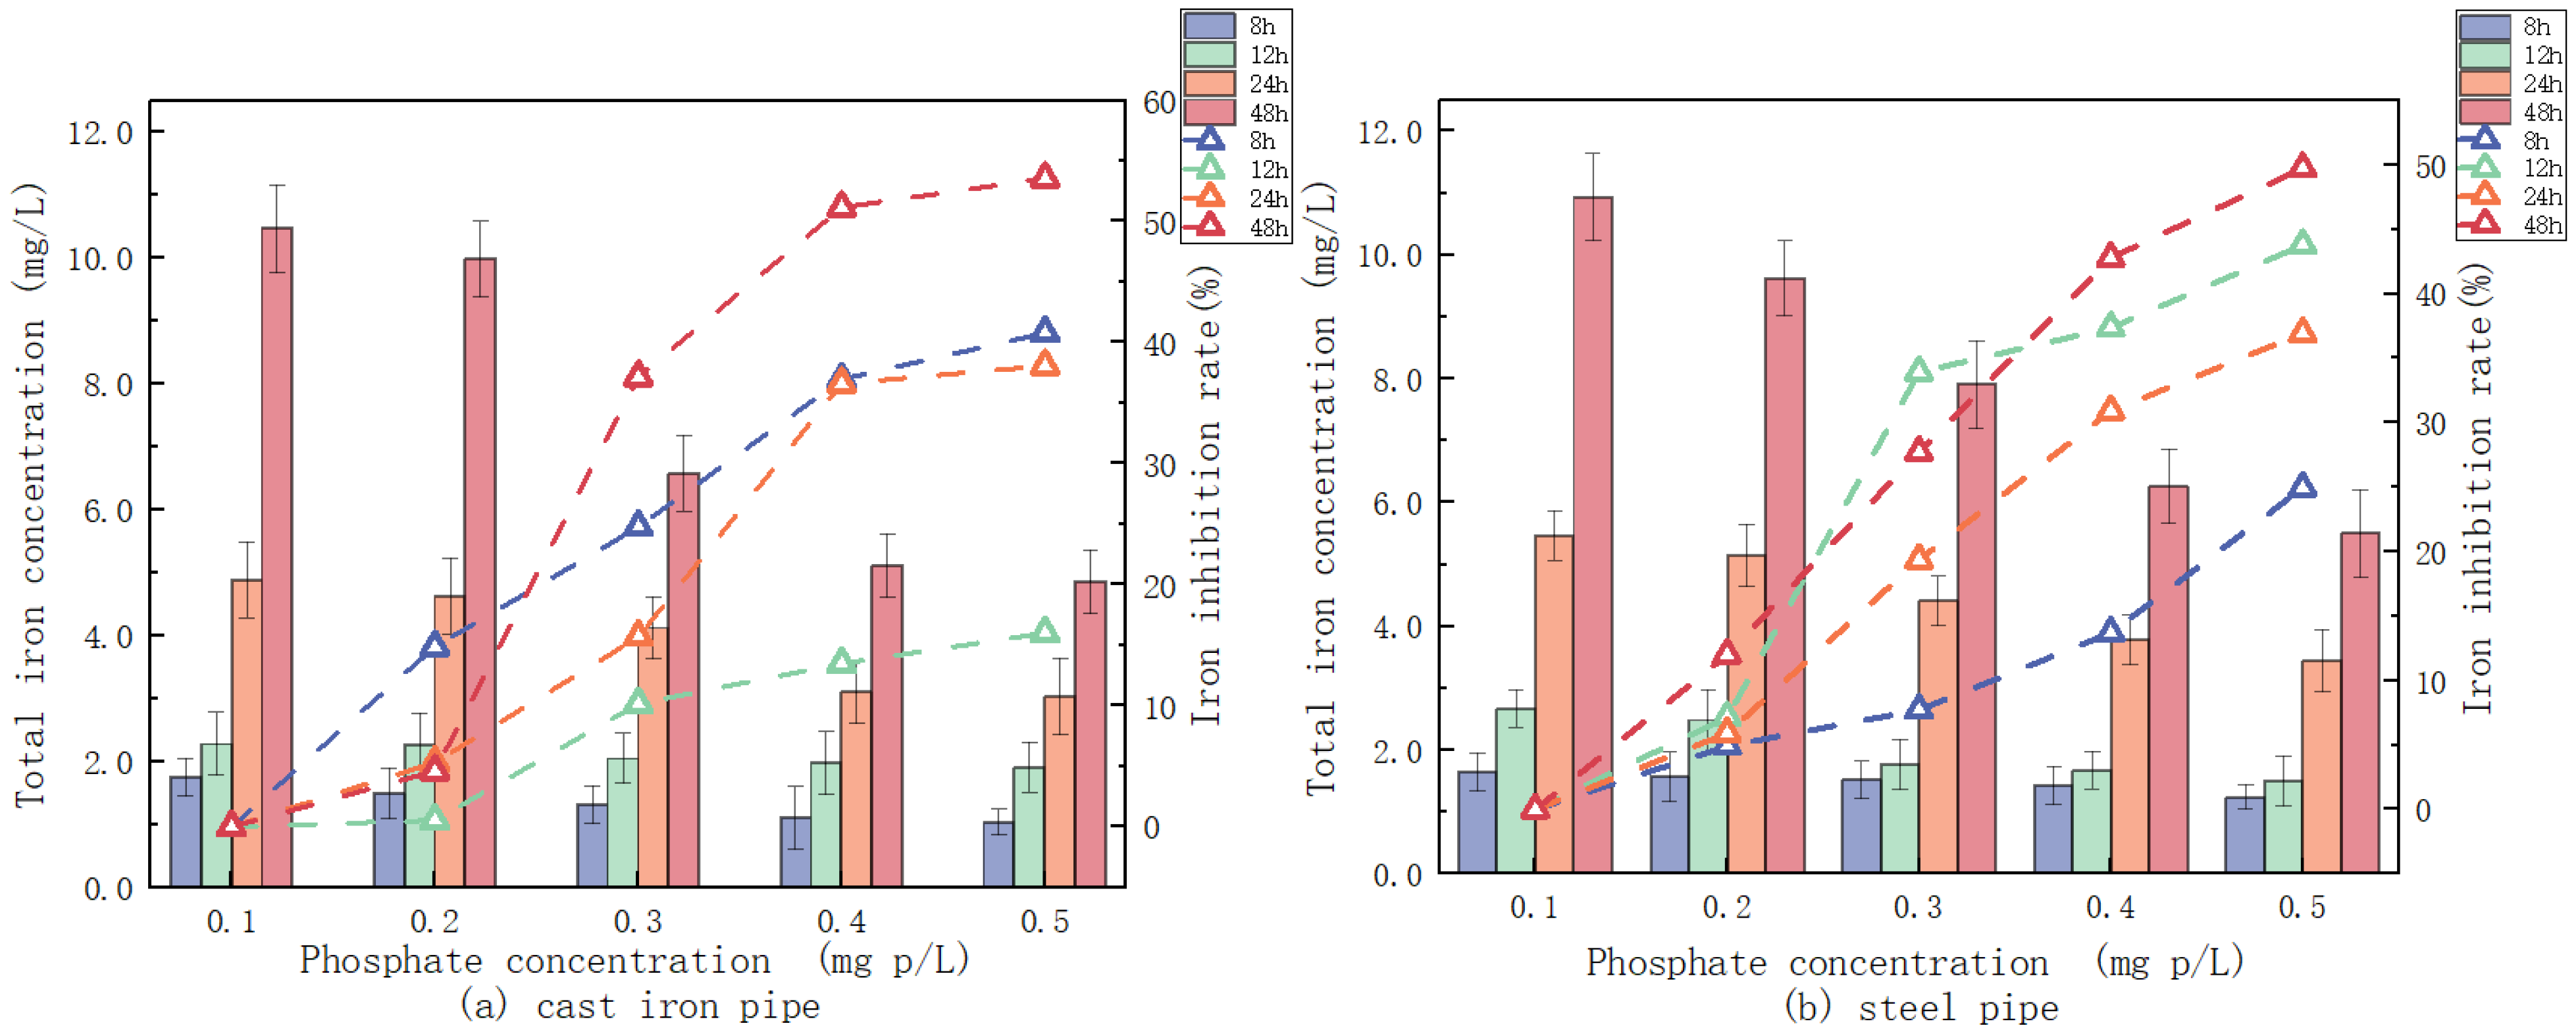
The control of phosphate on iron release is shown in Figure 8. With the increase in phosphate, the total iron concentration decreased; this trend was very clear, especially at 48 h and in the steel pipe, which indicates that within a certain concentration range, phosphate can inhibit the release of iron. Similar to alkalinity, the inhibitory effect of a high concentration of phosphate on the iron concentration can also offset the increase in iron concentration caused by the residence time in a low concentration of phosphate. In addition, at 48 h, the total iron content of cast iron pipe decreased by 49.8% and the total iron content of steel pipe decreased by 53.5%. For the desalination water in the two pipes, increasing the concentration of phosphate can effectively control the iron release.
The inhibitory effect of phosphate on the release of iron has been extensively studied, but the mechanism has not been uniformly concluded. Some people believe that phosphate is a commonly used corrosion inhibitor in water treatment. The iron ions produced by corrosion can be complexed with the phosphate root, and the phosphate compounds produced have extremely poor solubility, which can form a protective film in the inner wall of the pipeline, thus hindering the release of iron [28].
Regulation of pH, alkalinity, and phosphate addition can control iron release to a certain extent. However, the degree of control, the control effect, and the mechanism for iron release are all different. From the results, it can be found that the effect of alkalinity regulation control is optimal, followed by the addition of a certain amount of phosphate corrosion inhibitor, and finally, pH regulation. The experimental results show that the alkalinity regulation is greater than 150 mg/L, the pH regulation is 7.5–8.0, and phosphate injection with 0.3–0.5 mg/L can effectively control iron release.

3.3. Optimal Condition of Iron Release Control

3.3.1. Variance Analysis

The results of analysis of variance are presented in Table 4 and Table 5. The linear effects of B, AC, and BC on Y are highly significant for steel pipe; the linear effects of A2, B2, and C2 on Y are also significant. The results for cast iron pipe are consistent with those for steel pipe. The coefficients of the three variables in the quadratic regression equation are, for cast iron pipe, 0.009, −0.1813, and −0.06; and for steel pipe, 0.031, −0.1479, and 0.039. Comparing the absolute values of these coefficients reveals that the order of influence on Y (total iron concentration) is alkalinity concentration > phosphate concentration > pH.

3.3.2. Effects of Multiple Varied Parameters

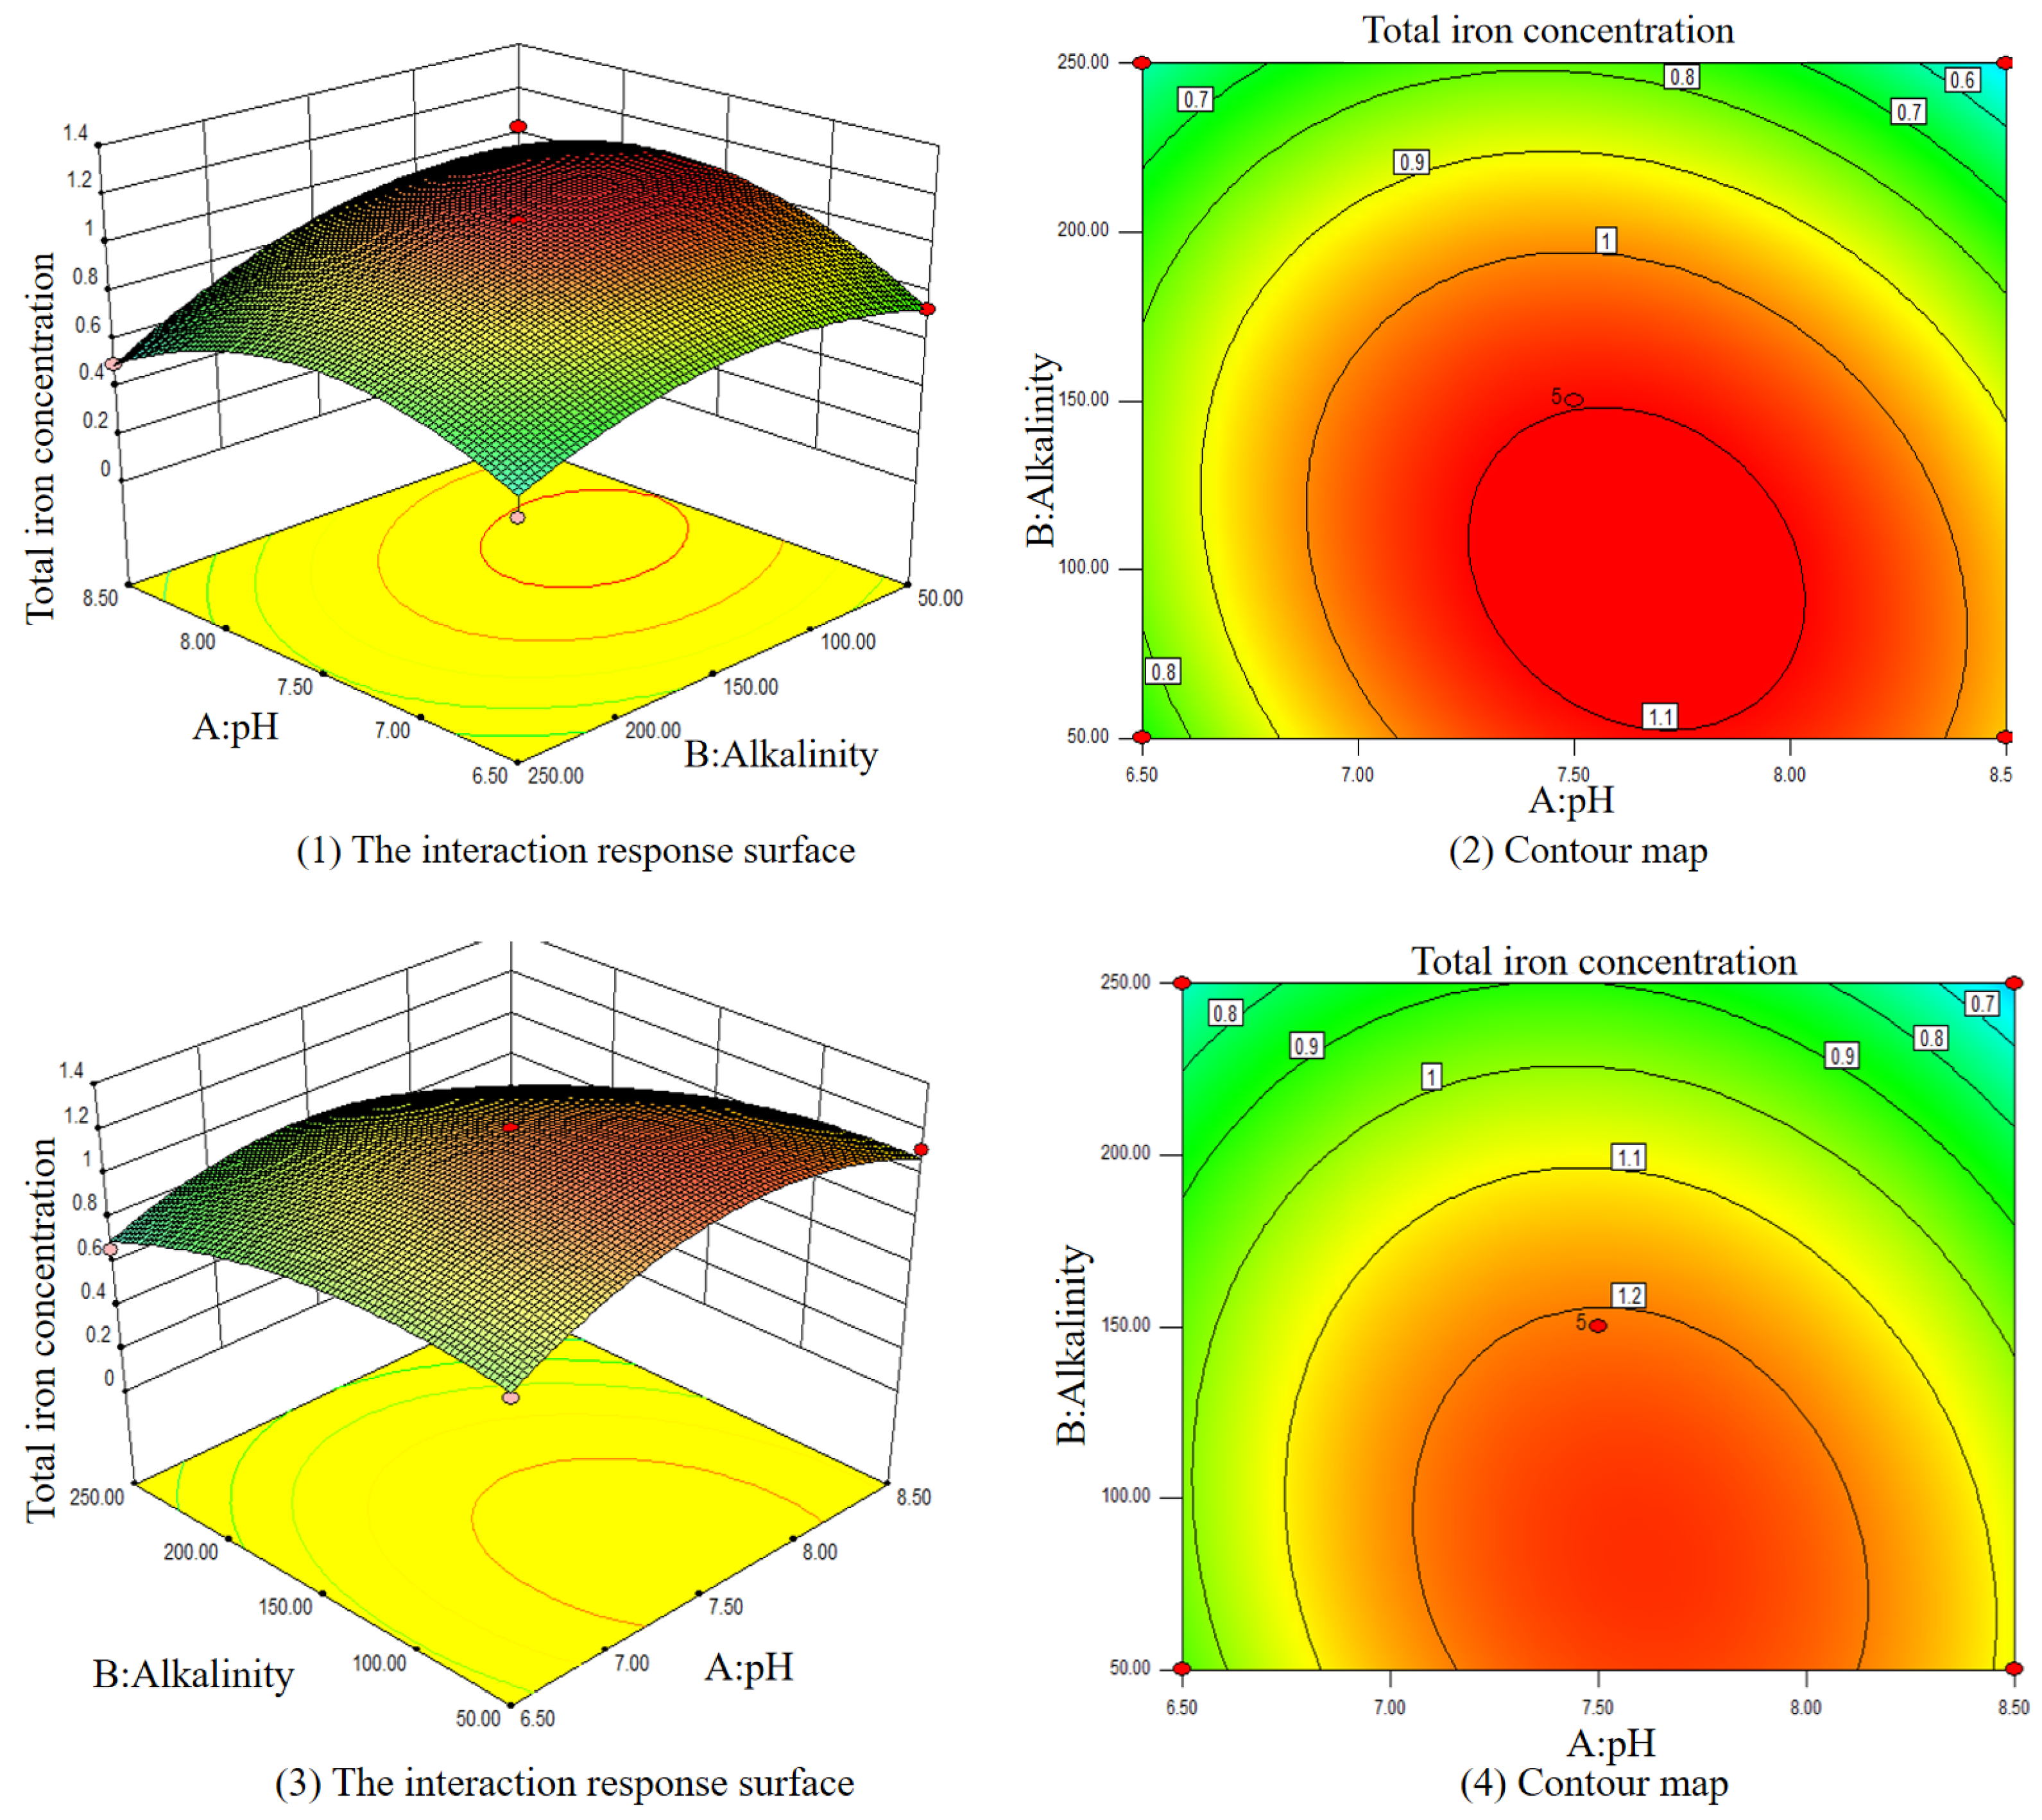
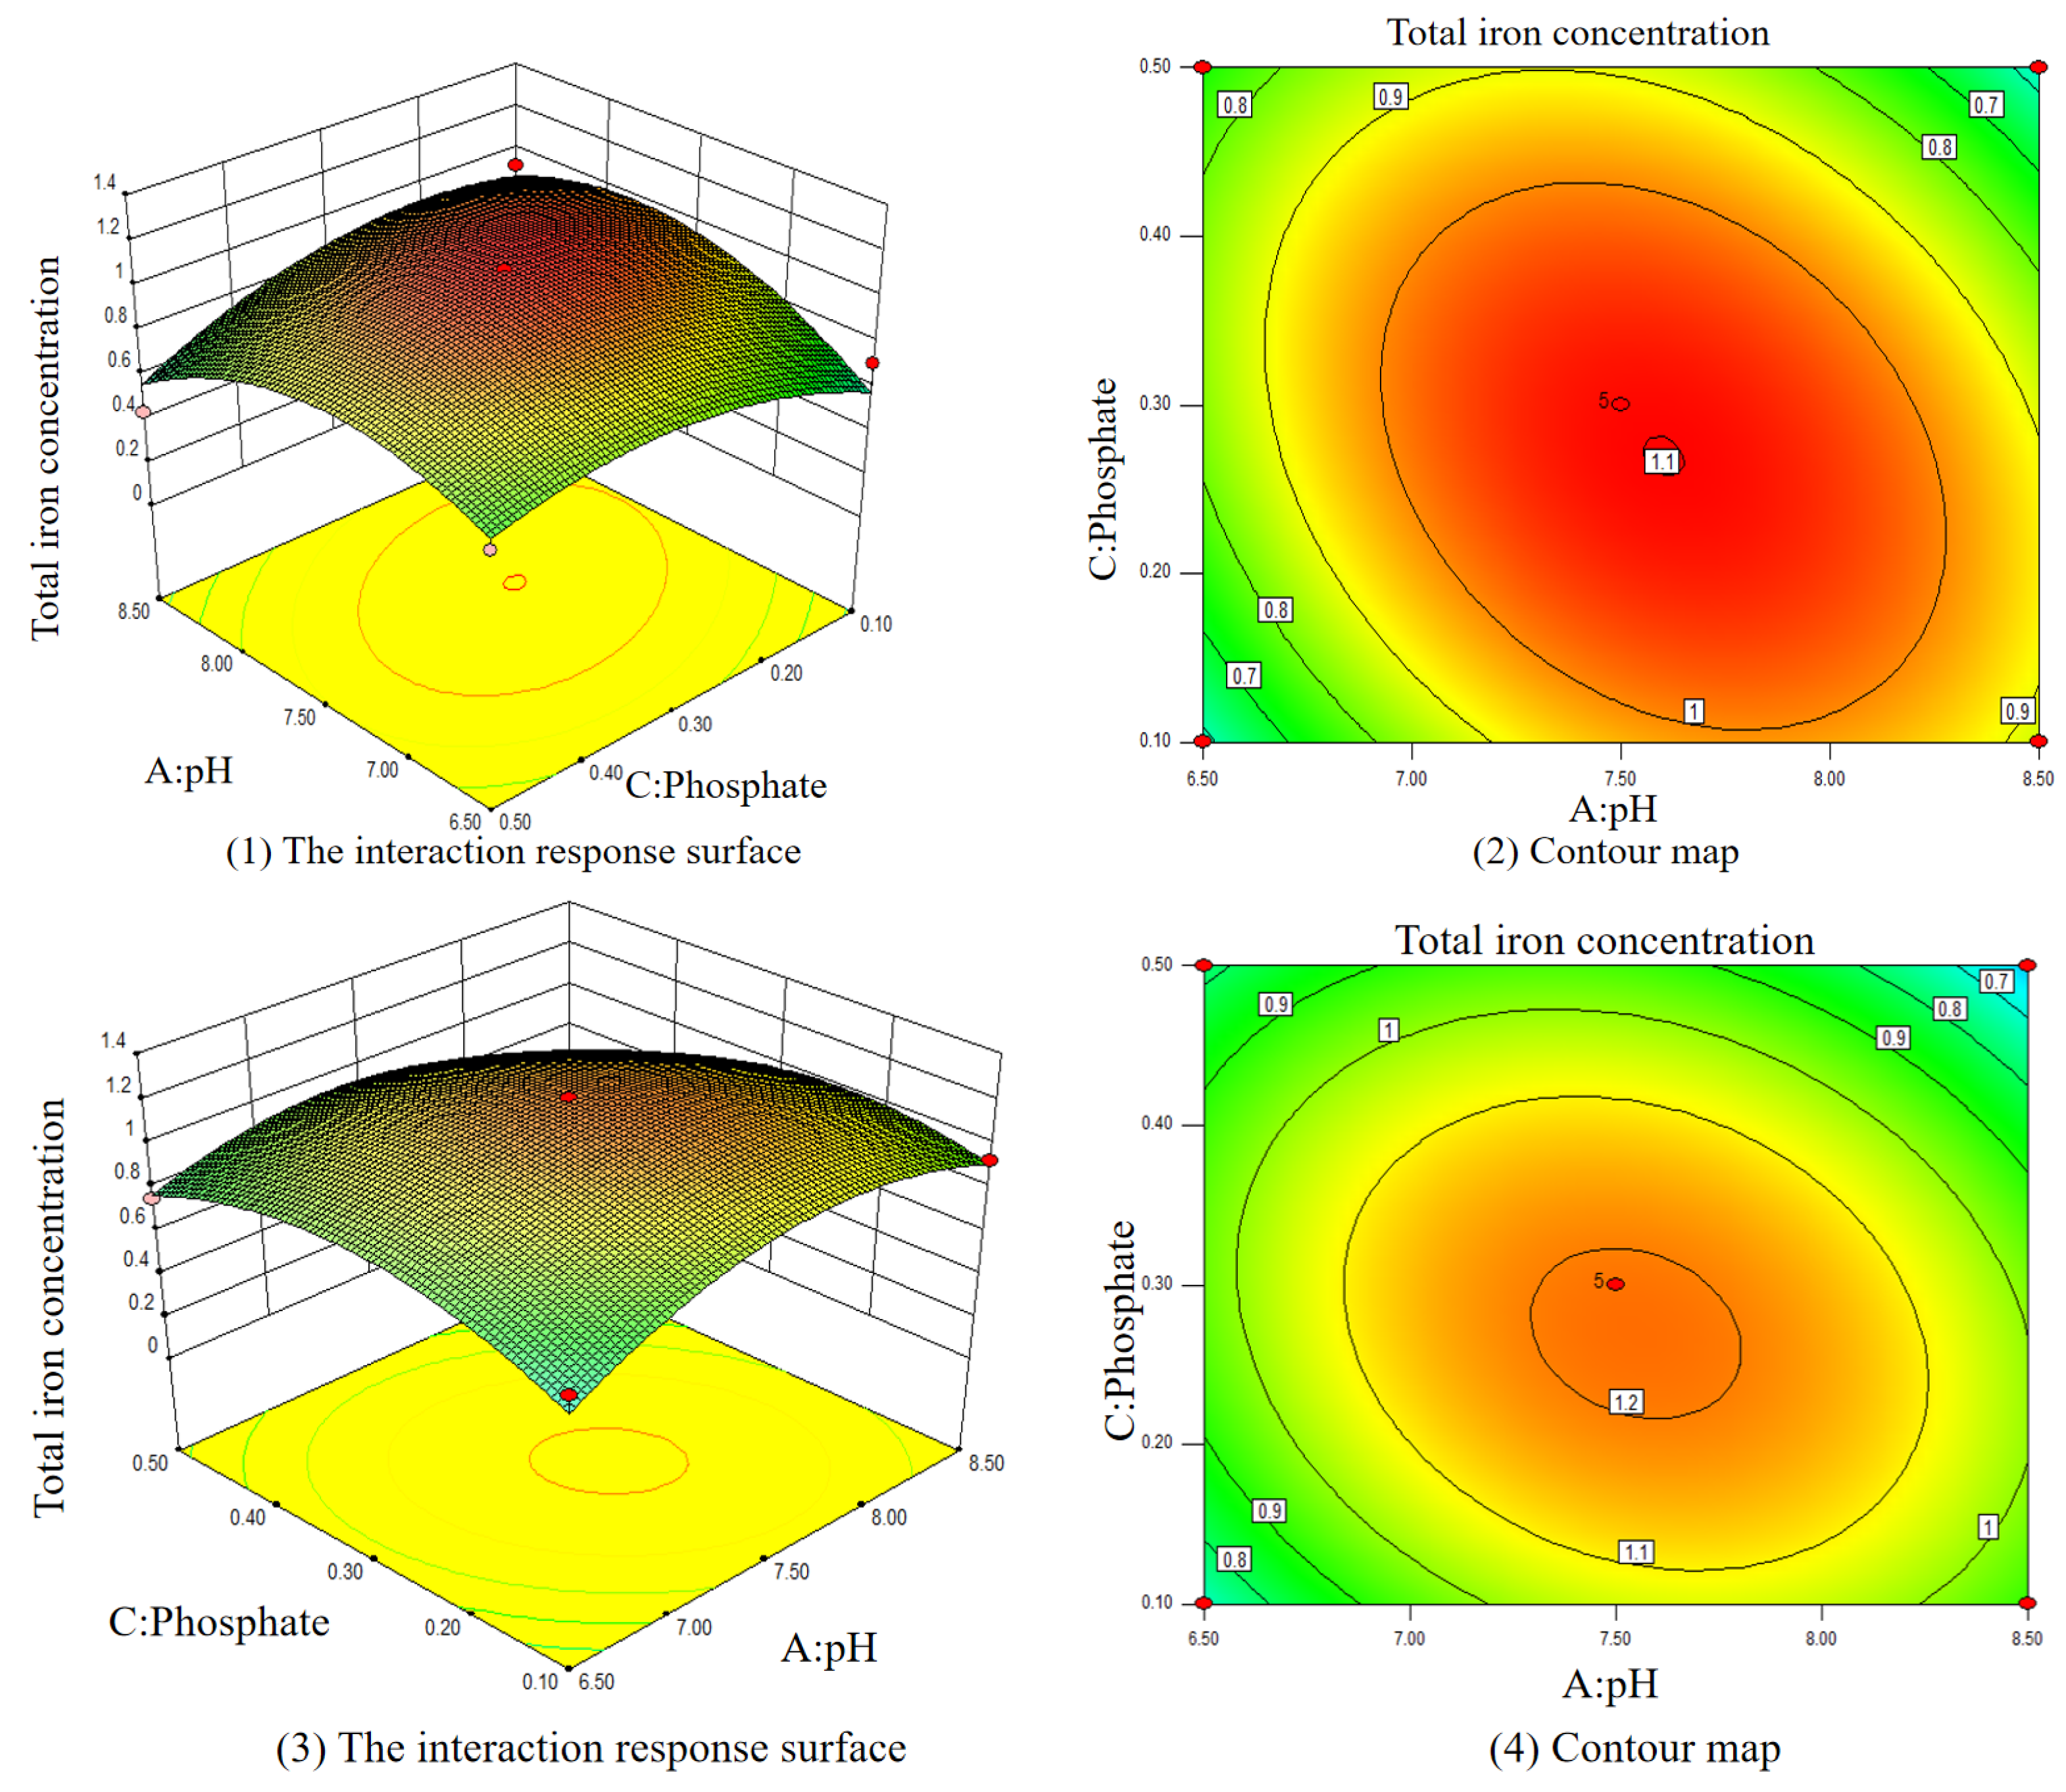
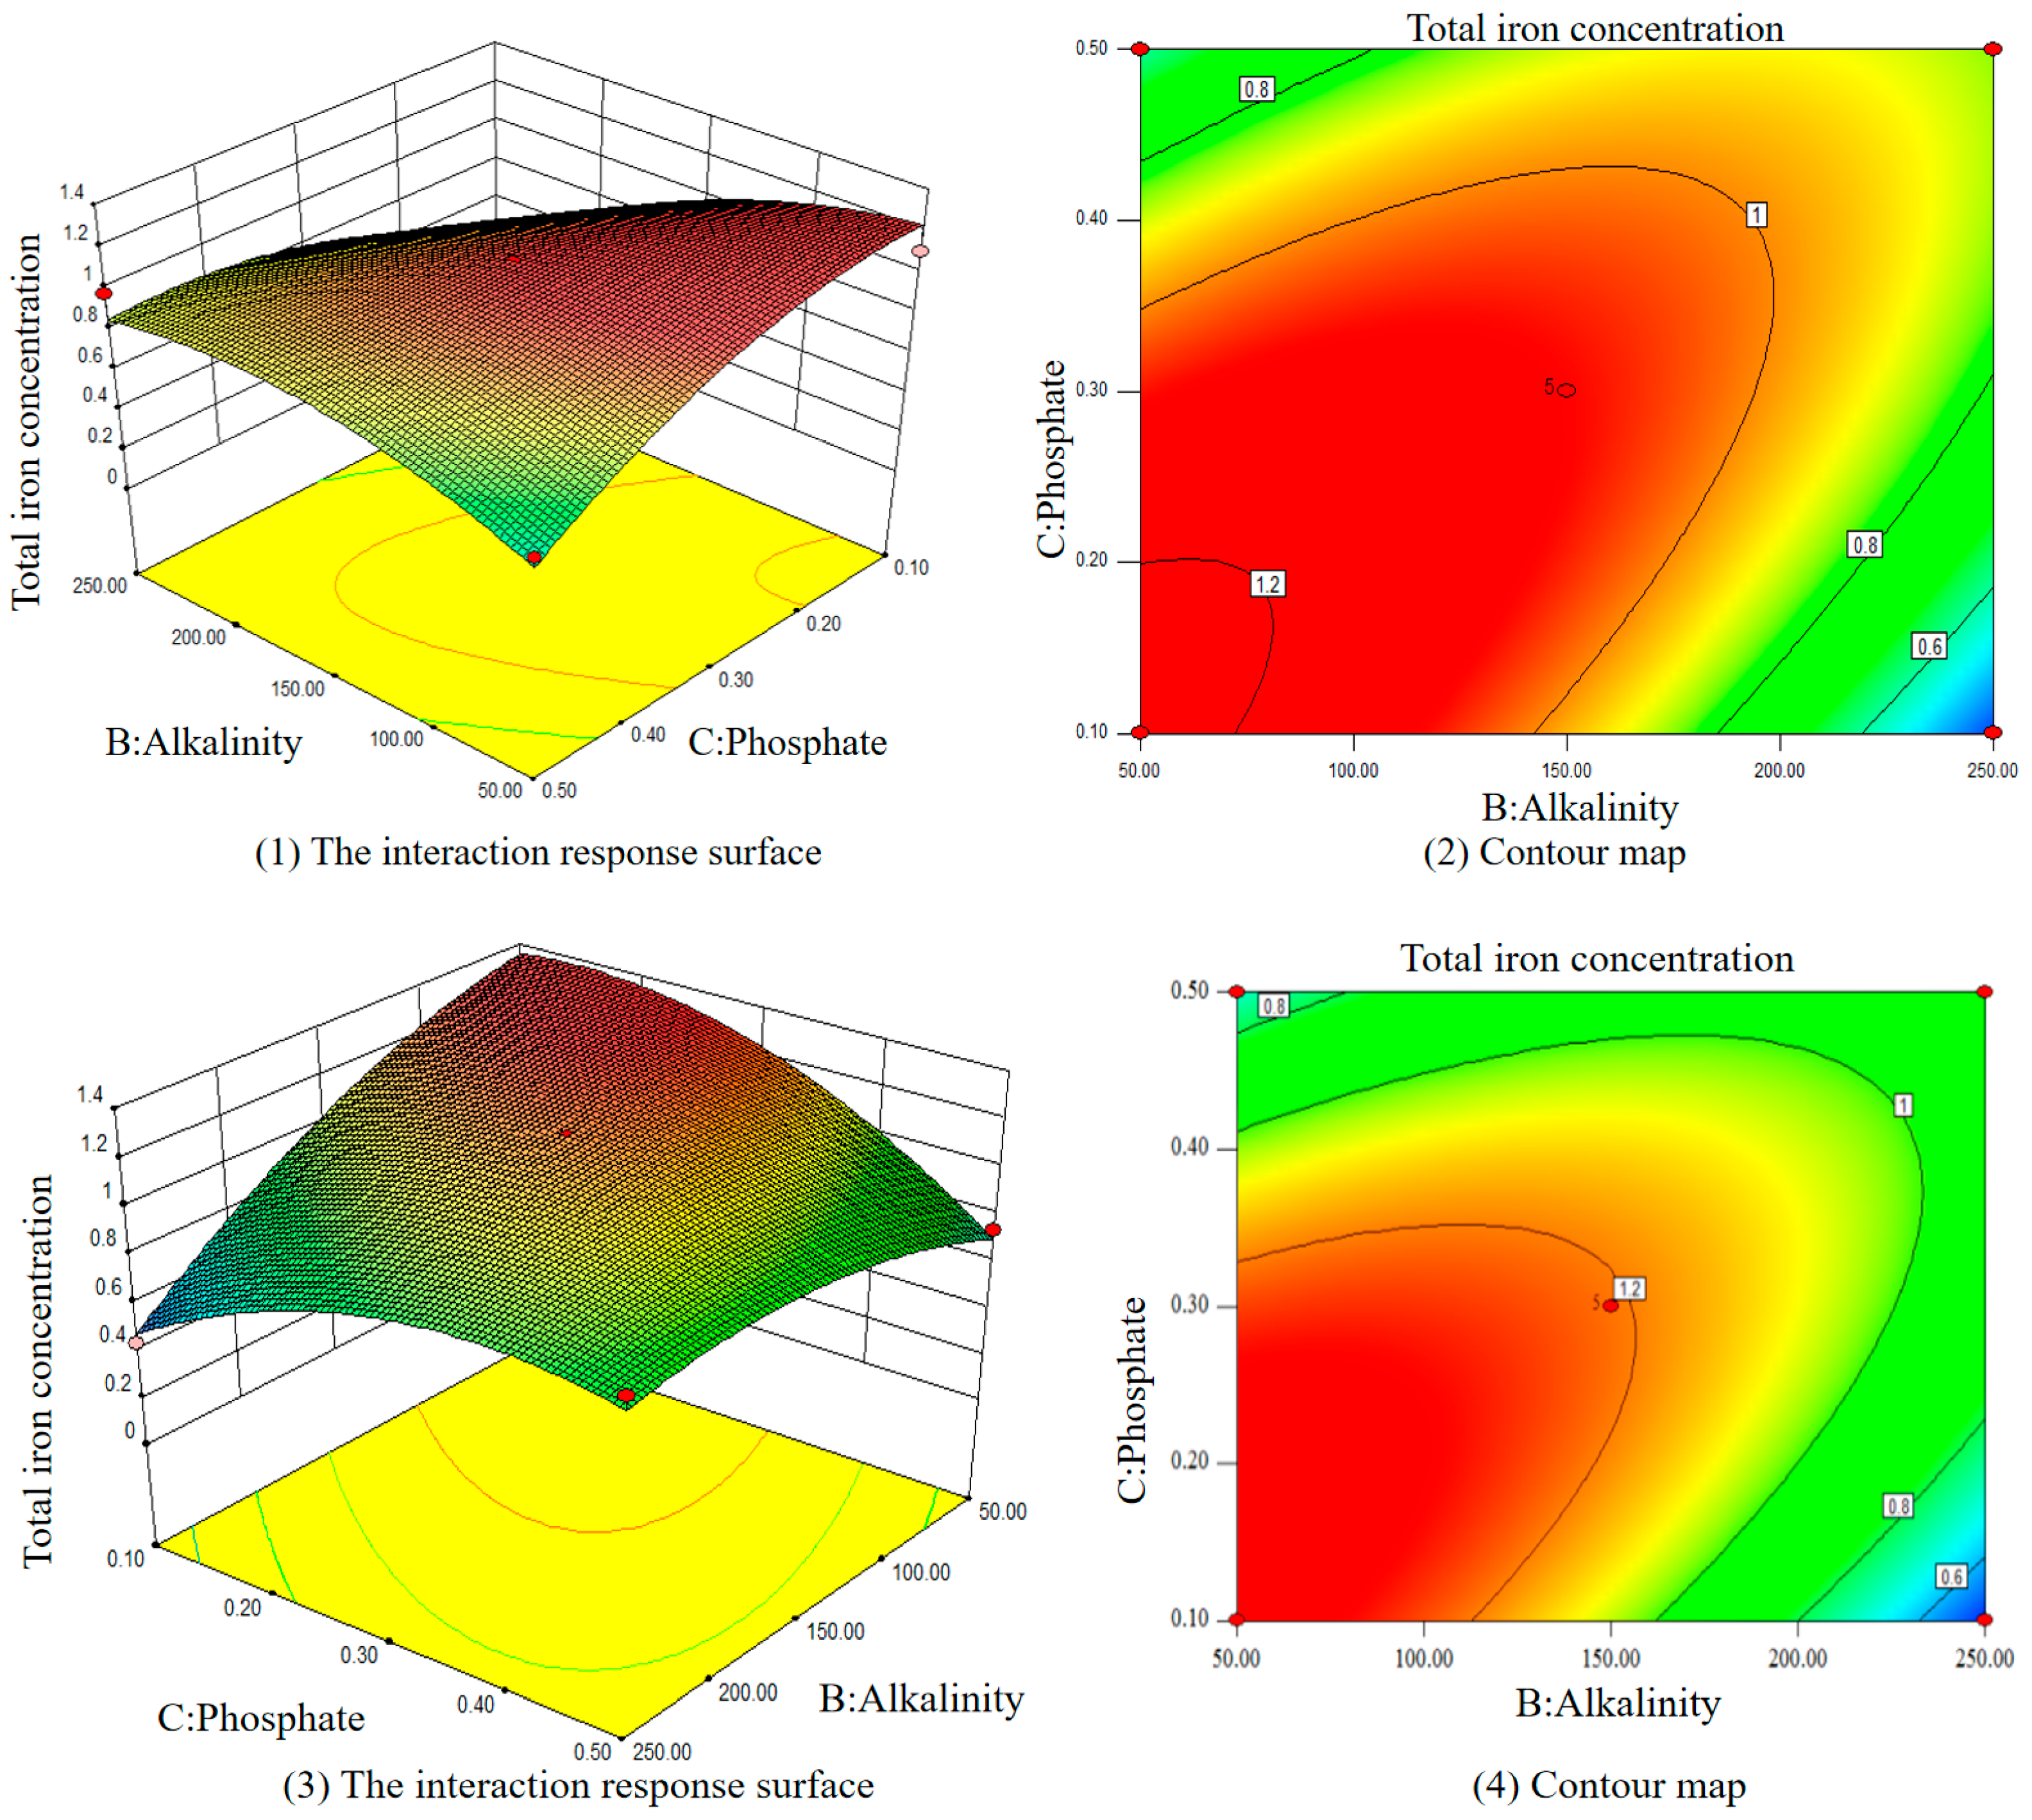
The response surface and contour analyzed by Design-Expert software and cast iron pipe between three factors are shown in Figure 9, Figure 10 and Figure 11. The interaction between two variables can be analyzed using the contour plot, where a warmer color indicates a larger total iron concentration.
Figure 9(1–4) shows the interaction response surface and contour lines for the pH value and alkalinity concentration when phosphate is 0.3 mg/L. The total iron concentration decreases as the alkalinity concentration increases, with the lowest total iron concentration occurring near pH 8.5 and alkalinity 250 mg/L. The trend indicated by the contour lines shows that the alkalinity concentration has a more significant impact on the total iron concentration than the pH value.
In Figure 10(1–4), the interaction response surface and contour lines between pH and phosphate at a base value of 150 mg/L are shown. The response trend of the contour lines shows that the concentration of phosphate has a more significant effect on the total iron concentration than the value of pH.
Figure 11(1–4) shows the interaction response surface and contour lines of alkalinity and phosphate at pH = 7.5. The total iron concentration decreases as the alkalinity concentration increases. From the trend of the contour lines, it is evident that alkalinity has a more significant impact on the total iron concentration compared to phosphate.
Under the combined effects of pH, alkalinity, and phosphate, the analysis of the response surface experimental results reveals that the trends in cast iron pipe are similar to those in steel pipe, but with different magnitudes. Among the three factors, alkalinity has the greatest impact on iron release, followed by phosphate, with pH having the least influence. The optimal conditions for controlling iron release obtained from the simulation of the response surface model are as follows: for cast iron pipe: adjust the pH to 8.5, adjust the alkalinity to 250 mg/L, and add 0.1 mg/L of phosphate; for steel pipe: adjust the pH to 8.0, adjust the alkalinity to 250 mg/L, and add 0.1 mg/L of phosphate.

4. Conclusions

In this experiment, by using steel and cast iron pipe used for more than 20 years to make a pipe section reactor, adding simulated desalinated water, changing different conditions, and monitoring the total iron concentration and other water quality parameters in the water, the analysis reached the following conclusions.
The water quality of desalinated water has the characteristics of soft water quality, low alkalinity hardness, and weak buffer capacity. Adding the desalinated water directly to conventional steel pipe and cast iron pipe will cause changes in water quality, especially the erosion of pipe scale that has formed in the pipe, which will pollute the water.
Three methods, adjusting pH value, increasing alkalinity, and adding phosphate corrosion inhibitor, can control iron release to varying degrees. The order of control effect is increasing alkalinity > adding phosphate corrosion inhibitor > adjusting pH value.
When controlling pH, alkalinity, and phosphate separately, the three factors showed similar trends but different degrees of influence on iron release in cast iron and steel pipe. All three factors are inversely proportional to the total iron concentration. Among them, pH has less effect on iron release, while alkalinity has more effect on cast iron pipe than steel pipe.
The response surface experiment obtained the optimal control conditions for the two pipelines under the combined effects of pH, alkalinity, and phosphate. For steel pipe, the optimal condition for iron release control was pH = 8.5, alkalinity = 250 mg/L CaCO3, and phosphate = 0.1 mg/L. For cast iron pipe, the optimal condition was pH = 8.0, alkalinity = 250 mg/L CaCO3, and phosphate = 0.1 mg/L.

Author Contributions

Conceptualization, H.Z.; methodology, H.Z.; validation, P.J., Y.J. and J.Z.; formal analysis, Y.F.; investigation, P.J.; resources, M.F.; data curation, T.W.; writing—original draft preparation, Y.F.; writing—review and editing, Y.F.; visualization, Y.F.; supervision, H.Z.; project administration, H.Z.; funding acquisition, H.Z. All authors have read and agreed to the published version of the manuscript.

Funding

This research was funded by [Shaanxi Natural Science Basic Research Program] grant number [No. 2025JC-YBMS-563].

Data Availability Statement

The original contributions presented in this study are included in the article. Further inquiries can be directed to the corresponding author.

Conflicts of Interest

The authors declare no conflict of interest.

Correction Statement

This article has been republished with a minor correction to the Data Availability Statement. This change does not affect the scientific content of the article.

References

  1. Lin, X.; Xu, Q.; Li, Y.; Zhao, B.; Li, L.; Qiang, Z. Modeling iron release from cast iron pipes in an urban water distribution system caused by source water switch. J. Environ. Sci. 2021, 110, 73–83. [Google Scholar] [CrossRef] [PubMed]
  2. Cui, Y.; Liu, S.; Smith, K.; Yu, K.; Hu, H.; Jiang, W.; Li, Y. Characterization of corrosion scale formed on stainless steel delivery pipe for reclaimed water treatment. Water Res. 2016, 88, 816–825. [Google Scholar] [CrossRef] [PubMed]
  3. Avramidi, M.; Loizou, C.; Kyriazi, M.; Malamis, D.; Kalli, K.; Hadjicharalambous, A.; Kollia, C. Optimization of the Quality of Reclaimed Water from Urban Wastewater Treatment in Arid Region: A Zero Liquid Discharge Pilot Study Using Membrane and Thermal Technologies. Membranes 2025, 15, 199. [Google Scholar] [CrossRef]
  4. Gandhimathi, G.; Chellaswamy, C.; Geetha, T.S.; Arunmozhi, S.A. Integrating Regression and Boosting Techniques for Enhanced River Water Quality Monitoring in the Cauvery Basin: A Seasonal and Sustainable Approach. Water Environ. Res. 2025, 97, e70128. [Google Scholar] [CrossRef]
  5. Zhang, H.; Zhao, L.; Liu, D.; Wang, J.; Zhang, X.; Chen, C. Early period corrosion and scaling characteristics of ductile iron pipe for ground water supply with sodium hypochlorite disinfection. Water Res. 2020, 176, 115742. [Google Scholar] [CrossRef]
  6. Sarin, P.; Snoeyink, V.L.; Lytle, D.A.; Kriven, W.M. Iron Corrosion Scales: Model for Scale Growth, Iron Release, and Colored Water Formation. J. Environ. Eng. 2004, 130, 364–373. [Google Scholar] [CrossRef]
  7. Zhuang, Y.; Han, B.; Chen, R.; Shi, B. Structural transformation and potential toxicity of iron-based deposits in drinking water distribution systems. Water Res. 2019, 165, 114999. [Google Scholar] [CrossRef]
  8. Mi, Z.; Zhang, X.; Chen, C. Iron release in drinking water distribution systems by feeding desalinated seawater: Characteristics and control. Desalinat. Water Treat. 2016, 57, 9728–9735. [Google Scholar] [CrossRef]
  9. Edwards, M. Controlling corrosion in drinking water distribution systems: A grand challenge for the 21st century. Water Sci. Technol. 2004, 49, 1–8. [Google Scholar] [CrossRef]
  10. Yang, Y.; Gao, X.; Fan, A.; Fu, L.; Gao, C. An innovative beneficial reuse of seawater concentrate using bipolar membrane electrodialysis. J. Membr. Sci. 2014, 449, 119–126. [Google Scholar] [CrossRef]
  11. Huang, Z.; Yuan, X.; Liu, X. The key drivers for the changes in global water scarcity: Water withdrawal versus water availability. J. Hydrol. 2021, 601, 126658. [Google Scholar] [CrossRef]
  12. Musie, W.; Gonfa, G. Fresh water resource, scarcity, water salinity challenges and possible remedies: A review. Heliyon 2023, 9, e18685. [Google Scholar] [CrossRef] [PubMed]
  13. Kaner, A.; Tripler, E.; Hadas, E.; Ben-Gal, A. Feasibility of desalination as an alternative to irrigation with water high in salts. Desalination 2017, 416, 122–128. [Google Scholar] [CrossRef]
  14. Alshehri, A.A.; Duranceau, S.J.; Taylor, J.S.; Stone, E.D. Investigating iron release in distribution systems with blend variations of source waters and phosphate inhibitors. Desalination Water Treat. 2009, 8, 211–220. [Google Scholar] [CrossRef]
  15. Birnhack, L.; Penn, R.; Lahav, O. Quality criteria for desalinated water and introduction of a novel, cost effective and advantageous post treatment process. Desalination 2008, 221, 70–83. [Google Scholar] [CrossRef]
  16. Lahav, O.; Salomons, E.; Ostfeld, A. Chemical stability of inline blends of desalinated, surface and ground waters: The need for higher alkalinity values in desalinated water. Desalination 2009, 239, 334–345. [Google Scholar] [CrossRef]
  17. Birnhack, L.; Voutchkov, N.; Lahav, O. Fundamental chemistry and engineering aspects of post-treatment processes for desalinated water—A review. Desalination 2011, 273, 6–22. [Google Scholar] [CrossRef]
  18. Imran, S.A.; Dietz, J.D.; Mutoti, G.; Taylor, J.S.; Randall, A.A.; Cooper, C. Red Water Release in Drinking Water Distribution Systems. Am. Water Work. Assoc. 2005, 97, 93–100. [Google Scholar] [CrossRef]
  19. Liu, H.; Schonberger, K.D.; Korshin, G.V.; Ferguson, J.F.; Meyerhofer, P.; Desormeaux, E.; Luckenbach, H. Effects of blending of desalinated water with treated surface drinking water on copper and lead release. Water Res. 2010, 44, 4057–4066. [Google Scholar] [CrossRef]
  20. Lee, C.H.; Lee, K.; Lee, J.S.; Ko, Y.H. Persistent organic alkalinity in the ocean. Geochim. Cosmochim. Acta 2024, 387, 53–62. [Google Scholar] [CrossRef]
  21. Sadeek, S.A.; Hale, C.; Bedoya-Lora, F.E.; Campbell, K.S.; Kelsall, G.H.; Hankin, A. Protectiveness and stability of iron carbonate films on carbon steel in mildly alkaline aqueous alkanolamine CO2 environments. Corros. Sci. 2023, 227, 111773. [Google Scholar] [CrossRef]
  22. Liu, H.; Schonberger, K.D.; Peng, C.Y.; Ferguson, J.F.; Desormeaux, E.; Meyerhofer, P.; Luckenbach, H.; Korshin, G.V. Effects of blending of desalinated and conventionally treated surface water on iron corrosion and its release from corroding surfaces and pre-existing scales. Water Res. 2013, 47, 3817–3826. [Google Scholar] [CrossRef] [PubMed]
  23. Fang, W. Study on the Chemical Stability of Water Quality in Urban Water Supply Systems and Its Control Methods. Master’s Thesis, Hunan University, Changsha, China, 2007. [Google Scholar]
  24. Lytle, D.A.; Snoeyink, V.L. The effect of pH and dissolved inorganic carbon on the properties of iron colloldal suspensions. Water Supply Res. Technol. 2003, 52, 165–181.1. [Google Scholar] [CrossRef]
  25. Lytle, D.A.; Sarin, P.; Snoeyink, V.L. The effect of chloride and orthophosphate on the release of iron from a cast iron pipe section. J. Water Supply: Res. Technol. 2005, 54, 267–281. [Google Scholar] [CrossRef]
  26. Darre, C.N.; Toor, S.G. Desalination of Water: A Review. Curr. Pollut. Rep. 2018, 4, 104–111. [Google Scholar] [CrossRef]
  27. Cohen, Y.; Semiat, R.; Rahardianto, A. A perspective on reverse osmosis water desalination: Quest for sustainability. AIChE J. 2017, 63, 1771–1784. [Google Scholar] [CrossRef]
  28. Lytle, D.A.; Snoeyink, V.L. Effect of orthophosphates and polyphosphates on the properties of iron particles and sus-pensions. Am. Water Work. Assoc. 2002, 94, 87–99. [Google Scholar] [CrossRef]
Figure 1. The schematic diagram of dynamic tubular reactor. Notes: (1) water inlet; (2) outlet; (3) plexiglass (PMMA); (4) bolt hole; (5) bolt; (6) pipe section; (7) rubber gasket; (8) bracing structure of PMMA.
Water 17 02474 g001
Figure 2. Microscopic morphology of inner layers of pipe scale in DN100 steel pipe before and after the experiment. (a) Steel pipe inner layer (before). (b) Steel pipe inner layer (after).
Water 17 02474 g002
Figure 3. Microscopic morphology of inner layers of pipe scale in DN100 cast iron pipe before and after the experiment. (a) Cast iron inner layer (before). (b) Cast iron inner layer (after).
Water 17 02474 g003
Figure 4. X-ray diffraction map of the steel pipe and cast iron pipe scale before the operation of the reaction device.
Water 17 02474 g004
Figure 5. X-ray diffraction map of the steel pipe and cast iron pipe scale after the operation of the reaction device.
Water 17 02474 g005
Figure 6. Modulating the effect of pH on iron release.
Water 17 02474 g006
Figure 7. Regulates the effect of alkalinity on iron release.
Water 17 02474 g007
Figure 8. Regulates the effect of phosphate on iron release.
Water 17 02474 g008
Figure 9. The interaction response surface and contour map of the steel pipe (1,2) and the cast iron pipe (3,4) between pH value and alkalinity concentration when phosphate is at 0.3 mg/L.
Water 17 02474 g009
Figure 10. The interaction response surface and contour map of the steel pipe (1,2) and the cast iron pipe (3,4) between pH value and phosphate concentration when alkalinity is at 150 mg/L.
Water 17 02474 g010
Figure 11. The interaction response surface and contour map of the steel pipe (1,2) and the cast iron pipe (3,4) between alkalinity and phosphate concentration when pH = 7.5.
Water 17 02474 g011
Table 1. Design values of pH, alkalinity, and phosphate for each group of experiments.
GrouppHAlkalinity (CaCO3 mg/L)Phosphate (P mg/L)
17.51500.3
27.52500.5
37.51500.3
47.51500.3
58.51500.1
68.5500.3
77.52500.1
87.5500.5
96.51500.5
106.5500.3
118.51500.5
126.52500.3
137.51500.3
146.51500.1
157.5500.1
168.52500.3
177.51500.3
Table 2. Water quality of DW.
ParameterContent
pH7.0
Iron content<0.03
Na+ (mg/L)80
Cl50
SO42−10
Alkalinity (CaCO3 mg/L)5
Hardness (CaCO3 mg/L)5
Turbidity<0.1
Table 3. Elemental composition of each layer of scale on steel and cast iron pipe before and after the experiment (%).
Corrosion LayerStateFeOSiCaCrMgMnAlSClZnNa
Steel pipe inner layerbefore56.0420.310.960.320.110.330.040.05
after97.31.650.190.380.330.19
Steel pipe outer layerbefore54.4400.961.960.360.550.360.050.1
after92.54.520.770.20.351.210.360.1
Cast iron pipe inner layerbefore89.63.832.170.260.321.072.840.22
after90.13.521.430.20.420.922.840.28
Cast iron pipe outer layerbefore42.238.41.610.11.340.229.2910.30.061.04
after52.130.61.310.11.30.449.290.440.10.93
Table 4. Variance analysis of steel pipe.
ProjectQuadratic SumVarianceMean SquareF-Numberp ValueSignificance
model1.0990.129.660.0034notable
A0.007750110.010.620.4578quiet
B0.17510.1713.930.0073notable
C0.01210.010.970.3577quiet
AB0.02310.021.850.2157quiet
AC0.05310.054.250.0782notable
BC0.30010.3023.920.0018notable
A20.24310.2419.380.0031notable
B20.10710.118.520.0224notable
C20.11710.129.310.0185notable
residual0.08870.01
pure error04
total departure1.17916
Table 5. Variance analysis of cast iron pipe.
ProjectQuadratic SumVarianceMean SquareF-Numberp ValueSignificance
model1.1890.1337.97<0.0001notable
A0.00064810.000.190.6776quiet
B0.24610.2571.39<0.0001notable
C0.03010.038.810.0208notable
AB0.01410.013.940.0876quiet
AC0.03410.039.880.0163notable
BC0.28210.2881.81<0.0001notable
A20.24010.2469.49<0.0001notable
B20.07610.0822.180.0022notable
C20.19910.2057.660.0001notable
residual0.02470.00
pure error04
total departure1.20216
Disclaimer/Publisher’s Note: The statements, opinions and data contained in all publications are solely those of the individual author(s) and contributor(s) and not of MDPI and/or the editor(s). MDPI and/or the editor(s) disclaim responsibility for any injury to people or property resulting from any ideas, methods, instructions or products referred to in the content.