Article

Numerical Study of Downstream Sediment Scouring of the Slotted Roller Bucket System

by
Payam Heidarian
1,*,
Seyed Ali Akbar Salehi Neyshabouri
2,
Alireza Khoshkonesh
3,
Rouzbeh Nazari
4,
Saeid Okhravi
5 and
Silvia Di Francesco
6,*
1
Department of Civil, Environmental, Architectural Engineering and Mathematics, University of Brescia, 25123 Brescia, Italy
2
Faculty of Civil and Environmental Engineering, Hydraulic Structures Department, Tarbiat Modares University, Tehran P.O. Box 14115-111, Iran
3
Department of Civil and Architectural Engineering, Sultan Qaboos University, P.C.123, AL Khoudh Street, Muscat P.O. Box 33, Oman
4
Department of Civil Engineering, The University of Memphis, Memphis, TN 38125, USA
5
Institute of Hydrology of the Slovak Academy of Sciences, Dúbravská Cesta 9, 84104 Bratislava, Slovakia
6
Department of Engineering, University of Cusano, 00166 Roma, Italy
*
Authors to whom correspondence should be addressed.
Water 2025, 17(16), 2471; https://doi.org/10.3390/w17162471
Submission received: 16 July 2025 / Revised: 9 August 2025 / Accepted: 16 August 2025 / Published: 20 August 2025
(This article belongs to the Section Water Erosion and Sediment Transport)

Abstract

Slotted roller buckets are energy dissipator structures designed to reduce the destructive power of high-velocity water flows in spillways, protecting downstream environments. This study aimed to estimate the critical role of slotted roller bucket design in downstream scour mitigation and hydraulic energy dissipation. The three-dimensional Navier–Stokes (N-St) equations were solved to simulate the jet flow over the roller bucket using CFD software. The free surface volume tracking using the volume of fluid (VOF) and non-equilibrium sediment transport equations was coupled with N-St to model the local scour downstream of the roller bucket system. Subsequently, the impact of bucket tooth lip angles, tailwater depth, and bucket radius on downstream scour were examined in a numerical 3D framework. The results showed that the 45- to 55-degree lip angle configuration significantly reduced the maximum scour depth by approximately 36%. Furthermore, the study quantified the effects of tailwater depth and bucket radius on scour dimensions and flow patterns. The optimal tailwater depth reduced scour depth by approximately 20% compared with the worst case, while variations in bucket radius led to more than a 50% difference in scour depth. We identified specific ranges for these parameters that further minimized erosion potential. The research also underscored the influence of transverse mixing on surging depth, revealing a crucial mechanism for energy dissipation. These findings contributed to a deeper understanding of the complex interplay between design parameters and scour. It offered practical insights for optimizing and operating hydraulic structures sustainably and understanding the scouring processes downstream of the dams.

1. Introduction

Energy dissipators are vital for attenuating the hydraulic energy of flows over spillways. They safeguard against downstream erosion, avert structural damage, and mitigate the risk of dam failures [1]. Among these, the slotted roller bucket is crucial to water flow regulation. It efficiently manages hydraulic energy, reduces erosional impacts downstream, and adjusts the water flow profile to control erosion and protect downstream structures. Roller buckets are frequently utilized at hydropower facility discharge points for effective energy dissipation, with slotted roller buckets demonstrating superior performance compared with their solid counterparts [2,3]. The choice of roller bucket type is determined by factors including tailwater elevation, flow regime, and local scour downstream of the dam. Slotted roller buckets are particularly advantageous when minimizing scour in confined areas with a stable substrate [4].
In recent years, extensive research has been conducted on various aspects of slotted roller buckets. Fuladipanah et al. (2023) utilized data-driven models to predict scour depth downstream of a slotted bucket [5]. The influence of different slot shapes and configurations on downstream scour dimensions was investigated by Eskandari et al. (2020) [6]. Ramarao et al. (2019) [7] and Ramarao and Kulhare (2022) [8] developed empirical relationships for jump buckets, emphasizing the importance of tailwater level, lip submergence, and drag in the formation of hydraulic jumps downstream and examined the impact of inadequate tailwater on the performance of slotted roller buckets in dams.
Comparative experimental studies on energy dissipation have highlighted the economic advantages of roller buckets over stilling basins, particularly in Ogee spillways [9,10,11,12]. On the other hand, computational fluid dynamics (CFD) simulations have been employed to model free surface evolution, kinetic energy dissipation, flow regimes, and scour downstream of energy dissipators [13,14,15,16,17,18,19,20]. Despite these advancements, several areas remain that warrant further investigation.
Building upon the existing body of research, this study aims to explore the flow patterns and scouring effects resulting from variations in the lip angle of bucket teeth. This area has not been extensively investigated. Previous studies have predominantly focused on conventional designs with fixed lip angles, leaving a gap in understanding the impacts of varying lip angles, specifically on the downstream scour. Despite advancements in the field, there are very few 3D numerical studies on generating and evolving circular flows and scouring in roller buckets. This gap highlights the need for further investigation, particularly into the interaction between flow dynamics and scouring mechanisms.
To address these gaps, the present study will numerically examine the effects of altering the lip angle of the teeth in a single bucket, introducing a novel configuration of teeth arrangement. In addition to investigating lip angle variation, we will evaluate the influence of tailwater depth, considered an initial condition, and bucket radius on downstream scour within a slotted roller bucket system. Using a CFD package, this study also seeks to establish a relationship between the dissipation rate of turbulent kinetic energy, as explored by Heidarian et al. (2022) [13], and scour dimensions. Ultimately, the research aims to optimize the design and performance of slotted roller buckets by introducing an innovative design for slotted bucket teeth, minimizing downstream scour.

2. Materials and Methods

This section outlines the modeling details employed in this study, focusing on the numerical models used to simulate flow dynamics and sediment transport. The governing equations for fluid flow and sediment transport are presented, followed by a detailed description of the sediment scour model and bed-load transport mechanisms. Additionally, the geometric configuration, initial, and boundary conditions are explained, along with the calibration and validation processes used to ensure the accuracy of the simulations.

2.1. Governing Equations

The continuity and momentum equations represent the fundamental principles of mass and momentum conservation, which are used to model phenomena in fluid dynamics. The continuity equation for incompressible flows ensures that mass is conserved throughout the domain, expressed as Equation (1):
. u f = 0
where u f represents the fluid velocity vector field. The momentum equation is derived from Newton’s second law and is often called the Navier–Stokes equation, which governs momentum transport. It can be written as Equation (2):
u f t + u f . u f = 1 ρ f p + ν 2 u f + F
where p is the pressure, ν is the kinematic viscosity, ρ f   is the fluid density, and F represents external forces such as gravity. In turbulent flows, where chaotic and random fluctuations dominate, direct simulation of turbulence is computationally prohibitive for most practical engineering problems. The Reynolds-averaged Navier–Stokes (RANS) equations are often employed to model turbulence by averaging the equations over time and introducing the concept of Reynolds stresses. The turbulent regime is characterized by a range of lengths and time scales, typically described by parameters such as the Reynolds number R e = U L / ν , where U is the characteristic velocity and L is the characteristic length scale.
Due to computational efficiency considerations, the current study uses RANS over LES (large eddy simulation) or DNS (direct numerical simulation). While DNS resolves all scales of turbulence, making it highly accurate, it is computationally impractical, especially for high Reynolds number flows and complex geometries. Similarly, LES provides a compromise by resolving larger turbulent scales while modeling the smaller ones, but it remains computationally expensive for complex engineering applications. On the other hand, RANS provides a practical balance between accuracy and computational feasibility by averaging the equations and solving the mean flow, making it suitable for steady and unsteady flow simulations in real-world engineering scenarios.
The RANS models employed in this study are based on the standard k-ε, RNG k-ε, and k-ω models. These models provide closure to the RANS equations by introducing additional transport equations for the turbulent kinetic energy (k) and either the turbulent dissipation rate (ε) or the specific dissipation rate (ω). These models are well documented in the literature (see [21,22,23]) and have proven effective for engineering flows, including boundary layer separation and recirculating flows.
The volume of fluid (VOF) method is employed to track the interface between different phases, mainly when dealing with free surface flows or multi-phase problems [24,25]. In this method, a scalar function, α, is introduced to represent the volume fraction of one fluid in each computational cell. The transport of this scalar function is governed by Equation (3):
α t + . α u f = 0
The VOF method is well suited for capturing sharp interfaces between immiscible fluids and ensures mass conservation. Its key advantage is its ability to handle complex interface topologies with minimal diffusion, making it ideal for wave dynamics, droplet formation, and surface tension-dominated flows.

2.2. Sediment Scour and Bed-Material Transport Model

The sediment scour model estimates sediment motion by predicting erosion, advection, and deposition processes. In this model, sediment exists in two states: suspended (within the water column) and packed (as part of the bed). Suspended sediment typically has a low concentration and moves with the fluid flow. Based on the study of Mastbergen & Van Den Berg, 2003 [26], the model initiates the computation of the critical Shields parameter by first calculating the dimensionless parameter d , i   as shown in Equation (4):
d , i = d i ρ f ρ i ρ f g μ 2 1 3
where ρ i   represents the density of sediment species, d i is the diameter of the sediment, μ denotes the fluid’s dynamic viscosity, and ‖g‖ signifies the magnitude of the acceleration due to gravity. Based on d , i ,   the critical Shields parameter ( θ c r , i ) in Equation (5) is computed using the Soulsby–Whitehouse equation [27]:
θ c r , i = 0.3 1 + 1.2 d , i + 0.055 1 e x p 0.02 d , i
The local Shields parameter is computed based on the local bed shear stress, τ, represented in Equation (6):
θ i = τ g d i ρ i ρ f
The entrainment lift velocity of sediment is then computed as Mastbergen and Van Den Berg (2003) described [26]:
u lift , i = α i n s d 0.3 θ i θ c r , i 1.5 g d i ρ i ρ f ρ f
In Equation (7), α i represents the entrainment parameter, with a recommended value of 0.018 according to the study of Mastbergen & Van Den Berg, 2003 [26]. The vector n s   denotes the outward-pointing normal to the packed bed interface. u lift   , i   is then utilized to determine the amount of packed sediment that transitions into suspension, effectively serving as a mass source of suspended sediment at the packed bed interface. Subsequently, the suspended sediment is transported with the fluid flow.
Deposition is when sediment grains either settle out of suspension onto the packed bed due to their weight or come to rest during bed-load transport. This process contributes to the buildup and modification of the sediment bed morphology over time. The settling velocity equation Soulsby proposed is shown in Equation (8) [27]:
u settling , i = ν d i 10.36 2 + 1.049 d 3 0.5 10.36
Bed-load transport refers to the mode of sediment transport characterized by rolling or bouncing over the surface of the packed bed of sediment. In this model, the approach for bed-load transport is based on the formulation proposed by Meyer, Peter, and Müller represented by Equation (9) [28]:
Φ i = β i θ i θ c r , i 1.5 c b , i
β i   is typically set to 8.0, as Van Rijn (1984) suggested, and c b , i   represents the volume fraction [29].

2.3. Geometry, Initial and Boundary Conditions

The initial and boundary conditions for this analysis were adapted from the numerical model by Pétursson [30], with modifications to accommodate multiple tooth configurations to study their effects on flow dynamics [30]. The overflow, tooth configuration, crown, and bed were designed and implemented in the CFD simulations based on Pétursson’s framework (Figure 1). The bucket models in this study were categorized into three groups, as detailed in Table 1. The first group (P) comprises models featuring buckets with two teeth and varied lip angles. The second group (T) includes four models with buckets containing two teeth fixed at a 45-degree angle but with different tailwater depths at the downstream of the bucket. The third group (R) comprises three models with varying bucket radii. Except for the models in the second group, all models have a tailwater depth of 14 m. Discharge rates and boundary conditions specific to each model are provided in Table 2 and Table 3, respectively.
A single mesh block was used for the simulations to encompass all geometric components, resulting in approximately 1.5 × 10⁶ mesh cells after a sensitivity analysis. The Courant governed time step discretization–Friedrichs–Lewy (CFL) stability and convergence criteria, ensuring that the relationship between time step and spatial interval satisfied the condition u t / x < 1 [31,32]. Convergence was considered achieved when the residual values of iterations fell below 0.001 (ε ≤ 0.001), adhering to the established criteria [24].

2.4. Calibration and Validation

During the study, the numerical simulations were performed using the FLOW-3D v12.0 computational fluid dynamics (CFD) software. This software utilizes the volume of fluid (VOF) method for free surface tracking and solves the Reynolds-averaged Navier–Stokes (RANS) equations [33].
Given that the study encompasses two key aspects, dynamic performance and scouring, the validation process was conducted in two distinct phases.
Under sediment-free conditions, the initial model validation phase assessed its hydraulic performance using experimental and numerical data from Karr [34] and Pétursson [30]. This model evaluation involved a detailed analysis of critical variables, including flow rate, chute inclination, invert elevation, and total hydraulic head, as well as tailwater depth, wave surge height, and flow depth over the bucket. The experimental setup featured an inlet gate, a chute with a 1:1 inclination, a solid bucket with a radius of 0.37 m, and a rectangular downstream channel.
The experimental setup featured a model measuring 5 m in length and 0.3 m in width, with an overflow height of 1.35 m and a bucket radius of 1.12 m. The initial conditions for validation with Karr’s experiments included a total head of 225.5 cm, a tailwater depth of 91.4 cm, and an entrance discharge of 36.2 L/s. Table 4 outlines the boundary conditions employed in the simulations. For the sensitivity analysis, mesh densities were tested with cell counts of 1 × 10⁵, 3 × 10⁵, 6 × 10⁵, and 10 × 105 cells, as shown in Table 5.
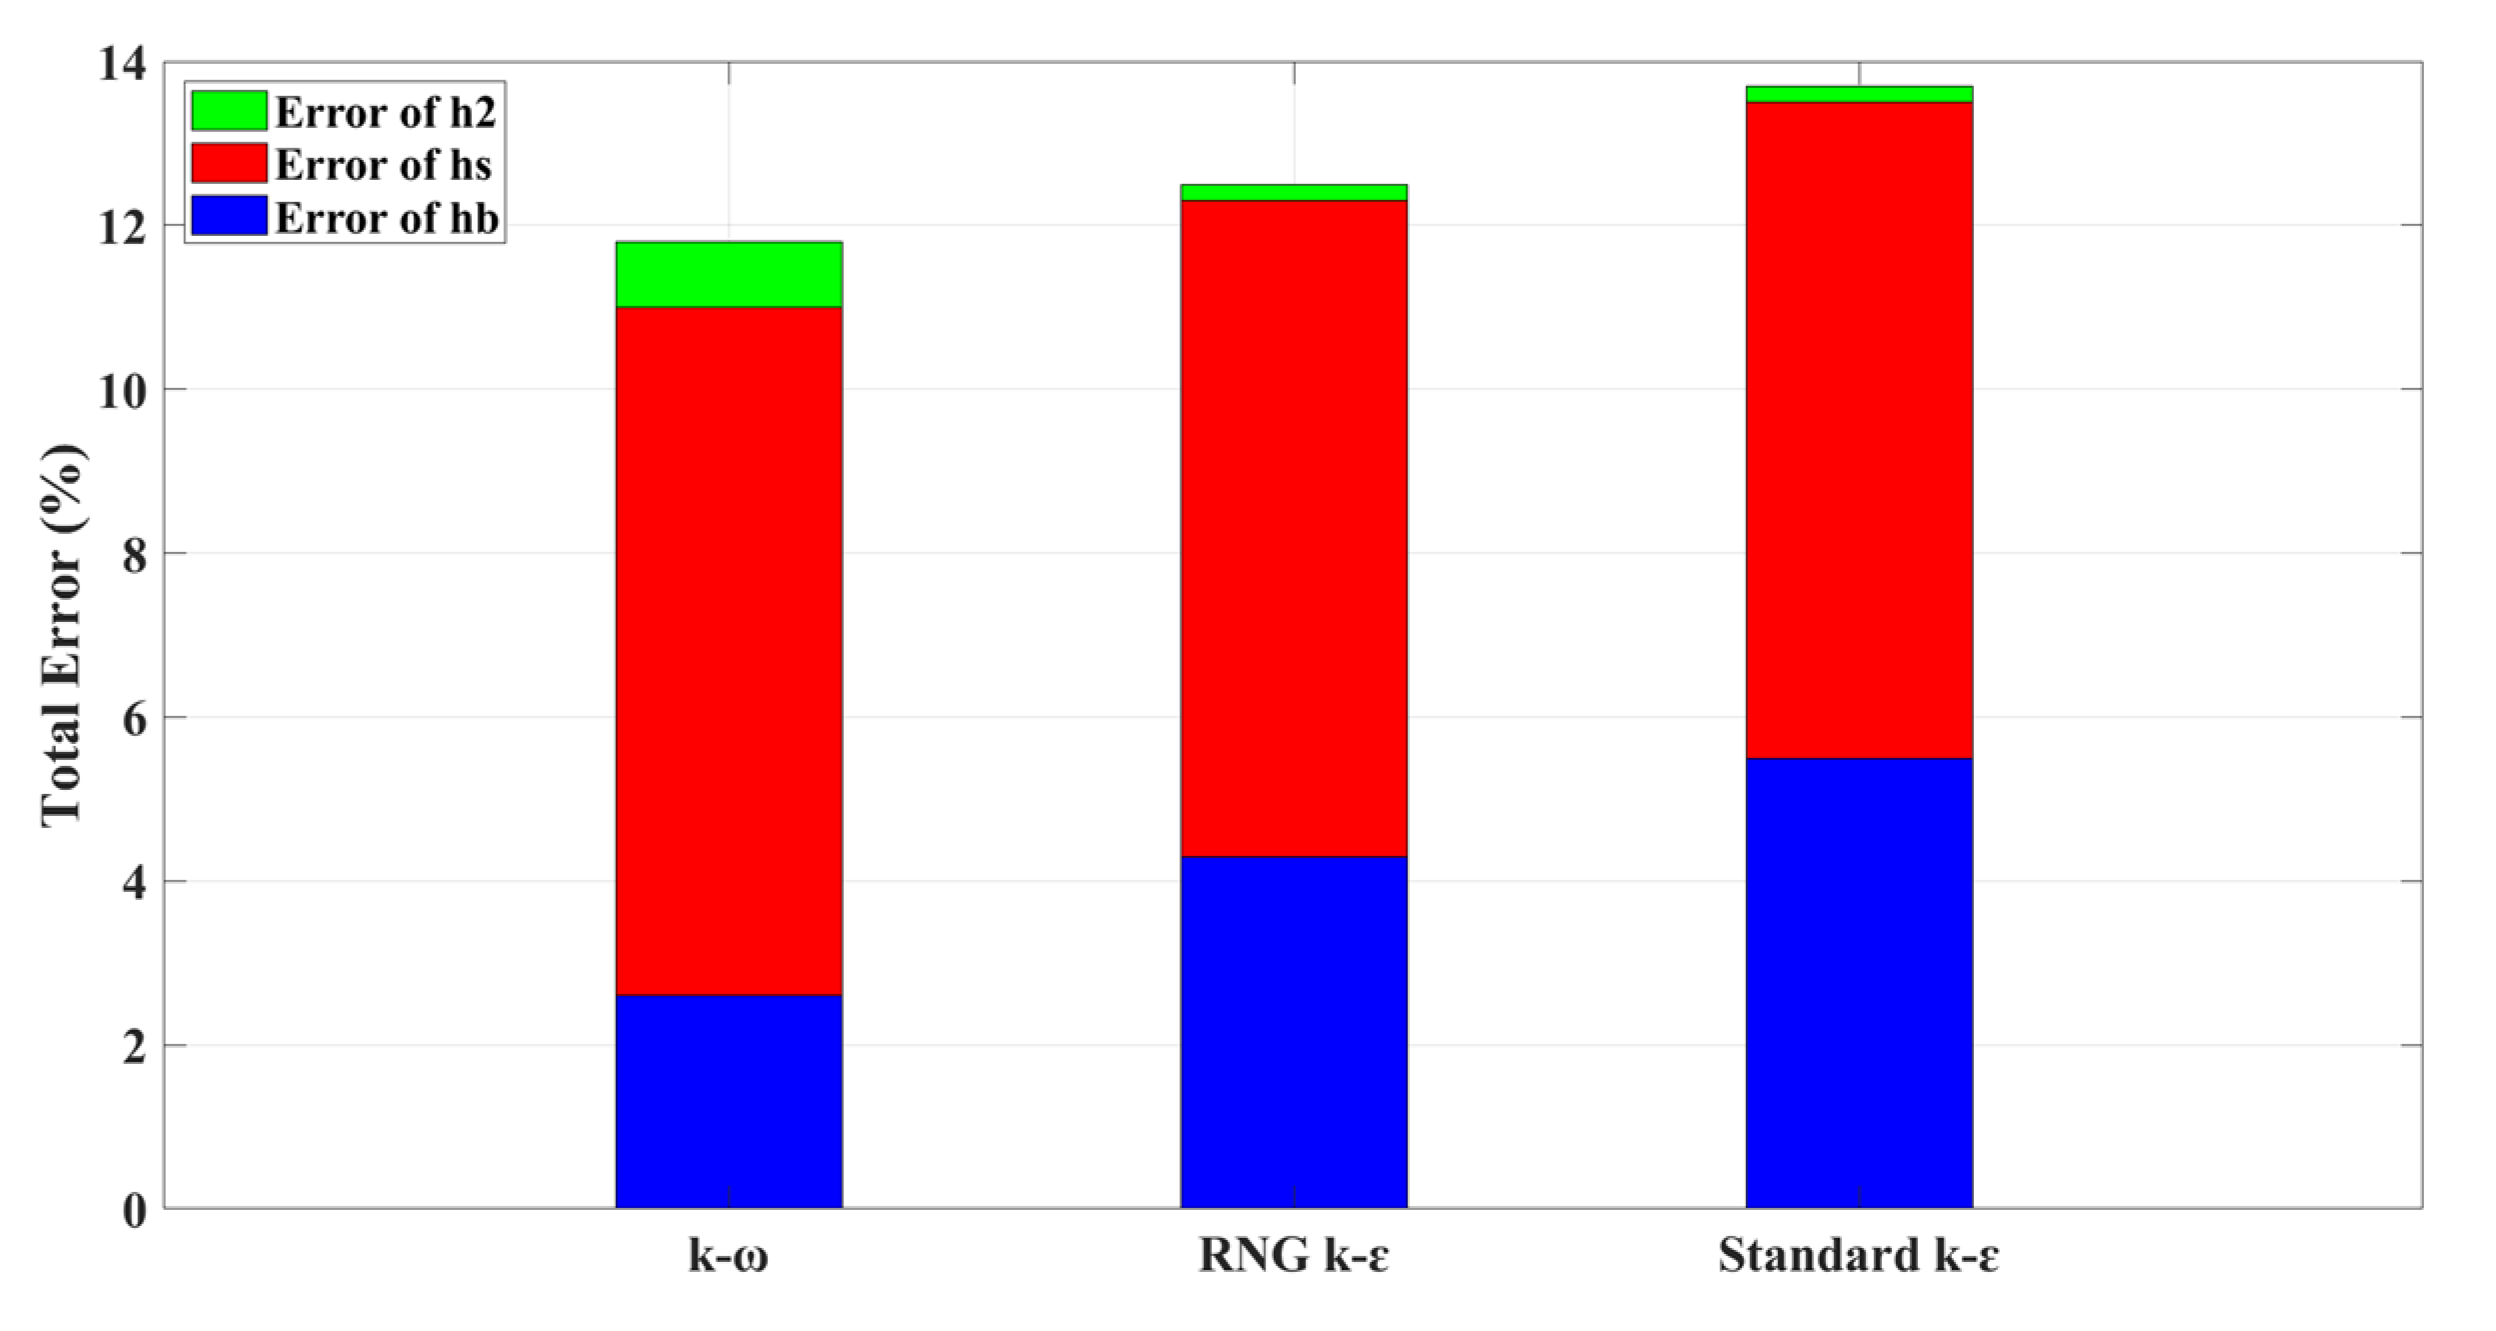
To ensure the independence of the simulation results from the mesh size, a grid independence test was conducted using four different levels of mesh resolution. The evaluated parameters included the water depth on the bucket (hb), the depth of the hydraulic surging downstream of the bucket (hs), and the tailwater depth farther downstream of the bucket, where the flow has reached equilibrium (h2). The numerical results were compared with the experimental data reported by Karr (1956) [34]. The percentage error for each parameter, as well as the total error, is presented in Table 5.
As shown in the table, increasing the number of cells leads to a consistent reduction in simulation errors. However, the improvement in accuracy becomes marginal beyond 600,000 cells. For instance, the difference in total error between the 600,000-cell mesh and the 1,000,000-cell mesh is only about 2.3%. On the other hand, increasing mesh resolution results in a significant increase in computation time.
Considering the trade-off between simulation accuracy and computational cost, the mesh with 600,000 cells was selected as the optimal configuration. This mesh provides sufficiently accurate results while maintaining a reasonable simulation runtime.
A comparative analysis between numerical and experimental results indicated that the RNG and k-ω turbulence models demonstrated lower total error values than the standard model. However, it is essential to note that the k-ω model required a substantially longer simulation time than the RNG model. As shown in Figure 2, the RNG model displayed considerable accuracy in replicating free surface flow, a result corroborated by previous studies [35,36,37]. The free surface profile stabilized after 100 s of simulation. Given that surging height is a critical parameter in this study, the RNG k-ε model was selected as the optimal turbulence model due to its lower error in simulating this aspect.
The water surface profile was evaluated at the 100 s mark of the simulation to assess the time required for hydraulic flow stabilization. Stability was confirmed by comparing the water surface profiles at three distinct time intervals: 90, 94, and 100 s (Figure 3). The streamlines and vortex formations observed after equilibrium were consistent and logically sound. A comparison of the final error values indicated that the simulation software provides reliable and accurate results for hydraulic flow modeling.
The validation results in Table 6 indicate that the error values are within acceptable ranges for calculating parameters related to flow depth and water level profiles at various points.
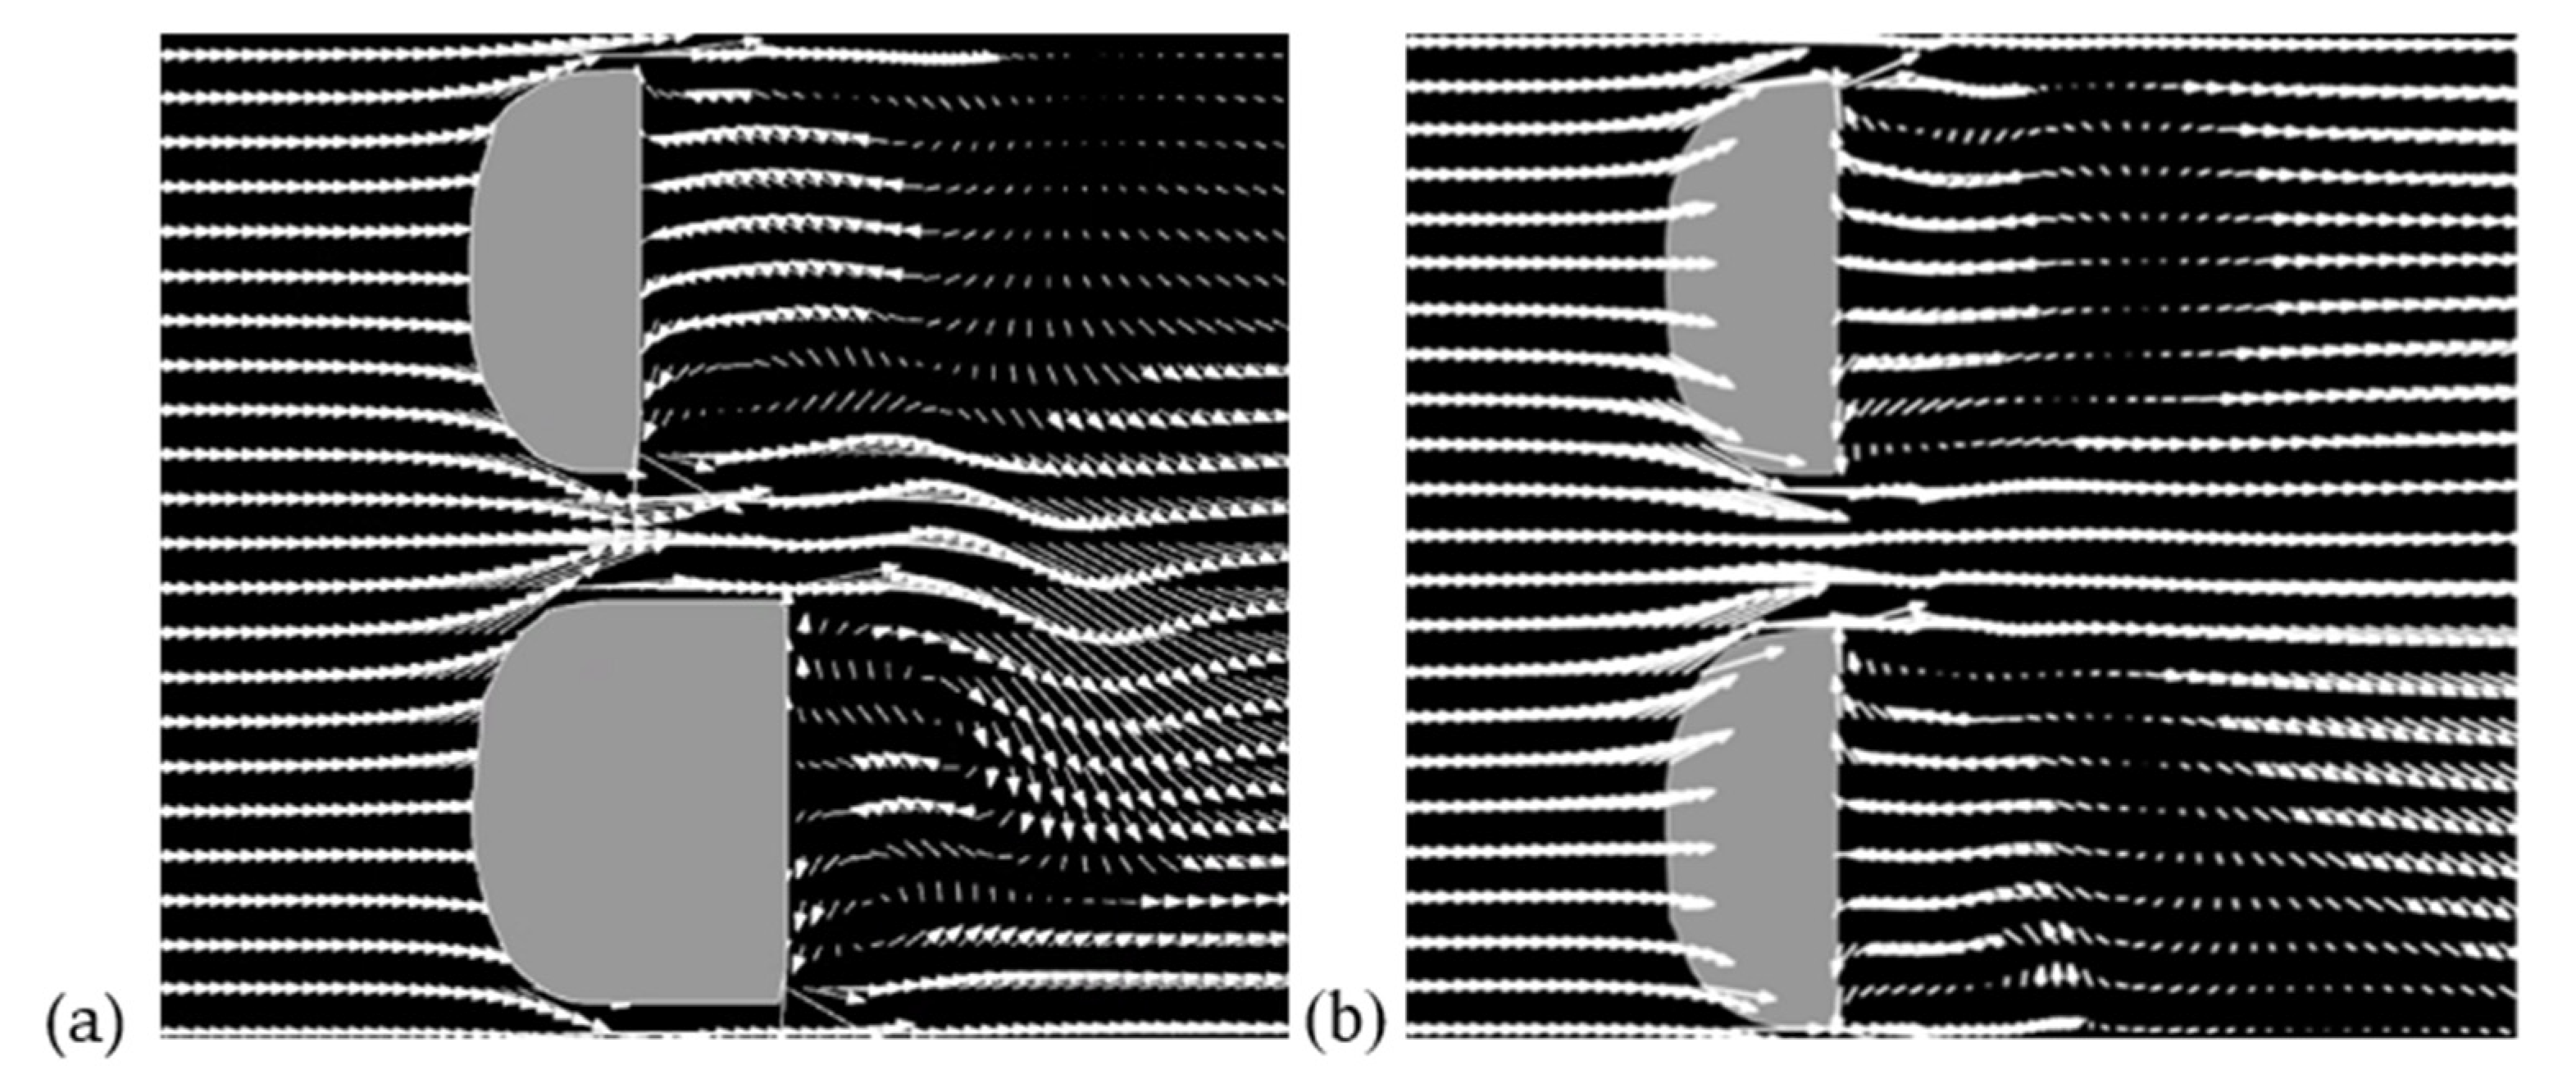
In the second phase of model validation, qualitative comparisons were conducted between the current study and Pétursson’s study, focusing on the hydraulic performance alignment of the models. As shown in Figure 4, key hydraulic performance such as vortex formation, jet flow exiting the bucket, and streamlines in the Flow3D simulation (Figure 4b) closely match the numerical and experimental findings of Pétursson’s study [30] (Figure 4a). The lines shown in Figure 4 represent the flow streamlines, illustrating the direction and pattern of the fluid motion within the computational domain. Additionally, the models effectively capture the flow behavior through the slotted bucket, further validating the flow dynamics described in the study of Bhosekar et al. (2012) [38].
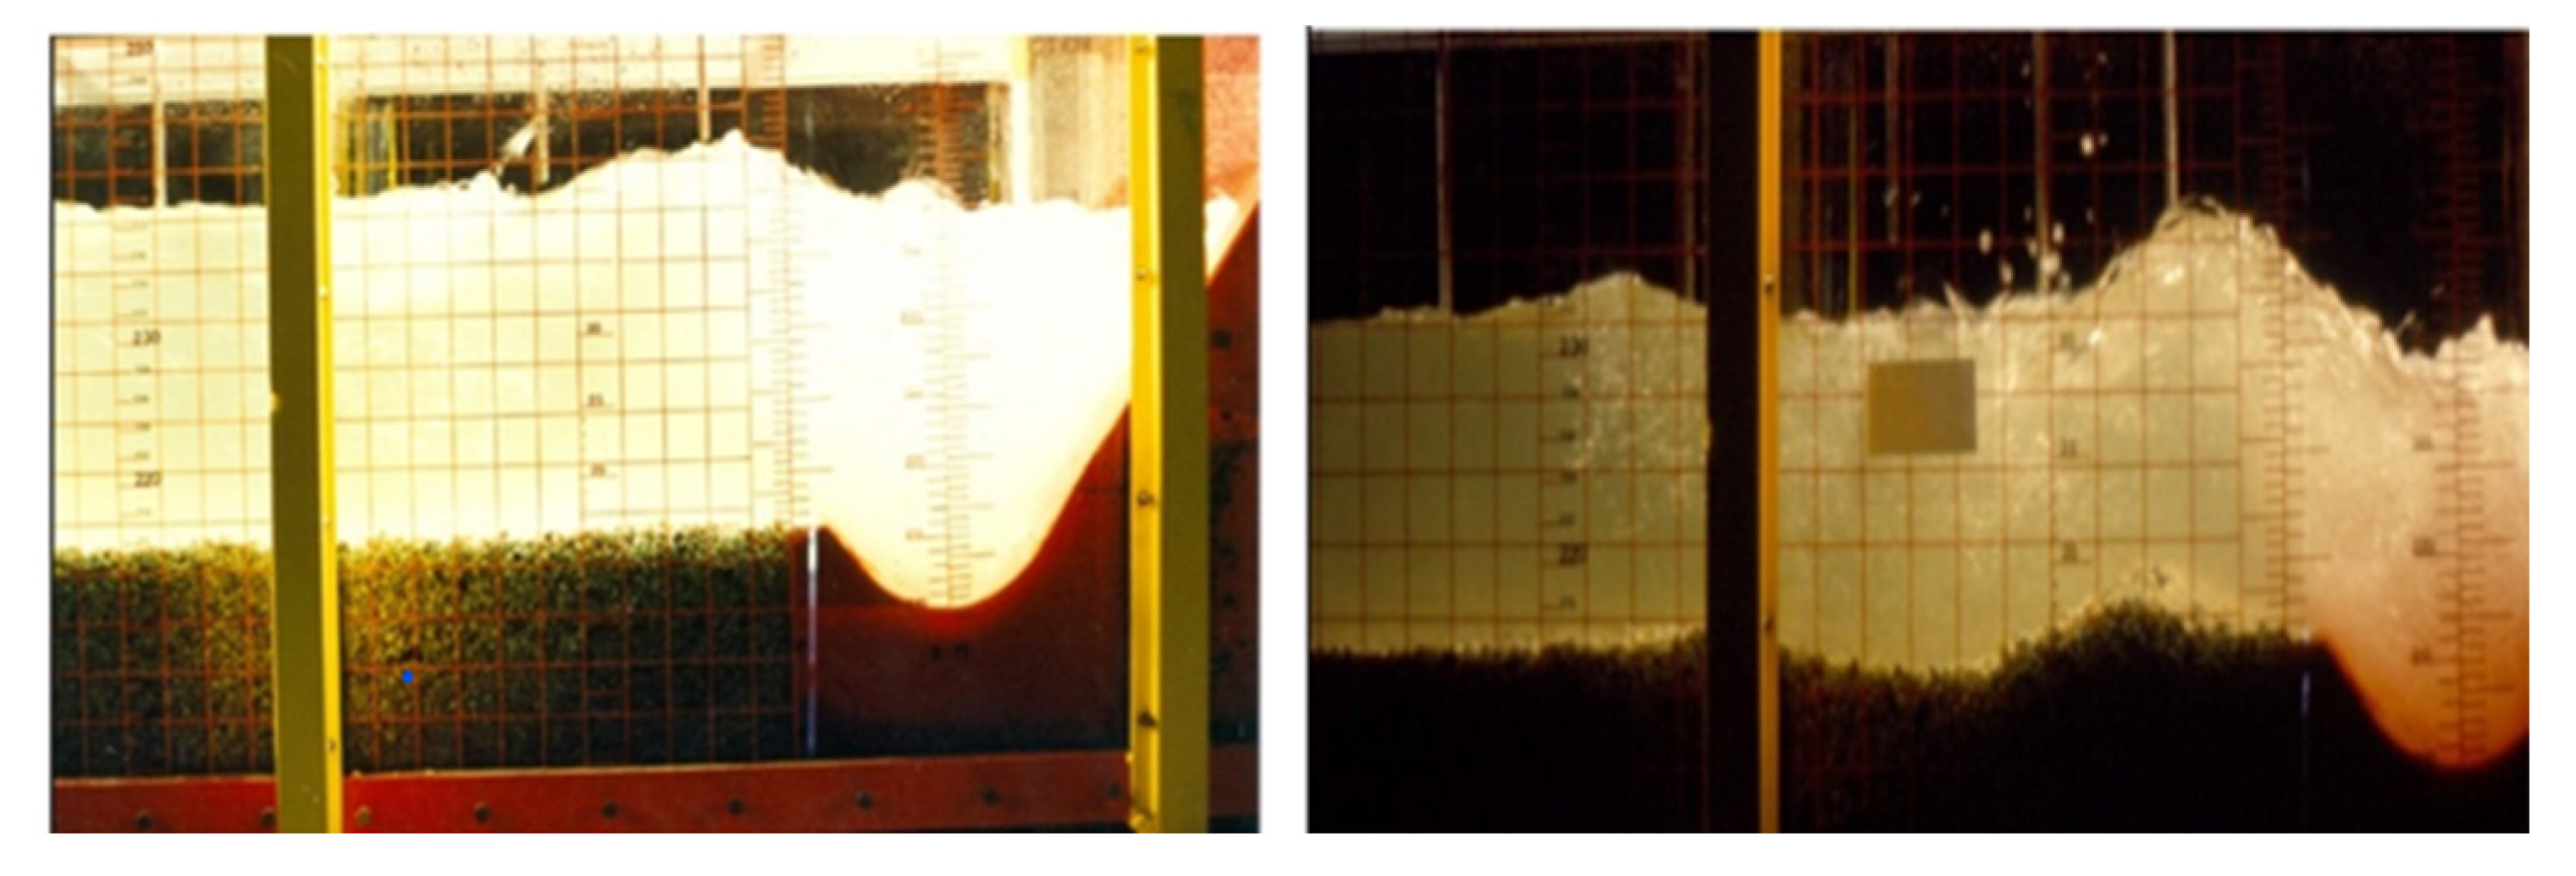
To validate the results of the scour investigation downstream of the slotted bucket using FLOW-3D software, comparisons were made against an experimental model that evaluated scour under similar hydraulic conditions. Data from Saghravani’s study on scour downstream of a solid bucket at Zirdan dam in southern Iran (Sistan and Baluchestan) were employed for this purpose [39]. Figure 5 illustrates the experimental model of the spillway used in their study. The experimental setup featured a flume divided into two sections: the first four meters had a height of approximately 120 cm, while the following eight meters had a height of 75 cm. This design allowed flexibility for testing various models. A width of 75 cm was selected to ensure adequate width and maintain two-dimensional flow on the spillway. This was based on the assumption that the maximum discharge, approximately 130 L/s, would produce a 12 cm water depth over the spillway.
Based on the evaluation of prior models, the RNG turbulence model was identified as the most appropriate for numerical simulations in this context. A computational domain was meshed using a block with four mesh planes, and the flow field within this domain was calculated using boundary conditions derived from the laboratory model, supplemented by essential sensitivity tests.
A non-uniform grid with a suitable aspect ratio was applied across different sections of the solution field to ensure hydraulic accuracy in line with the previous model. Sensitivity analysis of grid size led to the selection of approximately 6.5 × 10⁵ cells. Initial trials involved cell counts of 2 × 10⁵, 3 × 10⁵, 4 × 10⁵, 6.5 × 10⁵, 8 × 10⁵, and 9.5 × 10⁵. It was determined that the error in estimating the boiling depth for the 6.5 × 10⁵ cell model was negligible compared with the 9.5 × 10⁵ cell model, while the latter significantly increased simulation time. Therefore, 6.5 × 10⁵ cells were deemed optimal for the simulation.
The two-dimensional results, shown in Figure 6 (streamlines) and Figure 7 (velocity vectors and bed profile), verify the accuracy of flow mechanisms and confirm the logical functioning of the flow and bucket system.
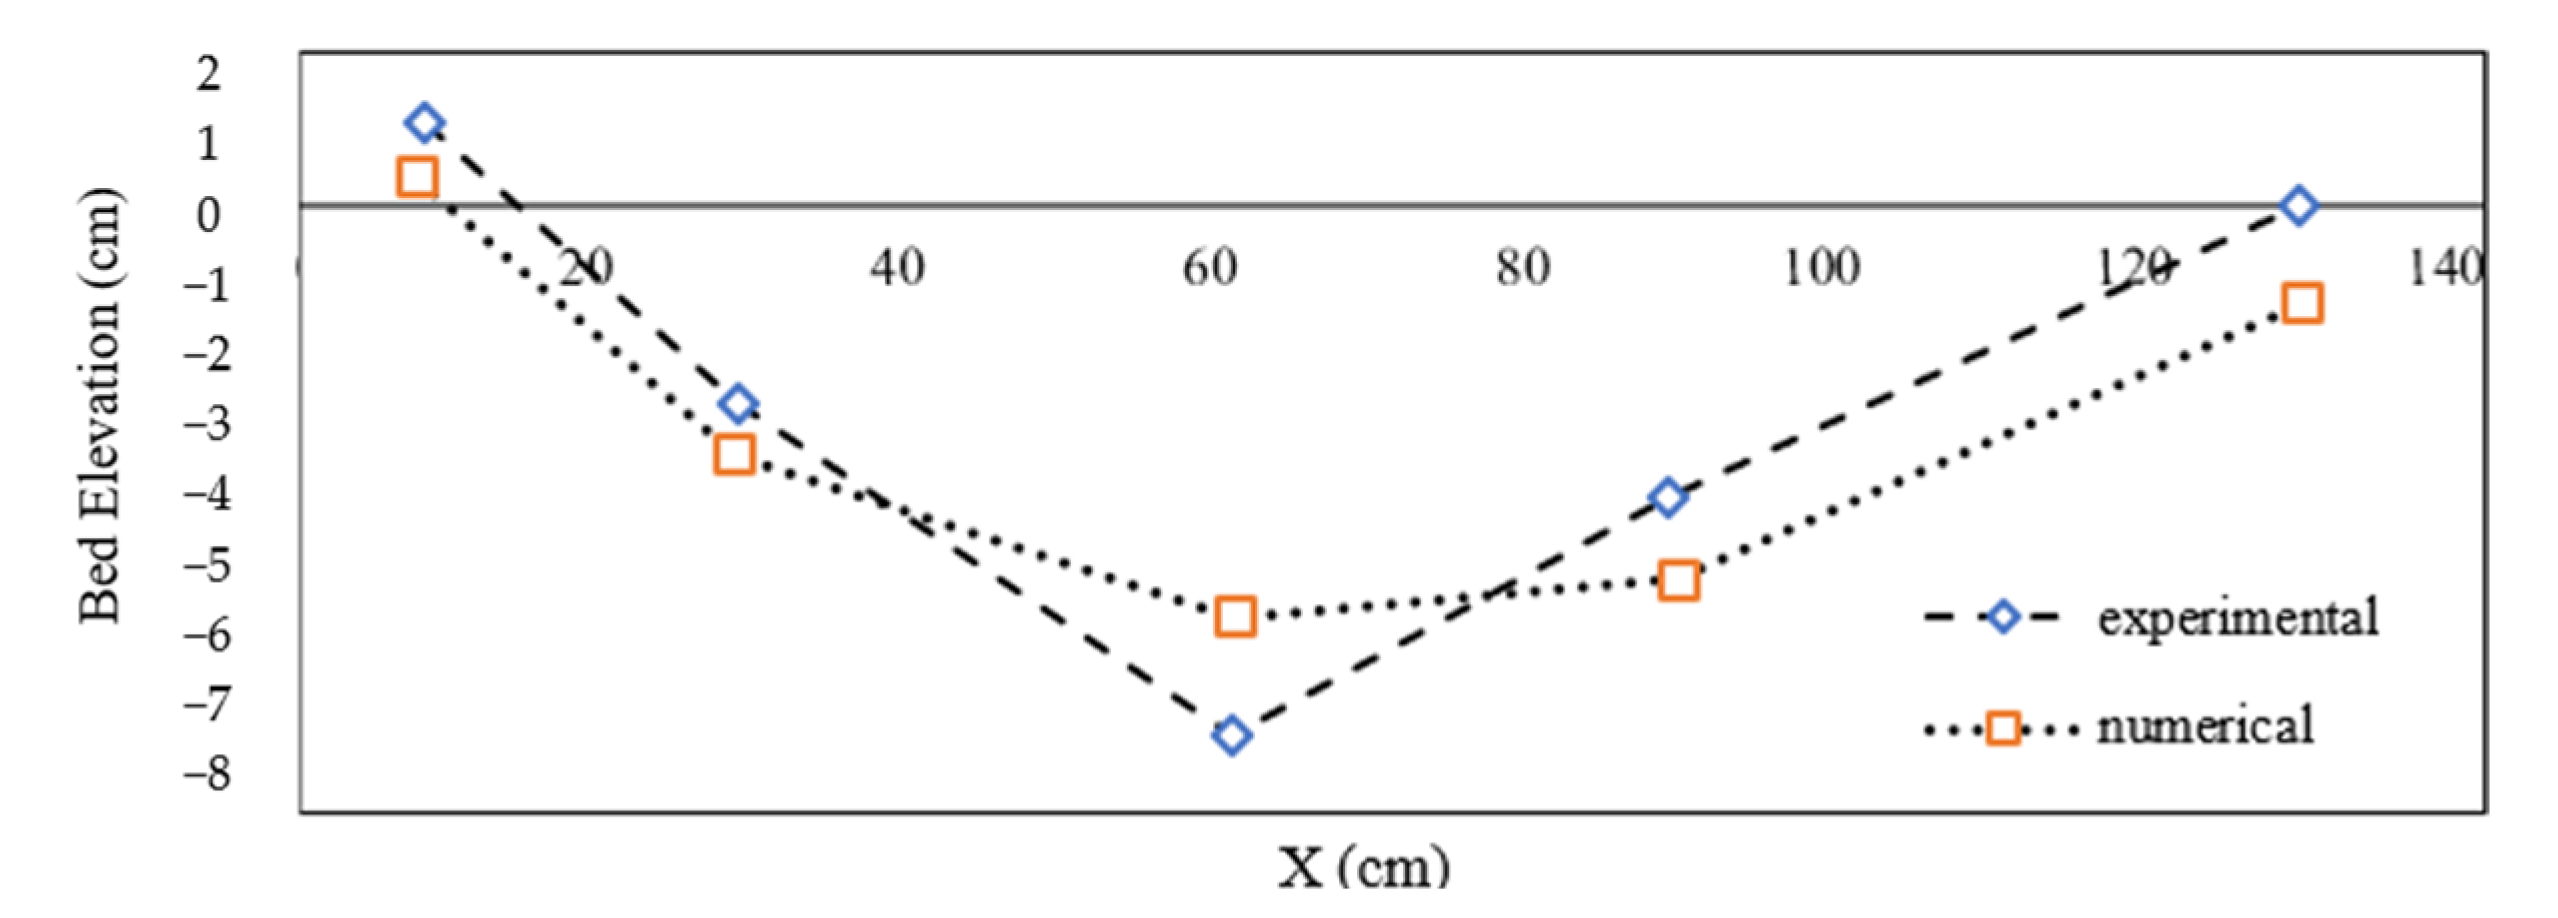
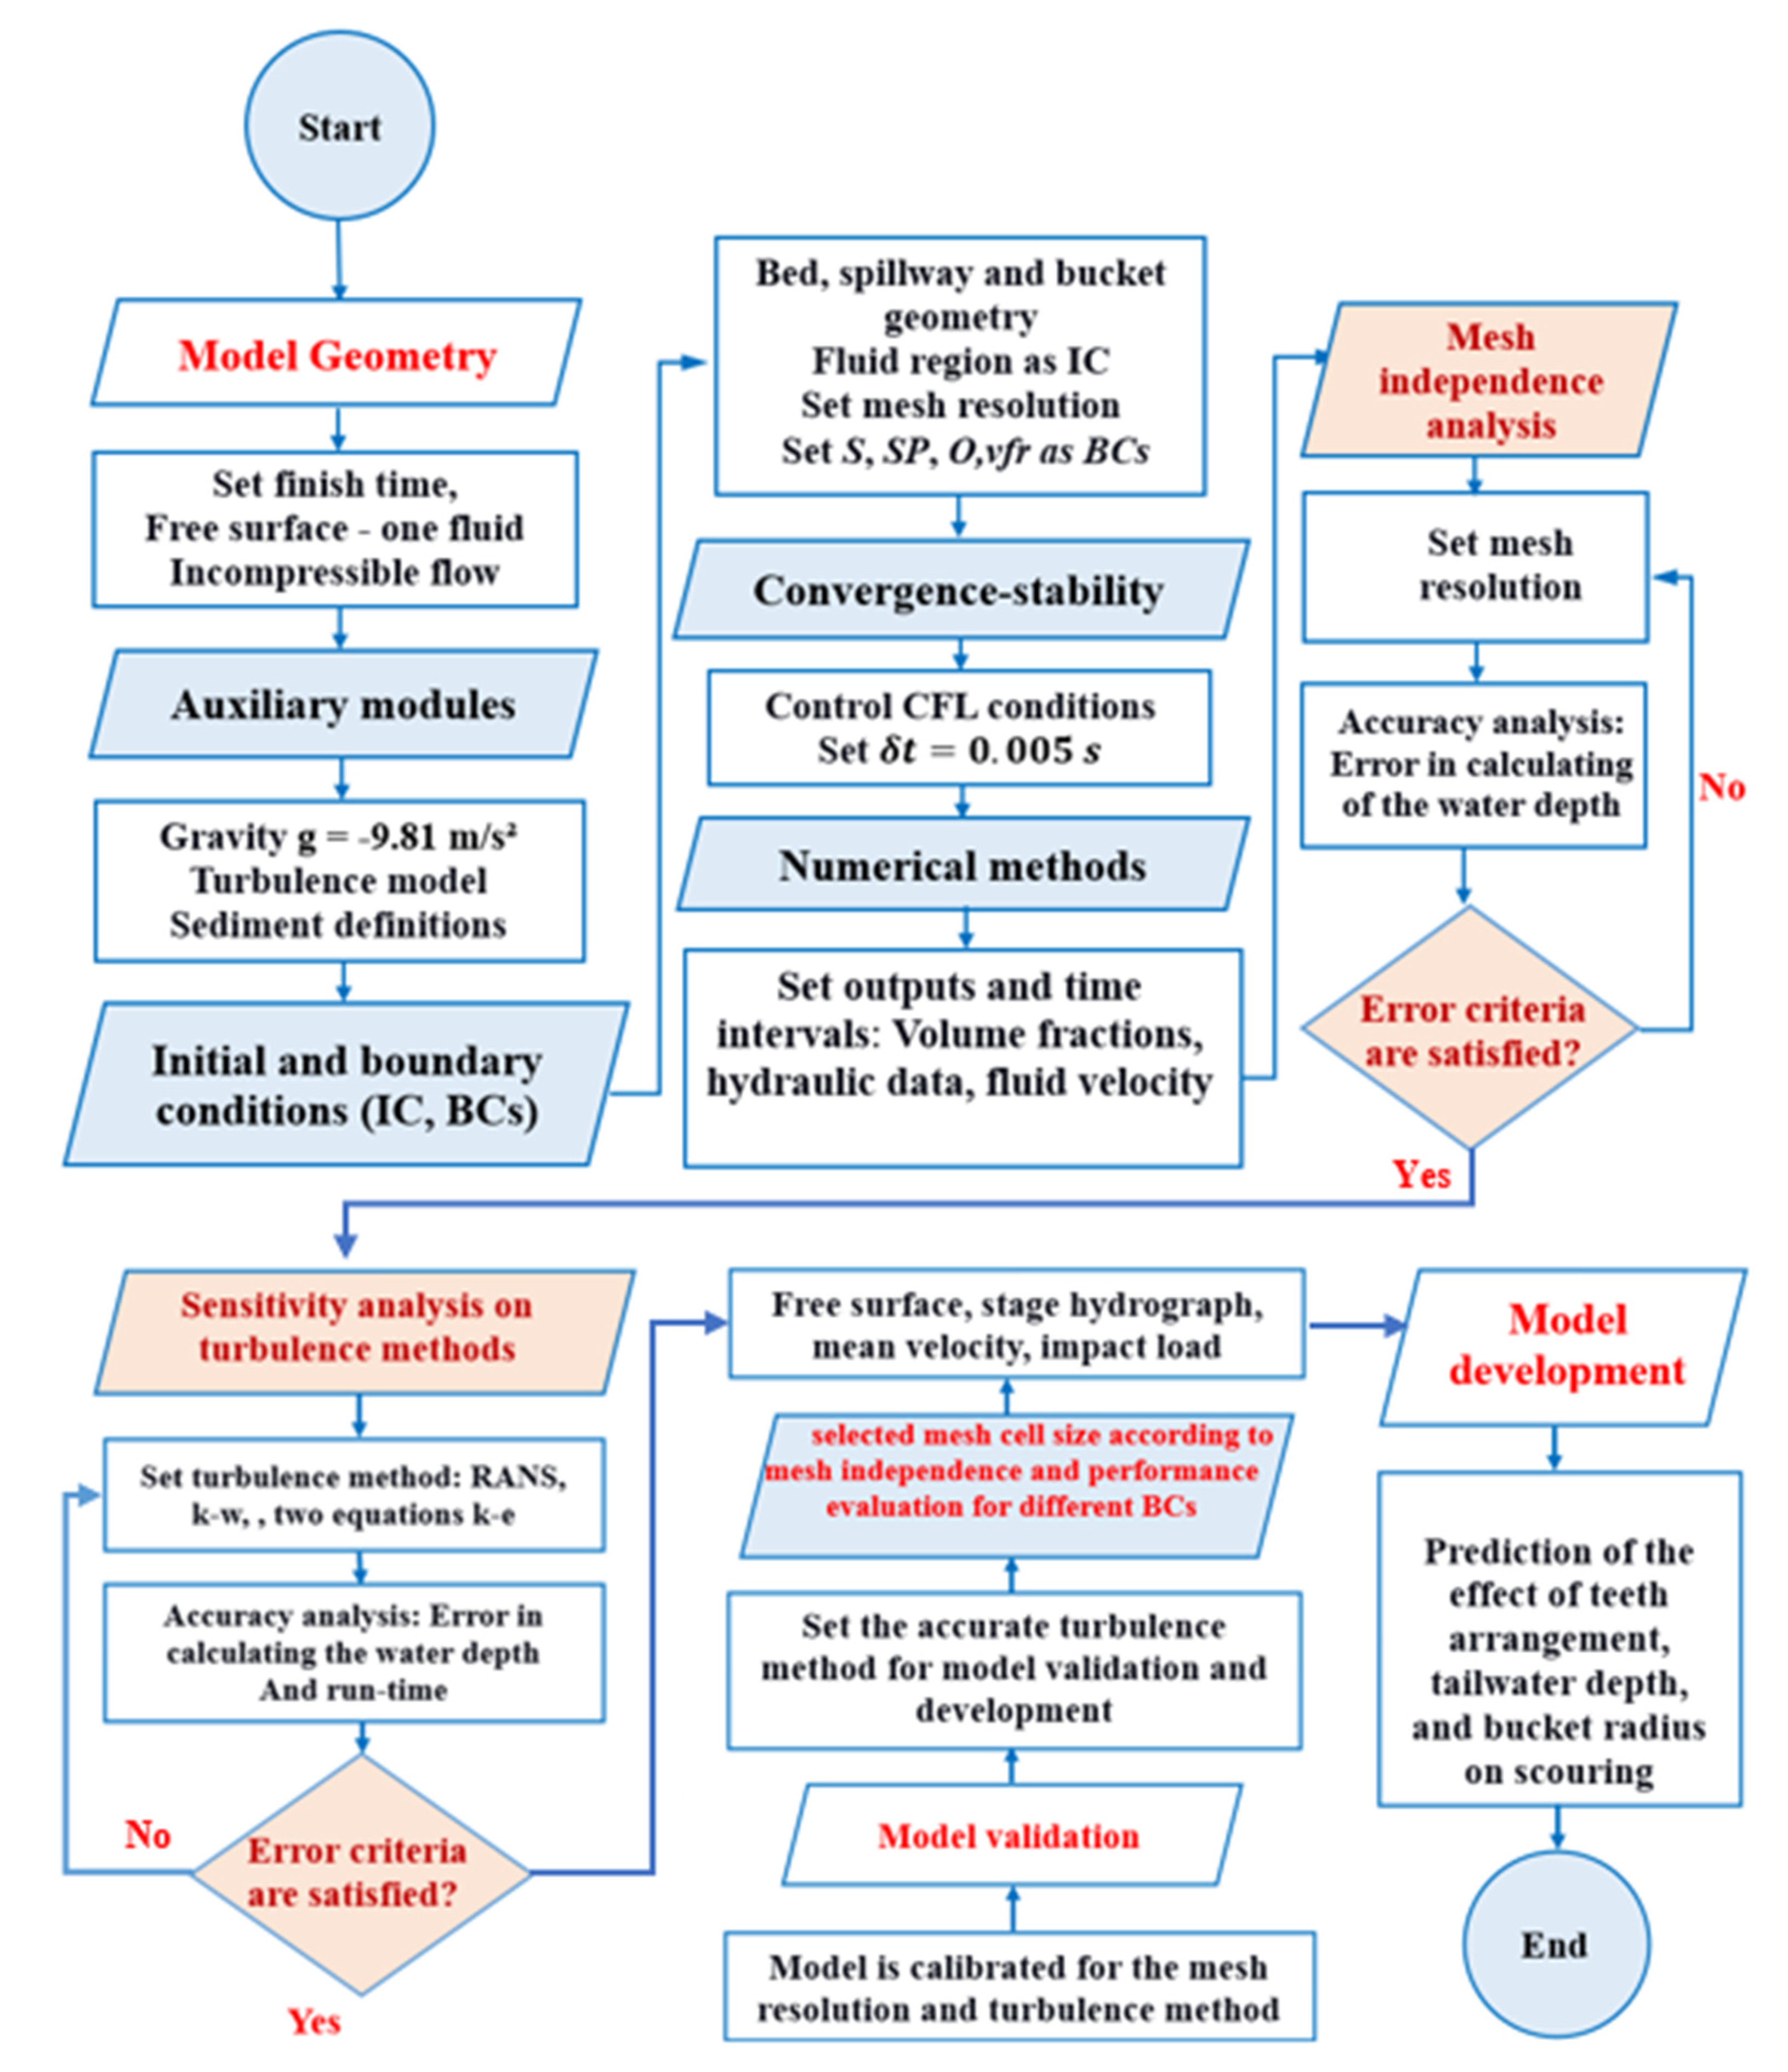
Figure 8 compares the experimental and numerical models, with scour values from the numerical simulation matched against the experimental results at specific points. The comparison reveals that the numerical model provides acceptable estimates of scour depth, validating the simulation’s reliability. In summary, the flowchart in Figure 9 delineates the simulation process utilizing FLOW-3D software, commencing with the definition of model geometry and establishing a one-fluid incompressible flow framework.
This is followed by integrating essential auxiliary modules, including gravity, turbulence models, and sediment definitions. Subsequently, initial and boundary conditions are defined. The convergence-stability phase controls CFL conditions and establishes specific output time intervals for critical parameters such as volume fractions, hydraulic data, and fluid velocity.
The methodology progresses to mesh independence analysis, ensuring the satisfaction of error criteria through accuracy and sensitivity analyses of various turbulence models, including k-ε, RNG, and k-ω approaches. The model is calibrated against benchmarks such as free surface profiles upon meeting these validation criteria. The final phase of model development aims to predict the impacts of various parameters, including teeth arrangement, tailwater depth, and bucket radius, on scour phenomena.

3. Results and Discussion

Using a numerical approach, this study investigates the effects of bucket radius and the arrangement of slotted bucket teeth on scouring and surge height downstream of the bucket. Consistent with the study of Pétursson [30], all models within the P, T, and R groups incorporate an ogee spillway, a chute, a slotted bucket, and an apron. Additionally, a two-meter-deep sediment box is positioned downstream of the apron. These models’ initial conditions, inlet discharge, and boundary conditions were established based on the specifications detailed in Pétursson’s study [30] (refer to Table 1, Table 2 and Table 3).
According to Bhosekar et al. (2012) [38], the primary free surface flow over the bucket was categorized into three distinct regions: a vortex on the bucket’s invert, a downstream vortex, and the flow directed upward from the teeth before flowing downstream over the vortex.
The study first examined the impact of varying the dimensions and arrangement of the teeth, tailwater depth, and bucket radius on scouring dimensions and surge height. Following this, an analysis was performed to explore whether a relationship exists between the turbulent kinetic energy dissipation rate and both scouring dimensions and surge height. It is important to note that the analysis of turbulent kinetic energy dissipation was conducted in alignment with the methodology outlined in the study of Heidarian et al., 2022 [13]. The focus was on slotted buckets with varying teeth arrangements and bucket radii, compared with the downstream section without sediment. Specifically, the analysis was performed for groups P and R under conditions without sediment presence.
The initial conditions, boundary conditions, and stability time were standardized across all models to ensure consistency. An equilibrium time of 350 s was selected based on the observation that there were no changes in the bed profile after this period. Figure 10 illustrates the sample design for group P as an example. For other models in different groups, model B within group P was utilized as a reference.

3.1. Group P (Different Lip Angles)

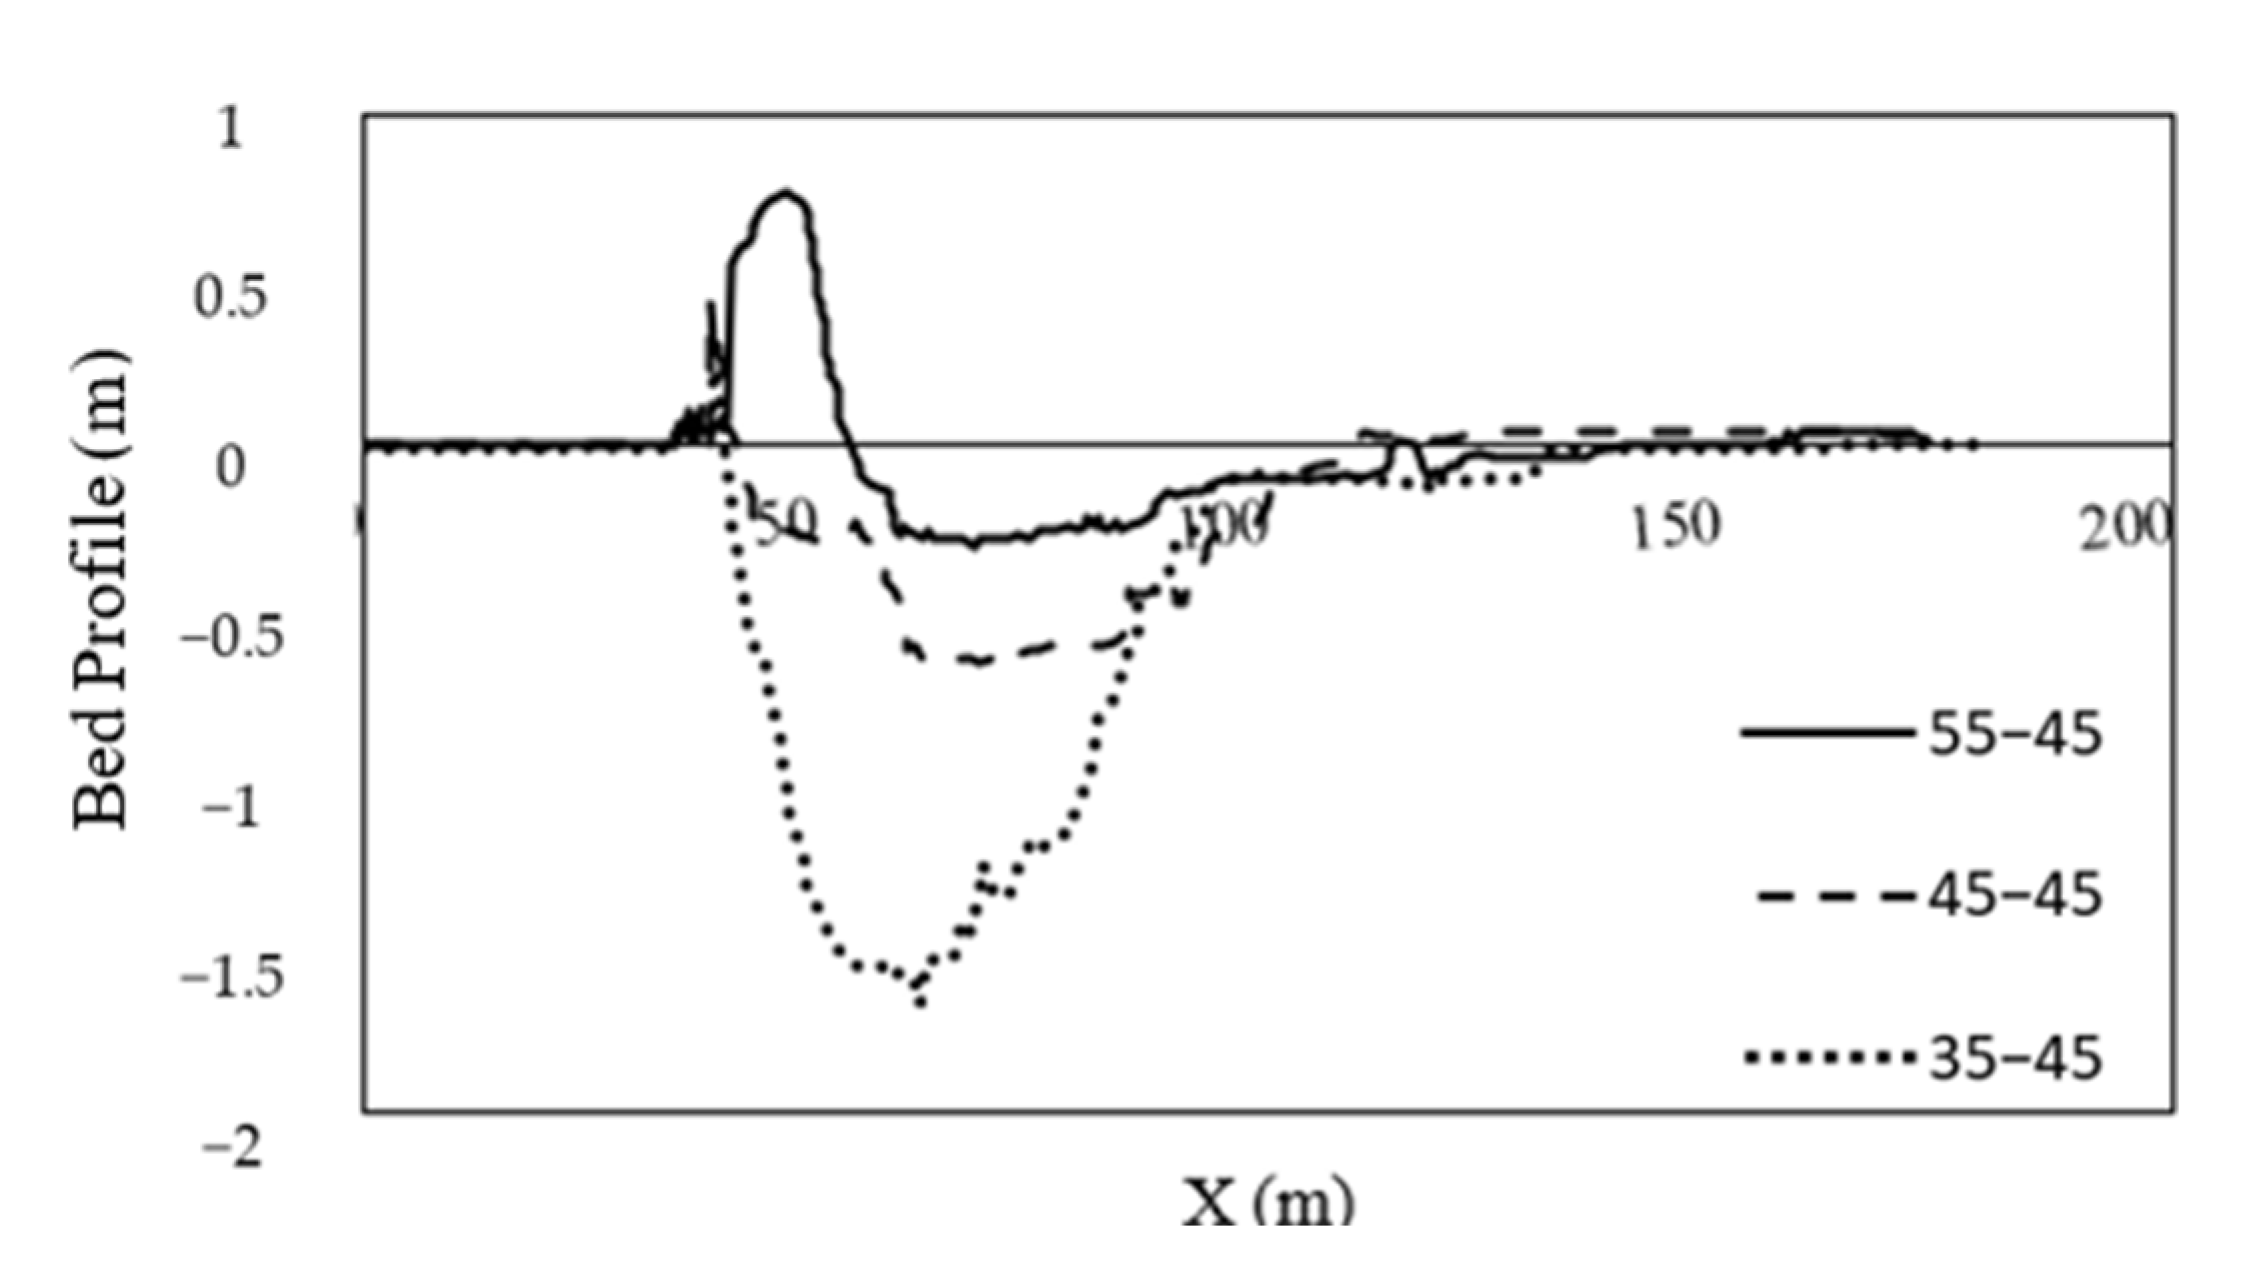
Figure 11 presents the scour depth for models within the P group. The maximum scour depth in model A (45–55) is less than that in the other models, with a depth of less than 0.5 m. In contrast, model B (45–45) exhibits a maximum scour depth of approximately 0.7 m, while model C (45–35) shows a significantly greater maximum depth of about 1.6 m. The reduced scour depth observed in model A (45–55) can be attributed to the higher rate of turbulent kinetic energy dissipation over and near the bucket, teeth, and apron. According to the study by Heidarian et al. (2022) [13], the elevated dissipation rate indicates increased turbulence in the bucket region, leading to enhanced kinetic energy dissipation. Consequently, the flow velocity downstream is reduced, resulting in a shallower scour depth compared with the other models.
Conversely, the maximum scour depth observed in model C (45–35) is likely due to the bucket’s less effective redirection of flow upward compared with the other two models. The increased weight of the downstream water volume and the water over the bucket direct the flow toward the bed, intensifying the scour.
Another noteworthy observation is that in model A (45–55), the maximum scour depth occurs at a greater distance from the apron than the other two models. In contrast, this distance is shorter in model C (45–35). This difference can be explained by the formation of a mound after the apron in model A (45–55). The downstream vortex generated near the apron in this model creates a relatively high mound extending to the edge of the apron, which causes the scour pit to form farther away from the bucket.
Additionally, the length of the scouring zone appears to be shortest in model A (45–55), followed by model B (45–45), with the most extended scouring zone observed in model C (45–35). This suggests that the scouring effect extends farther downstream in model C.
It is worth mentioning that since the 55-degree tooth has a greater height, small vortices are generated behind it. These vortices can trap some sediments, causing accumulation behind the tooth. This phenomenon is illustrated in Figure 11, which shows a sediment mound forming on the downstream wall behind the 55-degree tooth.
Based on Figure 12, model A (45–55) exhibited a surging depth of 16 m, observed approximately 35 m from the bucket on the apron. In model B (45–45), the surging depth increased to 18.5 m, measured 52 m downstream of the apron. Model C (45–35) demonstrated a surging depth of 15.6 m, located approximately 46 m beyond the apron. The extent of the vortex region was estimated based on the reversal points and circulation patterns of the velocity vectors in Figure 12. Although this method is qualitative in nature, it allows for a relative comparison of vortex sizes among different configurations. As summarized in Table 7, model A (45–55) exhibited the smallest downstream roller area (98.1 m2) compared with models B (45–45) and C (45–35), which had larger vortex areas.
This reduced vortex size in model A corresponds well with the findings in Figure 11, where the same configuration showed the smallest maximum scour depth among all models.
The lower surging depth observed in model A (45–55) compared with model B (45–45) can be attributed to the transverse scour effects depicted in Figure 13. In model A, increased transverse mixing along the y-direction, more pronounced than in model B (45–45), contributed to a reduction in surging depth. Additionally, the upward flow redirection in model A (45–55) resulted in a greater surging depth than in model C (45–35).
Moreover, as anticipated based on the principles of projectile motion, the 45-degree launch angle in model B (45–45) provided the maximum range, leading to a greater distance of surging depth from the bucket compared with the other models. This outcome is consistent with the increased transverse mixing observed in model A (45–55), which contributed to higher rates of turbulent kinetic energy dissipation.

3.2. Group T (Tailwater Depth)

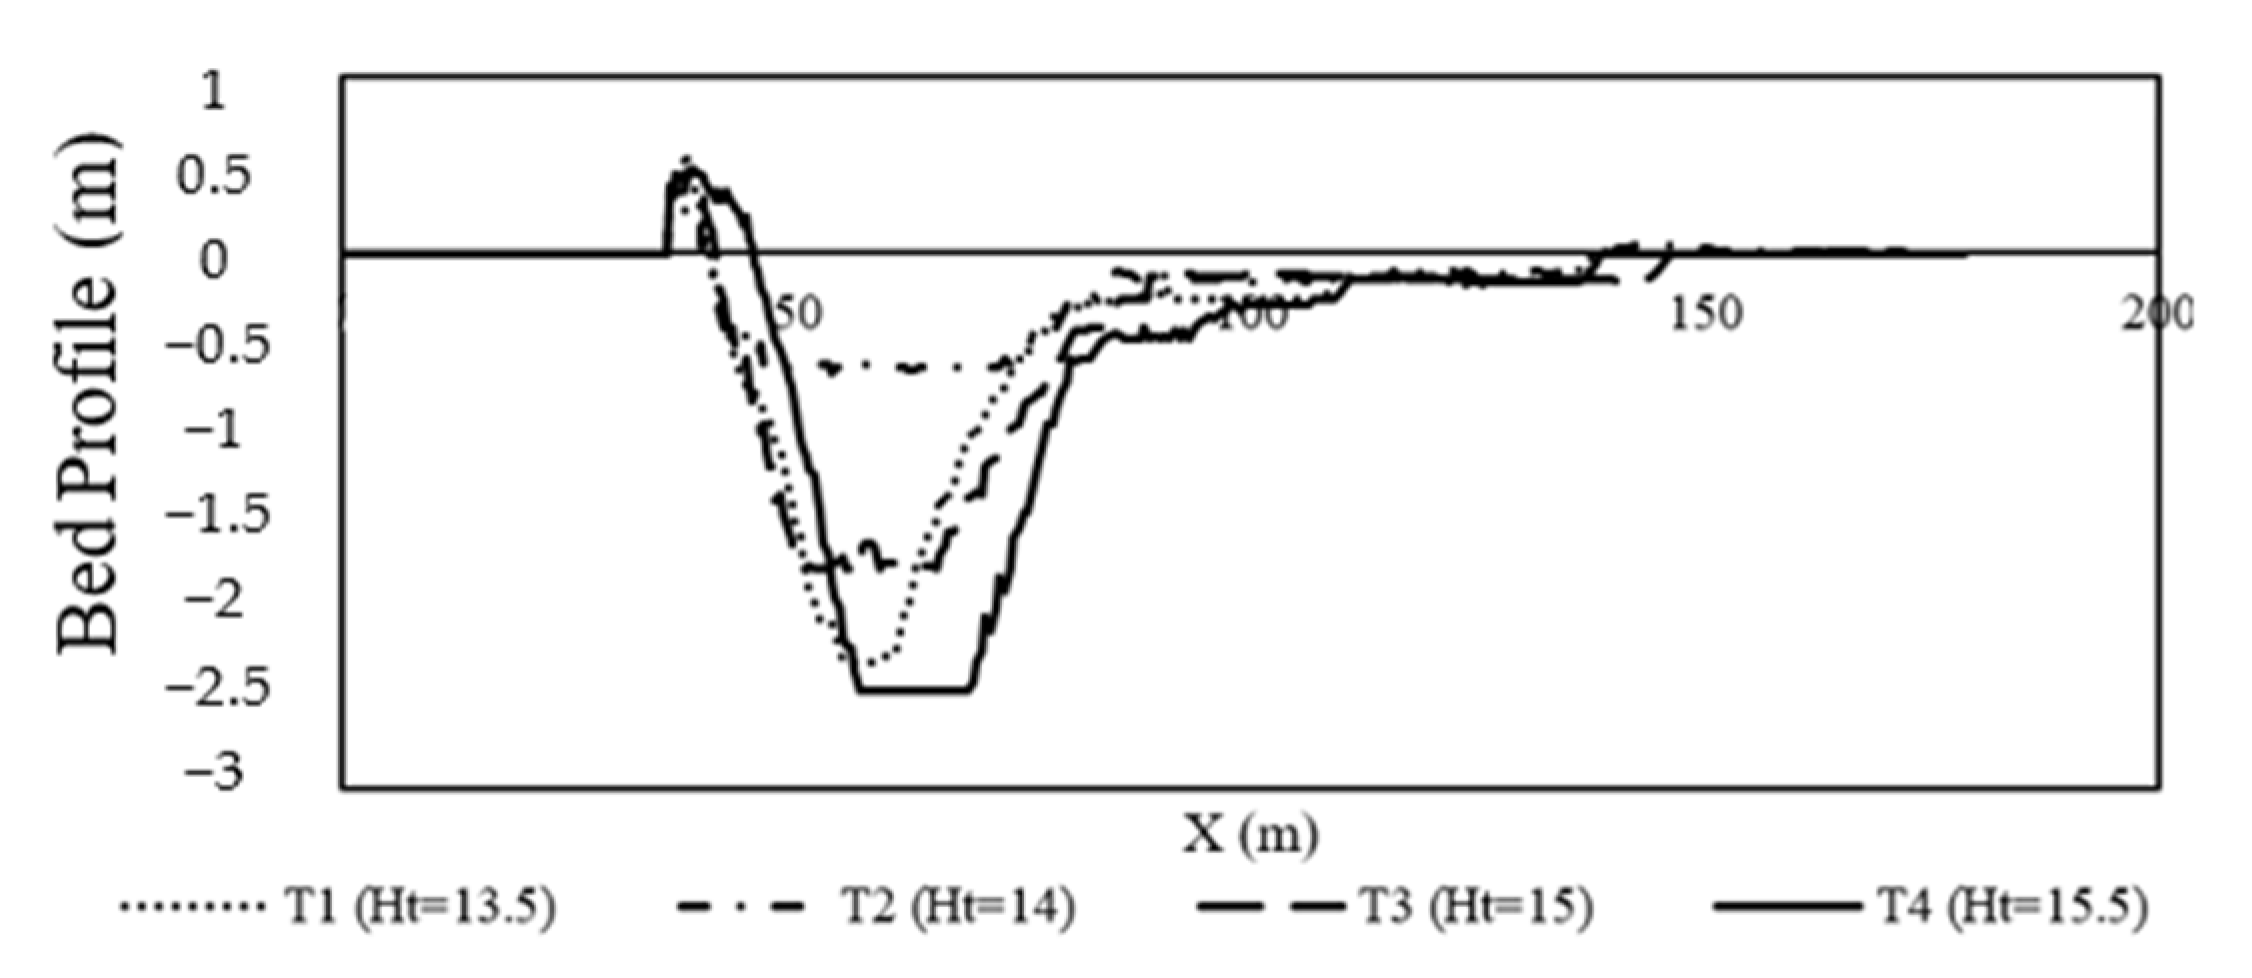
Four models with identical geometries and consistent teeth lip angles were simulated in group T. The only variable was the initial tailwater depth, which was treated as an initial condition. The examined tailwater depths were 13.5 m, 14 m, 15 m, and 15.5 m.
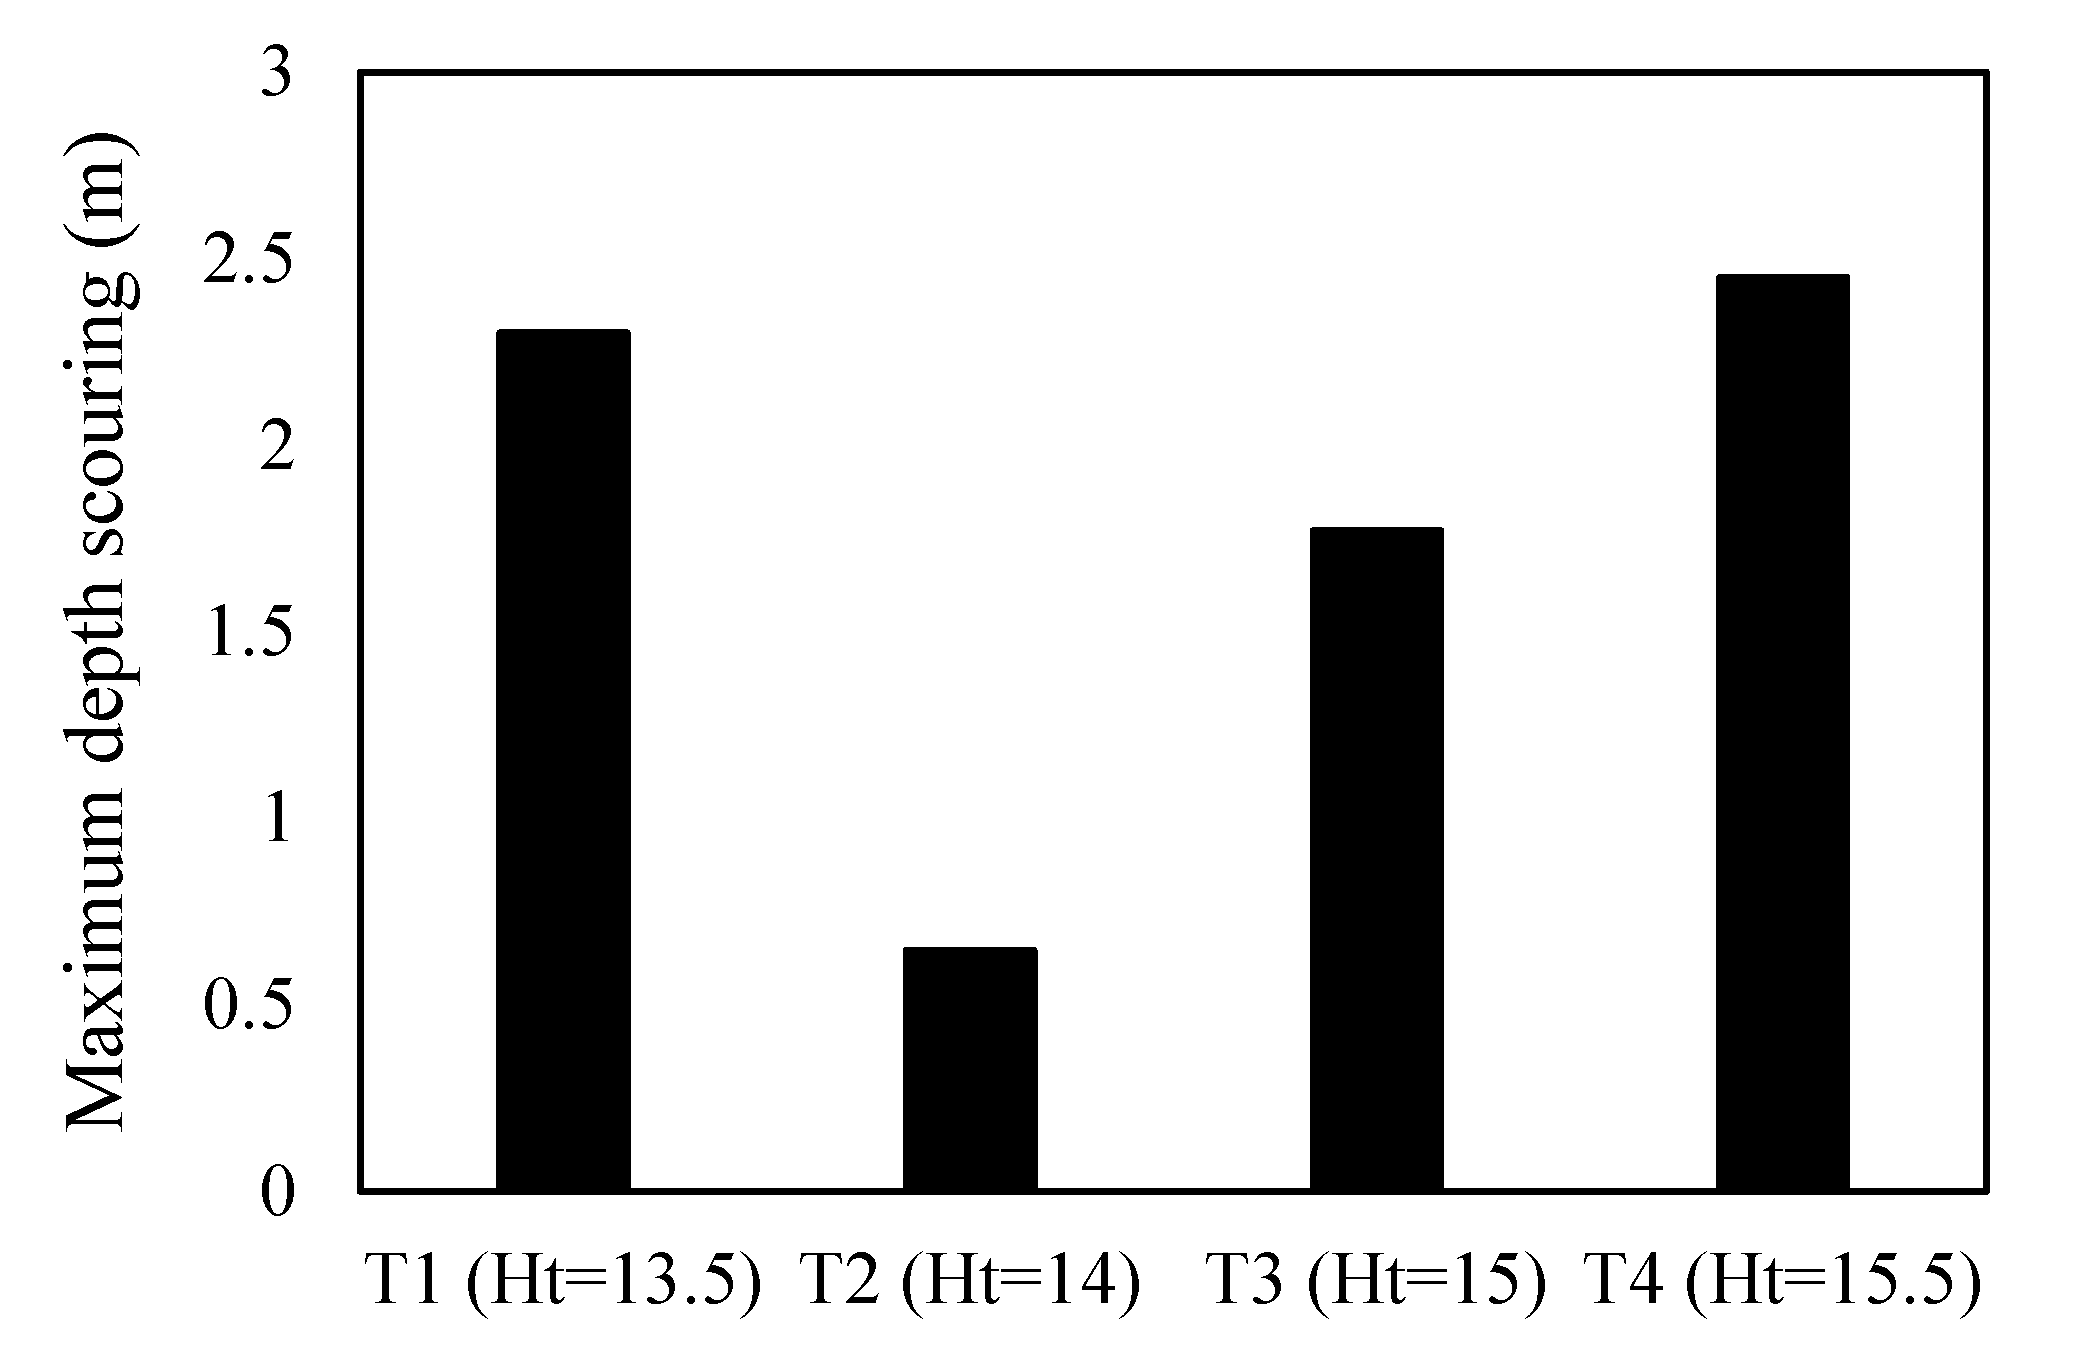
As illustrated in Figure 14, initially increasing the tailwater depth from 13.5 m to 14 m significantly reduces the scour depth from approximately 2 m to about 0.7 m. However, increasing the tailwater depth from 14 m to 15 m increases the scour depth, reaching nearly 1.7 m. When the tailwater depth is increased to 15.5 m, the scour depth reaches its maximum, exceeding 2.5 m and impacting the solid bed.
This phenomenon can be attributed to the need for the water depth to remain within a specific range for optimal performance of the slotted bucket. If the tailwater depth surpasses a certain threshold, the flow exiting the teeth is redirected from the edge of the apron toward the bed due to the weight of the water above the bucket. In this scenario, the jet’s energy is dissipated upon impacting the channel bed, creating a deep scour hole near the bucket.
As originally discussed by Peterka (1964) [40], bed vortices can play a significant role in energy dissipation and sediment transport. In our simulations, the formation of such vortical structures near the bucket floor was indirectly observed through variations in flow patterns and scour depth under different tailwater conditions. As the tailwater level increases, the interaction between the jet and the tailwater leads to more stable flow reattachment and reduced turbulence near the bed, resulting in less aggressive scouring. Conversely, at lower tailwater depths, the flow remains free and undeviated, exiting the bucket as a high-energy jet that impinges directly onto the bed material, increasing the depth of scour. Optimal vortex performance is closely related to the tailwater depth, and when the tailwater depth is within a specific range, the vortex forms effectively, resulting in minimal scour and a smoother water surface profile. This is depicted in Figure 15, which presents a bar chart showing the variation in scour depth with increasing tailwater depth.
Regarding the surging height in this group, it is challenging to draw definitive conclusions due to the varying tailwater depths, which result in non-uniform conditions across the models. However, turbulence and variations in the water surface profile diminish as tailwater depth increases. This effect can be attributed to the increasing pressure and weight of the tailwater volume on the jet exiting the bucket; as the depth increases, the more significant pressure and weight prevent the jet flow from reaching the tailwater surface, thereby reducing turbulence.
Nonetheless, as illustrated in Figure 16, a decrease in tailwater depth directly impacts surface boiling. Specifically, reduced tailwater depth leads to increased boiling, resulting in a transition from a plunging and roller bucket flow to a trajectory bucket flow.
The extent of the vortex region was estimated based on the reversal points and circulation patterns of the velocity vectors in Figure 16. Although this method is qualitative in nature, it allows for a relative comparison of vortex sizes among different configurations. As summarized in Table 8, model T2 with 14 m tailwater depth exhibited the smallest downstream roller area (89.6 m2) compared with other models with different tailwater depths, which had larger vortex areas.
This reduced vortex size in model T1 corresponds well with the findings in Figure 15, where the same configuration showed the smallest maximum scour depth among all models.

3.3. Group R (Different Bucket Radii)

This group examined three buckets with varying radii, R1 = 9 m, R2 = 11 m, and R3 = 13 m. As shown in Figure 17, the bucket with a radius of 11 m (R2) resulted in the lowest scour depth, approximately 0.7 m. The bucket with a radius of 9 m (R1) produced a scour depth of around 1.2 m, while the bucket with a radius of 13 m (R3) led to a maximum scour depth of about 1.8 m. These results suggest a nonlinear relationship between bucket radiuses and scour depth: initially, increasing the radius reduces the scour depth, but a further increase in radius leads to greater scour depth. This nonlinear behavior can be attributed to several factors. One possible explanation for this pattern is the variation in the exit velocity of water from the roller bucket as the radius changes. As the radius increases, there may be an optimal range where the exit velocity of water decreases, resulting in less energy being transferred to the riverbed, thereby reducing scour. However, forming vortices and secondary flows may increase energy levels beyond a certain radius, leading to deeper scour.
Another contributing factor is the impact of radius changes on the flow pattern and turbulence downstream. Different radii can generate varying vortex and rotational flows, directly influencing scour depth. Additionally, increasing the bucket radius leads to an increase in the height of the teeth. This change in tooth height can, directly and indirectly, affect turbulence and water flow behavior, thereby modifying the flow pattern; turbulence intensity; and, ultimately, the scour depth downstream of the roller bucket.
On one hand, increasing the height of the teeth might reduce scour by locally dissipating water energy within the rotational currents, transferring less energy to the riverbed. On the other hand, greater tooth height could enhance scour by creating stronger vortices that transfer more energy to the riverbed.
Furthermore, changes in the roller bucket radius can alter the volume and depth of water within the roller bucket, affecting the energy levels and how this energy is transferred to the riverbed. Specifically, in model R1, the smaller water volume might result in less energy transfer. In model R2, the water volume and energy transfer might be optimal, reducing scour. In model R3, the larger water volume may increase energy transfer to the riverbed, thereby increasing scour depth.
According to Figure 18, the boiling depth also becomes greater as the bucket radius increases. In the R3 model, with a radius of 13 m, the more extended bucket generates a larger turbulent zone. As a result, the kinetic energy dissipation due to turbulence in this model, as shown in the study by Heidarian et al. (2022) [13], is higher, which leads to a greater boiling depth compared with the models with 11 m and 9 m radii. Furthermore, as the radius increases, the height of the teeth also rises. This structural change causes the jet to be directed to a higher water surface level, enhancing surface turbulence and increasing the boiling depth.
The extent of the vortex region was estimated based on the reversal points and circulation patterns of the velocity vectors in Figure 18. Although this method is qualitative in nature, it allows for a relative comparison of vortex sizes among different configurations. As summarized in Table 9, model R2 with the radius of 11 m exhibited the smallest downstream roller area (121 m2) compared with other models with different radii, which had larger vortex areas.
This reduced vortex size in model R2 corresponds well with the findings in Figure 17, where the same configuration showed the smallest maximum scour depth among all models.

4. Conclusions

This study numerically examined various parameters influencing scour and surging height in slotted roller buckets, focusing on the effects of tooth arrangement, bucket radius, and tailwater elevation. The analyzed configurations included tooth lip angles of 55–45 degrees, 45–45 degrees, and 45–35 degrees; tailwater depths of 13.5 m, 14 m, 15 m, and 15.5 m; and bucket radii of 9 m, 11 m, and 13 m.
Results revealed that increasing the lip angle of bucket teeth effectively disrupts coherent flow structures, reduces the extent of local scour, and enhances energy dissipation through increased turbulent interaction. The 55–45° configuration, in particular, minimized scouring but simultaneously induced greater sediment movement toward the bucket and apron area, along with higher surface surging. These effects imply that for such configurations, design modifications such as elevating the apron lip or increasing sidewall height may be necessary to prevent structural and operational issues.
Moreover, tailwater depth did not exhibit a linear relationship with scour depth. Both excessive increases and reductions in tailwater elevation led to intensified scour due to their impact on boiling depth and flow regime transitions. Specifically, shallow tailwater conditions enhanced boiling and promoted flow oscillations, potentially transforming the hydraulic behavior from plunging to trajectory mode.
Furthermore, the bucket radius demonstrated a non-monotonic influence on scour development. Neither minimal nor oversized radii yielded optimal flow patterns, highlighting the importance of selecting an intermediate radius that balances scour minimization and hydraulic performance, while also considering structural and economic feasibility.
Overall, this study advances current understanding of flow–scour interactions in slotted roller buckets by incorporating 3D numerical modeling of innovative tooth geometries. The findings offer practical insights for the optimized design of roller bucket dissipators, particularly in terms of tailoring lip angles and structural elements such as sidewall elevations to control surging and mitigate downstream scour.

Author Contributions

P.H., S.A.A.S.N. and A.K., methodology; P.H., S.A.A.S.N., A.K. and S.O., software; S.D.F., P.H. and S.A.A.S.N., formal analysis; P.H., A.K., R.N., S.O. and S.D.F., investigation; P.H., A.K. and S.A.A.S.N., resources; P.H. and A.K., writing—original draft; P.H. and A.K., writing—review and editing; P.H. and A.K., visualization; S.A.A.S.N., R.N., S.O. and S.D.F., supervision; S.D.F., R.N. and S.O., project administration. All authors have read and agreed to the published version of the manuscript.

Funding

This research received no external funding.

Data Availability Statement

Data will be made available at a reasonable request.

Conflicts of Interest

The authors declare no conflicts of interest.

References

  1. Arjenaki, M.O.; Sanayei, H.R.Z. Numerical investigation of energy dissipation rate in stepped spillways with lateral slopes using experimental model development approach. Model. Earth Syst. Environ. 2020, 6, 605–616. [Google Scholar] [CrossRef]
  2. Khatsuria, R.M. Hydraulics of Spillways and Energy Dissipators; CRC Press: Boca Raton, FL, USA, 2004. [Google Scholar]
  3. Latifi, A.; Hosseini, S.A.; Saneie, M. Comparison of downstream scour of single and combined free-fall jets in co-axial and non-axial modes. Model. Earth Syst. Environ. 2018, 4, 1271–1284. [Google Scholar] [CrossRef]
  4. El Amri, A.; Verrette, J. Variations of the hydrodynamic efforts on horizontal and eroded base plates downstream in a trough-type energy dissipator. Can. J. Civ. Eng. 2007, 34, 890–894. [Google Scholar]
  5. Fuladipanah, M.; Azamathulla, H.M.; Tota-Maharaj, K.; Mandala, V.; Chadee, A. Precise forecasting of scour depth downstream of flip bucket spillway through data-driven models. Results Eng. 2023, 20, 101604. [Google Scholar] [CrossRef]
  6. Eskandari, A.; Heidarnejad, M.; Masjedi, A.; Purmohammadi, M.H.; Kamanbedast, A. Experimental investigation on the effect of different slot shapes and configurations on scour dimension downstream of flip buckets. Water SA 2020, 46, 458–464. [Google Scholar] [CrossRef]
  7. Ramarao, V.; Joshi, P.; Inamdar, A.; Sanghvi, S.S. Assessment of ski-jump bucket parameters for sluice spillway of Himalayan dam by hydraulic model studies. Int. J. Adv. Res. Ideas Innov. Technol. 2019, 5, 1156–1161. [Google Scholar]
  8. Ramarao, V.S.; Kulhare, A. Effect of Deficient Tailwater on the Performance of Slotted Roller Bucket of Indira Sagar Dam, Madhya Pradesh. In Proceedings of the 9th IAHR International Symposium on Hydraulic Structures—9th ISHS, Roorkee, India, 24–27 October 2022. [Google Scholar]
  9. Nangare, P.B.; Kote, A.S. Enhancement of energy dissipation using combination of solid roller bucket and type II stilling basin for ogee stepped spillway. In River Hydraulics: Hydraulics, Water Resources and Coastal Engineering; Springer International Publishing: Cham, Switzerland, 2021; Volume 2, pp. 97–101. [Google Scholar]
  10. Hafnaoui, M.A.; Debabeche, M. Numerical modeling of the hydraulic jump location using 2D Iber software. Model. Earth Syst. Environ. 2021, 7, 1939–1946. [Google Scholar] [CrossRef]
  11. Kote, A.S.; Nangare, P.B. Hydraulic model investigation on stepped spillway’s plain and slotted roller bucket. Eng. Technol. Appl. Sci. Res. 2019, 9, 4419–4422. [Google Scholar] [CrossRef]
  12. Nangare, P.; Kote, A. Experimental investigation of an ogee stepped spillway with plain and slotted roller bucket for energy dissipation. Int. J. Civ. Eng. Technol. 2017, 8, 1549–1555. [Google Scholar]
  13. Heidarian, P.; Neyshabouri, S.A.A.S.; Khoshkonesh, A.; Bahmanpouri, F.; Nsom, B.; Eidi, A. Numerical study of flow characteristics and energy dissipation over the slotted roller bucket system. Model. Earth Syst. Environ. 2022, 8, 5337–5351. [Google Scholar] [CrossRef]
  14. Rahmani Firozjaei, M.; Salehi Neyshabouri, S.A.A.; Amini Sola, S.; Mohajeri, S.H. Numerical simulation on the performance improvement of a lateral intake using submerged vanes. Iran. J. Sci. Technol. Trans. Civ. Eng. 2019, 43, 167–177. [Google Scholar] [CrossRef]
  15. Khani, S.; Moghadam, M.; Nikookar, M. Pressure fluctuations investigation on the curve of flip buckets using analytical and numerical methods. Comput. Res. Prog. Appl. Sci. Eng. 2017, 3, 165–171. [Google Scholar]
  16. Mirzaei, H.; Heydari, Z.; Fazli, M. Predicting the scour around open groyne using different models of turbulence & vortices flow in variety of open & close groyne. Model. Earth Syst. Environ. 2019, 5, 101–118. [Google Scholar]
  17. Morais, V.H.P.d.; Gireli, T.Z.; Vatavuk, P. Modelagem numérica e experimental aplicada a um vertedouro de superfície composto por um perfil Creager e um dissipador do tipo roller bucket. RBRH 2020, 25, e18. [Google Scholar] [CrossRef]
  18. Movahedi, A.; Kavianpour, M.; Aminoroayaie Yamini, O. Experimental and numerical analysis of the scour profile downstream of flip bucket with change in bed material size. ISH J. Hydraul. Eng. 2019, 25, 188–202. [Google Scholar] [CrossRef]
  19. Rahmani Firozjaei, M.; Hajebi, Z.; Naeeni, S.T.O.; Akbari, H. Experimental and numerical investigation of bottom intake structure for desalination plants. Numer. Methods Civ. Eng. 2024, 8, 1–9. [Google Scholar] [CrossRef]
  20. Sharif, N.; Ravori, A.R. Experimental and numerical study of the effect of flow separation on dissipating energy in compound bucket. APCBEE Procedia 2014, 9, 334–338. [Google Scholar] [CrossRef]
  21. Jones, W.P.; Launder, B.E. The prediction of laminarization with a two-equation model of turbulence. Int. J. Heat Mass Transf. 1972, 15, 301–314. [Google Scholar] [CrossRef]
  22. Wilcox, D.C. Reassessment of the scale-determining equation for advanced turbulence models. AIAA J. 1988, 26, 1299–1310. [Google Scholar] [CrossRef]
  23. Yakhot, V.; Orszag, S.A.; Thangam, S.; Gatski, T.; Speziale, C. Development of turbulence models for shear flows by a double expansion technique. Phys. Fluids A Fluid Dyn. 1992, 4, 1510–1520. [Google Scholar] [CrossRef]
  24. Hirt, C.W.; Nichols, B.D. Volume of fluid (VOF) method for the dynamics of free boundaries. J. Comput. Phys. 1981, 39, 201–225. [Google Scholar] [CrossRef]
  25. Amini, A.A.; Sarkardeh, H.; Jabbari, E.; Eidi, A. Understanding vortex characteristics in hydraulic systems: A temperature-driven analysis. Model. Earth Syst. Environ. 2024, 10, 3559–3571. [Google Scholar] [CrossRef]
  26. Mastbergen, D.R.; Van Den Berg, J.H. Breaching in fine sands and the generation of sustained turbidity currents in submarine canyons. Sedimentology 2003, 50, 625–637. [Google Scholar] [CrossRef]
  27. Soulsby, R. Dynamics of Marine Sands; Thomas Telford Publications: London, UK, 1997. [Google Scholar]
  28. Meyer-Peter, E. Formulas for bed-load transport. In Proceedings of the 2nd IAHR Meeting, Stockholm, Sweden, 7–9 June 1948. [Google Scholar]
  29. Van Rijn, L.C. Sediment transport, part I: Bed load transport. J. Hydraul. Eng. 1984, 110, 1431–1456. [Google Scholar] [CrossRef]
  30. Pétursson, G.S. Model Investigation of a Low Froude Number Roller Bucket at Urriðafoss HEP. Master’s Thesis, School of Engineering and Natural Sciences, University of Iceland, Reykjavik, Iceland, 2013. [Google Scholar]
  31. Okhravi, S.; Gohari, S.; Alemi, M.; Maia, R. Numerical modeling of local scour of non-uniform graded sediment for two arrangements of pile groups. Int. J. Sediment Res. 2023, 38, 597–614. [Google Scholar] [CrossRef]
  32. Oodi, S.; Gohari, S.; Di Francesco, S.; Nazari, R.; Nikoo, M.R.; Heidarian, P.; Eidi, A.; Khoshkonesh, A. Wave–Structure Interaction Modeling of Transient Flow Around Channel Obstacles and Contractions. Water 2025, 17, 424. [Google Scholar] [CrossRef]
  33. Flow Science, Inc. FLOW-3D® Version 2023R1 Users Manual; Flow Science, Inc.: Santa Fe, NM, USA, 2023; Available online: https://www.flow3d.com (accessed on 23 April 2023).
  34. Karr, M.H.F.E.L. Bucket-Type Energy Dissipator Characteristics. Lehigh University Fritz Lab Report, 1956. Available online: https://preserve.lehigh.edu/lehigh-scholarship/faculty-and-staff-publications/fritz-lab-reports/bucket-type-energy-dissipator (accessed on 23 April 2023).
  35. Zhang, M.-L.; Shen, Y.-M. Three-dimensional simulation of meandering river based on 3-D RNG κ-ε turbulence model. J. Hydrodyn. Ser. B 2008, 20, 448–455. [Google Scholar] [CrossRef]
  36. Khoshkonesh, A.; Nsom, B.; Bahmanpouri, F.; Dehrashid, F.A.; Adeli, A. Numerical study of the dynamics and structure of a partial dam-break flow using the VOF method. Water Resour. Manag. 2021, 35, 1513–1528. [Google Scholar] [CrossRef]
  37. Bahmanpouri, F.; Daliri, M.; Khoshkonesh, A.; Namin, M.M.; Buccino, M. Bed compaction effect on dam break flow over erodible bed; experimental and numerical modeling. J. Hydrol. 2021, 594, 125645. [Google Scholar] [CrossRef]
  38. Bhosekar, V.; Patnaik, S.; Bhajantri, M.; Sunderlal, B. Limitations of spillway roller bucket. Water Energy Int. 2012, 69, 47–54. [Google Scholar]
  39. Saghravani, F.; Salehi Neyshabouri, S.A.A. Investigation of Scour Downstream of Flip Bucket. Master’s Thesis, Tarbiat Modares University, Tehran, Iran, 1992. [Google Scholar]
  40. Peterka, J.A. Hydraulic Model Studies of Scour Holes and Bed Vortices Under Jets; Technical Note No. 59, WMO-No. 147; U.S. Water Resources Council: Washington, DC, USA, 1964. [Google Scholar]
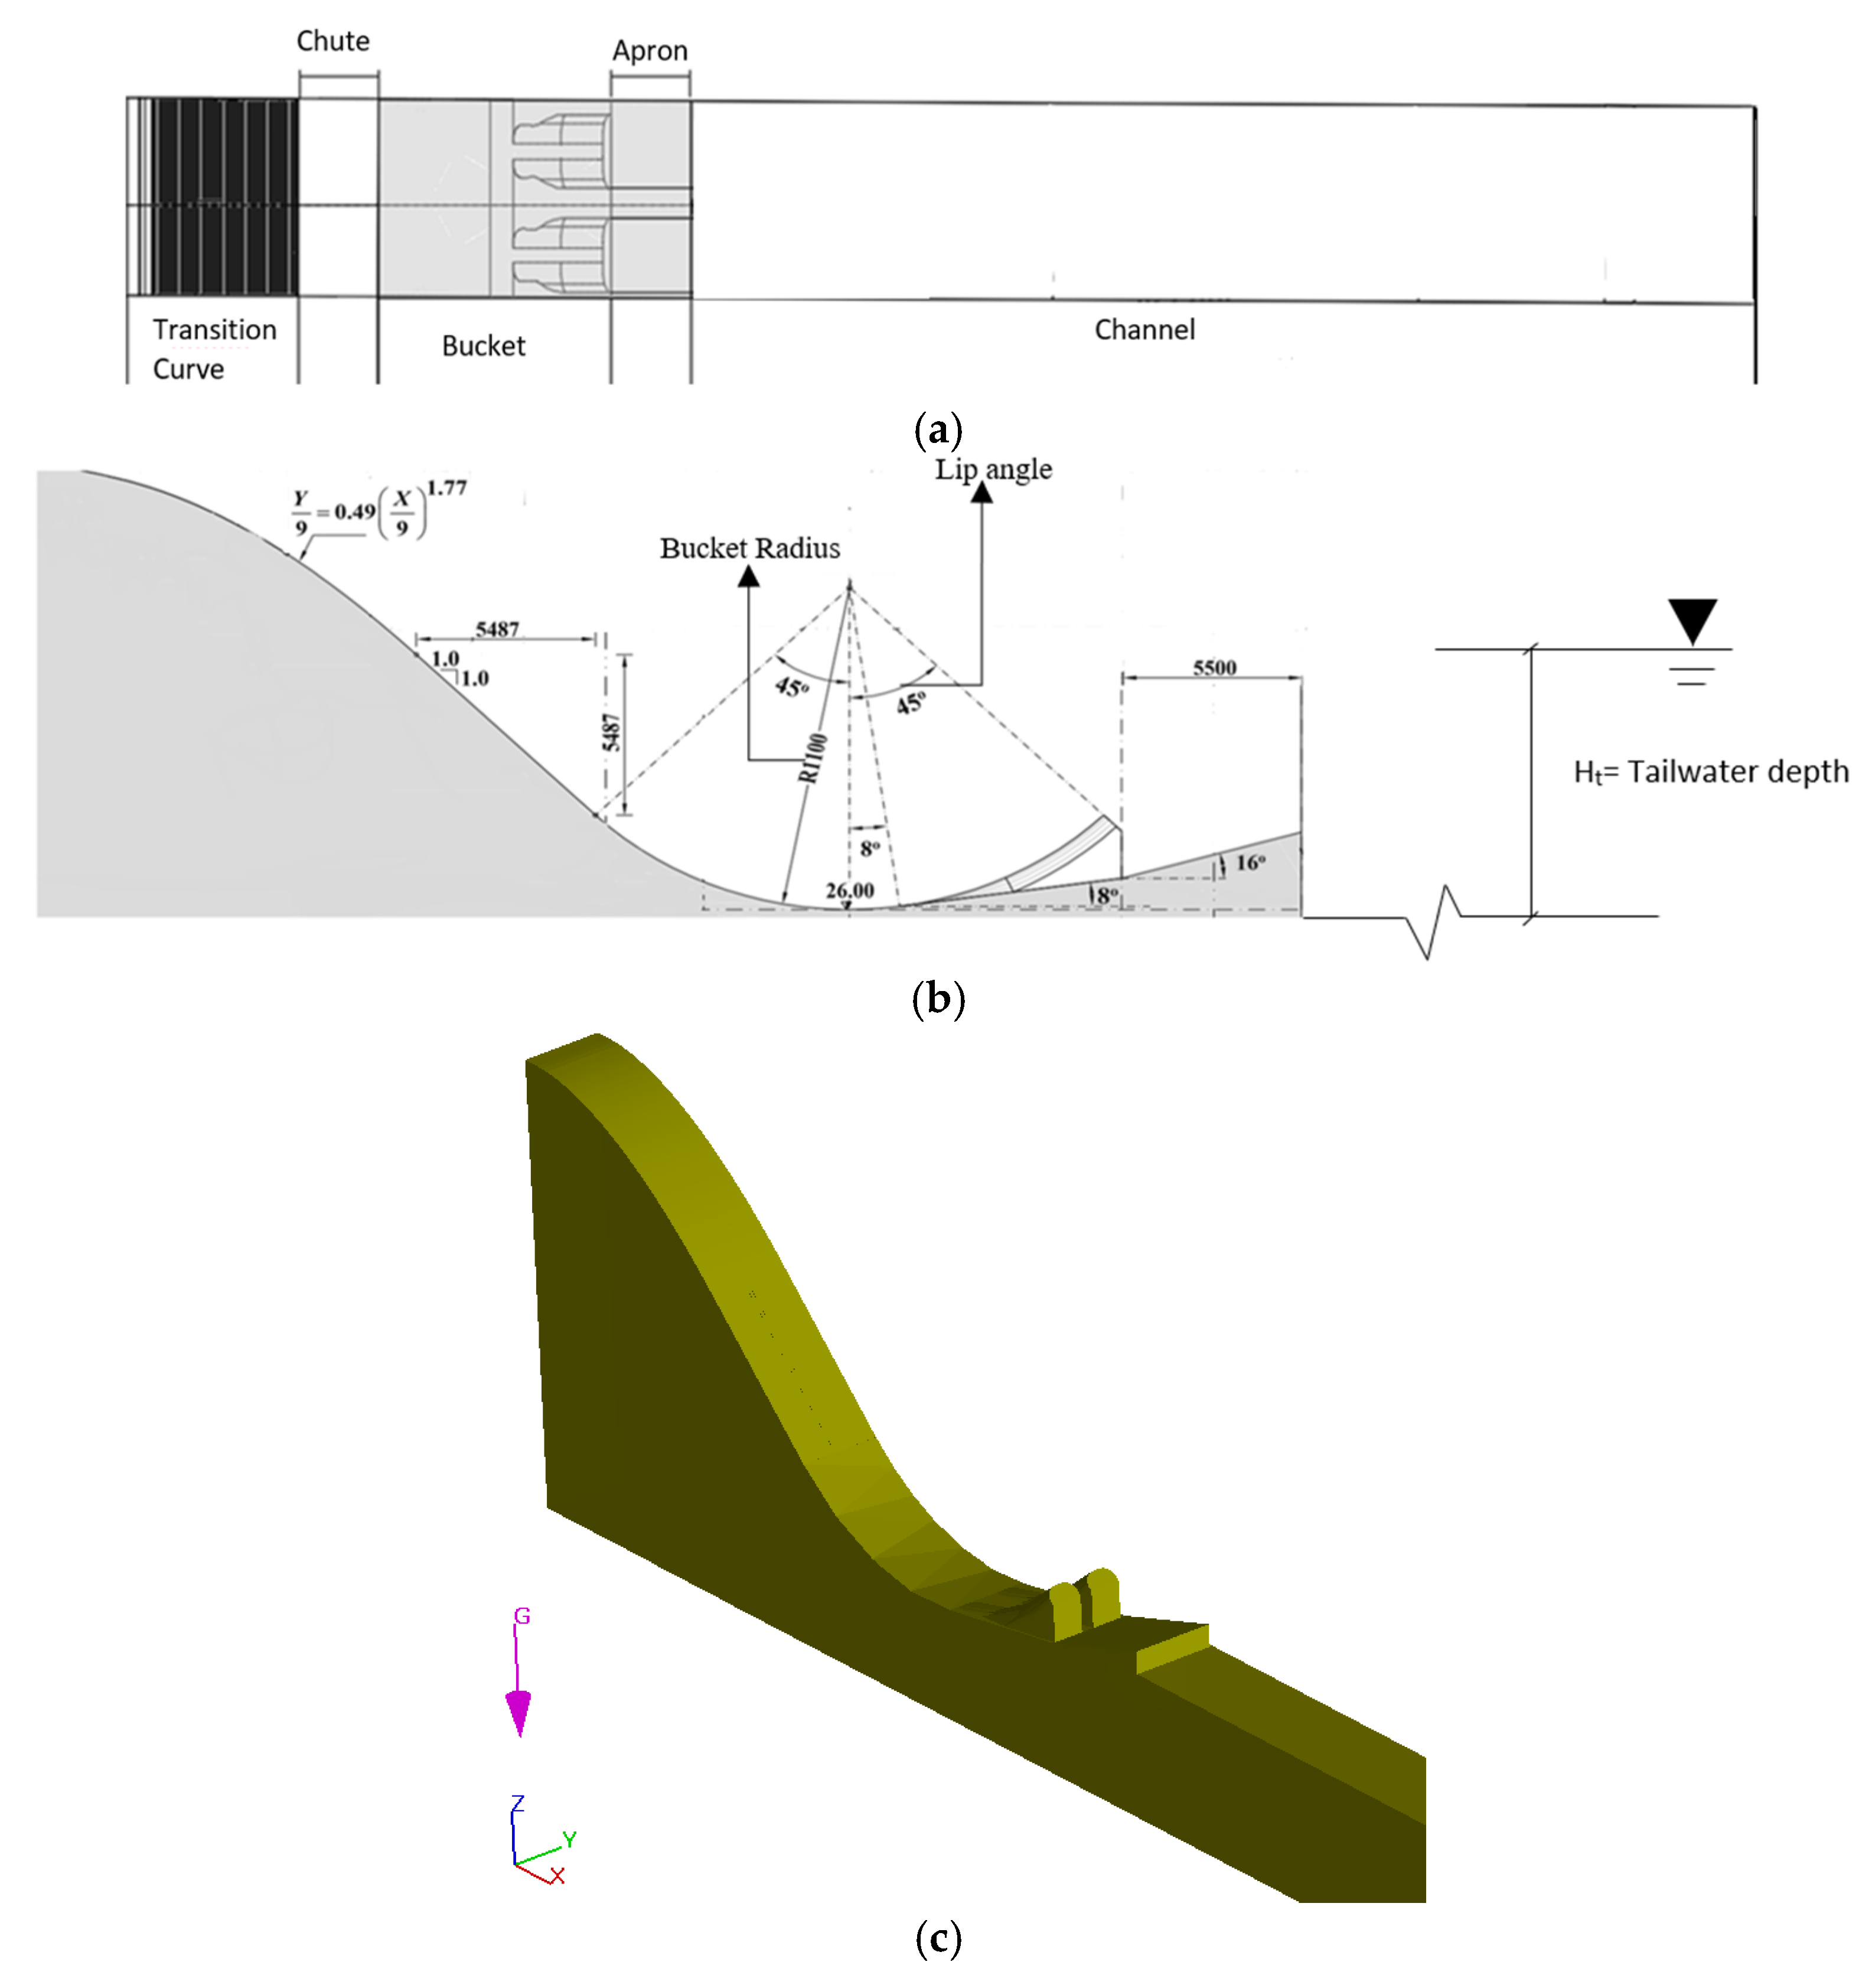
Figure 1. Plan of the model configuration (a), profile of the overflow components (b), and 3D view of the model (c). (a) Plan. (b) Profile. (c) A 3D view.
Water 17 02471 g001
Figure 2. Comparison of turbulence models’ error versus laboratory models.
Water 17 02471 g002
Figure 3. Flow profile diagram at the specified times to demonstrate flow stability.
Water 17 02471 g003
Figure 4. The hydraulic performance of the model in the present study is compared with Pétursson’s study models. (a) Streamlines from Pétursson’s numerical model [30] and (b) schematic representation of the vortices’ formation with the flow in this study.
Water 17 02471 g004
Figure 5. The experimental model of a spillway with a solid bucket and flow from Saghravani, 1992 [39].
Water 17 02471 g005
Figure 6. Streamlines in the numerically modeled system in FLOW 3D.
Water 17 02471 g006
Figure 7. Packed sediment elevation net change along with velocity vectors indicating flow direction and relative magnitude at the final equilibrium state in the FLOW 3D model.
Water 17 02471 g007
Figure 8. Comparison diagram of scouring depth amounts at specific points (determined in the experimental study) in experimental and numerical models.
Water 17 02471 g008
Figure 9. Detailed flowchart depicting the methodology for simulations in FLOW-3D.
Water 17 02471 g009
Figure 10. Models with different launch angles in the teeth are used to investigate the effect of tooth arrangement.
Water 17 02471 g010
Figure 11. Comparison of scour depth for three configurations with tooth angles of model A (55–45), B (45–45), and C (35–45).
Water 17 02471 g011
Figure 12. Group P. Velocity vector in the 2-D profile of the simulation result. (a) A (45–55). (b) B (45–45). (c) C (45–35). Note: The x-axis extent in this figure is limited to the region of vortex activity near the structure to highlight flow circulation patterns.
Water 17 02471 g012
Figure 13. Transverse mixing in the bucket with (a) 45–55 (lower tooth at a 55-degree angle, upper tooth at a 45-degree angle) teeth angles and (b) 45–45 teeth angles at the same elevation.
Water 17 02471 g013
Figure 14. Comparison of scour depth for models in group T (Ht, tailwater depth).
Water 17 02471 g014
Figure 15. Maximum scour depth in the group T models, indicating that this depth reaches a minimum within a specific range of tailwater depths (Ht, tailwater depth).
Water 17 02471 g015
Figure 16. Group T. Velocity vector in the 2-D profile of the simulation result. Note: The x-axis extent in this figure is limited to the region of vortex activity near the structure to highlight flow circulation patterns.
Water 17 02471 g016
Figure 17. Comparison of scour depth models in Group R.
Water 17 02471 g017
Figure 18. Group R. Velocity vector in the 2-D profile of the simulation result. (a) R1 (R = 9 m). (b) R2 (R = 11 m). (c) R3 (R = 13 m). Note: The x-axis extent in this figure is limited to the region of vortex activity near the structure to highlight flow circulation patterns.
Water 17 02471 g018
Table 1. Characteristics of the models.
GroupModelTeeth AngleRadiusTailwater Depth
PA45–551114
B45–45
C45–35
TT145–451113.5
T214
T315
T415.5
RR145–45914
R211
R313
Table 2. Initial conditions in the modeling case.
GroupPTR
ModelA (55–45)B (45–45)C (45–35)T1T2T3T4R1R2R3
Discharge (m3/s) 184183181180183179182178183185
Table 3. Boundary conditions cases.
BoundariesCondition
xminSpecified pressure
xmaxOutflow
yminFree slip
ymaxFree slip
zminWall
zmaxFree slip
Table 4. The corresponding boundary conditions were considered in validation with Karr’s experiments [34].
Boundary NameCondition
XminInitial discharge
XmaxSpecified pressure
YminWall
YmaxWall
ZminWall
ZmaxFree slip
Table 5. Grid independence test results: percentage error of hydraulic parameters compared with experimental data [34].
Number of CellsError of hb%Error of hs%Error of h2%Total of Error %
1 × 1058.612.210.631.4
3 × 1055.186.819.9
6 × 1054.36.34.915.5
10 × 1053.85.73.713.2
Table 6. The results of the numerical model versus laboratory data.
h 2 h b h s h b / h 1 h 2 / h 1 h s / h 1 h b / h 2 q / g h 2 1.5
Numerical (ft)2.982.773.140.370.400.420.930.04
Experimental (ft)3.002.953.350.400.410.450.980.04
Error (%)0.76.16.36.30.56.25.21.4
Table 7. Comparison of downstream roller area for different tooth angle configurations.
ModelAngle of Teeth LipsArea of Downstream Roller (m2)
A45–5598.1
B45–45165.1
C45–35112
Table 8. Effect of tailwater depth on the estimated downstream roller area.
ModelTailwater Depth (m)Area of Downstream Roller
(m2)
T113.5145
T214187
T31589.6
T415.5205
Table 9. Effect of Bucket radii on the estimated downstream roller area.
ModelBucket Radius
(m)
Area of Downstream Roller
(m2)
R19129
R211121
R313190
Disclaimer/Publisher’s Note: The statements, opinions and data contained in all publications are solely those of the individual author(s) and contributor(s) and not of MDPI and/or the editor(s). MDPI and/or the editor(s) disclaim responsibility for any injury to people or property resulting from any ideas, methods, instructions or products referred to in the content.