Article

Potential Effects of Grassland Restoration on the Water Resources in Nango-Dani, Aso, Japan

1
School of Humanities and Science, Tokai University, 9-1-1 Toroku, Higashi-ku, Kumamoto 862-8652, Japan
2
Institute of Integrated Science and Technology, Nagasaki University, 1-14 Bunkyo-machi, Nagasaki 852-8521, Japan
3
Tokai University, 2-10-2 Tomigaya, Shibuya-ku, Tokyo 151-0063, Japan
4
Division of Water Resources Engineering & Centre for Advanced Middle Eastern Studies, Lund University, Box 118, SE-221 00 Lund & Box 201, SE-221 00 Lund, Sweden
*
Author to whom correspondence should be addressed.
Water 2025, 17(16), 2466; https://doi.org/10.3390/w17162466
Submission received: 19 July 2025 / Revised: 10 August 2025 / Accepted: 15 August 2025 / Published: 20 August 2025
(This article belongs to the Section Hydrology)

Abstract

The semi-natural grasslands of the Aso Caldera, Japan, have historically played a key role in maintaining biodiversity, tourism, and water resources. However, they are now in decline due to a decrease in the number of agricultural workers and an aging workforce, as well as structural changes and stagnation in the agricultural and livestock industries. This study focused on the water resource maintenance function of grasslands by applying a water balance model to quantify the potential impact of grassland restoration on water resources in Nango-Dani, located in the southern part of the Aso Caldera. We simulated groundwater recharge, storage, spring discharge, and baseflow under multiple scenarios involving the conversion of coniferous trees to grasslands. According to the calculation results, replacing 10% of coniferous trees with grassland increased groundwater recharge by approximately 0.86 million m3. This increase is due to grasslands having a higher groundwater recharge capacity, owing to their higher canopy permeability and lower evapotranspiration. The storage volume increased by approximately 0.54 million m3, which is equivalent to the annual water usage of 6700 people. Furthermore, grassland restoration increased spring discharge and baseflow. These results quantitatively demonstrate a significant enhancement of regional water resource sustainability and provide scientific evidence to inform land-use policies.

1. Introduction

Rapid changes in land use around the world are caused by urbanization, intensive agricultural activities, deforestation, natural disasters, and changes in climate and environmental conditions. These changes manifest as variations in water resources and quality over time and space [1]. Regarding water resources specifically, changes in groundwater recharge, surface runoff, and evapotranspiration may affect the water balance. From the perspective of sustainability and socioeconomic development, it is important to understand the impact of land-use changes through scenarios of future natural vegetation recovery and human-induced landscape modification [2].
The vast grasslands surrounding the Aso Caldera in Kumamoto Prefecture, Japan, have been maintained by human activities, such as grazing, haymaking, and controlled burning, for over a thousand years. This grassland is home to a rich variety of plants, including rare species, as well as birds and insects specific to grasslands, which contribute to biodiversity conservation. The vast grasslands and pastoral areas of grazing cattle and horses are also characteristic of Aso, attracting approximately 17 million tourists per year, making them an important tourist resource. Furthermore, like the broad-leaved and coniferous forests that spread across the Aso Caldera, the grasslands of Aso allow rainwater to infiltrate into the ground. Because the amount of evapotranspiration is lower than that in forests, grasslands allow more rainwater to infiltrate into the ground [3]. According to analyses of hydrogen and oxygen stable isotopes in water, the estimated annual groundwater recharge rates for grasslands and forests are 1920 mm and 1493 mm, respectively [4]. In other words, the Aso grasslands play an important role in protecting the region’s water resources. The high permeability of pyroclastic flow deposits and the region’s abundant rainfall have also contributed to the formation of a water-rich groundwater zone that supplies water for domestic and agricultural use. Springs can be found throughout the region, and groundwater is an important water resource for the area. Furthermore, many tourists visit the region to see the springs, which significantly contribute to tourism and the local economy.
As mentioned above, the grasslands of Aso Caldera are secondary grasslands that have been artificially maintained. However, in recent years, the decline and aging of the agricultural workforce, coupled with structural changes and stagnation in the agricultural and livestock industries, have made it difficult to maintain grasslands, and their area has decreased significantly [5]. According to Amano and Iwasaki [6], the grassland area decreased from 91.6 km2 to 62.6 km2 between 1981 and 2015. Areas that were once grasslands have been afforested or have undergone natural succession and have now become forested. As mentioned earlier, forests have a lower recharge capacity than grasslands; therefore, afforestation of grasslands raises concerns regarding a decrease in groundwater recharge. Calculations showed that the total groundwater recharge decreased because of the decrease in grassland and increase in forest under certain conditions, while precipitation was maintained constant [6]. Additionally, calculations indicate that the flow rate of the Shira River, which flows through the caldera, decreased by approximately 5–10% between 1905 and 2010 owing to changes in land cover [3]. Water from the Shira River is used not only within the Aso Caldera but also for irrigating the paddy fields downstream. Therefore, its reduction will affect the water use throughout the watershed.
Based on the above, it is considered necessary to restore grasslands to utilize groundwater, spring water, and river water sustainably in the Aso Caldera in the future. However, no quantitative evaluations have been conducted to determine the extent to which grassland restoration affects water resources. Therefore, the objective of this study was to evaluate the impact of grassland restoration on water resources in the southern part of Aso Caldera (Nango-Dani), where the area of grassland has significantly decreased. Nango-Dani encompasses parts of Minamiaso Village and Takamori Town, with the former accounting for more than two-thirds of Nango-Dani. The majority of the tap water in Minamiaso Village comes from groundwater and springs. As of 31 March 2023, the population of Minamiaso Village was 9594, and the water supply coverage rate was 84.4% [7]. Therefore, as mentioned earlier, groundwater and springs are important water resources in the region. Understanding changes in water resources will provide scientific evidence for policy decisions related to land use.

2. Study Area

Aso Caldera is in central Kyushu, Japan (Figure 1). Approximately 25 km from north to south and 18 km from east to west, the caldera forms a slightly elongated oval shape. The central volcanic cone group, including the active Nakadake Volcano, which dominates the center of the caldera, extends from east to west, dividing the caldera floor into northern and southern sections. The northern part is called Aso-Dani, and the southern part is called Nango-Dani. The latter is the focus of this study.
Shimano [8] provided a detailed account of the topography and geology of the Aso Caldera; the characteristics of Nango-Dani are summarized below. The central crater hill group is slightly shifted to the south, resulting in Nango-Dani being narrower and having steeper valley walls than Aso-Dani. The southern part of Nango-Dani has complex terrain with steep valleys and ridges at elevations between 300 and 700 m, and there are cliff cones and alluvial fans at the foot of the central crater hill group and caldera walls. River terraces have also developed along the Shira River in some areas.
Figure 2a presents an overview of the geology of Nango-Dani. This map is based on the Aso Volcanic Geological Map [9], with some modifications. In the Aso Caldera, pre-Aso volcanic rocks erupted between 2.2 million and 400,000 years ago from the bedrock. This is followed by Aso pyroclastic flow deposits (Aso-1 to 4), volcanic rocks from the Central cone group, and lacustrine deposits. Terrace deposits are widely distributed along the Shira River, whereas cliff cones and alluvial fan deposits are prevalent in the foothill areas.
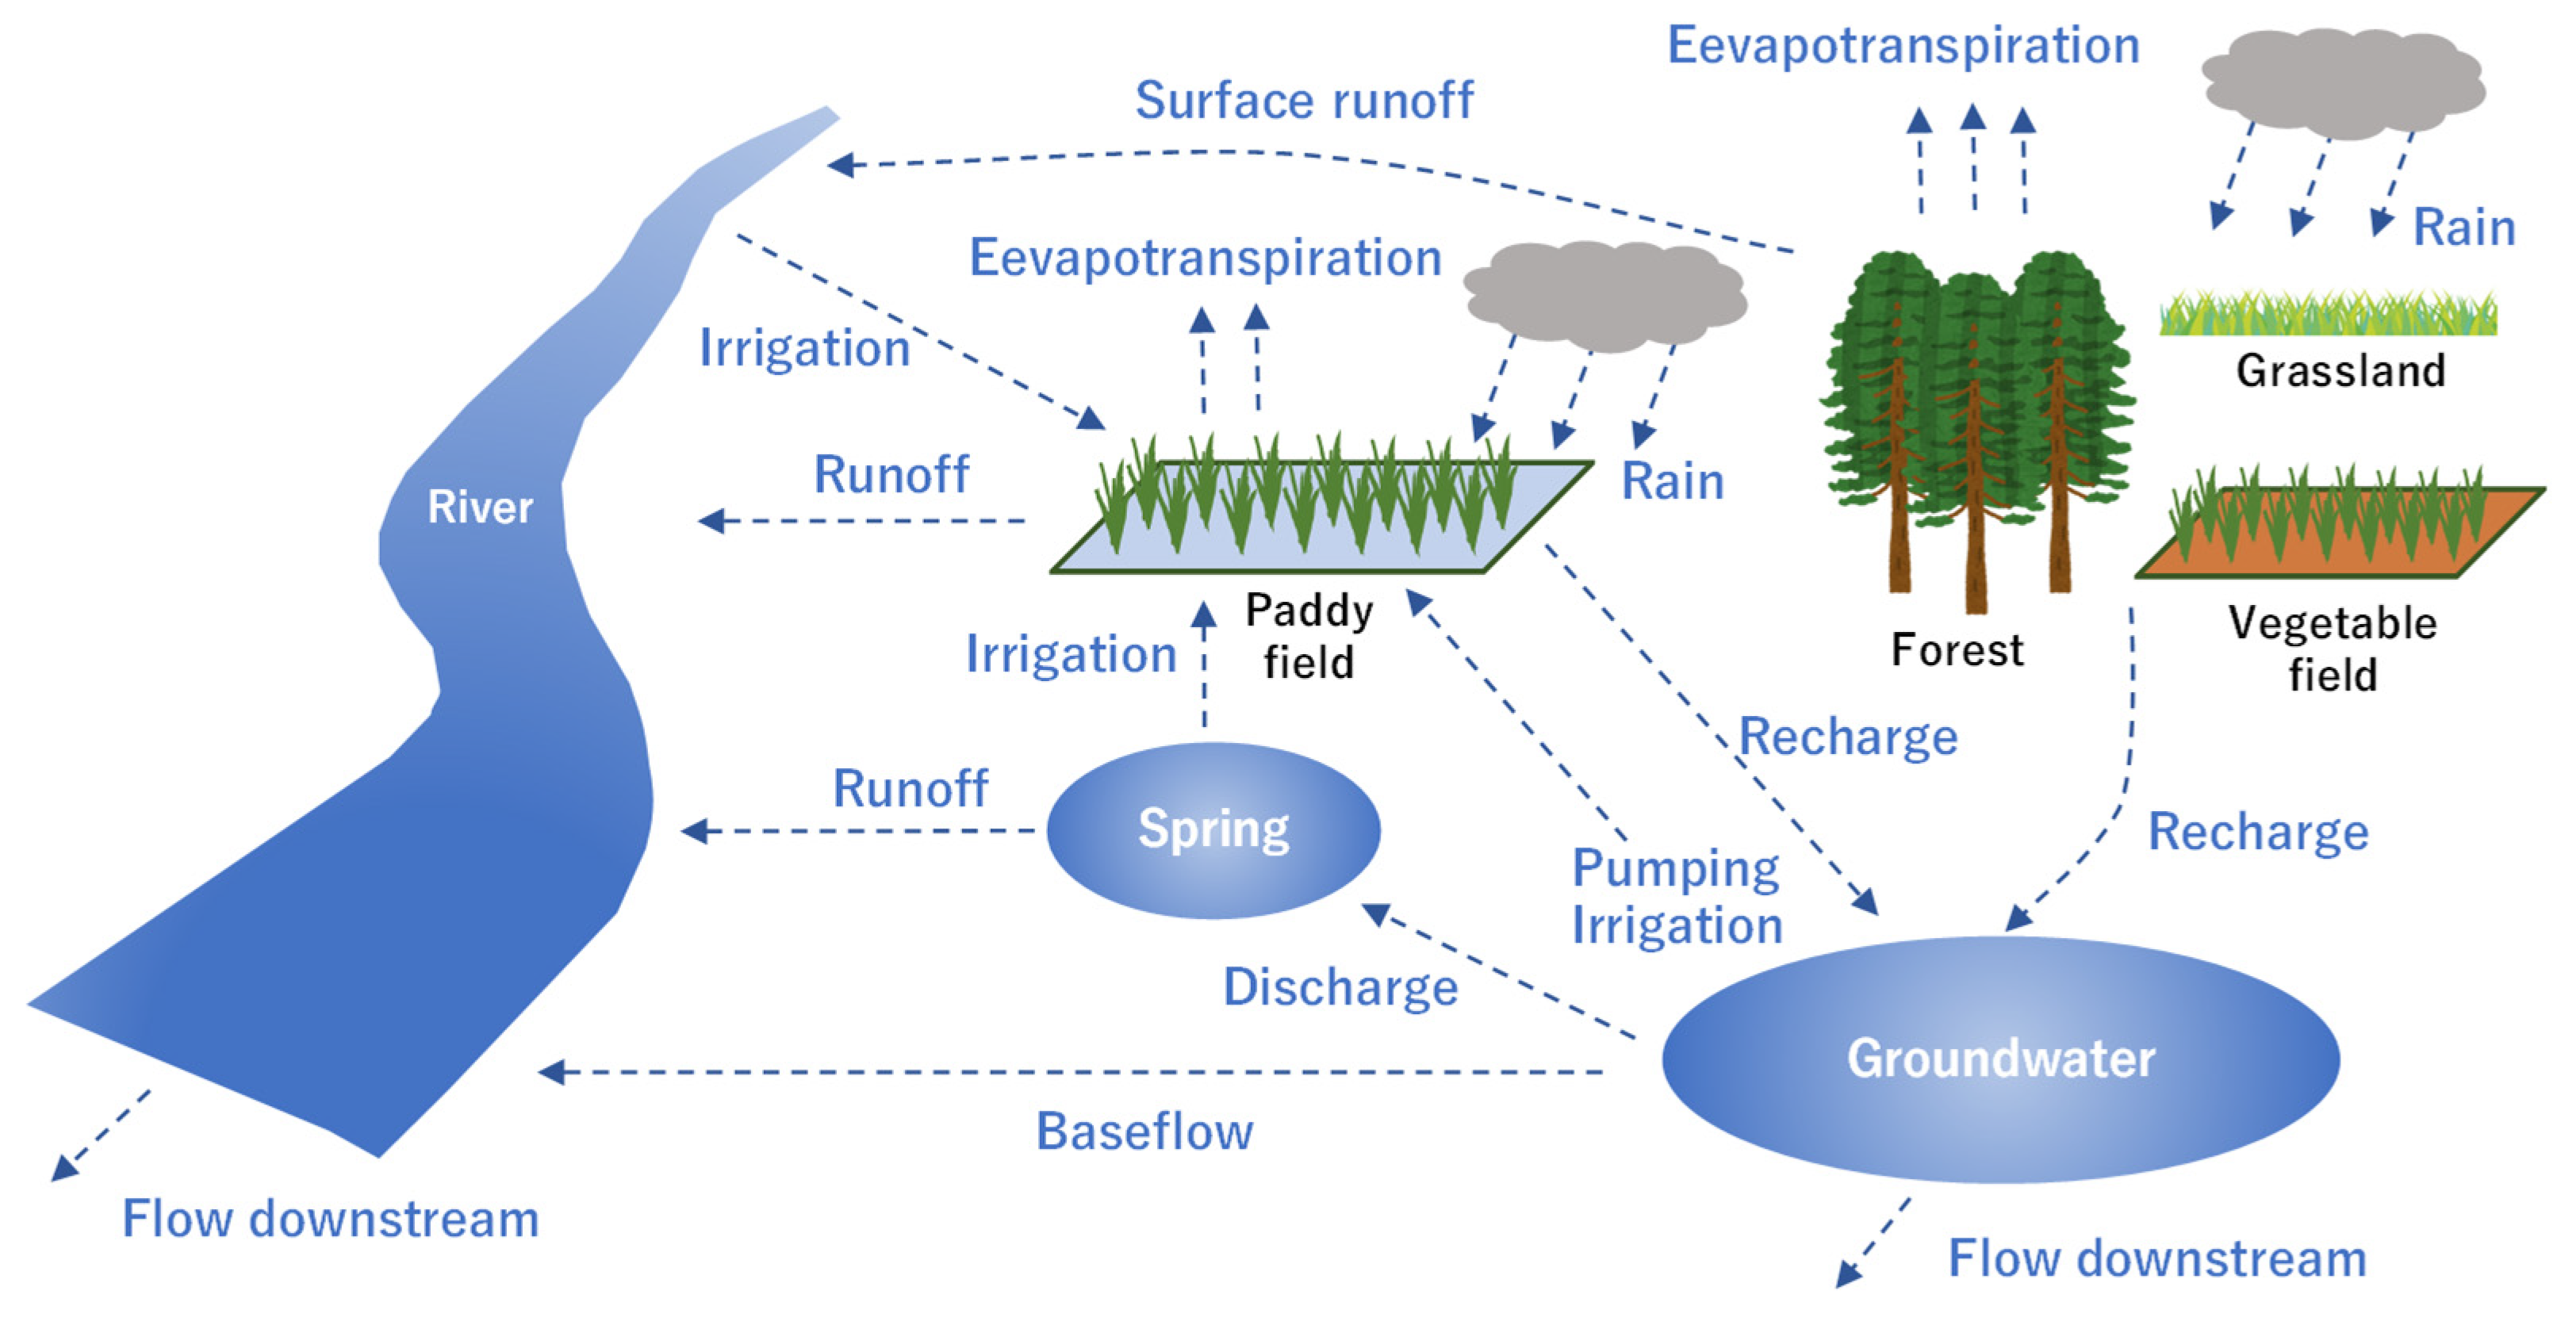
Figure 2c shows the land cover map of Nango-Dani [6]. This land cover map, created using satellite images taken from Landsat and GIS data, is a 2015 land use map. Rice paddies are widely distributed along the river at the bottom of the caldera. As elevation increases, residential areas and vegetable fields become more prevalent, and coniferous and broadleaf trees and grasslands coexist. Grasslands, forests (coniferous and broadleaf), vegetables, and paddy fields are important areas for groundwater recharge. Figure 3 shows a schematic of the water cycle in Nango-Dani. The presence of rice paddies complicates the water cycle in this region, which is also a recharge area. In rice paddy fields, water levels are maintained using groundwater, spring water, river water, or a combination of these sources. When a combination of water sources is used, the proportions of each vary greatly depending on the location.
The width of the Shira River is approximately 40 m at its widest point in the model area. In 2015, the water level of the Shira River at the river observation station (32°50′59″ N, 131°00′26″ E) at the end of the model area ranged from 0.33 to 1.60 m, with an average of 0.5 m [10]. The flow rate ranged from 4.43 to 143.0 m3/s, with an average of 10.8 m3/s [10]. The Minamiaso Weather Observatory (32°49.9′ N, 131°00.8′ E) reported that the daily air temperature ranged from −5.8 °C to 36.2 °C, with an average of 15.3 °C in 2015 [11]. The annual precipitation was 2820 mm in 2015, with monthly precipitation ranging from 50.0 mm to 810 mm. Approximately half of the annual rainfall occurs between June and August [11]. The study area is a relatively cool and rainy area within Kumamoto Prefecture.

3. Materials and Methods

3.1. Conceptual Model

In this study, we modified the water balance model specific to this region, developed by Amano et al. [12] and evaluated the impact of grassland restoration on water resources. In this model, the Shirakawa River Basin is divided into four areas, which are enclosed by red dotted lines running from upstream to downstream (Figure 4). Furthermore, each watershed is divided into three tanks: an aquifer tank containing alluvial deposits in the lowland area, a groundwater supply tank1 in the gently sloping mountainous area, and a groundwater supply tank2 in the steeply sloping mountainous area. Water balance calculations were then performed for each tank. As the calculation process below shows, each tank incorporates water exchange between paddy fields and water sources, different infiltration rates for each paddy field, and changes in spring discharge depending on the groundwater level. This represents the water cycle of the region throughout the model, as shown in Figure 3. First, in this study, we attempted to reproduce the groundwater levels and river flows for 2015. After confirming reproducibility, we evaluated the impact of grassland restoration on water resources based on the restoration patterns of grasslands described below. The area of each land-use type was calculated by aggregating the land cover maps created by Amano and Iwasaki [6] for each tank. This map has been reported to have a particularly high level of reproducibility for grassland areas compared to other land cover maps in the region. Additionally, paddy field areas were calculated using administrative statistical data (paddy field registers), and any discrepancies with the land cover map areas were adjusted using arable land areas. Meteorological data were obtained from the Minamiaso Observatory of the Japan Meteorological Agency [11].

3.2. Water Budget Calculations

3.2.1. Water Budget of Each Tank

In this model, to compare actual groundwater level measurements, the water balance of the aquifer tank and groundwater supply tank1 is expressed as follows:
Δ H × A × n e = ( Q r + Q i n Q p Q s Q b Q o u t ) × Δ t
where ΔH represents the change in water level (m) over a time interval (Δt), A is the tank area (m2), ne is the effective porosity, Qr is the groundwater recharge rate (m3/day), Qin is the groundwater inflow rate from the upstream tank (m3/day), Qp is the groundwater pumping rate (m3/day), Qs is the spring discharge rate (m3/day), Qb is the baseflow rate (m3/day), and Qout represents the groundwater outflow rate to the downstream tank (m3/day). Note that in this study, Δt was set to one day. In the steep-slope groundwater supply tank2, the change in storage volume rather than the water level is expressed as follows:
Δ S = ( Q r Q p Q s Q b Q o u t ) × Δ t
where ΔS is the change in storage volume (m3) over the time interval Δt.

3.2.2. Groundwater Inflow and Outflow Between Tanks

The inflow and outflow of groundwater between aquifer tanks, Qaq,in/out, is expressed as follows:
Q a q , i n / o u t = V × A c
where V is the Darcy velocity (m/day) and Ac is the cross-sectional flow area at the boundary of the tank (m2). The cross-sectional flow volume was calculated by determining the water level at the boundary of the aquifer tank using the hydraulic gradient obtained from the difference in water levels between adjacent aquifer tanks and the distance to the center of gravity of the tank area. This value was then substituted into the equation describing the relationship between the cross-sectional flow volume and water level, derived from the geological cross-sectional diagram [13]. The inflow and outflow rates (Qaq-t1,in/out) between the aquifer tank and groundwater supply tank1 are expressed by
Q a q t 1 , i n / o u t = k t 1 × H t × A t 1
where kt1 is the discharge coefficient, Ht is the difference in water level between the aquifer tank and groundwater supply tank1 (m), and At1 is the area of groundwater supply tank1. The inflow and outflow between groundwater recharge tanks 1 and 2 (Qt1−t2,in/out) are expressed by
Q t 1 t 2 , i n / o u t = k t 2 × S t 2
where kt2 is the discharge coefficient and St2 is the storage volume of groundwater supply tank 2.

3.2.3. Groundwater Recharge and Surface Runoff Volumes

The groundwater recharge (Qri) and surface runoff (Oi) from grasslands, coniferous trees, broadleaf trees, paddy fields during the non-irrigation season, and vegetable fields within the aquifer tank area can be expressed using the following:
Q r i = ( α i P E i ) × A i   when   I i α i P E i I i × A i                           when   I i < α i P E i
O i = ( α i P E i I i ) × A i     when   I i < α i P E i
where P is daily precipitation (m/day), Ei is daily evapotranspiration (m/day), Ii is infiltration rate (m/day), αi is canopy transmittance, Ai is area (m2), and i is land cover type. The values for canopy transmittance and infiltration capacity (water depth) are shown in Table 1 and were based on previous studies [13,14,15].
The groundwater recharge volume (Qri) from grasslands, coniferous trees, broadleaf trees, golf courses, bare land, and building sites in the sloped groundwater recharge tank area is expressed using Equation (8). The surface runoff volume (Oi), including river water, is based on the following rational formula:
Q r i = ( α i P × A i O i ) E i × A i
O i = α i P × β i × A i
where βi is the runoff coefficient. Each land cover type was set based on the Road Engineering Manual [16] (see Table 2). The canopy penetration rate was set to 1.0 for golf courses, bare land, building sites, and water bodies.
The infiltration rate in paddy fields during the irrigation period is arranged by the minimum district. Additionally, multiple types of rice paddy and whole crop silage (WCS) are cultivated in paddy fields, and their cultivation calendars differ (see Figure 5). Taking these factors into account, the volume of groundwater recharge (Qrp) from paddy fields during the irrigation period is expressed as follows:
Q r p = j = 1 k ( W j × A p j )
where Wj is the infiltration rate (m/day), Apj is the sum of the cultivated areas of food rice 1–3 and WCS (m2), j is each district, and k is the number of districts within the tank area.
Different infiltration rates were used before and after the mid-season drying period. During the mid-season drying period and intermittent irrigation, the cultivated area was halved to represent the absence of water. In this region, winter flooding occurs during periods when rice cultivation is not taking place. The groundwater recharge volume (Qrw) due to winter flooding was calculated by substituting the sum of the cultivated areas where winter flooding was conducted for Apj in Equation (10). Note that the field area data were obtained from the eMAFF Farmland Navigator [17] and the infiltration rate, which was applied before the mid-season drying period, was used. Detailed data on the implementation status of winter flooding, such as the specific dates and locations where flooding occurred, are unavailable. Therefore, records of winter flooding implementation fields obtained through on-site surveys conducted once every one–two weeks from early October 2020 to late March 2021 were applied [18].
The surface runoff volume (Oi) from paddy fields during the irrigation period is expressed as follows:
O i = ( α i P E i ) × j = 1 k A p j Q r p F     when     Q r p + F < ( α i P E i ) × j = 1 k A p j
where F is the amount of water used for plowing, which was calculated by multiplying the cultivated area by the flooded water depth (0.08 m). Only the plowing period (Figure 5) was considered.

3.2.4. Evapotranspiration

Daily evapotranspiration (Ei) (m/day) from land cover excluding grasslands, coniferous trees, and broadleaved trees was calculated using the Hamon formula [19]:
E T d = 0.1651 × L d × R H O S A T × K P E C   ( E T d = 0   when   T < 0 )
where ETd is the daily evapotranspiration (mm/day), and Ld is the daytime length (hours), which is the time from sunrise to sunset in multiples of 12 h. RHOSAT is saturated vapor density (g/m3) at the daily mean air temperature (T), where
R H O S A T = 216.7 × E S A T / ( T + 273.3 )
E S A T = 6.108 × EXP ( 17.26939 × T / ( T + 237.3 ) )
In the above equations, T is the daily mean air temperature (°C), ESAT is the saturated vapor pressure (mb) at a given T, and KPEC is the calibration coefficient, which was set to 1.2.
The daily evapotranspiration (Ei) of grasslands and forests (both coniferous and broadleaf trees) was first calculated using the Zhang model [20] to determine the annual evapotranspiration (Ea) as follows:
E a = 1 + a b / P a / 1 + a b / P a + P a / b P a
where Pa is the annual precipitation and a and b are set to 0.5 and 1100 for grasslands, and to 2 and 1410 for forests. Next, the annual evapotranspiration, calculated using the Zhang model, was allocated to each day based on the ratio of daily evapotranspiration, calculated using the Hamon formula, to the annual total.

3.2.5. Irrigation Water Volume for Rice Paddies

It is necessary to supply water to irrigation channels to compensate for infiltration and evaporation from paddy fields. However, if Equation (11) is true, this is not necessary. Thus, the volume of water C in irrigation channels can be expressed as follows:
C = γ × ( E i × j = 1 k A p j + Q r p + F )   when   Q r p + F ( α i P E i ) × j = 1 k A p j
where γ is the pumping coefficient. It was set to 1.5, based on the current situation, in which excess water from the irrigation channels flows into the river. Because the volume of irrigation water is supplied by spring water and pumped groundwater, the volume of groundwater pumped (Qp) is expressed as
Q p = C Q s   when   C > Q s
Furthermore, irrigation water was drawn from the Shira River on the left bank of its lower reaches instead of being pumped.

3.2.6. Spring Water and Baseflow Discharge

Spring discharge rates were measured at 11 springs with high discharge rates from July 2019 to March 2021. H-Q curves were created based on the groundwater levels at the observation well, as shown in Figure 4, and the discharge rates of each spring. Discharge rates (Qs) were then calculated according to the water levels in the tanks in which the observation wells were located. Additionally, the inflow volume into the Shira River was measured at 30 locations upstream of the observation station from January to March 2019, when no groundwater was pumped for irrigation, and this was given as a constant spring discharge volume (Qs). Because the baseflow discharge is indicated, the baseflow discharge volume (Qb) is expressed as follows:
Q b = δ × ( h b h r ) × A r
where δ is the river runoff coefficient, hb is the tank water level (m), hr is the elevation of the Shira riverbed (m), and Ar is the river area (m2). When the water level is lower than the riverbed elevation, groundwater recharge from the inflowing spring water is considered to occur. The amount of groundwater recharge from rivers (Qrr) was calculated by substituting hb and hr into Equation (18).

3.2.7. Model Calibration and Validation Assessment

The discharge, river runoff, and permeability coefficients and the effective porosity used in the calculations were set as initial values (see Table 3) based on previous studies [13,21,22], and then adjusted through a trial-and-error method within a reasonable range in comparison with actual measurements of 365 days in 2015 from the groundwater level observation well and river flow observation station, as shown in Figure 4. Specifically, each parameter was gradually increased or decreased simultaneously, such that the Nash–Sutcliffe (NS) coefficient described below approached 1.0. Corrections were made to ensure that the annual trends in water level fluctuations over time in each tank matched the trends in the measurements. The Kumamoto Prefectural Government installed this observation well in March 2010, and groundwater level observations began the following month. The well is 60 m deep, and the strainer is installed at a depth between 32.5 m and 54.5 m. At the time of installation, the natural water level was GL-13.3 m. The groundwater level was automatically recorded every hour using a pressure water level logger. River flow has been observed by the Ministry of Land, Infrastructure, Transport, and Tourism since April 1992. In practice, it is calculated from the relationship between the water level and flow rate (H-Q curve equation) based on the observed water level. The water level was recorded every 10 min using an electronic logger. Water level observations were conducted with a resolution of 1 cm.
The validity of the calculation results was evaluated using the Nash–Sutcliffe (NS) coefficient:
NS = i = 1 N q o i q c i 2 i = 1 N q o i q a v 2
where N is the number of calculation steps, qo(i) is the measured value at step i, qc(i) is the calculated value at step i, and qav is the average of the measured values. If NS is greater than or equal to 0.7, the model can be evaluated as having high reproducibility.

3.3. Grassland Restoration Patterns

Having confirmed the validity of this model using calculations from 2015, we evaluated the impact of grassland restoration on water resources by reducing the area of coniferous trees by the amount shown in Table 4, while simultaneously increasing the area of grasslands. For these calculations, we used the 2017 rainfall pattern, as this was the pattern that most closely matched the region’s monthly average precipitation over the past 30 years (1995–2024). Evapotranspiration was also calculated using the above method with the 2017 values applied.

4. Results and Discussion

4.1. Model Validation and Groundwater Recharge

Figure 6 shows the results of the groundwater levels and river flow rates in the tank to which the groundwater observation well was located. Examining the changes in groundwater levels revealed that the water level gradually decreased from January to June, subsequently rising until early September, before decreasing again, thus reproducing the annual trend. The NS coefficient was 0.93, indicating high reproduction accuracy. Focusing on changes over short periods of time, there were instances in which the calculated results surpassed the measured values during periods of heavy rainfall. Additionally, during the irrigation period, the water level fluctuated slightly owing to pumping effects, but these changes could not be reproduced. In this study, it was assumed that spring and river water shortages were compensated for by pumping. However, it is expected that reproduction will be possible if actual pumping data are incorporated. Examining the changes in river flow shows that the base and peak flows during rainfall are generally reproduced. The NS coefficient is 0.63, which is lower than that for groundwater, but the accuracy of reproduction is considered good. There is a tendency for calculated values to be higher than observed values during rainfall; however, this is because the model does not consider intermediate runoff [12].
Table 5 shows the volume of groundwater recharged for each land cover type in the model area. The highest recharge volume in the recharge area was approximately 96 million m3 in the paddy fields. The next highest volumes were found in broad-leaved and coniferous tree cover, at approximately 60 million m3 each. Vegetable fields have the next highest recharge volume, at approximately 57 million tons. The lowest recharge volume is in grasslands, at approximately 28 million m3. Paddy fields have the highest recharge height, followed by vegetable fields. Although paddy fields cover a smaller area than other recharge areas, their high infiltration rate and flooding period of approximately five months result in a high recharge height. The relationship between the recharge heights of grasslands, coniferous trees, and broadleaf trees is as follows: grasslands > coniferous trees > broadleaf trees. This is consistent with a previous study [4], which reported grassland > forest. The recharge height was 1469 mm for coniferous trees and 1406 mm for broadleaf trees, which is consistent with previous studies (1493 mm). Conversely, the grassland recharge height was 1513 mm, approximately 400 mm lower than the values reported in previous studies. The trunk passage rate for grasslands has been reported to vary considerably [23]. In this study, we applied an average canopy transmittance of 0.91 (see Table 1), but it is estimated that rainfall actually passes through the canopy at a higher rate.

4.2. Potential Effects of Grassland Restoration

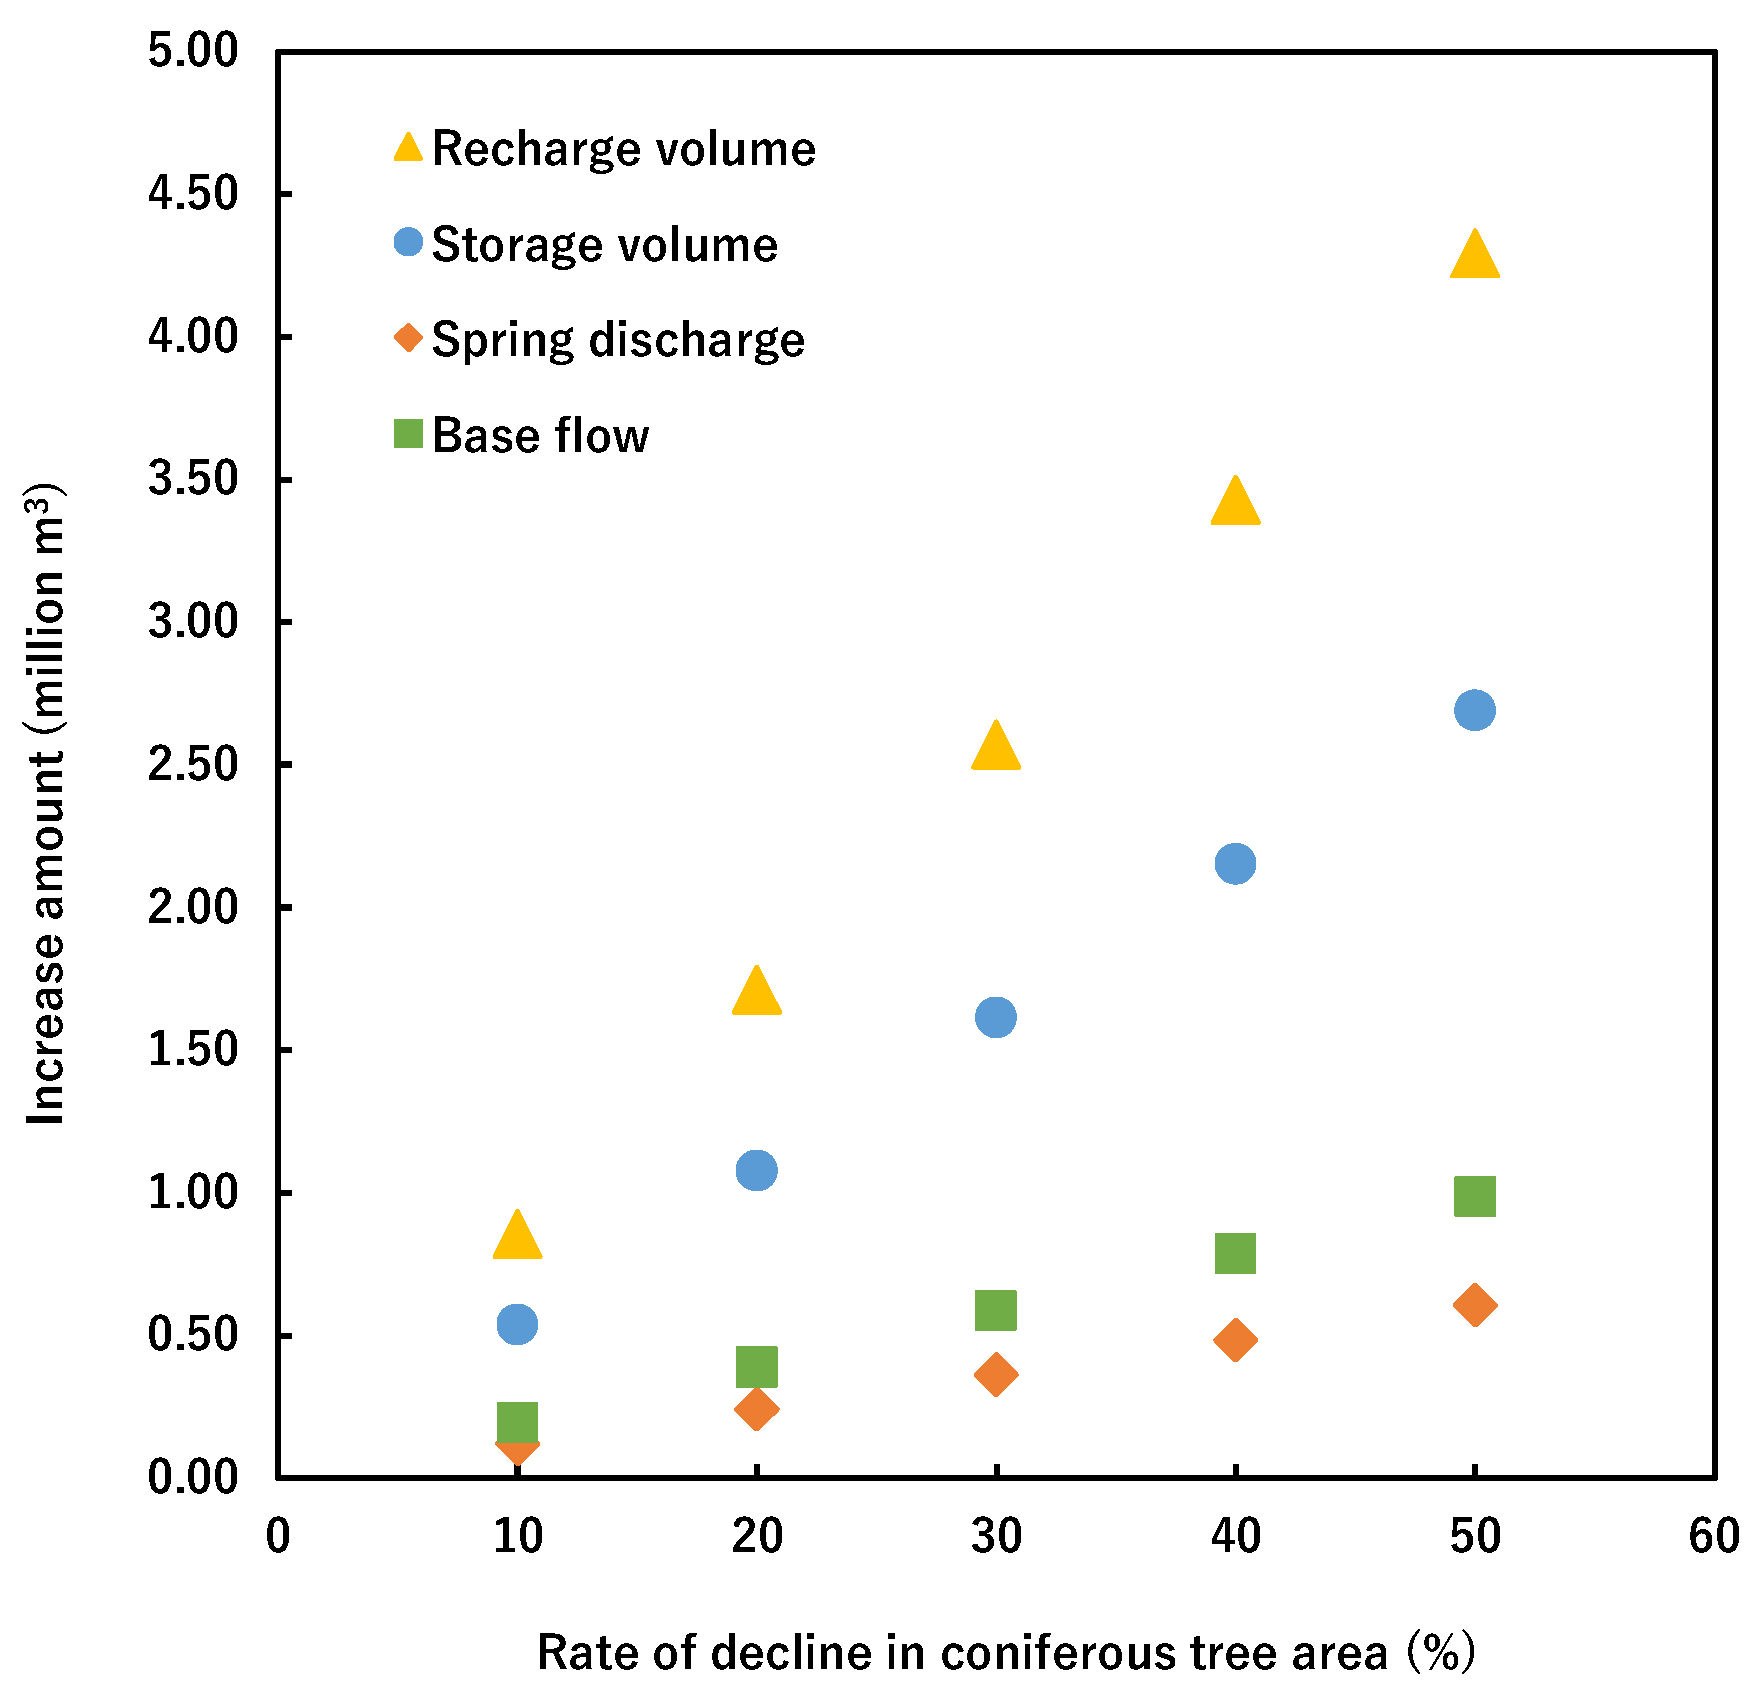
Figure 7 shows the effects of grassland restoration (reduction in coniferous trees) on water resources. As expected, replacing coniferous trees with grasslands increased water resources. It was estimated that for every 10% of coniferous trees converted into grassland, the recharge volume would increase by 0.86 million m3, the groundwater storage volume by 0.54 million m3, the spring discharge by 0.12 million m3 and the base flow by 0.19 million m3. As shown in Table 4, the recharge height was higher in grasslands than in coniferous trees. Therefore, it is logical that groundwater recharge increases as the area of coniferous trees decreases and the area of grassland increases. This is because grasslands have lower evapotranspiration rates and higher canopy transmittance than coniferous trees. Focusing on the increase in water resources, groundwater storage in particular increases significantly as grasslands are restored, with an increase of around 3.0 million m3 being reached when the area of coniferous forest decreases by 50%. Spring discharge and baseflow also showed an increasing trend, but not as significant as storage. In other words, approximately 63% of the increased groundwater recharge volume is allocated to storage, around 14% to spring water volume, and around 23% to baseflow. In this model, the spring discharge is calculated based on the relationship between the groundwater level and spring discharge (H-Q curve). However, as previously mentioned, this curve only applies to springs with a particularly high spring discharge. For the remaining 30 locations, it is predicted that the spring discharge will increase in line with the groundwater storage volume (groundwater level).
We considered the water usage of residents in Minamiaso Village, which covers most of the model area. In 2024, the daily water consumption per person in Kumamoto City, which is in the lower reaches of the Shira River, was approximately 0.22 tons [23]. We use data from Kumamoto City because data for Minamiaso Village are unavailable. Over the course of a year (365 days), this amounts to approximately 80.3 m3. As mentioned above, converting 10% of the coniferous forest area into grassland would increase the storage capacity by 0.54 million m3. This is equivalent to the annual water usage of approximately 6700 people. As of 30 June 2025, the population of Minamiaso Village (including areas outside the calculation region) was 9949 [24]. Thus, the increase in water storage capacity would meet the annual water needs of approximately 67% of the local population. Converting 20% of the coniferous forest to grassland would result in an increase in water storage capacity that exceeds the annual usage, which highlights the importance of grassland restoration in this region.

5. Conclusions

This study used a water balance model to provide quantitative evidence of how grassland restoration improves water resources in the Nango-Dani region of Aso Caldera in Japan. The NS coefficients for the groundwater level and river flow, as obtained from the model, were 0.93 and 0.63, respectively, and these values successfully reproduced the water cycle in the region. We conducted simulations using this model, replacing 10% to 50% of coniferous trees with grasslands. The results showed that replacing 10% of the forest with grassland increased groundwater recharge by 0.86 million m3. This is primarily because grasslands have higher canopy permeability and lower evapotranspiration rates than forests. Additionally, groundwater storage increased by 0.54 million m3, equivalent to the annual water consumption of around 6700 residents. Furthermore, the spring discharge and baseflow also increased, indicating an improvement in the overall water cycle. These results highlight the significant hydrological functions of semi-natural grasslands and emphasize their importance in regional sustainability strategies. Given that changes in land use impact water resource availability globally, incorporating grassland restoration into land management policies could enhance water resource security, biodiversity conservation, economic activity through tourism, and climate change adaptation resilience in regions such as Aso.

Author Contributions

Conceptualization, H.A. and T.I.; methodology, H.A.; validation, H.A. and T.I.; formal analysis, H.A. and T.I.; investigation, H.A., T.I. and K.N.; writing—original draft preparation, H.A., K.N. and R.B.; writing—review and editing, K.N. and R.B.; visualization, H.A.; supervision, T.I. and K.N.; project administration, T.I.; funding acquisition, T.I. All authors have read and agreed to the published version of the manuscript.

Funding

This research was supported by the Environment Research and Technology Development Fund (JPMEERF19S20504) of the Environmental Restoration and Conservation Agency, provided by the Ministry of the Environment of Japan.

Data Availability Statement

Data are contained within the article.

Conflicts of Interest

The authors declare no conflicts of interest.

References

  1. Jha, M.K. Impacts of Landscape Changes on Water Resources. Water 2020, 12, 2244. [Google Scholar] [CrossRef]
  2. Martins, M.S.d.M.; Valera, C.A.; Zanata, M.; Santos, R.M.B.; Abdala, V.L.; Pacheco, F.A.L.; Fernandes, L.F.S.; Pissarra, T.C.T. Potential Impacts of Land Use Changes on Water Resources in a Tropical Headwater Catchment. Water 2021, 13, 3249. [Google Scholar] [CrossRef]
  3. Azo Grassland Restoration Council. Aso Grasslands for the Future, 2nd ed.; Ministry of the Environment: Kumamoto, Japan, 2014; 60p.
  4. Kudo, K.; Shimada, J.; Maruyama, A.; Tanaka, N. The quantitative evaluation of groundwater recharge rate using Displacement Flow Model with stable isotope ratio in the soil water of difference vegetation cover. J. Groundw. Hydrol. 2016, 58, 21–45. [Google Scholar] [CrossRef]
  5. Takahashi, Y. Conservation and restoration of grassland landscape by collaborative management: A case of Aso Grassland. Landsc. Ecol. Manag. 2009, 14, 5–14. [Google Scholar] [CrossRef]
  6. Amano, H.; Iwasaki, Y. Land Cover Classification by Integrating NDVI Time Series and GIS Data to Evaluate Water Circulation in Aso Caldera, Japan. Int. J. Environ. Res. Public Health 2020, 17, 6605. [Google Scholar] [CrossRef] [PubMed]
  7. Kumamoto Prefecture; Water Supply in Kumamoto Prefecture. Available online: https://www.pref.kumamoto.jp/soshiki/51/220285.html (accessed on 9 August 2025).
  8. Shimano, Y. Hydro-chemical study of spring water in the Aso caldera, central Kyushu. Bunsei Bull 1997, 8, 43–67. [Google Scholar]
  9. Ono, K.; Watanabe, K. Geological map of Aso volcano 1:50,000. In Geological Map of Volcanos; Geological Survey of Japan: Ibaraki, Japan, 1985; No. 4; Available online: https://www.gsj.jp/Map/JP/volcano.html (accessed on 4 July 2025).
  10. Ministry of Land, Infrastructure, Transport and Tourism; Water Information System. Available online: https://www1.river.go.jp/cgi-bin/SiteInfo.exe?ID=309091289912015 (accessed on 9 August 2025).
  11. Japan Meteorological Agency. Historical Weather Data. Available online: https://www.data.jma.go.jp/stats/etrn/index.php?prec_no=86&block_no=1660&year=&month=&day=&view= (accessed on 4 July 2025).
  12. Amano, H.; Ichikawa, T.; Nakagawa, K. Assessment of impact of Kumamoto earthquake in Aso Nangou-Dani using water budget simulation. J. Jpn. Soc. Civ. Eng. Ser. B1 (Hydraul. Eng.) 2021, 2, I_133–I_138. [Google Scholar] [CrossRef] [PubMed]
  13. Kokusai Kogyo Co., Ltd. FY2014 Groundwater Survey Report for the Nango-Dani Region and Surrounding Areas; Kokusai Kogyo Co., Ltd.: Tokyo, Japan, 2015; 94p. [Google Scholar]
  14. Hattori, S.; Abe, T. Characteristic of Canopy Interception in a Bamboo Stand. Water Sci. 1989, 33, 34–53. [Google Scholar]
  15. Yoshi, T. Infiltration and Recharge Characteristics of Forests and Vegetable Fields in the Takayubaru Plateau, Kumamoto. Master’s Thesis, Tokai University, Kumamoto, Japan, 2009. [Google Scholar]
  16. Japan Road Association. Guidelines for Road Earthworks, 2009th ed.; Maruzen: Tokyo, Japan, 2009; 450p. [Google Scholar]
  17. Ministry of Agriculture, Forestry and Fisheries. eMAFF Farmland Information System. Available online: https://map.maff.go.jp/ (accessed on 9 July 2025).
  18. Amano, H.; Ichikawa, T. Quantitative Assessment of Groundwater Recharge Amount by Winter Flooding in Minamiaso Village, Kumamoto Prefecture. Bull. Sch. Humanit. Sci. Tokai Univ. 2022, 1, 18–23. [Google Scholar]
  19. Lu, J.; Sun, G.; McNulty, S.G.; Amatya, D.M. A comparison of six potential evapotranspiration methods for regional use in the Southeastern United States. J. Am. Water Resour. Assoc. 2005, 41, 621–633. [Google Scholar] [CrossRef]
  20. Zhang, L.; Dawes, W.R.; Walker, G.R. Response of mean annual evapotranspiration to vegetation changes at catchment scale. Water Resour. Res. 2001, 37, 701–708. [Google Scholar]
  21. Asia Air Survey Co., Ltd. FY2012 Survey Report on the Impact of Grassland Afforestation on River Discharge in the Aso Region; Asia Air Survey Co., Ltd.: Tokyo, Japan, 2013; 103p. [Google Scholar]
  22. Japan Society of Civil Engineers Committee on Hydraulics; Subcommittee for the Revision of the Hydraulic Formula Handbook. Hydraulic Formula Handbook, 1999th ed.; Maruzen: Tokyo, Japan, 1999; pp. 339–357. [Google Scholar]
  23. Kumamoto City: Environment in Kumamoto City. Available online: https://www.city.kumamoto.jp/kankyo/kiji00320533/index.html (accessed on 14 July 2025).
  24. Minamiaso Village. The Number of Population and Households. Available online: https://www.vill.minamiaso.lg.jp/kiji003739/index.html (accessed on 14 July 2025).
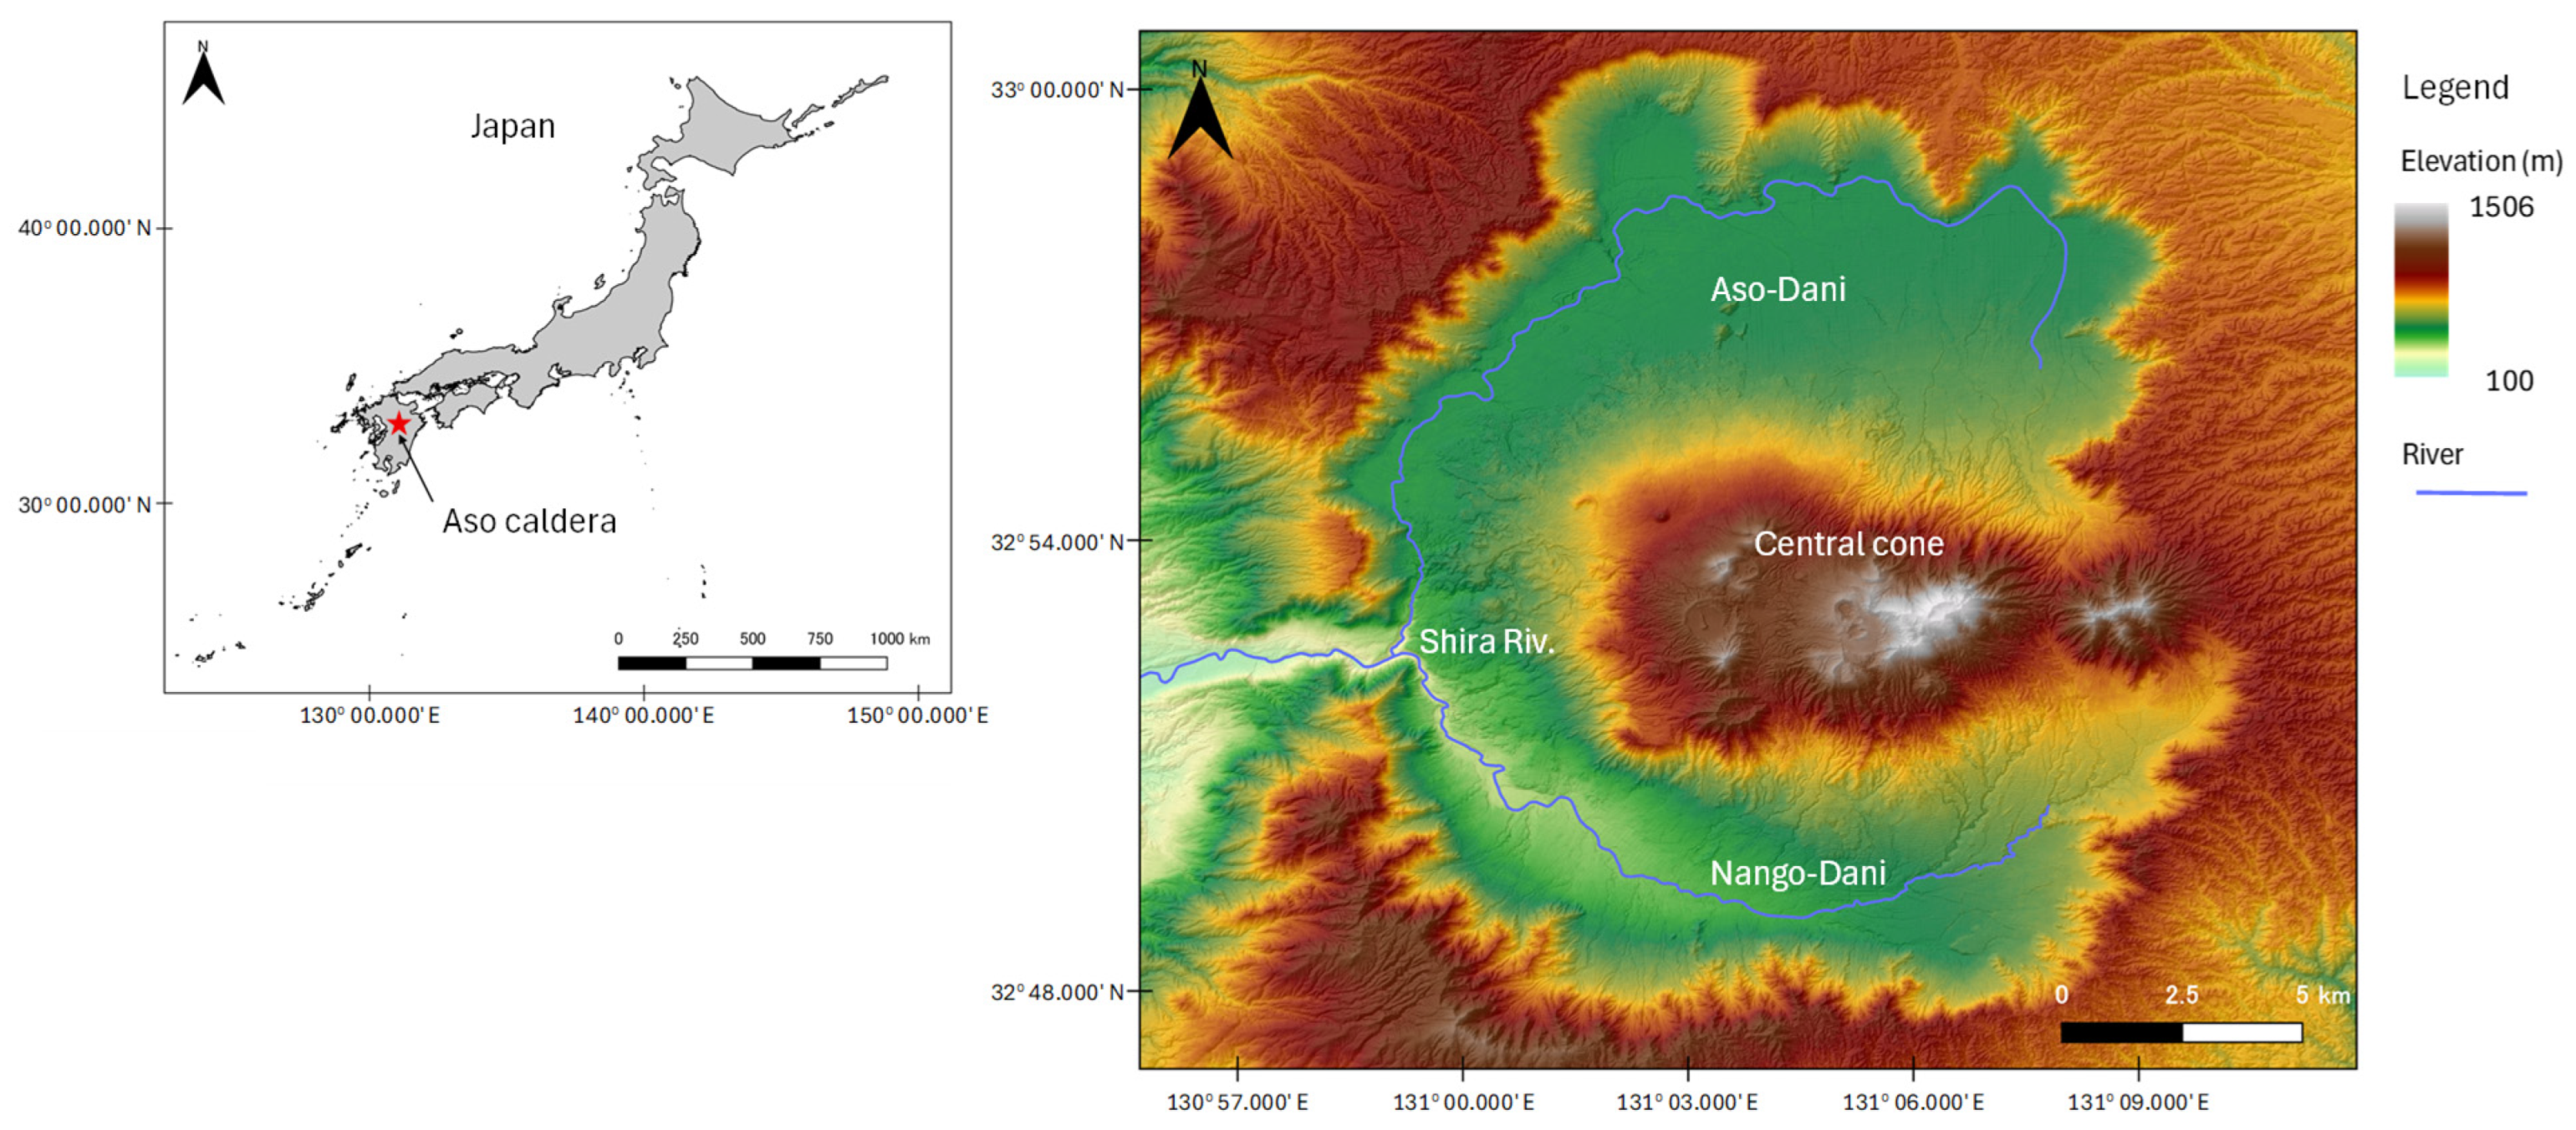
Figure 1. The location of Aso Caldera in Japan.
Water 17 02466 g001
Figure 2. Characteristics of hydrogeology and land cover: (a) geological map, (b) contour map of groundwater level, and (c) land cover map. The areas enclosed by the red lines in the figure denote the computational domain. Figure 2b shows a contour map of the groundwater levels. It is thought that the groundwater replenished in the central cone group and outer rim mountains is concentrated at the bottom of the caldera and flows downstream. It is also presumed that groundwater flows out of the caldera through cracks in the lava and along the boundaries between the layers of lava.
Water 17 02466 g002
Figure 3. Schematic of the water cycle in the study area.
Water 17 02466 g003
Figure 4. Computational domain for water balance calculations.
Water 17 02466 g004
Figure 5. Cultivation calendar for table rice and WCS. This figure is a modified version of the figure by Amano et al. [12]. The figure is a copyrighted work of the Japan Society of Civil Engineers.
Water 17 02466 g005
Figure 6. Calculated (a) groundwater level and (b) river discharge.
Water 17 02466 g006
Figure 7. Increase in available water resources due to grassland restoration.
Water 17 02466 g007
Table 1. Canopy transmittance coefficient and infiltration capacity (m/day).
GrasslandConiferous TreeBroadleaf TreePaddy FieldVegetable Field
α0.910.800.851.001.00
I2.43.04.70.029~0.0861.2
Table 2. Runoff coefficient by land cover type.
Grassland
Coniferous Tree
Broadleaf Tree
(Tank1)
Grassland
Coniferous Tree
Broadleaf Tree
(Tank2)
Golf CourseBare Land
Building
Water Body
β0.20.40.30.951.0
Table 3. Initial and calibrated hydraulic parameters.
Permeability
Coefficient
(m/s)
Discharge
Coefficient
kt1
Discharge
Coefficient
kt2
Runoff
Coefficient
δ
Effective
Porosity
Initial value2.10 × 10−5
~6.30 × 10⁻⁴
2.0 × 10−30.10.020.20
Calibrated value5.00 × 10−5
~7.85 × 10⁻³
4.5 × 10⁻⁴
~8.0 × 10⁻⁴
0.250.070.25
Table 4. Rate of decline in coniferous tree area.
Case-0Case-1Case-2Case-3Case-4Case-5
%01020304050
Table 5. Annual groundwater recharge volume from each land-cover area.
GrasslandPaddy FieldVegetable FieldBroadleaf TreesConiferous TreesBare LandBuildingsGolf CourseWater BodyTotal
Area (km2)18.611.620.942.841.45.37.70.40.9149.6
Recharge volume
(million m3)
28.295.856.960.160.80.71.00.91.9306.2
Recharge height (mm)15138248272814061469127127196121972047
% of total
recharge
9.231.318.619.819.60.20.30.30.6100.0
Disclaimer/Publisher’s Note: The statements, opinions and data contained in all publications are solely those of the individual author(s) and contributor(s) and not of MDPI and/or the editor(s). MDPI and/or the editor(s) disclaim responsibility for any injury to people or property resulting from any ideas, methods, instructions or products referred to in the content.