Article

Designing the Engineering Parameters of the Sea Ice Based on a Refined Grid in the Southern Bohai Sea

1
North China Sea Marine Forecasting Center of State Oceanic Administration, Qingdao 266000, China
2
Shandong Key Laboratory of Marine Ecological Environment and Disaster Prevention and Mitigation, Qingdao 266000, China
3
Shengli Oilfield Company, China Petroleum & Chemical Corporation, Dongying 257001, China
4
State Key Laboratory of Coastal and Offshore Engineering, Dalian University of Technology, Dalian 116024, China
*
Authors to whom correspondence should be addressed.
Water 2025, 17(16), 2465; https://doi.org/10.3390/w17162465
Submission received: 24 June 2025 / Revised: 6 August 2025 / Accepted: 18 August 2025 / Published: 20 August 2025

Abstract

The current standard for sea ice engineering in the Bohai Sea implements a 1/4° grid method, which cannot satisfy the safety of oil and gas activities in the southern Bohai Sea, and therefore more detailed information on ice conditions and a more refined ice zone division are necessary. In the present study, up to 1/12° resolution sea ice characteristic data (period, thickness, concentration, and strength) were obtained based on the NEMO-LIM2 ice–ocean coupling model. On this basis, the design sea ice strength parameters were derived with different return periods from 1 to 100 years. Among the total of 53 grids, the mean ice periods in the southern Bohai Sea from 1951 to 2022 were 2–35 days, the mean ice concentration values were 8.3–64.6%, and the mean ice thicknesses were 2–15 cm. The design uniaxial compressive strengths and shear strengths at almost all grids exceeded 2.00 MPa and 1.00 MPa for return periods over 20 years, respectively. The design flexural strengths for the 100-year return period ranged from 463 to 594 kPa. For the 100-year return period scenario, all grids exhibited design tensile strengths exceeding 200 kPa. Across the southern Bohai Sea, the most severe ice conditions occur in nearshore zones, and the ice conditions display a distinct spatial gradient with Bohai Bay > offshore deep-water areas > Laizhou Bay. The mean ice thickness, concentration, design flexural and tensile strengths derived in this study were lower compared to the ice parameters suggested in the current standard, and design uniaxial compressive and shear strengths derived here were comparable to those suggested in the current standard. The refined grid used here captures more detailed spatial variations in the design strength values of sea ice engineering parameters in the southern Bohai Sea, providing more accurate data support for the anti-ice design of marine structures.

1. Introduction

The Bohai Sea serves as a critical industrial zone in China, supporting dense concentrations of infrastructure for maritime transportation, petroleum operations, and power generation. Located at relatively high latitudes, the region experiences frequent winter incursions of cold air masses, triggering annual ice formation. Recent intensification of extreme climate events, combined with rapid coastal development of ports and oilfields, has significantly altered the sea ice spatiotemporal distribution.
For offshore structures operating in ice-covered waters, understanding the mechanical properties of sea ice is essential for evaluating ice loads and ensuring structural safety [1]. Ice–structure interactions depend strongly on the ice strength and failure behavior, which vary with temperature, salinity, and internal structure of ice [2]. Early research by Li et al. provided a foundational overview of Bohai Sea ice mechanical properties, summarizing long-term observational data to define key design parameters such as strength values and recurrence intervals [3]. Since then, a range of mechanical properties, including uniaxial compressive, flexural, tensile, and shear strength, have been systematically investigated through both laboratory and in situ experiments. Ji et al. conducted flexural and shear experiments across Bohai coastal sites, revealing rate-dependent and brine volume-related strength degradation [4,5]. Uniaxial compressive strength was comprehensively investigated by Wang et al., who conducted over 400 tests across 12 Bohai coastal sites, establishing empirical relationships with temperature, brine volume, and stress rate [6]. In response to climate-induced changes in sea ice formation, particularly increased air content within sea ice, porosity has recently emerged as a critical internal factor in strength modeling [7]. Li et al. proposed a three-dimensional framework linking uniaxial compressive strength with sea ice porosity and strain rate [8]. Chen et al. used Brazilian splitting tests with digital image correlation to assess tensile strength in Bohai Sea ice, finding a clear negative correlation of sea ice tensile strength with porosity [9]. However, these experimental studies were conducted at relatively isolated sites. Although they provided valuable insights into the intrinsic mechanical behavior of sea ice, they have not been systematically linked to large-scale spatial patterns or regional ocean–atmosphere conditions in the Bohai Sea.
With continuous advancements in remote sensing monitoring and numerical modeling, research on the distribution and seasonal evolution of sea ice in the Bohai Sea has become increasingly refined. Sun et al. integrated multi-source datasets, including AVHRR, MODIS, and GOCI, to systematically analyze sea ice area and thickness across major sub-regions in the Bohai Sea over the past 30 years [10]. Their results highlighted the dominant role of Liaodong Bay in regional ice formation and demonstrated strong correlations between ice conditions and cumulative freezing/melting degree days. Yan et al. reported a slight upward trend (~1.38% yr−1) in Bohai Sea ice area from 1988 to 2015, contrary to the general decline observed in polar regions [11]. Ouyang et al. found strong negative correlations between mean ice thickness and mean air temperature, and between median ice extent and negative accumulated temperature in the Bohai Sea [12]. Yan et al. used a multivariate regression approach to extend sea ice area reconstruction to 1958–2015 [13]. Based on long-term sea ice severity data, Zheng et al. revealed a regime shift from heavy to light ice conditions of the Bohai Sea [14]. Most existing studies concentrate on the variations in ice thickness and area, and there remains a lack of distribution of sea ice strength data for engineering applications.
Marine structures in ice-covered waters require information on key ice parameters (e.g., thickness, period, strength) in planning, design, and construction. Current Bohai Sea ice engineering applications derive design ice thickness and strength primarily from the guideline of “Sea Ice Conditions and Application Regulations for China Seas” issued by the China National Offshore Oil Corporation (CNOOC) in 2002 [15]. Over the past two decades, significant alterations in the spatiotemporal distribution of sea ice in the Bohai Sea have probably emerged, driven by extensive coastal development with consequent shoreline modifications and amplified climate change effects. With numerous platforms approaching service-life limits, new constructions and replacements demand urgent attention. This necessitates precise regional assessment of engineering ice parameters across oil and gas development zones, establishing partition-specific design criteria for ice loads. Such refinement ensures winter operational safety and optimizing structural costs in Bohai ice management strategies.
To support the design of offshore infrastructure in ice-covered waters of the Bohai Sea with high spatial resolution, previous work partitioned the region into a refined 1/12° grid and derived key sea ice parameters, including ice period, thickness, concentration, temperature, and salinity [16]. However, the grid-level sea ice strength data remains unavailable. Indeed, the lack of gridded sea ice strength data extends beyond the Bohai Sea to the Arctic Ocean, obscuring the spatiotemporal evolution of Arctic sea ice strength and complicating engineering design for Arctic offshore structures. Arctic sea ice strength exhibits significant seasonal variability. Sea ice strength is typically obtained by field and experiment measurements. Based on numerous mechanical tests, scholars have proposed influencing factors and empirical relationships for sea ice strength [17,18,19]. In recent years, researchers have attempted to investigate the spatiotemporal distribution of sea ice flexural strength across the Arctic Ocean. Chai et al. utilized freezing degree-days to derive ice thickness and thermohaline properties, subsequently applying empirical formulae to assess the statistical characteristics of level-ice flexural strength at four critical locations along the Northeast Passage during winter [20]. Tarovik et al. integrated meteorological, hydrological, and sea ice thermodynamic data to estimate brine volume fraction and flexural strength, evaluating spatiotemporal distributions across nine Arctic sea areas along the Northeast Passage route [21]. These studies of Arctic ice gridded strength provide valuable scientific references for developing analogous gridded sea ice strength models in the Bohai Sea.
Building on previous work [16], the present study addresses the impacts of climate change on engineering in the Bohai Sea ice zone and provides gridded sea ice mechanical parameters for the region. Focusing specifically on the southern Bohai Sea, where critical infrastructure like the Shengli Oilfield is located, the key engineering parameters of sea ice are derived including flexural strength, uniaxial compressive strength, shear strength, and tensile strength. Crucially, actionable design benchmarks for ice mechanical properties are also established here, advancing the research toward direct engineering implementation.

2. Materials and Methods

2.1. Study Area

The Bohai Sea (37°70–41°00 N, 117°35–121°10 E), situated in the mid-latitude monsoon zone of the Northern Hemisphere, represents a semi-enclosed inland sea extending northwestward from the Yellow Sea. Ice formation in the Bohai Sea initiates in late November to early December, progressing southward from shallow coastal zones to deeper offshore areas. The ablation phase commences in mid-to-late February with northward retreat from deep southern basins to shallow northern coasts, culminating in complete ice clearance by mid-March, yielding a 3–4-month ice season.
The southern Bohai Sea (Bohai Bay and Laizhou Bay) hosts numerous offshore oil and gas platforms, notably within the Shengli Oilfield operational waters. To ensure the safety of the platforms during ice season, CNOOC guidelines partition the southern Bohai Sea into sub-grids with assigned design ice parameters [15]. However, the standardized grid system, originally developed for pan-Bohai Sea ice conditions, proves inadequate for the Shengli Oilfield waters due to its insufficient resolution for local operational demands. Our study implements a multi-criteria grid refinement scheme (Figure 1) tailored to the critical area. Deep-water zones (grids 1–6, 47, 51) maintain quarter-degree (1/4° × 1/4°) grids aligned with the current guideline. Nearshore shallow waters (grids 7–14, 43–50, 52–53) adopt 1/12° resolution, with adjacent grids merged based on spatial homogeneity in hydrological and ice regime characteristics. High-priority operation areas implement non-merged 1/12° grids to preserve critical spatial details (grids 15–42). The relevant results of ice condition characteristics in the southern Bohai Sea will be presented based on this new ice zone division hereafter.

2.2. Sea Ice Concentration, Thickness, and Duration

Sea ice concentration, level ice thickness, and sea ice duration were derived based on the NEMO-LIM2 ice–ocean coupling model. The model was generated here to provide detailed information on the ice characteristics in the Bohai Sea from 1951 to 2022 with a refined ice zone division [16]. The model domain is located in a spatial range of 35–41° N, 117–127° E, covering the entire Bohai Sea with a spatial resolution of 1/12°. The topographic data in the NEMO model uses the ETOPO1 public data set, with a spatial resolution of 1 km, which is interpolated into the NEMO model grid through bilinear interpolation. The ice–ocean coupling model can finely simulate the ocean and sea ice environments near complex islands and shorelines.
It should be stated that compared to LIM2 model, LIM3 model employs a five-category ice thickness scheme, which aims to improve performance in high-latitude ice-covered regions by better representing ice thickness heterogeneity [22]. However, the Bohai Sea represents the lowest-latitude ice-covered region in the Northern Hemisphere. All sea ice here is first-year ice, and ice thickness rarely exceeds 0.5 m. Consequently, the complex ice thickness categorization scheme of LIM3 cannot be fully utilized in the Bohai Sea.

2.3. Sea Ice Strength

Currently, there are no theoretical formulae for calculating sea ice strength; existing formulae are empirical. These empirical equations are in simple forms but exhibit direct physical meaning, clearly indicating that sea ice strength is directly related to specific ice parameters. To guide oil and gas production operations in ice-covered regions of the Bohai Sea, the CNOOC guideline provides recommended methodologies for calculating sea ice load parameters in the Bohai Sea [15]. The sea ice uniaxial compressive strength, flexural strength, shear strength, and tensile strength were calculated here based on the regulation.
The sea ice uniaxial compressive strength was determined using Equation (1).
σ c = 1.77 0.13 T i
where Ti is sea ice temperature (°C), and σc is maximum uniaxial compressive strength of level ice loaded horizontally to ice surface (MPa).
The sea ice shear strength was determined using Equation (2).
τ = σ c 2
where τ is sea ice shear strength (MPa).
The sea ice flexural strength was determined using Equation (3).
σ f = 340 64 T i
where σf is sea ice flexural strength (kPa).
The sea ice tensile strength was determined using Equation (4).
σ t = 95 + 50 T i
where σt is sea ice tensile strength (kPa).
As shown in Equations (1)–(4), sea ice temperature is a key parameter to determine sea ice strength. In the CNOOC regulation [15], according to the characteristics of sea ice in the Bohai Sea, the ice temperature was determined using Equation (5).
T i = ( T ia + T iw ) / 2 273.15
where Tia and Tiw are sea ice temperatures (K) at the top and bottom surfaces of the ice cover determined by Equations (6) and (7).
T ia = λ ( 1.4 T a ) 4.7 + T a
T iw = 1.4 λ ( 1.4 T a ) 125
where λ is thermal conductivity coefficient of sea ice (kJm−2·h−1·K−1) determined using Equation (8), Ta is air temperature (K). Ta was adopted from Climate Forecast System Reanalysis data issued from the National Centers for Environmental Prediction (NCEP).
λ = 0.221 + H 2 1
where H is ice thickness (m).

2.4. Sensitivity Analysis

The primary inputs of NEMO-LIM2 model include shortwave/longwave radiation, 2 m air temperature, 2 m humidity, 10 m wind fields, and precipitation. Comprehensive sensitivity tests have been performed in the previous work of [23]. Through observational comparisons, sea ice thermodynamic and dynamic parameters were calibrated to ensure model stability and applicability in the Bohai Sea. Sea ice strength values were calculated using standardized formulae recommended by established specifications. As these represent fundamental principles rather than adjustable parameters, sensitivity analysis would not yield meaningful insights.

2.5. Model Verification

The details on the configuration of the model were reported in the previous work [16]. Comparisons between observed and simulated sea ice thickness and duration showed high accuracy of the model. The correlation coefficient between the hindcasting sea ice thickness and observations was above 0.60, with an absolute error of less than 4.0 cm. The hindcasting data could better reflect the distribution of ice periods in mild and severe ice years. Sea ice strength values were not directly validated, as they were derived from ice thickness and air temperature. Therefore, we focused our verification efforts on ice thickness, which plays a key role in the estimation of sea ice strength. Sea ice concentration validation was also omitted due to methodological differences between conventional coastal station observations and model-derived estimates. It was found that there is a good consistency between ice thickness and concentration, so the validation effect of ice thickness can also represent the accuracy of other sea ice parameters to a certain extent [16].

2.6. Return Period Design

The sea ice strength was designed using the Pearson-III (P-III) distribution with different return periods (100, 50, 25, 20, 10, 5, 2, 1 years). When determining the design ice engineering parameters, an excessively small estimate may lead to damage to marine structures, while an excessively large estimate can result in increased costs. The biggest advantage of the P-III distribution is its large elasticity. In most cases, it can be fitted well with the theoretical curve and empirical frequency points by repeatedly fitting the line or adjusting the coefficient of variation and mean appropriately. The probability density function of P-III distribution is Equation (9).
f ( x ) = β α Γ ( α ) ( x x 0 ) α 1 exp [ β ( x x 0 ) ]
where Γ(·) is the Gamma function, and α, β as well as x0 are the shape, scale, and position coefficients, respectively, related to the statistical parameters of the random variables:
α = 4 C s 2
β = 2 x ¯ C v C s
x 0 = x ¯ ( 1 2 C v C s )
where Cs is skewness coefficient, Cv is variation coefficient, and x ¯ is the average.
Therefore, the determination of the probability density function of P-III distribution is transformed into the determination of the statistical parameters. In general, the observations of ice parameters are not long enough, the empirical distribution based on observations must be extended to determine the design ice parameters. The preliminary values of the statistical parameters were obtained first using the observation data, and an empirical distribution curve was then depicted. Afterwards, the statistical parameters were adjusted until the corresponding empirical distribution curve fitted well with the observations. The statistical parameters after adjustment were selected to determine the final P-III distribution, and the design ice parameters were determined from corresponding cumulative frequency density curve according to the return period.

3. Results

3.1. Ice Duration

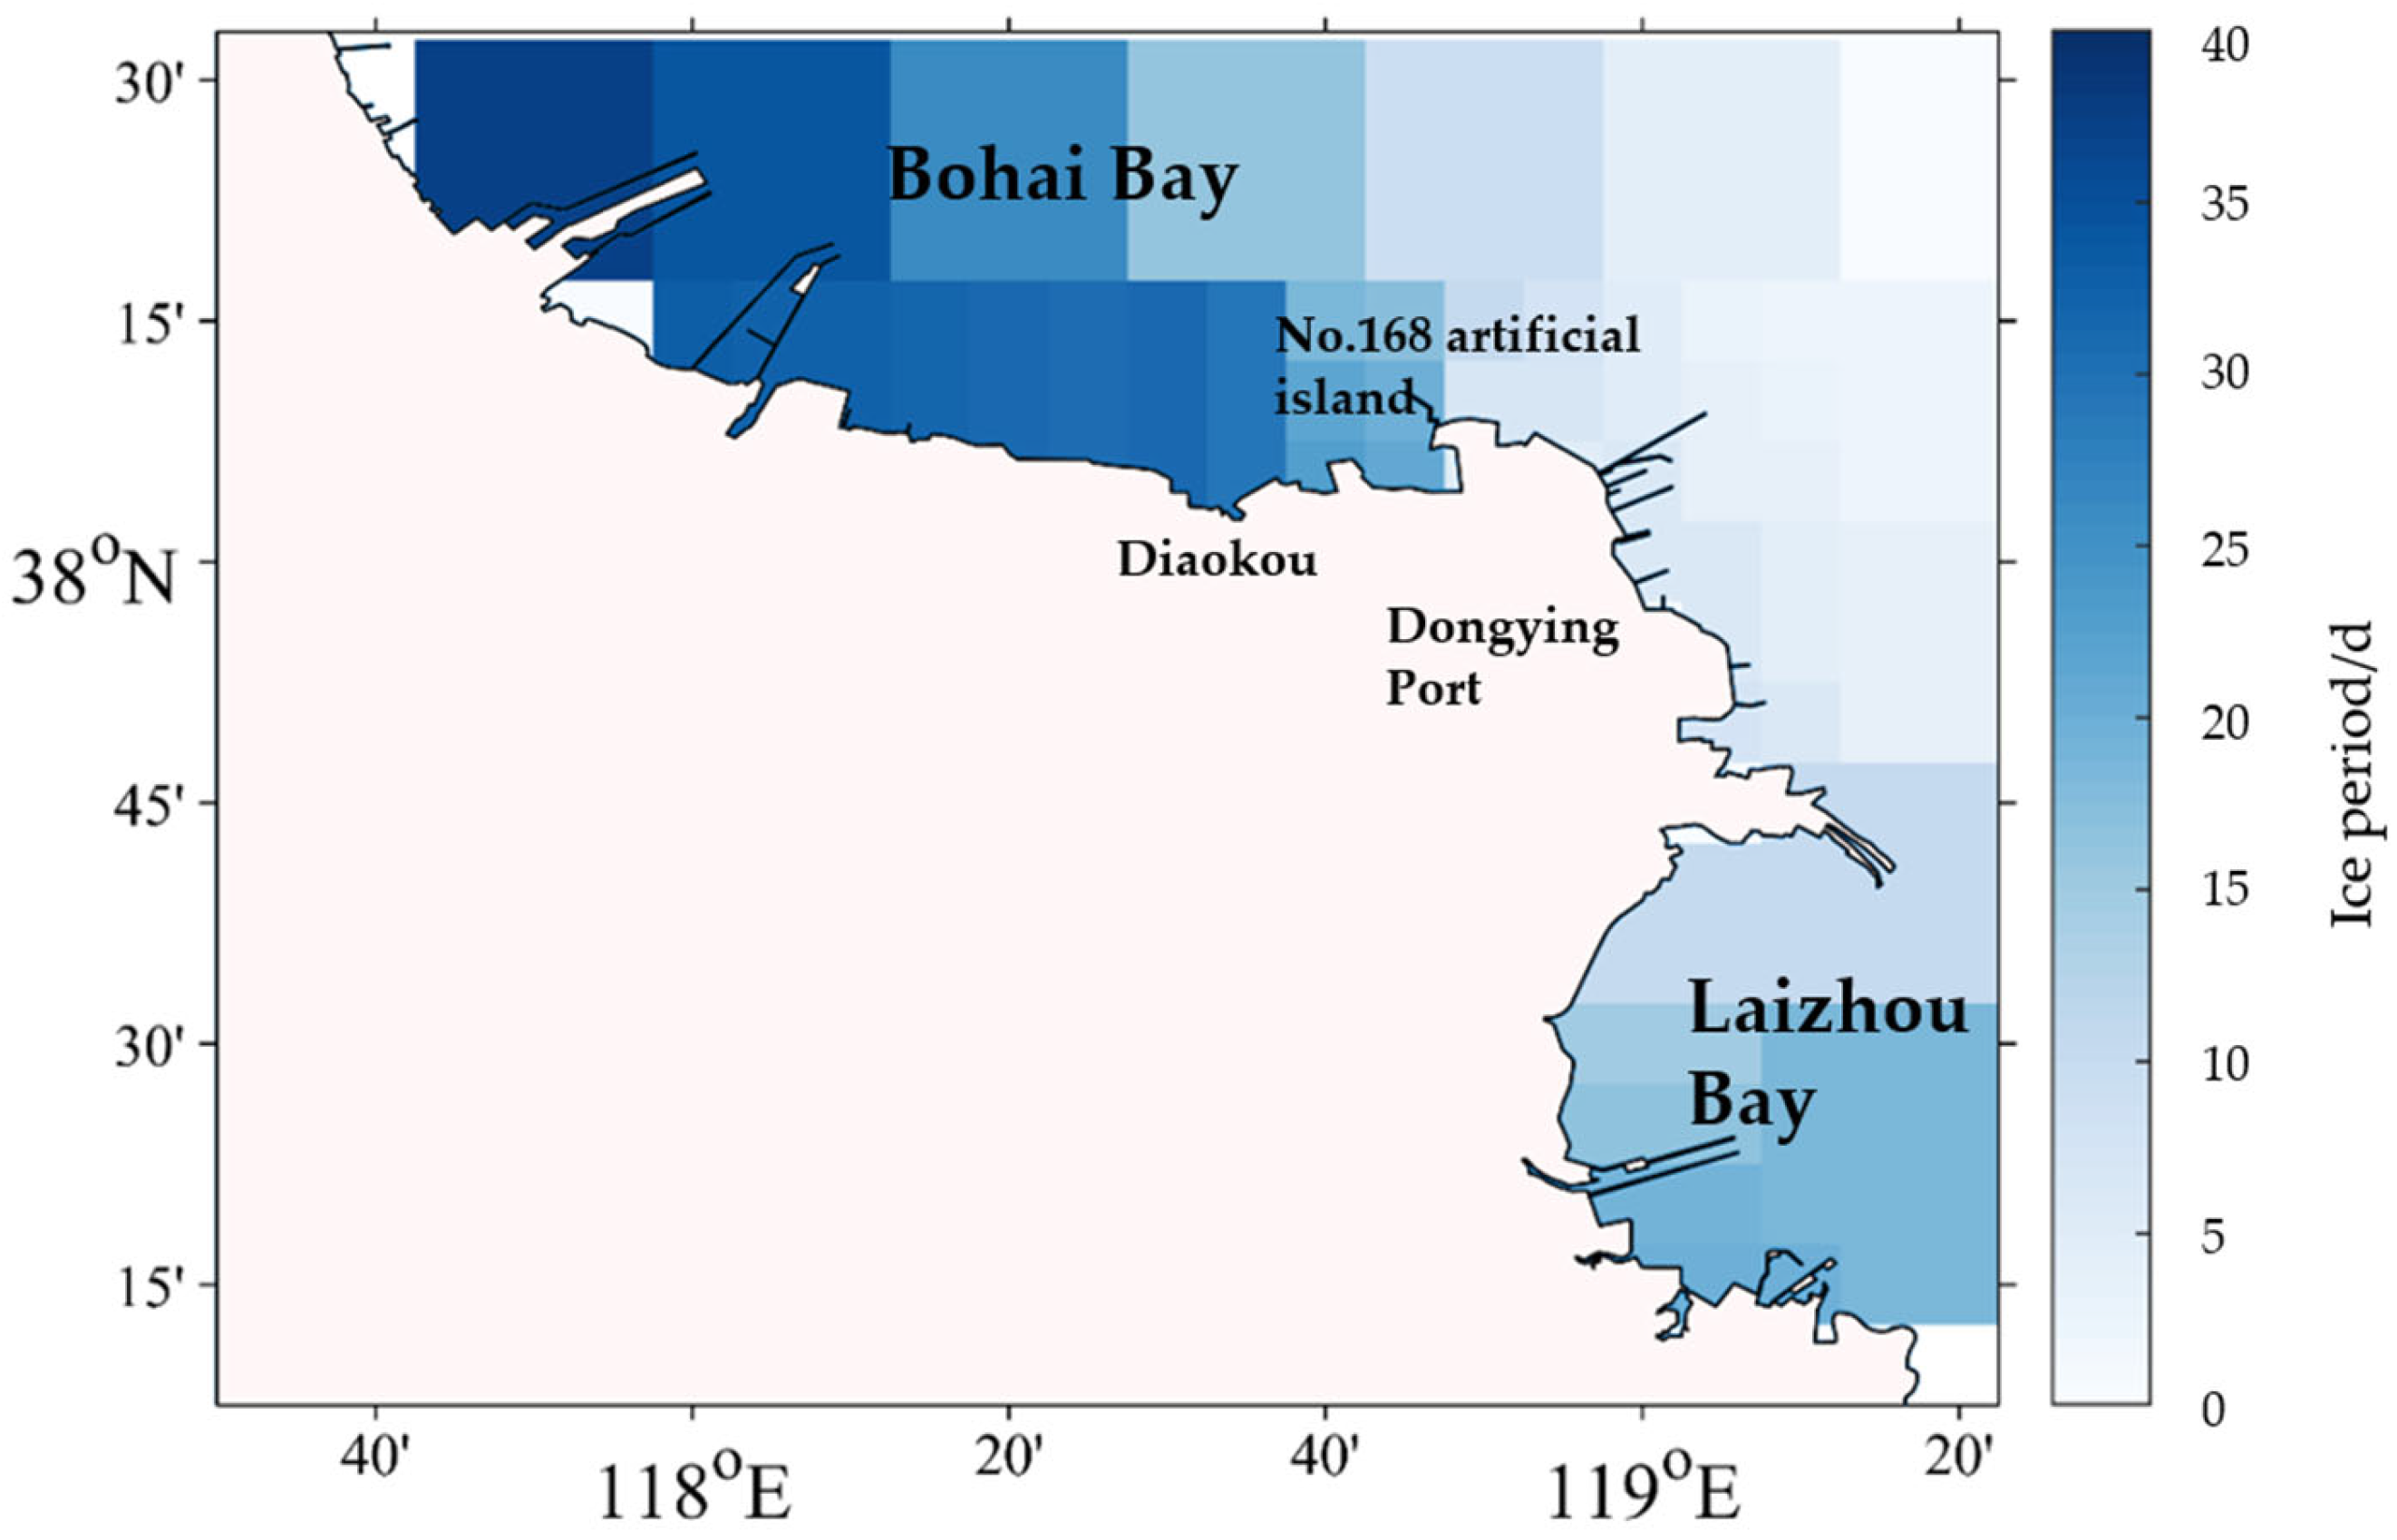
Accurate assessment of ice duration is important for engineering design and operational safety in ice-covered waters. The ice duration is defined as the temporal span between initial ice formation and final ice clearance (measured in days). Figure 2 presents the spatial distributions of average ice duration across study regions. The ice duration exhibited a decreasing gradient across the study area, with the longest persistence at the coastal Bohai Bay, intermediate duration at the coastal Laizhou Bay, and the shortest in central deep basins. Table 1 provides the maximum, minimum, and average ice duration of each grid division. The Diaokou nearshore area demonstrated prolonged severe ice periods compared to adjacent waters, attributable to shallow bathymetry facilitating ice grounding and obstruction effects from the eastern No.168 artificial island limiting ice drift. The western sectors showed longer ice durations than eastern counterparts. The maximum ice period days and the average ice period days near Dongying Port were short.

3.2. Level Ice Thickness

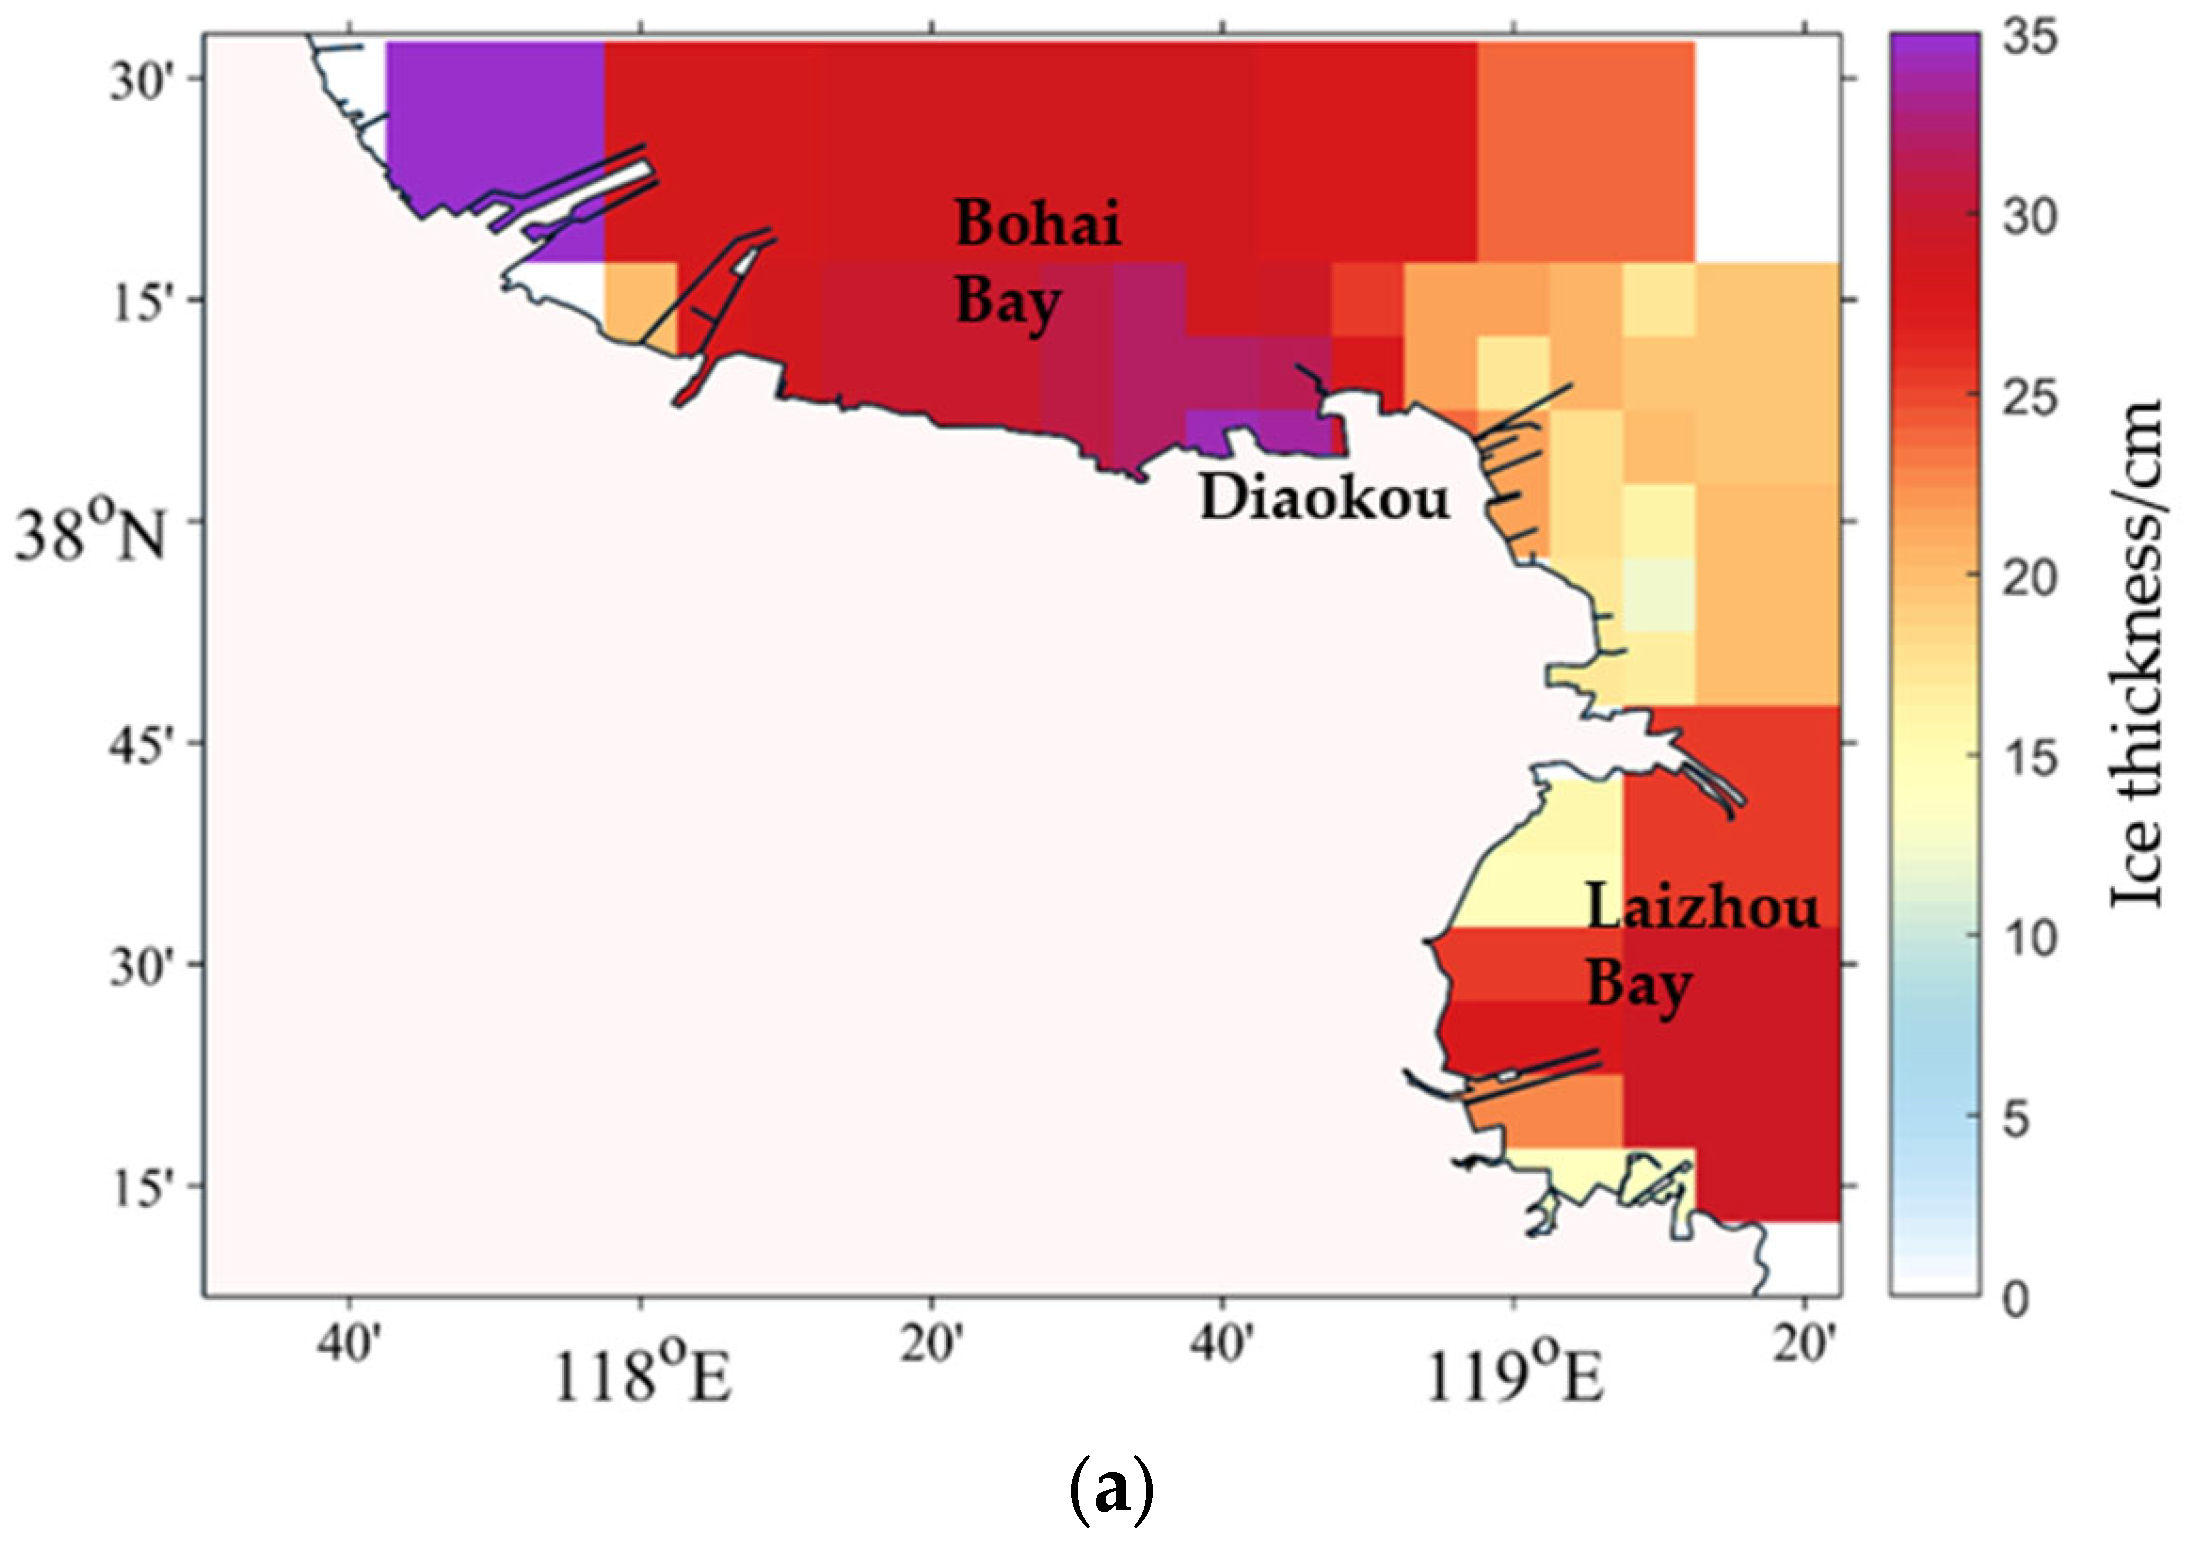
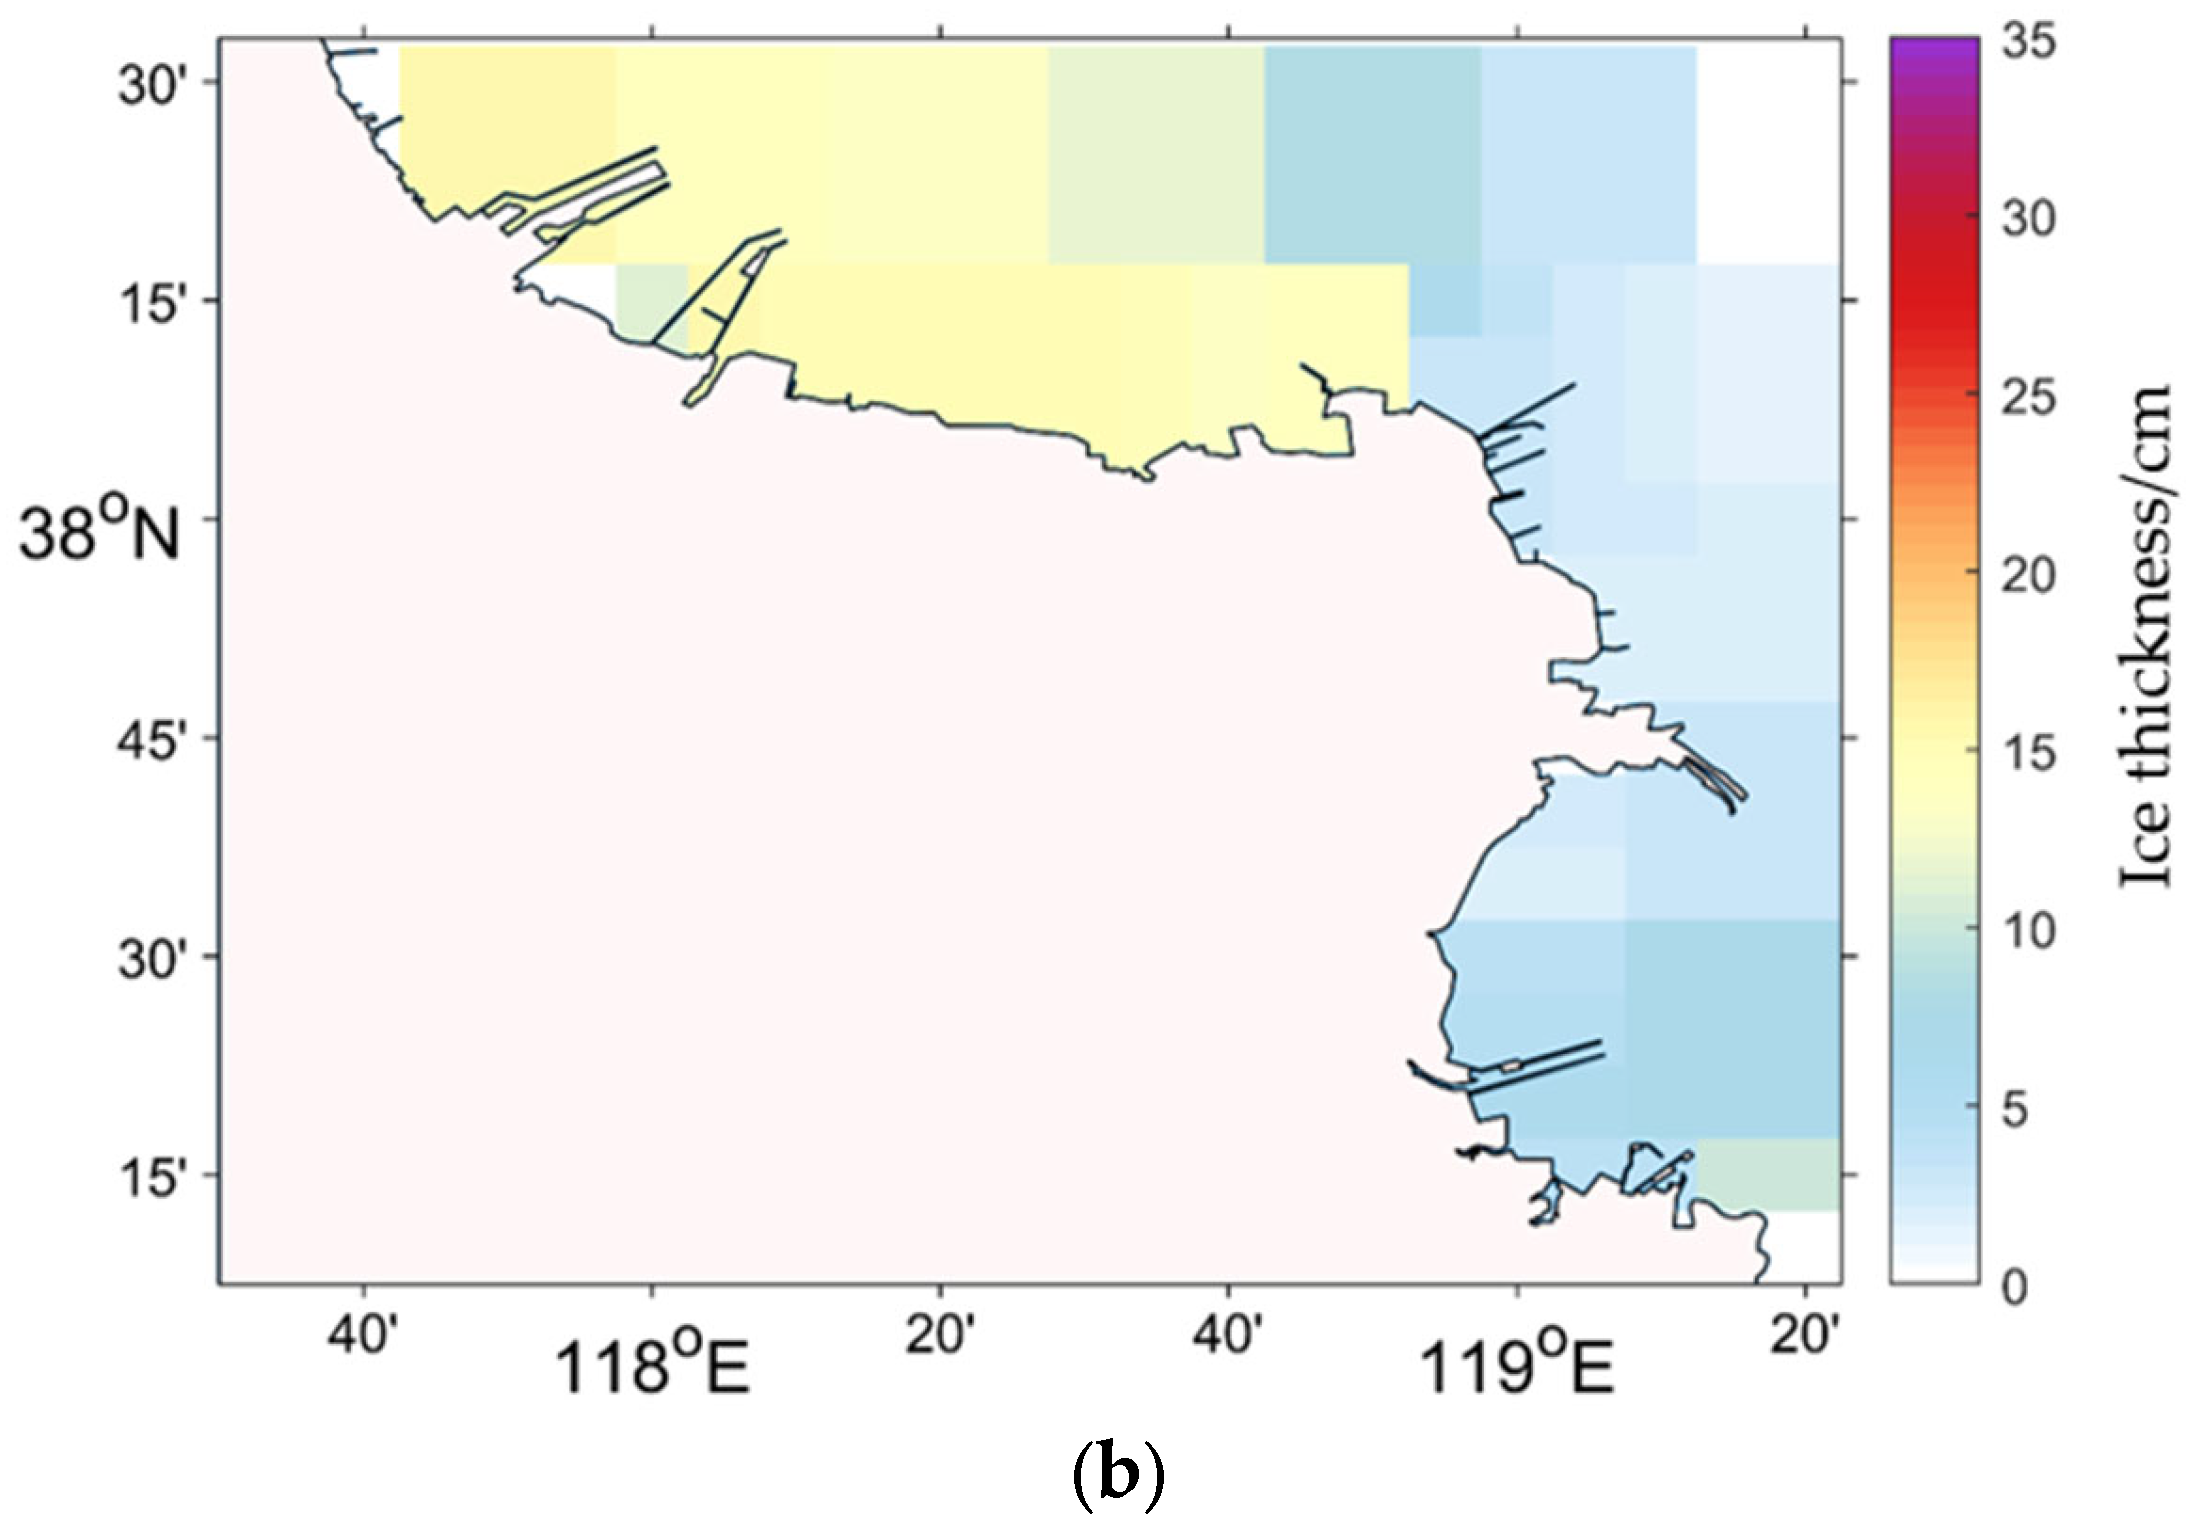
Precise quantification of ice thickness is critical for structural integrity assessments, as it directly governs ice load on offshore infrastructure. Figure 3 presents the spatial distributions of maximum ice thickness and mean ice thickness in the southern Bohai Sea from 1951 to 2022. The maximum ice thickness across the study area was 13–36 cm, and the mean ice thickness was 2–15 cm. The southwestern Bohai Bay and western Laizhou Bay exhibited significantly greater maximum ice thickness. Diaokou coastal waters also showed a high maximum ice thickness. The southern Bohai Bay consistently maintained a mean ice thickness > 10 cm, exceeding the mean ice thickness in the western Laizhou Bay.
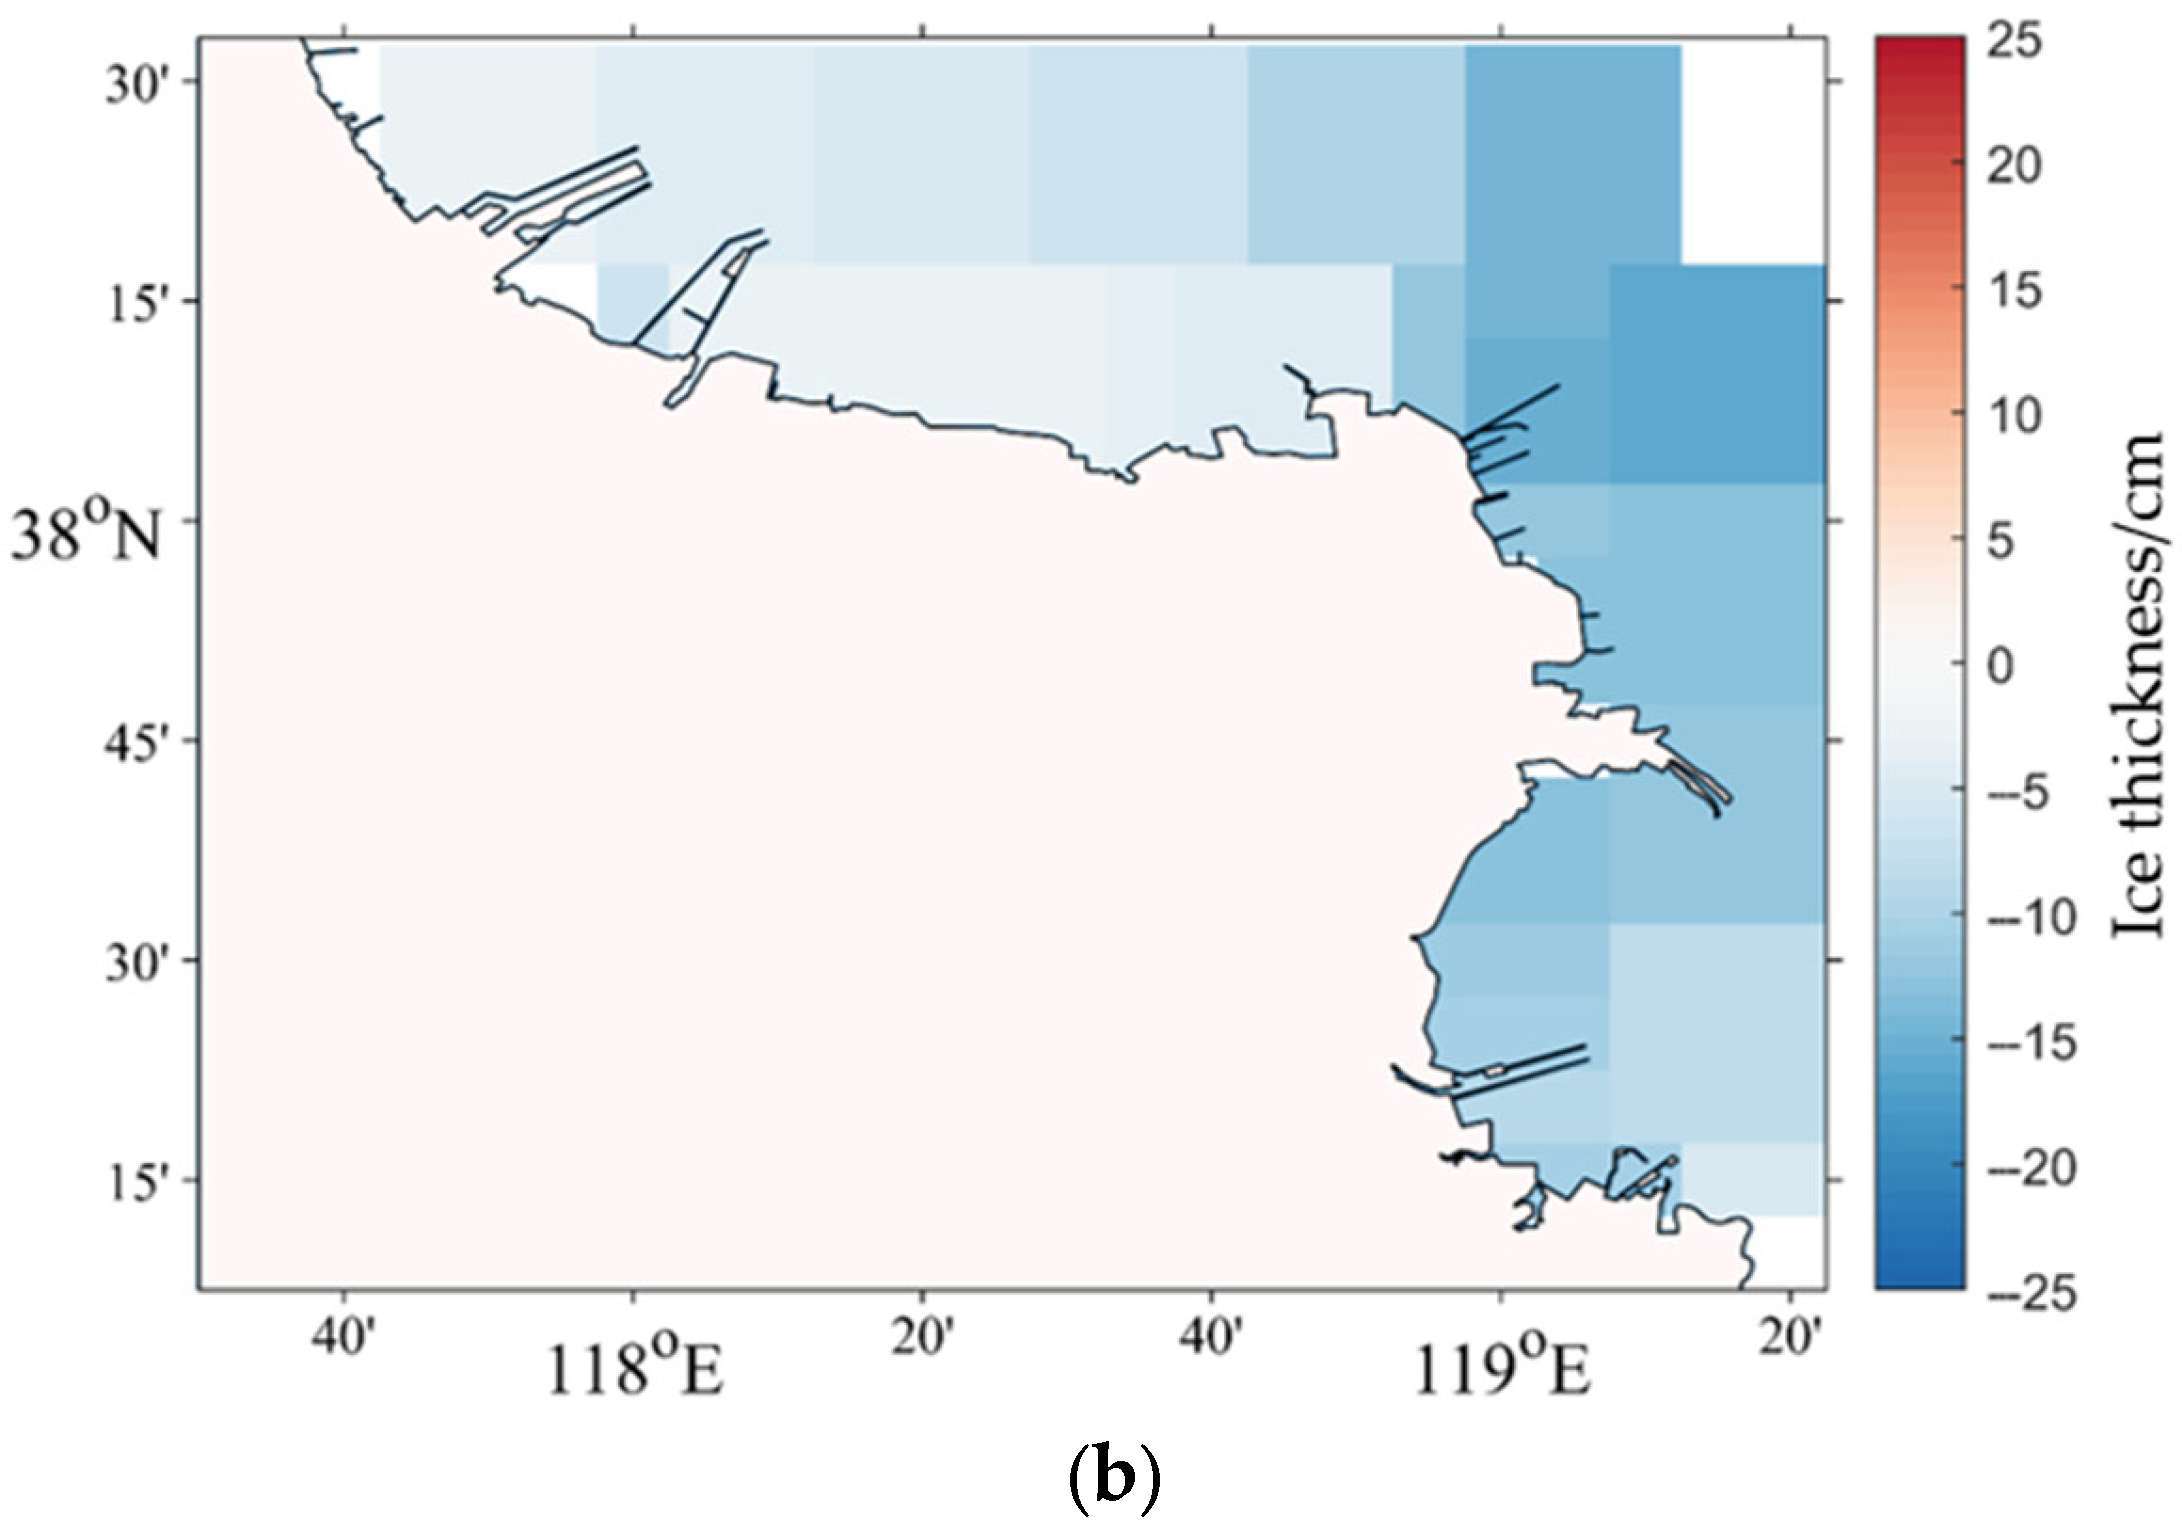
The refined grid division in this study corresponds to grids No. 9 and No. 10 in the original regulation. Under the original zoning, both grids No. 9 and No. 10 had a maximum ice thickness of 35 cm, with average thicknesses of 18 cm and 15 cm, respectively. Figure 4 shows the changes in ice thickness between the new zoning and original regulations, revealing that both maximum and average ice thicknesses decreased under the refined zoning, with relatively more significant reductions along the western coastal areas of Laizhou Bay.

3.3. Sea Ice Concentration

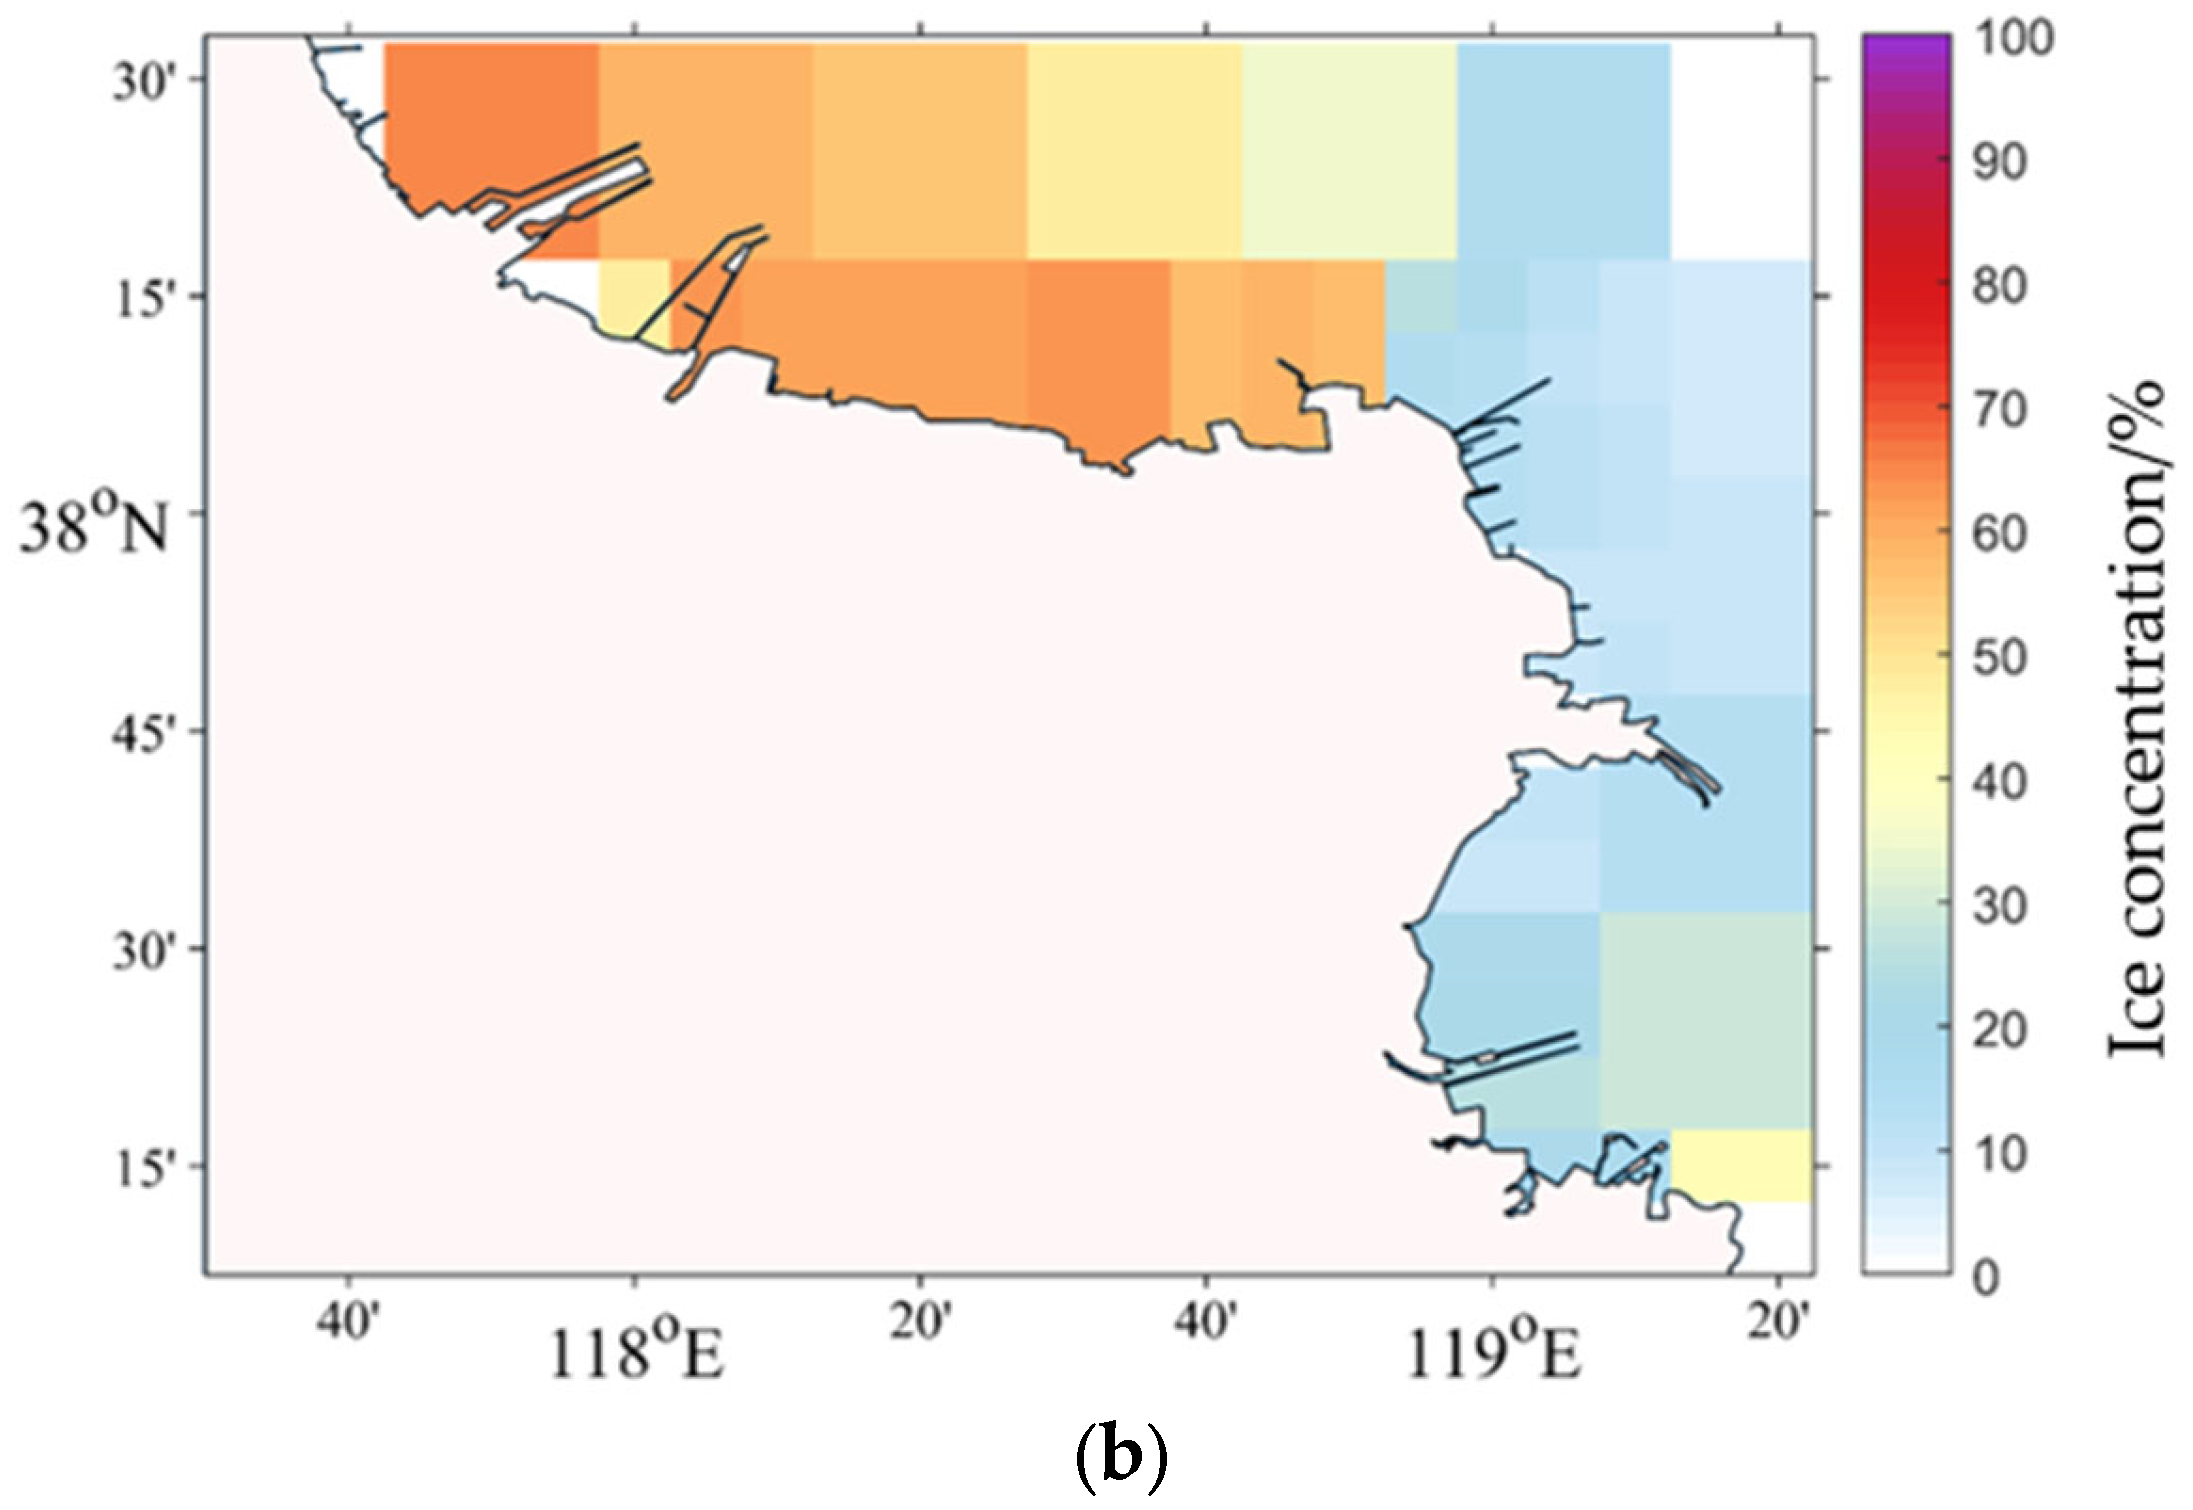
As a primary driver of ice dynamics, accurate spatial mapping of sea ice concentration is critical for quantifying ice–structure interaction on platforms, wind turbines, and subsea pipelines. Figure 5 presents the spatial distributions of maximum and mean sea ice concentration in the southern Bohai Sea from 1951 to 2022. Bohai Bay exhibited higher sea ice concentrations, followed by Laizhou Bay. In the southern Bohai Bay and southwestern Laizhou Bay, the maximum sea ice concentration exceeded 90% across most areas, with sea ice concentrations reaching up to 99.8% in the Feiyantan offshore area. Regarding average sea ice concentration, the Bohai Bay region generally showed higher values than the Laizhou Bay region.
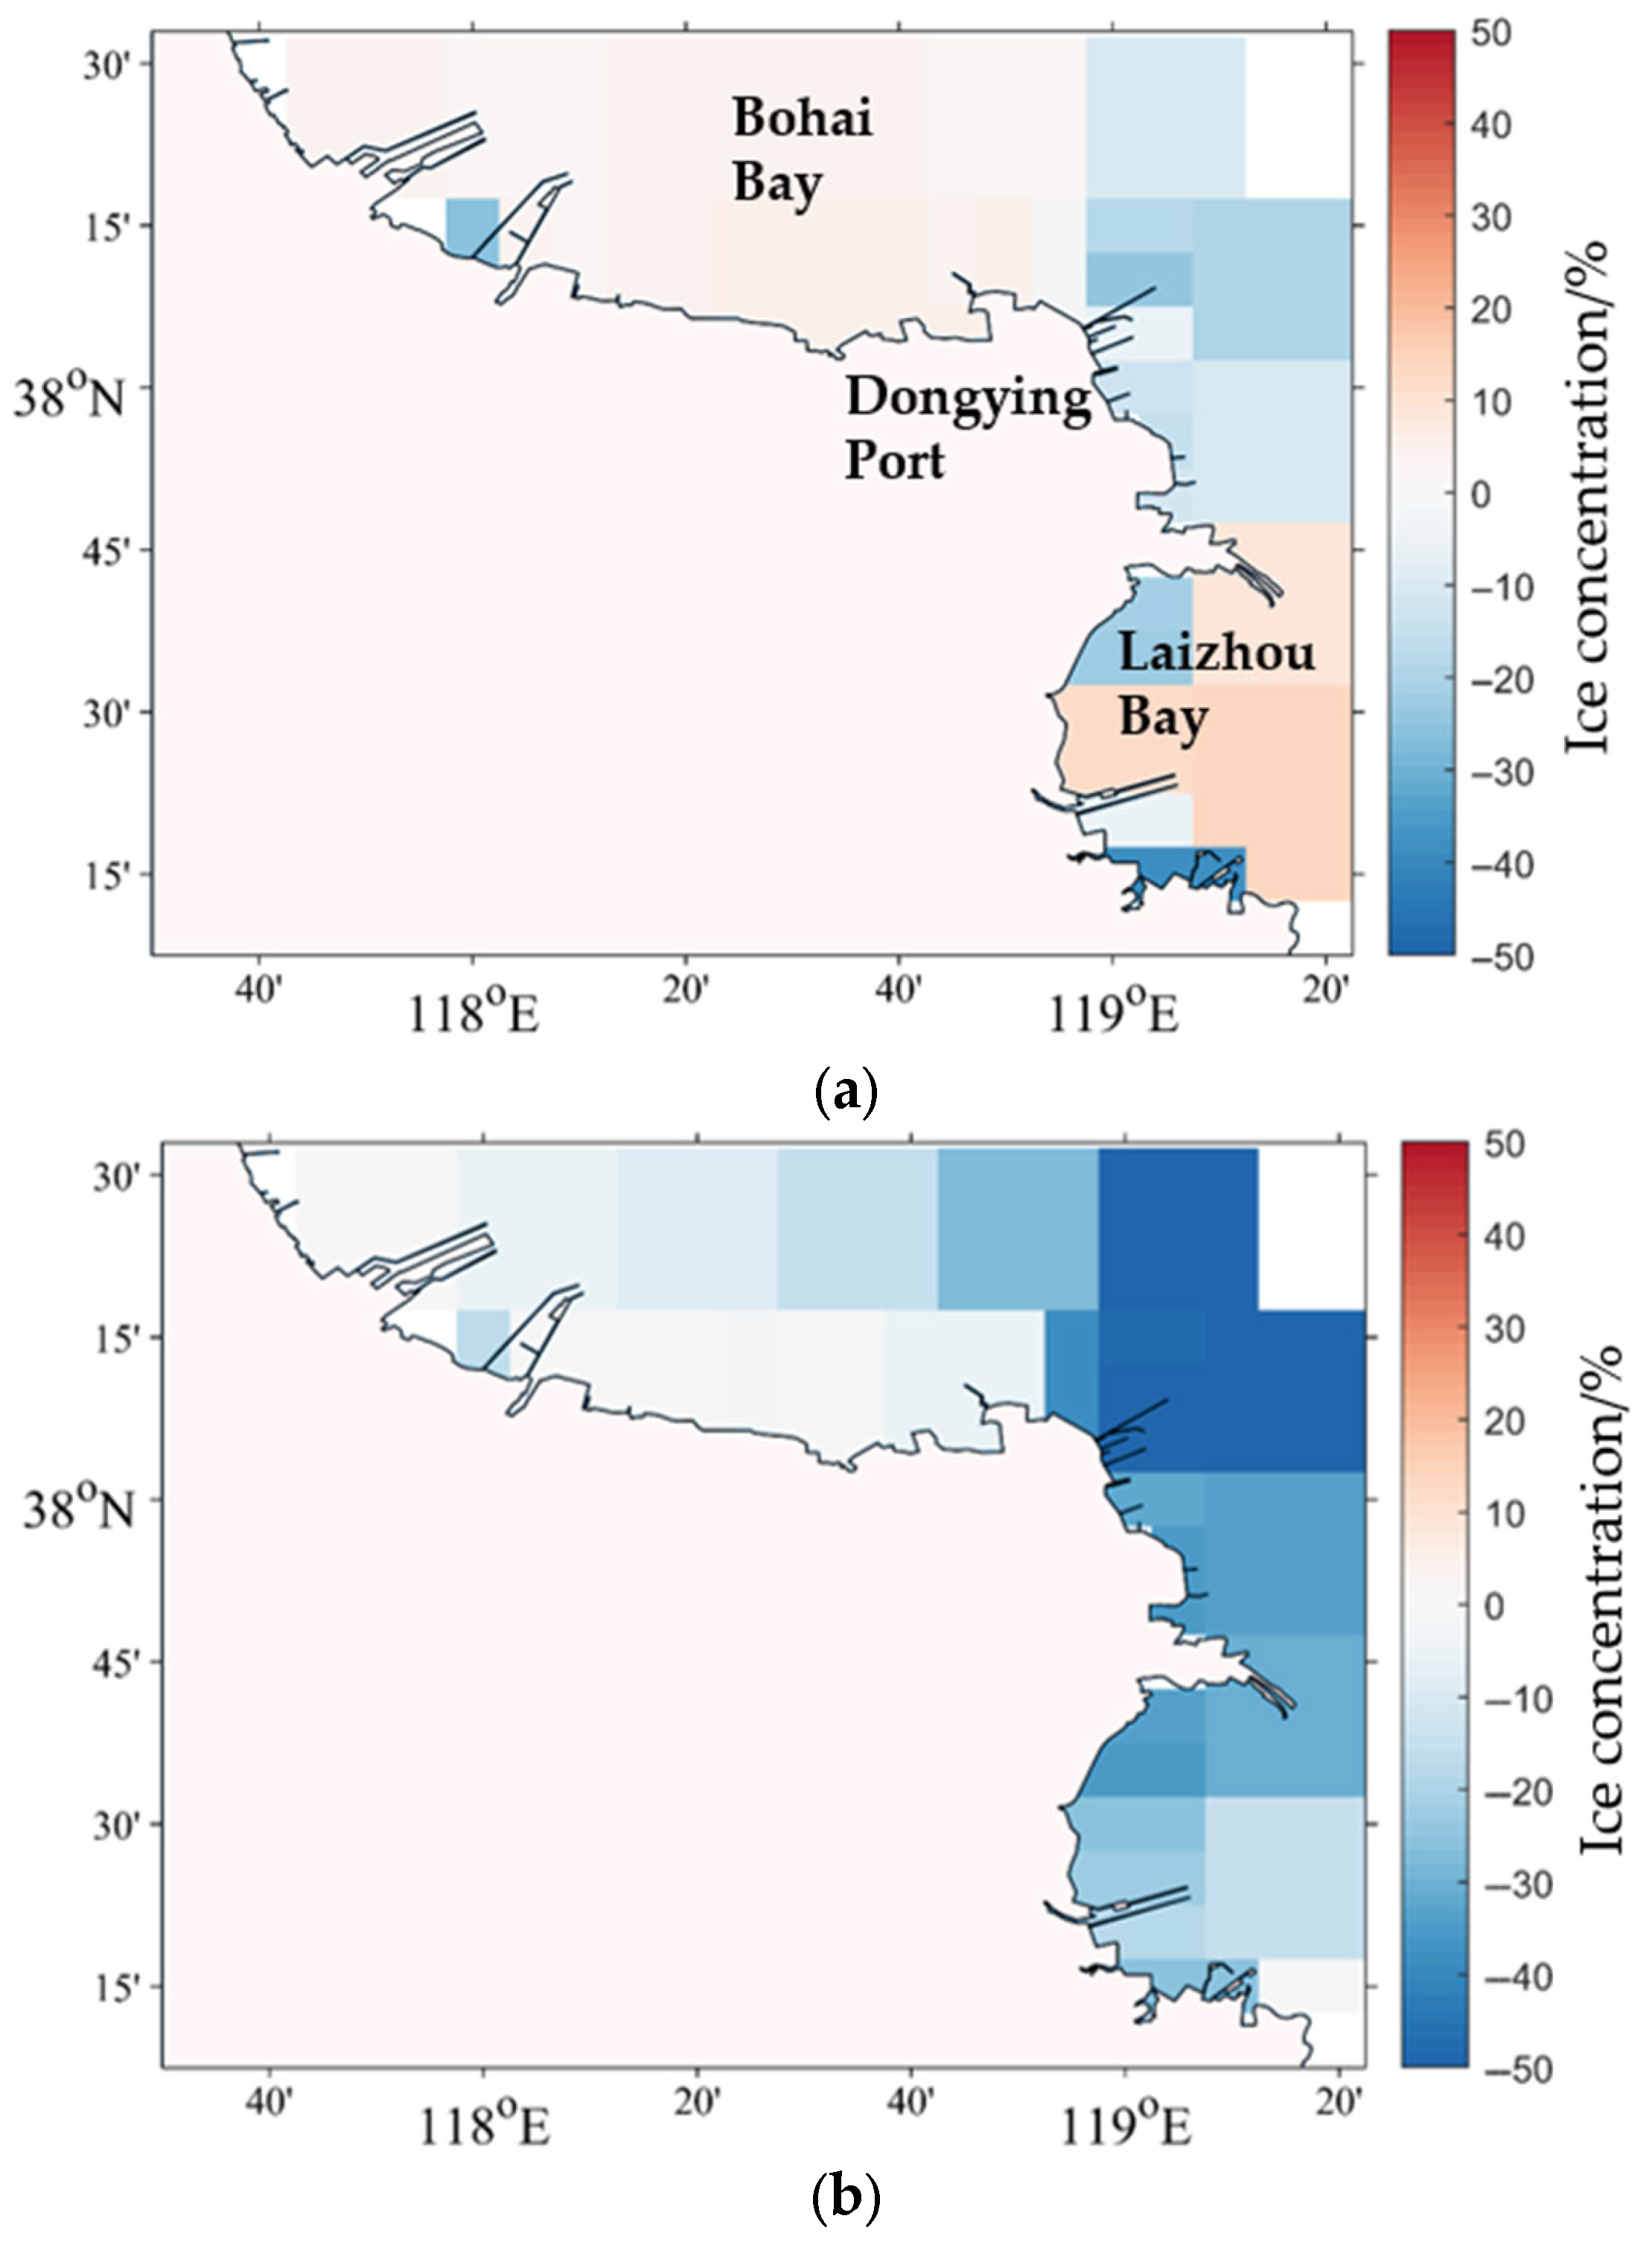
According to the original regulation, the maximum sea ice concentrations for grids No. 9 and No. 10 are 94.4% and 85.7%, respectively, with average concentrations of 63.4% and 43.8%. As shown in Figure 6, in this study, the maximum sea ice concentration in the southern Bohai Bay showed values essentially consistent with the original standard; the maximum sea ice concentration in the eastern sections of the study area were slightly below the original standards; and the maximum sea ice concentration in the southwestern Laizhou Bay exceeded the standard values. For average sea ice concentration, all zones in the southern Bohai Sea demonstrated lower values than the original standard, and the most significant reduction occurred near the Dongying Port area.
The decrease in sea ice concentration near the Dongying Port area compared to the values in the original standard is primarily caused by two reasons. First, the CNOOC standard was implemented and published in 2002. Over the past 15 years, sea ice severity in the China Seas has exhibited an overall declining trend. This regional trend is a key factor contributing to the generally lower average sea ice concentrations found in our results for the southern Bohai Sea compared to the baseline values established in the original standard. Second, the CNOOC standard utilized shore-based observation data from the Diaokou location. Diaokou is situated within a shallow river channel. Sea ice concentration within such confined, shallow riverine environments is typically higher than in the adjacent open sea. Consequently, the sea ice concentration values adopted in the original standard for the Dongying Port area, based on Diaokou data, were inherently biased upwards due to this localized effect. In contrast, the data used in our analysis was derived entirely from NEMO numerical model results. Therefore, our results for Dongying Port reflected the open-water sea ice conditions more accurately, thus avoiding the overestimation presented in the original standard data source for this specific area.

3.4. Sea Ice Uniaxial Compressive Strength

Sea ice uniaxial compressive strength governs the ice loads against vertical structures in ice-covered waters. Figure 7 presents the spatial distributions of design sea ice maximum uniaxial compressive strength in the southern Bohai Sea. The design values of maximum sea ice uniaxial compressive strength exhibited a distinct spatial gradient, decreasing sequentially from the Bohai Bay (highest values) through deep-water area (medium values) to the Laizhou Bay (lowest values), with the Bohai Bay bottom and Dongying Port areas showing the most severe strength values. Table A1 in Appendix A specifies the design strength values for different return periods. The design strength values at almost all grids exceeded 2.00 MPa for return periods over 20 years. The design strength values in the Bohai Bay and Dongying Port areas maintained >2.00 MPa for 10-year and 5-year return periods while the design strength values at other regions fell below 2.00 MPa. For 2-year and 1-year return periods, the design strength values at almost all grids were <2.00 MPa.

3.5. Sea Ice Shear Strength

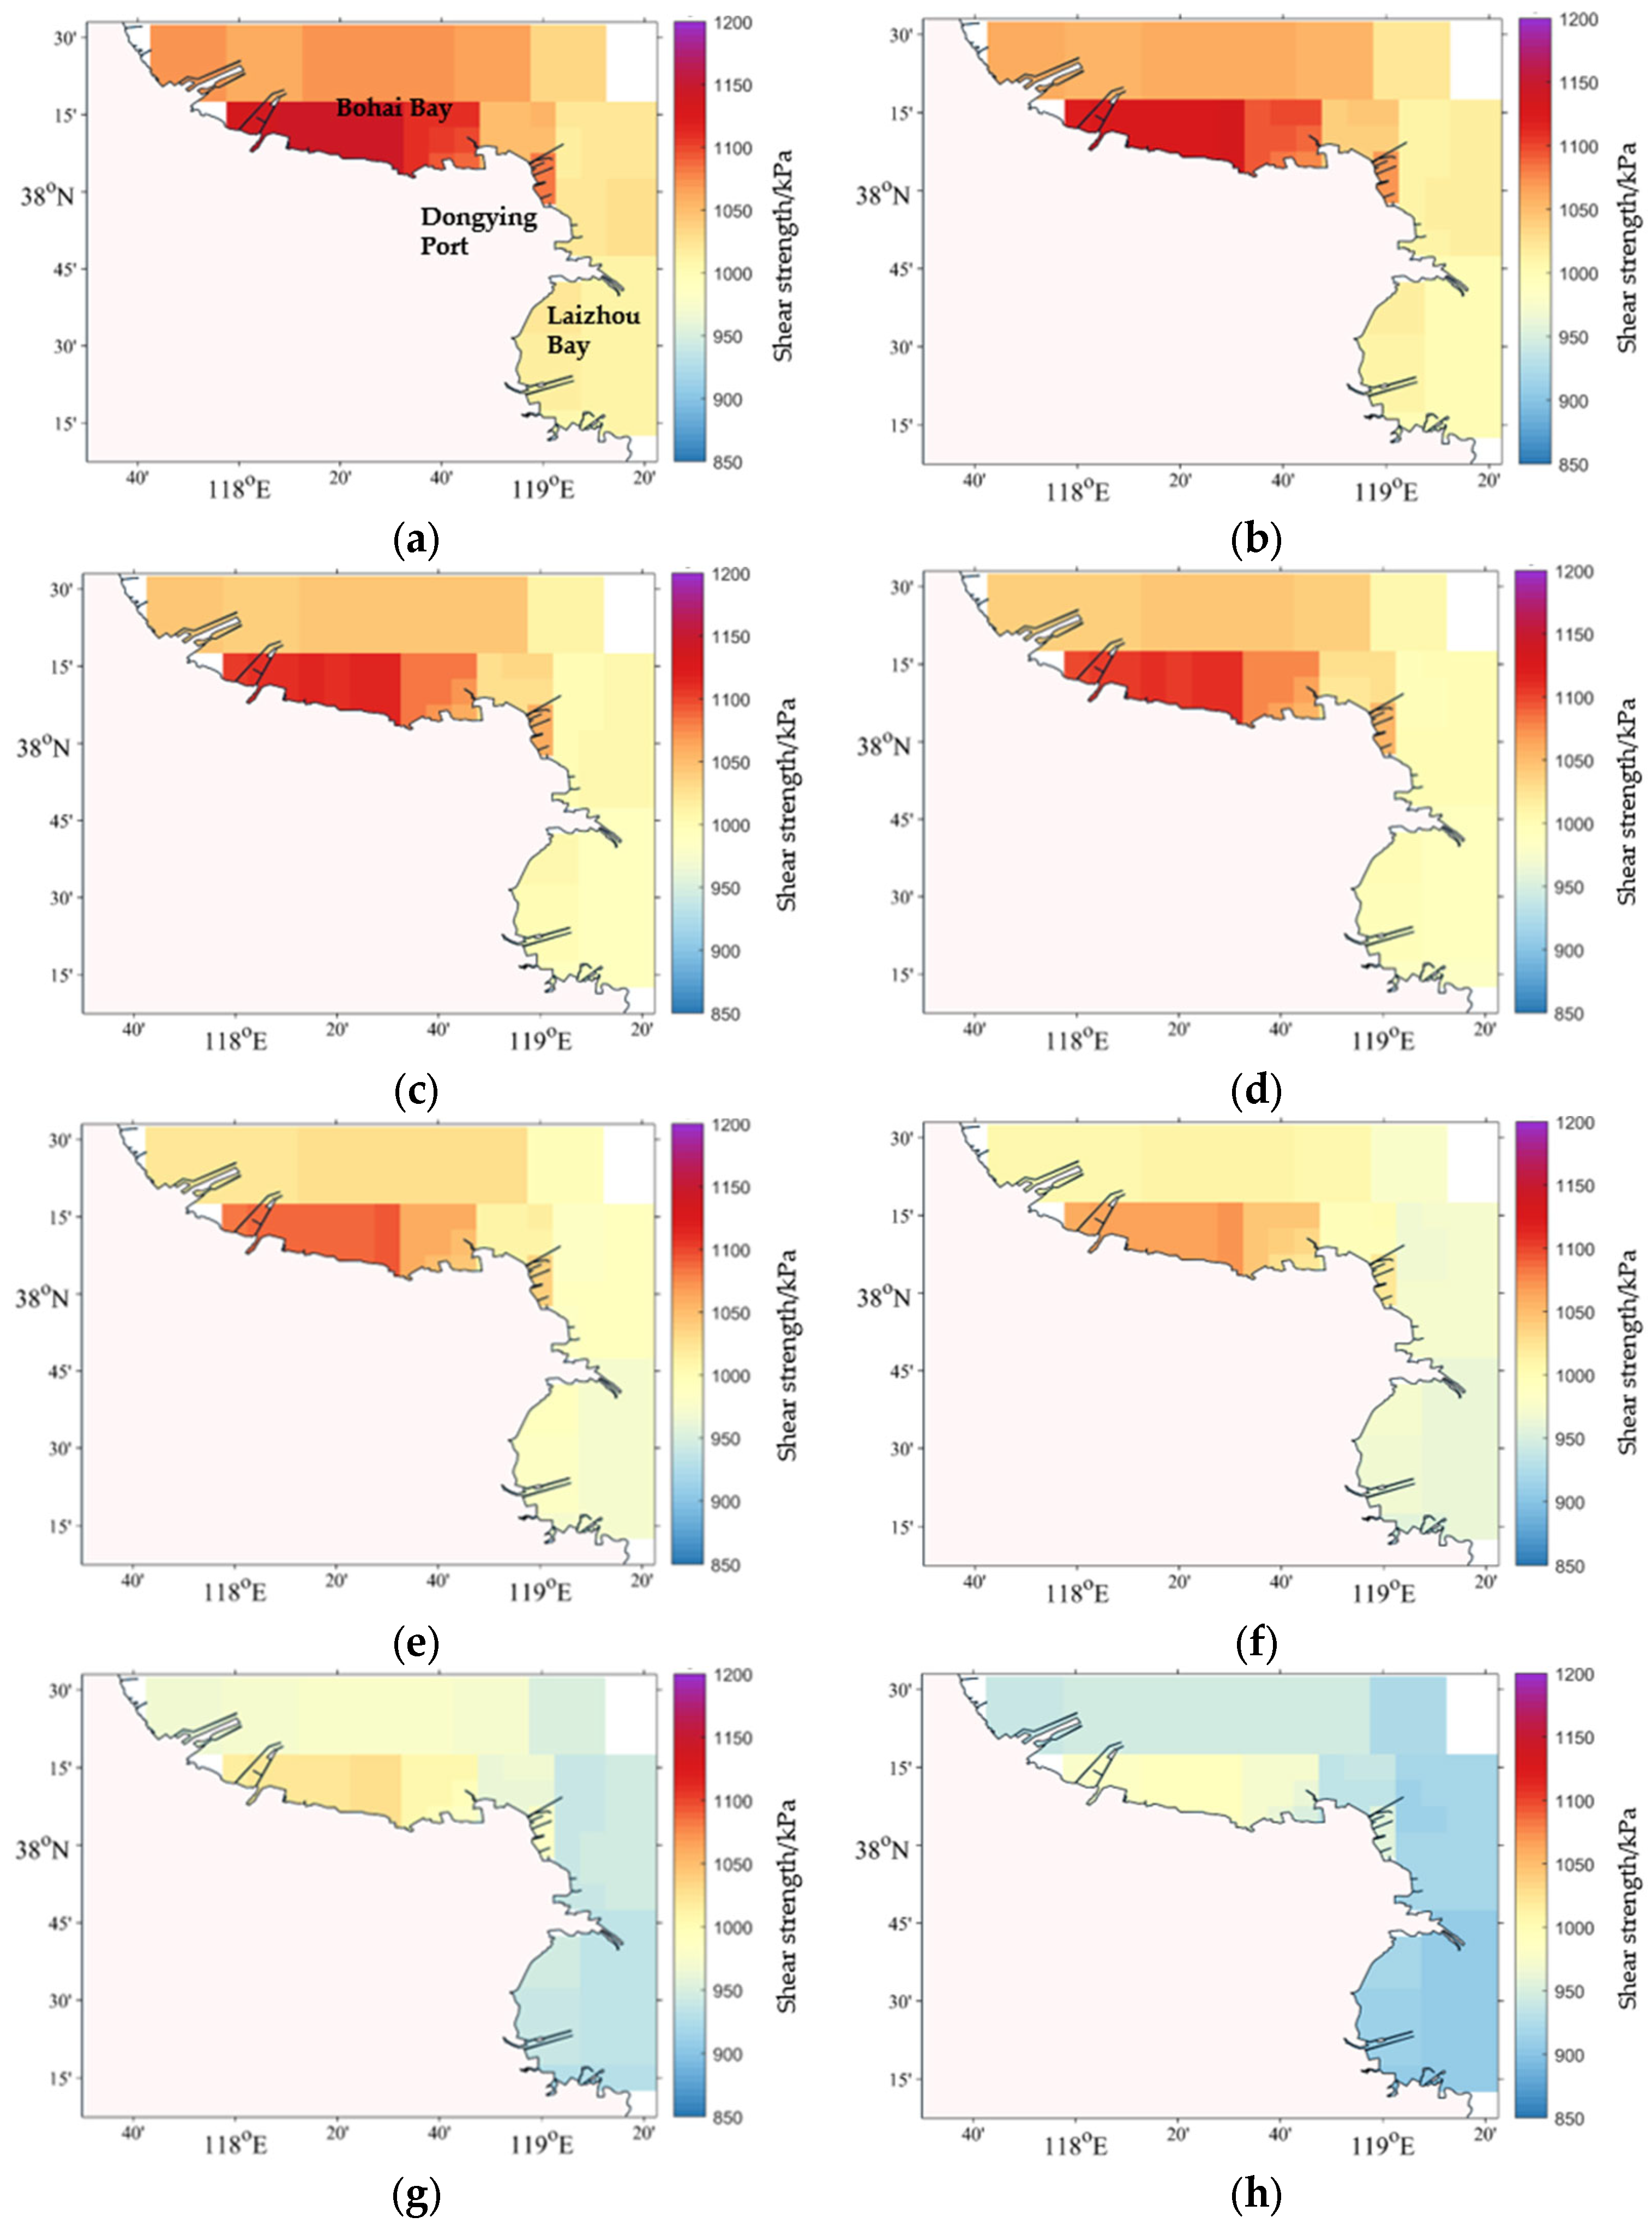
Sea ice shear strength is another important parameter determining the ice load during ice–structure interaction. Figure 8 presents the spatial distributions of design sea ice shear strength in the southern Bohai Sea. Since the shear strength was determined based on the uniaxial compressive strength, the spatial variation pattern of design sea ice shear strength in the southern Bohai Sea was consistent with the distribution characteristics of the design uniaxial compressive strength. Table A2 in the Appendix A specifies the design shear strength values for different return periods. The design shear strength values at almost all grids exceeded 1.00 MPa for return periods over 20 years. The design strength values in the Bohai Bay and Dongying Port areas maintained >1.00 MPa for 10-year and 5-year return periods while the design strength values at other regions fell below 1.00 MPa. For design values with 2-year and 1-year return periods, the strength values at almost all grids were <1.00 MPa.

3.6. Sea Ice Flexural Strength

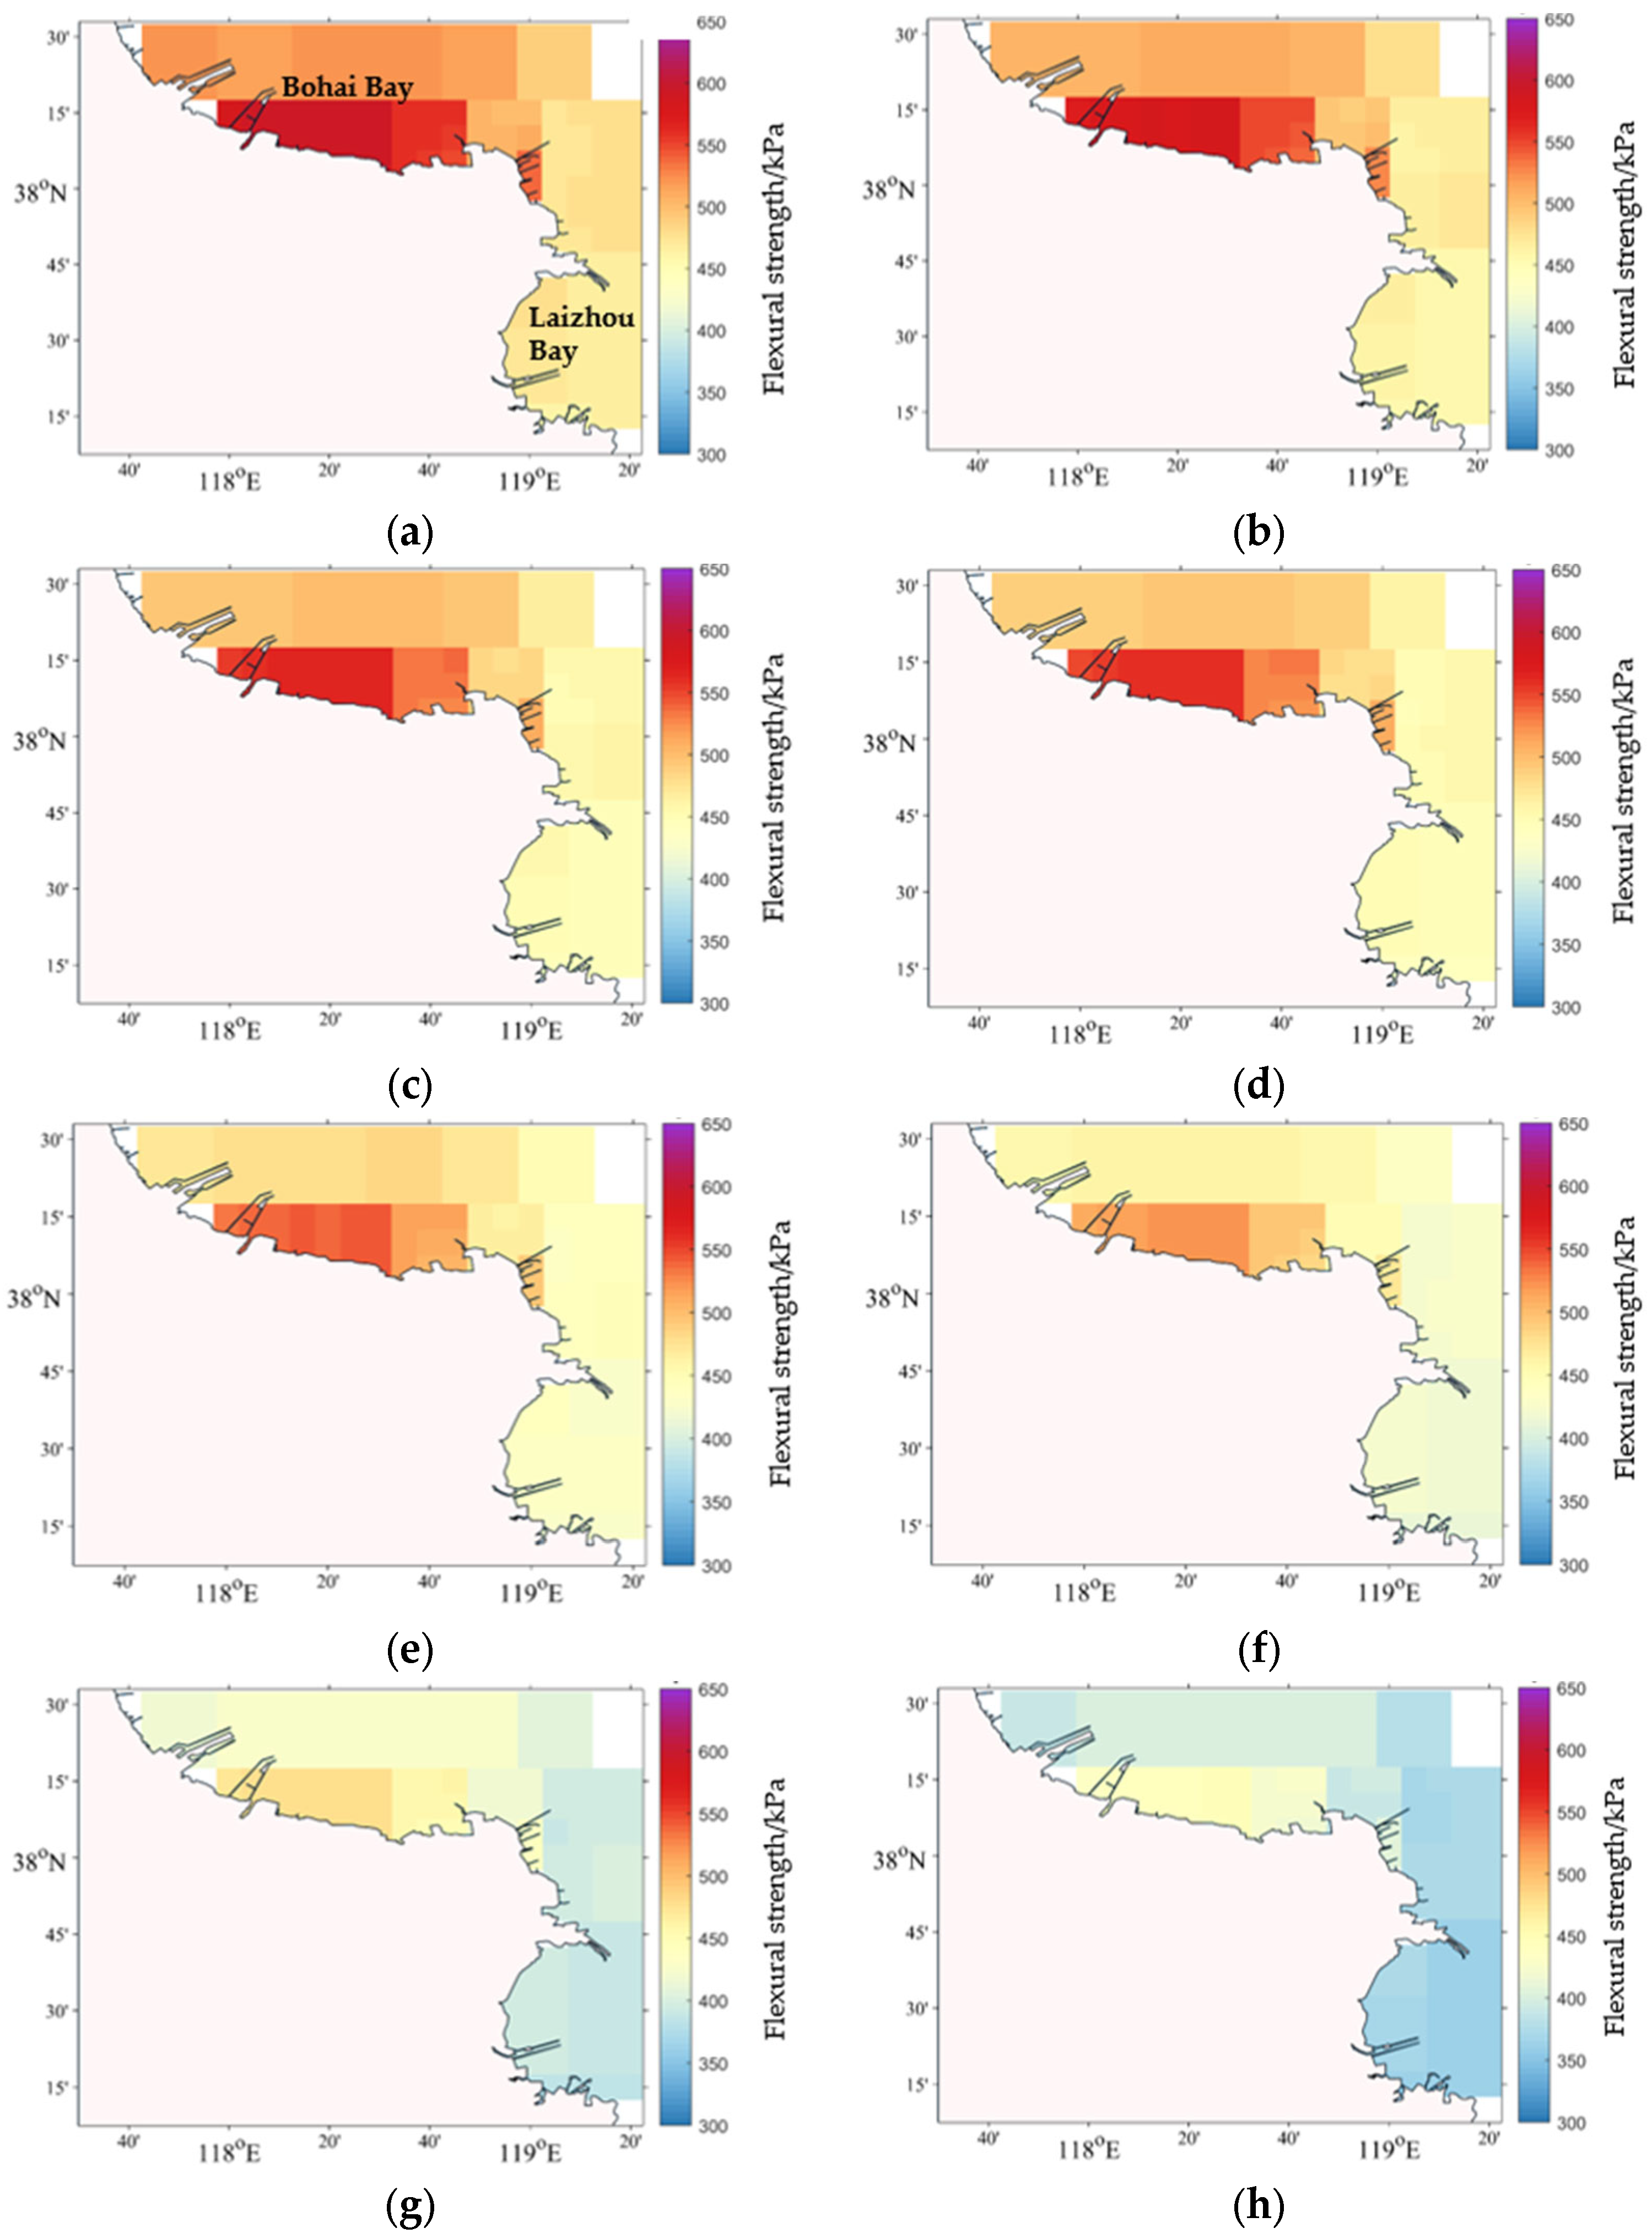
As the critical parameter controlling ice failure on sloped structures, quantification of sea ice flexural strength is essential for the design of ice-breaking cones. Figure 9 presents the spatial distributions of design sea ice flexural strength in the southern Bohai Sea. The design values of sea ice flexural strength exhibited a distinct spatial gradient, decreasing sequentially from the Bohai Bay (highest values) through deep-water area (medium values) to the Laizhou Bay (lowest values), with the Bohai Bay bottom and Dongying Port areas showing the most severe strength values. Table A3 in the Appendix A specifies the design flexural strength values for different return periods. The design flexural strength for the 100-year return period ranged from 463 to 594 kPa. The design values decreased with shorter return periods. For return periods of 5 years and above, the minimum and maximum design flexural strengths remained greater than 400 kPa and 500 kPa, respectively. At the 2-year return period, the design flexural strength decreased to 386 kPa and 480 kPa.

3.7. Sea Ice Tensile Strength

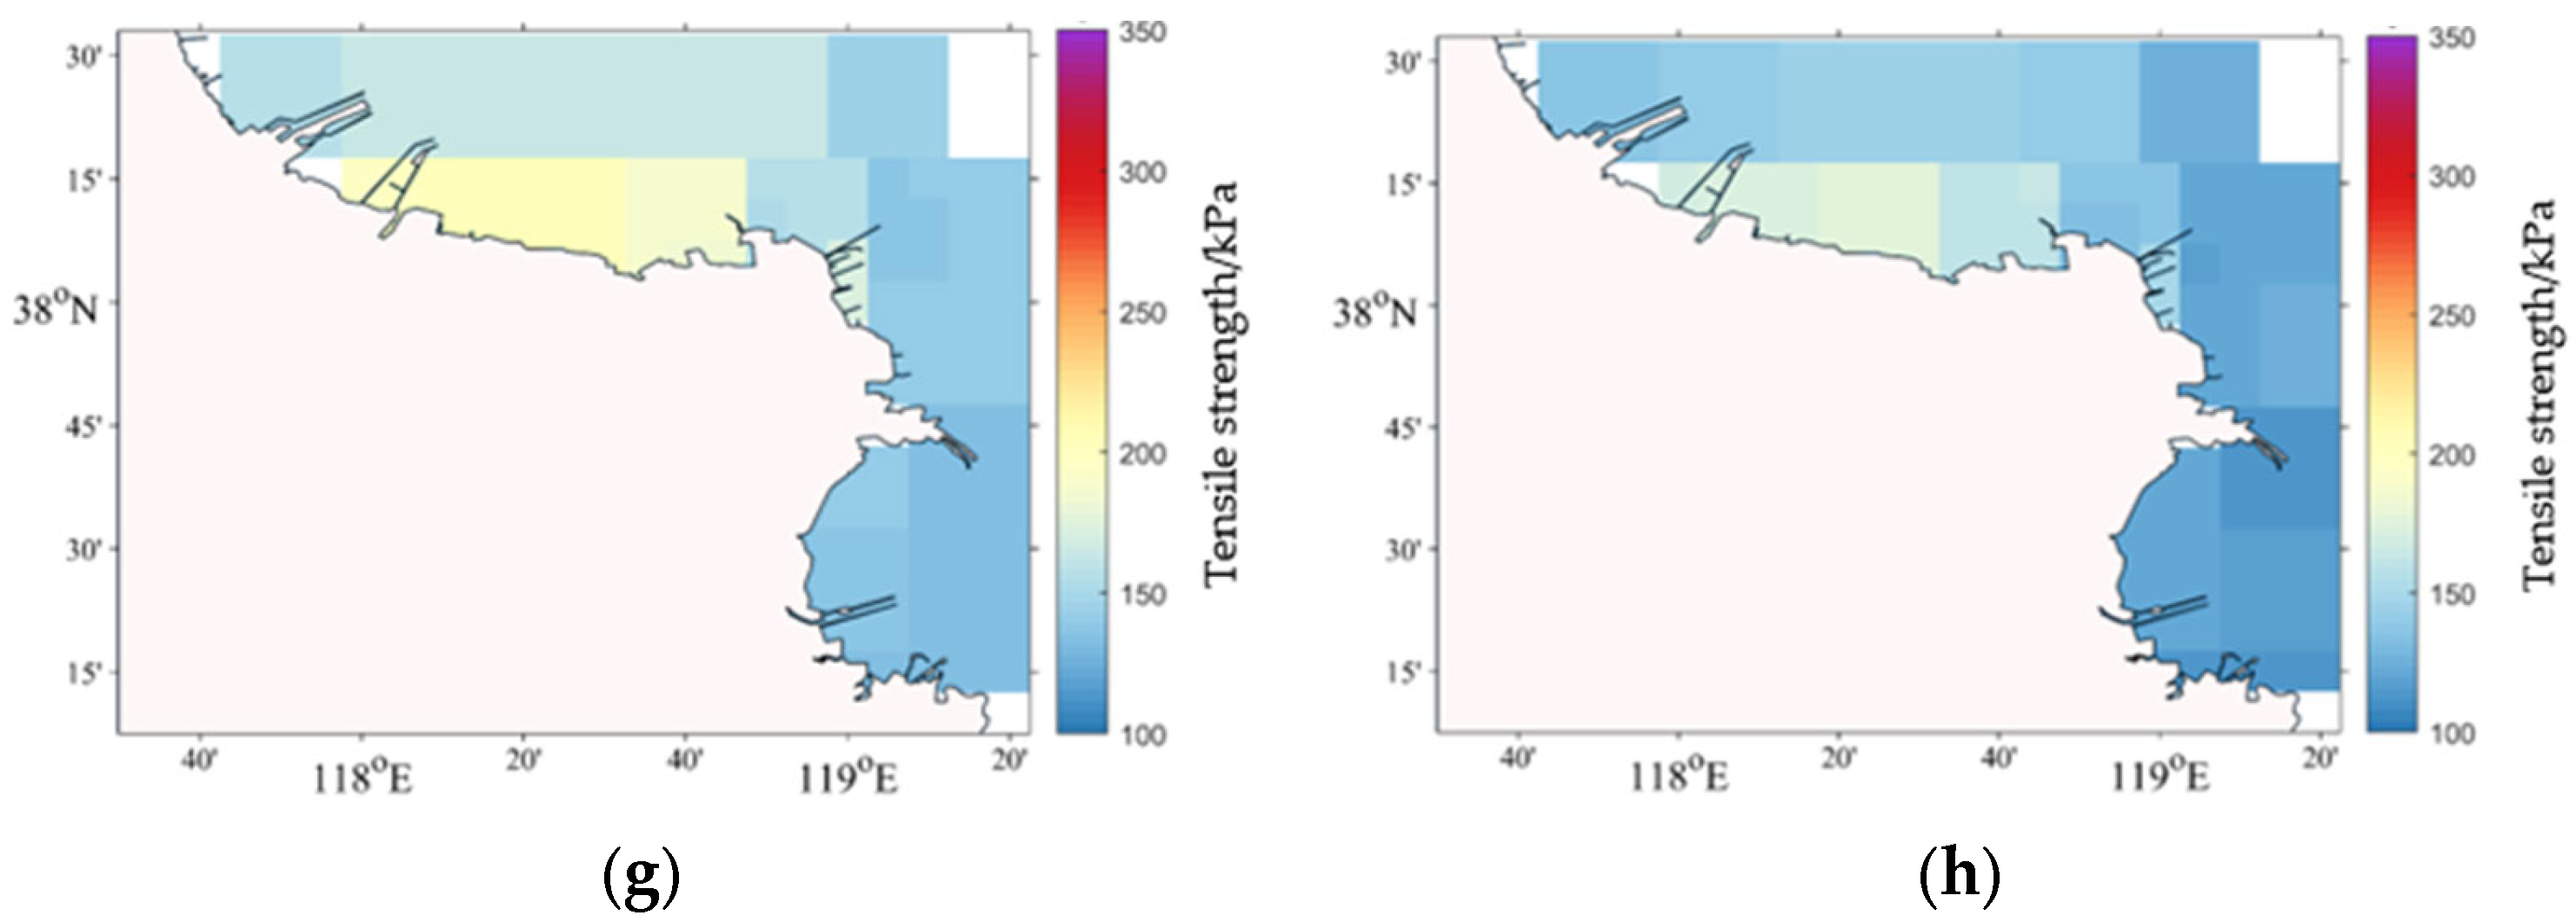
Despite its low magnitude compared to uniaxial compressive strength, sea ice tensile strength influences the crack formation of large ice cover. Figure 10 presents the spatial distributions of sea ice tensile strength in the southern Bohai Sea. The design values of sea ice tensile strength exhibited a distinct spatial gradient, decreasing sequentially from the Bohai Bay (highest values) through deep-water area (medium values) to the Laizhou Bay (lowest values), with the Bohai Bay bottom and Dongying Port areas showing the most severe strength values. Table A4 in the Appendix A specifies the design tensile strength values for different return periods. For the 100-year return period scenario, all grids exhibited design tensile strengths exceeding 200 kPa. For return periods between 50 and 20 years, the Laizhou Bay area showed design tensile strengths below 200 kPa, and other locations maintained values above 200 kPa. Below the 20-year return period, only several severe grids demonstrated tensile strengths surpassing 200 kPa. Under 1-year return period conditions, all grids displayed design tensile strengths less than 200 kPa.

4. Discussion

4.1. The Selection of Sea Ice Strength Formulae

Numerous uniaxial compressive strength tests have been conducted on Bohai Sea ice. However, these tests have predominantly focused on the Liaodong Bay, where ice conditions are relatively severe, whereas data availability for the Laizhou Bay has been limited. Both of the Chinese ice-region engineering design codes [15,24] recommend that, in the absence of measured data, the peak value of sea ice uniaxial compressive strength be calculated using Equation (1).
The National Marine Environmental Monitoring Center (NMEMC) historically conducted uniaxial compressive strength tests on sea ice in the Yellow River Estuary area near the Laizhou Bay [25]. These tests served as design references for offshore oil production structures of the Shengli Oilfield, providing the relationship between the design value of uniaxial compressive strength of level ice in the Yellow River Estuary and ice temperature, as expressed by Equation (13).
σ c = 1.84 0.161 T i
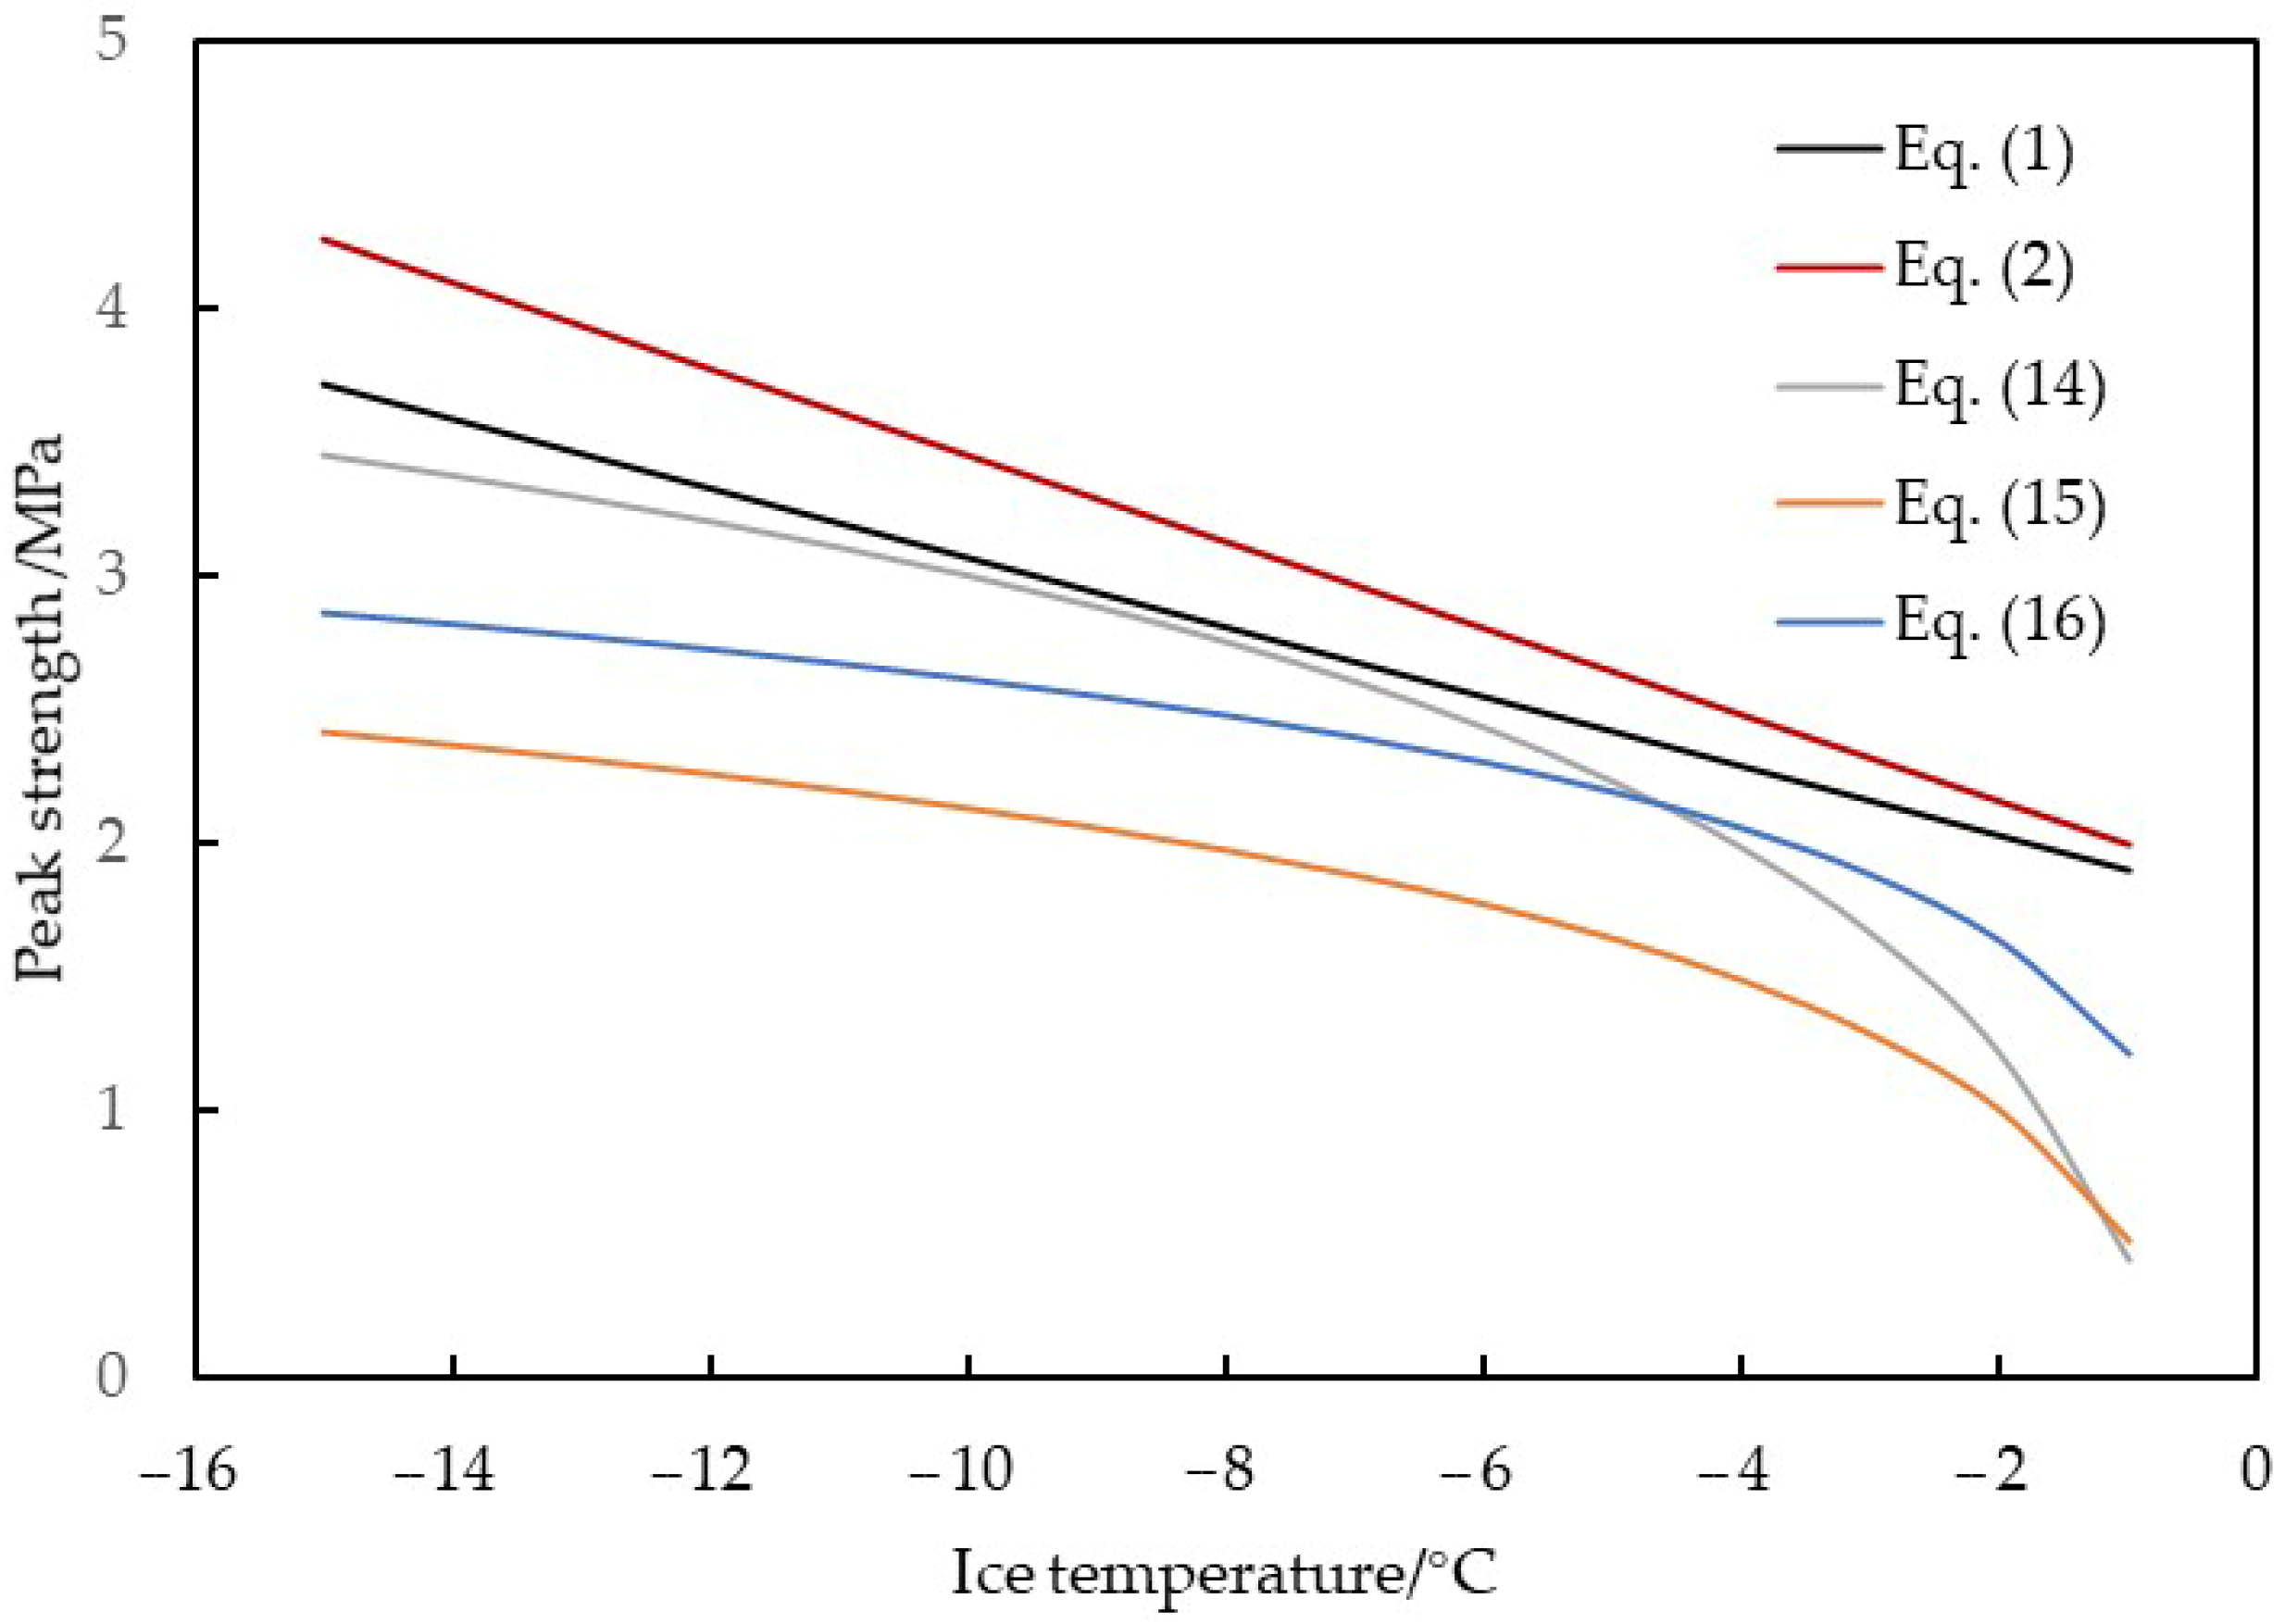
Recently, during the 2020/2021 winter, ice blocks were collected at different sites in the southern Bohai Sea (Feiyantan, No. 168 artificial island, and Zhuangxi 106). Ice samples were then machined to carry out uniaxial compressive strength tests of sea ice at different ice temperatures in the laboratory. Test results showed that as the temperature of the ice samples decreased, the uniaxial compressive strength of the sea ice increased. Previous studies have typically employed a linear relationship to fit the variation in the peak uniaxial compressive strength of ice with temperature. Although the linear fitting yielded good results, it fails to account for the fact that the ice strength approaches zero as the ice temperature nears the freezing point. Therefore, a nonlinear relationship was adopted for fitting, as shown in Equations (14)–(16).
For sea ice in the Zhuangxi 106 site,
σ c = 1.11 ln ( T i ) + 0.45
For sea ice in the No. 168 artificial island,
σ c = 0.7 ln ( T i ) + 0.52
For sea ice in the Feiyantan site,
σ c = 0.61 ln ( T i ) + 1.21
The relationship curves between the peak compressive strength of the sea ice and ice temperature, as derived from the aforementioned formulae, were compared in Figure 11. It can be observed that the formula for the sea ice in the Yellow River Estuary area (Equation (13)) and the code-specified formula (Equation (1)) all yield higher values than the recent laboratory-derived relationships between peak strength and ice temperature (Equations (14)–(16)). The discrepancy can be attributed to the impact of climate warming on ice conditions in China. Climate warming has made extremely low air temperatures less frequent, resulting in higher air temperatures during sea ice growth periods. The warmer environment increases the brine and gas content within the ice, leading to reduced strength. Compared to Equation (13), Equation (1) shows closer agreement with the field measurement data obtained in the 2020/2021 winter. The ice sampling sites for deriving Equation (13) were closer to the Yellow River Estuary, where sea ice has lower salinity and consequently higher strength. Therefore, Equation (1) was selected as the calculation formula for uniaxial compressive strength in this paper.

4.2. Comparions with Original CNOOC Guideline

The CNOOC Guideline was issued in 2002, reflecting sea ice conditions under prevailing climatic-hydrological regimes of the previous era. Comparing the sea ice parameters derived here with the values proposed in the CNOOC guideline provides climate-driven modifications in Bohai Sea ice conditions to some degree. As shown in Figure 4b and Figure 5b, the southern Bohai Sea exhibits marked declines in both average ice thickness and concentration.
Compared with the sea ice uniaxial compressive strength in the original standards, our refined grid division shows generally comparable design sea ice strength values across the southern Bohai Sea. The most notable differences occurred for 100-year, 50-year and 1-year return periods, where the original design values are slightly higher, but only by 0.05 MPa. For sea ice shear strength, there is no obvious difference either. The maximum difference was 43 kPa occurring under the 10-year return period design condition, while the minimum difference was 11 kPa which was observed for the 1-year return period scenario.
The flexural strength and tensile strength of sea ice show significant differences. Compared with the design sea ice flexural strength in the corresponding grids of the original standards, our refined grid yielded lower values. The original guideline provided design flexural strengths of 642.5–23.5 kPa for return periods varying from 100 to 1 years. The maximum differences reached 132 kPa for the 100-year return period, and the minimum difference was 85 kPa for the 5-year return period.
Compared with the design sea ice tensile strength in the corresponding grids of the original standards, our refined grid yielded lower values. The original guideline provided design flexural strengths of 331.5–237.5 kPa for return periods varying from 100 to 1 years. The maximum differences reached 103 kPa for the 100-year return period, and the minimum difference was 66 kPa for the 5-year return period.
Moreover, the original guideline characterizes southern Bohai Sea ice conditions using only two grid cells, which is not enough to resolve critical differences between nearshore and offshore ice regimes. The refined grid here successfully captures more detailed spatial variations in the design strength values of sea ice engineering parameters throughout the study waters. The most severe ice conditions occur in nearshore zones, exhibiting maximum values in thickness, concentration, and design ice strength. Across the southern Bohai Sea, the ice conditions display a distinct spatial gradient with Bohai Bay > offshore deep-water areas > Laizhou Bay.

4.3. Potential Impacts of Climate Change on Bohai Sea Ice Engineering

The Bohai Sea ice management authority in China classifies ice severity into five levels (Level 1–5) based on floating ice extent, where Level 1 represents the mildest conditions and Level 5 the most severe. With global warming, according to the China Marine Disaster Bulletin, from 1951 to 2023, the ice severity in the Bohai Bay has decreased from Level 4 towards Level 2 in general, and Laizhou Bay has declined from Level 3 towards Level 2 typically.
This changing ice regime is further evidenced by comparing our results with the original CNOOC guideline. Compared to the previous standards, our analysis yields lower values for key sea ice parameters, including ice thickness, concentration, and flexural and tensile strength. These changed ice parameters may carry significant practical implications for engineering in the Bohai Sea. The reduced ice thickness and ice strength will reduce ice loads on structure. The reduced ice loads translate directly into lighter and more economical structures, lowering material requirements and construction costs. It is also necessary to update design sea ice parameters to reflect the climate-driven reduction in ice severity, avoiding unnecessary over-engineering while maintaining safety margins appropriate for the actual, diminished ice hazard.

4.4. Limitations of the Study

There are several limitations in this study. First, the high-resolution sea ice strength model was specifically developed for the southern Bohai Sea and may be less applicable to other ice-covered regions due to unique local characteristics. Bohai Sea is the lowest-latitude freezing sea in the Northern Hemisphere, exhibiting significant interannual ice variability with maximum annual ice thickness not exceeding 0.5 m. Its shallow bathymetry, high water temperatures, substantial river discharge, and high brine/gas porosity in sea ice have led to the development of region-specific parameterization methods for ice strength (the approach adopted in this study). While regionally constrained, the core framework of nesting mechanical parameterization within climatic/oceanographic models provides transferable methodology for gridded ice strength assessment in other regions, including the Arctic.
Second, gridded sea ice strength values were calculated using standardized formulae recommended by established specifications, and were not validated by field measurements. Validating gridded strength data presents critical technical challenges. Sea ice strength measurements rely on in situ tests and exhibit diurnal variations due to changing ice temperatures. Achieving spatiotemporal resolution matching between field measurements and model outputs in the future may be an effective method.

5. Conclusions

Based on our previous high-resolution study of sea ice parameters in the Bohai Sea [16], this study extends the focus to the southern Bohai Sea where intensive oil and gas operations are located and sea ice strength properties are critical for engineering design.
As the most intensive offshore oil-gas development area in China, the southern Bohai Sea undergoes annual sea ice encroachment, creating unique operational challenges. Current design standards characterize this region with only two coarse-resolution grids for ice thickness, concentration, and strength parameters. Our study employed high-resolution meshing (minimum 1/12° grids) to partition the southern Bohai Sea into 51 zones. Utilizing the NEMO-LIM2 sea ice–ocean coupled model, the grid-specific outputs for ice thickness, concentration, and period were obtained, and through return-period analysis, design values of sea ice strength parameters were further derived for each grid. The analysis reveals pronounced spatial variations in ice conditions across the southern Bohai Sea. Nearshore zones exhibit the most severe ice conditions, demonstrating maximum values in thickness, concentration, and design ice strength. A clear spatial gradient of ice conditions is displayed in the southern Bohai Sea with Bohai Bay > offshore deep-water areas > Laizhou Bay.
Compared to the current standards of CNOOC, the mean ice thickness and concentration derived here were reduced. For design sea ice strength values, the flexural and tensile strength derived here were lower than those in the current standards. The reductions in sea ice thickness, concentration, and flexural strength compared to current standards yield significant engineering benefits. First, the lower ice loads enable substantial cost savings through optimized structural designs. Second, the mitigated ice–structure interactions directly reduce operational risks. Third, these findings support design enhancements such as revising ice load zoning maps for Bohai Sea offshore blocks.

Author Contributions

Conceptualization, G.L.; methodology, S.G.; software, X.C.; validation, Q.H. and D.G.; formal analysis, Q.H., D.G. and Y.Z.; investigation, G.L.; resources, L.W.; data curation, G.L.; writing—original draft preparation, G.L., Y.J. and Q.W.; writing—review and editing, Y.J. and C.R. All authors have read and agreed to the published version of the manuscript.

Funding

This research was funded by the National Natural Science Foundation of China (42206222 and 42276242) and the Open Fund of State Key Laboratory of Coastal and Offshore Engineering (SL2507).

Data Availability Statement

The original contributions presented in this study are included in the article. Further inquiries can be directed to the corresponding authors.

Acknowledgments

The authors thank the editor and anonymous reviewers for their valuable comments and suggestions to this paper.

Conflicts of Interest

Author Linfeng Wang was employed by the company China Petroleum & Chemical Corporation. The remaining authors declare that the research was conducted in the absence of any commercial or financial relationships that could be construed as a potential con-flict of interest.

Appendix A

The design strength values in the southern Bohai Sea for different return periods are shown in Table A1, Table A2, Table A3 and Table A4.
Table A1. The design uniaxial compressive strength (in MPa) of sea ice for different return periods.
Grid No.Return Period/Year
10050252010521
12.142.122.092.082.052.011.931.88
22.132.112.082.072.052.011.951.89
32.142.122.092.082.052.021.951.89
42.142.122.092.082.062.021.951.89
52.142.112.092.082.052.021.951.89
62.062.042.022.021.991.961.901.85
72.272.242.212.202.162.122.041.96
82.282.252.222.212.172.132.051.97
92.282.252.222.212.182.132.051.97
102.282.262.232.212.182.132.051.98
112.282.252.222.212.182.132.051.98
122.282.262.232.222.182.132.051.98
132.292.262.232.222.182.142.061.98
142.222.192.162.152.122.082.011.94
152.222.192.172.162.122.092.011.95
162.212.192.162.152.122.082.011.94
172.212.192.162.152.122.082.011.94
182.222.192.172.162.132.092.011.95
192.222.192.172.162.132.092.011.95
202.102.082.052.052.021.991.921.87
212.102.082.062.052.021.991.931.87
222.102.082.052.052.021.991.921.87
232.102.082.062.052.021.991.931.87
242.102.082.062.052.031.991.931.88
252.102.082.062.052.021.991.931.87
262.102.082.062.052.021.991.931.87
272.112.092.062.062.032.001.931.88
282.102.082.062.052.021.991.931.87
292.172.152.122.112.082.041.971.91
302.172.152.122.112.082.041.971.91
312.042.022.002.001.971.941.881.83
322.042.022.001.991.971.941.881.83
332.042.022.001.991.961.931.881.83
342.052.032.012.001.971.941.881.83
352.052.032.012.001.971.941.881.83
362.042.032.012.001.971.941.881.83
372.042.032.012.001.971.941.891.83
382.042.022.001.991.971.941.881.83
392.042.022.001.991.971.941.881.83
402.052.032.012.001.981.951.891.84
412.052.032.012.001.981.951.891.84
422.052.032.012.001.971.941.891.83
432.052.032.012.001.981.951.891.84
442.052.032.012.011.981.951.891.84
452.052.032.012.001.971.941.891.84
462.052.032.012.001.981.941.891.84
472.022.001.981.971.951.921.871.82
482.042.022.001.991.971.941.881.83
492.042.022.001.991.971.941.881.83
502.042.022.001.991.971.941.881.83
512.022.001.981.981.951.921.871.82
522.022.001.981.971.951.921.861.81
532.022.001.981.971.951.921.861.82
Table A2. The design shear strength (in kPa) of sea ice for different return periods.
Grid No.Return Period/Year
10050252010521
1107110591045104010241004965938
2106310531041103710231006973945
3106910581046104210271009976947
4107010591047104210281010977947
5106810571045104010261008974944
61032102210121008996980951926
71133111911041099108110591018981
81140112611111105108710651023986
91141112711121106108810661024987
101142112811131107108910671025988
111141112711121107108810671025988
121142112811131108108910671026989
131143113011151109109110691028991
141108109610821077106110421004972
151109109610831078106210431005973
161107109410811076106010411003971
171107109410811076106010411003971
181109109710841079106310431006973
191109109710841079106310431006973
2010491039102710231010993962934
2110511041102910251012995964936
2210491039102710231010993962934
2310511041102910251012995964936
2410521042103110271013997965938
2510501040102810251011994963935
2610501039102810241010994963935
2710531043103210281014998966939
2810511041103010261012996964937
29108510731060105610401022986955
30108510731060105610401022986955
31102110121001998985970941916
3210191010999996983968940914
3310181009999995982967939913
34102310141003999987972942917
35102310131003999986971942917
36102210131003999986971942917
37102210131003999986971943917
38102110111001997985970941916
39102010111000997984969940915
401025101510051001989973944919
411024101510041000988973943918
421023101410031000987972943917
431024101410041000988973944919
441027101710071003990975946921
451024101410041000987972943918
461024101410041000988972943918
4710101001991987975961933909
4810191010999996983968939914
4910191010999996983968939914
50101910101000996984969940914
5110101001991988976961934910
521008999989986974959932907
5310091000990986974960932908
Table A3. The design flexural strength (in kPa) of sea ice for different return periods.
Grid No.Return Period/Year
10050252010521
1520508495490474455419389
2517506494490476459427399
3522511499495480463430400
4523512500496481464430401
5515504492488474458428401
6487477467463450435405380
7584571556551533512471435
8591577562557539517475439
9592578563558540518476440
10593579564559541519477441
11592578563558540519478442
12593579564559541520478442
13594581566561543522480444
14559547534529513494458425
15560548535530514495458426
16558546533528512493456424
17558546533528512493456424
18561549536531515496459427
19561549536531515496459427
20504494482478464448416388
21507497485481467450418389
22504494482478464448416388
23507497485481467450418389
24499490479476463448419394
25506495484480466449417389
26505495483479465448416388
27501491481477465449420395
28508497486482468451418390
29537525513508493475440409
30537525513508493475440409
31474464454451438424395371
32471462452448436422394369
33470461451447435421393368
34474465455452439425397372
35474465455451439424396372
36474465454451439424396372
37475466456452440425397372
38473464454450438423395371
39472463453449437422394370
40477468457454442427398373
41476467456453441426398373
42475466456452440425397372
43477468457454442427398373
44479470460456444429400375
45475466456452440425397373
46475466456452440426397373
47466457446443431416388363
48471462452448436421393369
49471462452448436421393369
50471462452449436422394369
51467458447444431416388363
52463454444441429414386361
53464455445441429414386362
Table A4. The design tensile strength (in kPa) of sea ice for different return periods.
Grid No.Return Period/Year
10050252010521
1233224214210198184157136
2232224215212201188163142
3233225216213202189165144
4233225217213203190166144
5230223214211200188164143
6208201193190181169147127
7290279267263248231197168
8296284272268253235201171
9296285273269254236202172
10297286274269255237202172
11292281270265252235202174
12292282270266252235203175
13294283272268254237205177
14266257247243231216187162
15267258247244231216188162
16265256246242230215186161
17265256246242230215186161
18267258248244232217188163
19267258248244232217188163
20219212203200190178155134
21221213205202192180156135
22219212203200190178155134
23221213205202192180156135
24222215206203193181157136
25220213204201191179155135
26220212204201191179155135
27223216207204194182158137
28222214205202192180156136
29249240230226215200173149
30249240230226215200173149
31202194186183173161139121
32201193184181171159138120
33199191183180170158137119
34203195187184174162140122
35203195186183173162140121
36202195186183173161140121
37203195187184174162140122
38202194185182172160139121
39201193184181172160138120
40204196188185175163141123
41203196187184174163141122
42203195187184174162140122
43203195187184174163141123
44205197189186176165143124
45203196187184174162140122
46203196187184174162141122
47195187179176166155133116
48201193184181171159137120
49201193184181171159137120
50202193185182171159138120
51194186178175165154133116
52192184176173164152132115
53193185176174164153132115

References

  1. Wang, A.; Tang, M.; Zhao, Q.; Liu, Y.; Li, B.; Shi, Y.; Sui, J. Analysis of sea ice parameters for the design of an offshore wind farm in the Bohai Sea. Ocean Eng. 2021, 239, 109902. [Google Scholar] [CrossRef]
  2. Timco, G.W.; Weeks, W.F. A review of the engineering properties of sea ice. Cold Reg. Sci. Technol. 2010, 60, 107–129. [Google Scholar] [CrossRef]
  3. Li, Z.; Wang, Y. Design criteria of Bohai Sea ice-control engineering. Ocean Eng. 2000, 1, 61–64, 69. (In Chinese) [Google Scholar]
  4. Ji, S.; Wang, A.; Su, J.; Yue, Q. Experimental Studies on Elastic Modulus and Flexural Strength of Sea Ice in the Bohai Sea. J. Cold Reg. Eng. 2011, 25, 182–195. [Google Scholar] [CrossRef]
  5. Ji, S.; Liu, H.; Li, P.; Su, J. Experimental Studies on the Bohai Sea Ice Shear Strength. J. Cold Reg. Eng. 2013, 27, 244–254. [Google Scholar] [CrossRef]
  6. Wang, A.; Xu, N.; Ji, S. Characteristics of sea ice uniaxial compressive strength around the coast of Bohai Sea. Ocean Eng. 2014, 32, 82–88. (In Chinese) [Google Scholar]
  7. Shi, L.; Bai, Y.; Li, Z.; Cheng, B.; Leppäranta, M. Preliminary results on the relationship between thermal diffusivity and porosity of sea ice in the Antarctic. Chin. J. Polar Sci. 2009, 20, 72–80. [Google Scholar]
  8. Li, Z.; Zhang, L.; Lu, P.; Leppäranta, M.; Li, G. Experimental study on the effect of porosity on the uniaxial compressive strength of sea ice in Bohai Sea. Sci. China Technol. Sci. 2011, 54, 2429–2436. [Google Scholar] [CrossRef]
  9. Chen, X.; He, S.; He, W.; Wang, Z.; Ji, S. Tensile strength of sea ice using splitting tests based on the digital image correlation method. Adv. Polar Sci. 2021, 32, 374–381. [Google Scholar]
  10. Sun, J.; Chen, X.; Li, Q.; Gao, J.; Zhang, H.; Xu, Y. Temporal and spatial variation characteristics of sea ice conditions in the Bohai Sea from 1988 to 2018 based on remote sensing technology. J. Catastrophol. 2022, 37, 178–184. (In Chinese) [Google Scholar]
  11. Yan, Y.; Shao, D.; Gu, W.; Liu, C.; Li, Q.; Chao, J.; Tao, J.; Xu, Y. Multidecadal anomalies of Bohai Sea ice cover and potential climate driving factors during 1988–2015. Environ. Res. Lett. 2017, 12, 094014. [Google Scholar] [CrossRef]
  12. Ouyang, L.; Hui, F.; Zhu, L.; Cheng, X.; Cheng, B.; Shokr, M.; Zhao, J.; Ding, M.; Zeng, T. The spatiotemporal patterns of sea ice in the Bohai Sea during the winter seasons of 2000–2016. Int. J. Digit. Earth 2019, 12, 893–9098. [Google Scholar] [CrossRef]
  13. Yan, Y.; Uotila, P.; Huang, K.; Gu, W. Variability of sea ice area in the Bohai Sea from 1958 to 2015. Sci. Total Environ. 2020, 709, 136164. [Google Scholar] [CrossRef]
  14. Zheng, D.; Wang, Z.; Zhang, S.; Xu, P.; Zhou, Z. Interannual and indecadal variation of the sea ice in Bohai Sea and its mechanisms. Acta Oceanol. Sin. 2015, 37, 12–20. (In Chinese) [Google Scholar]
  15. Zhang, B. Regulations for Offshore Ice Condition & Application in China Sea; China National Offshore Oil Corporation: Beijing, China, 2002; Q/HSn 3000-2002. (In Chinese) [Google Scholar]
  16. Li, G.; Jiao, Y.; Chen, X.; Zhao, Y.; Li, R.; Guo, D.; Ge, L.; Hou, Q.; Wang, Q. Investigation of the recent ice characteristics in the Bohai Sea in the winters of 2005–2022 using multi-source data. Water 2024, 16, 290. [Google Scholar] [CrossRef]
  17. Karulina, M.; Marchenko, A.; Karulina, E.; Sodhi, D.; Sakharov, A.; Chistyakov, P. Full-scale flexural strength of sea ice and freshwater ice in Spitsbergen Fjords and North-West Barents Sea. Appl. Ocean Res. 2019, 90, 101853. [Google Scholar] [CrossRef]
  18. Aly, M.; Taylor, R.; Dudley, E.B.; Turnbull, I. Scale effect in ice flexural strength. J. Offshore Mech. Arct. Eng. Trans. ASME 2019, 141, 051501. [Google Scholar] [CrossRef]
  19. Huang, Y.; Han, J.; Sun, J.; Zhao, T. Size effects on the in-situ compressive behavior of first-year sea ice. Appl. Ocean Res. 2025, 154, 104395. [Google Scholar] [CrossRef]
  20. Chai, W.; Leira, B.; Høyland, K.V.; Sinsabvarodom, C.; Yu, Z. Statistics of thickness and strength of first-year ice along the Northern Sea Route. J. Mar. Sci. Technol. 2021, 26, 331–343. [Google Scholar] [CrossRef]
  21. Tarovik, O.; Yakimov, V.; Dobrodeev, A.; Li, F. Influence of seasonal and regional variation of ice properties on ship performance in the Arctic. Ocean Eng. 2022, 257, 111563. [Google Scholar] [CrossRef]
  22. Hvatov, A.; Nikitin, N.O.; Kalyuzhnaya, A.V.; Kosukhin, S.S. Adaptation of NEMO-LIM3 model for multigrid high resolution Arctic simulation. Ocean Model. 2019, 141, 101427. [Google Scholar] [CrossRef]
  23. Li, R.; Lu, Y.; Hu, X.; Guo, D.; Zhao, P.; Wang, N.; Lee, K.; Zhang, B. Space-time variations of sea ice in Bohai Sea in the winter of 2009–2010 simulated with a coupled ocean and ice model. J. Oceanogr. 2021, 77, 234–258. [Google Scholar] [CrossRef]
  24. Xu, N.; Chen, W.; Yuan, S.; Yue, Q.; Li, Z.; Ji, S.; Liu, X.; Shi, W.; Zhang, D.; Wang, R. The Specification for Engineering Sea Ice Techniques; State Oceanic Administration: Beijing, China, 2017; HY/T 047-2016. (In Chinese) [Google Scholar]
  25. Meng, G.; Zhang, M.; Li, Z.; Sui, J.; Yan, D. Compressive strength of low salinity sea ice and Yellow River ice in the Yellow River Estuary. Mar. Environ. Sci. 1994, 3, 72–80. (In Chinese) [Google Scholar]
Figure 1. Grid division in the southern Bohai Sea. The pink part represents land. Grids 1–6, 47, 51 are deep-water zones, grids 7–14, 43–50, 52–53 are nearshore shallow waters, grids 15–42 are high-priority operation areas.
Water 17 02465 g001
Figure 2. Average ice period in the southern Bohai Sea from 1951 to 2022.
Water 17 02465 g002
Figure 3. (a) Maximum and (b) average ice thicknesses from 1951 to 2022 in each grid division.
Water 17 02465 g003aWater 17 02465 g003b
Figure 4. The differences of (a) maximum and (b) average ice thicknesses at the refined grids compared to those at the grids in the CNOOC standard.
Water 17 02465 g004aWater 17 02465 g004b
Figure 5. (a) Maximum and (b) average sea ice concentrations from 1951 to 2022 in each grid division.
Water 17 02465 g005aWater 17 02465 g005b
Figure 6. The differences of (a) maximum and (b) average sea ice concentrations at the refined grids compared to those at the grids in the CNOOC standard.
Water 17 02465 g006
Figure 7. The design sea ice uniaxial compressive strength with different return periods of (a) 100, (b) 50, (c) 25, (d) 20, (e) 10, (f) 5, (g) 2, and (h) 1 years.
Water 17 02465 g007
Figure 8. The design sea ice shear strength with different return periods of (a) 100, (b) 50, (c) 25, (d) 20, (e) 10, (f) 5, (g) 2, and (h) 1 years.
Water 17 02465 g008
Figure 9. The design sea ice flexural strength with different return periods of (a) 100, (b) 50, (c) 25, (d) 20, (e) 10, (f) 5, (g) 2, and (h) 1 years.
Water 17 02465 g009
Figure 10. The design sea ice tensile strength with different return periods of (a) 100, (b) 50, (c) 25, (d) 20, (e) 10, (f) 5, (g) 2, and (h) 1 years.
Water 17 02465 g010aWater 17 02465 g010b
Figure 11. Comparisons between the varying trends of peak compressive strength of sea ice with ice temperature derived from different formulae.
Water 17 02465 g011
Table 1. The maximum, minimum, and average ice periods from 1951 to 2022 in each grid division.
Grid No.Maximum/dMinimum/dAverage/dGrid No.Maximum/dMinimum/dAverage/d
180035286405
280033296405
374025306405
471015316103
56909326103
66304336304
781033345906
882032355906
982031365907
1081031375202
1181030385203
1279030396203
1380031406304
1478029415904
1573022425906
1673022435102
1773022444703
18730194559010
19730194658010
20730194760010
21730224862014
22730224967016
23730225067018
2466075167018
2565065266019
2660055368018
276405
Disclaimer/Publisher’s Note: The statements, opinions and data contained in all publications are solely those of the individual author(s) and contributor(s) and not of MDPI and/or the editor(s). MDPI and/or the editor(s) disclaim responsibility for any injury to people or property resulting from any ideas, methods, instructions or products referred to in the content.