Article

Multiscale Analysis of Seepage Failure Mechanisms in Gap-Graded Soils Using Coupled CFD-DEM Modeling

1
College of Architecture, Anhui Science and Technology University, Bengbu 233030, China
2
School of Civil Engineering, Southeast University, Nanjing 210096, China
*
Author to whom correspondence should be addressed.
Water 2025, 17(16), 2461; https://doi.org/10.3390/w17162461
Submission received: 17 July 2025 / Revised: 5 August 2025 / Accepted: 16 August 2025 / Published: 19 August 2025
(This article belongs to the Special Issue Effects of Hydrology on Soil Erosion and Soil Water Conservation)

Abstract

Seepage erosion around sheet pile walls represents a critical failure mechanism in geotechnical engineering, yet the underlying mechanisms governing the onset of erosion remain poorly understood. This study presents a comprehensive multi-scale investigation employing a coupled computational fluid dynamics (CFD)-discrete element method (DEM) to elucidate the onset mechanisms of seepage erosion in gap-graded soils with varying the fines content under different hydraulic gradients. The results demonstrate that increasing the fines content enhances the overall erosion resistance, as evidenced by reduced particle mobilization and eroded mass ratio. Particle tracking analysis reveals that the fines content fundamentally influences the spatial distribution of the erosion. Specimens with low fines content exhibit distributed erosion throughout the domain, while specimens with higher fines content show concentrated erosion around the sheet pile wall and downstream regions. Micromechanical analysis of local contact fabric and contact forces indicates that this spatial heterogeneity stems from the mechanical coordination number and mechanical redundancy, characterized by the reduced magnitudes of these parameters for the region with lower erosion resistance. These findings establish that the fines content governs both global erosion resistance and spatial erosion patterns, providing essential insights for optimizing soil gradation design and advancing fundamental understanding of seepage erosion mechanisms.

1. Introduction

Internal erosion represents one of the most critical failure mechanisms threatening the integrity of dam embankments [1] and rocks [2,3,4,5], which commonly adopt the sheet piles/cutoff walls to control seepage in geotechnical engineering practice. This phenomenon manifests through hydraulically induced changes in water content within the soil skeleton structure, resulting in preferential flow pathways through the porous matrix and inducing effective stress reduction with subsequent particle mobilization under seepage forces. The literature classifies internal erosion mechanisms into different categories based on the behavior of soil bulk, including suffusion, concentrated leak erosion and backwards erosion [6]. The internal erosion process typically initiates through suffusion, characterized by the detachment and transport of fine particles through the coarse soil matrix under hydraulic loading, progressively leading to the development of flow channels, and ultimately resulting in piping failure, and potential soil heave or boiling phenomena. In recent decades, tremendous research efforts have significantly advanced understanding of suffusion processes in granular materials. However, the complex mechanisms governing seepage failure in embankments with sheet piles remain inadequately characterized, representing a critical knowledge gap in seepage-induced failure analysis.
Particle size distribution emerges as a fundamental parameter controlling the susceptibility and progression of internal erosion in granular soils. The geometric arrangement and size relationships between soil particles directly influence pore network connectivity, hydraulic conductivity anisotropy, and the critical conditions required for particle mobilization [7]. Extensive research has demonstrated that specific gradation characteristics significantly affect the onset and evolution of suffusion processes [8,9,10,11]. Tomlinson and Vaid [10] identified the grain-size ratio D 15 f D 85 s as a critical parameter governing the internal erosion susceptibility, demonstrating that soil structures exhibit erosion immunity when this ratio remains below 8, while spontaneous piping occurs when the ratio exceeds 12. Furthermore, Wan and Fell [11] found the gap-graded soils tended to exhibit erosion at lower gradients than non-gap-graded soils under the same fines content, highlighting the significance of gradation characteristics in controlling internal stability.
The theoretical understanding of seepage-induced failure mechanisms has evolved significantly since Terzaghi’s [12] pioneering work, which first quantified the influence of seepage flow on the stability of sheet pile walls and established a safety factor formulation for hydraulic heave prediction. Subsequent investigations by Tanaka and Verruijt [13] revealed the critical dependence of hydraulic gradient thresholds on soil permeability anisotropy, leading to the development of the Prismatic failure concept for evaluating critical hydraulic head conditions in both one-layer anisotropic soils and stratified two-layer systems. More recently, Luo et al. [14] conducted comprehensive analyses of internal erosion evolution under varying particle size distribution conditions, demonstrating the development of heterogeneous stress fields within internally unstable soil masses and providing insights into the coupled hydro-mechanical processes governing seepage failure progression.
Given the complex interplay between particle characteristics, hydraulic conditions, and failure mechanisms identified in previous studies, advanced numerical approaches have become essential for understanding internal erosion processes at multi-scales. The advancement of numerical techniques has established computational modeling as an indispensable tool for elucidating the fundamental mechanisms governing internal erosion processes. Cundall and Strack [15] pioneered the discrete element method (DEM) for particle-based system simulations, enabling access to particle-scale data essential for the mechanistic analysis. Scholtes et al. [16] implemented this approach to investigate internal erosion processes through progressive removal of the finest particles from soil matrices under constant stress conditions, providing insights into how failure is triggered when particle removal occurs. Zou et al. [17] identified representative particle size ratios, hydraulic gradients, and erosion duration as critical parameters governing particle transport mechanisms in base soil-filter systems through DEM analyses. Furthermore, Shire et al. [18] examined the internal stability of gap-graded specimens by analyzing fabric evolution and effective stress distributions, demonstrating that the particle size distribution characteristics, fines content, and relative density significantly influence stress distribution within the granular assembly. While DEM simulations provide exceptional capability for microscopic process characterization, their application remains limited in modeling hydraulic geo-structures due to the absence of fluid consideration, where complex fluid-structure interactions and multiphase flow phenomena govern the overall system behavior.
The multiphase nature of seepage phenomena necessitates comprehensive simulation approaches capable of accurately representing the coupled behavior of solid particles and fluid flow, leading to the emergence of computational fluid dynamics (CFD)-DEM coupling as a predominant framework for investigating solid–fluid system mechanics. Tsuji et al. [19] pioneered the application of this coupled technique for fluidized bed modeling, which was then widely employed in geotechnical applications, including landslide dynamics [20,21,22] and liquefaction phenomena [23]. Concerning internal erosion, Kawano et al. [24] demonstrated significant reductions in coordination numbers under fluid flow influence, particularly for mobilized fine particles, highlighting the critical role of fluid–particle interactions in altering granular fabric. More recently, Liu et al. [25] utilized CFD-DEM simulations to investigate suffusion mechanisms in underfilled gap-graded sandy gravels, revealing that particle contact evolution provides fundamental insights into the suffusion phenomenon. These findings collectively demonstrate the efficacy of CFD-DEM coupling in capturing the complex hydro-mechanical processes governing internal erosion, providing detailed insights into particle-scale mechanisms that are difficult to observe experimentally.
While the existing literature establishes the significant influence of the particle size distribution and fines content on internal erosion behavior, a fundamental understanding of how the initial fines content affects the onset and evolution of seepage erosion within sheet piles remains inadequately characterized. This knowledge gap limits the development of predictive frameworks for assessing seepage-induced instability in granular materials under varying gradation conditions. The primary objective of this investigation is to elucidate the underlying mechanisms governing the onset of seepage erosion in gap-graded soil skeleton within sheet piles through comprehensive CFD-DEM simulations. The study systematically examines the seepage processes in soil under varying fines content and hydraulic gradient scenarios, providing mechanistic insights into failure progression at the particle scale. The computational methodology, theoretical framework, and numerical model setup are presented in Section 2, followed by the macroscopic behavior of seepage erosion in Section 3. Section 4 presents the comprehensive particle-scale analyses and mechanistic interpretations of the observed phenomena. Finally, Section 5 presents the concluding remarks of the findings.

2. Methodology and Numerical Model Setup

2.1. Description of CFD-DEM

The fluid typically involves multiphase interactions between water and air phases in geotechnical processes such as excavation. To simulate these multi-phase processes, this study developed an improved CFD-DEM software based on the open-source software. The discrete particles were mimicked by the LAMMPS improved for general granular and granular heat transfer simulations (LIGGGHTS) software (v3.8) [26], and the fluid flow was simulated by the Open Field Operations and Manipulation software (OpenFOAM) software (v5.x) [27]. The software has been widely used for the simulation of particle flow and fluidized bed [28,29]. The following graph gives the coupling procedures of the software. The information about the particles is calculated from the DEM solver first and passed to the CFD solver for determining the corresponding cell. For each cell, on the basis of the particle volume fraction, it estimates the particle–fluid forces acting on each particle to determine the momentum exchange terms. The results are then returned to the DEM solver for updating the position of the particles and repeating the routines, as shown in Figure 1.
The OpenFOAM software employs the finite volume method to discretize the complex geometries into cells control volumes. The following continuity equation is held to satisfy the conservation form on each control volume,
α f t + α f u f = 0
where u f is the velocity of fluid flow, denotes the Laplace operator, and α f is a volume phase-fraction coefficient representing the initial fluid region.
The motion of an incompressible flow is governed by the volume-averaged Navier–Stokes equation as,
α f u f t + α f u f u f = α f p ρ f K s l u f u p + τ
where ρ f is the density of fluid flow and u p is the averaged particle velocity. The stress tensor for the fluid phase is represented by τ = ν f u f , where ν f is the fluid viscosity, u f is the average fluid velocity, and K s l denotes the momentum exchange with the particulate phase.
For multi-phase fluid, the volume phase-fraction α f = α 1 + α 2 , where α 1 and α 2 are the volume fractions of the different fluid, respectively. In this study, the water phase refers to α f = 1 while the air phase refers to α f = 0 . In such a case, the density and viscosity of the multi-phase fluid are estimated as ρ f = α 1 ρ 1 + α 2 ρ 2 and ν f = α 1 ν 1 + α 2 ν 2 , respectively. The pressure difference across the interface Δ p is estimated using the Young–Laplace equation, expressed as follows:
Δ p = σ k n ^
where σ is the surface tension coefficient, n ^ = α f , is the unit normal vector perpendicular to the interface, and k is the curvature of interface, estimated as k = n ^ / n ^ . In this study, the surface tension coefficient is set to 0.072 N/m.
The CFD method divides the momentum exchange into an implicit and an explicit term, comprising numerous models for estimating the interaction force between the particle and the fluid, stemming from either the hydrostatic forces or the hydrodynamic forces. For the numerical simulation, it often concerns the fluid–particle interaction force in terms of the fluid drag force and the buoyancy force as the typical hydrodynamic force and hydrostatic force, respectively. Di Felice [30] gives the evaluation of the drag force as
K s l = 3 4 C d u f u p d p ε 1 χ
C d = 0.63 + 4.8 R e p 2
χ = 3.7 0.65 exp 1.5 lg R e p 2 2
Then, the drag force is estimated as
F d p = K s l V p u f u p
where F d p and V p are the drag force and volume of each particle, respectively.
The volumetric fluid–particle interaction force F d is determined by the total drag force of the particles inside the cell as
F d = F d p V c e l l
in which V c e l l is the total volume of particles for each cell.
The developed CFD-DEM solver has been validated through simulations of water droplets and seepage processes with stratified soil, as documented in the authors’ previous published work [31,32]. Similar behavior of seepage failure was observed compared with the experimental tests of Tanaka and Verruijt [13]. Furthermore, details for the software and coupling procedures can also be found in Xiao and Wang [31].

2.2. Simulation Process

2.2.1. Material Properties

Gap-graded particle systems have been extensively utilized in internal erosion investigations due to their enhanced susceptibility to particle mobilization, as demonstrated by Wan and Fell [11] who established that gap-graded soils exhibit preferential erosion initiation compared to well-graded materials. Binary particle systems are widely used to simulate gap-graded soils and have proven effective for studying internal erosion mechanisms [25,33,34,35,36]. Kezdi [37] proposed that the soil will be considered internally unstable if the ratio of D 15 c / d 85 f 4 , where D 15 c represents the diameter at 15% finer by weight in the coarse component and d 85 f is the diameter at 85% finer by weight in the fine component. Following Liu et al. [36], the system consists of coarse particles with a diameter of 2.0 mm and fine particles with a diameter of 0.5 mm, resulting in a ratio of D 15 c / d 85 f equaling to 4, which can be identified as internal unstable soil and is ideal for investigating the onset mechanisms of seepage erosion. Based on the work of De Frias Lopez et al. [38], three different fines content (FC), as 30%, 50% and 70%, were prepared to simulate the interactive-underfilled, interactive-overfilled, and overfilled condition, respectively, which were used to enhance understanding of the fines content on the influence of the onset of seepage erosion behavior.
The inter-particle mechanical interactions are simulated by the Hertz–Mindlin contact model. A reduced modulus has been widely used to simulate the erosion process using CFD-DEM in previous studies [25,34,36], which demonstrated that particle stiffness has negligible influence on erosion mechanisms. Furthermore, El Shamy and Zeghal [39] studied the influence of modulus on the steady-state response of pore fluid and particles subjected to upward fluid flow and observed consistent results with only minor local variations for moduli of 2.9 × 10 10 and 2.9 × 10 6 Pa, respectively. Hence, this study simulates the particles with a scaled Young’s modulus to save the computation effort. The mechanical properties of the particle and boundary are summarized in Table 1. For the coupled DEM-CFD simulation framework, the data exchange frequency between DEM and CFD was established at 10 steps to ensure adequate coupling efficiency. The timesteps of the DEM and CFD solver were set to 5 × 10 6 and 5 × 10 5 s, respectively.

2.2.2. Numerical Procedure

Sample preparation was conducted exclusively using LIGGGHTS software. The particles were randomly generated within the computational domain, followed by gravitational deposition until the quasi-static equilibrium conditions were achieved. The simulations were conducted to examine the onset and development of seepage failure relevant to the excavation process or the construction of sheet pile systems. Considering computational efficiency, a scaled granular packed bed is simulated with a sheet pile wall positioned at the center of the sample. To replicate typical excavation scenarios encountered in geotechnical practice, asymmetric soil deposit configurations were established with the particle bed heights of 30 mm and 40 mm on the downstream and upstream sides of the retaining wall, respectively.
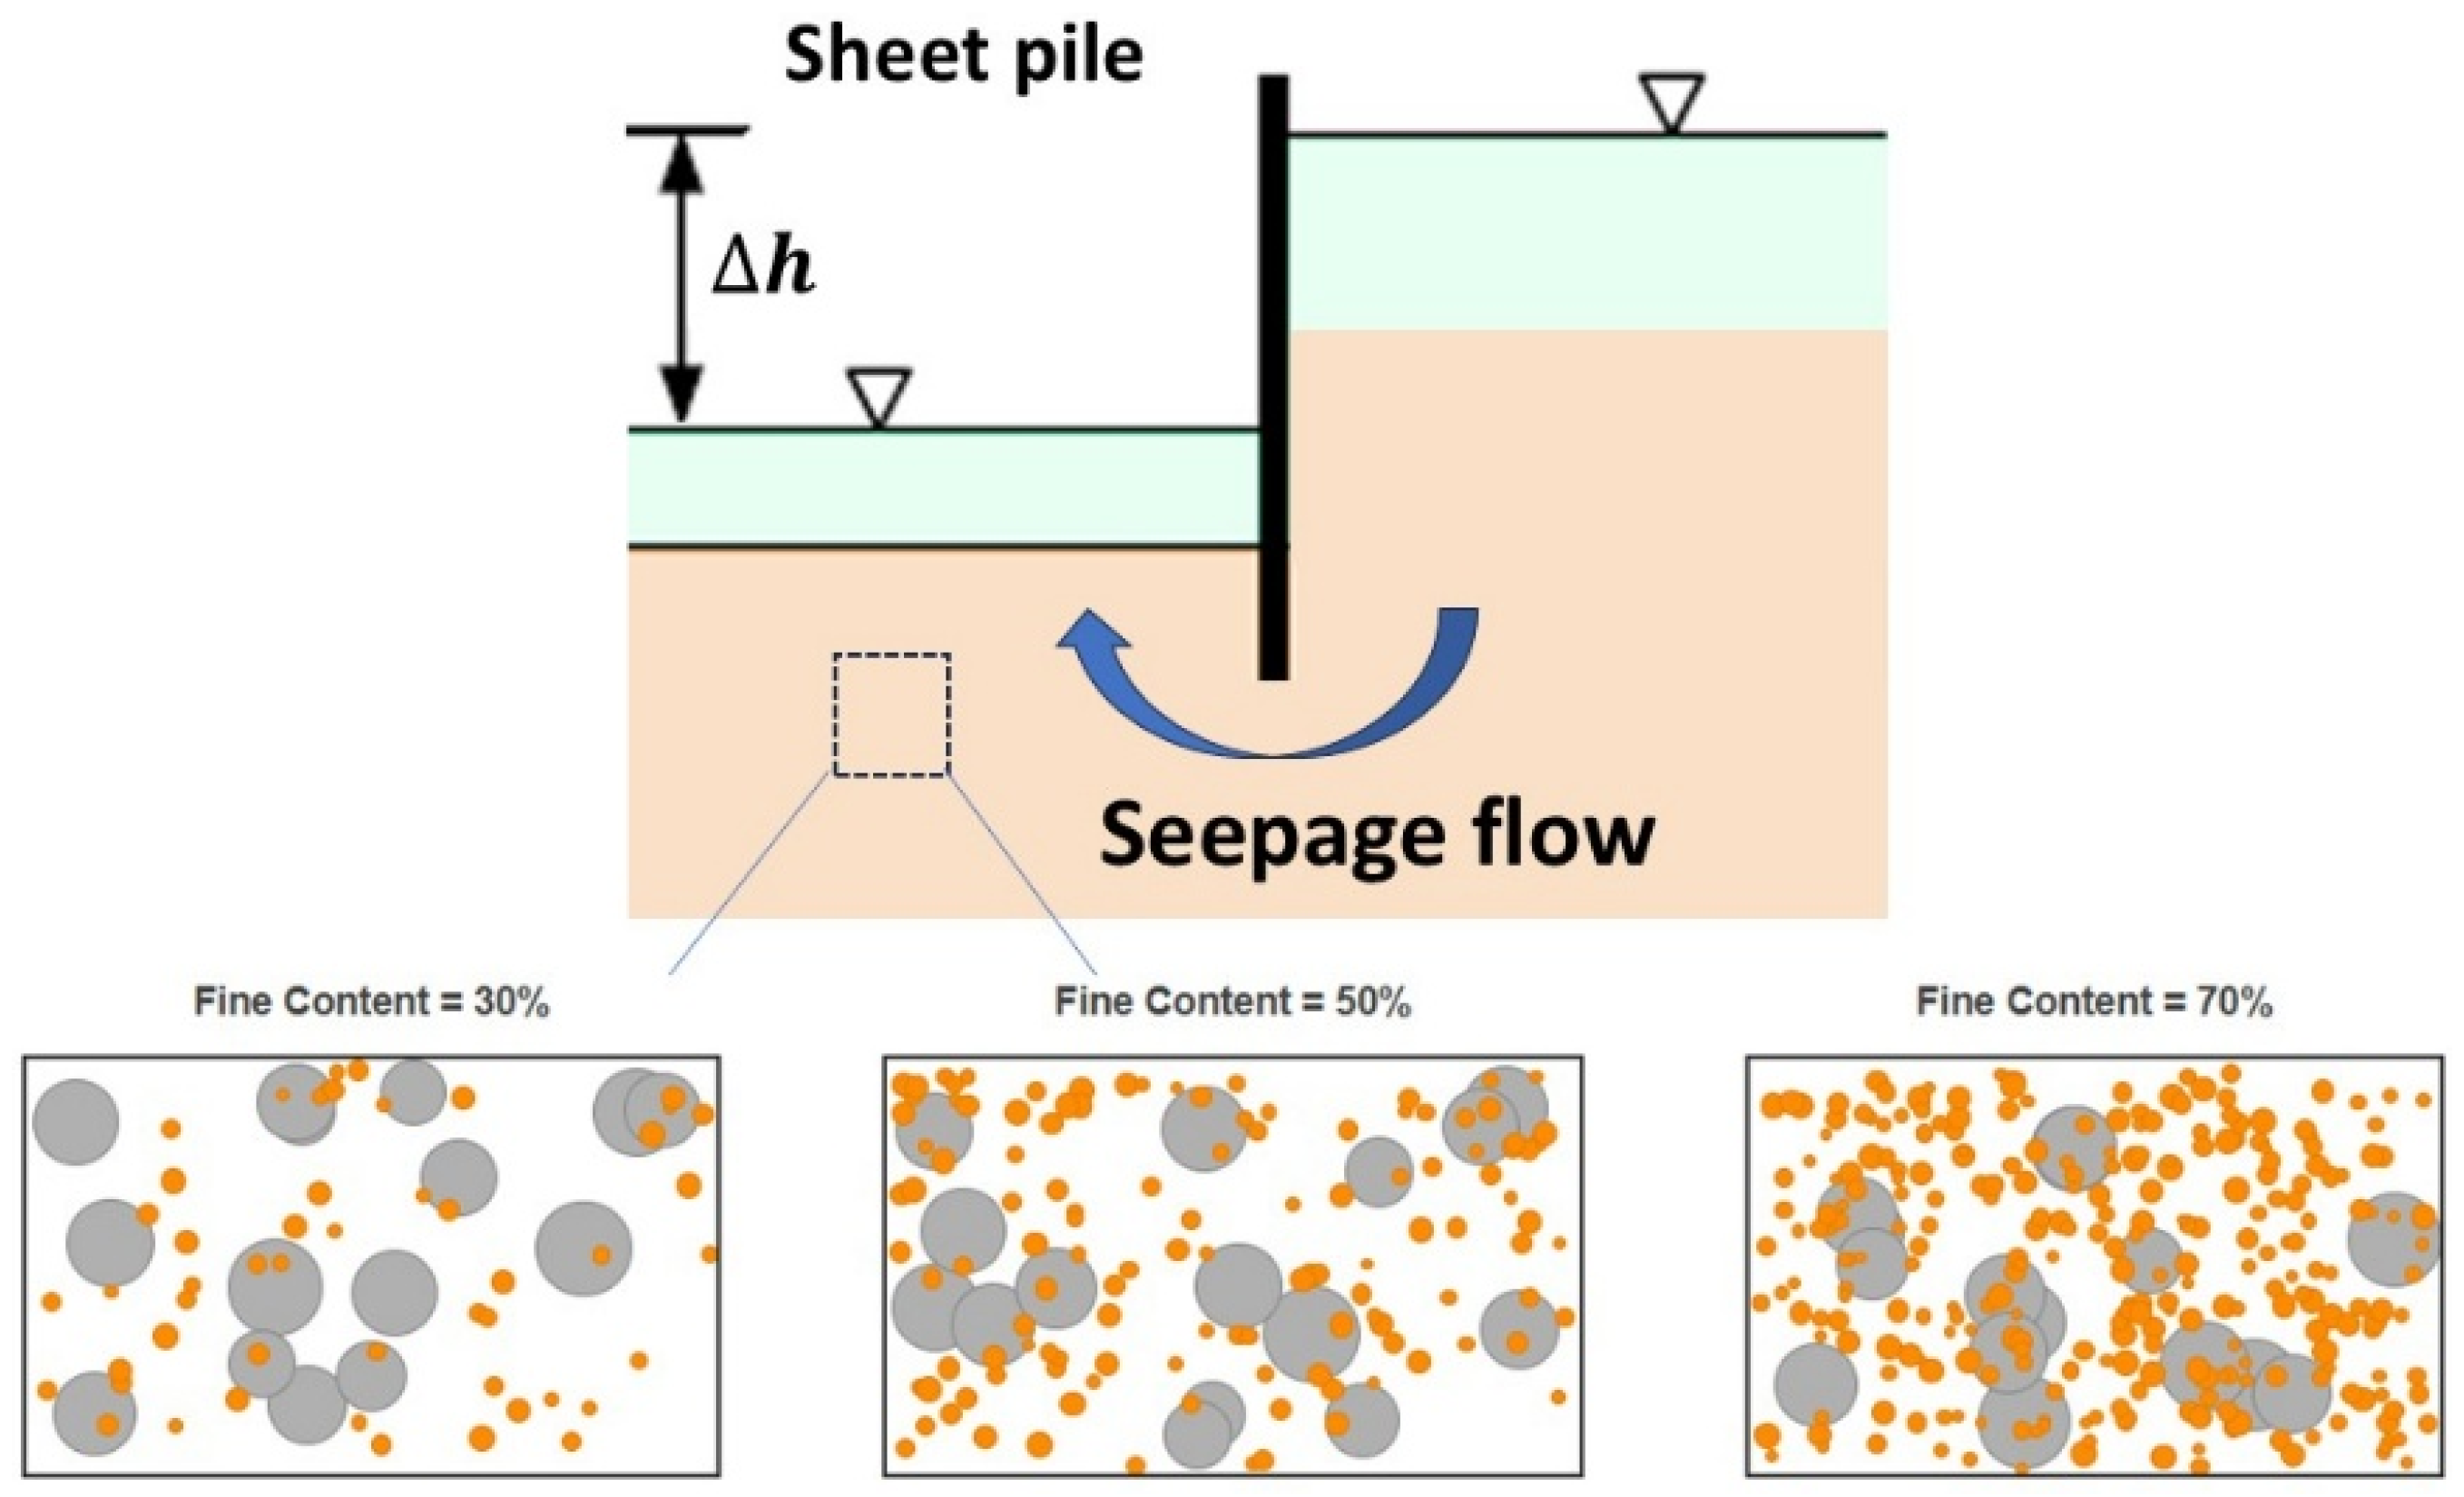
The sheet pile is placed with a distance of 0.025 m to the bottom. According to the work of Terzaghi and Peck [40], the seepage heave behavior for the lifting of the soil block occurs within the width of D/2, where D refers to the embedment depth of the retaining wall. In such a case, the numerical model dimensions are set to 0.06 m in both x- and y-directions, which is sufficient to capture the complete failure mechanism while eliminating boundary effects. The dimension of the sheet pile wall is 0.005 m in the x-direction, representing 1/12 of the sample width. Figure 2 illustrates the schematic diagram for the numerical model configuration and detailed sample specifications are presented in Table 2.
The seepage erosion progress was started following the completion of the DEM model generation. The CFD mesh configuration was established as consistent with the work of Xiao and Wang [31] to ensure computational compatibility. Seepage flow conditions were imposed by establishing different water tables across the sheet pile boundaries, with the left side of the boundary defined as the downstream side containing an initial hydraulic head of 0.025 m. Correspondingly, the right side of the boundary is determined as the upstream side, with the initial water table denoted as h. Different hydraulic gradient conditions were achieved through systematic variation of the h values. Based on the findings of Xiao and Wang [31], who demonstrated that the heave phenomenon is difficult to be observed under h < 0.06 m. Hence, this study investigates three scenarios with h equaling to 0.06, 0.07, and 0.08 m to simulate the onset, intermediate development, and significant seepage heave behavior, respectively. Since this work focused on the fundamental mechanisms of onset of seepage failure, simulations are conducted using the laminar model without turbulence considerations. The properties of fluid are detailed in Table 3.

3. Macroscale Observations of Seepage Erosion

3.1. Spatial Distribution of Particle Velocity

Figure 3 illustrates the spatial distribution of the particle velocity field for the three samples with varying fine contents at t = 0.1 s under a hydraulic head of h = 0.06 m. The velocity magnitude contours reveal different erosion patterns, with Sample FC30 exhibiting pronounced localized particle mobilization near the sheet pile interface, while Sample FC70 demonstrates significantly reduced particle mobilization throughout the domain. The results indicate that increasing fine content enhances erosion resistance through a reduction in particle velocities. Furthermore, the higher velocity observed adjacent to the sheet pile wall, in particular for Sample FC50, suggest that the hydraulic erosion preferentially initiates particle detachment at the upstream side. Subsequently, the erosion process propagates to the downstream side, developing preferential flow channels and enhancing particle mobilization.
To examine the temporal evolution of seepage erosion under enhanced hydraulic loading conditions, Figure 4, Figure 5 and Figure 6 present the particle velocity distributions for the three specimens at an increased hydraulic head of h = 0.08 m during seepage. The temporal progression reveals that Sample FC30 maintains consistently higher particle velocities and more extensive erosion zones throughout the observation period, with erosion patterns initiating near the sheet pile interface and propagating downstream as flow pathways become established. As the erosion process develops, particle velocities gradually decrease across all samples, indicating the achievement of quasi-steady flow conditions. Notably, the temporal evolution demonstrates that while initial particle mobilization occurs rapidly, the system progressively stabilizes with higher agitation occurring near the sheet pile wall on the downstream side. Furthermore, compared to Figure 4, the higher hydraulic gradient enhances the detachment on the downstream side, even for Sample FC50 and Sample FC70, which showed minimal erosion under lower hydraulic loading. These observations align with experimental findings reported in the literature [5,6], confirming the capability of the numerical model to capture realistic seepage erosion mechanisms.

3.2. Evolution of Eroded Mass Ratio

The eroded mass ratio serves as a fundamental parameter for characterizing seepage-induced erosion behavior. Following the criterion established by Xiao and Wang [31], the particles are classified as eroded when the drag force exceeds the particle weight. The eroded mass ratio is subsequently calculated as the cumulative mass of eroded particles normalized by the initial total mass. Figure 7 illustrates the temporal evolution of eroded mass ratio for the three samples subjected to different hydraulic gradients, revealing a pronounced inverse correlation between the initial fines content and the erosion resistance. Specimens with a lower fines content exhibit significantly higher eroded mass ratios, indicating reduced erosion resistance. Consistent with the particle velocity distributions shown in Figure 3, Figure 4, Figure 5 and Figure 6, Sample FC30 demonstrates rapid initial erosion development, achieving quasi-steady conditions within approximately 0.1 s under all hydraulic conditions. This behavior reflects the rapid formation of preferential flow channels in low-fines-content specimens, which facilitates enhanced fluid transport and rapid achievement of quasi-steady flow conditions. Conversely, specimens with a higher fines content (Sample FC50 and FC70) exhibit more gradual erosion progression, with Sample FC70 showing the most protracted transition to equilibrium conditions due to its denser soil matrix.
The influence of the hydraulic gradient magnitude is critically significant across all sample configurations, with a higher hydraulic gradient inducing greater eroded particles. Notably, under h = 0.08 m, while Sample FC30 exhibits a higher initial eroded mass ratio, specimens with a higher fines content demonstrate continuous erosion development, ultimately converging toward similar final erosion ratios. This convergence suggests that the hydraulic gradient intensity can partially compensate for the protective effects of a higher fines content under sustained loading conditions.

3.3. Evolution of Particle Migration

The behavior of particle displacement was further investigated to analyze particle migration under seepage-induced flow conditions. Within the soil matrix, coarse particles constitute the primary load-bearing skeleton, while fine particles are susceptible to transport and mobilize during the erosion process. Accordingly, following the work of Wang et al. [33], the average fine particle displacement D f was examined to evaluate the particle transport, with the expression as
D f = i = 1 N f S i N f
in which N f represents the number of eroded fine particles and S i is the displacement of particle i.
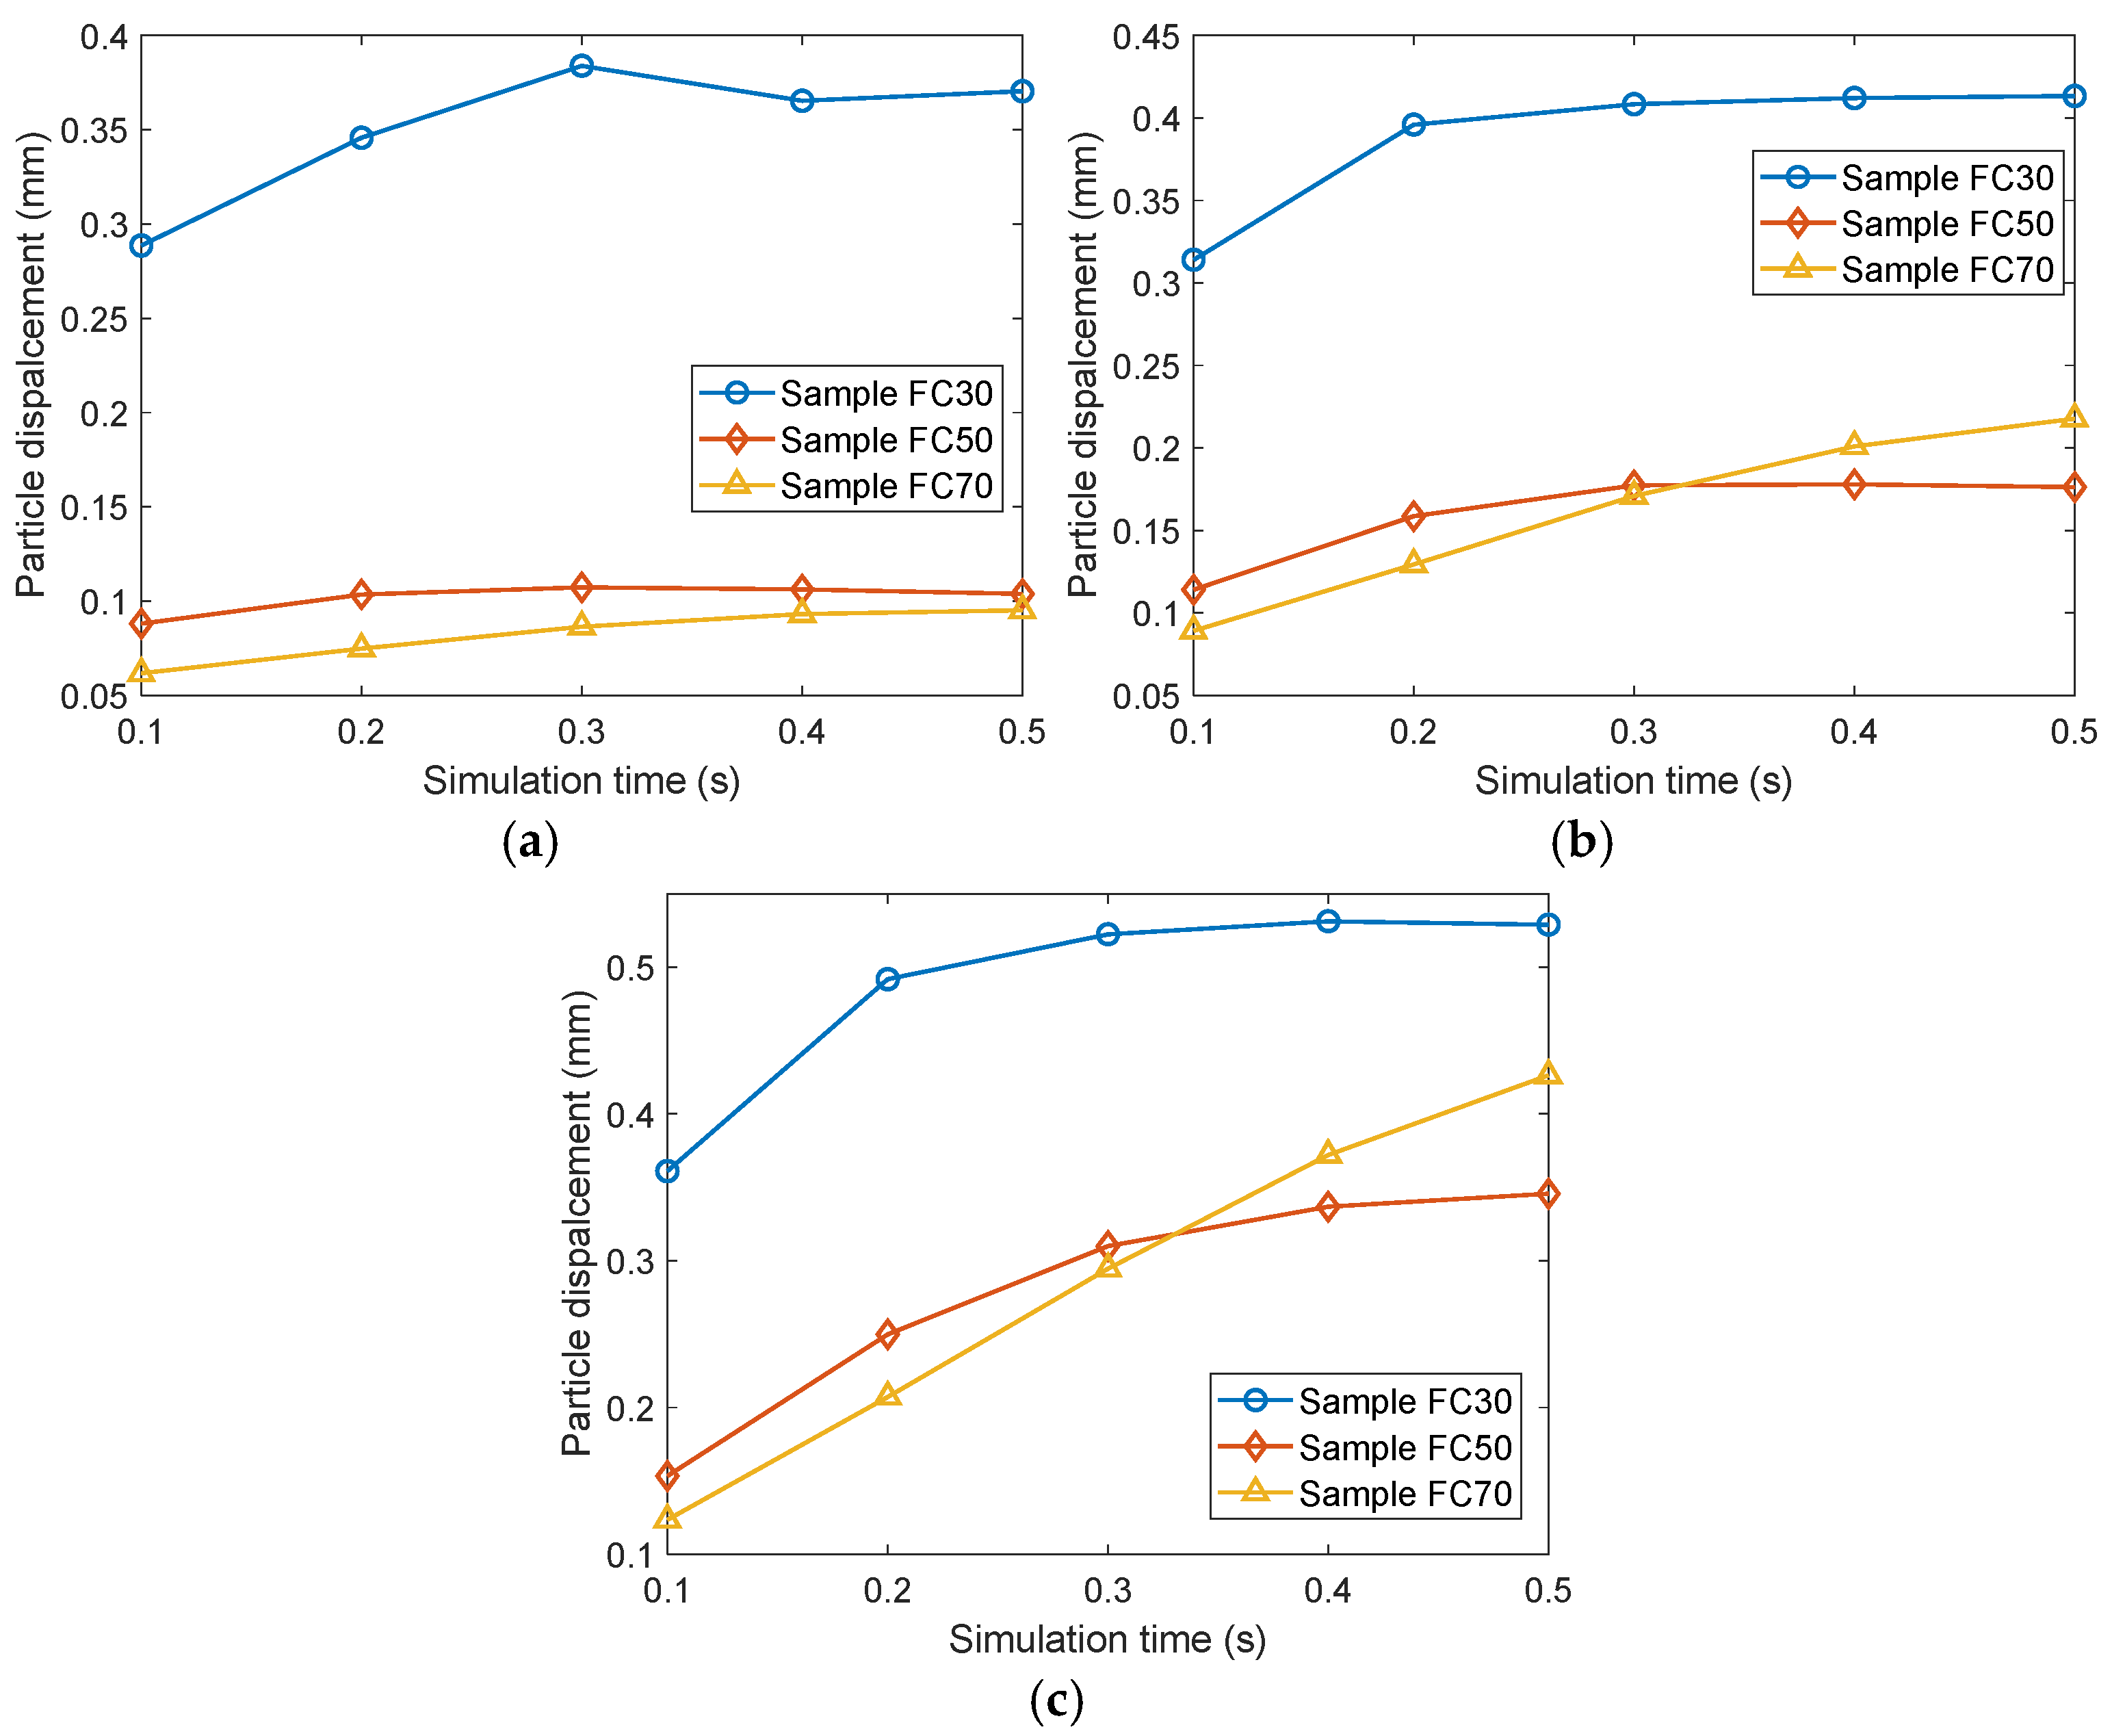
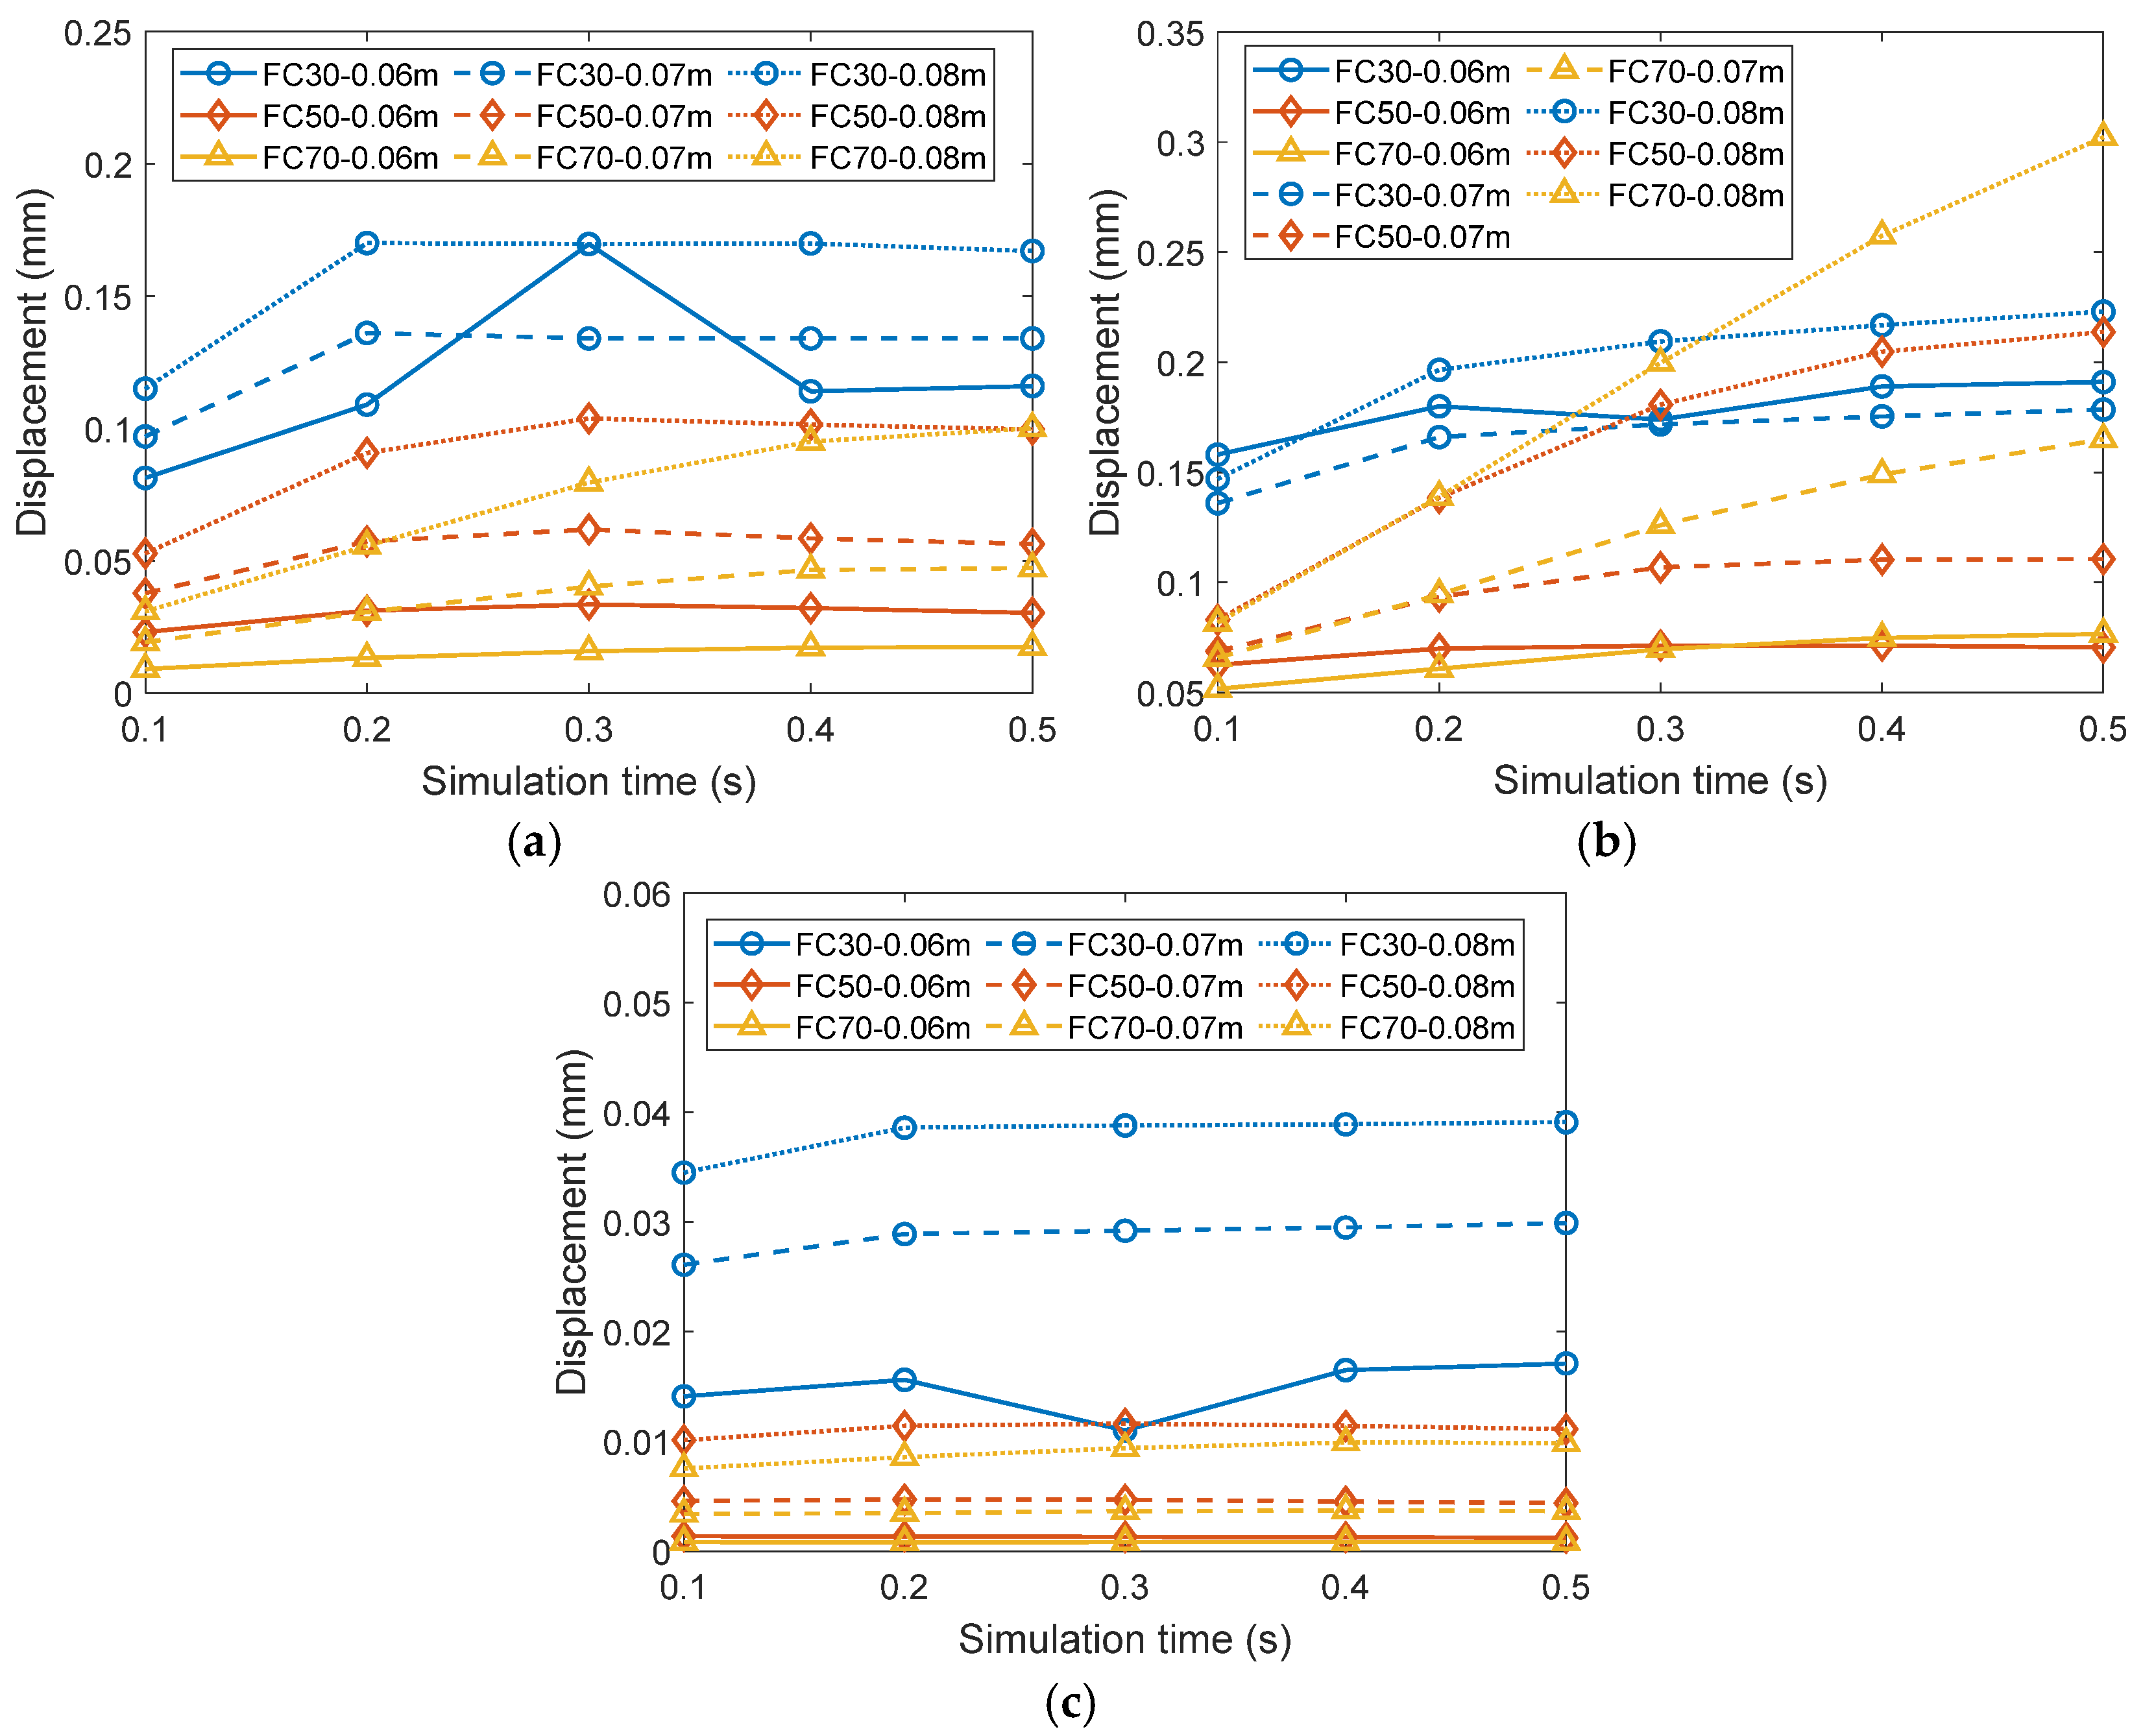
Figure 8 portrays the temporal evolution of the average fine particle displacement during the erosion process for the three samples subjected to varying hydraulic gradients. The results demonstrate a characteristic progression wherein the average fine particle displacement increases monotonically with simulation time until reaching quasi-steady conditions, exhibiting strong consistency with the erosion ratio behavior presented in Figure 7. A direct correlation exists between erosion resistance and particle mobility, with specimens exhibiting higher erosion ratios demonstrating correspondingly greater average fine particle displacements. Sample FC30 consistently shows the highest particle displacement across all hydraulic conditions. Additionally, higher hydraulic gradients induce progressively greater particle displacements. Notably, Sample FC70 exhibits distinctive behavior characterized by gradual but sustained particle migration. While initially demonstrating lower displacement rates compared to Sample FC50, the prolonged erosion process in FC70 ultimately results in higher average fine particle displacement at the final stage, particularly under higher hydraulic gradients. The results indicate that intensified hydraulic forcing can overcome the stabilizing effects of a higher fines content, resulting in sustained particle migration during the intermediate erosion phase and enhanced cumulative displacement despite initially superior erosion resistance.

3.4. Evolution of Void Ratio

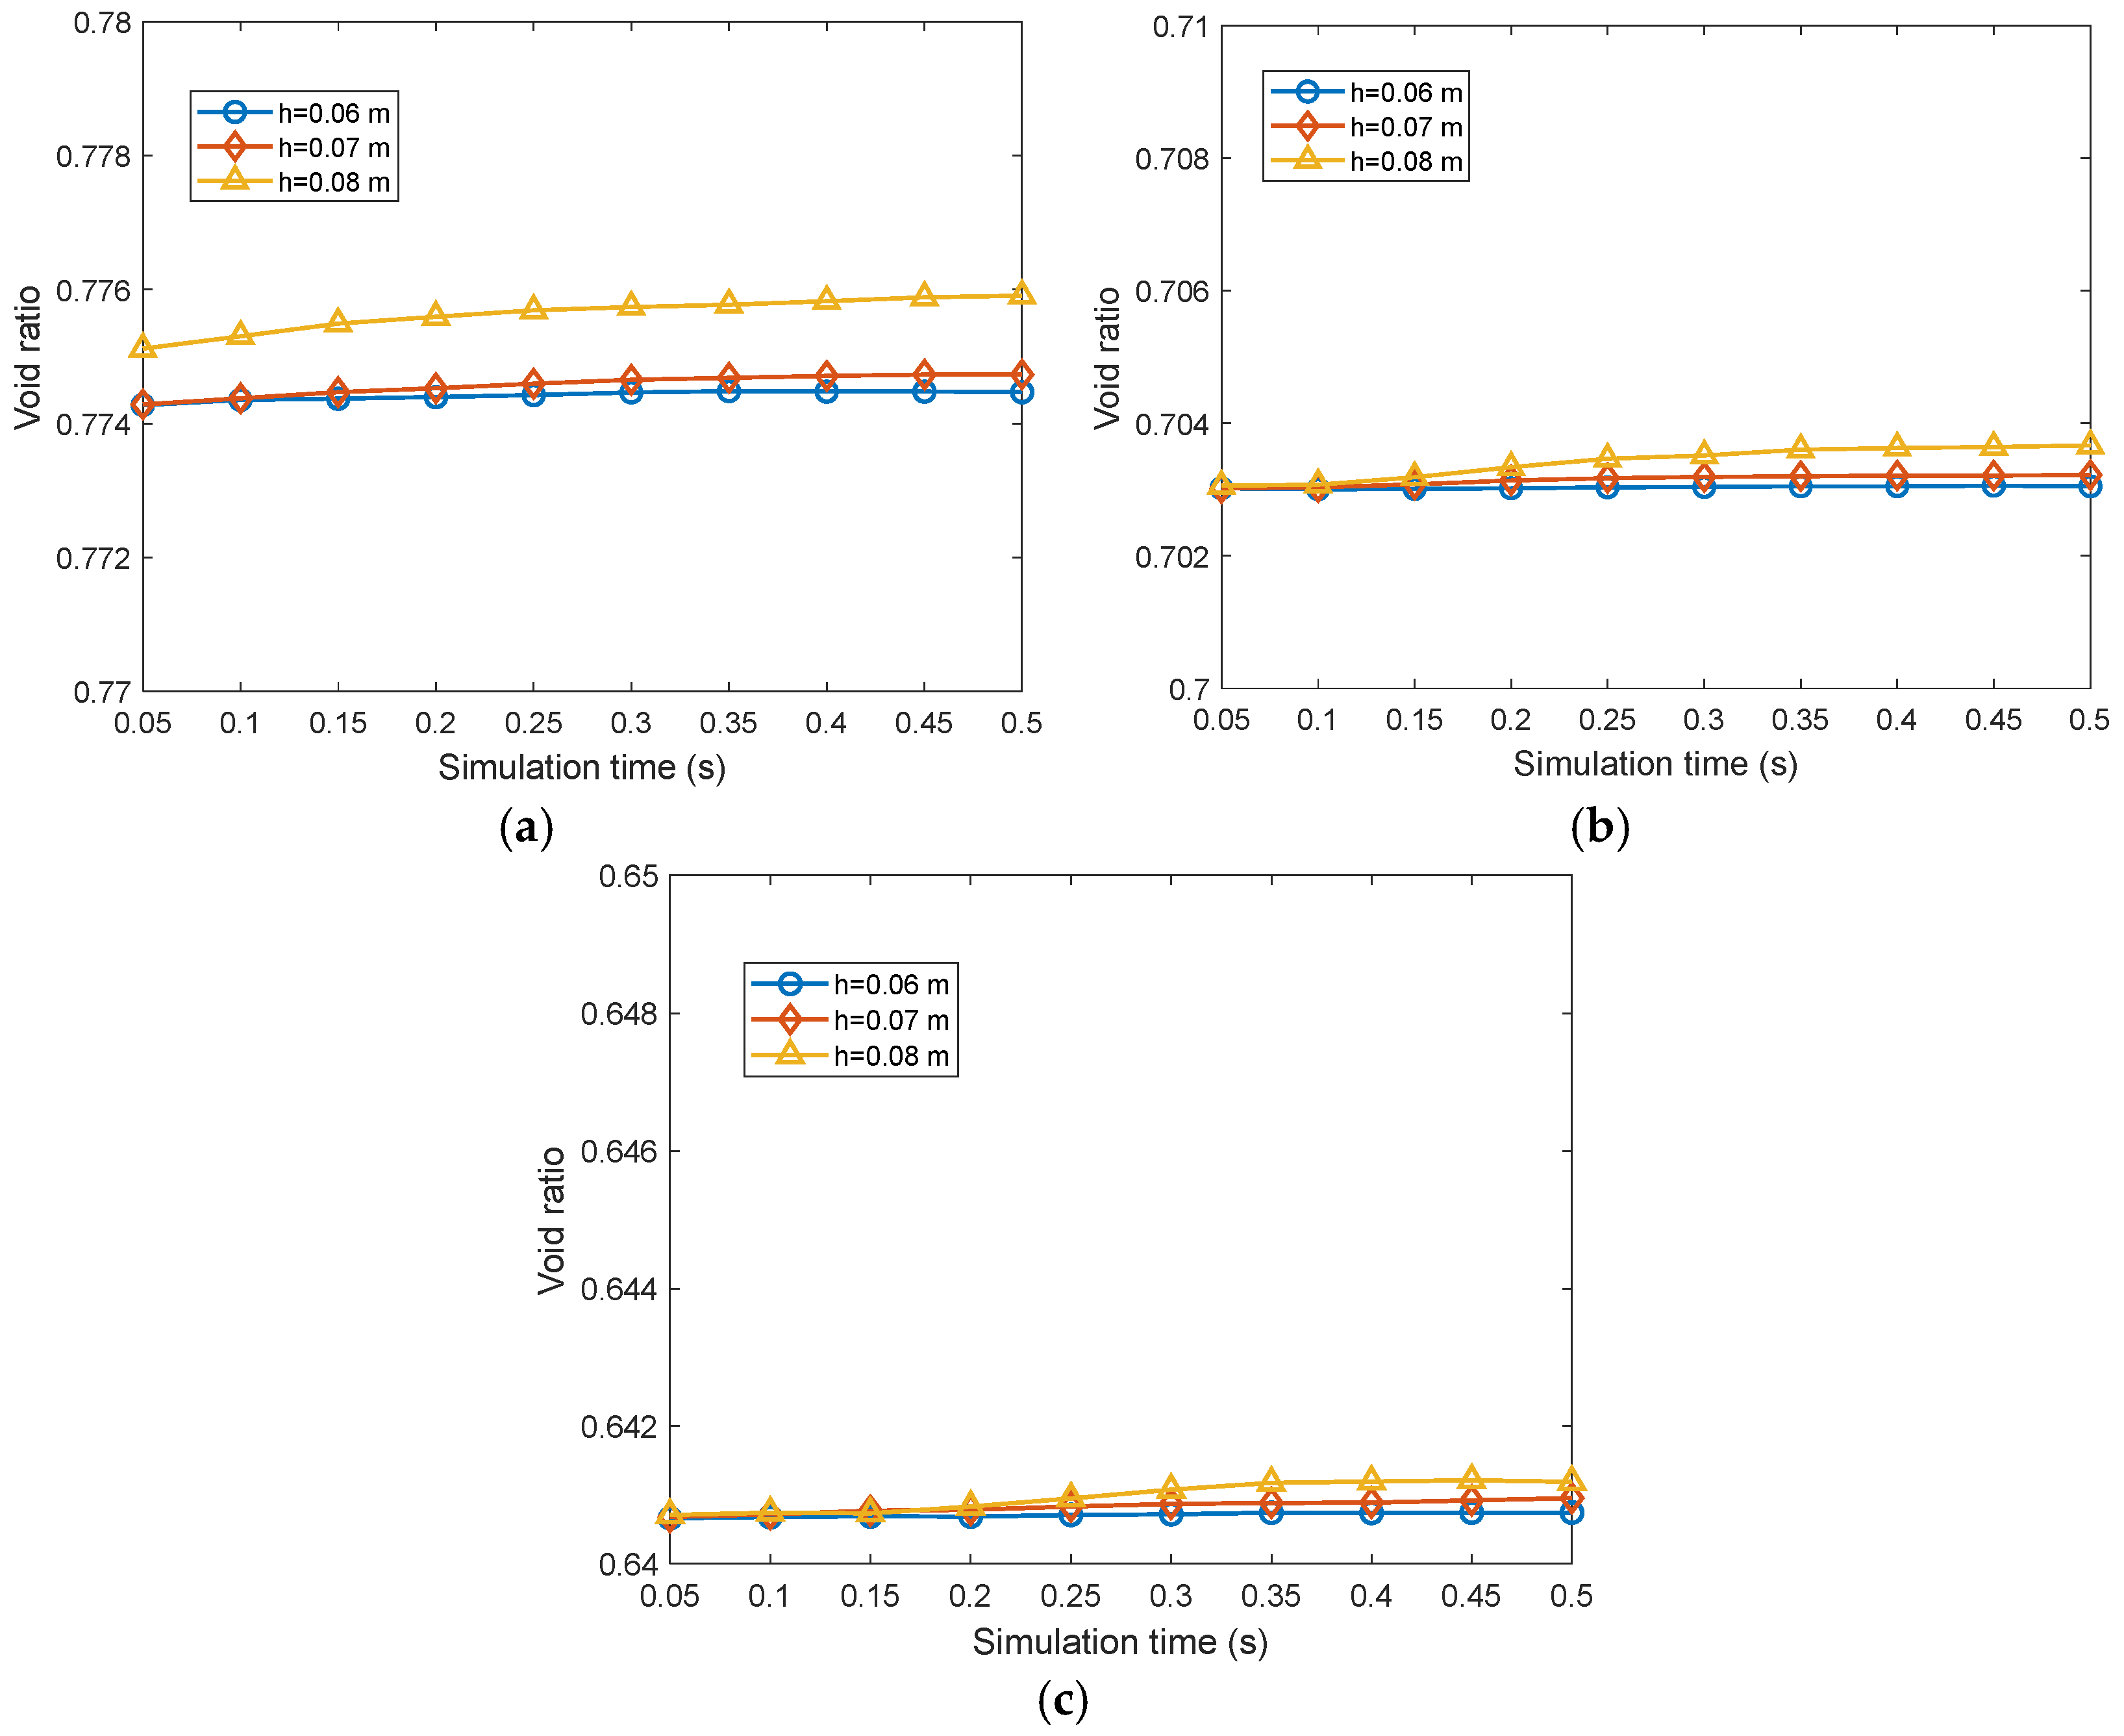
Figure 9 presents the temporal evolution of the average void ratio for all three samples under different hydraulic gradients. Throughout the simulation period, due to the relatively lower particle displacement, all samples induce a relatively lower temporal variations in average void ratio. The initial void ratio values demonstrate a clear inverse correlation with the fines content: Sample FC30 exhibits the highest average void ratio, followed by Sample FC50 and Sample FC70, reflecting the impact of increased fine particle content on soil fabric characteristics. The stability of the bulk void ratio across different hydraulic conditions suggests that the observed differences in erosion susceptibility stem primarily from spatial redistribution of the particles and localized fabric changes rather than significant overall volume changes, emphasizing the importance of micro-scale analysis in understanding seepage-induced instability mechanisms.

4. Particle-Scale Observations and Discussions

4.1. Initial Particle Position Tracking

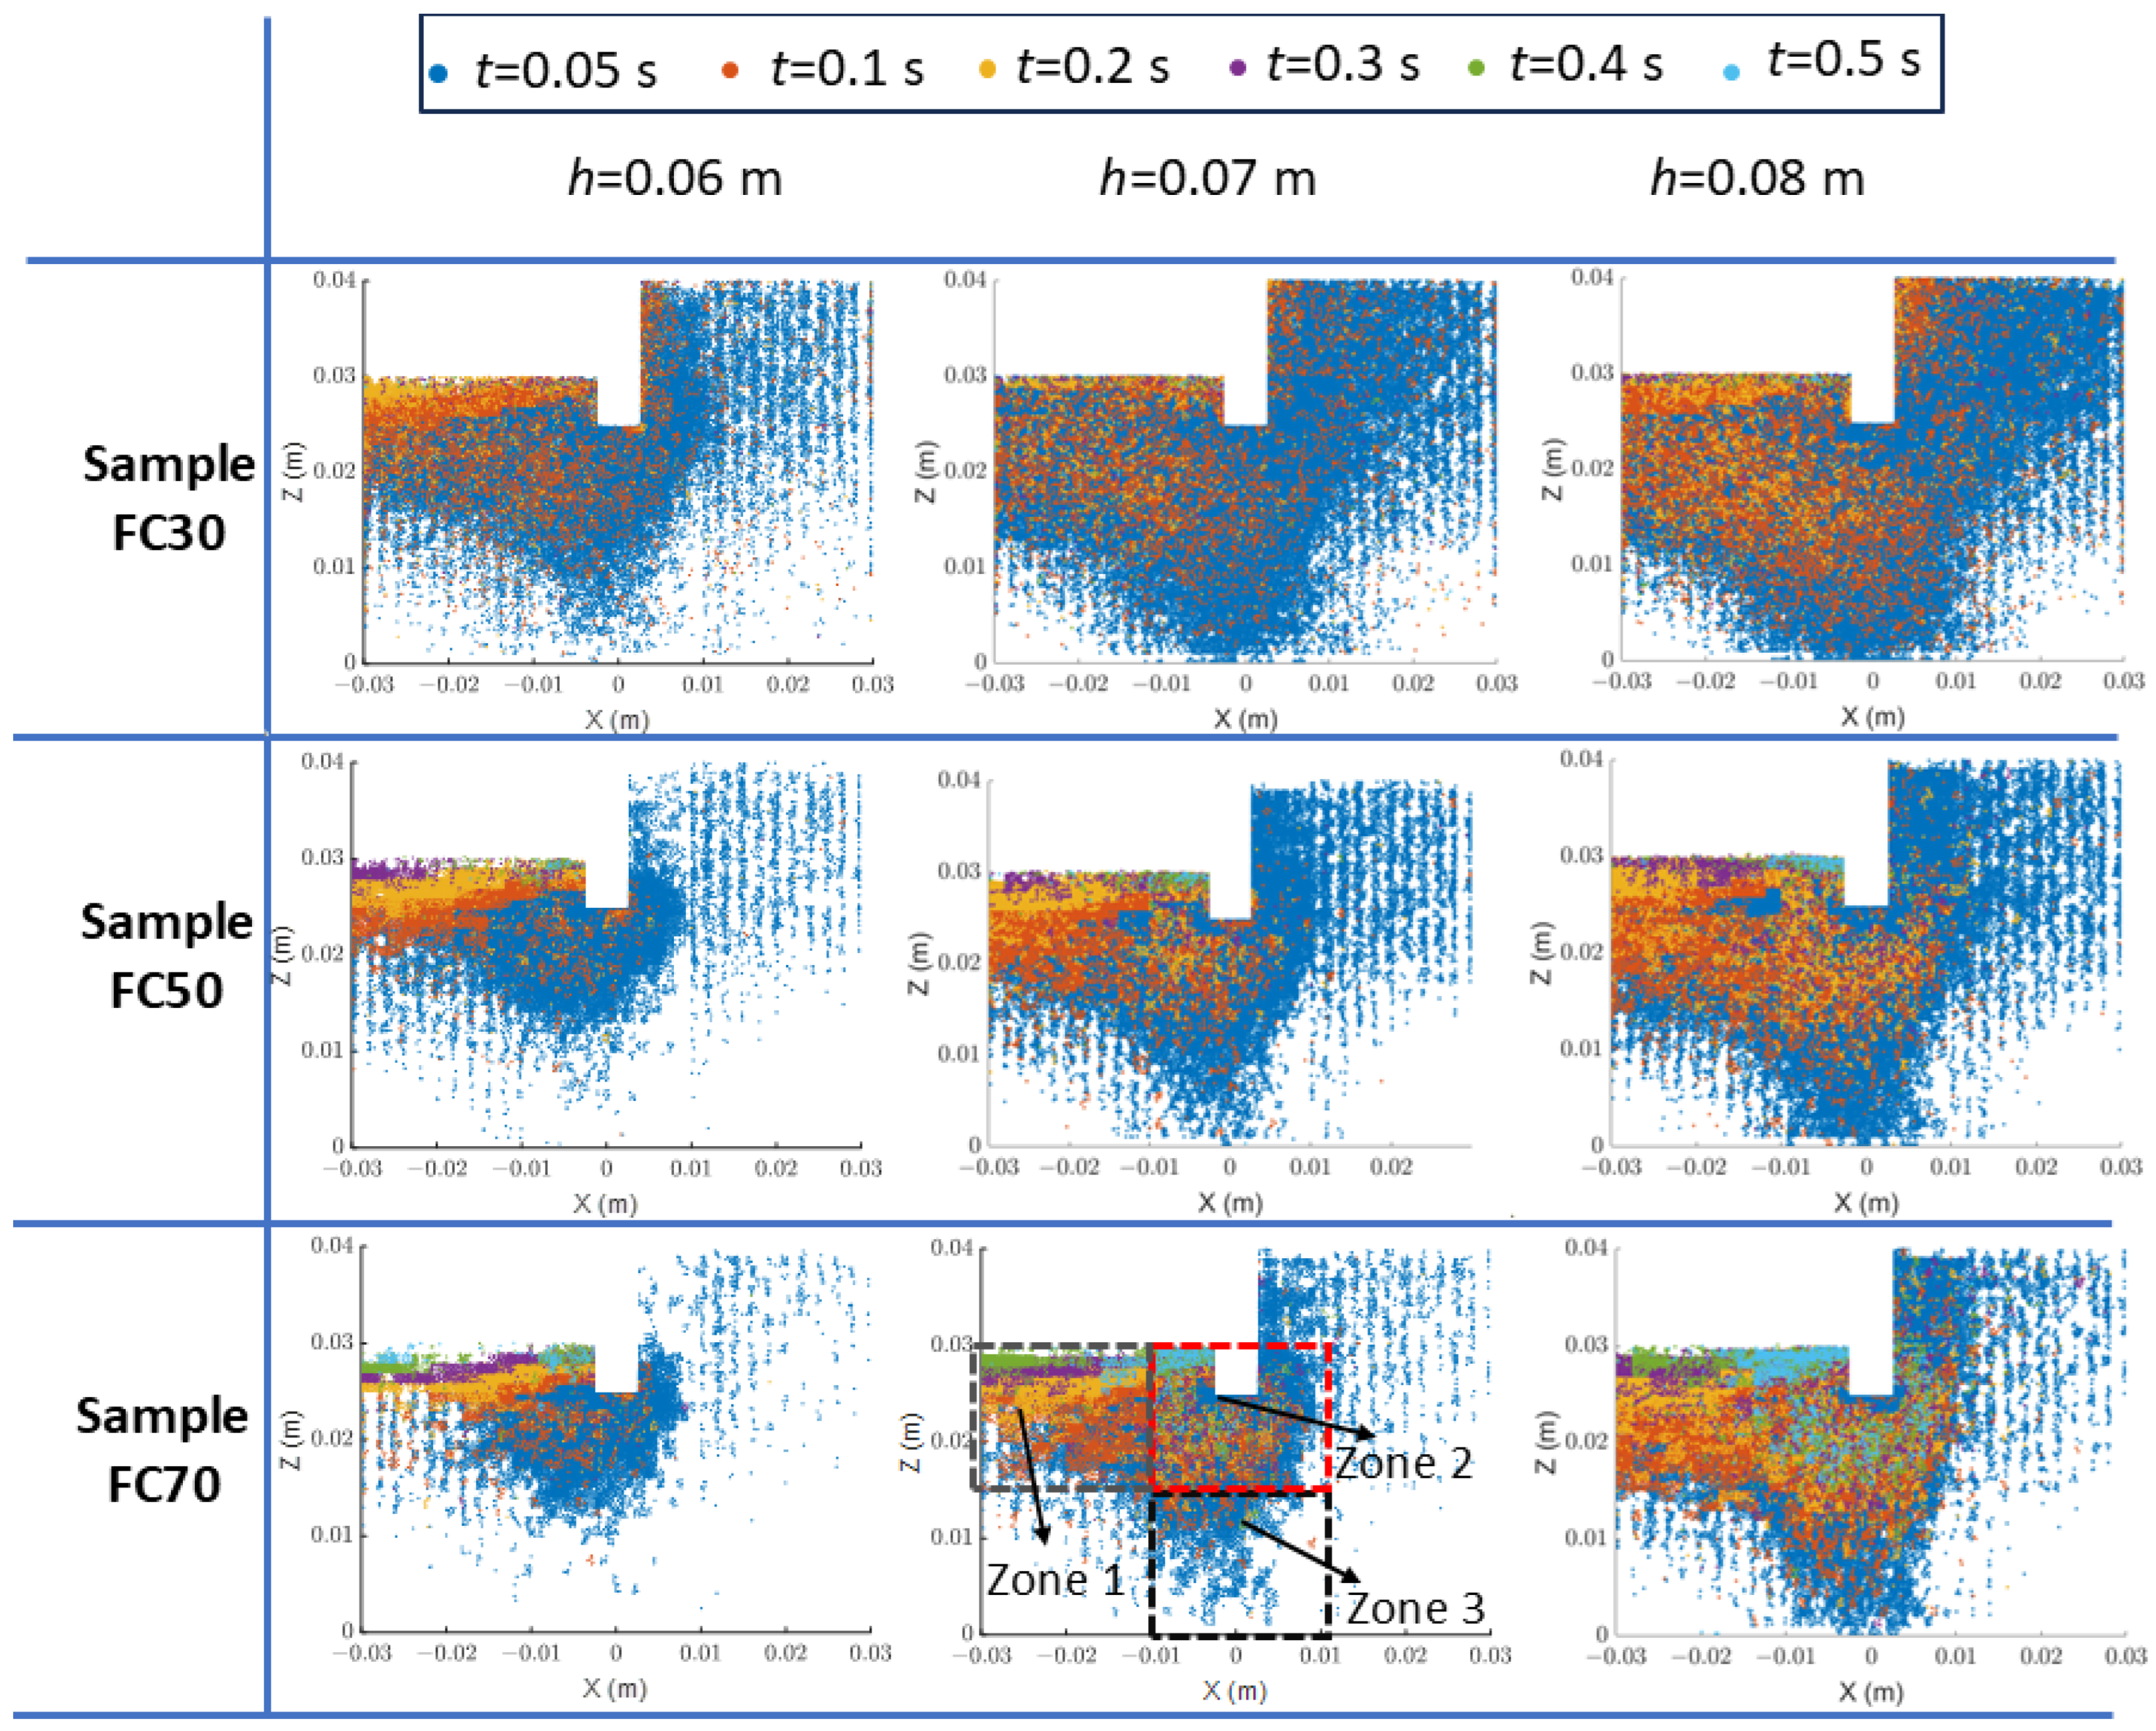
Figure 10 illustrates the spatial distribution of the initial positions for eroded particles across different temporal stages and hydraulic conditions, with each temporal increment representing newly eroded particles during the corresponding time interval. The erosion process exhibits pronounced spatial heterogeneity, with particle mobilization predominantly concentrated in regions adjacent to the sheet pile wall and downstream boundary due to elevated local hydraulic gradients. Sample FC70 exhibits the most concentrated erosion patterns, whereas specimens with a lower fines content demonstrate significant expansion of the active erosion zone toward the upstream side under elevated hydraulic conditions. This phenomenon indicates that a reduced fines content facilitates simultaneous erosion on both downstream and upstream sides when subjected to higher hydraulic gradients. To elucidate the underlying mechanisms governing these macroscopic erosion patterns, temporal-spatial particle-scale observations were conducted in terms of internal structure and contact force for three representative zones illustrated in Figure 10.
The cumulative particle displacement can be quantified as the summations of displacements across the discrete zones. Figure 11 portrays the temporal evolution of average particle displacement for the three zones across all specimens. The results demonstrate that particle displacement enhances with increasing hydraulic conditions for each zone. Furthermore, the results reveal that the enhanced displacement observed in Sample FC70 (Figure 8) is predominantly attributed to the mobilization of the particles within Zone 2.

4.2. Coordination Number

The coordination number (CN) serves as a fundamental parameter for characterizing the stability and connectivity of the soil skeleton structure, providing quantitative insight into the micromechanical behavior that governs macroscopic erosion resistance. Nie et al. [41] and Mu et al. [42] proposed that particles with a coordination number lower than 3 can be determined as unstable particles susceptible to migration under seepage flow. Based on the macroscopic erosion behavior observed previously, significant particle mobilization occurs predominantly during the initial stage of seepage erosion. Taking h = 0.06 m as an example, Figure 12 presents the probability distribution of the coordination numbers for the fine particles across the three defined zones at t = 0.1 s. Sample FC30 exhibits significant higher percentages of particles with CN < 3 for each zone, with Zone 1 showing the largest proportion of unstable particles. As the fines content increases, the particles achieve sufficient constraint through enhanced inter-particle connectivity. Sample FC70 demonstrates the most stable configuration, with approximately 1.3% of the particles with CN < 3 in both Zone 1 and Zone 2. For all samples, Zone 3 demonstrates the most stable conditions, correlating with the observed spatial distribution of the erosion patterns.
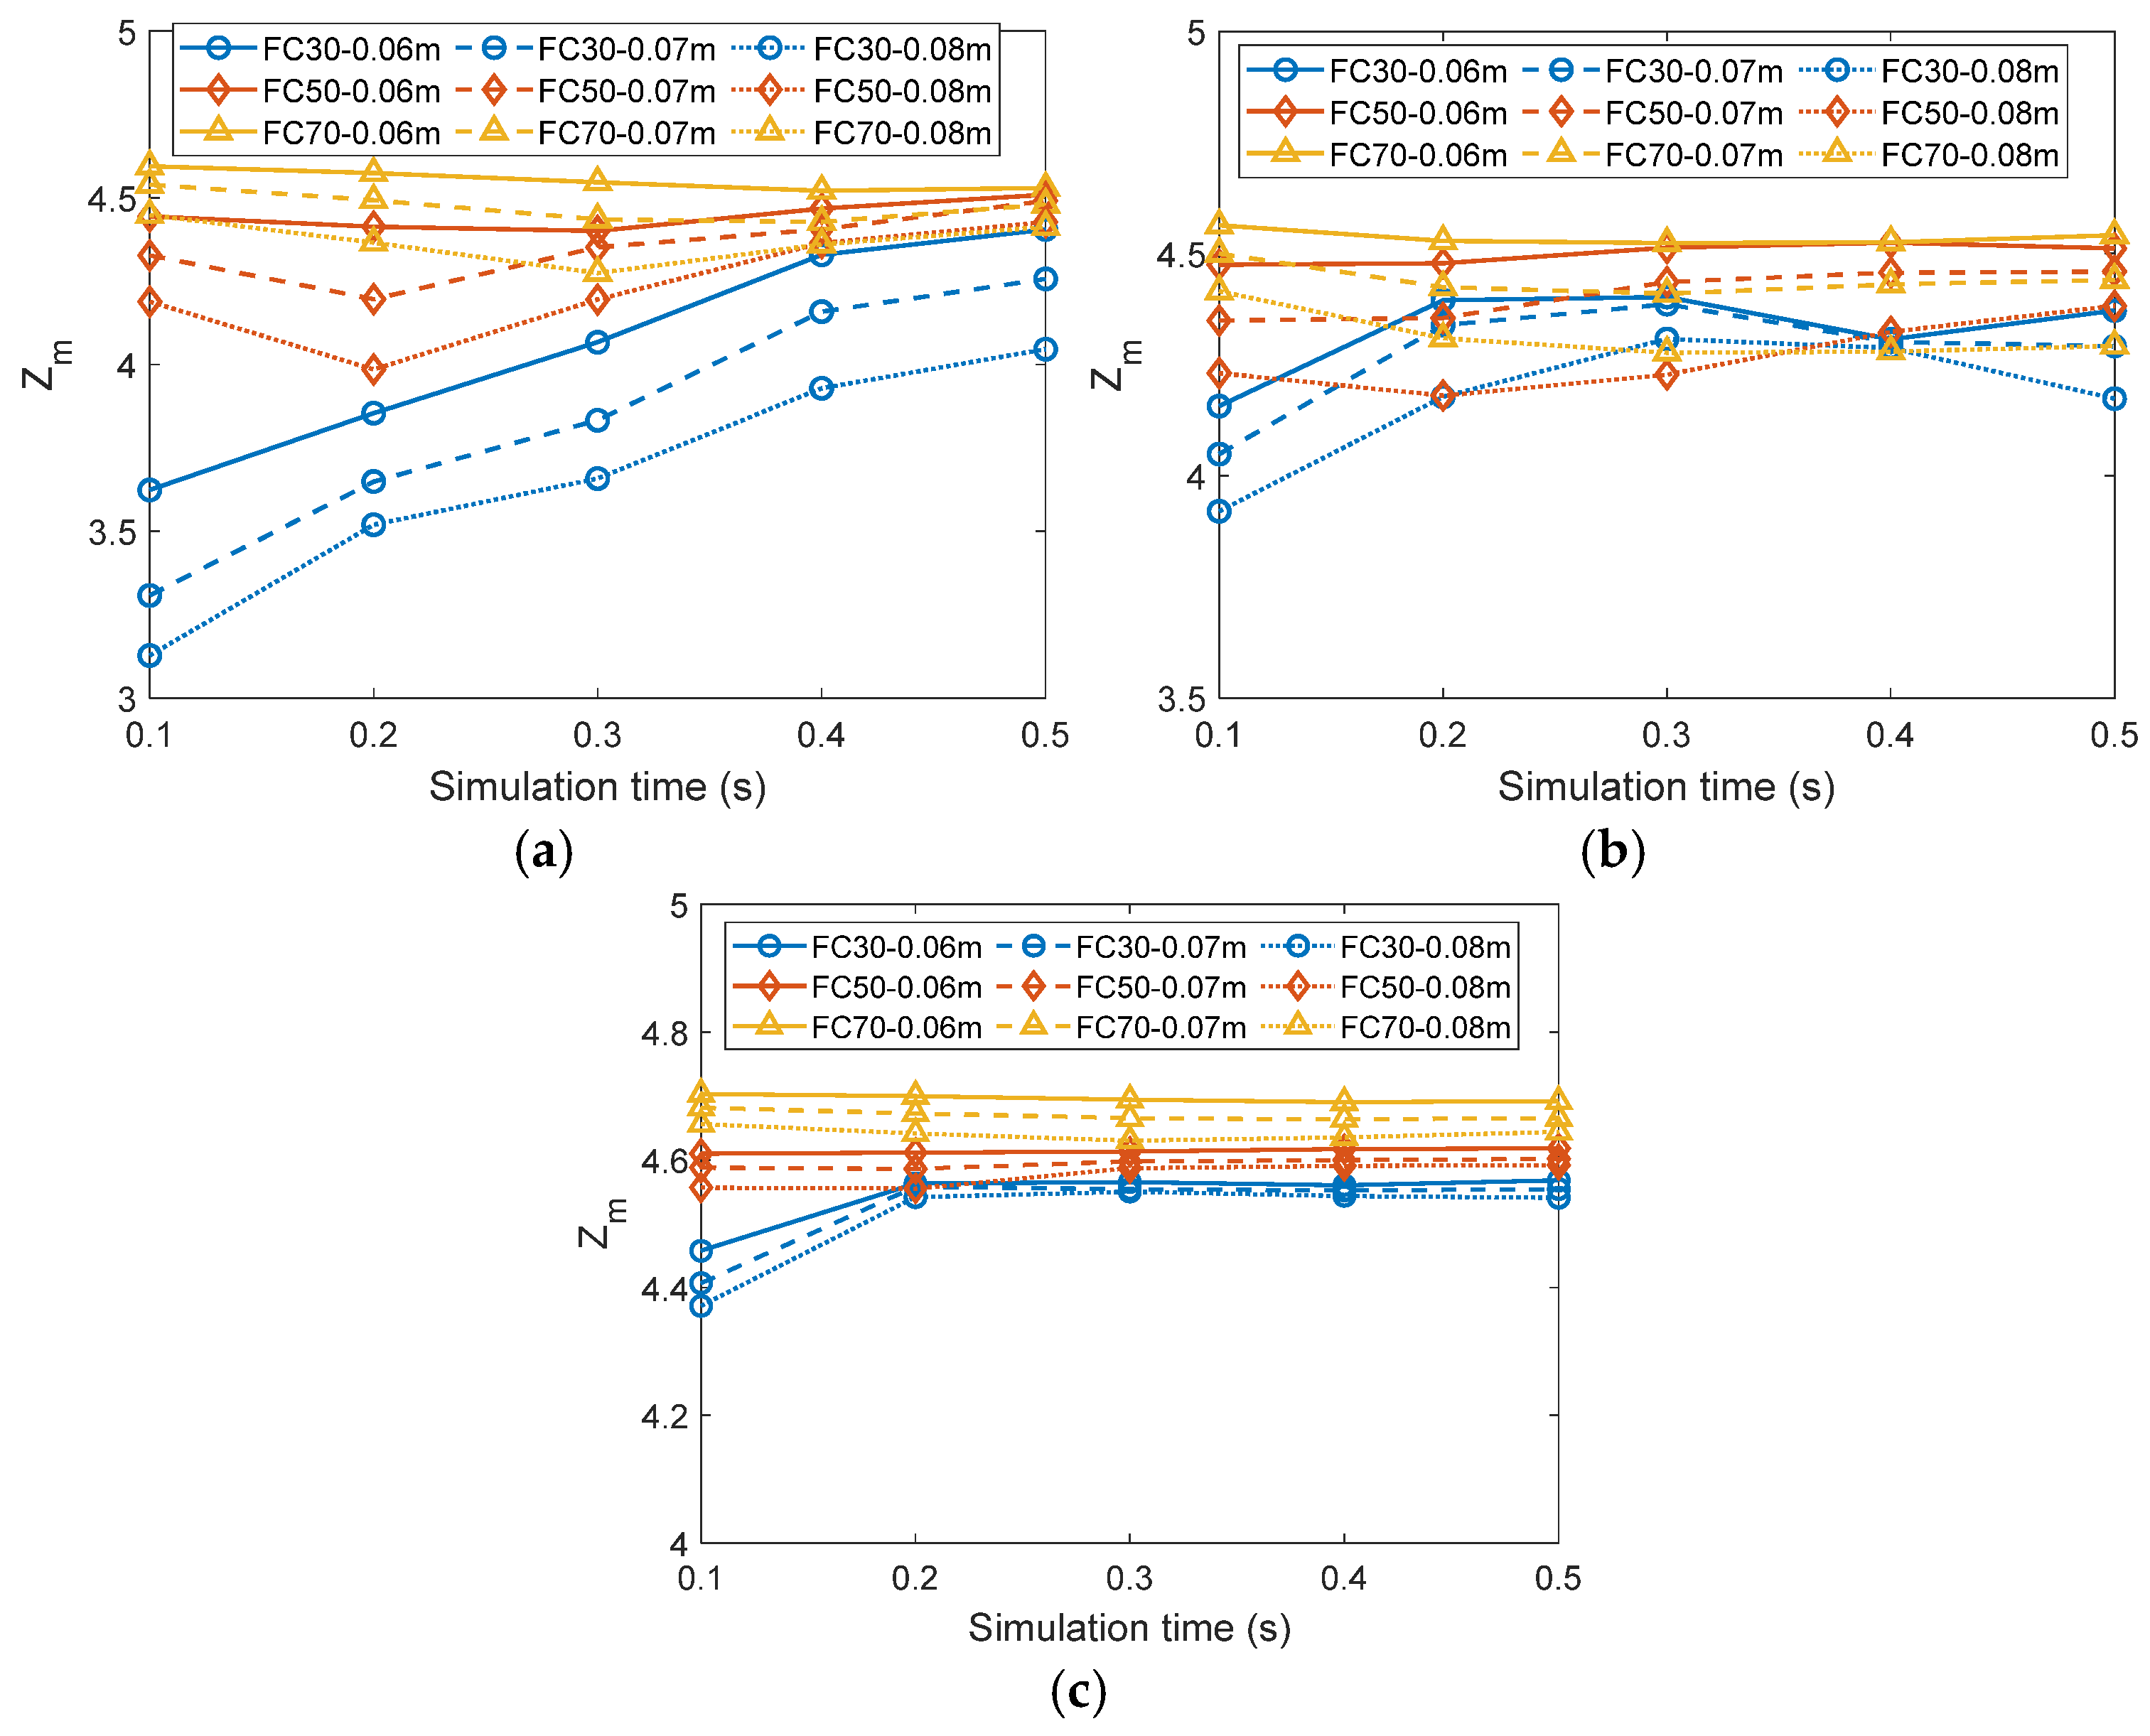
Thornton [43] defines the mechanical coordination number Z m as a refined parameter that excludes particles with 0 or 1 contacts, providing a more accurate measure of the micromechanical properties of granular soils. This parameter is expressed as
Z m = 2 N c N p 1 N p N p 1 N p 0
in which N c represents the total number of contacts and N p is the total number of particles. N p 0 and N p 1 correspond to the number of particles with one and zero contacts, respectively.
Figure 13 depicts the temporal evolution of Z m across different zones for the three specimens under varying hydraulic gradients. The results reveal distinct evolution patterns that correlate with the fines content and spatial locations. Increasing hydraulic conditions consistently reduce Z m across all zones for the three specimens, indicating that enhanced seepage flow weakens particle connectivity and destabilizes the granular structure. At the initial stage, Sample FC30 exhibits relatively lower Z m values while Sample FC70 presents greater magnitudes of Z m , reflecting the enhanced structural stability provided by a higher fines content. Moreover, the specimens with a lower fines content demonstrate lower Z m in Zone 1 compared to Zone 2, while this spatial difference diminishes as the fines content increases, implying a weakened structure on the downstream side for specimens with a lower fines content. The erosion resistance can also affect the rate at which the structure weakens. As the seepage process develops, for Sample FC30, the particles migrating from the upstream side may refill Zone 1 and Zone 2, consequently increasing particle connectivity and Z m , particularly in Zone 1. However, Sample FC50 shows a significant reduction in the mechanical coordination number at the initial stage, followed by continuous increases in both Zone 1 and Zone 2. Sample FC70 experiences a continuous decrease in Z m under seepage impact, particularly in Zone 2. As the seepage process develops, Sample FC70 shows relatively lower Z m compared to Sample FC50 under h = 0.07 m and 0.08 m at the final stage in Zone 2, which enhances the possibility of particle detachment and consequently results in greater particle displacements as shown in Figure 8 and Figure 11.

4.3. Mechanical Redundancy

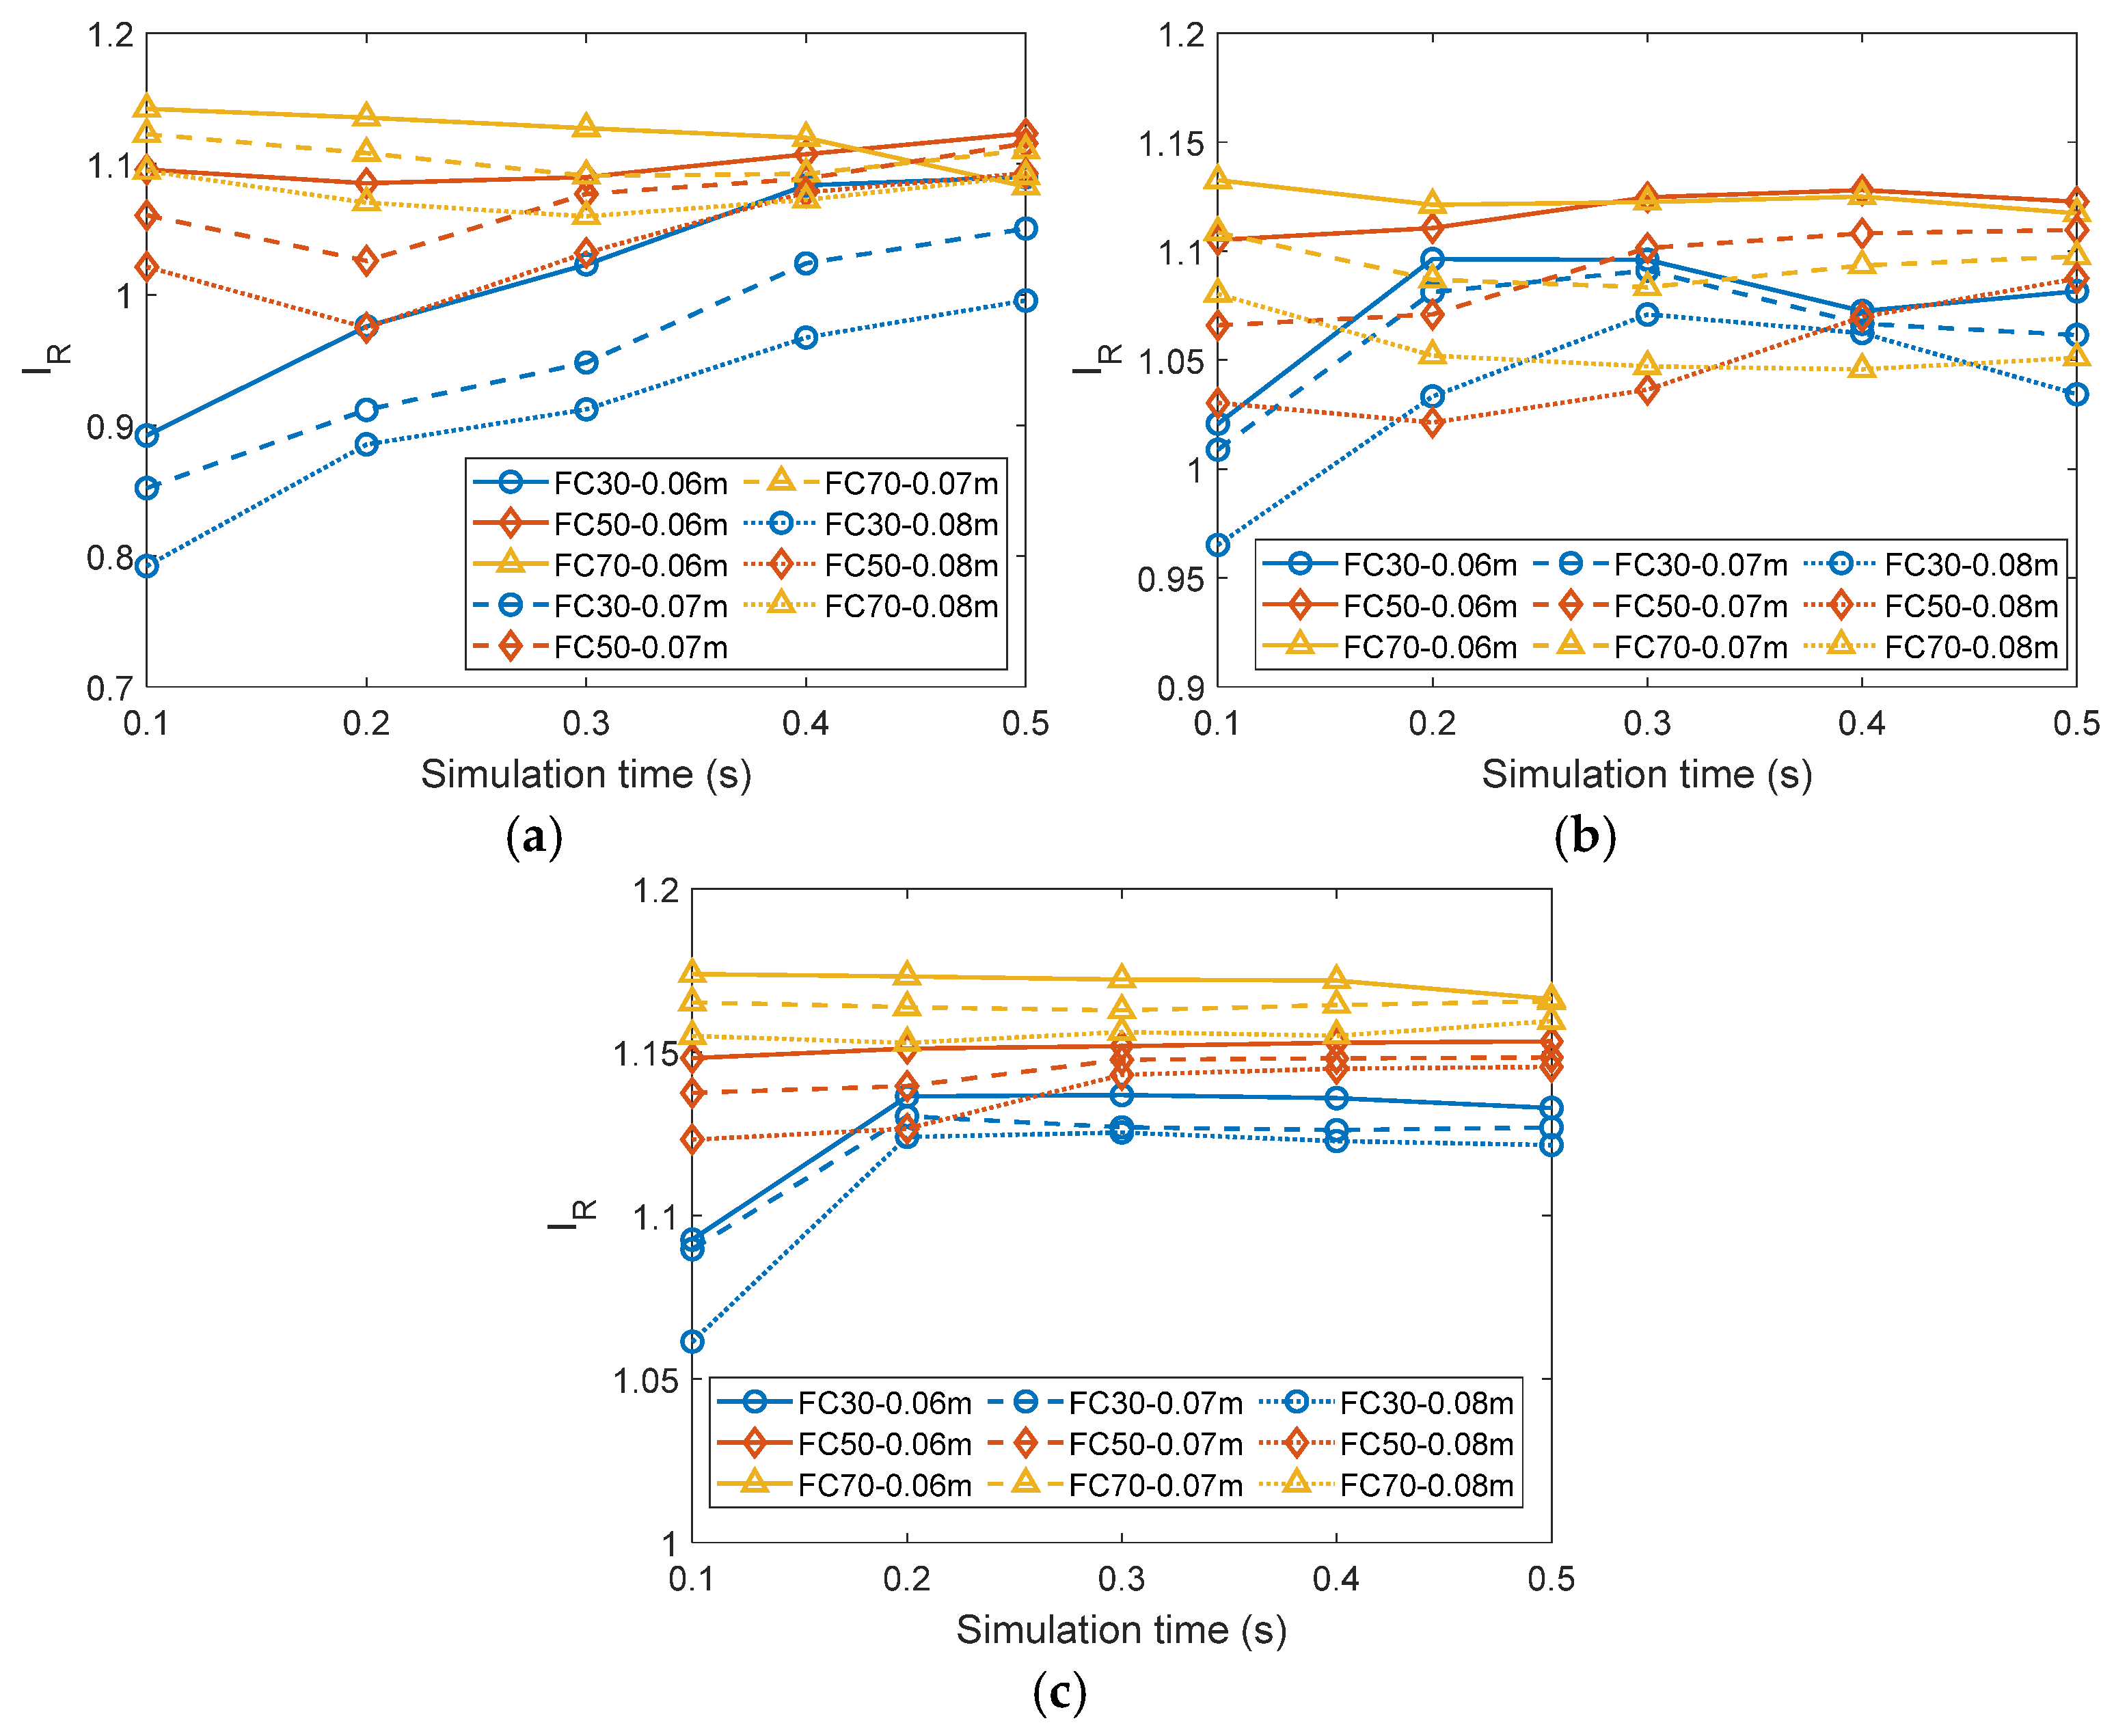
Kruyt and Rothenburg [44] and Liu et al. [45] proposed a mechanical redundancy of a system to determine the stability of the material system, with the expression as
I R = 3 2 f s N c 6 N p N p 0
in which f s is the ratio of the number of contacts that have reached the plastic limit in the tangential direction relative to the total number of contacts. The mechanical characteristics of the material system are suggested in an unstable condition if this parameter is less than 1.
Figure 14 depicts the temporal evolution of the mechanical redundancy across different zones during the seepage process. Consistent with the mechanical coordination number behavior, the mechanical redundancy exhibits a systematic decrease with increasing hydraulic conditions, reflecting the progressive deterioration of structural stability under enhanced seepage impact. Specimens with a higher fines content demonstrate greater I R magnitudes, indicating a higher erosion resistance. Zone 3 shows a higher magnitude of I R for each specimen, indicating a relative stable condition during erosion. Due to the lower erosion resistance, Sample FC30 exhibits the lowest value of I R , particularly in Zone 1, suggesting that the downstream side represents a more vulnerable region for specimens with a lower fines content. As the fines content increases, Zone 2 exhibits relatively lower I R values compared to Zone 1, suggesting that the region around the sheet pile wall experiences more unstable conditions during erosion for higher fines content specimens. Notably, compared to Sample FC50, Sample FC70 demonstrates a lower magnitude of I R at the final stage under h = 0.08 m, indicating a relatively unstable condition that facilitates particle migration.

4.4. Contact Forces

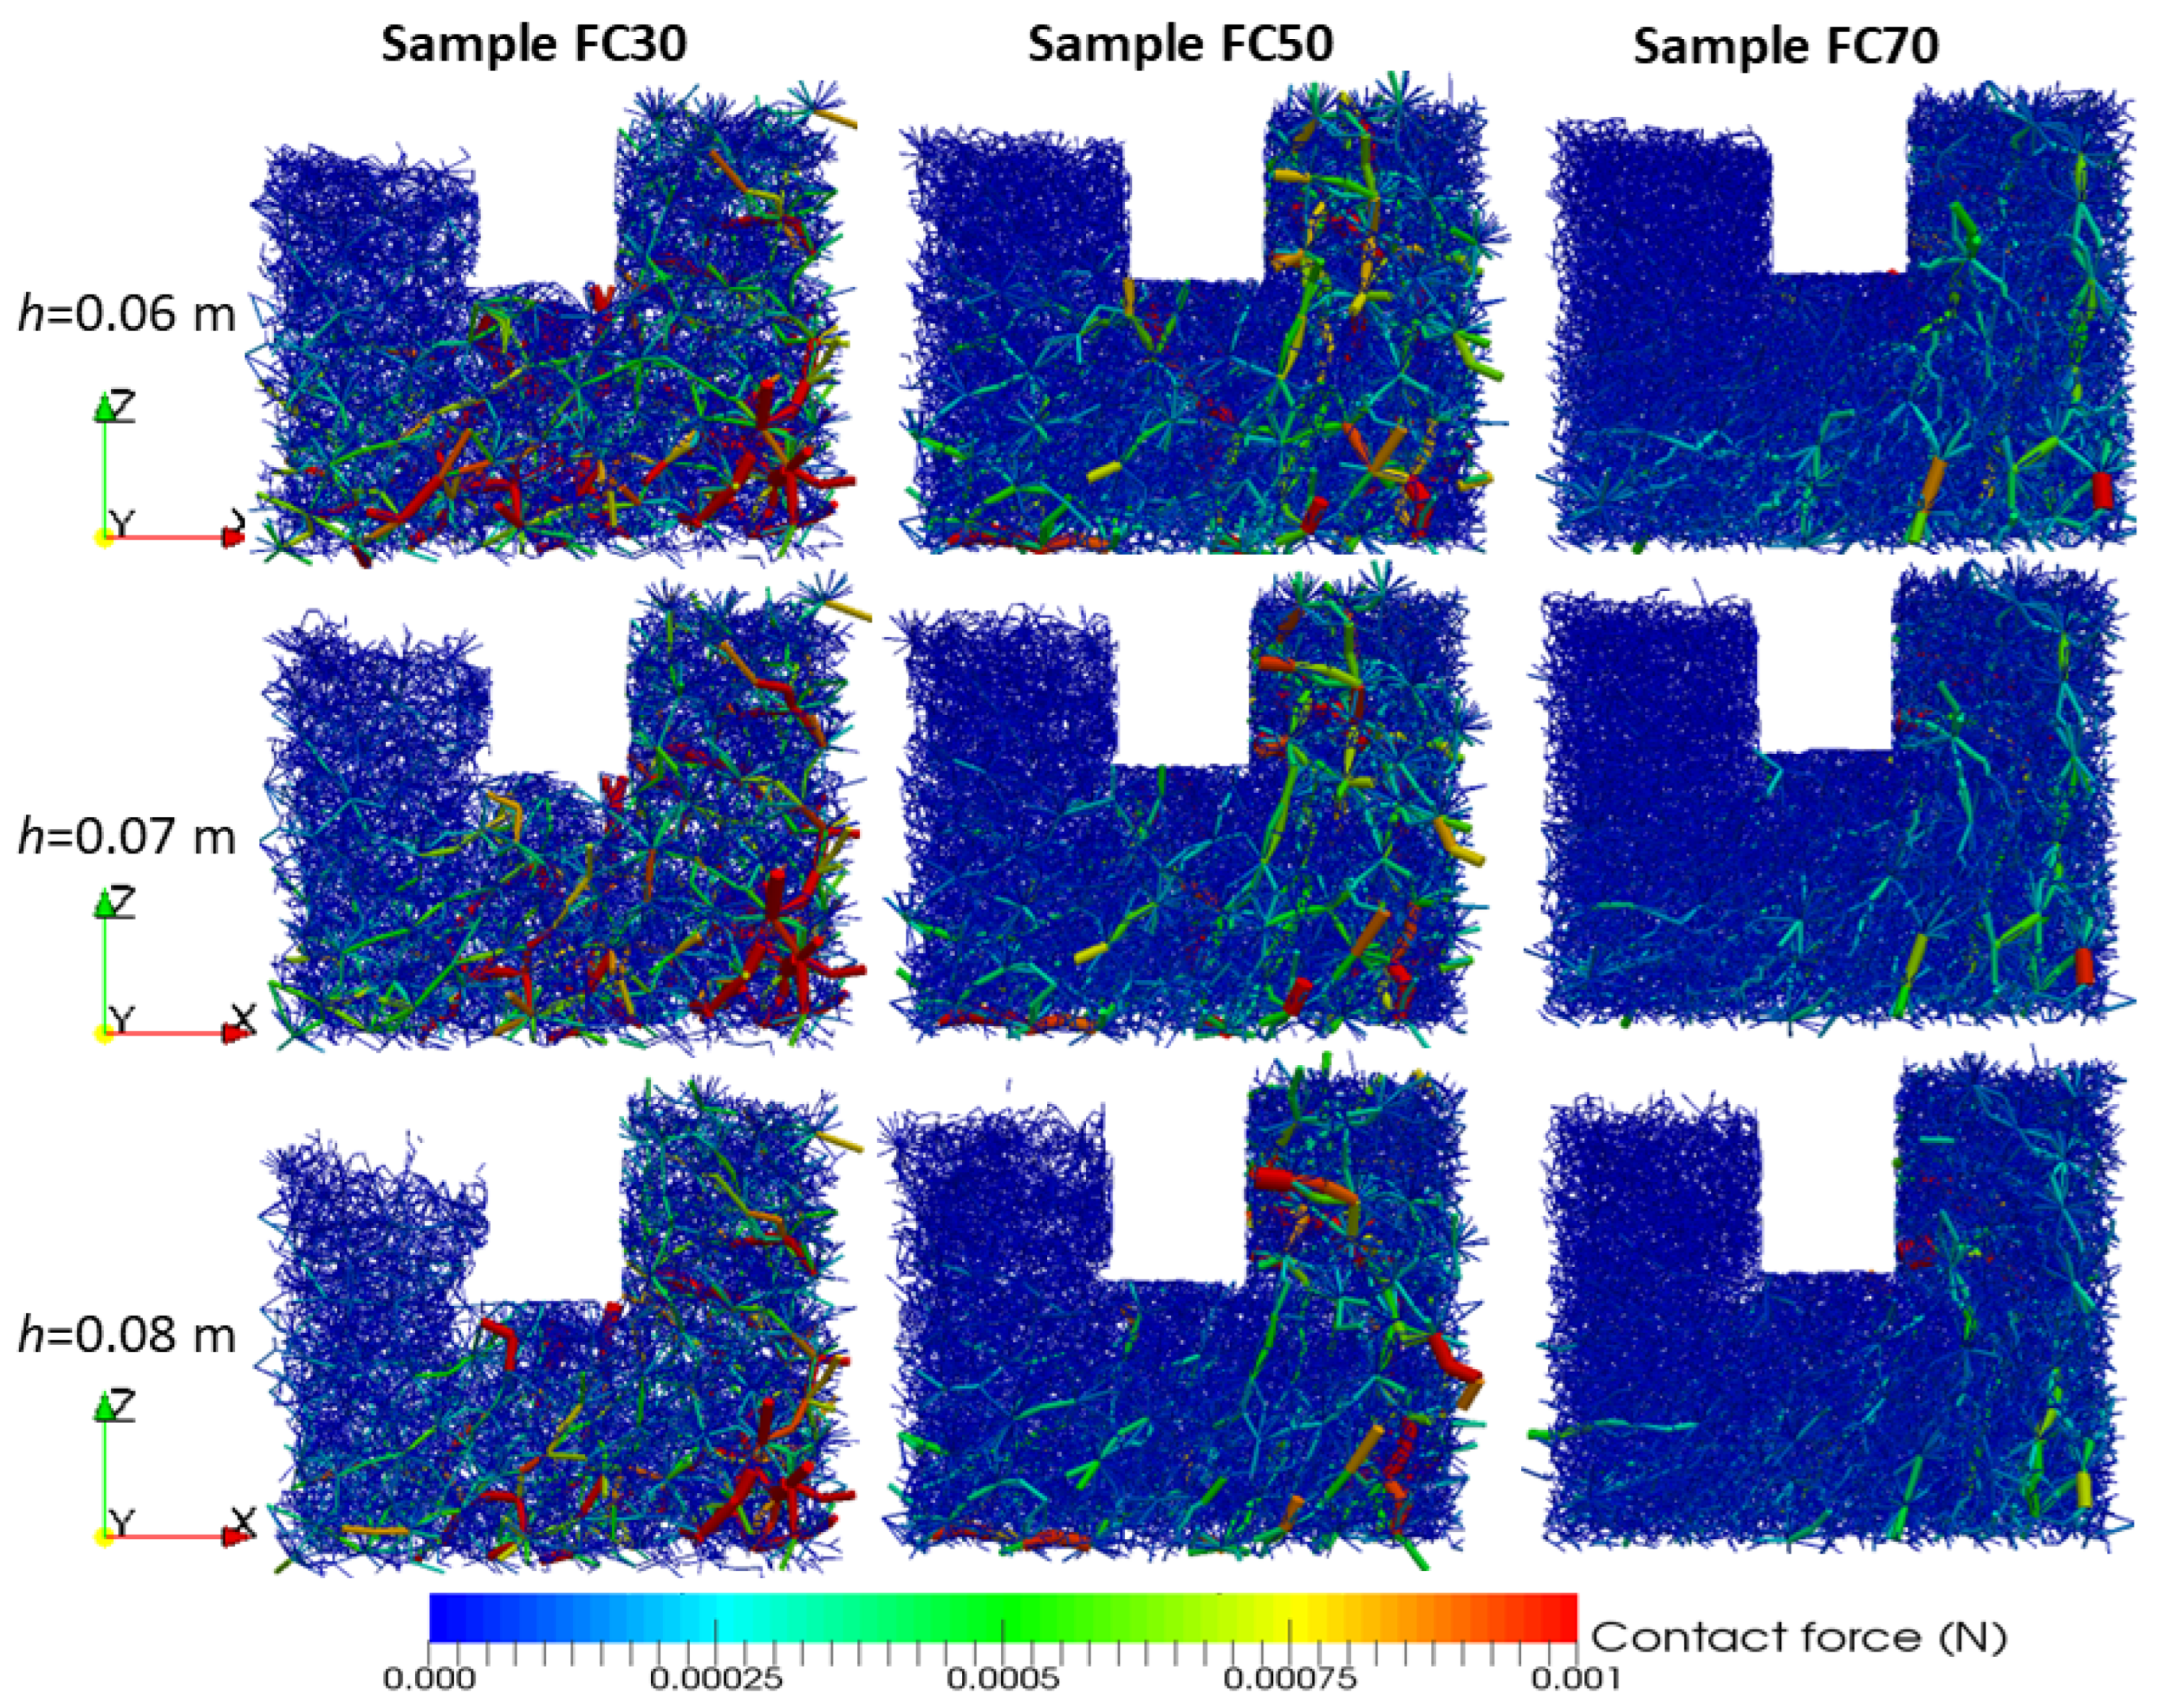
To further elucidate the micromechanical mechanisms underlying the onset of seepage erosion, the interparticle contact forces were analyzed. Taking Zone 2 as an example, Figure 15 portrays the force chains networks for the three specimens at t = 0.5 s. As a fines content increases, the network becomes intense while the magnitude reduces. After erosion, the force chain orientation predominantly rotates to align parallel to the preferential flow path, with strong contact forces concentrating on the upstream side across all specimens in Zone 2. The proportion of strong contact force reduces with the increase in the hydraulic conditions.
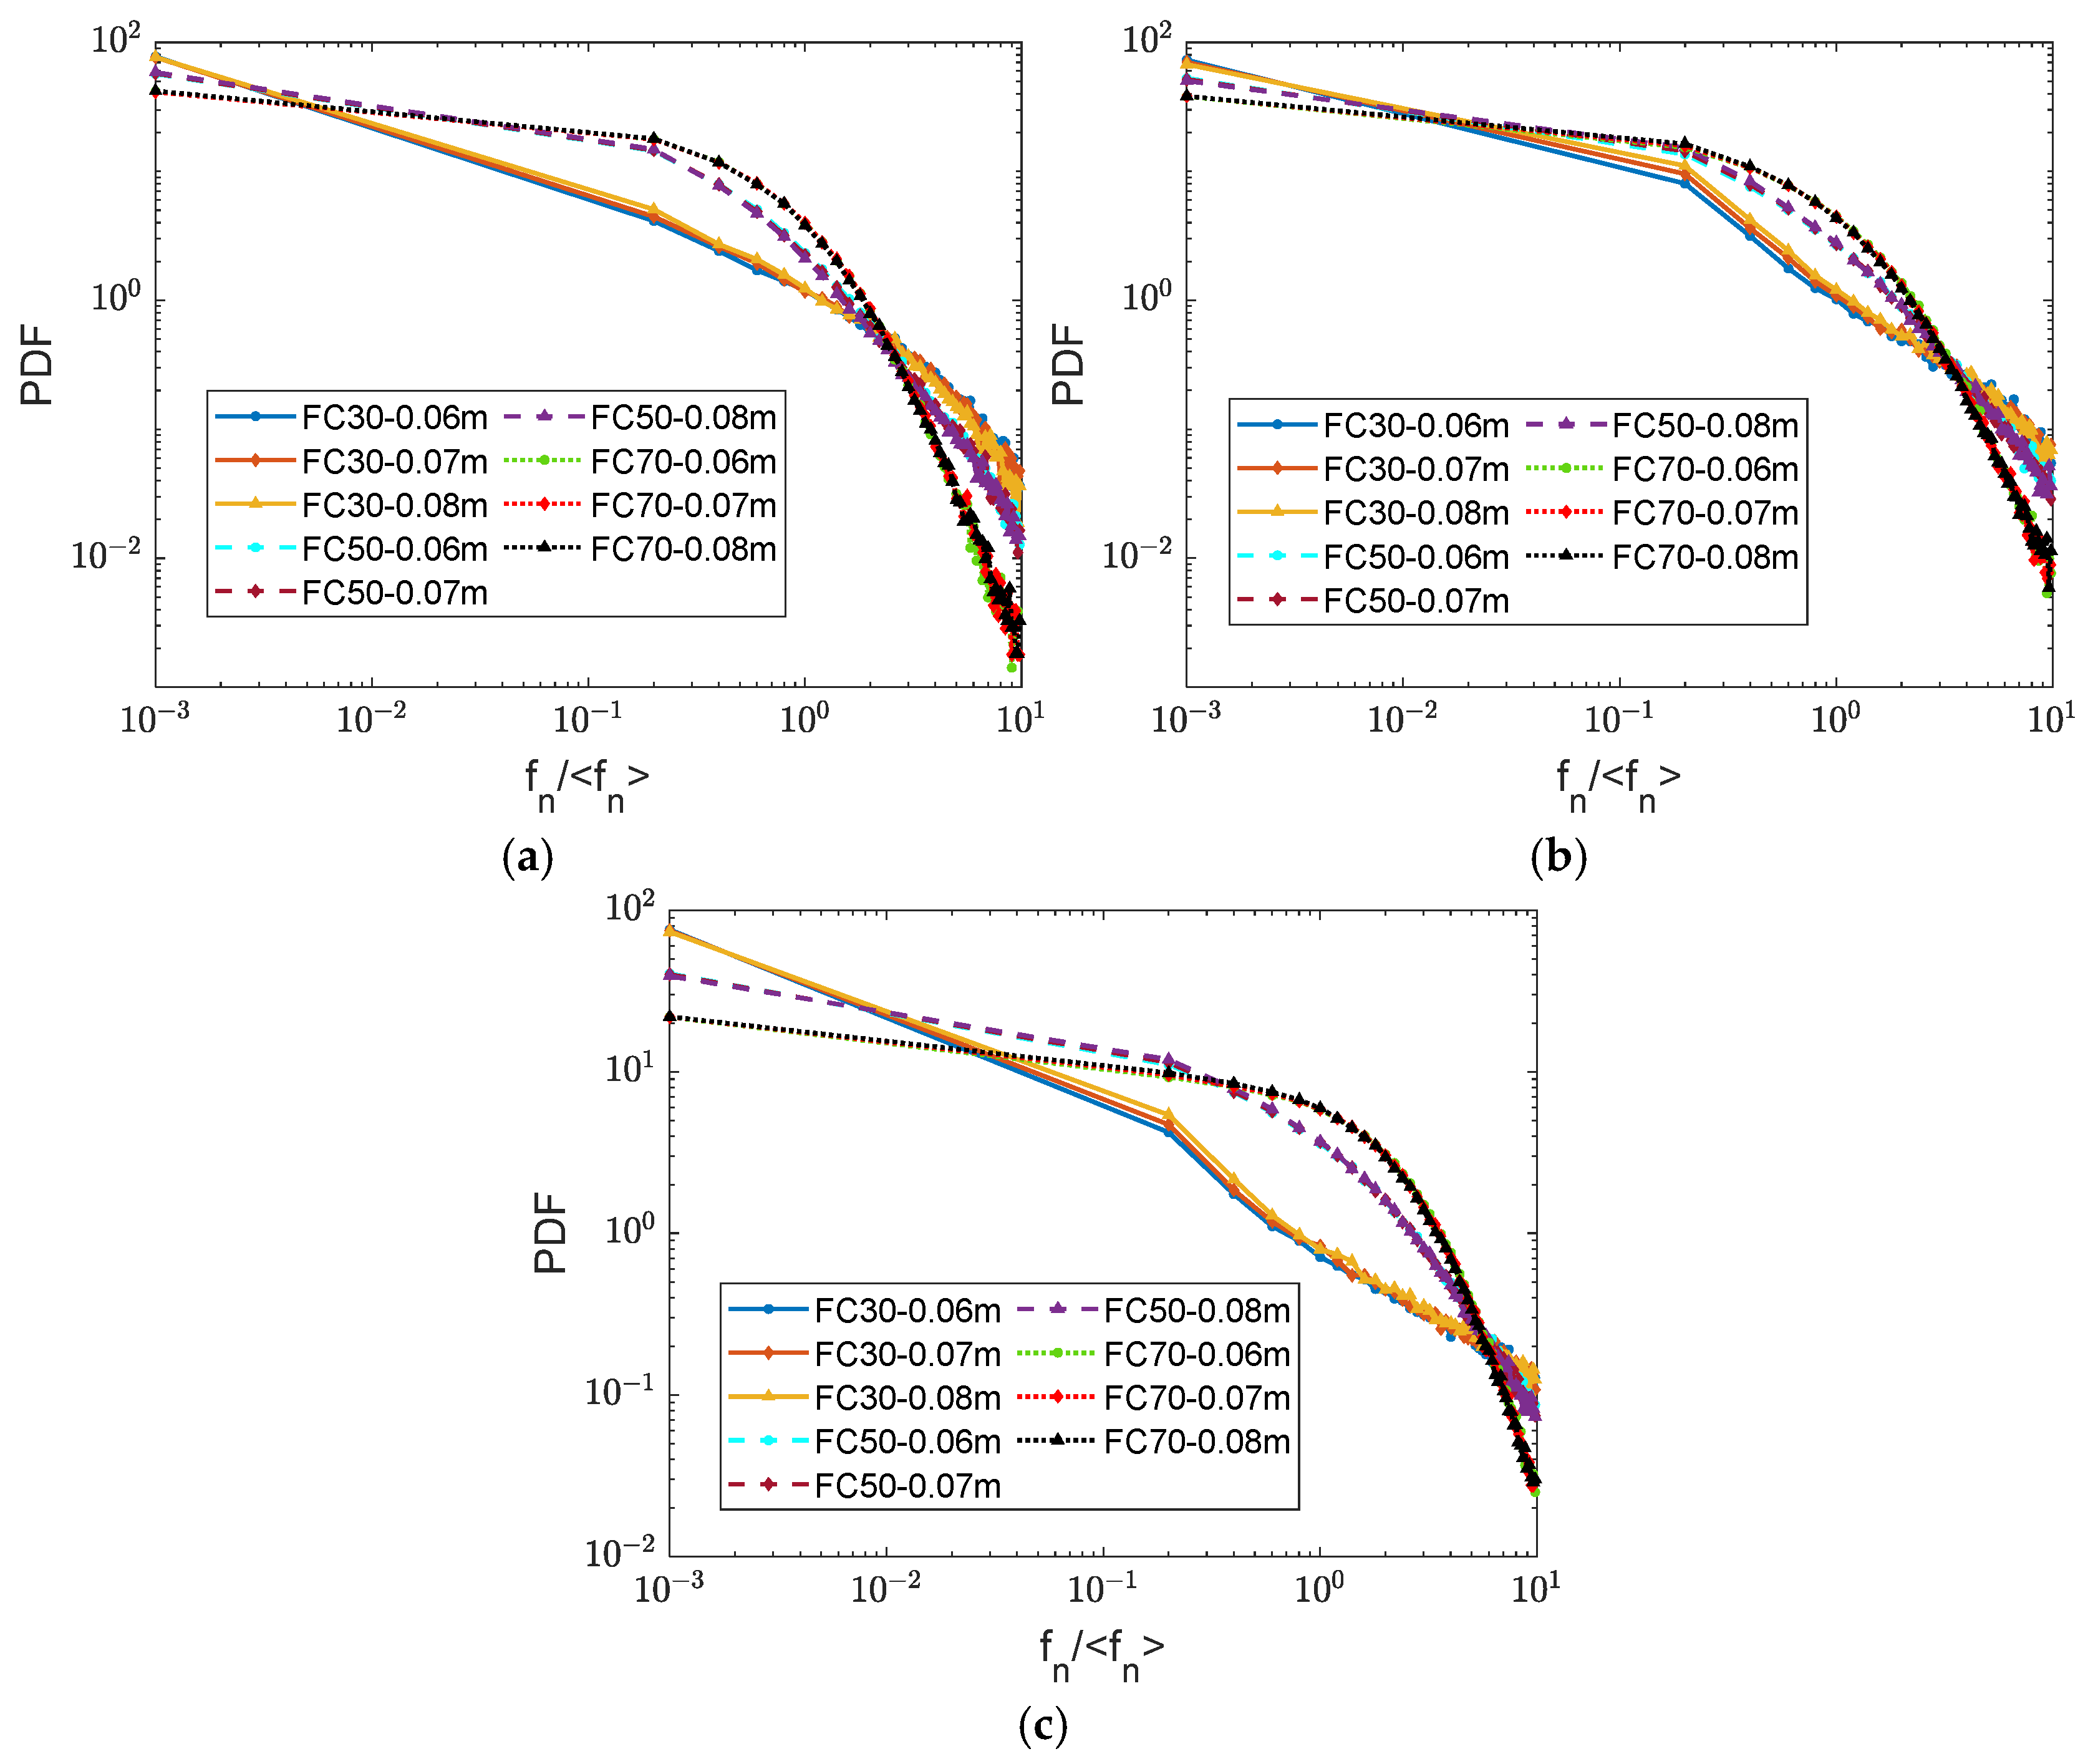
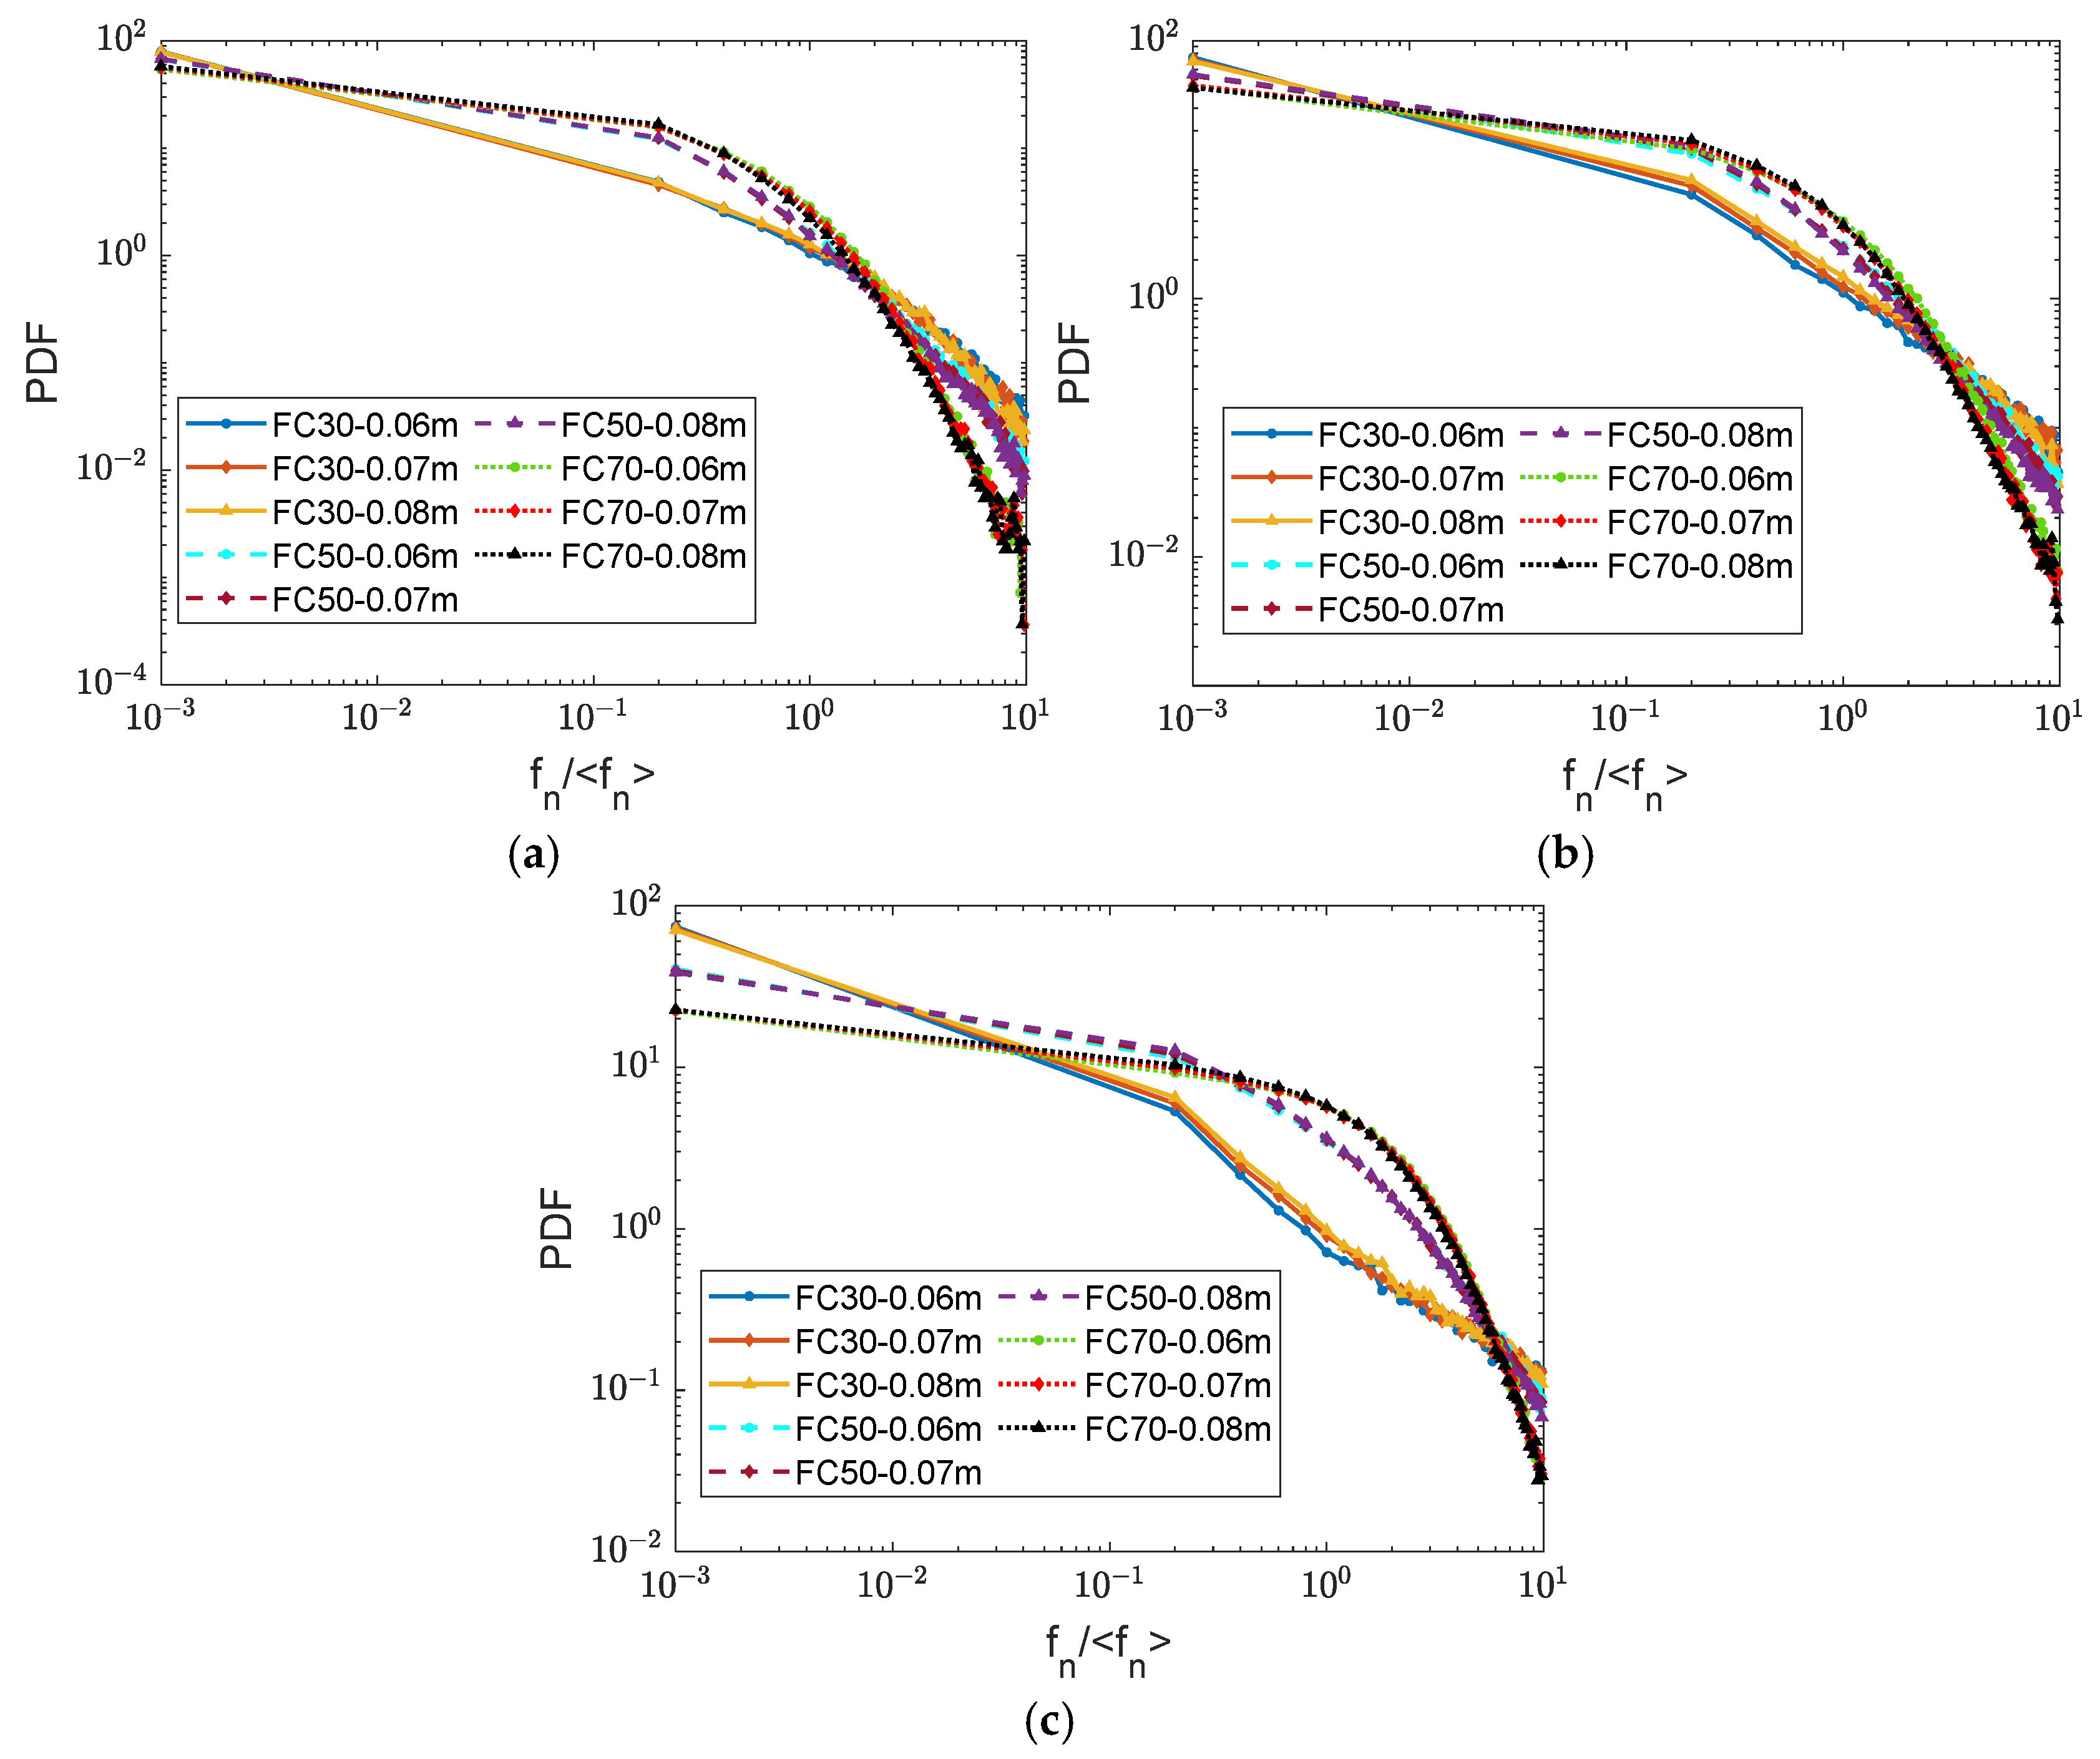
Following Radjai et al. [46] and Minh and Cheng [47], contact forces are categorized into strong and weak components, with strong contact forces defined as those exceeding 1.2 f n , where f n refers to the average contact force of the specimen. Figure 16 and Figure 17 depict the probability distribution of normal contact forces across the three zones at t = 0.1 s and t = 0.5 s, respectively. The results reveal distinct behavior patterns dependent on the fines content. Sample FC30 exhibits similar probability distribution across all zones due to rapid development of erosion. Conversely, as the fines content increases, only Zone 3 maintains consistent probability distributions, particularly for Sample FC70. Regarding Zone 1 and Zone 2, Samples FC50 and FC70 demonstrate increased proportions of weak contact forces at t = 0.5 s, attributed to the gradual progression of seepage erosion. The weak contact force, combined with the lower mechanical coordination number in Zone 2, facilitates the development of erosion and results in the enhanced displacement observed in Sample FC70. These findings indicate that variations in the fines content would result in the stability problems at different zones within the soil skeleton.

5. Conclusions

This study employs the CFD-DEM technique to investigate the underlying mechanisms governing seepage erosion onset around sheet pile walls in gap-graded soils with varying the fines content. The comprehensive analysis integrates macroscopic behavior with particle-scale observations to elucidate the fundamental processes controlling erosion onset and development. The results demonstrate that erosion resistance increases significantly with the fines content, as evidenced by the temporal evolution of particle velocity, eroded mass ratio, particle displacement, and void ratio. The micro-scale observations indicate that the fines content serves as a critical parameter governing both overall erosion resistance and spatial heterogeneity. The results reveal that mechanical coordination number and mechanical redundancy are suitable parameters for analyzing soil skeleton stability. Due to the lower erosion resistance, Sample FC30 exhibits relatively lower magnitudes of these parameters, particularly on the downstream side. However, for Sample FC70, the gradual erosion process facilitates erosion around the sheet pile wall, which shows lower magnitudes of these parameters and results in a greater displacement compared to Sample FC50. These findings suggest that the particle interaction mechanisms are essential for predicting erosion behavior in gap-graded soils around embedded structures and should be incorporated in the theoretical analysis. While this study provides fundamental insights into particle-scale erosion processes, the results should be interpreted within the context of the simplified hydraulic boundary conditions employed. Future work incorporating complex field conditions such as turbulent flow regimes and realistic stress states will be necessary to enhance the applicability of these mechanistic insights to practical geotechnical systems.

Author Contributions

Conceptualization, Q.X.; methodology, Q.X.; software, Q.X.; validation, Q.X.; formal analysis, Q.X. and X.Y.; writing—original draft preparation, Q.X.; writing—review and editing, L.M., S.C. and L.Y.; funding acquisition, Q.X. and L.M. All authors have read and agreed to the published version of the manuscript.

Funding

This work was supported by the Talent Introduction Program of AHSTU (No. JZYJ202301), the Natural Science Research Project of Anhui Educational Committee (No. 2023AH040274).

Data Availability Statement

The original contributions presented in this study are included in the article. Further inquiries can be directed to the corresponding author.

Conflicts of Interest

The authors declare no conflicts of interest.

Abbreviations

The following abbreviations are used in this manuscript:
CFDComputational fluid dynamics
DEMDiscrete element method
FCFines content
CNCoordination number

References

  1. Foster, M.; Fell, R.; Spannagle, M. The statistics of embankment dam failures and accidents. Can. Geotech. J. 2000, 37, 1000–1024. [Google Scholar] [CrossRef]
  2. Zhao, Y.; Liu, Q.; Zhang, C.; Liao, J.; Lin, H.; Wang, Y. Coupled seepage-damage effect in fractured rock masses: Model development and a case study. Int. J. Rock Mech. Min. Sci. 2021, 144, 104822. [Google Scholar] [CrossRef]
  3. Zhao, Y.; Liu, Q.; Zhang, C.; Liao, J.; Zhu, S.; Zhang, L. Mechanical behavior of sandstone during post-peak cyclic loading and unloading under hydromechanical coupling. Int. J. Min. Sci. Technol. 2023, 33, 927–947. [Google Scholar] [CrossRef]
  4. Zhao, Y.; Zhang, L.; Wang, W.; Tang, J.; Lin, H.; Wan, W. Transient pulse test and morphological analysis of single rock fractures. Int. J. Rock Mech. Min. Sci. 2017, 91, 139–154. [Google Scholar] [CrossRef]
  5. Liu, J.; Zhao, Y.; Tan, T.; Zhang, L.; Zhu, S.; Xu, F. Evolution and modeling of mine water inflow and hazards characteristics in southern coalfields of China: A case of Meitanba mine. Int. J. Min. Sci. Technol. 2022, 32, 513–524. [Google Scholar] [CrossRef]
  6. Richards, K.S.; Reddy, K.R. Critical appraisal of piping phenomena in earth dams. Bull. Eng. Geol. Environ. 2007, 66, 381–402. [Google Scholar] [CrossRef]
  7. Kenney, T.C.; Chahal, R.; Chiu, E.; Ofoegbu, G.I. Controlling constriction sizes of granular filters. Can. Geotech. J. 1985, 22, 32–43. [Google Scholar] [CrossRef]
  8. Bendahmane, F.; Marot, D.; Rosquoët, F.; Alexis, A. Characterization of internal erosion in sand kaolin soils. Rev. Eur. Génie Civ. 2011, 10, 505–520. [Google Scholar] [CrossRef]
  9. Sato, M.; Kuwano, R. Laboratory testing for evaluation of the influence of a small degree of internal erosion on deformation and stiffness. Soils Found. 2018, 58, 547–562. [Google Scholar] [CrossRef]
  10. Tomlinson, S.S.; Vaid, Y.P. Seepage forces and confining pressure effects on piping erosion. Can. Geotech. J. 2000, 37, 1–13. [Google Scholar] [CrossRef]
  11. Wan, C.F.; Fell, R. Investigation of rate of erosion of soils in embankment dam. J. Geotech. Geoenviron. Eng. 2004, 130, 373–380. [Google Scholar] [CrossRef]
  12. Terzaghi, K. Theoretical Soil Mechanics; John Wiley & Sons: New York, NY, USA, 1943; pp. 235–264. [Google Scholar]
  13. Tanaka, T.; Verruijt, A. Seepage Failure of Sand behind Sheet Piles. The Mechanism and Practical Approach to Analyze. Soils Found. 1999, 39, 27–35. [Google Scholar] [CrossRef]
  14. Luo, Y.; Nie, M.; Xiao, M. Flume-scale experiments on suffusion at bottom of cutoff wall in sandy gravel alluvium. Can. Geotech. J. 2017, 54, 1716–1727. [Google Scholar] [CrossRef]
  15. Cundall, P.A.; Strack, O.D.L. A discrete numerical model for granular assemblies. Géotechnique 1979, 29, 47–65. [Google Scholar] [CrossRef]
  16. Scholtes, L.; Hicher, P.Y.; Sibille, L. Multiscale approaches to describe mechanical responses induced by particle removal in granular materials. Comptes Rendus Méc. 2010, 338, 627–638. [Google Scholar] [CrossRef]
  17. Zou, Y.H.; Chen, Q.; Chen, X.Q.; Cui, P. Discrete numerical modelling of particle transport in granular filters. Comput. Geotech. 2013, 47, 48–56. [Google Scholar] [CrossRef]
  18. Shire, T.; O’Sullivan, C.; Hanley, K.J.; Fannin, R.J. Fabric and Effective Stress Distribution in Internally Unstable Soils. J. Geotech. Geoenviron. Eng. 2014, 140, 04014072. [Google Scholar] [CrossRef]
  19. Tsuji, Y.; Kawaguchi, T.; Tanaka, T. Discrete particle simulation of two-dimensional fluidized bed. Powder Technol. 1993, 77, 79–87. [Google Scholar] [CrossRef]
  20. Zhao, J.D.; Shan, T. A coupled CFD-DEM analysis of granular flow impacting on a water reservoir. Acta Mech. 2014, 225, 2449–2470. [Google Scholar] [CrossRef]
  21. Hung, C.; Liu, C.H.; Chang, C.M. Numerical investigation of rainfall-induced landslide in mudstone using coupled finite and discrete element analysis. Geofluids 2018, 1, 9192019. [Google Scholar] [CrossRef]
  22. Zhou, Y.; Shi, Z.; Zhang, Q.; Jang, B.; Wu, C. Damming process and characteristics of landslide-debris avalanches. Soil Dyn. Earthq. Eng. 2019, 121, 252–261. [Google Scholar] [CrossRef]
  23. El Shamy, U.; Denissen, C. Microscale characterization of energy dissipation mechanisms in liquefiable granular soils. Comput. Geotech. 2010, 37, 846–857. [Google Scholar] [CrossRef]
  24. Kawano, K.; Shire, T.; O’Sullivan, C.; Nezamabadi, S.; Luding, S.; Delenne, J.Y. Coupled DEM-CFD Analysis of the Initiation of Internal Instability in a Gap-Graded Granular Embankment Filter. EPJ Web Conf. 2017, 140, 10005. [Google Scholar] [CrossRef]
  25. Liu, L.; Chen, R.; Zhou, C.; Li, X.; Bate, B. Microscopic mechanism of the combined effects of confining pressure and fines content on suffusion in gap-graded underfilled soils. J. Hydrol. 2023, 626, 130370. [Google Scholar] [CrossRef]
  26. LIGGGHTS. LIGGGHTS (R)-Public Documentation, Version 3.X. Available online: http://www.cfdem.com (accessed on 18 February 2015).
  27. OpenFOAM. OpenFOAM—The Open Source CFD Toolbox. The OpenFOAM Foundation. 2015. Available online: http://www.openfoam.org (accessed on 22 May 2015).
  28. Zhou, Z.; Kuang, S.; Chu, K.; Yu, A. Discrete particle simulation of particle-fluid flow: Model formulations and their applicability. J. Fluid Mech. 2010, 661, 482–510. [Google Scholar] [CrossRef]
  29. Kerst, K.; Roloff, C.; Medeiros de Souza, L.G.; Bartz, A.; Seidel-Morgenstern, A.; Thevenin, D.; Janiga, G. CFD-DEM simulations of a fluidized bed crystallizer. Chem. Eng. Sci. 2017, 165, 1–13. [Google Scholar] [CrossRef]
  30. Di Felice, R. The voidage function for fluid-particle interaction systems. Int. J. Multiph. Flow 1994, 20, 153–159. [Google Scholar] [CrossRef]
  31. Xiao, Q.; Wang, J.-P. CFD-DEM simulations of seepage-induced erosion. Water 2020, 12, 678. [Google Scholar] [CrossRef]
  32. Xiao, Q. Simulating the hydraulic heave phenomenon with multiphase fluid flows using CFD-DEM. Water 2020, 12, 1077. [Google Scholar] [CrossRef]
  33. Wang, X.; Huang, B.; Tang, Y.; Hu, T.; Ling, D. Microscopic mechanism and analytical modeling of seepage-induced erosion in bimodal soils. Comput. Geotech. 2022, 141, 104527. [Google Scholar] [CrossRef]
  34. Zhang, P.; Mu, L.; Huang, M. A coupled CFD-DEM investigation into hydro-mechanical behaviour of gap-graded soil experiencing seepage erosion considering cyclic hydraulic loading. J. Hydrol. 2023, 624, 129908. [Google Scholar] [CrossRef]
  35. Liu, Y.; Wang, L.; Hong, Y.; Zhao, J.; Yin, Z.Y. A coupled CFD-DEM investigation of suffusion of gap graded soil: Coupling effect of confining pressure and fines content. Int. J. Numer. Anal. Meth. Geomech. 2020, 44, 2473–2500. [Google Scholar] [CrossRef]
  36. Liu, L.; Chen, R.; Li, Z.; Zhou, C.; Li, X. A new method for preventing sidewall preferential flow in the internal erosion simulation using un-resolved CFD–DEM. Acta Geophys. 2024, 72, 3595–3607. [Google Scholar] [CrossRef]
  37. Kezdi, A. Soil Physics: Selected Topics; Elsevier Science: Amsterdam, The Netherlands, 1979; pp. 126–133. [Google Scholar]
  38. De Frias Lopez, R.; Silfwerbrand, J.; Jelagin, D.; Birgisson, B. Force transmission and soil fabric of binary granular mixtures. Geotechnique 2016, 66, 578–583. [Google Scholar] [CrossRef]
  39. El Shamy, U.; Zeghal, M. Coupled continuum-discrete model for saturated granular soils. J. Eng. Mech. 2005, 131, 413–426. [Google Scholar] [CrossRef]
  40. Terzaghi, K.; Peck, R.B. Soil Mechanics in Engineering; John Wiley & Sons: New York, NY, USA, 1948; pp. 213–236. [Google Scholar]
  41. Nie, Z.H.; Zhu, Y.G.; Zou, J.F.; Gong, J.; Liu, S.K. DEM study of the microscopic characteristics and internal stability of binary mixtures. Powder Technol. 2019, 352, 314–324. [Google Scholar] [CrossRef]
  42. Mu, L.; Zhang, P.; Shi, Z.; Huang, M. Coupled CFD-DEM investigation of erosion accompanied by clogging mechanism under different hydraulic gradients. Comput. Geotech. 2023, 153, 105058. [Google Scholar] [CrossRef]
  43. Thornton, C. Numerical simulation of deviatoric shear deformation of granular media. Géotechnique 2000, 50, 43–53. [Google Scholar] [CrossRef]
  44. Kruyt, N.P.; Rothenburg, L. Plasticity of granular materials: A structural-mechanics view. AIP Conf. Proc. 2009, 1145, 1073–1076. [Google Scholar]
  45. Liu, Z.; Zhang, H.; Qian, J.; Zhou, C. Macro- and micro-scale investigation of suffusion in gap-graded soils under multiple factors using CFD-DEM. Comput. Geotech. 2025, 186, 107381. [Google Scholar] [CrossRef]
  46. Radjai, F.; Wolf, D.E.; Jean, M.; Moreau, J.-J. Bimodal character of stress transmission in granular packings. Phys. Rev. Lett. 1998, 80, 61–64. [Google Scholar] [CrossRef]
  47. Minh, N.H.; Cheng, Y.P.; Thornton, C. Strong force networks in granular mixtures. Granul. Matter 2014, 16, 69–78. [Google Scholar] [CrossRef]
Figure 1. Schematic diagram of developed CFD-DEM simulation procedures.
Water 17 02461 g001
Figure 2. Schematic diagram of the numerical model.
Water 17 02461 g002
Figure 3. Spatial distribution of particle velocity at t = 0.1 s for h = 0.06 m. (a) Sample FC30; (b) Sample FC50; (c) Sample FC70.
Water 17 02461 g003
Figure 4. Temporal-spatial distribution of particle velocity for Sample FC30 at h = 0.08 m. (a) t = 0.1 s; (b) t = 0.3 s; (c) t = 0.5 s.
Water 17 02461 g004
Figure 5. Temporal-spatial distribution of particle velocity for Sample FC50 at h = 0.08 m. (a) t = 0.1 s; (b) t = 0.3 s; (c) t = 0.5 s.
Water 17 02461 g005
Figure 6. Temporal-spatial distribution of particle velocity for Sample FC70 at h = 0.08 m. (a) t = 0.1 s; (b) t = 0.3 s; (c) t = 0.5 s.
Water 17 02461 g006
Figure 7. Temporal evolution of eroded mass ratio for samples at different hydraulic gradients. (a) h = 0.06 m; (b) h = 0.07 m; (c) h = 0.08 m.
Water 17 02461 g007
Figure 8. Temporal evolution of particle displacement for samples under different hydraulic gradients. (a) h = 0.06 m (b) h = 0.07 m; (c) h = 0.08 m.
Water 17 02461 g008
Figure 9. Temporal evolution of void ratio for samples under different hydraulic gradients. (a) Sample FC30; (b) Sample FC50; (c) Sample FC70.
Water 17 02461 g009
Figure 10. Temporal evolution of the initial positions of eroded particles for different samples.
Water 17 02461 g010
Figure 11. Spatial-temporal evolution of particle displacement for different samples. (a) Zone 1; (b) Zone 2; (c) Zone 3.
Water 17 02461 g011
Figure 12. Probability distribution of CN of the fine particles with different samples at t = 0.1 s under h = 0.06 m. (a) Zone 1; (b) Zone 2; (c) Zone 3.
Water 17 02461 g012
Figure 13. Temporal evolution of the mechanical coordination number for specimens in different zones. (a) Zone 1; (b) Zone 2; (c) Zone 3.
Water 17 02461 g013
Figure 14. Temporal evolution of the mechanical redundancy for specimens in different zones. (a) Zone 1; (b) Zone 2; (c) Zone 3.
Water 17 02461 g014
Figure 15. Force chains networks for different specimens in Zone 2 at t = 0.5 s.
Water 17 02461 g015
Figure 16. Log–log plots of the normal contact force distribution in different zones at t = 0.1 s. (a) Zone 1; (b) Zone 2; (c) Zone 3.
Water 17 02461 g016
Figure 17. Log–log plots of the normal contact force distribution in different zones at t = 0.5 s. (a) Zone 1; (b) Zone 2; (c) Zone 3.
Water 17 02461 g017
Table 1. Properties of particles and boundary.
Young’s modulus5 MPa
Radii of particles0.25 mm
1 mm
Friction coefficient0.85
Poission’s ratio0.45
Restitution coefficient0.5
Table 2. The information of the specimens.
Sample FC30Sample FC50Sample FC70
Fines content (FC)30%50%70%
Number of particles389,302640,105846,449
Table 3. Properties for the free surface flow simulation.
Viscosity of WaterDensity of WaterViscosity of AirDensity of Air
10 6   m 2 / s 1000   kg / m 3 1.506 × 10 5   m 2 / s 1.2041   kg / m 3
Disclaimer/Publisher’s Note: The statements, opinions and data contained in all publications are solely those of the individual author(s) and contributor(s) and not of MDPI and/or the editor(s). MDPI and/or the editor(s) disclaim responsibility for any injury to people or property resulting from any ideas, methods, instructions or products referred to in the content.