Abstract
Seismic waves induce pore pressure changes in aquifers, leading to water level oscillations in wells. These oscillations are often used to estimate the poroelastic properties of aquifers, but their interpretation is influenced by factors such as aquifer properties, seismic wave characteristics, and wellbore storage. The aim of this study is to evaluate the effect of wellbore storage on seismically induced water level oscillations. We analyze water level responses to similar seismic forcing in two adjacent deep wells (~1000 m) tapping the same confined aquifer: one open (artesian) and one closed (flowing artesian). Seismic forcing was characterized using ground motion velocity data from a nearby seismic station. The results show that the wells differ by three orders of magnitude in their wellbore storage. In the open well, pore pressure oscillations are reliably detected only for teleseismic events, while in the closed well, they are also reliably recorded for regional earthquakes. Under these conditions, it is possible to estimate the first-order approximation of the aquifer’s poroelastic coefficients. These findings emphasize the importance of accounting for wellbore storage when interpreting seismically induced water level fluctuations.
1. Introduction
Pore pressure oscillations have been vastly reported to correlate with seismic waves [1,2,3,4,5,6,7]. These pore pressure oscillations are induced by stress variations due to cyclic loading associated with passing seismic waves [8]. The stress variations lead to strain changes in porous media, which affect the pore pressure. Water level oscillations as a response to seismic waves depend on the earthquake magnitude and the distance between the epicenter and the well. Earthquakes with high magnitudes (Mw > 7) could cause water level oscillations at wells located thousands of kilometers away from the earthquake’s epicenter. The oscillations also depend on the poroelastic properties of the aquifer and the well properties [1]. Seismic energy density, which depends on an earthquake’s magnitude and its distance to a certain location on Earth, was suggested to reflect different hydrologic responses, such as liquefaction, spring discharge changes, water level changes, and other changes in groundwater properties [9,10,11,12]. However, these different hydrological responses for the same seismic energy density are related to the frequency content of seismic waves [13]. Shalev et al. [14] showed the dependency of water level fluctuation amplitude on the poroelastic properties of an aquifer and that these properties may change due to compaction or dilatation during the propagation of seismic waves through the aquifer. Since aquifer pore pressure is evaluated through water level measurement in wells, the wellbore storage must be considered. Studies on the effect of seismic waves on pore water pressure are mostly conducted on water level measurement data from wells that tap confined aquifers. In these studies, the confined aquifer water level is measured in two types of wells with a significant difference in wellbore storage: open and closed wells. The open well, in some cases referred to as an artesian well, is defined as a well in which the water level is above the top of the aquifer but below the ground surface. In the case of an open well, the wellhead is open to the atmosphere, and water flows vertically in the well casing as a response to pore pressure oscillations in the confined aquifer. On the other hand, the closed well, in some cases referred to as a flowing artesian well, is defined as a well in which the water level is above both the top of the aquifer and the ground surface; hence, the wellhead is closed to prevent water from spontaneously flowing out of the well.
Open wells, with water levels below the wellhead elevation, serve as a drain path for aquifer pore water, which distorts and lags the reflection of pore pressure oscillation in the well water level fluctuations due to the wellbore storage effect [15]. A water level change in an open well reflects a volume change that is equal to the water level change times πR2 (R—radius of the well). The predominant storage wellbore effect in water pressure oscillations arises from these volume changes. Xing et al. [16] showed numerically that the water level response is attenuated or even unobservable in open wells, especially in low-conductivity aquifers or at high-frequency oscillations. In closed wells, the wellbore storage effect is only due to the compressibility of water, and there are no volume changes because the entire well is filled with water at all times. Pore pressure oscillations induced by the propagation of seismic waves in an aquifer are well represented by pressure measurements in the wellhead, as a result of the low wellbore storage, which leads to negligible flow between the aquifer and the well [2,15]. Closed wells, drilled into highly pressurized aquifers, were very common in the past, but they recently became rare as a result of intensive groundwater use [17].
In previous studies, it was found that wells of a similar type, tapping the same aquifer, showed different amplitudes and directions of a step-like change in the water level in response to the passage of seismic waves in the aquifer [18,19,20,21,22,23,24]. In these studies, the different responses of the water level to earthquakes were explained by the location of the wells in relation to geological faults. These studies mostly referred to the sustainable step-like change in water levels related to the passage of seismic waves and did not consider differences in well water level high-frequency oscillations, which strongly depend on the wellbore storage. Wang et al. [25] recently developed a numerical model for evaluating the effect of the wellbore and skin zone on the water level response of a well to seismic waves. Still, such models need to be verified by field measurements. Though open and closed wells respond differently to seismic waves, both types of wells are commonly used to infer the poroelastic parameters of the aquifer, even though the effect of the wellbore storage is not clear enough.
The goal of this research is to study the wellbore storage effect on well water level measurements during seismic wave propagation in an aquifer, considering the same aquifer conditions and the same dynamic strain variations at both open and closed wells. This will allow a first-order approximation of the aquifer’s poroelastic coefficients.
2. Study Area
The study area is located in the Southern Golan Heights, Israel, near the Yarmouch River, several kilometers east of the Dead Sea transform, as described in Figure 1a. The research was carried out on water level measurements from two water wells: an open well, MZR1 (Meizar 1), and a closed well, MZR2 (Meizar 2), which are located near the bed of the Meizar stream that flows towards the Yarmouk River. The MZR1 wellhead stands approximately 56 m above mean sea level (AMSL), while the MZR2 wellhead stands approximately (−103) meters AMSL. Both wells tap the Turonian and late Cenomanian age Dolostone of the upper part of the Judea group aquifer, which is confined in the study area, under low hydraulic conductivity layers of the Senonian Mount Scopus group formations (Figure 2; Supplementary Materials file, Figures S1 and S2). The hydraulic conductivity of the Judea group aquifer in the study area is between 300 m/day and 600 m/day, and storativity is between 0.00012 and 0.00025, according to pumping tests [26]. Siebert et al. [27] conducted an analysis of groundwater samples from wells MZR1 and MZR2, which showed some differences in the water chemical compositions of both wells, suggesting that water from different sources is mixed in the Judea group aquifer, near the study area (see Table S1 in the Supplementary Materials file). The diversity of the chemical composition is also evident in nearby thermal springs close to the study area [27]. The hydraulic gradient between the MZR1 and MZR2 wells is approximately stable on a yearly scale, and it stands approximately at a value of 0.008 during the non-pumping periods of the MZR2 well (Figure S3 in the Supplementary Materials file). Despite the proximity of only 3 km and a low hydraulic gradient between the wells, MZR2 is a closed well, and MZR1 is an open well, due to the high wellhead elevation difference (159 m). In this study, a well with a water level above the wellhead elevation is defined as a closed well (e.g., MZR2, with water level approximately 20 m above the wellhead), while a well with a water level below the wellhead elevation is defined as an open well (e.g., MZR1, with water level approximately 140 m below the wellhead). While MZR1 is an observation well with a continuous water level measurement, MZR2 is used occasionally for water production. During the non-production periods of MZR2, a non-return valve temporarily seals the wellhead and enables water level measurement in the well.
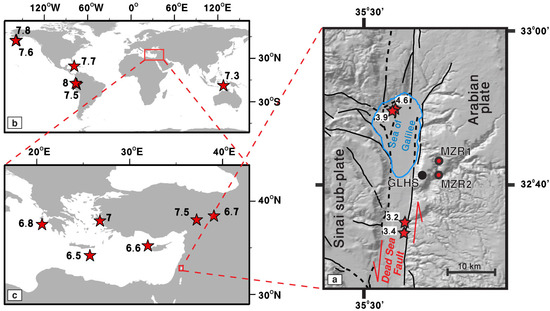
Figure 1.
Research area and earthquake locations and magnitudes. (a) The wells (MZR1 and MZR2), seismic station (GLHS), and faults (continuous and dashed lines represent known and estimated fault locations, respectively). Red arrows indicate lateral motion along the Dead Sea Transform. The red stars mark the epicenter of the teleseismic (b), regional (c), and local (a) earthquakes analyzed. The numbers next to each red star indicate the moment magnitude, Mw, of each earthquake.
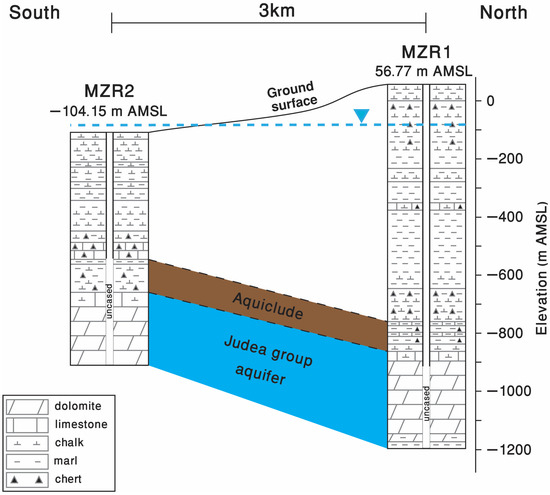
Figure 2.
Lithological cross-section between the MZR1 (open) and MZR2 (closed) wells. The wellhead elevation (above mean sea level—ASML) is indicated above each well’s lithological section. The aquifer of the Judea group is confined. The dashed blue line marks the estimated potentiometric surface of the Judea group aquifer between the wells, according to average water level measurements of the wells during 2023.
The technical specifications of the wells are shown in Table 1. Water enters the wells through their uncased section, which is mostly located within the upper part of the Judea group, consisting of dolostone, at a depth of 964–1250 m and at a depth of 448–807 m in MZR1 and MZR2, respectively. In MZR1, the average static water level is approximately 140 m below the surface, while in MZR2, it is approximately 10 m above the surface (according to average measurements in 2023). The relative proximity between the wells, which tap the same aquifer, allows an examination of the influence of well type, namely, closed or open, on the measured groundwater level response to earthquakes. The dolostone karstification level in the upper Judea group near the wells is unknown and assumed to be similar because of the very close distance between the wells and the lack of a significant lithological difference in the well logs during drilling. Still, the lithology of the open section of the MZR2 well also contains, besides dolostone, a portion of limestone, chalk, and marl (about 30% total), which might create a certain degree of variance in aquifer hydraulic parameters. Although this study is focused on one specific site, we believe that the results are applicable to different lithologies and well setups.

Table 1.
Monitoring well technical specifications. Wellhead elevation is presented in meters above mean sea level (m AMSL).
In order to perform the above examination, groundwater level measurement data of the wells is compared to ground motion velocity measurement data from the nearest seismic station, GLHS (Figure 1a, (Latitude 32.71351°, Longitude 35.64957°, elevation ~333 m AMSL)), which is located 5.4 km southwest of MZR1 and 4.4 km west of MZR2.
3. Methods
3.1. Groundwater and Ground Motion Measurements
A schematic description of the measuring stations in the study area is shown in Figure 3. Water level data of the wells was obtained using Keller–Druck piezo-resistive pressure sensors, model PAA33X, in the closed well, MZR2, and PAA36XW in the open well, MZR1. The measuring range of the PAA33X sensor is 0–0.3 MPa, with an accuracy of 150 Pa and a signal stability of 7 Pa. The measurement range of the PAA36XW sensor is 0–0.1 MPa, with an accuracy of 50 Pa and a signal stability of 2.5 Pa. Water pressure in both wells is recorded at a rate of 40 samples per second. The main difference between the two pressure sensors is that the sensor of the closed well is screwed into the well casing at the ground surface, while the sensor of the open well is submerged 5 m below the water level and hangs inside the well casing on a ~145 m long cable, fixed to the wellhead. Since there is no possibility for water to rise up the closed well, while it is closed, water pressure changes in the aquifer are transferred up the well casing and are measured as water pressure changes at the wellhead. In the open well, water pressure changes in the aquifer lead to water movement up or down the well casing, which changes the water column height in the well. Therefore, the pressure measurement in the open well represents the water column height above the submerged sensor. The pressure sensors at the wells are connected by means of an electrical and communication cable to a Campbell Scientific data logger, model CR6, which is located in a control box next to or near the wellheads. The control box also includes a solar power supply system, a Vaisala PTB110 barometric pressure sensor, a Garmin GPS receiver, GPS16X-HVS, for time correction, and a cellular communication system for transmitting the measured data to the Geological Survey of Israel (GSI).
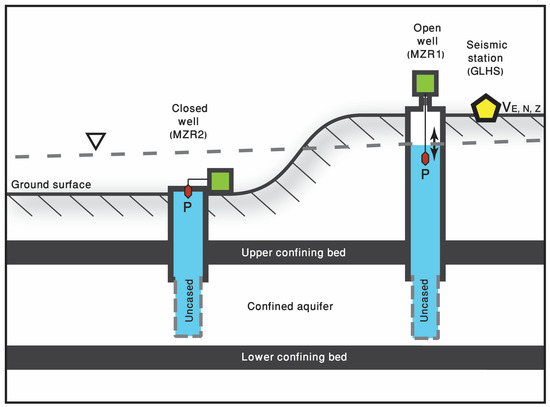
Figure 3.
An illustration of measurement systems, including water pressure sensors (red hexagons), the control box with data logger, the barometric pressure sensor, the power system and communication system (a green square), and the GLHS seismic station (a yellow pentagon). The dashed line marks the estimated potentiometric surface of the confined aquifer, into which the wells penetrate. The black arrows represent fluctuations of water level in the open well.
Seismic data is obtained from station GLHS of the Israel Seismic Network [28]. GLHS is a station with collocated sensors, recording ground accelerations, velocities, and displacements. The velocity data used in this study was measured by a Trillium 120 PH broadband seismometer (Nanometrics), located within a posthole, at a depth of 5.5 m below the surface (327.5 m AMSL), and recorded by a 6-channel Centaur (Nanometrics), at 200 samples per second and 40 V peak-to-peak sensitivity. As a common practice in seismic measurements, the seismometer was located at least 5 m below the surface to reduce the influence of daily temperature fluctuations and other ambient seismic noises of the ground surface.
3.2. Seismic Data Processing
Data in this study includes 16 seismic events clearly recorded in both wells and the seismic station. The events’ source information was obtained from the USGS [29] and GSI [30] catalogs (Table 2) and were categorized into three groups: four local events, six regional events, and six teleseismic events (see the source location map in Figure 1).

Table 2.
Time, location, and other properties of the seismic event sources used in this research.
Waveforms were manually picked for their P, S, and surface arrivals, using Antelope seismic processing software version 5.13 (<brtt.com>), and due to the proximity of the seismic station to the wells, the arrival times were assumed identical at all stations (Figure 4). Each phase was then segmented and processed independently.
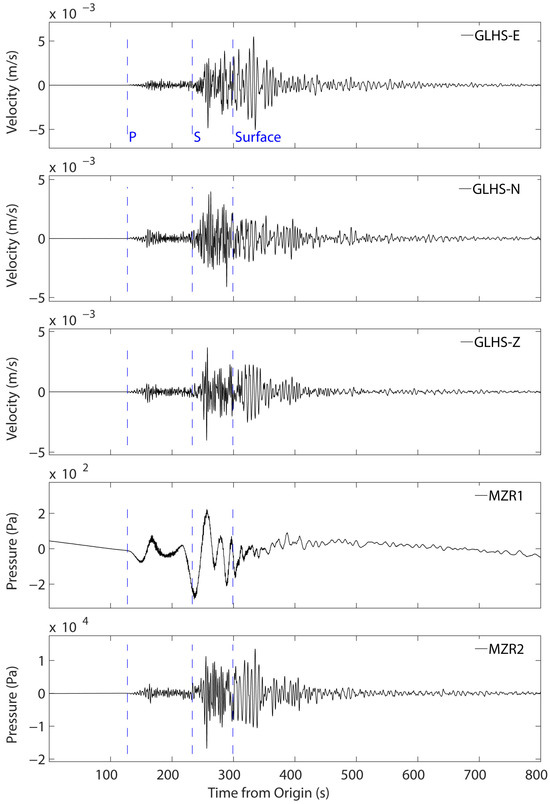
Figure 4.
Time series of the east (E), north (N), and vertical (Z) components of the ground velocity measured at the GLHS seismic station and water pressure measured at the MZR1 and MZR2 wells during the arrival of seismic waves from a regional earthquake, on 24 January 2024, M 6.7, that occurred in Turkey at 17:55:14 UTC. The earthquake’s seismic waves arrived at the wells at 17:56:55 UTC. In this figure, time = 0 is 17:54:55 UTC.
Volumetric strain, , and deviatoric strain, , were calculated from the velocity data of each seismic phase according to the wave velocity and based on the following equations for body waves (e.g., Shearer [31]):
where is either the P-wave velocity or the S-wave velocity, and are the longitudinal ground motion (displacement and velocity), and and are the transversal components. Calculation of the longitudinal and transversal components requires a 3-D rotation of the seismic waveforms to their longitudinal (L), SV (Q), and SH (T), accounting for the incidence angle at which the body waves approach the station. This coordinate system separates the coupled pressure waves and shear waves from the Z component to a purely P-wave component, defined as the longitudinal (L) direction, and two perpendicular shear wave components, defined as the vertical SV and horizontal SH components [32]. The estimation of the incidence angle for each type of body wave phase is not a straightforward procedure, especially for cases when different wave phases arrive together. For surface waves, the radial and transversal components are defined according to the azimuthal direction from the seismic station to the earthquake location: the radial is the event-to-station orientation, and the transversal is its perpendicular in the horizontal plane. Thus, the surface wave radial ( and transversal () strain components are calculated using the same equations as Equations (1) and (2), but with , representing either Rayleigh (3000 ) or Love (3500 m/s) wave velocity, depending on the considered phase (e.g., Lay and Wallace [33]):
where and are the radial ground motion (displacement and velocity). In this study, we do not distinguish between Rayleigh and Love waves and assign a velocity of 3500 m/s to both surface waves.
As Skempton [34] showed, the change in pore fluid pressure in an undrained poroelastic material depends on both the mean and differential stress components. Shalev et al. [35] expressed the relation in terms of volumetric and shear strains:
where is the calculated pore pressure change induced by the volumetric and deviatoric strain components ( and ). and N are the volumetric strain and shear strain coupling coefficients, respectively. This means that a change in strain is linearly related to pore pressure and water level. The pore pressure change induced by surface waves is calculated using the radial () and transversal () strain components (Equations (3) and (4)). The radial strain component is multiplied by a factor of ( is the undrained Poisson ratio) to obtain the volumetric strain according to the free surface condition (e.g., Shalev et al. [35]), and is the coefficient for the radial strain:
The strain–pressure relations, Equations (5) and (6), are originally written in the time domain. These equations could be re-written in the frequency domain taking the Fourier transform and assuming that the coupling coefficients are frequency-independent. For surface waves, the strain and pore pressure coupling expression in the frequency domain is:
The calculated spectrum of the strain and water pressure data were then compared to the spectrum of the measured water pressure in the wells. The spectra of the signals were obtained by applying a Fourier integral on each of the segmented time-domain phases (P, S, and surface), using a fixed frequency step of log(f) = 0.05 (e.g., Kurzon et al. [28]). For regional and teleseismic events, this was performed in a frequency range of 0.01–20 Hz, and for local events in a frequency range of 0.3–20 Hz. The upper limit of 20 Hz is defined by the Nyquist frequency of the water level data, recorded at a rate of 40 samples per second. The lower frequency limit is defined by the spectra of the source: for the larger ones with a lower frequency content, 0.01 Hz, and for the smaller events (the local events in this dataset), 0.3 Hz. Similar transformations were applied to the 30 to 500 s time series of noise preceding the P-wave arrival in order to obtain the spectral reference for the earthquake recorded signals.
In this study, we focus on the difference between pressure oscillations in open and closed wells. Therefore, we use the same and N values that provide the best fit for all the processed regional and teleseismic events simultaneously and show a comparison between the spectra of the recorded pressure oscillations and the calculated pressure oscillation, applying Equation (7) only for the case of surface wave analysis.
4. Results
Data on the water pressure oscillations recorded in the two adjacent open (MZR1) and closed (MZR2) wells is compared with the recorded ground motions from the adjacent seismic station (GLHS) for three earthquake types: teleseismic, regional, and local. Below, we present the measurement results of the three earthquake types: Alaska, 22 July 2020, M 7.8, representing the teleseismic type; central Turkey, 24 January 2020, M6.7, representing the regional type; and Sea of Galilee, Israel, 4 July 2018, M 4.6, representing the local type. The signals are presented in the time and frequency domains. The spectral analysis provides a more generalized approach, exploring frequency-dependent aspects of the different phases in the two types of wells. A complete presentation of all the other 13 earthquakes that are listed in Table 2 is provided in the Supplementary Materials file (Figures S4–S16).
The impact of the teleseismic waves from the 22 July 2020, M 7.8 earthquake that occurred in the Alaskan region is shown in Figure 5. The background noise recorded during the ~400 s before the first arrival of the seismic signal is shown for both wells in the time domain (Figure 5a). The background noise spectrum is compared with the spectra of the three seismic phases: P, S, and surface waves (Figure 5f–h). The overall noise amplitude (Figure 5a) and its spectral content (dashed lines in Figure 5f–h) in both wells during the specified period are quite similar. This is not a general rule, and in other cases, the measured noise may be different between the two wells.
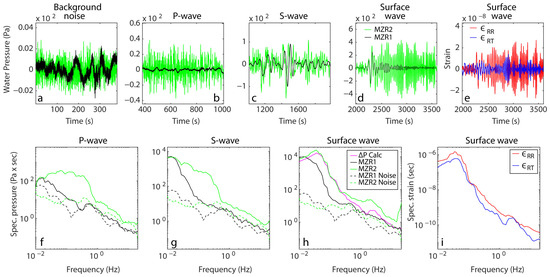
Figure 5.
The response of the open (MZR1) and closed (MZR2) wells to the magnitude 7.8 teleseismic earthquake, originating in the Alaska region on 22 July 2020. The black and green lines represent the time series of the water pressure measurements in wells MZR1 and MZR2, respectively: (a) background noise, (b) P-wave, (c) S-wave, (d) surface wave Time series of radial (red line) and transversal (blue line) strain during the passage of surface waves (e). Spectra of well water pressure fluctuations: (f) P-wave, (g) S-wave, (h) surface wave with calculated pore water pressure (magenta). (i) Spectra of radial and transversal strain during the passage of surface waves. The dashed lines indicates background noise spectra for MZR1 well (black) and the MZR2 well (green). Note the different scales of the Y-axes.
The amplitude of the pressure oscillations in the open well, MZR1, induced by the passage of the P-waves is significantly lower than the amplitude of the pressure oscillations in the closed well, MZR2 (Figure 5b). This amplitude difference in response to P-waves is also apparent in the frequency domain in the comparison between the spectra of the wells’ water pressure oscillations (Figure 5f). At high frequencies, above ~0.3 Hz for the open well and above ~1 Hz for the closed well, the signals of water pressure oscillations become close to the background noise. Although both wells are adjacent and tap the same aquifer that responds to the passage of the same P-waves, for frequencies higher than 0.03 Hz, the oscillation amplitude in the open well is almost an order of magnitude lower than the oscillation amplitude in the closed well. This means that the P-wave-induced pressure oscillations in the open well could not be simply used to evaluate the aquifer’s poroelastic properties without also considering the wellbore storage effect on the well water level response. On the other hand, in the closed well, a relatively wider low-frequency range of water pressure oscillations is well above the background noise, which is more reliable for aquifer poroelastic properties evaluation.
The amplitudes of the S-waves and surface waves that radiated from every earthquake are several times larger than the amplitude of the P-waves. During the passage of the S-waves of the teleseismic earthquake, the pressure oscillations approach the noise level at frequencies higher than ~0.3 Hz and ~0.5 Hz for the open well and the closed well, respectively. In the case of the passage of the surface waves of the teleseismic earthquake, the pressure oscillations approach the noise level at the open well for frequencies higher than ~0.5 Hz. For the S- and surface phases, the spectra (Figure 5g,h) show the same pressure oscillation amplitude in both wells for very low frequencies, below 0.02 Hz. At higher frequencies, the amplitude of the oscillations in the open well is significantly lower than in the closed well. The major difference in the pressure oscillation amplitude between the two adjacent wells emphasizes the importance of the wellbore storage effect in evaluating aquifer poroelastic properties from the water level response to seismic waves. Taking into account the differences between open and closed well data, we use only the record from the closed well for comparison with the spectrum of the calculated pore pressure from the ground motion measurements, using the and N = 15 values (Equation (7)), shown by the magenta line in Figure 5h. BKu and N were obtained by calculating their best-fit values for each of the events in Table 2 and then taking their mean values. Calculations were performed using the strain components obtained from the seismic data and shown in the time domain (Figure 5e) and in the spectral domain (Figure 5i). Since the calculations were performed using the spectral data (Equation (7)), the similarity between the radial and transversal strain components (Figure 5i), as well as in the other telesesmic and regional events shown in the Supplementary Materials file (Figures S4–S8), limits our certainty regarding the and N values for each specific event.
A similar example of the signals in the time and frequency domains, recorded in response to a regional earthquake with a magnitude of M 6.7, which occurred in central Turkey on 24 January 2020, is presented in Figure 6. Similar to the previous record of the teleseismic earthquake, the background noise of the water pressure measurement in both wells is shown prior to the seismic wave arrival (Figure 6a). Similarly, the time series (Figure 6a–d) and spectrum (Figure 6f–h) of the water pressure measurements are divided according to three main seismic phases (P, S, and surface). The amplitude of the water pressure oscillations in the closed well, MZR2, is one to two orders of magnitude higher than the amplitude of the water pressure oscillations in the open well, MZR1. The spectra of the water pressure signals for both the open and closed wells have significantly larger amplitudes than the noise level along the entire frequency range. In addition, the water pressure oscillation amplitude for the whole frequency range and at all phases for the closed well is at least an order of magnitude larger than the water pressure oscillation amplitude for the open well (Figure 6f–h). The magenta line in Figure 6h shows the spectrum of the calculated pressure oscillation using the same and N values mentioned before. The signals of the strain components in the time and frequency domains are shown in Figure 6e and Figure 6i, respectively. As in the case of a teleseismic earthquake (Figure 5i), the spectra of the strain components for the frequency range between 0.01 Hz and 1 Hz are very similar, making the spectral domain problematic for independently constraining the and N values.
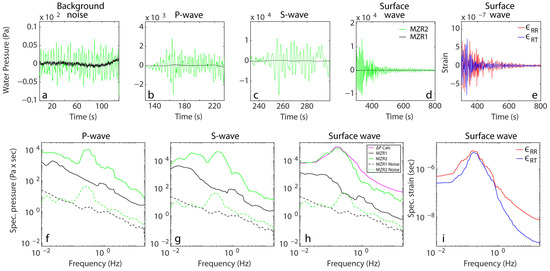
Figure 6.
The response of the open (MZR1) and closed (MZR2) wells to the magnitude 6.7 regional earthquake, originating in central Turkey on 24 January 2020. The black and green lines represent the time series of the water pressure measurements in wells MZR1 and MZR2, respectively: (a) background noise, (b) P-wave, (c) S-wave, (d) surface wave. Time series of radial (red line) and transversal (blue line) strain during the passage of surface waves (e). Spectra of well water pressure fluctuations: (f) P-wave, (g) S-wave, (h) surface wave with calculated pore water pressure (magenta). (i) Spectra of radial and transversal strain during the passage of surface waves. The dashed lines indicates background noise spectra for MZR1 well (black) and MZR2 well (green). Note the different scales of the Y-axes.
Figure 7 shows an example of the signals in the time and frequency domains recorded for a local earthquake that occurred on 4 July 2018, M 4.6, in the northwestern section of the Sea of Galilee, about 15 km from the Meizar wells. Most of the energy of the radiated waves from a weaker earthquake is within the significantly higher frequency range. The background noise is shown for about 20 s prior to the event (Figure 7a), and the high-frequency noise amplitude (<3 Pa × s) is significantly lower than that of the regional and teleseismic earthquakes (between 101 and 102 Pa × s). In contrast to the P-wave response in the regional and teleseismic earthquakes, in this local event, the amplitude of the water pressure oscillation response in both wells is on the same order of magnitude. In the S-wave and surface wave phases, the response amplitude in the closed well, MZR2, is significantly higher than the response amplitude in the open well, MZR1.
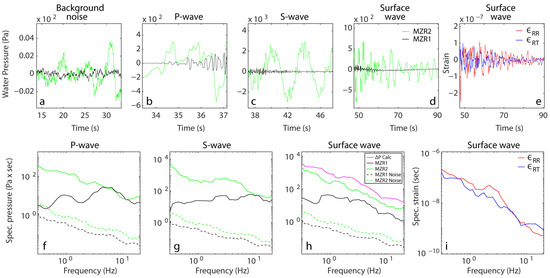
Figure 7.
The response of the open (MZR1) and closed (MZR2) wells to the magnitude 4.6 local earthquake, originating in the northwest of the Sea of Galilee on 4 July 2018. The black and green lines represent the time series of the water pressure measurements in wells MZR1 and MZR2, respectively: (a) background noise, (b) P-wave, (c) S-wave, (d) surface wave. Time series of radial (red line) and transversal (blue line) strain during the passage of surface waves (e). Spectra of well water pressure fluctuations: (f) P-wave, (g) S-wave, (h) surface wave with calculated pore water pressure (magenta). (i) Spectra of radial and transversal strain during the passage of surface waves (i). The dashed lines indicates background noise spectra for MZR1 well (black) and MZR2 well (green). Note the different scales of the Y-axes.
The signal duration for the local earthquake is significantly shorter, and the separation between phases is problematic. The P-waves may still arrive while the initial S-waves join in, and, similarly, the surface waves may overlap with the S-waves. Although this constrains our model Equation (7), there is a reasonable resemblance between the spectra of the calculated water pressure and the measured water pressure in the closed well (Figure 7h) for the surface waves.
5. Discussion
This research presents, for the first time, field measurements of two adjacent wells tapping the same confined aquifer, which exists under artesian conditions. Because of the elevation difference in the wellheads, one of the wells is open and the other one is closed. The dynamic strain is evaluated through ground motion velocity measurements at a nearby seismic station. In addition, we examine the frequency range in which the open well represents the dynamic strain variations at different phases of seismic waves. This examination is important for studies that use seismic-wave-induced water level fluctuations in wells to evaluate the poroelastic properties of aquifers.
5.1. Open Well vs. Closed Well
The results of this study indicate that the effect of seismic waves on water levels is different between the two adjacent closed and open wells that tap the same aquifer. The water level response to Earth tides presented in Figure 8 shows no significant phase or amplitude differences, implying that near both well locations, the same hydraulic and mechanical characteristics prevail. This is in spite of the known differences in the open-section lithology of each well (Figure 3) and the unknown karstification level in each location.
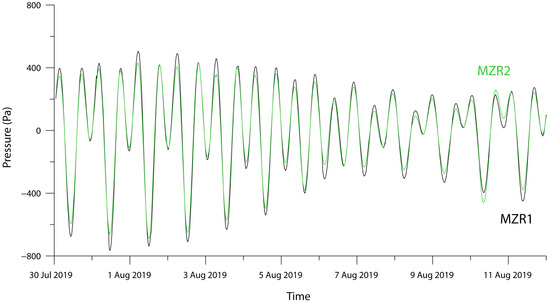
Figure 8.
Response of well water pressure to Earth tides. A fourteen-day time series of the water pressure measurements in MZR1, the open well, and MZR2, the closed well. The pressure data was demeaned to remove the barometric trend.
While at very low frequencies (f < 2 × 10⁻⁵ Hz), corresponding to Earth tides, wellbore storage effects are negligible, at higher frequencies (f > 2 × 10⁻² Hz), there is significant frequency-dependent filtering in the open well (Figure 5, Figure 6 and Figure 7). This is seen through the differences between the spectrum of the open well and the spectrum of the closed well, especially at frequencies with high spectral amplitudes. The response of a well to changes in the aquifer pore pressure can vary significantly depending on whether the well is open or closed. A seismic wave-induced pore pressure variation in an aquifer causes different amounts of water pressure response in closed and open wells, due to the different wellbore storage, i.e., the different capacity of the wells to release groundwater. The well might be viewed as an element of the hydraulic system with different storage properties (storativity or specific storage) defined differently for confined and unconfined aquifers [36]. Similar to a confined aquifer, the pressure change, in the closed well is accommodated by water compressibility, . The wellbore storage coefficient of a closed well, , is the volume of water, , flowing into the closed well divided by ,
where V, R, and H are the volume, radius, and hydraulic head of the closed well, respectively.
An open well accommodates the pressure change, , by flow within the well that changes the water level by . The water level change is related to the amount of water flowing into the well so . Thus, the wellbore storage coefficient of an open well () with the same dimensions as the closed well is:
Finally, the ratio between the wellbore storage coefficients of an open well and a closed well in response to the same pressure change in the aquifer is obtained by dividing Equation (9) by Equation (8):
For wells, such as MZR1 and MZR2, with a hydraulic head of approximately H = 1000 m, a water density of = 1000 kg/m3, and water compressibility of = 5 × 10⁻¹⁰ 1/Pa, the predicted volume flowing into the open well is three orders of magnitude larger than the predicted volume flowing into the closed well. This will require a longer time for the open well to fully respond to the pressure change in the aquifer. This explains why the amplitude of high-frequency pressure oscillations in the open well is significantly lower than in the closed well. According to a comparison between the spectra of the water pressure oscillations recorded in the open and closed wells (Figure 5, Figure 6 and Figure 7), the open well spectral amplitude is significantly lower and, in some cases, even approaches the noise level. This difference decreases for the low-frequency teleseismic signals and becomes negligible for the very-low-frequency signals associated with tidal variations (Figure 8).
The presented comparison of the pressure oscillation in the two adjacent wells, together with the above estimation, shows that the records in the open well represent the water pressure oscillations in the aquifer only for signals that are dominated by the low-frequency range, such as tides and teleseismic events. The higher-frequency range of seismic-wave-induced oscillations for regional and local earthquakes is significantly damped, and it is not appropriate for constraining aquifer poroelastic properties. However, a significant response of the open well to seismic waves, greater than the measurement noise, also in high frequencies, occurs in response to local earthquakes (Figure 7). A possible explanation for this could be an artifact of the pressure measurement in the open well caused by a high-frequency relative movement between the sensor suspended in the open well and the well itself, which does not occur in closed wells. In any case, it is clear from Figure 7 that, also for local earthquakes, the similarity between the calculated pore pressure oscillation spectrum and the closed well measured pressure spectrum is higher than the similarity between the calculated pressure spectrum and the open well measured pressure spectrum. That is, the pressure in the closed well is a better representative of the pore water pressure in the aquifer than the pressure measured in the open well.
5.2. Pressure Oscillations in a Closed Well Induced by Surface Waves
The results presented in this study allow for an examination of the water pressure response in the closed well to surface seismic waves originating from sources at different distances. Figure 9 demonstrates the agreement between the spectra of the measured pressure oscillations in the closed well, MZR2, and the calculated water pressure using Equation (7) with constant poroelastic coefficients of and N = 15 .
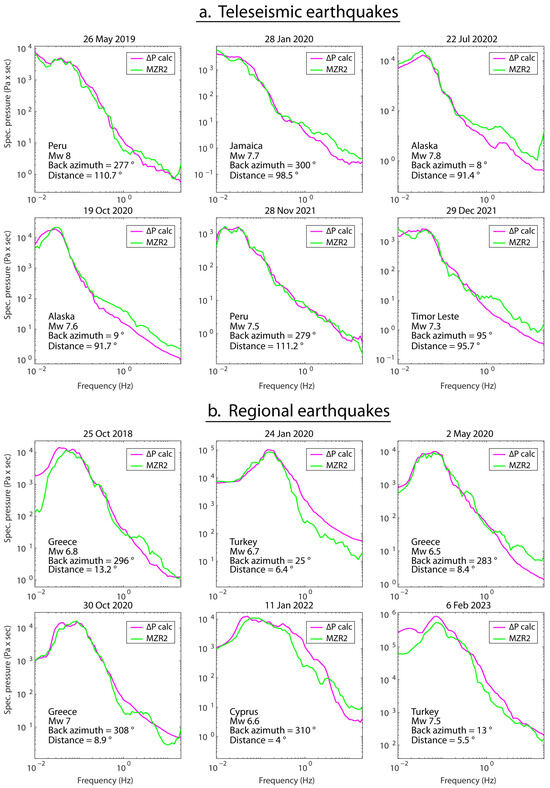
Figure 9.
Spectral analysis of the response to seismic waves originating from six teleseismic earthquakes (a) and six regional earthquakes (b), with different locations and magnitudes. Comparison, according to the surface wave phase only, between the water pressure fluctuations in the closed well, MZR2, and the calculated water pressure fluctuations in the aquifer, according to BKu = 5.4 GPa and N = 15 GPa. Source-to-site distance and back azimuth are presented for each earthquake.
The quality of the fit is highlighted by calculating the spectral ratio between the pore water pressure calculated from ground velocity measurements and the pressure measurements in the well. Figure 10 shows the spectral ratio for three different groups of earthquakes, according to their epicentral distances: local (a), regional (b), and teleseismic (c). Two red lines mark a spectral ratio range of 0.5–2, in which there is a good agreement between the well measurements and the calculated pressure oscillations. Although there is no agreement for local earthquakes (Figure 10a), for regional and teleseismic events (Figure 10b,c), there is a wide frequency band in which there is good agreement between the closed well measurements and calculated pressure oscillations. In addition, in the shaded areas of Figure 10b,c, which indicate the spectral signature of the seismic sources (Figure 9), we see a good fit between the water pressure and the ground motion oscillations. The similarity between the measured and calculated water pressure means that the aquifer’s poroelastic parameters (as and N) may be estimated using regional and teleseismic data. In the case of local events, in which the seismic phases are closer in time, distinguishing between the different phases is not straightforward, and large uncertainties may be related to the strain components associated with these phases. In such cases, we expect significant deviations between the measured pressure oscillations and the predicted pressure oscillations (Equation (7)). Furthermore, the spectral ratio of the regional events (Figure 10b) is increased and dispersed over a range of one order of magnitude at oscillation frequencies greater than 0.4 Hz. Such frequency dependence might be caused by the different lithologies, as the well and the seismic station are at a distance of about 5 km from each other. In addition, the seismometer is considered to be at surface level (about 5 m below the surface), while the depth at which water enters the well is from 448 to 807 m below the surface; hence, it is less affected by typical higher amplitudes at the near surface.
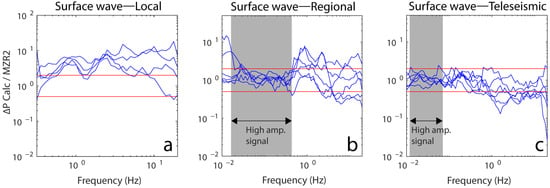
Figure 10.
Spectral ratio between the pressure measurements in the closed well, MZR2, and the pore water pressure calculated from ground velocity measurements at the GLHS seismic station during the passage of seismic surface waves. The blue lines represent the spectral ratio for the local (a), regional (b), and teleseismic (c) events. The red horizontal lines represent the upper and lower boundaries of the good fit (ratio of 0.5–2, around a 1:1 ratio) between the pore water pressure calculated from ground motion velocities and the closed well pressure measurements. The gray rectangles represent the average frequency range where the MZR2 signal spectra show the highest amplitudes for the regional (b) and teleseismic (c) events.
The good agreement between the well measurements and the calculated pressure oscillations was obtained by using constant and N values, assuming they have no azimuthal dependency but show a similar ratio to the ratios discussed by Barbour and Beeler [37]. In a future study, we intend to focus on (a) characterizing the azimuthal dependency of surface waves and (b) evaluating the response of closed wells to body waves. The main challenge in evaluating the volumetric and deviatoric strains caused by seismic body waves at a specific site is finding the incidence angle of these waves at that site. Once the volumetric and deviatoric strains are known, it is possible to use Equation (5), compare the calculated pore pressure to the measured water pressure in the closed well, and then try to evaluate the media anisotropy, as reflected by the change in the poroelastic horizontal and vertical coefficients, depending on the azimuth and inclination angles. Additional limitations of the current study may result from (a) the fact that this is one case study, based on two wells at a dolomitic aquifer, and (b) possible differences in aquifer properties between the wells that may exist due to heterogeneity in the aquifer.
6. Conclusions
The passage of seismic waves through an aquifer causes elastic deformation of the surrounding rock, resulting in pore pressure oscillations within the aquifer. Since water level oscillations observed during seismic wave passage are commonly used to infer poroelastic properties, it is crucial to understand how well properties influence the water level response, particularly in the seismic frequency range. In this study, we demonstrate the effect of wellbore storage on seismically induced water level oscillations using data from two adjacent deep wells (~3 km apart) that tap the same confined dolostone aquifer. One well is open (artesian), and the other is closed (flowing artesian). We show that the open well exhibits significant attenuation of high-frequency water level oscillations, whereas the closed well retains a clearer response. This difference is attributed to wellbore storage: the open well requires a water volume approximately three orders of magnitude larger to reflect the same pressure change. In the open well, pore pressure oscillations are reliably detected only for teleseismic events, while in the closed well, they are also reliably recorded for regional earthquakes. Under these conditions, it is possible to estimate the first-order approximation of the aquifer’s poroelastic coefficients.
Supplementary Materials
The Supplementary Material file can be downloaded at https://www.mdpi.com/article/10.3390/w17162453/s1. Text S1: The Judea group aquifer characteristics in the study area; Figure S1: Geological map of the study area surroundings; Figure S2: Generalized cross-section of the Judea group aquifer around the study area; Table S1: Chemical analysis of groundwater from wells MZR1 and MZR2; Text S2: Long-term water table hydrographs from wells MZR1 and MZR2; Figure S3: A one-year long time series of the hydraulic head measurements from wells MZR1 and MZR2; Text S3: Analysis of the seismic events mentioned in Table 2; Figure 5, Figure 6 and Figure 7 in the manuscript; Figures S4–S8: Analysis of the well response to teleseismic earthquakes; Figures S9–S13: Analysis of the well response to regional earthquakes; Figures S14–S16: Analysis of the well response to local earthquakes. Refs. [27,38,39,40,41] are cited in SM.
Author Contributions
Conceptualization, H.L., I.K., H.G., V.L., and E.S.; methodology, I.K., V.L., and E.S.; software, H.L., I.K., and V.L.; validation, H.L., V.L., and E.S.; formal analysis, H.L. and I.K.; investigation, H.L. and I.K.; resources, I.K. and E.S.; data curation, H.L., and I.K.; writing—original draft preparation, H.L.; writing—review and editing, H.L., I.K., H.G., V.L., and E.S.; visualization, H.L.; funding acquisition, E.S. and V.L. All authors have read and agreed to the published version of the manuscript.
Funding
Grants from the Israel Science Foundation (ISF 363/20) and the Israel Ministry of Sciences and Technology (MOST 1254) supported this research.
Data Availability Statement
The Matlab script and data files used in the processing and generation of Figure 4, Figure 5, Figure 6, Figure 7, Figure 8, Figure 9 and Figure 10 and S4–S16 are provided at https://doi.org/10.5281/zenodo.15877086. Within the zip file, there is a short page describing the content of the folder. The script was written in Matlab version 2023b (https://www.mathworks.com/products/matlab.html, last accessed on 18 August 2025), combined with Antelope Software version 5.13 for seismic acquisition and processing (https://brtt.com, last accessed on 18 August 2025). Teleseismic and regional earthquakes metadata is from the U.S. Geological Survey, 2025, Earthquake Lists, Maps, and Statistics, at URL https://www.usgs.gov/natural-hazards/earthquake-hazards/lists-maps-and-statistics (last accessed on 18 August 2025). Local earthquake metadata is from the Geological Survey of Israel at URL https://eq.gsi.gov.il/en/indexEn.php (last accessed on 18 August 2025).
Acknowledgments
We would like to thank Uri Malik for his important technical assistance.
Conflicts of Interest
The authors declare no conflicts of interest.
References
- Cooper, H.H., Jr.; Bredehoeft, J.D.; Papadopulos, I.S.; Bennett, R.R. The Response of Well-Aquifer Systems to Seismic Waves. J. Geophys. Res. 1965, 70, 3915–3926. [Google Scholar] [CrossRef]
- Kitagawa, Y.; Itaba, S.; Matsumoto, N.; Koizumi, N. Frequency Characteristics of the Response of Water Pressure in a Closed Well to Volumetric Strain in the High-Frequency Domain. J. Geophys. Res. Solid Earth 2011, 116, 1–12. [Google Scholar] [CrossRef]
- Brodsky, E.E.; Roeloffs, E.; Woodcock, D.; Gall, I.; Manga, M. A Mechanism for Sustained Groundwater Pressure Changes Induced by Distant Earthquakes. J. Geophys. Res. Solid Earth 2003, 108, 2390. [Google Scholar] [CrossRef]
- Roeloffs, E. Poroelastic Techniques in the Study of Earthquake-Related Hydrologic Phenomena. In Advances in Geophysics; Dmowska, R., Saltzman, B., Eds.; Elsevier: Amsterdam, The Netherlands, 1996; Volume 37, pp. 135–195. [Google Scholar]
- Liu, L.-B.; Roeloffs, E.; Zheng, X.-Y. Seismically Induced Water Level Fluctuations in the Wali Well, Beijing, China. J. Geophys. Res. Solid Earth 1989, 94, 9453–9462. [Google Scholar] [CrossRef]
- Cao, M.; Xue, L.; Zhao, L. Investigating Well Water Level Oscillations Caused by Seismic Waves Using Automatically Detected Responses. J. Hydrol. 2024, 639, 131628. [Google Scholar] [CrossRef]
- Isaya, D.; De Luca, G.; Di Carlo, G.; Guerriero, V.; Martorana, R.; Tallini, M. Hydroseismograms at Gran Sasso Aquifer, Central Italy, for Earthquake Hydrology Studies. Sci. Rep. 2025, 15, 13162. [Google Scholar] [CrossRef]
- Hsieh, P.A.; Bredehoeft, J.D.; Farr, J.M. Determination of Aquifer Transmissivity from Earth Tide Analysis. Water Resour. Res. 1987, 23, 1824–1832. [Google Scholar] [CrossRef]
- Wang, C.; Chia, Y. Mechanism of Water Level Changes during Earthquakes: Near Field versus Intermediate Field. Geophys. Res. Lett. 2008, 35, L12402. [Google Scholar] [CrossRef]
- Wang, C.Y.; Manga, M. Hydrologic Responses to Earthquakes and a General Metric. Geofluids 2010, 10, 206–216. [Google Scholar] [CrossRef]
- Cucci, L.; Castellano, C.; Tertulliani, A. A Dataset of Hydrological Effects Induced by Historical and Modern Earthquakes in Southern Apennines (Italy). Sci. Data 2025, 12, 879. [Google Scholar] [CrossRef]
- Sanz de Ojeda, A.; Alhama, I.; Sanz, E. Aquifer Sensitivity to Earthquakes: The 1755 Lisbon Earthquake. J. Geophys. Res. Solid Earth 2019, 124, 8844–8866. [Google Scholar] [CrossRef]
- Weingarten, M.; Ge, S. Insights into Water Level Response to Seismic Waves: A 24 Year High-Fidelity Record of Global Seismicity at Devils Hole. Geophys. Res. Lett. 2014, 41, 74–80. [Google Scholar] [CrossRef]
- Shalev, E.; Kurzon, I.; Doan, M.-L.; Lyakhovsky, V. Sustained Water-Level Changes Caused by Damage and Compaction Induced by Teleseismic Earthquakes. J. Geophys. Res. Solid Earth 2016, 121, 4943–4954. [Google Scholar] [CrossRef]
- Kano, Y.; Yanagidani, T. Broadband Hydroseismograms Observed by Closed Borehole Wells in the Kamioka Mine, Central Japan: Response of Pore Pressure to Seismis Waves from 0.05 to 2 Hz. J. Geophys. Res. Solid Earth 2006, 111, B03410. [Google Scholar] [CrossRef]
- Xing, Y.; Liu, Q.; Hu, R.; Gu, H.; Taherdangkoo, R.; Ptak, T. Global Sensitivity Analysis of Water Level Response to Harmonic Aquifer Disturbances through a Monte-Carlo Based Surrogate Model with Random Forest Algorithm. J. Hydrol. 2024, 641, 131775. [Google Scholar] [CrossRef]
- Hilton, A.; Jasechko, S. Widespread Aquifer Depressurization after a Century of Intensive Groundwater Use in USA. Sci. Adv. 2023, 9, eadh2992. [Google Scholar] [CrossRef]
- Ma, Y.; Huang, F. Coseismic Water Level Changes Induced by Two Distant Earthquakes in Multiple Wells of the Chinese Mainland. Tectonophysics 2017, 694, 57–68. [Google Scholar] [CrossRef]
- Yan, R.; Woith, H.; Wang, R. Groundwater Level Changes Induced by the 2011 Tohoku Earthquake in China Mainland. Geophys. J. Int. 2014, 199, 533–548. [Google Scholar] [CrossRef]
- Shi, Z.; Wang, G.; Manga, M.; Wang, C.-Y. Continental-Scale Water-Level Response to a Large Earthquake. Geofluids 2015, 15, 310–320. [Google Scholar] [CrossRef]
- Montgomery, D.R.; Manga, M. Streamflow and Water Well Responses to Earthquakes. Science 2003, 300, 2047–2049. [Google Scholar] [CrossRef]
- Liao, X.; Wang, G.; Shi, Z. Sustained Changes in Well Water Levels Following a Large Earthquake: Possible Evidence of Permeability Decreases in a Shallow Groundwater System. Geophys. Res. Lett. 2021, 48, e2020GL090232. [Google Scholar] [CrossRef]
- Lan, S.; Gu, H.; Liu, Y. Changes in Groundwater Level and Tidal Response Caused by the Wenchuan Earthquake, China. Hydrogeol. J. 2021, 29, 1329–1341. [Google Scholar] [CrossRef]
- Shi, Z.; Wang, C.-Y.; Yan, R. Frequency-Dependent Groundwater Response to Earthquakes in Carbonate Aquifer. J. Hydrol. 2021, 603, 127153. [Google Scholar] [CrossRef]
- Wang, M.; Gu, H.; Liu, Q.; Wei, H.; Xu, Y.; Lan, S.; Jing, H.; Sauter, M. Effects of Wellbore and Skin Zone on Co-Seismic Water Level Responses: A Numerical Study. J. Hydrol. 2024, 646, 132350. [Google Scholar] [CrossRef]
- Shalev, E.; Malik, U.; Lutzky, H. Monitoring and Analysis of Level and Flow Data in Meizar Wells; Rep. GSI-07-2015; Israel Geological Survey: Jerusalem, Israel, 2015; 17p. (In Hebrew) [Google Scholar]
- Siebert, C.; Möller, P.; Magri, F.; Shalev, E.; Rosenthal, E.; Al-Raggad, M.; Rödiger, T. Applying Rare Earth Elements, Uranium, and 87Sr/86Sr to Disentangle Structurally Forced Confluence of Regional Groundwater Resources: The Case of the Lower Yarmouk Gorge. Geofluids 2019, 2019, 6727681. [Google Scholar] [CrossRef]
- Kurzon, I.; Nof, R.N.; Laporte, M.; Lutzky, H.; Polozov, A.; Zakosky, D.; Shulman, H.; Goldenberg, A.; Tatham, B.; Hamiel, Y. The “TRUAA” Seismic Network: Upgrading the Israel Seismic Network—Toward National Earthquake Early Warning System. Seismol. Res. Lett. 2020, 91, 3236–3255. [Google Scholar] [CrossRef]
- U.S. Geological Survey USGS Earthquake Catalog. Available online: https://earthquake.usgs.gov/earthquakes/search/ (accessed on 1 March 2023).
- Geological Survey of Israel Earthquake Catalog. Available online: https://seis.gsi.gov.il/ (accessed on 1 March 2023).
- Shearer, P.M. Introduction to Seismology, 2nd ed.; Cambridge University Press: Cambridge, UK, 2009. [Google Scholar]
- Bormann, P. (Ed.) New Manual of Seismological Observatory Practice (NMSOP-2); IASPEI, GFZ German Research Centre for Geosciences: Potsdam, Germany, 2012. [Google Scholar]
- Lay, T.; Wallace, T. Modern Global Seimology; Academic Press, Inc.: Cambridge, MA, USA, 1995; Volume 58, 521p. [Google Scholar]
- Skempton, A.W. The Pore-Pressure Coefficients A and B. Géotechnique 1954, 4, 143–147. [Google Scholar] [CrossRef]
- Shalev, E.; Kurzon, I.; Doan, M.L.; Lyakhovsky, V. Water-Level Oscillations Caused by Volumetric and Deviatoric Dynamic Strains. Geophys. J. Int. 2016, 204, 841–851. [Google Scholar] [CrossRef]
- Freeze, R.A.; Cherry, J.A. Groundwater; Prentice-Hall, Inc.: Englewood Cliffs, NJ, USA, 1979; ISBN 0-13-365312-9. [Google Scholar]
- Barbour, A.J.; Beeler, N.M. Teleseismic Waves Reveal Anisotropic Poroelastic Response of Wastewater Disposal Reservoir. Earth Planet. Phys. 2021, 5, 547–558. [Google Scholar] [CrossRef]
- Roded, R.; Shalev, E.; Katoshevski, D. Basal Heat-Flow and Hydrothermal Regime at the Golan–Ajloun Hydrological Basins. J. Hydrol. 2013, 476, 200–211. [Google Scholar] [CrossRef]
- Sneh, A.; Bartov, Y.; Rosensaft, M.; Weissbrod, T. Geological Map of Israel, 1:200,000; GSI Rep. GSI/8/2001; Geological Survey of Israel: Jerusalem, Israel, 1998. [Google Scholar]
- Fleischer, L. Stratigraphic Table of Israel Outcrops and Subsurface, Compilation. Plate VIII. Geol. Framew. Levant. Levantine Basin Isr. 2002, 2, 553–577. [Google Scholar]
- Kawecki, M.W. Correction for Temperature Effect in the Recovery of a Pumped Well. Groundwater 1995, 33, 917–926. [Google Scholar] [CrossRef]
Disclaimer/Publisher’s Note: The statements, opinions and data contained in all publications are solely those of the individual author(s) and contributor(s) and not of MDPI and/or the editor(s). MDPI and/or the editor(s) disclaim responsibility for any injury to people or property resulting from any ideas, methods, instructions or products referred to in the content. |
© 2025 by the authors. Licensee MDPI, Basel, Switzerland. This article is an open access article distributed under the terms and conditions of the Creative Commons Attribution (CC BY) license (https://creativecommons.org/licenses/by/4.0/).