Article

Microbiome and Chemistry Insights into Two Oligotrophic Karst Water Springs in Slovenia from 2016 and 2023 Perspectives

1
Faculty of Civil and Geodetic Engineering, University of Ljubljana, Jamova Cesta 2, SI-1000 Ljubljana, Slovenia
2
D13 Department of Catalysis and Chemical Reaction Engineering, National Institute of Chemistry, Hajdrihova Ulica 19, SI-1000 Ljubljana, Slovenia
3
Biotechnical Faculty, University of Ljubljana, Jamnikarjeva Ulica 101, SI-1000 Ljubljana, Slovenia
4
Institute of Hydrology, Slovak Academy of Sciences, Dúbravská cesta 9, 841 04 Bratislava, Slovakia
5
Faculty of Electrical Engineering, University of Ljubljana, Tržaška Cesta 25, SI-1000 Ljubljana, Slovenia
*
Author to whom correspondence should be addressed.
Water 2025, 17(16), 2402; https://doi.org/10.3390/w17162402
Submission received: 5 July 2025 / Revised: 8 August 2025 / Accepted: 12 August 2025 / Published: 14 August 2025
(This article belongs to the Section Water Quality and Contamination)

Abstract

Groundwater, a critical source of drinking water, plays an essential role in global biogeochemical cycles, yet its microbial ecosystems remain insufficiently characterized, particularly in pristine karst aquifers. This study conducted high-resolution profiling of microbial communities and environmental parameters in two representative alpine karst aquifers in Slovenia: Idrijska Bela and Krajcarca. Monthly groundwater samples from the Krajcarca spring and Idrijska Bela borehole over a 14-month period were analyzed using whole-metagenome sequencing (WMS), UV-Vis spectroscopy, inductively coupled plasma mass spectrometry (ICP-MS), and isotopic analysis. The results revealed stable hydrochemical conditions with clear spatial differences driven by bedrock composition and groundwater residence time. Bacterial communities displayed strong correlations with hydrochemical parameters, while archaeal communities exhibited temporal stability. Functional gene profiles mirrored bacterial patterns, emphasizing the influence of environmental gradients on metabolic potential. No significant temporal changes were detected across two sampling campaigns (2016–2023), highlighting the resilience of these aquifers. This work establishes a valuable baseline for understanding pristine groundwater microbiomes and informs future monitoring and water quality management strategies.

1. Introduction

The vast majority of the world’s liquid freshwater reserves are below the earth’s surface [1], making the groundwater an important source of drinking water worldwide and a significant contributor to the global cycle of water, metals, and organic substances. Despite its importance, the governing principles are poorly understood from a microbiological, chemical, and temporal perspective. Since groundwater has been recognized as an ecosystem with a natural microbial community [2,3], there has been increased interest in understanding the functioning of the ecosystem, such as the role of microorganisms in biogeochemical processes like nutrient cycling [4,5,6,7]. In addition, much emphasis has been put so far on studying the composition of natural microbial communities [8,9,10,11] with respect to water resource protection [12,13].
Pristine karst aquifers are geochemically stable, oligotrophic environments that pose particular challenges for microbial communities due to low nutrient availability, lack of light, and low (~8 °C) but constant temperatures that reflect the mean annual surface temperature with minimal fluctuation (1–2 °C/year) [3]; they contain apparently adapted and diverse microbial communities [14]. Various environmental factors in general contribute to microbial diversity, such as the physico-chemical and hydrological properties of the water [15,16]. Hydrological factors, such as the rate of water flow and recharge, and meteorological variables like seasonal changes influence nutrient flux and habitat stability [8,10], whereas geological composition influences the available electron donors and acceptors, which affect metabolic pathways [17] and hence contribute to microbial diversity.
Karst aquifers are characterized by their high permeability and rapid water flow, which significantly influences their susceptibility to contamination from the surface either through percolation or direct inflow. Unlike other aquifer systems, the rapid infiltration and transport of water through the fractures, conduits, and sinkholes of karst systems result in limited natural filtration, allowing contaminants to enter the aquifer quickly and directly [18]. The study of pristine karst water sources provides an important basis for understanding native microbial communities and provides a comparison for assessing the impact of contamination events. The potential to control water quality has been explored through various strategies, such as the use of microbial indicators and sequencing methods [19,20,21,22]. However, a deeper understanding of the natural microbial community in pristine aquifers using modern methods such as high-throughput sequencing is essential to distinguish natural fluctuations from contamination signals and to develop effective water quality management strategies.
Most groundwater studies rely on 16S rRNA sequencing and other traditional methods [23], which have some disadvantages compared to whole-metagenome sequencing (WMS). While 16S rRNA sequencing is well suited for profiling bacteria and archaea, it often lacks the resolution to identify microbes at the species level and does not provide insight into functional genes or community metabolic potential of other microbial constituents, such as fungi and protozoa, which is critical for understanding ecological dynamics in groundwater systems. However, the shift towards next-generation microbiome analyses has led to an increased use of WMS, which offers a more comprehensive approach by sequencing all genetic material in a sample, capturing the full spectrum of the microbial community, including bacteria, archaea, viruses, and eukaryotes [24,25].
Despite the recognized importance of microbial communities in groundwater ecosystems, studies employing WMS in pristine groundwater, particularly in karst aquifers, are relatively scarce [13,26]. Challenges such as low microbial biomass, difficulties in obtaining sufficient high-quality DNA, and the complexity of groundwater environments have limited the application of WMS in these settings. Applying WMS to karst groundwater can provide deeper insights into the metabolic potential and ecological roles of native microbial communities.
Karst landscapes make up a large part of Slovenia, but microbial studies have mostly focused on cave environments [27,28] with only one study investigating the microbiology of karst aquifers using terminal restriction fragment length polymorphism (t-RFLP) [29]. However, in this study we provide a much deeper resolution of microbial profiling by analyzing monthly, size-fractionated (>5 µm, >0.45 µm, >0.1 µm) large volume (100 l) samples from two pristine alpine karst aquifers representative of Slovenia’s alpine karst hydrology (Schemes S1–S4) over a 14-month period using whole-metagenome sequencing (WMS). In parallel, we monitored a number of physico-chemical parameters and investigated the concordance of UV-VIS spectra, derived spectral indices, and metal patterns between two sampling campaigns (2016–2017 and 2022–2023), allowing us to investigate temporal continuity. Our main objective was to assess whether and to what extent the measured environmental characteristics are related to microbiome abundance, its taxonomy (at the level of Bacteria, Archaea, Fungi, Protozoa), and functional makeup in the two pristine alpine karst aquifers and to establish the first high-resolution baseline of these ecosystems with WMS and detailed chemical analyses. Their geological substrates, hydrological resilience, and water quality underscore their ecological and societal importance. As pressures from tourism and climate variability grow, sustained monitoring and protection of these systems become increasingly vital. This knowledge is crucial for understanding the function of natural ecosystems and for the sustainable management of vulnerable drinking water resources.

2. Materials and Methods

2.1. Description of the Study Sites

In this study, two pristine karst water sources, the Krajcarca spring and Idrijska Bela borehole (Schemes S1–S4), located in the north-west part of the Republic of Slovenia, were sampled over a 14-month period as locations representative of Slovenia’s alpine karst hydrology due to their high water quality and minimum human and environmental impacts.
The water from a 120-meter-deep borehole in Idrijska Bela (IB) in the Belca Valley, Slovenia (45°57′46.07″ N, 13°57′11.88″ E) is located at 469 m a.s.l. and is already used for human consumption in the Idrija region, Slovenia. The borehole is located near the confluence of the Belca tributary and the Idrijca River, although the latter has been studied in more detail [30,31,32,33]. The Belca stream next to the IB borehole, with a catchment area estimated to be approximately 18 km2, has carved its valley into Upper Triassic bedded dolomite with transitions to limestone [34]. The Idrija region and the surrounding Idrija-Cerkno Hills in western Slovenia are characterized by a geologically very complex structure. Nevertheless, this area is one of the most thoroughly studied geological regions in Slovenia [35,36,37]; however, the resilience of these aquifers has not been studied yet over a longer period. The Idrijska region is part of the External Dinarides and is characterized by a complex nappe structure formed during the Alpine orogeny. Stratigraphic sequences include Permian to Eocene sedimentary rocks, particularly dolomites and limestones. According to Mlakar (1969) [37], tectonic evolution in the Idrijsko-Žirovsko area resulted in overthrusting of multiple tectonic units, creating a multilayered geological fabric. These formations significantly influence groundwater pathways and surface morphology. Several large plains formed along the thrusts within the dolomite and at the contact of dolomite and limestone, such as the Zadlog karst field [38]. The region is also characterized by a complicated tectonic structure with typical folded structures and faults in different directions. One of the most prominent is the Idrija Fault, a large tectonic line that cuts the entire region [39,40].
The Krajcarca spring (K), located in the Zadnjica Valley within Triglav National Park in the Julian Alps (46°23′01.08″ N, 13°46′21.81″ E; 703 m a.s.l.), Slovenia, is among the most abundant tributaries of the Soča River and serves as a source of drinking water for the Trenta Valley. In the Krajcarca basin, Upper Triassic dolomites form the primary aquifer system. Springs emerge at lithological contacts, particularly where dolomitic beds meet glacial moraine deposits. The hydraulic gradient and permeability differences define spring locations [41]. The main rock in Trenta is Dachstein limestone. It is characteristic that the limestone transitions vertically and laterally into dolomite [42,43]. Krajcarca emerges from an elevation of approximately 700 to 720 m, issuing from numerous springs on both sides of the valley and directly from the streambed. These springs are fed by water seeping through moraines, which thin at certain points, allowing the water to discharge over a threshold of Upper Triassic dolomite. Hydrogeological evidence suggests that these present-day springs are likely secondary outlets, while the primary sources may be located higher up, at the contact zone between Dachstein limestone and dolomite. The catchment area of Krajcarca, bounded by the orographic watershed, spans approximately 20 km2 [41]. For researchers of alpine karst, the 1.5-kilometer-long Krajcarca stream is of particular interest because the hydrological data, collected over many years (1955–1973) at the Zadnjica measuring station in Trenta (ARSO), reflect not only the stream’s surface discharge but also the flow dynamics of an alpine karst spring. The estimated recharge area of Krajcarca is approximately 20 km2. The spring utilized here therefore captures inflow from multiple sub-catchments, including Beli potok and sections of Zadnjica Valley, contributing to its robust flow regime [41].
Both locations (Scheme S2) display pronounced seasonal variability in water flow that is influenced by snowmelt and orographic precipitation due to the nearby high-altitude mountains and close proximity of the Adriatic Sea (Krajcarca ~70 km; Idrijska Bela ~40 km) (Schemes S2–S4). Peak discharges occur in late spring, while base flows dominate winter months. The karst systems exhibit a rapid response to rainfall events, particularly in Krajcarca, due to their high infiltration capacity and direct recharge from surrounding slopes. The waters of both Idrijska Bela and Krajcarca are cold (average temperatures between 8 and 10 °C), clear, and oligotrophic. Their chemical composition reflects limited residence time and interaction with soluble bedrock, resulting in low mineral content and excellent potability. The Idrijska Bela and Krajcarca springs are representative of Slovenia’s alpine karst hydrology and were taken as proxies for the information related to the nearby Krajcarca spring and Idrijska Bela borehole, as no other data are currently available.

2.2. Sampling

Two separate sampling campaigns were executed in 2016 and 2023. Springs were sampled on a monthly basis to capture a one-year hydrological cycle from May 2016 to June 2017 and another from 2022 to 2023. One sample from IB was collected in March 2015. Two batches of 500 mL were sampled for chemical analyses in a sterile flask to assess the chemistry of the environment and microbiological load estimates through direct epifluorescence counting.
For the extraction of eDNA, altogether 100 L of water was aseptically collected in five 20-litre plastic containers during each sampling campaign and transferred to the laboratory. Before sampling, containers were sterilized with 20% hydrogen peroxide for 15 min and thoroughly rinsed with sterile water. Water samples were stored at room temperature and processed the same day by sequential filtering.

2.3. Analysis of Physicochemical and Microbiological Water Quality Parameters

On-site measurements of water temperature (T), specific electrical conductivity (SEC; (normalized to unit length and unit cross section at a specified temperature)), pH, and dissolved oxygen (DO) were performed using a WTW Multiline 3420 portable meter (WTW, Wuppertal, Germany).
Chemical analyses were performed according to standard methods (Clesceri et al., 1998) [44] and included alkalinity (ability of solution to neutralize acids expressed in milligrams per liter of CaCO3), hardness (sum of calcium and magnesium expressed in mg/L of CaCO3), and concentrations of chloride, nitrate, sulphate and ortho-phosphate; they were expressed in milligrams per liter.
An AquaSnap™ Total test using a corresponding luminometer (Hygiena, Camarillo, CA, USA) was used for estimation of microbial biomass in the field, and total ATP concentration was expressed in RLU—Relative Light Units, where 1 RLU equates to 1 fmol of ATP. Each sample was tested in duplicate.
In a laboratory, one milliliter of the water sample was directly plated onto RIDA®COUNT test plates (R-biopharm, Darmstadt, Germany): RIDA®COUNT Total Aerobic Count for heterotrophic aerobic bacteria and RIDA®COUNT E. coli/Coliform for Escherichia coli and coliforms. Plates were inoculated in duplicate with one milliliter of the sample and incubated for 48 h at 37 °C, and for 7 days when Total Aerobic Count plates were incubated at 20 °C. Grown colonies were expressed in CFU per milliliter.
To determine microbial abundances, 300 mL of the water sample was filtered (0.22 μm pore size). Cells were stained with acridine orange directly on the filter as described before [45,46]. Around 30 images per filter were obtained using epifluorescence microscopy at 1000× magnification and analyzed with ImageJ V1.50 [47,48] to obtain the total cell count.

2.4. UV-VIS Spectroscopy and Organic Matter Indices

The UV-Vis spectra of water samples were measured from 230 to 900 nm at 1 nm intervals using a Lambda 40P spectrophotometer (Perkin Elmer, Waltham, MA, USA) to investigate potential differences in spectral signals between the IB and K locations across different years and seasons. From the spectral profiles, commonly used UV-VIS absorbance indices and their ratios were calculated to aid further interpretation, following the methodology described before [49,50]. The evaluated indices included E2/E3 (A254/A365), E4/E6 (A465/A665), the sum of absorbance from 250 to 450 nm (SumA250–450), absorbance at 300 nm (A300) and 254 nm (A254), as well as spectral slopes S275–295 and S350–400, along with their ratio (SR). In addition, absorbance indices A230 (carbohydrates and aromaticity), A260 (nucleic acids), A280 (proteins), and A320 (colorimetric dissolved organic carbon, cDOC) were analyzed, following recent applications by Kolbl et al. (2022) [50], Zupanc et al. (2023) [51], and Blagojevič et al. (2025) [52]. From these, the absorbance ratios DNA1 (A260/A230), DNA2 (A260/A280), and DNA3 (A260/A320) were calculated to assess the relative signal contribution of nucleic acids compared to the presence of the aforementioned substances. All data were log-transformed prior to statistical analysis, which was performed in PAST software [53]. Kruskal–Wallis, Mann–Whitney, one-way PERMANOVA, and non-metric multidimensional scaling (nmMDS) were applied to evaluate differences between sample groups.

2.5. Inductively Coupled Plasma Mass Spectrometry (ICP-MS) for Quantification of Metals in Water Samples

ICP-MS is one of the most powerful analytical techniques for detecting and quantifying trace and ultra-trace levels of metals and several non-metals in liquid samples, including water. In this study, ICP-MS was used to analyze elements such as Al, As, Cu, Zn, Cd, Cr, Mn, Mo, Ni, Pb, V, and Fe. Water samples were collected from the two spring locations using acid-washed high-density polyethylene (HDPE) bottles (500 mL capacity). All containers were pre-cleaned with 10% (v/v) nitric acid (HNO3, Suprapur®, Merck, Rahway, NJ, USA) and rinsed thoroughly with ultrapure water (resistivity ≥ 18.2 MΩ·cm). Immediately after sampling, nitric acid was added to each bottle to achieve a pH < 2, ensuring sample preservation and preventing adsorption of metal ions onto the container walls. Samples were stored at 4 °C and analyzed within 14 days of collection in accordance with EPA Method 200.8. Ultrapure water was produced using a Milli-Q® purification system (Merck Millipore, Burlington, MA, USA). All acids and reagents used were of trace metal grade or higher. A multi-element calibration standard (TraceCERT®, Sigma-Aldrich, St. Louis, MO, USA) was used to prepare working solutions for external calibration. Internal standards—including indium (In), rhodium (Rh), and rhenium (Re)—were added to all samples and standards at a final concentration of 10 µg/L to correct for instrumental drift and matrix suppression. Prior to analysis, water samples were centrifuged for 15 min at 14,000× g to remove suspended solids. A 50 mL aliquot of each filtered sample was transferred to a polypropylene centrifuge tube. All samples were spiked with internal standards immediately before analysis.
Metal quantification was performed using an inductively coupled plasma mass spectrometer (ICP-MS) (e.g., Agilent 7900 (Santa Clara, CA, USA) or Thermo Fischer Scientific iCAP RQ (Bremen, Germany)). External calibration curves were prepared using five-point serial dilutions ranging from 0.1 to 100 µg/L for each target element. Calibration standards were matrix-matched with 1% HNO3 and contained internal standards. Method accuracy was evaluated by analyzing certified reference material (CRM) NIST 1643f (Trace Elements in Water), with recoveries maintained between 90% and 110%. Blank samples and quality control standards were measured after every 10 samples to monitor carryover, drift, and contamination.
The concentration of the following twelve metals were analyzed in samples spanning the two sampling campaigns over the year in both springs: aluminum (Al), arsenic (As), copper (Cu), zinc (Zn), cadmium (Cd), chromium (Cr), manganese (Mn), molybdenum (Mo), nickel (Ni), lead (Pb), vanadium (V), and iron (Fe). Isotopes with minimal spectral interferences were selected for each element: 27Al, 75As, 63Cu/65Cu, 66Zn, 111Cd, 52Cr, 55Mn, 95Mo, 60Ni, 208Pb, 51V, and 56Fe (Table S2). Limits of detection (LODs) ranged from 0.01 to 0.1 µg/L, depending on the element and matrix complexity.

2.6. Isotopic Analysis

Isotopic composition of the samples was determined by laser spectroscopy (Picarro, Santa Clara, CA, USA). Seven injections per vial were applied, and each sample was measured two or three times. The δ- values with regard to VSMOW2 standard were determined; the accuracy of δ18O and δ2H measurement was better than 0.2 and 1.0‰, respectively.
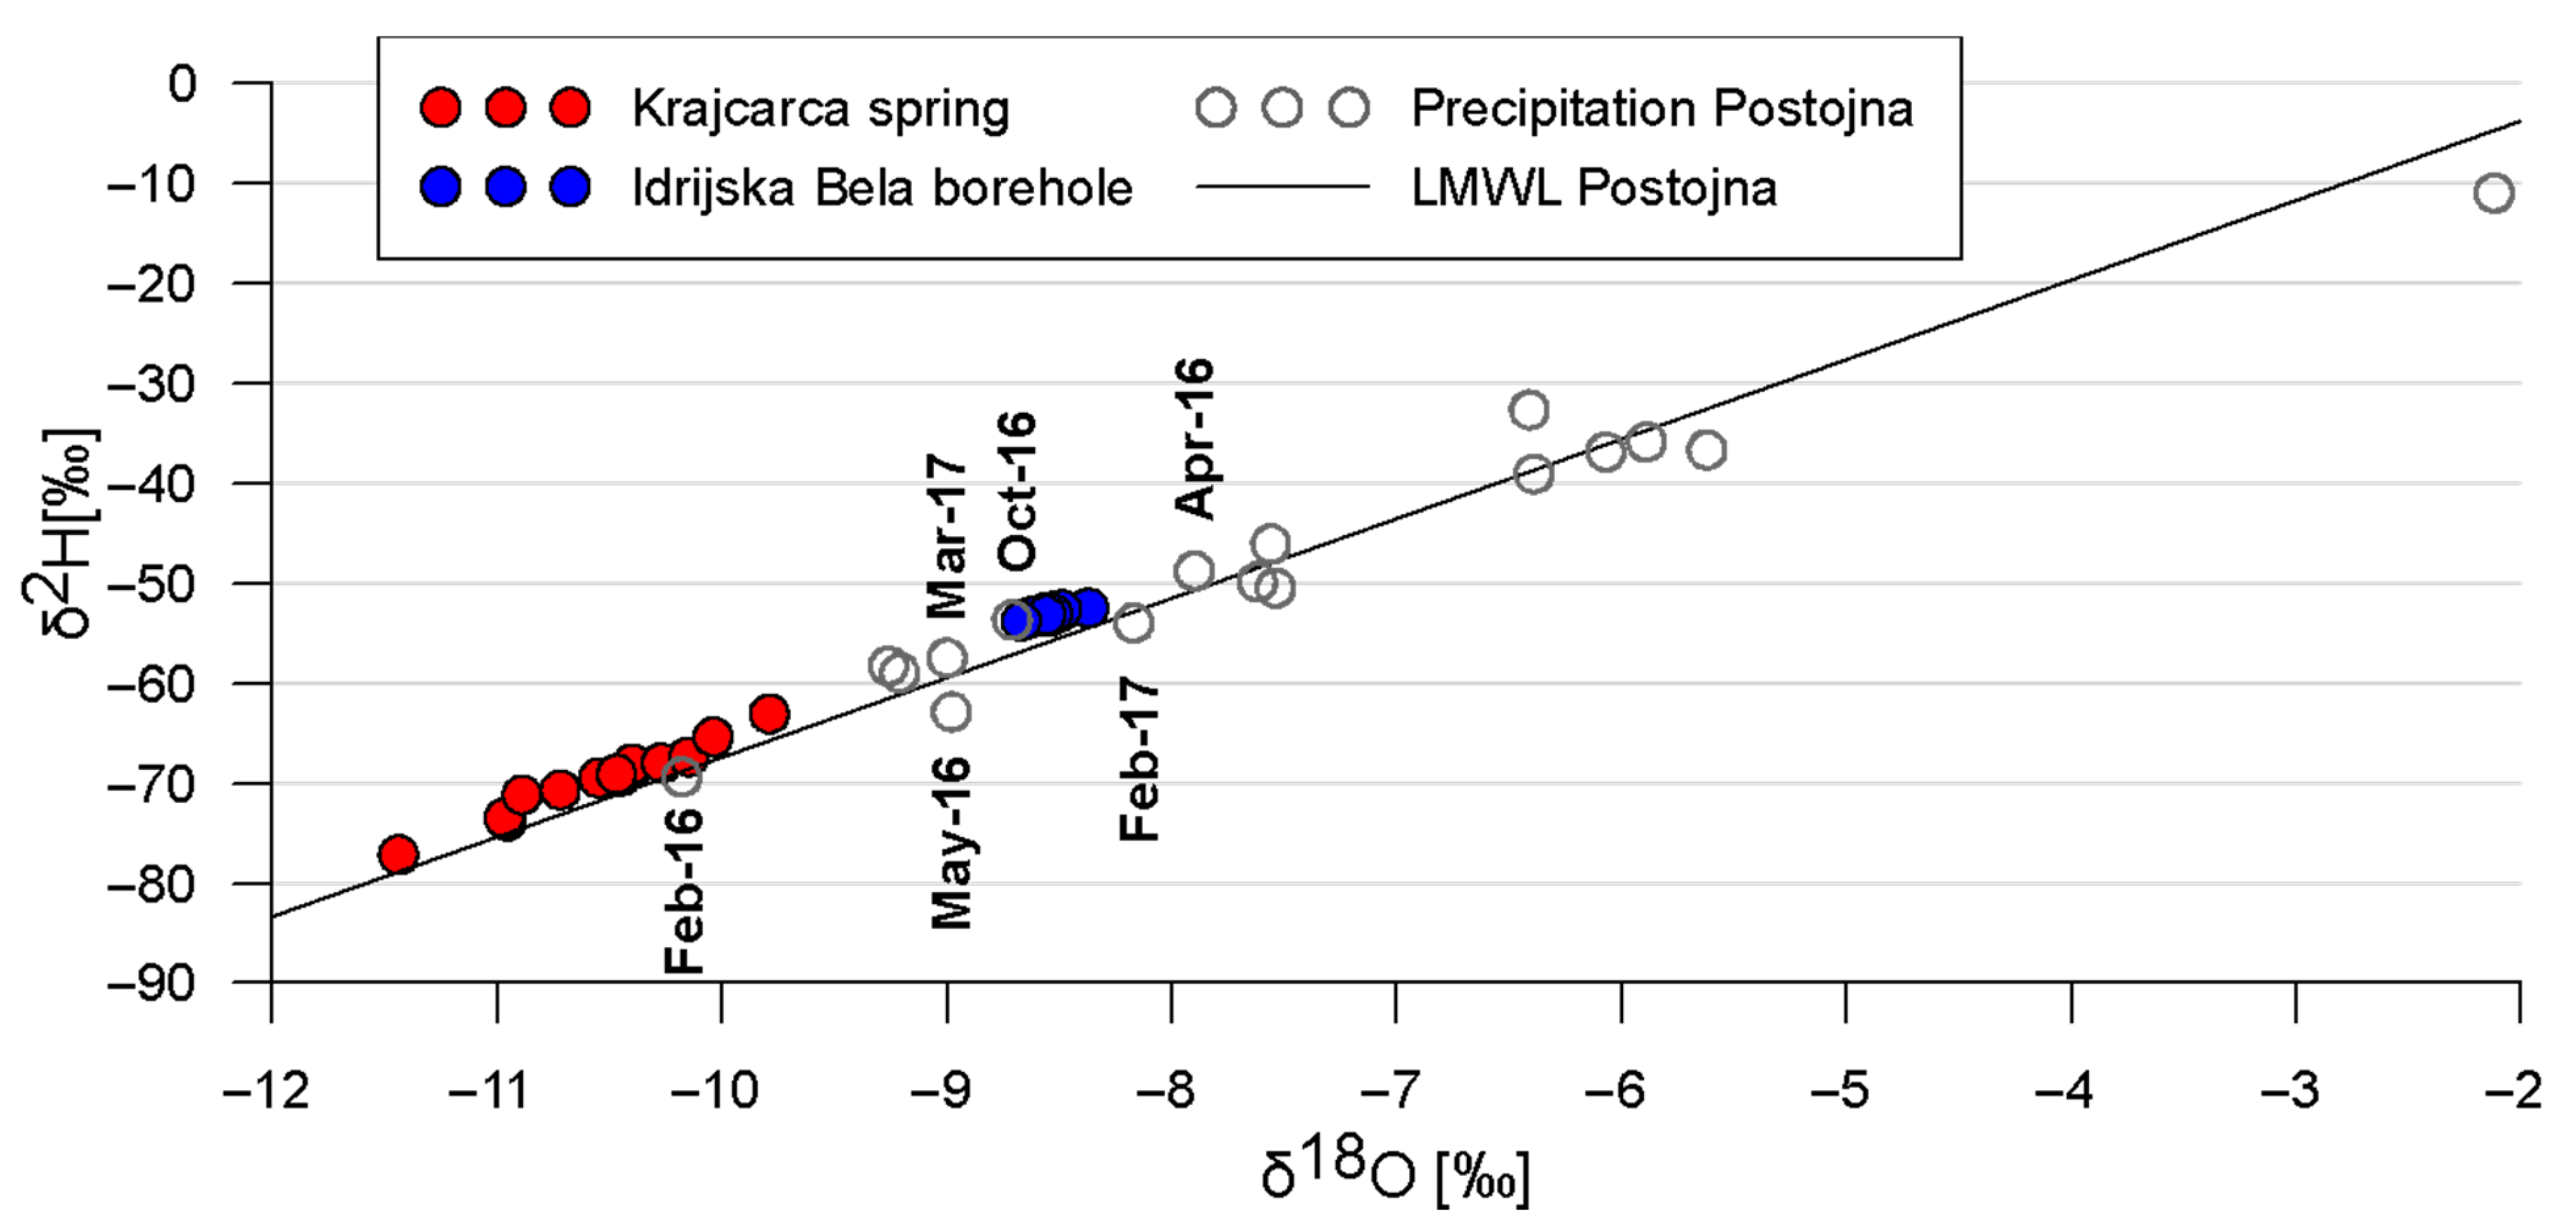
Stable isotopes of oxygen and hydrogen in water were used to compare the groundwater in the spring and borehole with local precipitation measured in Postojna. We have evaluated the variability in isotopic composition of groundwater in both sources, the position of the samples along the local meteoric water line, and the relationship with local precipitation. Isotopic interpretation was supplemented by physical and chemical properties of groundwater (temperature, electrical conductivity, and concentrations of chloride and nitrate). Monthly composite samples of precipitation collected in Postojna from August 2015 and October 2017 were used to construct the local meteoric water line (δ2H = 7.95 ×* δ18O + 12.13) [54].

2.7. Discharge and Precipitation

Supplementary data on precipitation and discharge were obtained from the publicly available database of the Slovenian Environment Agency (ARSO). We selected the weather stations closest to the sampling site for the rainfall data. These are the measurement stations Zadlog (IB) and Trenta (K). The data are expressed in millimeters of rainfall falling in 24 h (up to 7 a.m. on the sampling day) (https://meteo.arso.gov.si/met/sl/archive/ (accessed 4 May 2025)).
As the discharge was not measured at the actual sampling site, we obtained data on the discharge of the closest rivers into which the selected water sources connect. The Belca (IB) flows into the Idrijca (water gauging station Podroteja I), and the Krajcarca (K) flows into the Soča (water gauging station Kršovec I). The values are expressed in cubic meters per second. (https://vode.arso.gov.si/hidarhiv/pov_arhiv_tab.php (accessed 4 May 2025)).

2.8. Filtration of Water Samples for Microbiome Analyses

Filtering was carried out in a molecular biology laboratory on a disinfected surface using sterile materials. Samples were filtered through a set of sterile nitrocellulose membrane filters of decreasing pore diameter sizes: 5 μm, 0.45 μm (11342-142, 11306-142, Sartorius), and 0.1 μm (VVLP14250, Millipore, Merck). The set of filters was enclosed into a filtering system consisting of stainless steel pressure filter holder for 90 mm membranes (Millipore, YY3009000) and 1 gallon dispensing pressure vessel (Millipore XX67 000 51) with nitrogen gas used to filter the water under pressure (1.5 bar for 5 μm filter, 2 bar for 0.45 μm, and 2.5–3 bar for 0.1 μm filter). Negative controls: 100 L of tap water and prefiltered sample water were filtered through the same set of filters for the purpose of negative control. Lower pressure was needed when filtering negative controls. Filters were subsequently placed in sterile 50 mL Falcon tubes (TPP) and stored at −20°C until DNA extraction.

2.9. DNA Extraction

To extract the environmental DNA, extensive preparations were made to minimize the contamination of hyper oligotrophic aqueous samples, such as control filtrations, control DNA extractions, and tests of several extraction kits for their maximum efficiency. We determined that DNA analysis would require filtering of 100 L of water per sample in order to collect sufficient amounts of cells for successful DNA extraction and WMS of the water microbiome.
The DNA was extracted in steps utilizing ¼ of each filter using the PowerWater DNA isolation kit (14900-50-NF, Mo Bio Laboratories, Carlsbad, CA, USA) following the manufacturer’s protocol. The quantitative analysis of DNA was conducted using a NanoVue (Thermo Fisher Scientific, Waltham, MA, USA), and the integrity of DNA samples was checked on 1% agarose gel using the Qubit dsDNA HS Kit (Thermo Fisher Scientific).
The same procedure was executed utilizing autoclaved water samples and blank filters in two separate experiments to derive the estimate of the background signal that could be interpreted as the negative control devoid of any DNA. Samples falling within that range were deemed to contain too low DNA content within the blank baseline serving as the estimate of background of the reagent signal and were not sequenced. Only samples with the DNA concentration above 5 ng/µl were utilized.

2.10. Shotgun Metagenomic Sequencing

A total of 23 samples underwent random shotgun sequencing. Extracted DNA was sheared to ∼200-bp fragments using the M220 Focused-ultrasonicator (Covaris, Woburn, MA, USA). End-repair, barcoding, and adapter ligation were performed using the Ion Plus Fragment Library Kit (Thermo Fisher Scientific) according to the IonXpress Plus gDNA Fragment Library Preparation Protocol. DNA fragments of ∼200 bp were selected and eluted with the E-Gel Agarose Gel Electrophoresis System on 2% Size Select gels (Thermo Fisher Scientific). Libraries were amplified using the Ion Plus Fragment Library Kit (Thermo Fisher Scientific) and visualized using the LabChip GX system (PerkinElmer, Waltham, MA, USA). Template amplification and enrichment were performed on the Ion OneTouch 2 System using the Ion PI Hi-Q OT2 200 Kit (Thermo Fisher Scientific). Libraries were loaded onto the Ion PI Chip v3 and sequenced on the Ion Proton System with the Ion PI Hi-Q Sequencing 200 Kit (Thermo Fisher Scientific). The sequencing run produced a total of 67,046,499 usable reads with a median length of 176 bp.

2.11. Bioinformatic and Statistical Analysis

Statistical analyses were carried out in Past (PAleontological STatistics) [53]. The environmental parameters were first transformed using Box-Cox transformation (except pH, which is already log transformed) and then analyzed for significant differences between the two sampling sites using One-way Permutational Multivariate Analysis of Variance (PERMANOVA) with 9999 permutations and Euclidean similarity index. SIMPER analysis, also using Euclidean index, was conducted to pinpoint the factors contributing to the observed differences between the sites. In addition, the correlation between the parameters was assessed using the Pearson coefficient.
The full environmental dataset was converted into a Euclidean distance matrix, as well as a subset of environmental data corresponding to the same time points as the metagenomic data. To evaluate whether the relationships between variables in the subset were preserved, a Mantel test with 9999 permutations was performed.
Taxonomical and functional annotation of metagenomic data was performed using Metagenomic Rapid Annotations using Subsystems Technology (MG-Rast server) [55]. The data was compared to the REFSeq database for taxonomical annotation and the Subsystems database for functional annotation using a maximum e-value of 1e−5, a minimum identity of 60%, and a minimum alignment length of 15 base pairs.
The metagenomic data was transformed into relative abundances and with Box-Cox transformation. Differences in taxonomic and functional profiles were visualized using non-metric multidimensional scaling (NM-MDS) based on the Bray–Curtis dissimilarity in Past, and environmental variables were plotted as vectors. PERMANOVA with 9999 permutations was used to determine the significance of differences between groups.
Redundancy analysis (RDA) with forward selection and with unrestricted permutations was used to model environmental parameters explaining the variability in metagenomic data (taxonomic and functional profiles). Monte Carlo (MC) permutation test with 10,000 permutations and environmental parameters as predictors was conducted to determine the significance of the hypothesized relationships. The analyses were performed using the multivariate data analysis software CANOCO V4.5 for Windows [56]. To separate the effects of environmental and temporal factors, variation partitioning was applied using partial RDA and adjusted explained variation. This approach decomposed total explained variance into unique environmental, unique temporal, shared, and unexplained components, following the method of Borcard et al. (1992) [57] and Peres-Neto et al. (2006) [58].

3. Results and Discussion

3.1. Physicochemical and Microbiological Water Quality Parameters

The values of the physical and chemical parameters throughout the year indicate a stable temporal environment in both water sources. Stable parameters include T, pH, EC, water hardness, alkalinity, and stable isotopes (Table 1). Despite this within-site temporal stability, significant spatial differences between IB and K are evident (Figure 1). PERMANOVA analysis confirmed a strong separation between the two sites (F = 262.6, p = 0.0001), with SIMPER identifying EC, δ2H, water hardness, and alkalinity as the most important factors for this dissimilarity (97.1% of total variation). These variables are closely related to bedrock mineral composition and groundwater residence time, suggesting that geological and hydrogeochemical factors are the main drivers of physicochemical differentiation between sites, consistent with findings in Slovenian Alpine springs [59].
Importantly, both water sources exhibit very low nutrient levels and indicators of anthropogenic impact, with chloride, sulphate, and phosphate concentrations all remaining low. The elevated nitrate levels in IB—although still modest—suggest a potential minor influence from diffuse agricultural sources or other low-intensity human activity in the recharge area [60]. This interpretation is supported by higher EC and Ca2+/Mg2+ ratios in IB, which often correlate with land use intensity and water–rock interaction time. Microbiologically, both sources met excellent water quality standards. The complete absence of colonies at 37 °C and very low CFU counts at 20 °C (<14 CFU/mL in IB and <67 CFU/mL in K) indicate no fecal contamination and low microbial biomass, consistent with oligotrophic and pristine groundwater conditions. Overall, these results affirm that both aquifers are of high ecological and drinking water quality, with minimal anthropogenic influence, and that the main differences in water chemistry reflect natural geological variation rather than contamination or seasonal disturbance.
A group of many physicochemical variables—temperature (T), specific electrical conductivity (EC), calcium, magnesium, water hardness, alkalinity, nitrate, and stable isotopes (δ18O and δ2H)—were strongly intercorrelated (Pearson’s r > 0.63, p < 0.05), suggesting shared geochemical controls such as carbonate weathering and recharge conditions. Moderate correlations were observed with chloride and deuterium excess (0.40 < r < 0.67, p < 0.05), while negative correlations were found with dissolved oxygen (DO; −0.32 > r > −0.59, p < 0.05) and pH (−0.48 < r < −0.69, p < 0.05).
To ensure that the subset of samples used for metagenomic sequencing accurately reflected the broader environmental context, we compared the full environmental dataset (15 monthly samples per site) with the subset of six time points per site corresponding to the metagenomic data. A Mantel test revealed a strong and statistically significant correlation between the two datasets (R = 0.8461, p = 0.0001), suggesting that the selected subset is representative of the temporal variability and hydrochemical conditions observed throughout the entire monitoring period.

3.2. Carbonate Weathering and Alkalinity Sources

Concentrations of calcium (Ca2+) and magnesium (Mg2+) were analyzed to assess the geochemical processes controlling water composition, particularly the influence of carbonate weathering [61]. IB exhibited Ca:Mg molar ratios ranging from 1.1 to 1.8, with one outlier at 11.1, suggesting a predominantly dolomite-influenced system with limited calcite contribution. The relatively narrow range reflects a homogeneous lithology and stable geochemical conditions. In contrast, K displayed a broader and significantly higher Ca:Mg ratio, ranging from 2.1 to 10.0, with an average ratio of approximately 5.0, indicating strong calcite dominance and less dolomite influence. The wider variability in K may reflect heterogeneous carbonate lithology, variable flow paths, or differences in recharge dynamics and mineral availability.
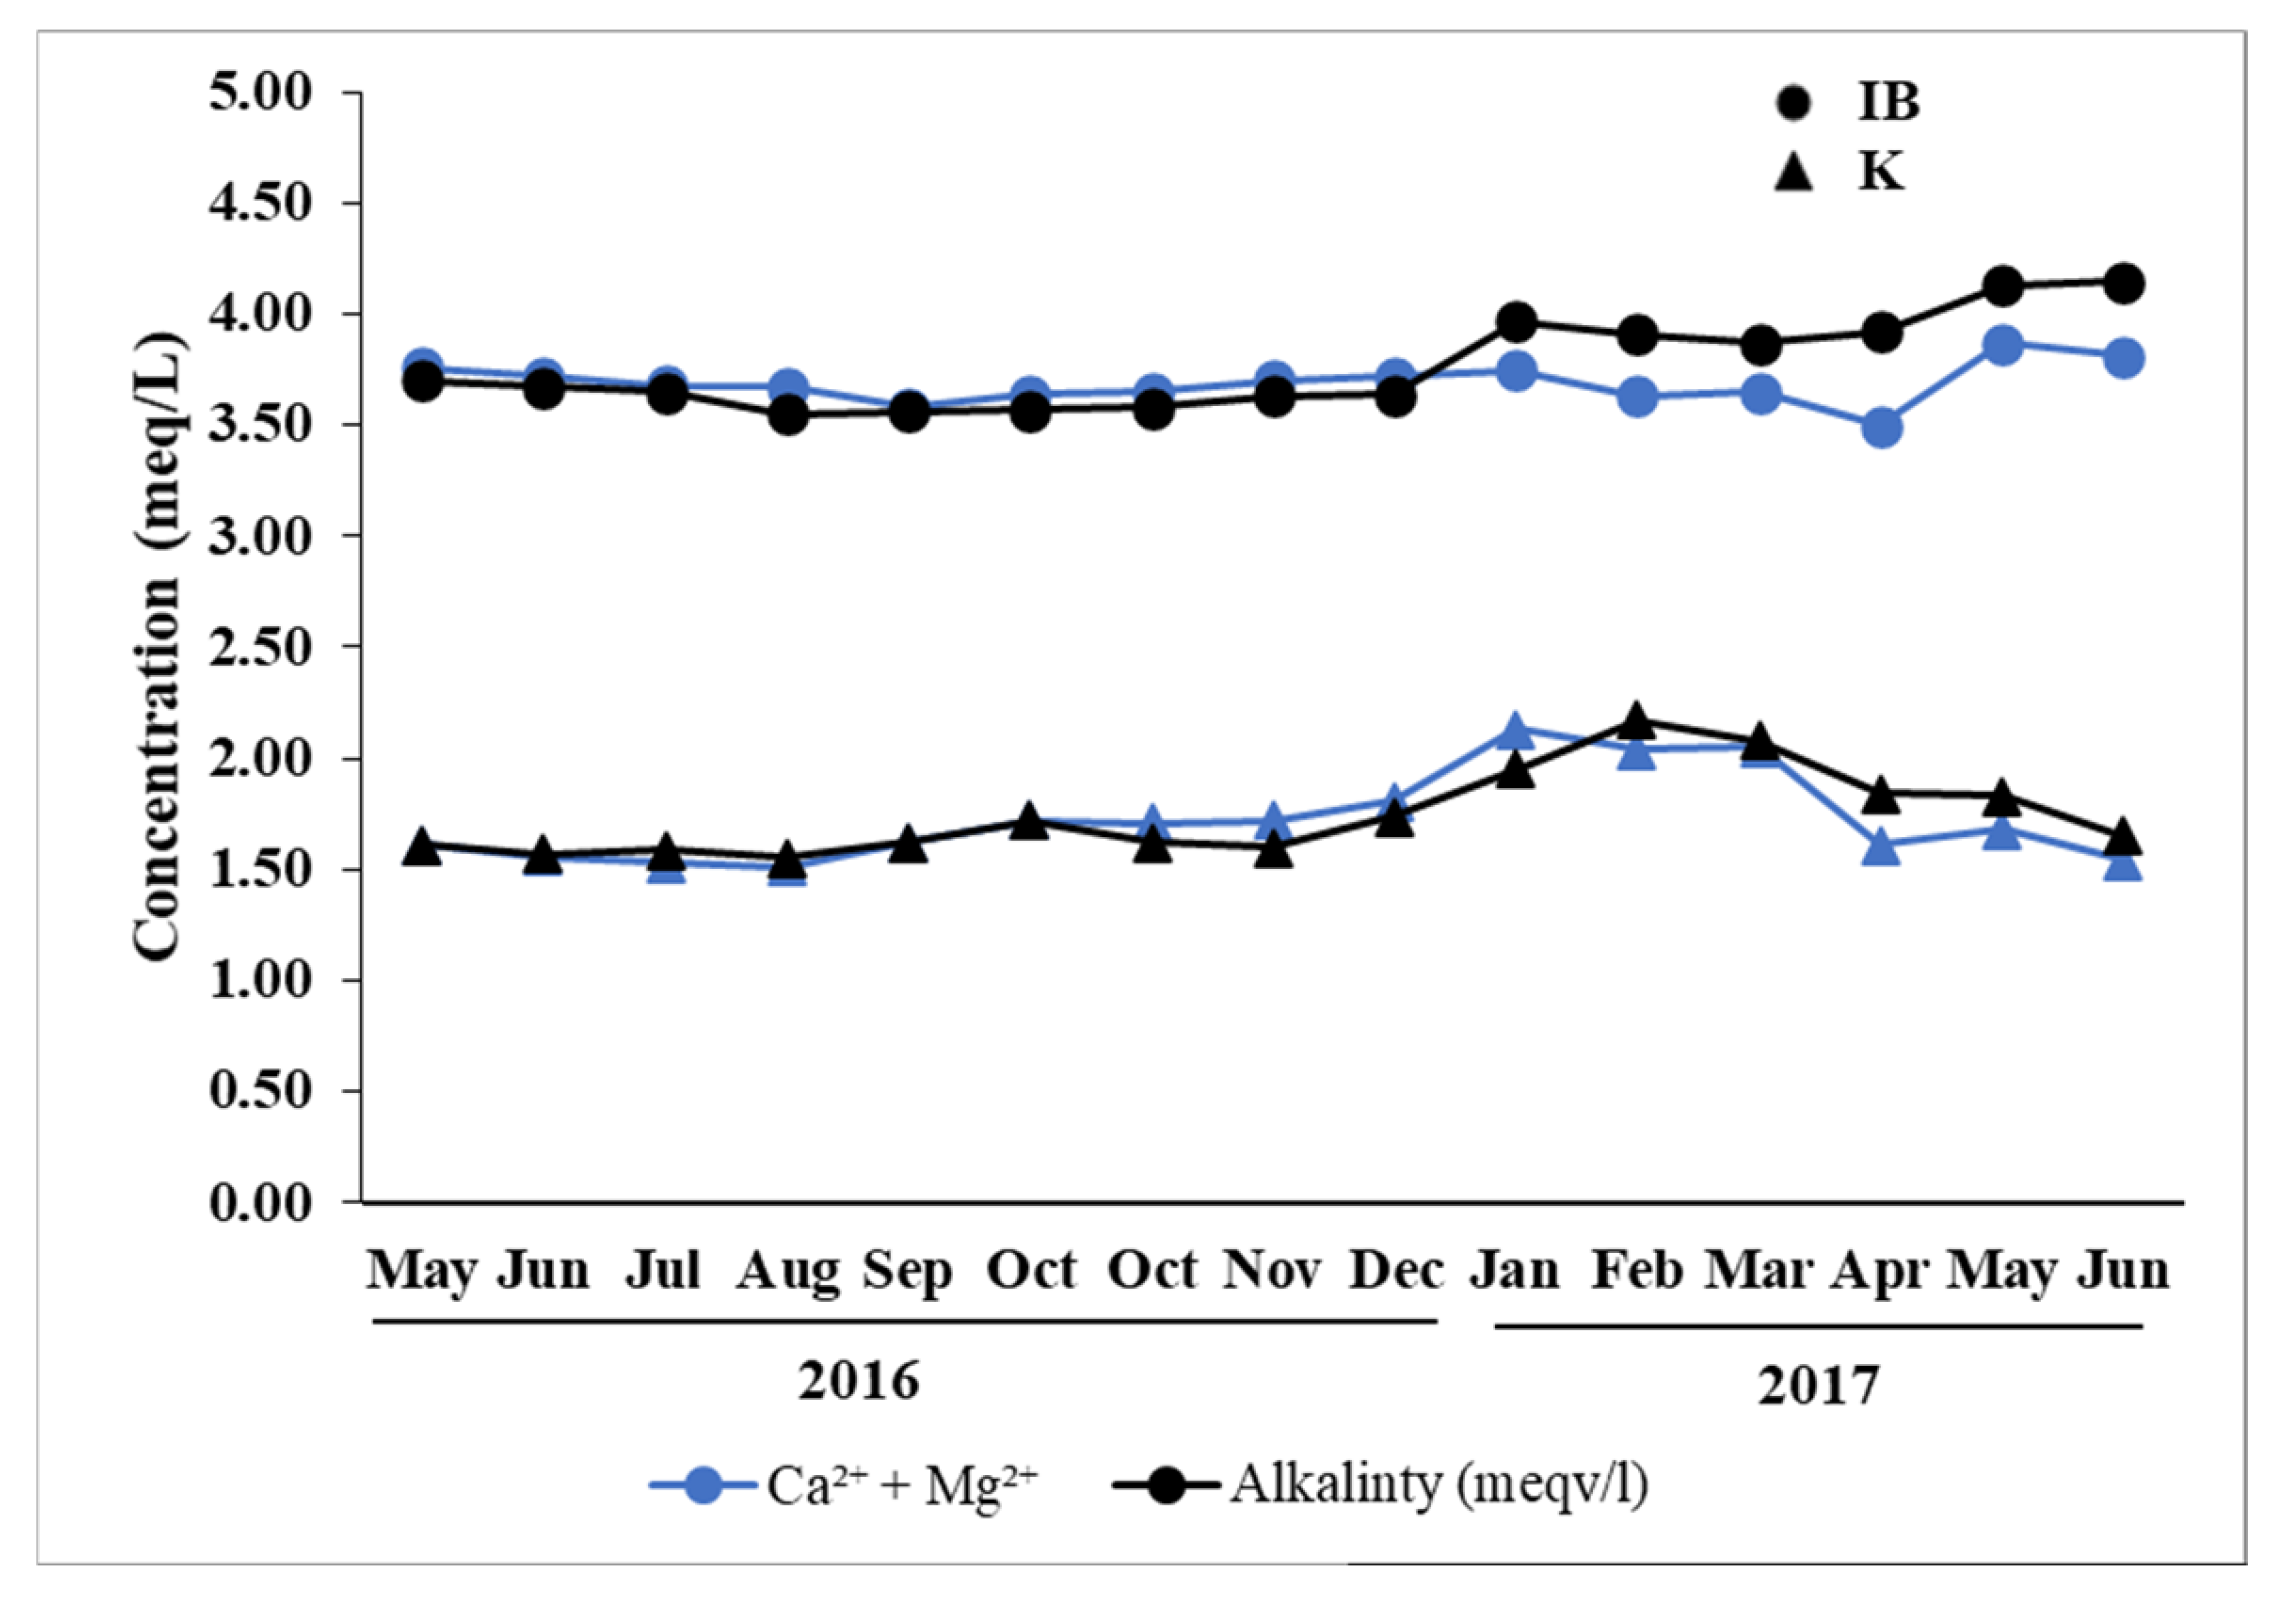
To further evaluate the source of alkalinity, Pearson correlation coefficients were calculated between alkalinity and the sum of Ca2+ and Mg2+ (expressed in milliequivalents per liter). At IB, the overall correlation was moderate (r = 0.44), suggesting that carbonate weathering is not the sole contributor to alkalinity. However, when the data was split seasonally, a strong correlation was observed during the period from May to December 2016 (r = 0.85), indicating that during this time, alkalinity is largely controlled by carbonate weathering. Similar conditions as observed for the IB borehole have been reported in the upper River Idrijca near the confluence with the Belca stream, where dolomite weathering was identified as the dominant geochemical process [30]. In contrast, the weaker correlation observed from January to June 2017 suggests the influence of additional processes such as soil CO2 contributions, organic acid inputs, or hydrologic mixing. At K, a consistently strong correlation (r = 0.72) throughout the monitoring period supports the interpretation that carbonate weathering is the dominant driver of both alkalinity and divalent cation concentrations, consistent with classical karst hydrogeochemistry.
These seasonal and site-specific trends are clearly visualized in Figure 2, which shows the parallel dynamics of alkalinity and Ca2+ + Mg2+ concentrations over time. The strong and persistent alignment at K supports calcite-dominated weathering, whereas the divergence at IB in early 2017 highlights the influence of non-carbonate alkalinity sources.

3.3. Isotopic Composition of Water

Water at IB is isotopically much heavier than at K, while the range for K is very large for both isotopes (compared to IB, where the range is close to analytical accuracy). Groundwater from the IB borehole is isotopically similar to local precipitation in Postojna, mainly falling in the spring months (Figure 3). A smaller range in isotopic composition of the water indicates its deeper circulation. Water in the K spring is isotopically lighter than precipitation in Postojna, which indicates a higher elevation of the recharge area. Greater δ18O and δ2H ranges indicate shallower water circulation compared to groundwater from IB. The information inferred from the isotopic composition of the water is supported by higher water temperature and electrical conductivity in the IB groundwater (Figure 1). Since the mean annual temperature of groundwater tends to be close to the mean annual air temperature in the recharge area, the data indicate that the recharge area of IB is at a lower elevation. Higher electrical conductivity suggests longer contact time of water with bedrock (deeper circulation). High values of deuterium excess (d = δ2H − 8 × δ18O) found in the groundwater are typical of the Mediterranean Sea precipitation, and also for precipitation in the cold period of the year.

3.4. Microbial Biomass and DNA Concentrations

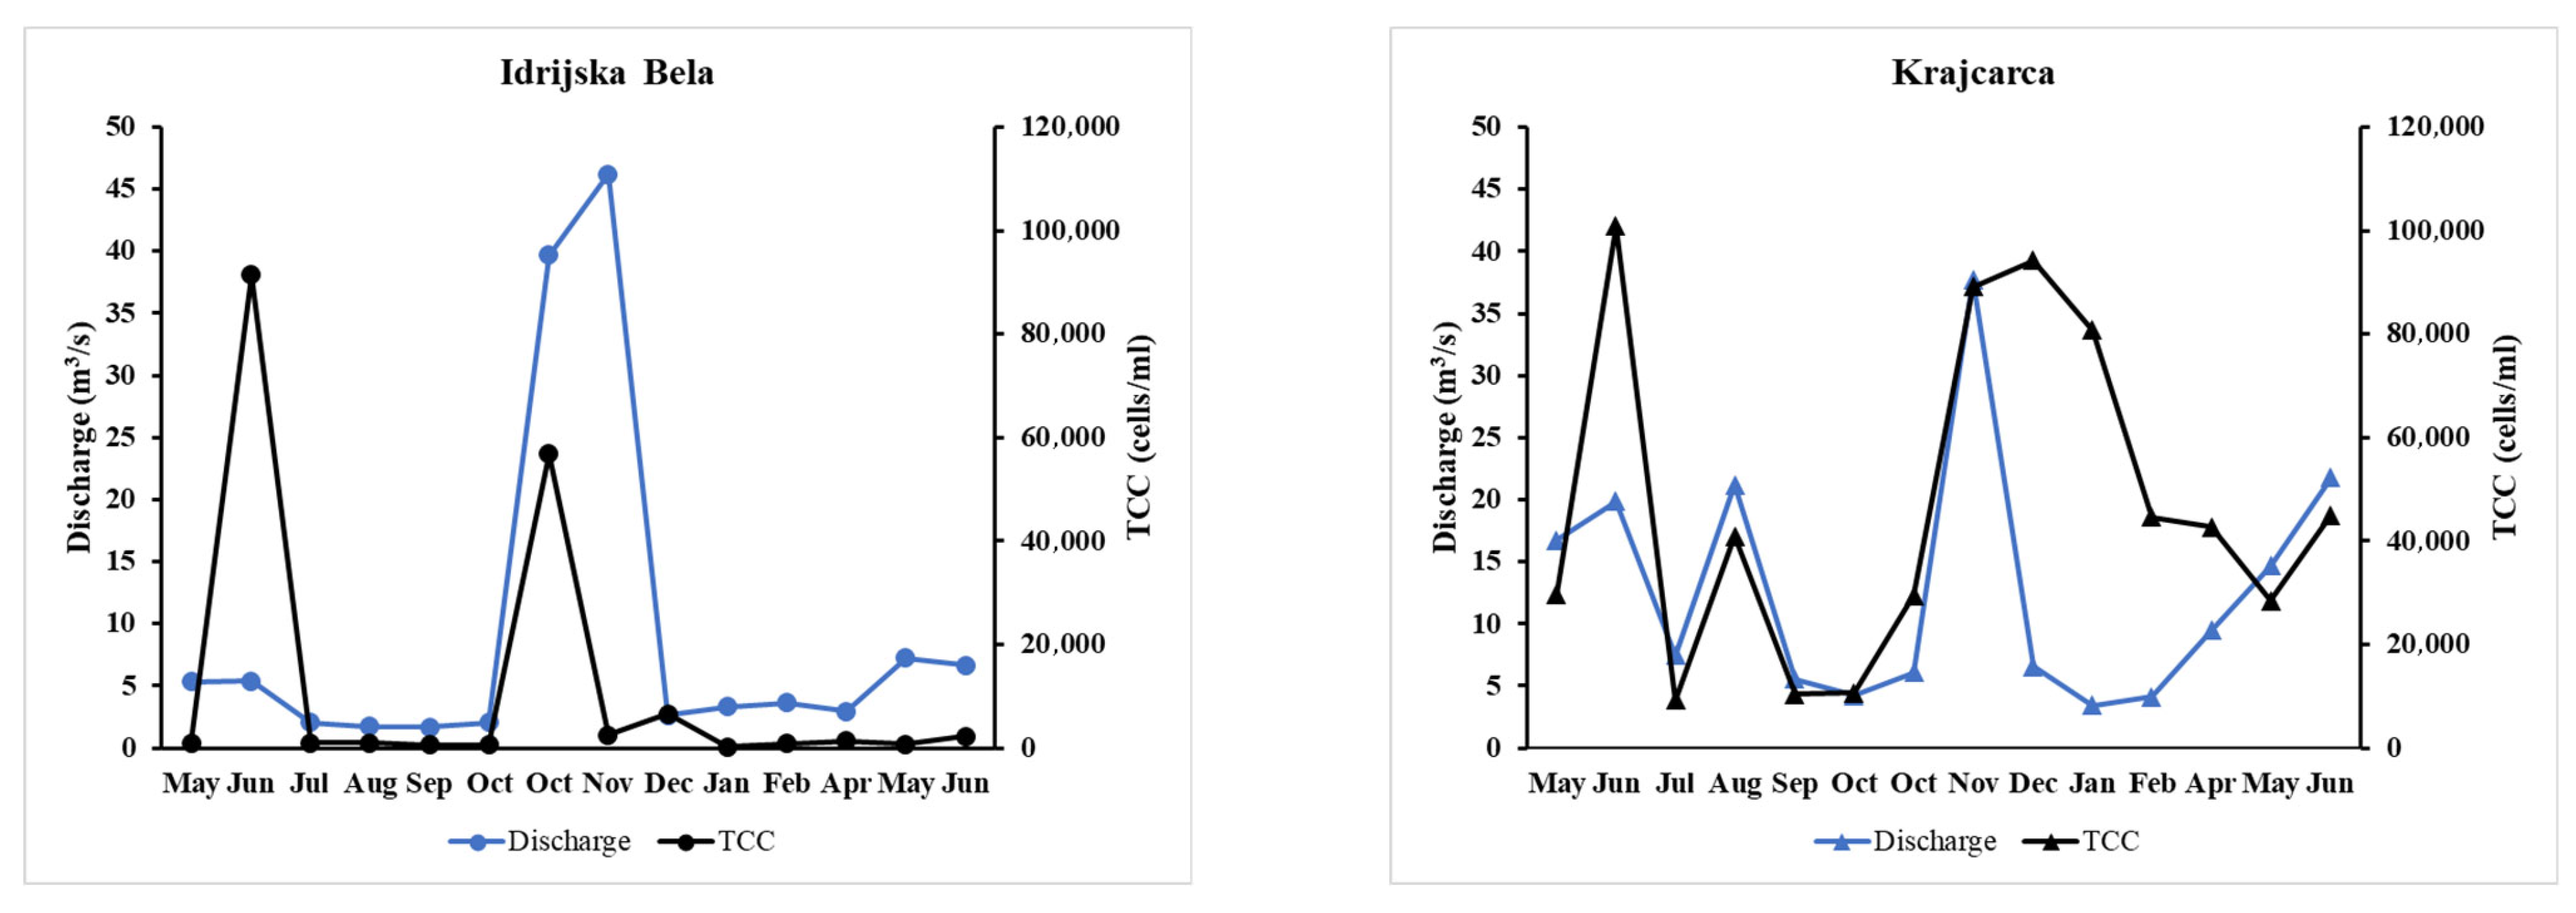
Microbial biomass was estimated by direct epifluorescence microscopic cell counting after filtration through 0.22 µm pore filters. Both sites showed consistently low but fluctuating microbial cell concentrations, with average values of 1.19 × 10⁴ cells/mL in IB and 4.69 × 10⁴ cells/mL in K (Figure 4). The microbial load in IB remained near baseline for most of the year, with the exception of two distinct peaks in June and October, indicating occasional recharge-related inputs. In contrast, K showed more pronounced temporal variability, with a notable peak also occurring in June. Total cell counts (TCC) ranged from 0.21 × 10³ to 91.4 × 10³ cells/mL at IB and from 9.29 × 10³ to 100.8 × 10³ cells/mL at K. These values fall within the range reported for other European karst aquifers [10,23], supporting the notion that microbial biomass in pristine karst systems tends to be low.
In addition to these observations, adenosine triphosphate (ATP) concentrations were measured in the field as an additional indicator of microbial biomass. In IB, ATP levels remained consistently below the detection limit (0 RLU) throughout the monitoring period, consistent with oligotrophic and pristine groundwater conditions. In K, however, ATP was detectable three times and reached 2 RLU in June, which is consistent with the observed peak cell count.
The generally higher microbial biomass in K can be attributed to the hydrogeological characteristics of the sampling sites. IB is a closed borehole that draws water directly from deeper, less disturbed aquifers, while K is a spring system in which water intermittently reaches the surface during emergence and sampling. This partial surface contact can introduce small amounts of microbial biomass or surface-derived organic matter, which contributes to the observed differences in microbial load between sites.
In general, microbial load increases with rising water flow, as enhanced discharge can mobilize microorganisms from aquifer surfaces or biofilms [2,62]. This pattern was also observed in our dataset; however, there were notable exceptions where cell concentrations remained low despite increased discharge, as well as cases of high microbial counts under low discharge conditions (Figure 4). These discrepancies make it clear that microbial mobilization in karst systems depends not only on the amount of discharge but also on the dynamics of microbial accumulation, the connectivity of the aquifer, and the type of recharge source (e.g., soil infiltration or snowmelt). Such factors can influence both the timing and the extent of microbial detachment and transport during high-flow events.
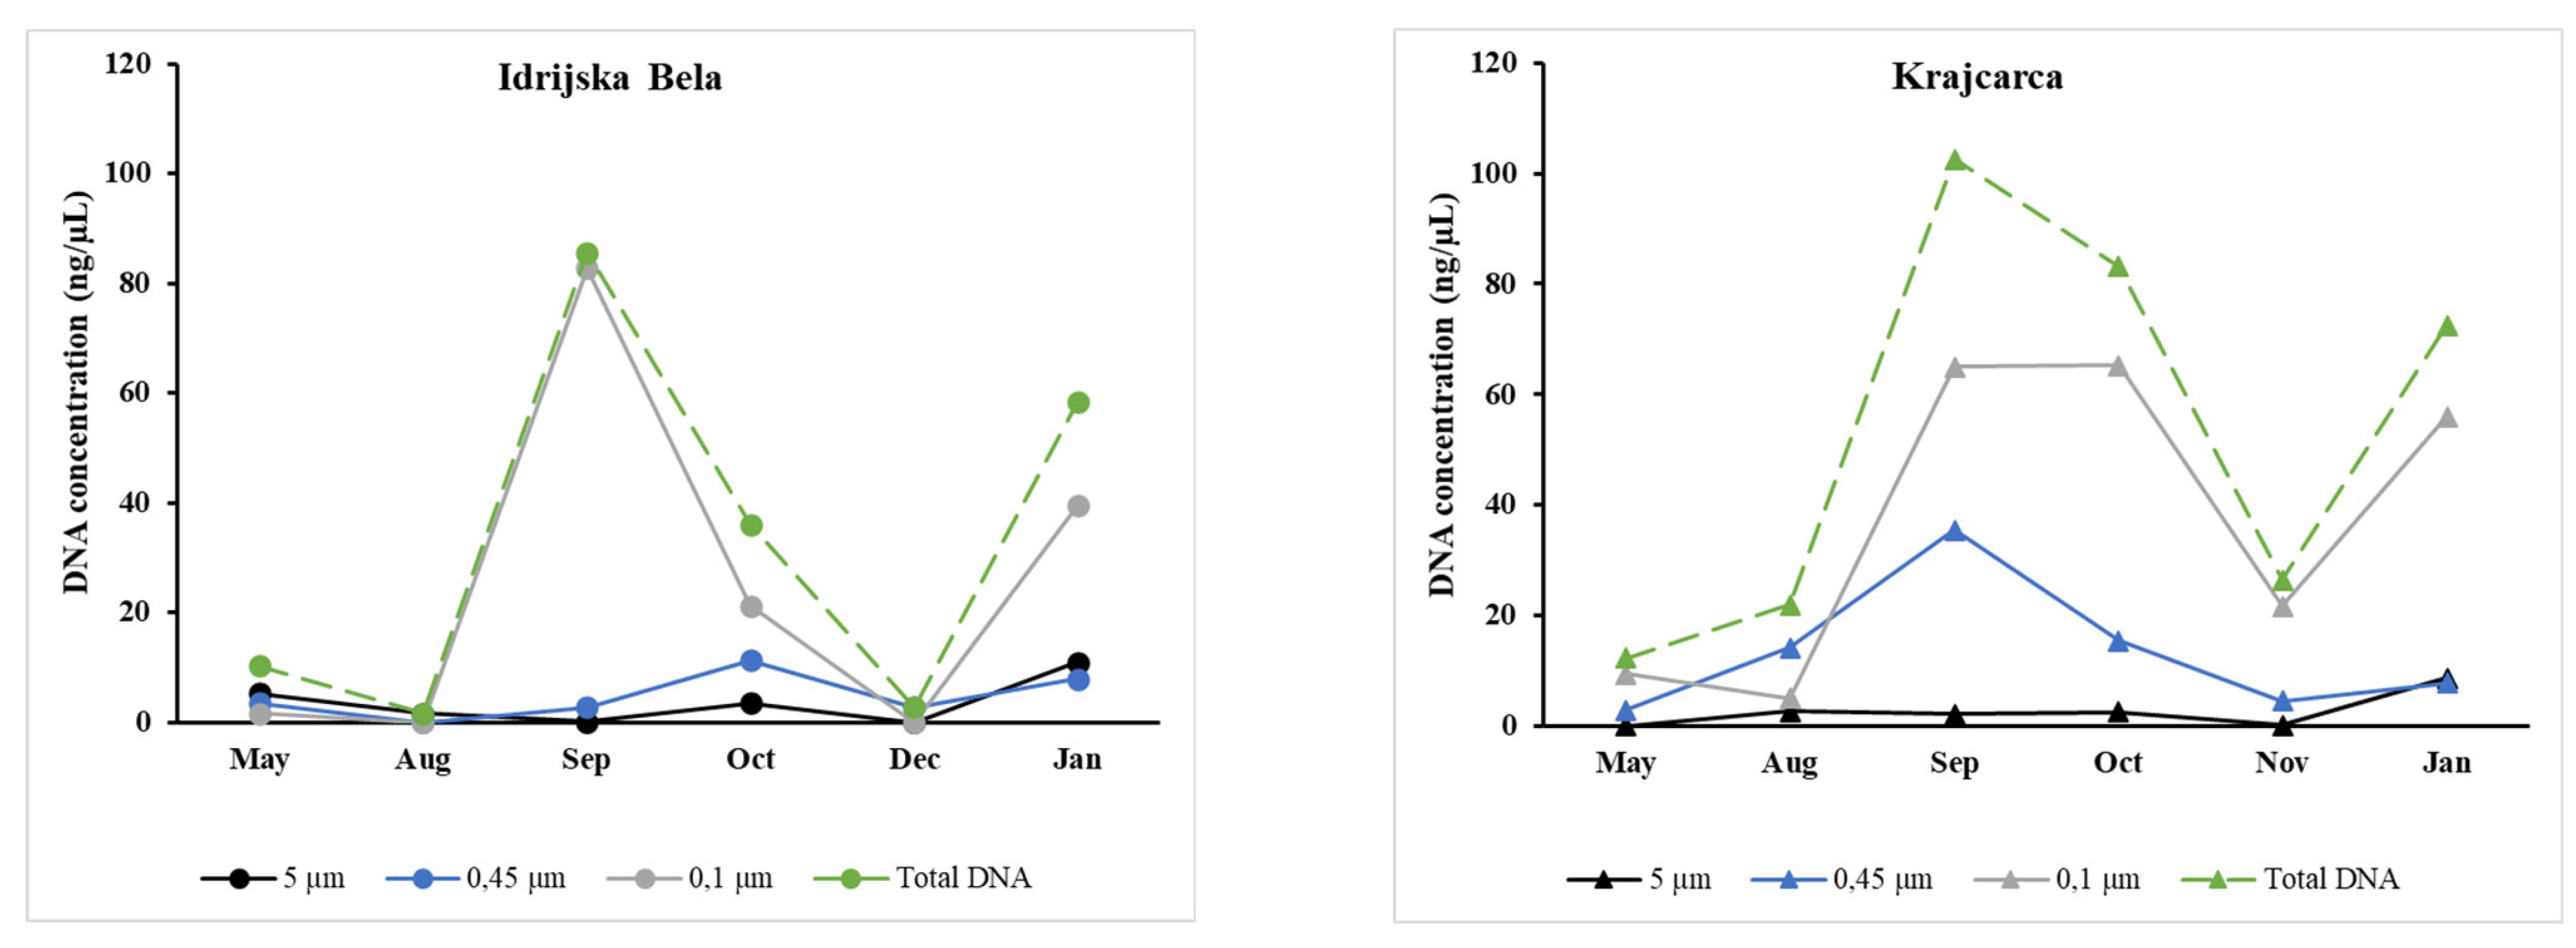
Water spring microbiome characteristics varied across size fractions and sampling periods, reflecting differences in cell size distribution, particle association, and seasonal hydrological conditions. DNA concentrations were highest in the 0.1 µm fraction, accounting for 74.5% of total DNA in IB and 69.7% in K, indicating a dominance of ultramicrobacteria and small free-living cells. The 0.45 µm fraction contributed 14.5% in IB and 25.2% in K, while the 5 µm fraction yielded the smallest share (11.0% in IB; 5.1% in K), likely representing larger, particle-associated or aggregated cells.
These patterns suggest that both aquifers are, in fact, dominated by small-sized microbial populations typical of oligotrophic groundwater systems. The relatively higher DNA yield from larger fractions at K further suggests increased particle association, potentially due to its nature as a spring with intermittent surface contact [41,42,43], in contrast to the confined borehole at IB with more complex and longer hydrological setting [30,31,32,33,35,36,37].
Seasonal dynamics were also evident as the levels of total DNA concentrations (Figure 5) peaked at both sites in late summer (August–September) and early winter (December–January), with Krajcarca exhibiting higher total yields and more pronounced seasonal shifts, in alignment with its more seasonal nature described above. Interestingly, the highest DNA concentrations were observed in September, despite low total cell counts at that time. This discrepancy may be attributed to the accumulation of extracellular DNA following microbial cell lysis, a shift toward DNA-rich taxa, or the release of biofilm-derived material. Such mismatches between DNA yield and cell counts are not uncommon in oligotrophic aquifers and highlight the complexity of microbial dynamics beyond simple cell abundance metrics.

3.5. Differences in Microbiome at Bacterial, Archaeal, and Functional Layers

To assess the significance of differences in microbial taxonomy and functional gene profiles between sampling sites and microbial size fractions, we performed a PERMANOVA test at multiple taxonomic and functional levels. Significant differences between the two sampling sites exist at all levels of community structure (p < 0.05), including archaeal, bacterial, and functional gene profiles. In contrast, microbial size fractionation (filter size) had no significant effect on archaeal community structure (p > 0.05). However, filter size had a significant effect on bacterial communities at the genus (p = 0.035) and species (p = 0.021) level, but not at the family level. This suggests that taxonomic differences at the finer taxonomic levels are more sensitive to physical partitioning and may reflect characteristics such as cell size, surface attachment, or ecological strategy (e.g., planktonic vs. particle-associated). Functional gene profiles also differed significantly by size fraction at all classification levels (p = 0.007–0.009), suggesting that different microbial fractions have different functional capacities, confirming the above-noted differences in taxonomic composition.
Visualization with NMDS provided insight into the structuring of archaeal, bacterial, and functional gene profiles across sampling sites and microbial size fractions at the finest taxonomic or functional level (species or functional gene level). Archaeal profiles (Figure 6A) showed clear site-specific segregation, particularly along NMDS axis 1. Samples from IB showed greater variability than those from K, which were more tightly clustered, suggesting a more uniform archaeal community structure at this site. Environmental vectors such as magnesium, nitrate, electrical conductivity, and DNA concentration were more consistent with the IB samples, indicating a closer relationship between archaeal composition and hydrochemical conditions at this site. Ordination showed acceptable stress (0.12), and both axes explained a high proportion of the variation (axis 1 R2 = 0.68, axis 2 R2 = 0.64).
The bacterial profiles (Figure 6B) showed strong structuring by both location and size fraction. IB samples formed compact clusters, while K samples—especially from the 0.1 µm fraction—were widely distributed along both NMDS axes, indicating greater heterogeneity and responsiveness to environmental gradients. Vectors such as magnesium, water hardness, SEC, nitrate, size fraction, and DNA concentration increased strongly with K samples, emphasizing their influence on bacterial community structure. Ordination showed low stress (s = 0.09) and high explanatory power along axis 1 (R2 = 0.81). These results were consistent with the results of PERMANOVA, which showed that both site location and size fraction significantly influenced the observed bacterial communities, especially at the species level (p < 0.05).
The functional gene profiles (Figure 6C) derived from the subsystem annotations showed an intermediate pattern. As with the bacterial communities, the functional gene profiles from K were more scattered, especially in the 0.1 µm fraction, whereas the IB samples were more tightly grouped. Environmental vectors such as magnesium, nitrate, SEC, and DNA were again closely related to axis 1 (R2 = 0.81), which explained most of the functional gene variation.

3.6. Influence of Environmental Variables on Bacterial and Archaeal, and Functional Gene Profiles

Using RDA, variables were first filtered based on their statistical significance for archaeal, bacterial, and functional gene profiles at three different taxonomic or functional gene levels. Only variables that significantly explained a part of the variability of the metagenomic profiles were included in the final models (ESM6). Results are summarized in Table 2.
RDA revealed that the environmental variables explained a limited proportion of the variation in archaeal community composition at the different taxonomic levels. The adjusted explained variation ranged from 21.2% at the genus level to 29.4% at the family level. While certain variables, including alkalinity, water hardness, calcium, and magnesium concentrations, were identified as significant factors for archaeal community shifts, their explanatory power remained low after p-value adjustments. These results indicate that archaeal communities in pristine karst aquifers have a relatively stable structure with limited response to measured environmental gradients. This is consistent with the known ecological characteristics of archaea, which often occupy specialized niches and are adapted to stable, oligotrophic environments [63,64].
In contrast, bacterial communities showed strong and consistent responses to environmental variation. Adjusted explained variation was substantially higher at all taxonomic levels, reaching 70.8% at the family level. Key environmental drivers included magnesium concentration, water hardness, alkalinity, specific electrical conductivity (SEC), and nitrate concentration. Temporal factors such as seasonal variation and microbial size fractions also significantly influenced bacterial community composition. The effect of microbial size fractionation was significant at the species and genus level, but not at the family level, aligning with patterns observed in both NMDS ordinations and PERMANOVA results. Furthermore, DNA concentration explained part of the variation in bacterial community composition. This likely reflects both biological and technical factors. Higher DNA concentrations may indicate increased microbial biomass in response to favorable environmental conditions and thus serve as an indicator of microbial productivity. At the same time, fluctuations in DNA yield could affect the completeness of community profiles, particularly the detection of low-abundance taxa, despite data normalization procedures. Taken together, these results emphasize the importance of considering both environmental gradients and sample-specific factors when interpreting microbial community dynamics.
Environmental variables also significantly influence the functional potential of microbial communities, as revealed by the analysis of metagenomic functional gene profiles. The adjusted explained variation was high across all functional classification levels (Subsystem Function: 46.4%, Subsystem Level 3: 41.7%, Subsystem Level 2: 45.0%). The same set of environmental factors that influenced bacterial community composition—magnesium, water hardness, alkalinity, SEC, and nitrate—also explained a substantial part of the functional variability. Seasonal dynamics and size fractions were additionally important, suggesting that the functional capabilities of microbial communities depend on both temporal and physical factors. These results show that environmental gradients not only alter taxonomic composition but also drive changes in the metabolic potential of microbial communities, potentially affecting important ecosystem processes such as nutrient cycling.
To assess the effects of hydrological and meteorological variables on microbial parameters, we first tested discharge and precipitation values from the sampling day and alternative metrics, including 3- and 7-day averages and maxima for discharge and cumulative precipitation over 3 and 7 days prior to sampling. However, forward selection analysis showed that same-day discharge and precipitation values were the most informative. The final RDA models (Figure S14) showed no statistically significant effect of discharge or precipitation on microbial community composition, although it is known that the karst microbiota responds to hydrological influences. This suggests that while discharge can influence biomass mobilization, it does not necessarily alter the taxonomic or functional gene structure of established groundwater microbial communities within the time frame or spatial scale covered by our study. However, this may also reflect the limited resolution of the available discharge data, which originates from downstream gauges and does not fully represent the hydrological dynamics at the spring outlets. In addition, long-term hydroclimatic trends in Slovenia indicate rising temperatures and a decrease in discharge over time [65], patterns that we speculate could also affect our two study areas at some point in the future; therefore, long-term monitoring is warranted.

3.7. Variation Partitioning in Microbial Communities and Functional Potential Explained by Environmental and Temporal Factors

Variation partitioning analysis was conducted to quantify the independent and shared contributions of environmental and temporal factors in shaping bacterial and archaeal taxonomic, as well as microbial gene functional profiles (Figure S15). The results of the variation partitioning process are summarized in Figure 7.
The discrepancy between the total explained variation in RDA and the variation partitioning is primarily due to differences in model structure. While RDA includes all environmental and temporal variables in a single model and captures their combined and overlapping effects, variation partitioning separates these predictors into partial models. This allows the estimation of the unique (pure) effects of each set of variables by controlling for the influence of the others. As a result, the total variation explained in variation partitioning is lower than in the full RDA model because shared explanatory power is partitioned out. This approach provides a more nuanced understanding of how individual predictors contribute to microbial community structure [57,58].
The variation partitioning results revealed clear differences in how environmental and temporal factors contribute to structuring microbial communities, particularly between bacteria and archaea, and across taxonomic and functional gene levels.
Environmental variables independently explained the highest proportion of variation in bacterial community at the family level (48.6%), suggesting that broader taxonomic groupings are more strongly structured by stable hydrochemical gradients. At finer resolutions, such as the species level, the independent contribution of environmental factors was slightly lower (41.5%), while the influence of temporal factors increased (4.5%). This indicates that species-level community turnover is more sensitive to seasonal dynamics than higher taxonomic levels. Notably, the highest shared variation between environment and time was observed at the genus level (8.4%), suggesting that seasonal environmental fluctuations most strongly shape microbial dynamics at this intermediate taxonomic resolution, in addition to the fact that the number of taxonomic categories is smaller. Meanwhile, unexplained variation decreased from species (49.2%) to family level (42.0%), indicating that aggregating taxa into broader groups reduces the apparent influence of stochastic processes and unmeasured environmental variability.
In contrast to bacteria, variation partitioning of archaeal communities revealed a markedly different pattern. Although some environmental variables explained a small portion of the variation in archaeal composition, no significant contribution of temporal variables was detected. This finding indicates that archaeal communities are not structured by seasonal dynamics and instead exhibit high temporal stability.
Functional gene profiles also showed strong environmental structuring, although the proportion of variation explained was somewhat lower than for taxonomic data. The independent effect of environmental variables ranged from 31.4% to 35.9% across different functional levels, with only modest contributions from temporal variables (2.0–3.2%). Shared variation between environmental and temporal predictors peaked at Subsystem Level 3 (6.1%), suggesting that some finer-scale functions may still respond to seasonal environmental shifts. Notably, functional gene profiles exhibited consistently high levels of unexplained variation (57.3–60.6%), likely reflecting substantial functional redundancy, post-genomic regulation not captured by metagenomic data, and the influence of other unmeasured environmental and possibly biological factors [45,46].

3.8. Comparison of UV-VIS, Indices, and Trace Metal Content Results Between the 2016 and 2023 Seasons

UV-Vis spectroscopy was used to evaluate differences in dissolved organic matter (DOM) composition between IB and K samples across two sampling campaigns in order to elucidate whether statistically significant differences were introduced in a longer time span than one year of observation (Figure 8). Key absorbance indices and DNA-related ratios were calculated to gain insight on molecular size (A254, MWI, A300, E2/E3, E4/E6), aromaticity and humification (E4/E6), and the relative contribution of carbohydrates (A230), nucleic acids (A260), proteins (A280), and cDOC content (A320). These parameters allowed comparison of DOM composition and variability between the two sites (Figures S1–S6).
As the data were non-normally distributed (Shapiro–Wilk W < 0.87 and p < 1.15 × 10⁻¹⁴; Figures S2 and S3), a non-parametric statistical approach was employed, using one-way PERMANOVA, Kruskal–Wallis, Mann–Whitney, and nmMDS analyses. No meaningful or statistically significant differences for interpretation were observed across seasons or years. This suggests that the overall chemistry of the sampled water samples remained largely the same within the time frame of the 2016–2023 sampling campaigns. However, location-based comparisons revealed several statistically significant distinctions reflecting the distinct nature of both locations, with one-way PREMANOVA indicating a very strong statistically significant difference between IB borehole and K spring samples (p = 0.0001).
The total CDOM absorption, SumA250–450 (reflecting CDOM concentration and aromaticity; Figure S3) revealed a decisive statistically significant difference between IB and K (Kruskal–Wallis and Mann–Whitney p < 1.6 × 10⁻²⁰; ESM 1), with values ranging from 8 to 9, indicating a measurable difference in CDOM levels between the two sites.
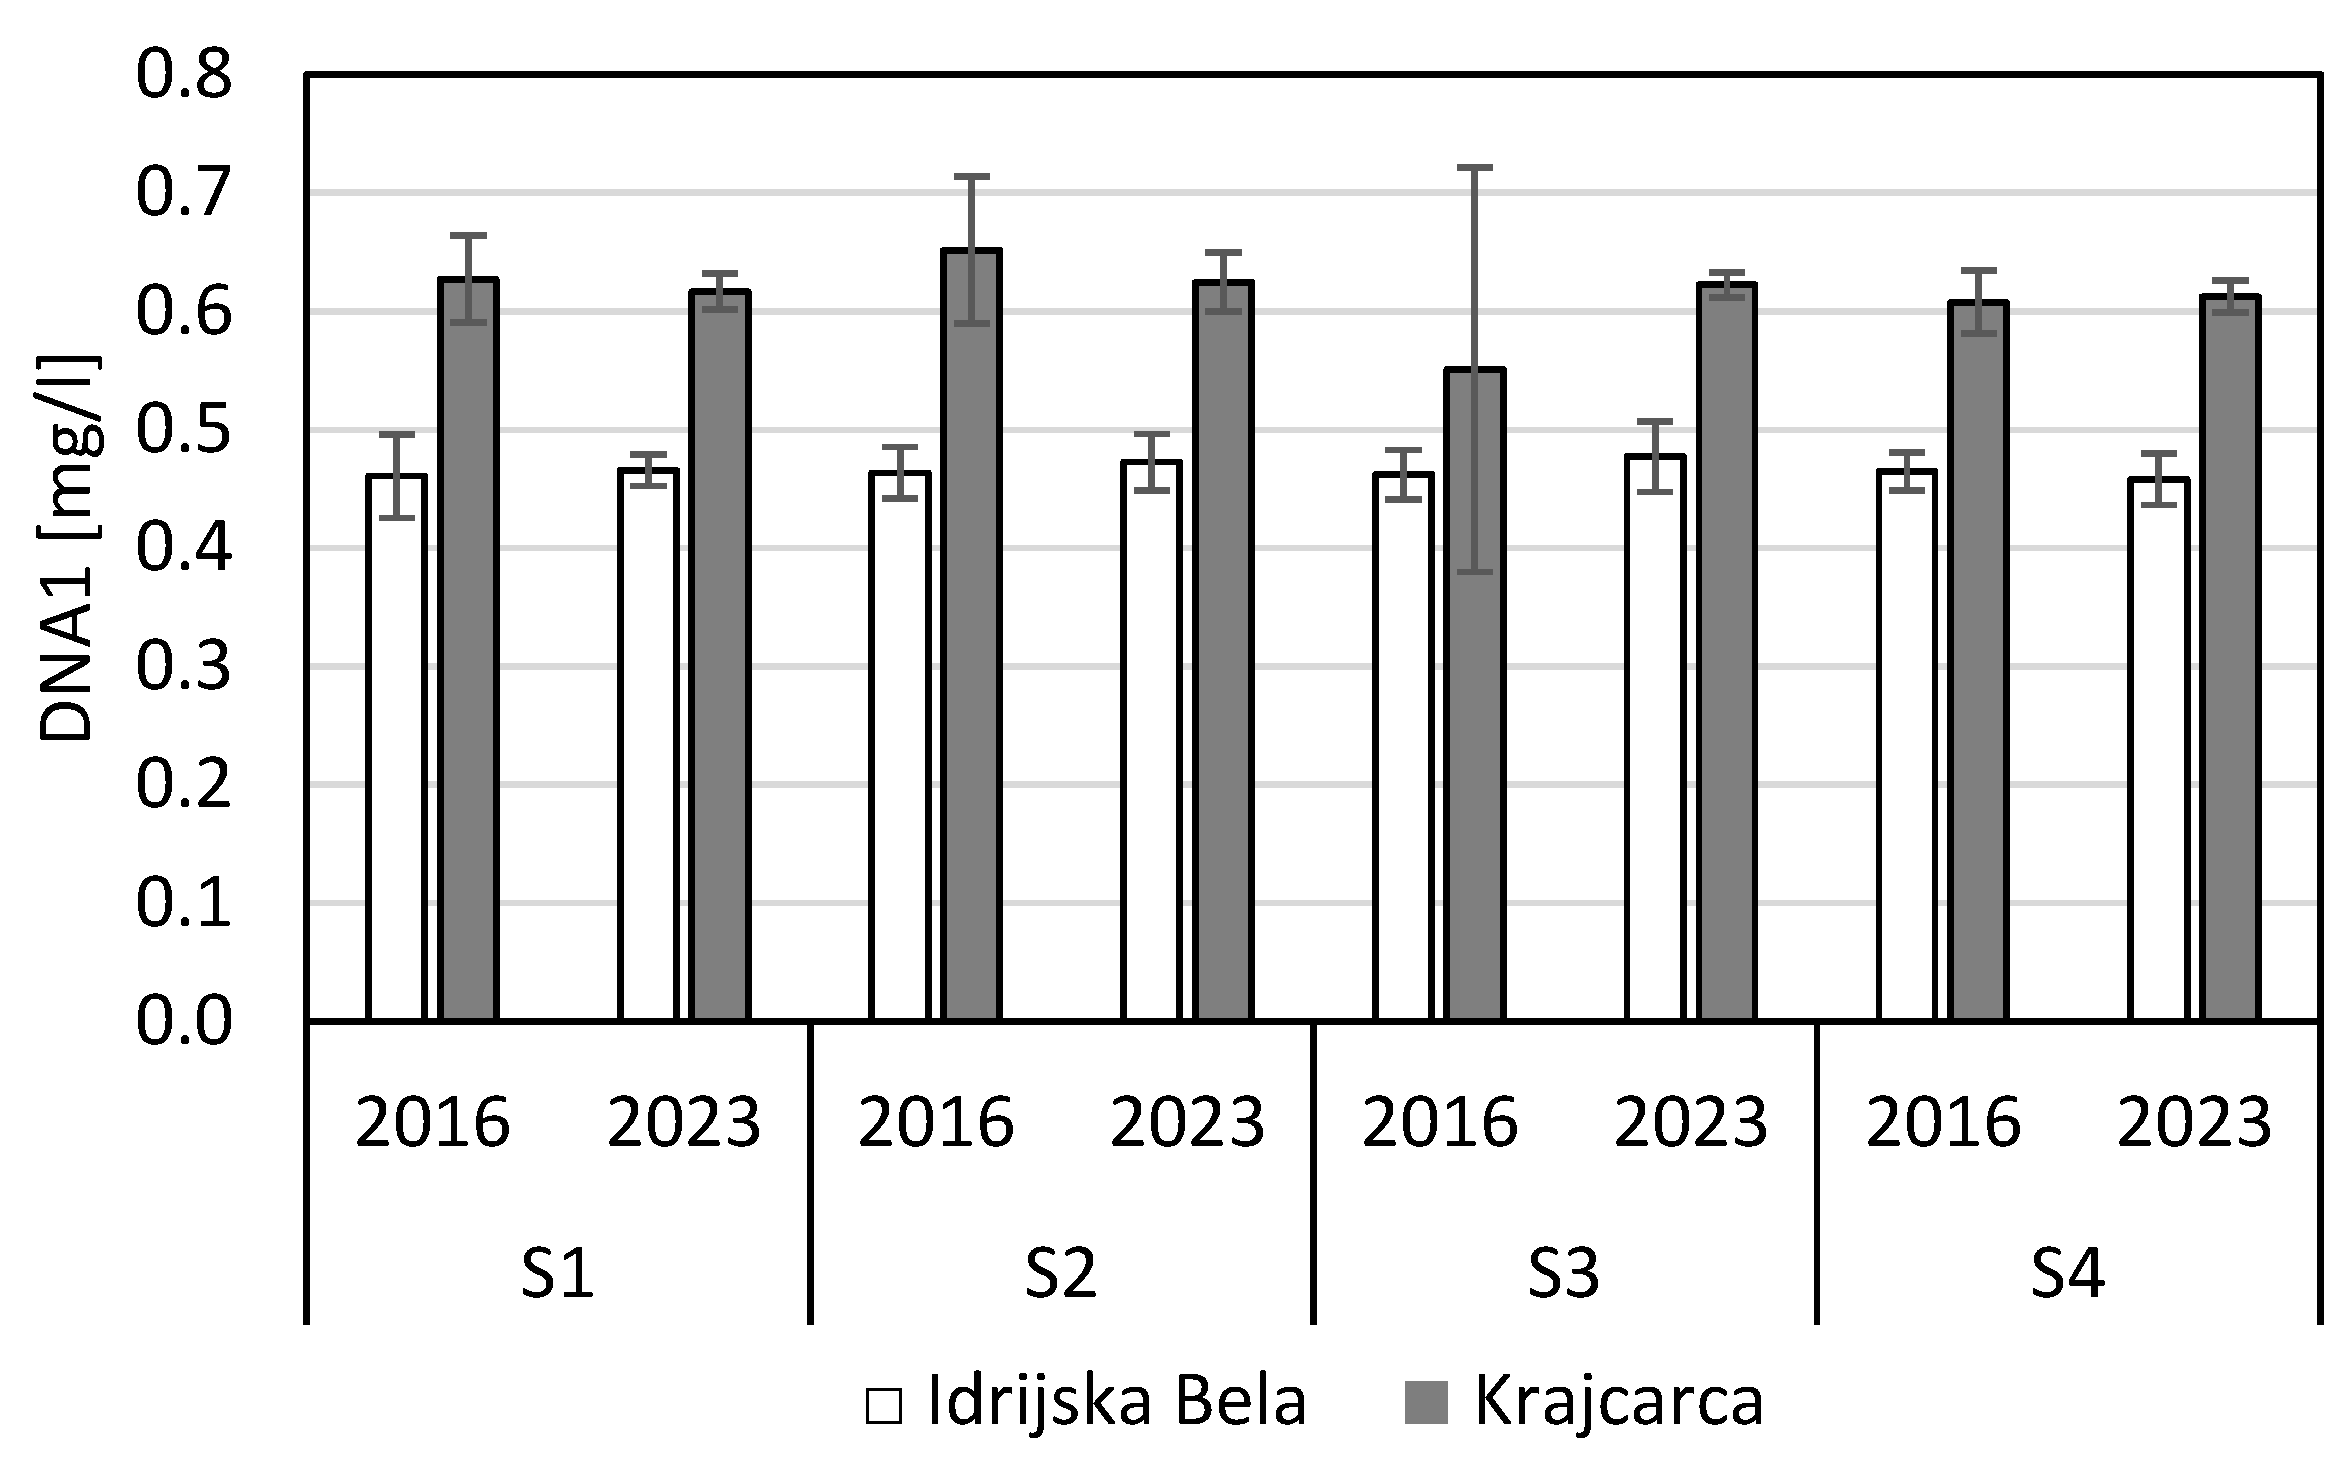
DNA1 index (Figure 8) was higher in K samples (≈0.6) compared to IB samples (≈0.45), suggesting a relatively greater presence of DNA- and RNA-like material in relation to carbohydrate-like compounds. This index showed a decisive and statistically significant difference between sites based on both the Mann–Whitney and Kruskal–Wallis tests (p ≈ 5.3 × 10−47). DNA2 and DNA3 ratios ranged from 1.2 to 1.3 and 1.5 to 1.6, respectively (Figure S1), indicating lower protein and cDOM signal contributions compared to nucleic acids. Although the median values between IB and K were similar, the Kruskal–Wallis and Mann–Whitney tests still detected a statistically significant difference: moderate (p ≈ 0.037; Figure S4) for DNA2 and strong evidence for DNA3 (p ≈ 0.002; Figure S4). The weaker significance observed for DNA2 and DNA3 may be attributed to the inherently greater variability of ratio-based indices, which are more susceptible to noise from their component absorbances.
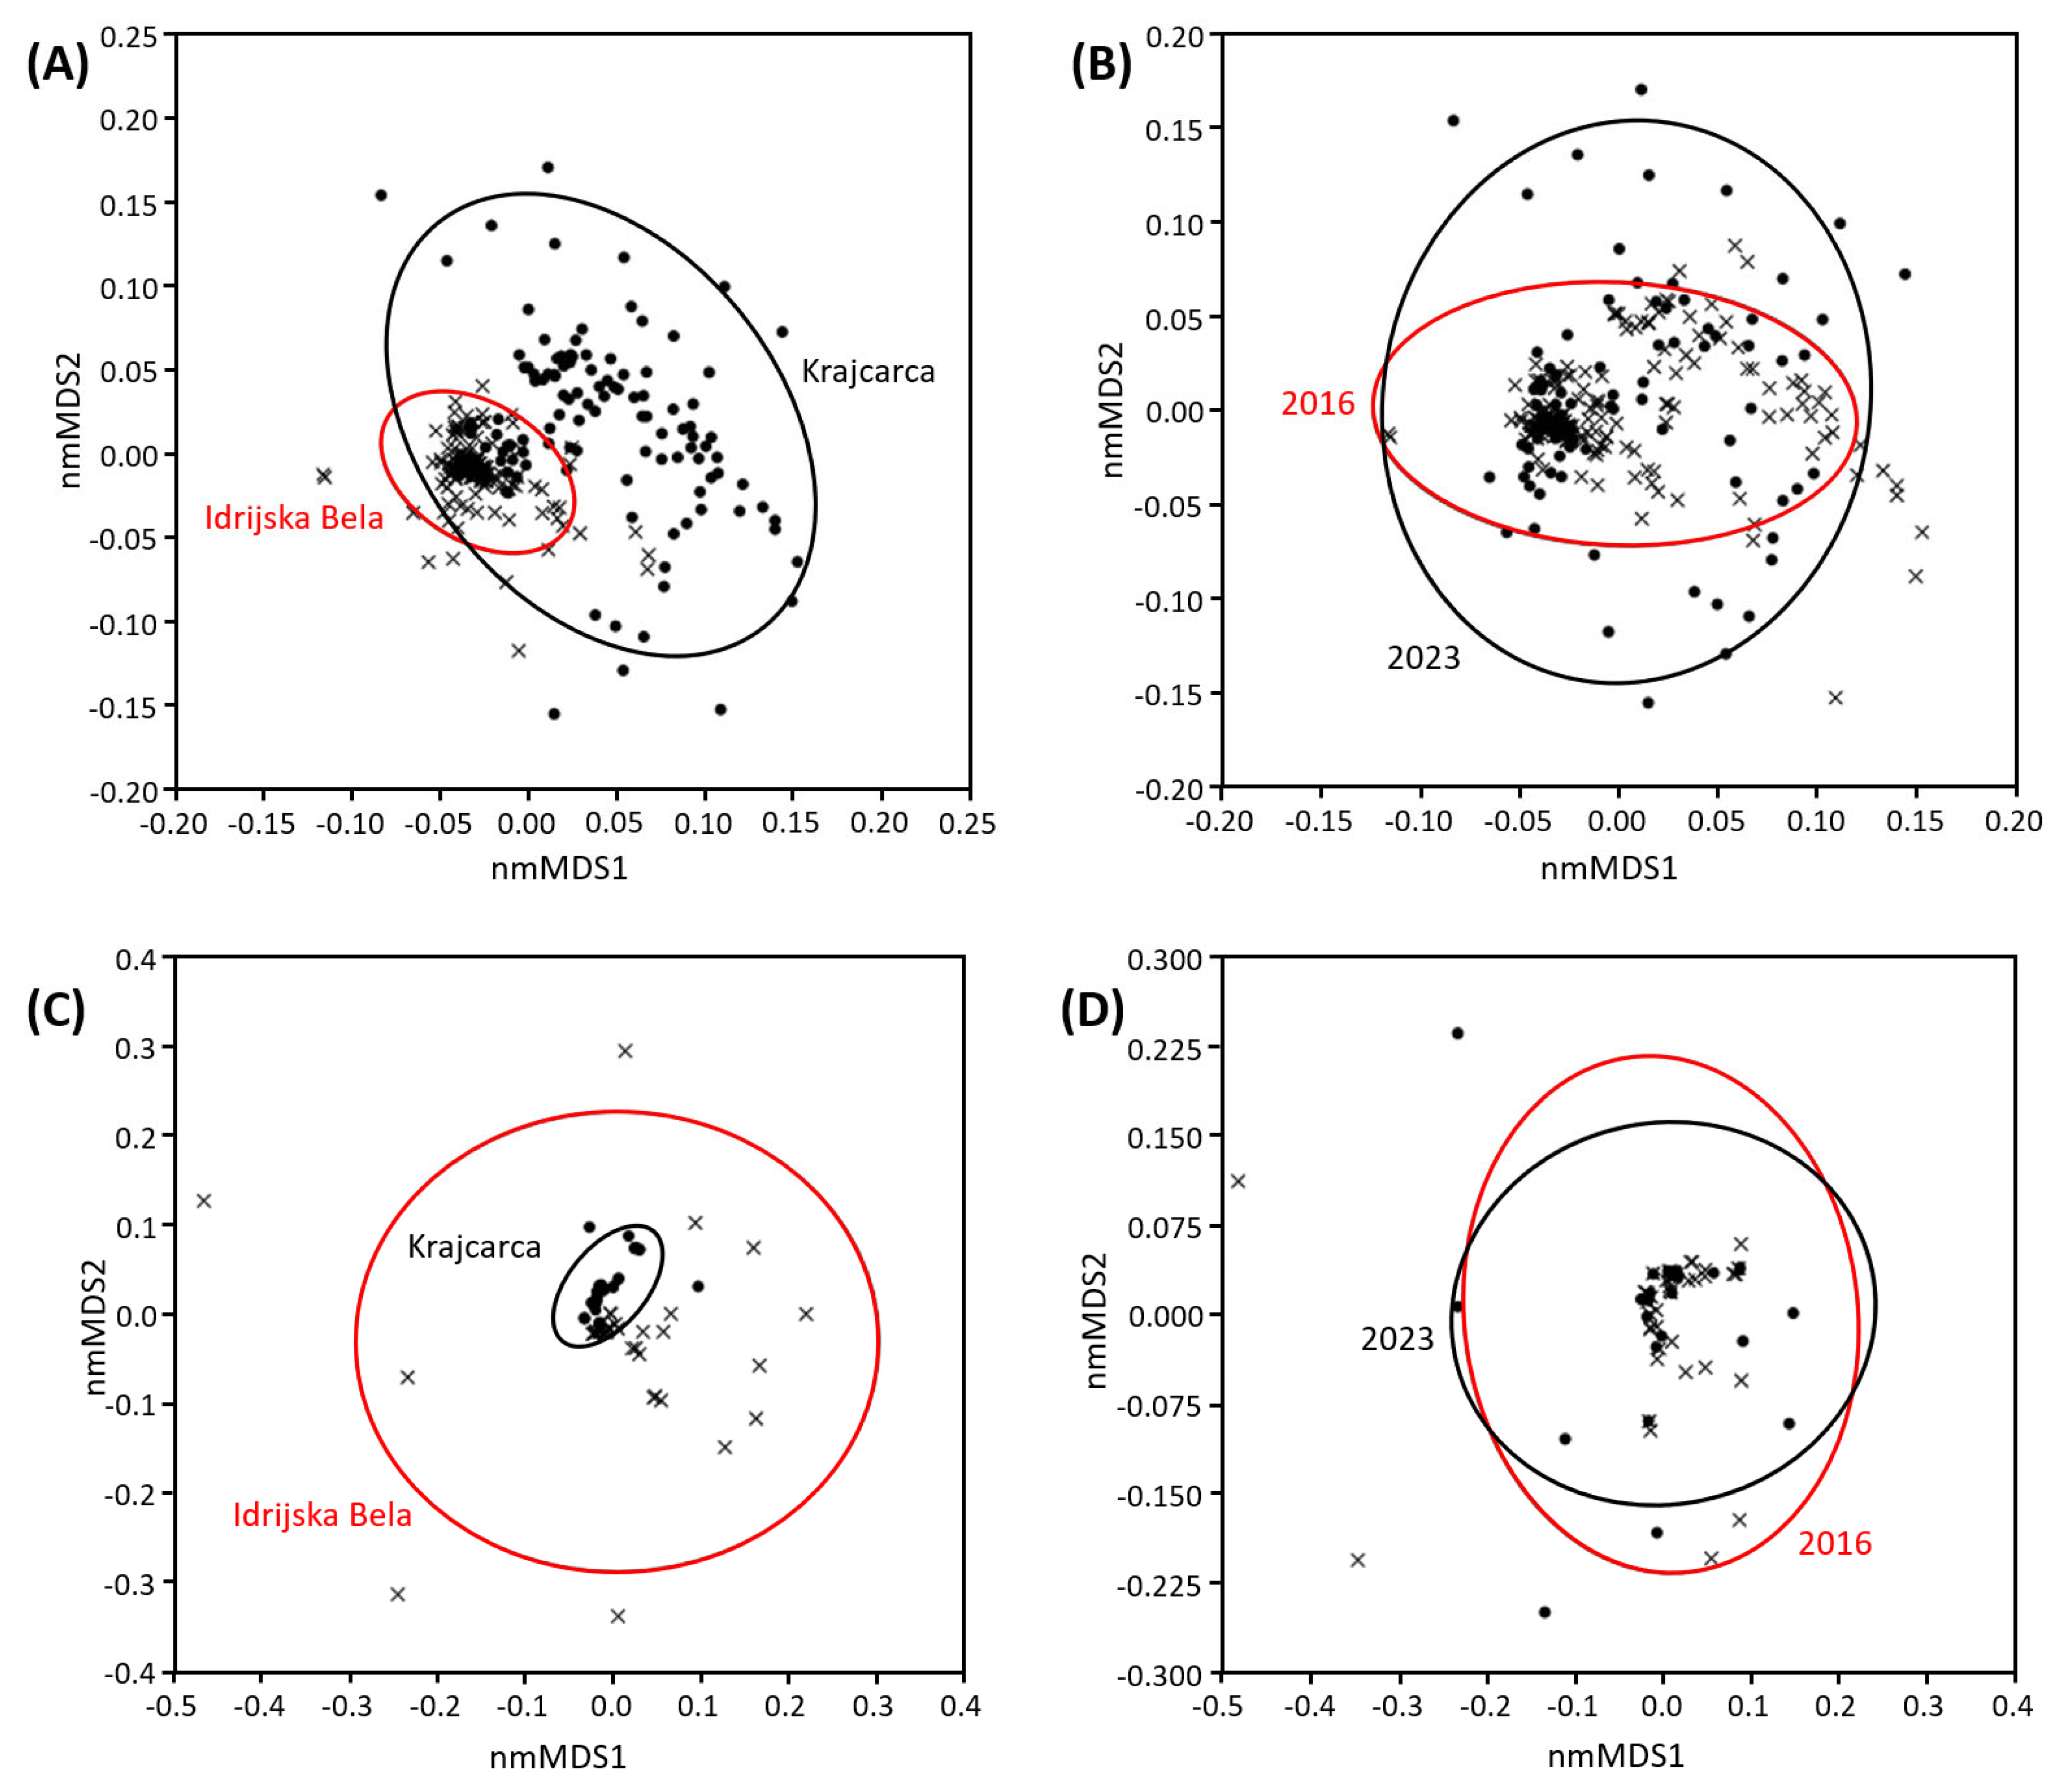
The indices A254, MWI, and A300 (Figure S1), all associated with molecular size, exhibited slightly lower median values in IB samples compared to K samples. Kruskal–Wallis and Mann–Whitney tests (Figure S4) indicated decisive statistically significant differences between the two sites (p < 1 × 10⁻⁵). In contrast, the E2/E3 ratio (≈2.0; Figure S1), used to track changes in the relative size of DOM molecules, and the E4/E6 ratio (≈1.1, Figure S1), a general indicator of humification which is also correlated with molecular size, atom ratios (O:C, C:N), carboxyl content, and total acidity [49], showed no statistically significant differences between IB and K (Kruskal–Wallis, Mann–Whitney; p > 0.05; Figure S4). While A254, MWI, and A300 suggest that DOM in IB may consist of smaller (less complex) molecules and differs in composition compared to K, this was not fully supported by the E2/E3 and E4/E6 ratios, which are also associated with molecule size (Figures S5 and S6). This apparent inconsistency may be attributed to the greater variance observed in the K samples, as evidenced by the broader spread of the K cluster in the nmMDS plot (Figure 9), where the more compact IB cluster is nested within it. The 95% confidence ellipse for IB indicated lower variability and more consistently defined DOM characteristics, while the larger ellipse for K reflected greater heterogeneity. Although the IB cluster lies within the broader K distribution, the separation of their centroids still suggests a degree of compositional differentiation in DOM characteristics. The separate two-way PERMANOVA analyses showed significant differences existed between the two sites (p< 0.0001) at the level of DOM characteristics and trace metals (Figure 9A,C) while the effects of additional factors such as sampling campaigns, seasons, year or their interactions were not significant (npermutations = 9999) yielding a final RDA model (Figure S14).
The results of ICP-MS largely followed those observed for DOM characteristics regarding normality tests (Figure S8), significant multivariate differences (Figure S9), pairwise comparisons by location (Figure S10), and sampling campaign (Figure S11). We showed that IB contained significantly higher concentrations of various metals irrespective of the season or month of sampling (Figures S7–S12). This is also observed in the fact that the variability of metals present in the K was lower in comparison to those observed in IB (Figure S7) and close to the detection limit of ICP-MS, resulting in a more densely packed group of samples in comparison to IB (Figure 9C and Figures S7–S11).
Although the two sampling locations differed significantly based on the numerous environmental parameters measured in this study (Figure 1, Figure 2, Figure 3 and Figure 4), the differences between sampling campaigns were not significant for DOM characteristics (Figure 9B) nor trace metals (Figure 9D). The differences in the underlying hydrochemistry explained roughly half of the observed variability in the two water spring microbiome descriptions at the bacterial and functional levels, while archaea exhibited high temporal stability. In addition, while Krajcarca spring represented a much wider DOM variability in comparison to borehole IB (Figure 9A), the pattern was reversed in metal content (Figure 9C), while 95% confidence ellipses of the sampling campaigns largely overlapped (Figure 9B,D). Finally, the kernel density of the multivariate descriptions of the sites showed that only one central distribution of DOM characteristics and metal distributions existed between the two sites, suggesting the existence of central characteristics of the two springs, possibly characteristic of the Slovenian Karst water springs. Future research is warranted to elucidate this.

4. Conclusions

In conclusion, this study provided the first detailed whole-metagenome-based characterization of microbial communities in two pristine alpine karst aquifers in Slovenia, combining comprehensive chemical, physical, and microbiological analyses. The findings demonstrated that hydrogeochemical factors, notably carbonate weathering and bedrock composition, are the primary drivers of spatial differences in microbial community structure and functional potential. Bacterial communities and their functional profiles were significantly influenced by environmental gradients, while archaeal communities showed remarkable temporal stability. Despite seasonal hydrological variability, the aquifers’ overall microbial and chemical signatures remained consistent across years, underscoring their ecological resilience. These insights contribute to a deeper understanding of karst groundwater ecosystems and provide a critical reference point for detecting future environmental changes and guiding sustainable drinking water resource management.

Supplementary Materials

The following supporting information can be downloaded at: https://www.mdpi.com/article/10.3390/w17162402/s1. Scheme S1: A Schematic representation of the experiments conducted in this study. Scheme S2: Geographical representation of the two spring locations utilized in this study, Krajcarica and Idrijska Bela (Adapted from Janež, 2002 and Kanduč, 2008). Scheme S3: A wider geographical positioning of the Republic of Slovenia on the European continent. Scheme S4: Geological comparison of the Krajcarca spring and Idrijska Bela borehole sites. Figure S1. UV-Vis characteristic indices: a) A230; b) A260; c) A320; d) DNA1 (A260/A230); e) DNA2; f) (A260/A280); g) DNA3 (A260/A320); h) A254; i) MWI; j) A300; k) E2/E3; l) E4/E6; m) SumA250-450. Figure S2. Normality test for UV-Vis characteristic indices: A230, A260, A280, A320, DNA1, DNA2, DNA3, A254, MWI, A300, E2/E3, E4/E6 and SumA250-A450; for Idrijska Bela (IB) and Krajcarca (K) water samples. Figure S3. Two-way PERMANOVA results for UV-Vis characteristic indices (A230, A254, A260, A280, A300, A320, DNA1, DNA2, DNA3, MWI, E2/E3, E4/E6, and SumA250–A450) comparing Idrijska Bela (IB) and Krajcarca (K) water samples by year (2016, 2023) and location. The analysis was based on the Euclidean similarity index with 9,999 permutations. Figure S4. Mann-Whitney pairwise test and Kruskal-Wallis test for UV-Vis characteristic indices (A230, A260, A280, A320, DNA1, DNA2, DNA3, A254, MWI, A300, E2/E3, E4/E6 and SumA250-A450) comparing Idrijska Bela (IB) and Krajcarca (K) water samples by location. Figure S5. Mann-Whitney pairwise test and Kruskal-Wallis test for UV-Vis characteristic indices (A230, A260, A280, A320, DNA1, DNA2, DNA3, A254, MWI, A300, E2/E3, E4/E6 and SumA250-A450) comparing Idrijska Bela (IB) and Krajcarca (K) water samples by year of campaign (2016, 2023). Figure S6. Spectral slopes and their ratio calculated according to the method described by Helms et al. (2008) for each season within the sampling campaigns in the years 2016 and 2023. Seasons were defined as S1- spring; S2-summer; S3-fall; S4-winter, in line with differences in general rainfall/snowfall patterns. Spectral slopes S275-S295, S350-400 and their ratio (SR) were calculated from seasonally summed UV-Vis spectra to minimize noise interference. S275-295 slopes were generally stepper in K samples, except for K S4 2016 samples. Similarly, S350-400 the slope appeared steeper in K samples with some deviations such as K S2 2016, and K S2 2023. As a result, the SR ratio did not yield a clear trend suitable for interpretation. Therefore, no definitive conclusions could be drawn as based on SR ratio. The UV-VIS derived water SR ratio typically refers to a Spectral Reflectance (SR) ratio derived from Ultraviolet-Visible (UV-VIS) spectroscopy measurements of water samples. This ratio provides information about the optical properties of water, especially related to the presence and concentration of dissolved organic matter. Figure S7. And overview of metal content in water samples collected over the two sampling campaigns in the two streams (IB and K) (A). Horizontal lines designate the values states as the lowest concentration of quantitation for the ICP-MS method. Please note the log Y -scale describing the concentration of the trace metals in water samples (microgram/liter). (B) A numerical representation of values encountered for the two locations describing the concentration of the trace metals in water samples (microgram/liter). The limits of detection were used as lower bounds of concentrations in both figures. Figure S8. Normality test for metal measurements (Al, As, Cu, Zn, Cd, Cr, Mn, Mo, Ni, Pb, V) for Idrijska Bela (IB) and Krajcarca (K) water samples. Figure S9. Two-way PERMANOVA results for metal measurements (Al, As, Cu, Zn, Cd, Cr, Mn, Mo, Ni, Pb, and V) comparing Idrijska Bela (IB) and Krajcarca (K) water samples by sampling campaign (year 2016, year 2023) and location (IB, K). The analysis was based on the Euclidean similarity index with 9,999 permutations. Figure S10. Mann-Whitney pairwise and Kruskal-Wallis test results for metal measurements (Al, As, Cu, Zn, Cd, Cr, Mn, Mo, Ni, Pb, and V) comparing Idrijska Bela (IB) and Krajcarca (K) water samples by location (IB, K). Figure S11. Mann-Whitney pairwise and Kruskal-Wallis test results for metal measurements (Al, As, Cu, Zn, Cd, Cr, Mn, Mo, Ni, Pb, and V) comparing Idrijska Bela (IB) and Krajcarca (K) water samples by year (2016, 2023). Figure S12. Non-metric multidimensional scaling (nmMDS) plot with 95% confidence ellipses and kernel point density overlay, based UV-Vis characteristic indices (A230, A260, A280, A320, DNA1, DNA2, DNA3, A254, MWI, A300, E2/E3, E4/E6 and SumA250-450). (a) Grouping by location: Idrijska Bela (X symbols, red ellipse) and Krajcarca (dots, black ellipse). Stress = 0.3084; and R2 for Axis 1 and Axis 2 were 0.4576 and 0.397, respectively. (b) Grouping by year: 2016 samples (X symbols, red ellipse) and 2023 samples (dots, black ellipse). Stress = 0.3084; and R2 for Axis 1 and Axis 2 were 0.4576 and 0.397, respectively. Figure S13. Non-metric multidimensional scaling (nmMDS) plot with 95% confidence ellipses and kernel point density overlay, based on metals measurements (Alu, As, Cu, Zn, Cd, Cr, Mn, Mo, Ni, Pb, V and Fe). (a) Grouping by location: Idrijska Bela (X symbols, black ellipse) and Krajcarca (dots, red ellipse). Stress = 0.1369; and R2 for Axis 1 and Axis 2 were 0.5618 and 0.1098, respectively. (b) Grouping by year: 2016 samples (dots, black ellipse) and 2023 samples (X symbols, red ellipse). Stress = 0.1392; and R2 for Axis 1 and Axis 2 were 0.6353 and 0.07192, respectively. Figure S14. RDA model results showing the proportion of variation explained by environmental variables for archaeal, bacterial, and functional community profiles across different taxonomic or functional levels. Figure S15: A visual representation of the microbiome status at the two locations throughout the sampling periods. Relative abundance (%) of microbial communities and functional genes in samples from Idrijska Bela (IB) and Krajcarca (K). (A) Archaeal species composition representing 98% of total abundance (remaining 2% grouped as Others). (B) Bacterial species composition representing 80% of total abundance (20% grouped as Others). (C) Functional gene profiles based on SEED Subsystems Level 2 annotations, representing 98% of total functional potential (2% grouped as Others); NULL indicates unclassified or unannotated functions at this level. Please note that due to the high number of categories at species level (i.e. > 800) not all could be presented and therefore were grouped to “Others”.

Author Contributions

Conceptualization, S.K.R. and B.S.; Data curation, M.L., M.B., M.O., Z.P., L.H., D.R., B.M. and B.S.; Formal analysis, M.L., M.B., Z.P., L.H., D.R., B.M. and B.S.; Funding acquisition, M.M., B.L., U.N., S.K.R. and B.S.; Investigation, M.L., M.B., M.M., Z.P., L.H., D.R., B.L., U.N., B.M., S.K.R. and B.S.; Methodology, M.B., M.M., Z.P., L.H., D.R., B.L., U.N., B.M., S.K.R. and B.S.; Project administration, M.M., B.L., U.N., S.K.R. and B.S.; Resources, M.O., M.M., Z.P., B.L., U.N., B.M., S.K.R. and B.S.; Software, M.M., B.L., U.N., B.M., S.K.R. and B.S.; Supervision, S.K.R. and B.S.; Validation, S.K.R. and B.S.; Visualization, M.L., M.B., M.O., M.M., S.K.R. and B.S.; Writing - original draft, M.L., M.B., M.O., M.M., Z.P., L.H., D.R., B.L., U.N., B.M., S.K.R. and B.S.; Writing - review & editing, M.L., M.B., M.O., M.M., Z.P., L.H., D.R., B.L., U.N., B.M., S.K.R. and B.S. All authors have read and agreed to the published version of the manuscript.

Funding

This research was funded by the Slovenian Research and Innovation Agency (ARIS) projects J1-6741 and J1-6732 to B.S., the research program ARIS P2-0180 to M.M., and the research program ARIS P2-0095 to B.M. M.L. was funded by the Slovenian Research and Innovation Agency ARIS Young researcher fellowship (#53601). The APC was funded by ARIS P2-0180 to M.M.

Data Availability Statement

The raw data supporting the conclusions of this article will be made available by the authors on request.

Acknowledgments

We thank colleagues from Biotechnical Faculty, University of Ljubljana, Slovenia and Slovenian Academy of Sciences for their technical assistance at the initial stage of the project. The authors acknowledge the kind support from the side of the Triglav National Park authorities (https://www.tnp.si/en/ (accessed on 13 August 2025) and the public utility company Idrija (https://komunalaidrija.si/ (accessed on 13 August 2025) for sampling permits and access, and finally to the Slovenian Environment Agency (https://www.arso.gov.si/en/ (accessed on 13 August 2025) for access to meteorological data.

Conflicts of Interest

The authors declare no conflicts of interest. The funders had no role in the design of the study; in the collection, analyses, or interpretation of data; in the writing of the manuscript; or in the decision to publish the results.

Abbreviations

The following abbreviations are used in this manuscript:
16S rRNASubunit of ribosomal ribonucleic acid
ARSOSlovenian Environment Agency
DOMDissolved organic matter
eDNAEnvironmental DNA
IBIdrijska Bela
ICP-MSInductively coupled plasma mass spectrometry
KKrajcarca
LMWLLocal meteoric water line
nmMDSNon-metric multidimensional scaling
PASTPAleontological Statistics program
PERMANOVAOne-way Permutational Multivariate Analysis of Variance
RDARedundancy analysis
SECSpecific electrical conductivity
t-RFLPTerminal restriction fragment length polymorphism
WMSWhole-metagenome sequencing

References

  1. Gleeson, T.; Cuthbert, M.; Ferguson, G.; Perrone, D. Global Groundwater Sustainability, Resources, and Systems in the Anthropocene. Annu. Rev. Earth Planet. Sci. 2020, 48, 431–463. [Google Scholar] [CrossRef]
  2. Farnleitner, A.H.; Wilhartitz, I.; Ryzinska, G.; Kirschner, A.K.T.; Stadler, H.; Burtscher, M.M.; Hornek, R.; Szewzyk, U.; Herndl, G.; Mach, R.L. Bacterial Dynamics in Spring Water of Alpine Karst Aquifers Indicates the Presence of Stable Autochthonous Microbial Endokarst Communities. Environ. Microbiol. 2005, 7, 1248–1259. [Google Scholar] [CrossRef] [PubMed]
  3. Griebler, C.; Lueders, T. Microbial Biodiversity in Groundwater Ecosystems. Freshw. Biol. 2009, 54, 649–677. [Google Scholar] [CrossRef]
  4. Anantharaman, K.; Brown, C.T.; Hug, L.A.; Sharon, I.; Castelle, C.J.; Probst, A.J.; Thomas, B.C.; Singh, A.; Wilkins, M.J.; Karaoz, U.; et al. Thousands of Microbial Genomes Shed Light on Interconnected Biogeochemical Processes in an Aquifer System. Nat. Commun. 2016, 7, 13219. [Google Scholar] [CrossRef]
  5. Schwab, V.F.; Herrmann, M.; Roth, V.-N.; Gleixner, G.; Lehmann, R.; Pohnert, G.; Trumbore, S.; Küsel, K.; Totsche, K.U. Functional Diversity of Microbial Communities in Pristine Aquifers Inferred by PLFA- and Sequencing-Based Approaches. Biogeosciences 2017, 14, 2697–2714. [Google Scholar] [CrossRef]
  6. Xiu, W.; Wu, M.; Nixon, S.L.; Lloyd, J.R.; Bassil, N.M.; Gai, R.; Zhang, T.; Su, Z.; Guo, H. Genome-Resolved Metagenomic Analysis of Groundwater: Insights into Arsenic Mobilization in Biogeochemical Interaction Networks. Environ. Sci. Technol. 2022, 56, 10105–10119. [Google Scholar] [CrossRef]
  7. Liu, S.; Zheng, T.; Li, Y.; Zheng, X. A Critical Review of the Central Role of Microbial Regulation in the Nitrogen Biogeochemical Process: New Insights for Controlling Groundwater Nitrogen Contamination. J. Environ. Manag. 2023, 328, 116959. [Google Scholar] [CrossRef]
  8. Zhou, Y.; Kellermann, C.; Griebler, C. Spatio-Temporal Patterns of Microbial Communities in a Hydrologically Dynamic Pristine Aquifer. FEMS Microbiol. Ecol. 2012, 81, 230–242. [Google Scholar] [CrossRef]
  9. Wilhartitz, I.C.; Kirschner, A.K.T.; Brussaard, C.P.D.; Fischer, U.R.; Wieltschnig, C.; Stadler, H.; Farnleitner, A.H. Dynamics of Natural Prokaryotes, Viruses, and Heterotrophic Nanoflagellates in Alpine Karstic Groundwater. Microbiologyopen 2013, 2, 633–643. [Google Scholar] [CrossRef]
  10. Savio, D.; Stadler, P.; Reischer, G.H.; Demeter, K.; Linke, R.B.; Blaschke, A.P.; Mach, R.L.; Kirschner, A.K.T.; Stadler, H.; Farnleitner, A.H. Spring Water of an Alpine Karst Aquifer Is Dominated by a Taxonomically Stable but Discharge-Responsive Bacterial Community. Front. Microbiol. 2019, 10, 28. [Google Scholar] [CrossRef]
  11. Zhong, S.; Zhou, S.; Liu, S.; Wang, J.; Dang, C.; Chen, Q.; Hu, J.; Yang, S.; Deng, C.; Li, W.; et al. May Microbial Ecological Baseline Exist in Continental Groundwater? Microbiome 2023, 11, 152. [Google Scholar] [CrossRef] [PubMed]
  12. Sinreich, M.; Pronk, M.; Kozel, R. Microbiological Monitoring and Classification of Karst Springs. Environ. Earth Sci. 2014, 71, 563–572. [Google Scholar] [CrossRef]
  13. Hemme, C.L.; Tu, Q.; Shi, Z.; Qin, Y.; Gao, W.; Deng, Y.; Van Nostrand, J.D.; Wu, L.; He, Z.; Chain, P.S.G.; et al. Comparative Metagenomics Reveals Impact of Contaminants on Groundwater Microbiomes. Front. Microbiol. 2015, 6, 1205. [Google Scholar] [CrossRef] [PubMed]
  14. Hershey, O.S.; Kallmeyer, J.; Wallace, A.; Barton, M.D.; Barton, H.A. High Microbial Diversity Despite Extremely Low Biomass in a Deep Karst Aquifer. Front. Microbiol. 2018, 9, 2823. [Google Scholar] [CrossRef]
  15. Flynn, T.M.; Sanford, R.A.; Ryu, H.; Bethke, C.M.; Levine, A.D.; Ashbolt, N.J.; Santo Domingo, J.W. Functional Microbial Diversity Explains Groundwater Chemistry in a Pristine Aquifer. BMC Microbiol. 2013, 13, 146. [Google Scholar] [CrossRef]
  16. Sirisena, K.A.; Daughney, C.J.; Moreau, M.; Sim, D.A.; Lee, C.K.; Cary, S.C.; Ryan, K.G.; Chambers, G.K. Bacterial Bioclusters Relate to Hydrochemistry in New Zealand Groundwater. FEMS Microbiol. Ecol. 2018, 94, fiy170. [Google Scholar] [CrossRef]
  17. Beyer, A.; Rzanny, M.; Weist, A.; Möller, S.; Burow, K.; Gutmann, F.; Neumann, S.; Lindner, J.; Müsse, S.; Brangsch, H.; et al. Aquifer Community Structure in Dependence of Lithostratigraphy in Groundwater Reservoirs. Environ. Sci. Pollut. Res. 2015, 22, 19342–19351. [Google Scholar] [CrossRef]
  18. Goldscheider, N.; Hunkeler, D.; Rossi, P. Review: Microbial Biocenoses in Pristine Aquifers and an Assessment of Investigative Methods. Hydrogeol. J. 2006, 14, 926–941. [Google Scholar] [CrossRef]
  19. Pronk, M.; Goldscheider, N.; Zopfi, J. Microbial Communities in Karst Groundwater and Their Potential Use for Biomonitoring. Hydrogeol. J. 2009, 17, 37–48. [Google Scholar] [CrossRef]
  20. Vierheilig, J.; Savio, D.; Ley, R.E.; Mach, R.L.; Farnleitner, A.H.; Reischer, G.H. Potential Applications of next Generation DNA Sequencing of 16S RRNA Gene Amplicons in Microbial Water Quality Monitoring. Water Sci. Technol. 2015, 72, 1962–1972. [Google Scholar] [CrossRef]
  21. Chik, A.H.S.; Emelko, M.B.; Anderson, W.B.; O’Sullivan, K.E.; Savio, D.; Farnleitner, A.H.; Blaschke, A.P.; Schijven, J.F. Evaluation of Groundwater Bacterial Community Composition to Inform Waterborne Pathogen Vulnerability Assessments. Sci. Total Environ. 2020, 743, 140472. [Google Scholar] [CrossRef] [PubMed]
  22. Demeter, K.; Linke, R.; Ballesté, E.; Reischer, G.; Mayer, R.E.; Vierheilig, J.; Kolm, C.; Stevenson, M.E.; Derx, J.; Kirschner, A.K.T.; et al. Have Genetic Targets for Faecal Pollution Diagnostics and Source Tracking Revolutionized Water Quality Analysis Yet? FEMS Microbiol. Rev. 2023, 47, fuad028. [Google Scholar] [CrossRef] [PubMed]
  23. Savio, D.; Stadler, P.; Reischer, G.H.; Kirschner, A.K.T.; Demeter, K.; Linke, R.; Blaschke, A.P.; Sommer, R.; Szewzyk, U.; Wilhartitz, I.C.; et al. Opening the Black Box of Spring Water Microbiology from Alpine Karst Aquifers to Support Proactive Drinking Water Resource Management. WIREs Water 2018, 5, e1282. [Google Scholar] [CrossRef] [PubMed]
  24. Stres, B.; Kronegger, L. Shift in the Paradigm towards Next-Generation Microbiology. FEMS Microbiol. Lett. 2019, 366, fnz159. [Google Scholar] [CrossRef]
  25. Quince, C.; Walker, A.W.; Simpson, J.T.; Loman, N.J.; Segata, N. Shotgun Metagenomics, from Sampling to Analysis. Nat. Biotechnol. 2017, 35, 833–844. [Google Scholar] [CrossRef]
  26. Barbosa, F.A.S.; Brait, L.A.S.; Coutinho, F.H.; Ferreira, C.M.; Moreira, E.F.; de Queiroz Salles, L.; Meirelles, P.M. Ecological Landscape Explains Aquifers Microbial Structure. Sci. Total Environ. 2023, 862, 160822. [Google Scholar] [CrossRef]
  27. Pašić, L.; Kovče, B.; Sket, B.; Herzog-Velikonja, B. Diversity of Microbial Communities Colonizing the Walls of a Karstic Cave in Slovenia. FEMS Microbiol. Ecol. 2009, 71, 50–60. [Google Scholar] [CrossRef]
  28. Mulec, J.; Skok, S.; Pašić, L. Low Bacterial Diversity and Nitrate Levels in Cores from Deep Boreholes in Pristine Karst. Life 2024, 14, 677. [Google Scholar] [CrossRef]
  29. Opalički Slabe, M.; Danevčič, T.; Hug, K.; Fillinger, L.; Mandić-Mulec, I.; Griebler, C.; Brancelj, A. Key Drivers of Microbial Abundance, Activity, and Diversity in Karst Spring Waters across an Altitudinal Gradient in Slovenia. Aquat. Microb. Ecol. 2021, 86, 99–114. [Google Scholar] [CrossRef]
  30. Kanduč, T. Hydrogeochemical Characteristics of the River Idrijca (Slovenia). Geologija 2008, 51, 39–49. [Google Scholar] [CrossRef]
  31. Kanduč, T.; Kocman, D.; Ogrinc, N. Hydrogeochemical and Stable Isotope Characteristics of the River Idrijca (Slovenia), the Boundary Watershed Between the Adriatic and Black Seas. Aquat. Geochem. 2008, 14, 239–262. [Google Scholar] [CrossRef]
  32. Baptista-Salazar, C.; Biester, H. The Role of Hydrological Conditions for Riverine Hg Species Transport in the Idrija Mining Area. Environ. Pollut. 2019, 247, 716–724. [Google Scholar] [CrossRef]
  33. Škerjanec, M.; Atanasova, N.; Žagar, D.; Novak, G. Idrijca and Soča/Isonzo River Discharges Estimation for Modelling Mercury Pollution. Acta Hydrotech. 2024, 37, 153–171. [Google Scholar] [CrossRef]
  34. Buser, S. Tolmač Lista Gorica: L 33-78: Socialistična Federativna Republika Jugoslavija, Osnovna Geološka Karta, 1:100 000; Zvezni geološki zavod: Beograd, Yugoslavia, 1973. [Google Scholar]
  35. Mlakar, I.; Čar, J. Geološka Karta Idrijsko-Cerkljanskega Hribovja Med Stopnikom in Rovtami 1:25.000 [Kartografsko Gradivo] = Geological Map of the Idrija—Cerkno Hills Between Stopnik and Rovte 1:25.000; Geološki zavod Slovenije: Ljubljana, Slovenia, 2009. [Google Scholar]
  36. Čar, J.; Placer, L. The Middle Triassic Structure of the Idrija Region. Geologija 1977, 20, 141–166. [Google Scholar]
  37. Mlakar, I. Nappe Structure of the Idrija-Žiri Region. Geologija 1969, 12, 5–72. [Google Scholar]
  38. Čar, J.; Šegina, E. Geologic Structure and Origin of the Zadlog Karst Polje. Geologija 2024, 67, 249–271. [Google Scholar] [CrossRef]
  39. Gosar, A. Measurements of Tectonic Micro-Displacements within the Idrija Fault Zone in the Učja Valley (W Slovenia). Acta Geogr. Slov. 2020, 60, 79–93. [Google Scholar] [CrossRef]
  40. Placer, L.; Popit, T.; Rižnar, I. Tectonics and Gravitational Phenomena, Part Two: The Trnovski Gozd-Banjšice-Šentviška Gora Degraded Plain. Geologija 2024, 67, 129–156. [Google Scholar] [CrossRef]
  41. Janež, J. Karst Springs in the Upper Soča Valley. Geologija 2002, 45, 393–400. [Google Scholar] [CrossRef]
  42. Jurkovšek, B. Tolmač Listov Beljak in Ponteba: L33-51: L33-52: Socialistična Federativna Republika Jugoslavija, Osnovna Geološka Karta, 1:100 000; Jurkovšek, B., Buser, S., Čakalo, M., Ferjančić, L., Poljak, M., Ramovš, A., Stojanović, B., Toman, M., Eds.; Zvezni Geološki Zavod: Beograd, Yugoslavia, 1987. [Google Scholar]
  43. Zupan Hajna, N. Explanatory Book to the Map: Geological Structure of the Idrija-Cerkno Hills. Acta Carsologica 2010, 39. The map and book are available from the Geological Survey of Slovenia (http://www.geo-zs.si/). [Google Scholar] [CrossRef]
  44. Clesceri, L.S.; Greenberg, A.E.; Eaton, A.D. Standard Methods for the Examination of Water and Wastewater, 20th ed.; American Public Health Association: Washington, DC, USA, 1998. [Google Scholar]
  45. Stres, B.; Sul, W.J.; Murovec, B.; Tiedje, J.M. Recently Deglaciated High-Altitude Soils of the Himalaya: Diverse Environments, Heterogenous Bacterial Communities and Long-Range Dust Inputs from the Upper Troposphere. PLoS ONE 2013, 8, e76440. [Google Scholar] [CrossRef]
  46. Stres, B.; Philippot, L.; Faganeli, J.; Tiedje, J.M. Frequent Freeze—Thaw Cycles Yield Diminished yet Resistant and Responsive Microbial Communities in Two Temperate Soils: A Laboratory Experiment. FEMS Microbiol. Ecol. 2010, 74, 323–335. [Google Scholar] [CrossRef] [PubMed]
  47. Rueden, C.T.; Schindelin, J.; Hiner, M.C.; DeZonia, B.E.; Walter, A.E.; Arena, E.T.; Eliceiri, K.W. ImageJ2: ImageJ for the next Generation of Scientific Image Data. BMC Bioinform. 2017, 18, 529. [Google Scholar] [CrossRef] [PubMed]
  48. Schneider, C.A.; Rasband, W.S.; Eliceiri, K.W. NIH Image to ImageJ: 25 Years of Image Analysis. Nat. Methods 2012, 9, 671–675. [Google Scholar] [CrossRef] [PubMed]
  49. Helms, J.R.; Stubbins, A.; Ritchie, J.D.; Minor, E.C.; Kieber, D.J.; Mopper, K. Erratum: Absorption Spectral Slopes and Slope Ratios as Indicators of Molecular Weight, Source, and Photobleaching of Chromophoric Dissolved Organic Matter. Limnol. Oceanogr. 2008, 53, 955–969. [Google Scholar] [CrossRef]
  50. Repinc, S.K.; Bizjan, B.; Budhiraja, V.; Dular, M.; Gostiša, J.; Brajer Humar, B.; Kaurin, A.; Kržan, A.; Levstek, M.; Arteaga, J.F.M.; et al. Integral Analysis of Hydrodynamic Cavitation Effects on Waste Activated Sludge Characteristics, Potentially Toxic Metals, Microorganisms and Identification of Microplastics. Sci. Total Environ. 2022, 806, 151414. [Google Scholar] [CrossRef]
  51. Zupanc, M.; Humar, B.B.; Dular, M.; Gostiša, J.; Hočevar, M.; Repinc, S.K.; Krzyk, M.; Novak, L.; Ortar, J.; Pandur, Ž.; et al. The Use of Hydrodynamic Cavitation for Waste-to-Energy Approach to Enhance Methane Production from Waste Activated Sludge. J. Environ. Manag. 2023, 347, 119074. [Google Scholar] [CrossRef]
  52. Blagojevič, M.; Zupanc, M.; Gostiša, J.; Stres, B.; Šmid, A.; Dular, M.; Slemenik Perše, L.; Gradišar Centa, U.; Bizjan, B.; Rak, G.; et al. The Impact of Radicals on Physicochemical Properties of Waste Activated Sludge during Hydrodynamic Cavitation Treatment. Ultrason. Sonochem. 2025, 115, 107291. [Google Scholar] [CrossRef]
  53. Hammer, Ø.; Harper, D.A.T.; Ryan, P.D. Past: Paleontological Statistics Software Package for Education and Data Analysis. Palaeontol. Electron. 2001, 4, 1–9. [Google Scholar]
  54. Mulec, J.; Oarga-Mulec, A.; Holko, L.; Pašić, L.; Kopitar, A.N.; Eleršek, T.; Mihevc, A. Microbiota Entrapped in Recently-Formed Ice: Paradana Ice Cave, Slovenia. Sci. Rep. 2021, 11, 1993. [Google Scholar] [CrossRef]
  55. Meyer, F.; Paarmann, D.; D’Souza, M.; Olson, R.; Glass, E.M.; Kubal, M.; Paczian, T.; Rodriguez, A.; Stevens, R.; Wilke, A.; et al. The Metagenomics RAST Server—A Public Resource for the Automatic Phylogenetic and Functional Analysis of Metagenomes. BMC Bioinform. 2008, 9, 386. [Google Scholar] [CrossRef]
  56. ter Braak, C.J.F.; Smilauer, P. Canoco Reference Manual and User’s Guide: Software for Ordination, Version 5.0; Microcomputer Power: Ithaca, NY, USA, 2012. [Google Scholar]
  57. Borcard, D.; Legendre, P.; Drapeau, P. Partialling out the Spatial Component of Ecological Variation. Ecology 1992, 73, 1045–1055. [Google Scholar] [CrossRef]
  58. Peres-Neto, P.R.; Legendre, P.; Dray, S.; Borcard, D. Variation Partitioning of Species Data Matrices: Estimation and Comparison of Fractions. Ecology 2006, 87, 2614–2625. [Google Scholar] [CrossRef] [PubMed]
  59. Kanduč, T.; Mori, N.; Kocman, D.; Stibilj, V.; Grassa, F. Hydrogeochemistry of Alpine Springs from North Slovenia: Insights from Stable Isotopes. Chem. Geol. 2012, 300–301, 40–54. [Google Scholar] [CrossRef]
  60. Menció, A.; Boy, M.; Mas-Pla, J. Analysis of Vulnerability Factors That Control Nitrate Occurrence in Natural Springs (Osona Region, NE Spain). Sci. Total Environ. 2011, 409, 3049–3058. [Google Scholar] [CrossRef]
  61. Shuster, E.T.; White, W.B. Seasonal Fluctuations in the Chemistry of Lime-Stone Springs: A Possible Means for Characterizing Carbonate Aquifers. J. Hydrol. 1971, 14, 93–128. [Google Scholar] [CrossRef]
  62. Pronk, M.; Goldscheider, N.; Zopfi, J. Dynamics and Interaction of Organic Carbon, Turbidity and Bacteria in a Karst Aquifer System. Hydrogeol. J. 2006, 14, 473–484. [Google Scholar] [CrossRef]
  63. Valentine, D.L. Adaptations to Energy Stress Dictate the Ecology and Evolution of the Archaea. Nat. Rev. Microbiol. 2007, 5, 316–323. [Google Scholar] [CrossRef]
  64. Stan-Lotter, H.; Fendrihan, S. Halophilic Archaea: Life with Desiccation, Radiation and Oligotrophy over Geological Times. Life 2015, 5, 1487–1496. [Google Scholar] [CrossRef]
  65. Jelen, M.; Mikoš, M.; Bezak, N. Karst Springs in Slovenia: Trend Analysis. Acta Hydrotech. 2020, 33, 1–12. [Google Scholar] [CrossRef]
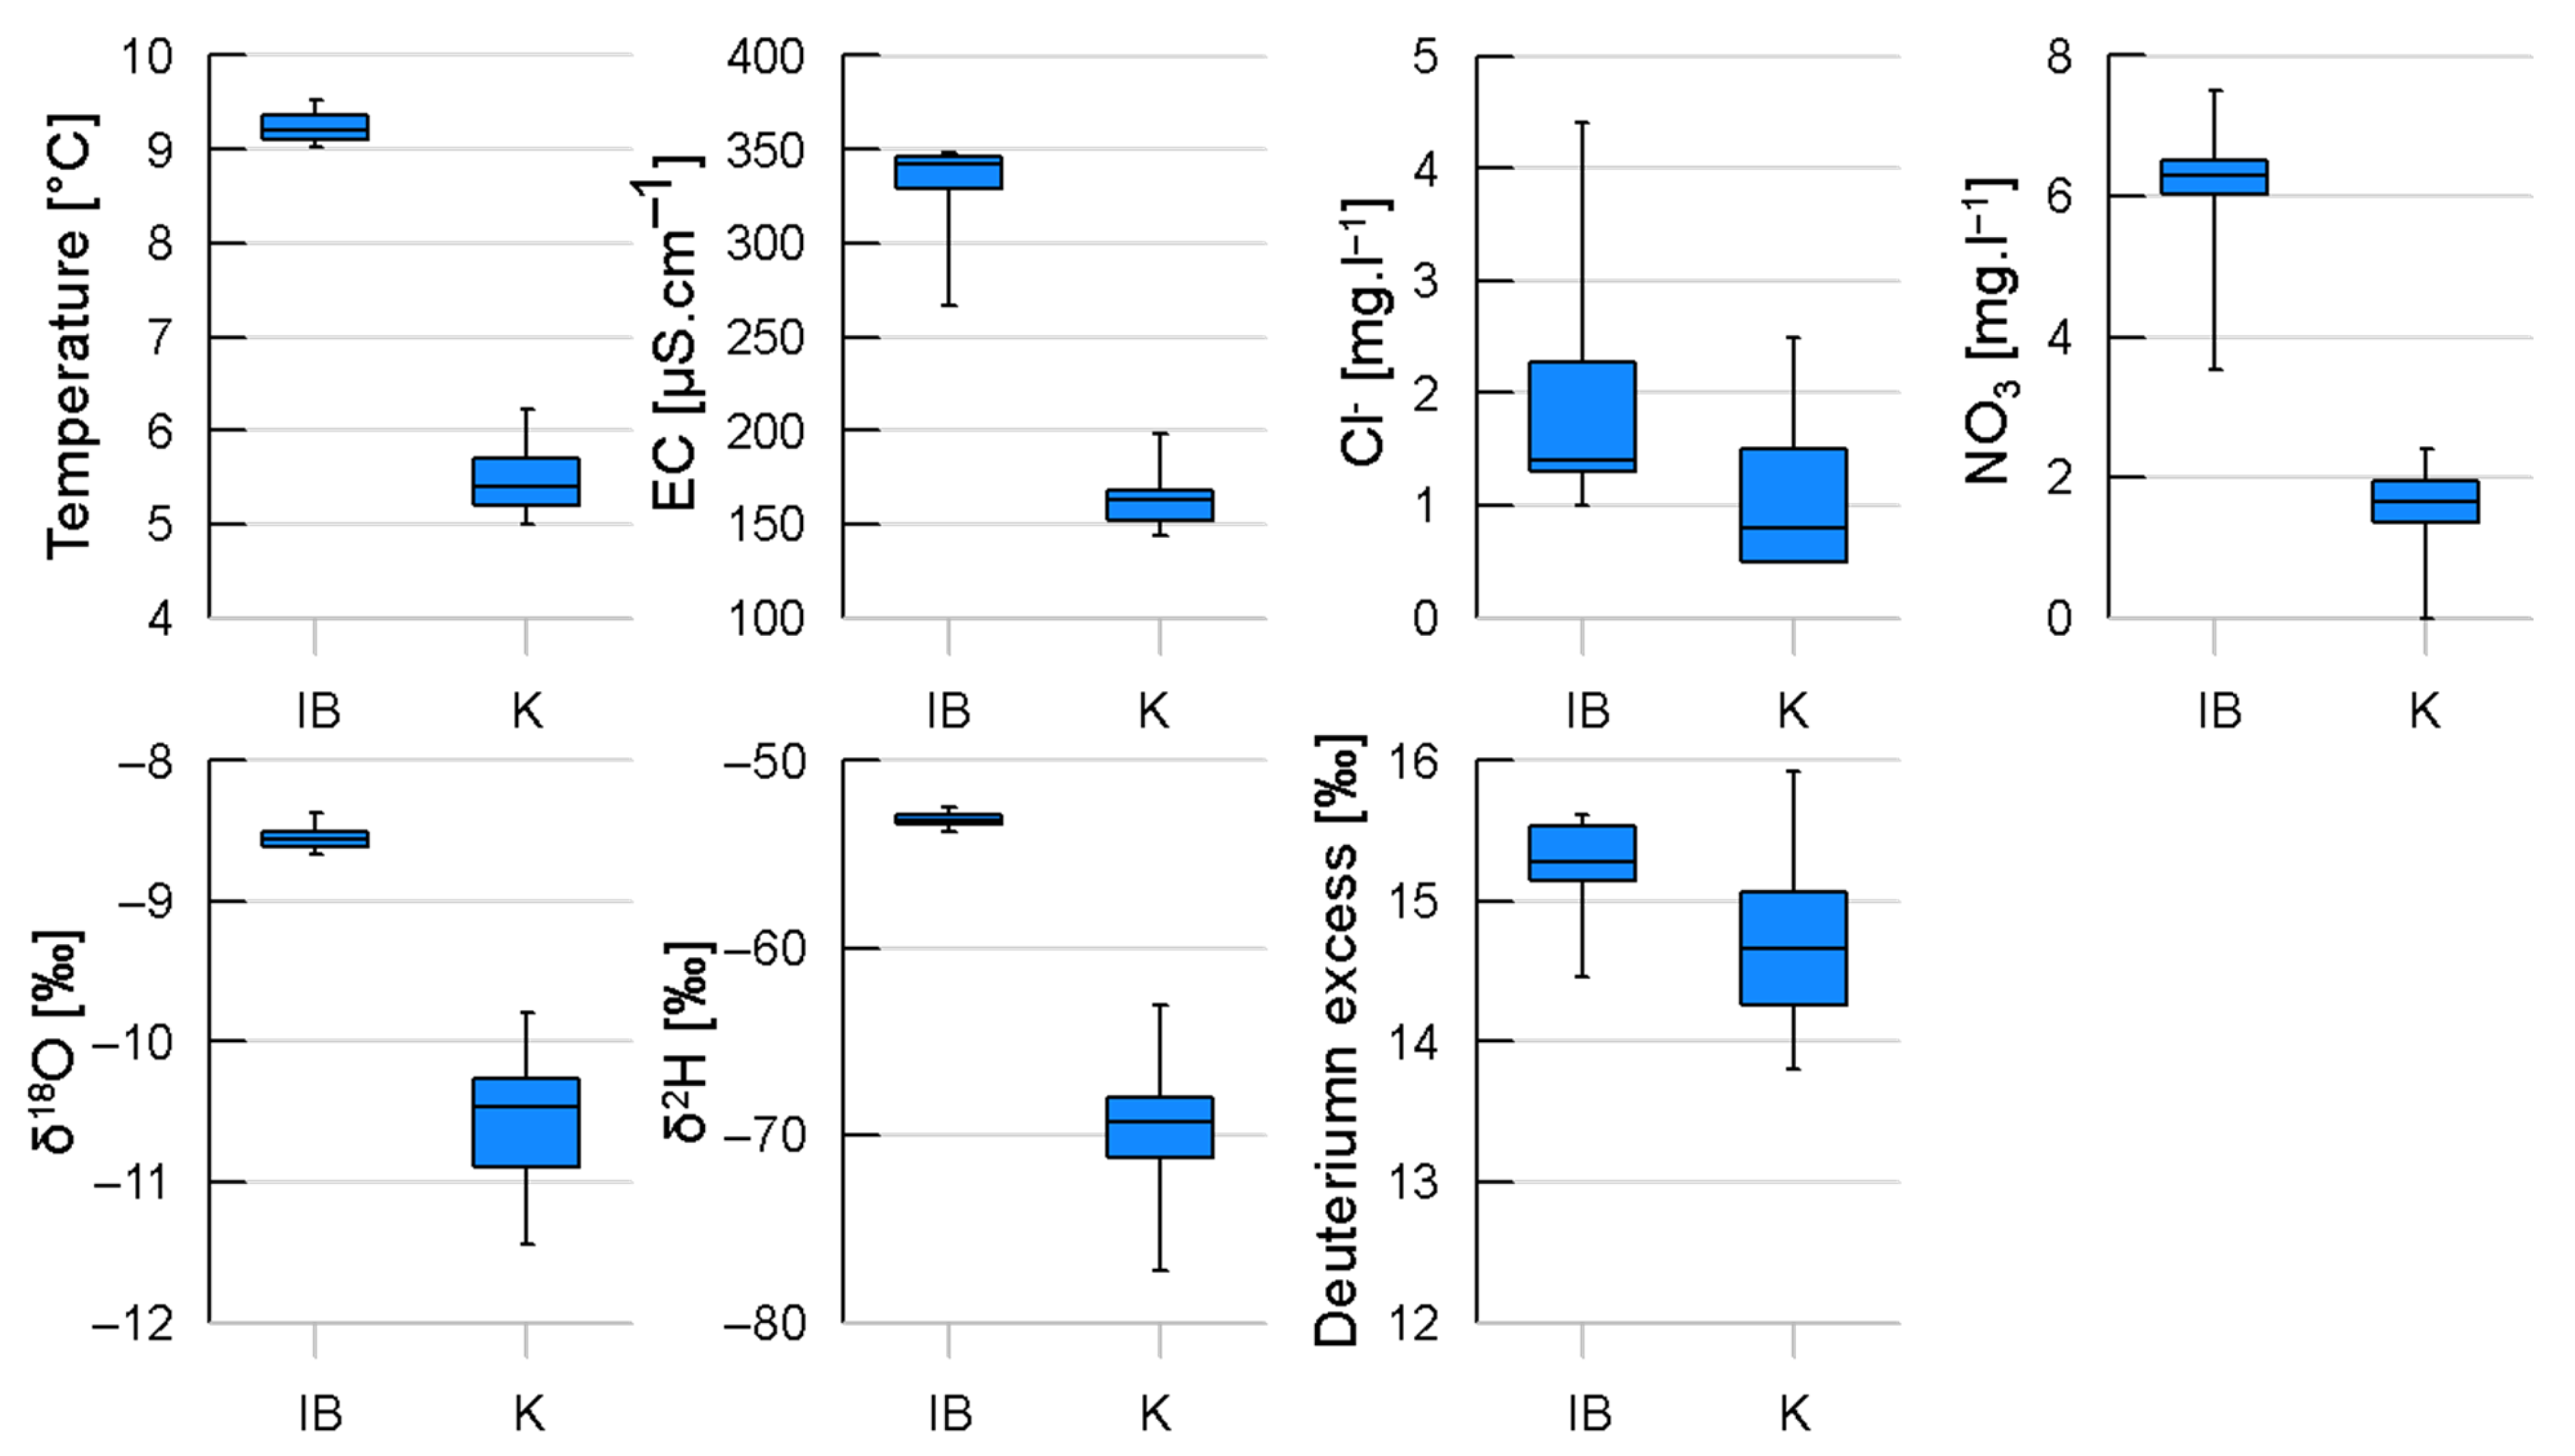
Figure 1. Selected physical and chemical properties of water that differed significantly between the Idrijska Bela borehole (IB) and Krajcarca spring (K).
Water 17 02402 g001
Figure 2. Seasonal trends in Ca2+ + Mg2+ and alkalinity concentrations (meq/L) at IB and K from May 2016 to June 2017.
Water 17 02402 g002
Figure 3. Isotopic composition of water in the Idrijska Bela borehole and Krajcarca spring (monthly data from May 2016 to June 2017) and precipitation in Postojna (January 2016–May 2017); the local meteoric water line (LMWL) for Postojna is based on monthly precipitation data from the period between August 2015 and October 2017.
Water 17 02402 g003
Figure 4. Seasonal patterns of discharge and total cell counts (TCC) in IB (left) and K (right) from May 2016 to June 2017.
Water 17 02402 g004
Figure 5. DNA concentrations recovered from different microbial size fractions at IB (left) and K (right) from May to January 2017.
Water 17 02402 g005
Figure 6. (AC) NMDS ordination microbiome information layers. (A) Archaeal communities (species level; Stress: 0.12 R2 Axis 1: 0.68 Axis 2: 0.64), (B) Bacterial communities (species level; Stress: 0.09 R2 Axis 1: 0.81 Axis 2: 0.28) and functional gene profiles (Subsystems function; Stress: 0.12 R2 Axis 1: 0.81 Axis 2: 0.16). Colors designate filter size fractions: blue and light blue—Idrijska Bela 0.45 µm and 0.1 µm size fractions, respectively; grey and light grey—Krajcarca 0.45 µm and 0.1 µm size fractions, respectively. Vectors designate environmental variables: Site; Season; Month; Week; t_weeks—time in weeks; t_days—time in days; Q—Discharge; Precip—Precipitation; pH; T—Temperature; EC—Electrical conductivity; DO—Dissolved oxygen; Ca—Calcium; Mg—Magnesium; WH—Water hardness; A—Alkalinity; Cl—Chloride; NO3—Nitrate; SO4—Sulphate; PO4—Phosphate; SF—Size fraction; DNA—DNA concentration; TCC—Total cell count; 18O, 2H—Stable isotopes; DE—Deuterium excess.
Water 17 02402 g006
Figure 7. Variation partitioning results showing the proportion of explained variation attributed to environmental variables (blue), seasonal effects (red), their shared contribution (green), and unexplained variation (yellow) for bacterial communities (species, genus, family) and functional profiles (subsystem function, level 3, level 2).
Water 17 02402 g007
Figure 8. DNA1 ratio (A260/230), representing the relative signal of DNA- and RNA-like compounds compared to carbohydrate-like substances. Values were calculated from seasonally averaged UV-Vis spectra and are reported as mean ± one standard deviation.
Water 17 02402 g008
Figure 9. Non-metric multidimensional scaling (nmMDS) plot with 95% confidence ellipses, based on aggregated multivariate UV-Vis characteristic indices (A230, A260, A280, A320, DNA1, DNA2, DNA3, A254, MWI, A300, E2/E3, E4/E6 and SumA250-450) (A,B) and multivariate metal content measurements (Alu, As, Cu, Zn, Cd, Cr, Mn, Mo, Ni, Pb, V and Fe) (C,D). (A) Location-based grouping of aggregated multivariate UV-Vis characteristic indices with Idrijska Bela samples (X, red ellipse) and Krajcarca samples (dots, black ellipse); (B) campaign-based grouping of aggregated multivariate UV-Vis characteristic indices with 2016 samples (X, red ellipse) and 2023 samples (dots, black ellipse). Stress = 0.3084; and R2 for Axis 1 and Axis 2 were 0.4576 and 0.397, respectively. (C) Location-based grouping of metal content measurements with Idrijska Bela (X, red ellipse) and Krajcarca (dots, black ellipse); (D) Campaign-based grouping of metal content measurements with 2016 samples (dots, red ellipse) and 2023 samples (X, black ellipse). Stress = 0.14 (location), 0.10 (year); R2 for Axis 1 = 0.56 (location), 0.9 (year); R2 for Axis 2 = 0.11 (location), 0.37 (year).
Water 17 02402 g009
Table 1. Physical and chemical water parameters for IB and K. The results represent average values of measurements and their ranges recorded within the analyzed timeframe. Overall, the variability in results from the standard methods reported therein remained below 10% standard deviation [44].
Parameter (Unit)IBK
MeanRangeMeanRange
Temperature (°C)9.29.0–9.55.45.0–6.2
pH7.87.6–8.08.27.9–9.0
Electrical conductivity (µS cm−1)335* (267) 326–348164149–198
Dissolved oxygen
(mg L−1)
11.310.5–12.912.011.7–13.0
Ca (mg L−1)43.038.9–48.7 (64.3) *27.726.1–31.9
Mg (mg L−1)18.7* (3.5) 16.8–21.34.21.7–8.2
Water hardness (CaCO3 mg L−1)184.6175.2–193.786.275.6–106.6
Alkalinity
(CaCO3 mg L−1)
188.5177.7–207.787.277.6–108.6
Cl (mg L−1)2.01.0–4.41.10.5–2.5
NO3 (mg L−1)6.13.5–7.51.60–2.4
SO42− (mg L−1)0.90–2.61.00–3.3
PO43− (mg L−1)0.040–0.02 (0.5) *0.010–0.05
δ18O (‰)−8.55−8.67–−8.37−10.53−11.44–−9.79
δ2H (‰)−53.15−53.8–−52.5−69.6−77.2–−63.1
Deuterium excess (‰)15.2714.46–15.6214.6513.80–15.92
Note(s): * value in brackets is standing out.
Table 2. Adjusted explained variation (RDA) and key environmental drivers of archaeal, bacterial, and functional gene metagenomic profiles across taxonomic and functional gene levels. WH = Water Hardness, SF = Size Fraction, A = Alkalinity * low significance after adjustment.
Community/FunctionLevelAdjusted Explained Variation (%)Key Environmental Drivers
ArchaeaSpecies24.2* A, WH, Ca2+, Mg2+, SEC, T, Site
Genus21.2Same
Family29.4Same
BacteriaSpecies57.0Season, SF, Mg2+, WH, A, SEC, NO3, Site, T, DNA, Ca2+, 18O
Genus67.2Same
Family70.8Same except SF
Functional PotentialSubsystems Function46.4Mg2+. WH, A, SEC, SF, Season, Site, Ca2+, NO3, T, 18O
Subsystems Level 341.7Same
Subsystems Level 245.0Same
Disclaimer/Publisher’s Note: The statements, opinions and data contained in all publications are solely those of the individual author(s) and contributor(s) and not of MDPI and/or the editor(s). MDPI and/or the editor(s) disclaim responsibility for any injury to people or property resulting from any ideas, methods, instructions or products referred to in the content.