Article

Scale and Reasons for Changes in Chemical Composition of Waters During the Spring Freshet on Kolyma River, Arctic Siberia

1
Pacific Geographical Institute, Far Eastern Branch Russian Academy of Sciences, 7, Radio Str., 690041 Vladivostok, Russia
2
Far Eastern Geological Institute, Far Eastern Branch Russian Academy of Sciences, 159, 100-let Vladivostoka, 690022 Vladivostok, Russia
*
Author to whom correspondence should be addressed.
Water 2025, 17(16), 2400; https://doi.org/10.3390/w17162400
Submission received: 2 July 2025 / Revised: 12 August 2025 / Accepted: 12 August 2025 / Published: 14 August 2025

Abstract

The information on the seasonal variability of the chemical composition of the Arctic rivers is necessary for the proper assessment of the status of river runoff and the influence of anthropogenic and natural factors. Spring freshet is an especially important period for the Arctic rivers with a sharp maximum of water discharge. The Kolyma River is the least studied large river with a basin located solely in the permafrost zone. The change in the concentration of dissolved organic carbon (DOC), major, trace, and rare earth (RE) elements was studied at the peak and waning of the spring freshet of 2024 in the lower reaches of the Kolyma River. The concentration of elements was determined in filtrates <0.45 μm and in suspended solids > 0.45 μm. The content of coarse colloids (0.05–0.45 μm) was estimated by the intensity of dynamic light scattering (DLS). It was shown that the freshet peak is characterized by a minimal specific conductivity, concentration of major cations, and chemical elements migrating mainly in solution (Li, Sr, and Ba). During the freshet decline, the concentration of these elements increases with dynamics depending on the water exchange. The waters from the Kolyma River main stream have a maximal content of coarse colloids and concentration of <0.45 μm forms of hydrolysates (Al, Ti, Fe, Mn, REEs, Zr, Y, Sc, and Th), DOC, P, and heavy metals (Cu, Ni, Cd, and Co) at the freshet peak. A decrease of 8–10 times for hydrolysates and coarse colloids (0.05–0.45 μm) and of 3–6 times for heavy metals was observed at the freshet waning during the first half of June. This indicates a large-scale accumulation of easy soluble forms of hydrolysates, DOC, and heavy metals in the seasonal thawing topsoil layer on the catchment upstream in the previous summer, with a flush out of these elements at the freshet peak of the current year. In the large floodplain watercourse Panteleikha River, the change in concentration of major cations and REEs, Zr, Y, Sc, and Th at the freshet is less accented compared with the Kolyma River main stream due to a slower water exchange. Yet, <0.45 μm forms of Fe, Mn, Co, As, V, and P show an increase of 4–6 times in the Panteleikha River in the second half of June compared with the freshet peak, which indicates an additional input of these elements from the thawing floodplain landscapes and bottom sediments of floodplain watercourses. The concentration of the majority of chemical elements in suspended matter (>0.45 μm) of the Kolyma River is rather stable during the high-water period. The relative stability in the chemical composition of the suspended solids means that the content of the suspension and not its composition is the key to the share of dissolved and suspended forms of chemical elements in the Kolyma River runoff.

1. Introduction

The study of the variability in the chemical composition of the Arctic rivers attracts the attention of researchers due to the response of the rivers to climate change and other natural and anthropogenic factors. The potential impact of river runoff on sedimentation and biogeochemical processes in the Arctic Ocean is another reason for interest in the Arctic rivers [1,2,3]. Initially, the main emphasis was placed on the study of organic matter depending on seasonal, interannual, and regional variability of hydrological, landscape, and climatic factors. As a result, a rather complete description of the behavior of dissolved organic carbon (DOC) in large Arctic rivers, including the Kolyma River, has been obtained [1,2,3]. Later, large-scale studies took place to study the trace element compositions of most great Arctic rivers [4,5,6,7,8,9,10]. In particular, review works have been published showing regional features of the concentration level of dissolved/colloidal forms (filtrates <0.45 μm) for a number of chemical elements, including trace elements, in the rivers of the watersheds of all Arctic seas [7,11,12]. For the rivers of the Northern Dvina, Pechora, Ob, and Yenisei basins, there are plenty of data on the content of colloidal forms of various sizes for major and trace chemical elements obtained by ultrafiltration and dialysis methods [4,5,9,10,13,14].
Until recently, one of the least studied rivers in terms of trace element compositions was the Kolyma River, the largest river at the East Siberian Sea basin, and the only large river in the Arctic zone with the catchment entirely located in the permafrost area [2]. Last decade, the hydrological features, the average content of major ions and dissolved forms (<0.45 μm) of trace elements, have been reported for the lower reaches of the Kolyma River for the base flow period of July–August 2019–2020 [7,15]. The notable seasonal variability, even within the base flow regime, was mentioned [11].
However, the chemical composition of waters at the peak of the spring flood and the dynamics of its change during the decline of the freshet for the Kolyma River have not been characterized. At the same time, the special role of the spring flood period in the formation of the runoff of Arctic rivers was shown firstly on the example of medium size Alaskan rivers where >30% of annual runoff of dissolved Fe, Zn, Cu, Pb, and DOC, and 80% of suspended solids were carried out in 3–12 days [8]. The significant influence of spring freshet was shown for the nutrients in the biggest Alaskan river—the Yukon [16]. For the Kolyma and other largest rivers of the Russian Arctic, the seasonality of the removal of nutrients and DOC was also characterized [1,2]. The study of the seasonality for the trace elements runoff by Arctic rivers within Siberia and Europe is not so complete and mainly concerns the rivers of the Ob, Yenisei, Pechora, Taz, and Northern Dvina basins [5,9,10,17,18] but not the Kolyma River. Another gap existing in the study of the Kolyma River is an absence of information on the colloidal forms, including the coarse colloids, in the composition of filtrates <0.45 μm of river waters, although the leading role of colloids in the migration of many chemical elements was clearly shown for other Arctic rivers [4,6]. Moreover, there is practically no data on the chemical composition of the suspended matter in the Kolyma River. The present work is aiming to fill the gaps.
This study aims to investigate the following: (1) firstly, we characterize the changes in the concentration of the sum of dissolved and colloidal forms of major and trace elements in the waters of the lower reaches of the Kolyma River main stream and its tributaries based on the analysis of filtrates <0.45 μm. (2) Secondly, we determine possible causes of changes in the chemical composition of watercourses during the spring freshet, including the influence of the content of coarse (0.05–0.45 μm) colloids estimated by the DLS (dynamic light scattering) method, as well as variations in the DOC content. (3) Next, we evaluate the chemical composition of suspended matter and suspended forms of migration of chemical elements in the waters of the lower reaches of the Kolyma River. (4) Finally, we compare the chemical composition of waters and suspended matter of the Kolyma River during the spring flood with other rivers.

2. Materials and Methods

2.1. Study Area
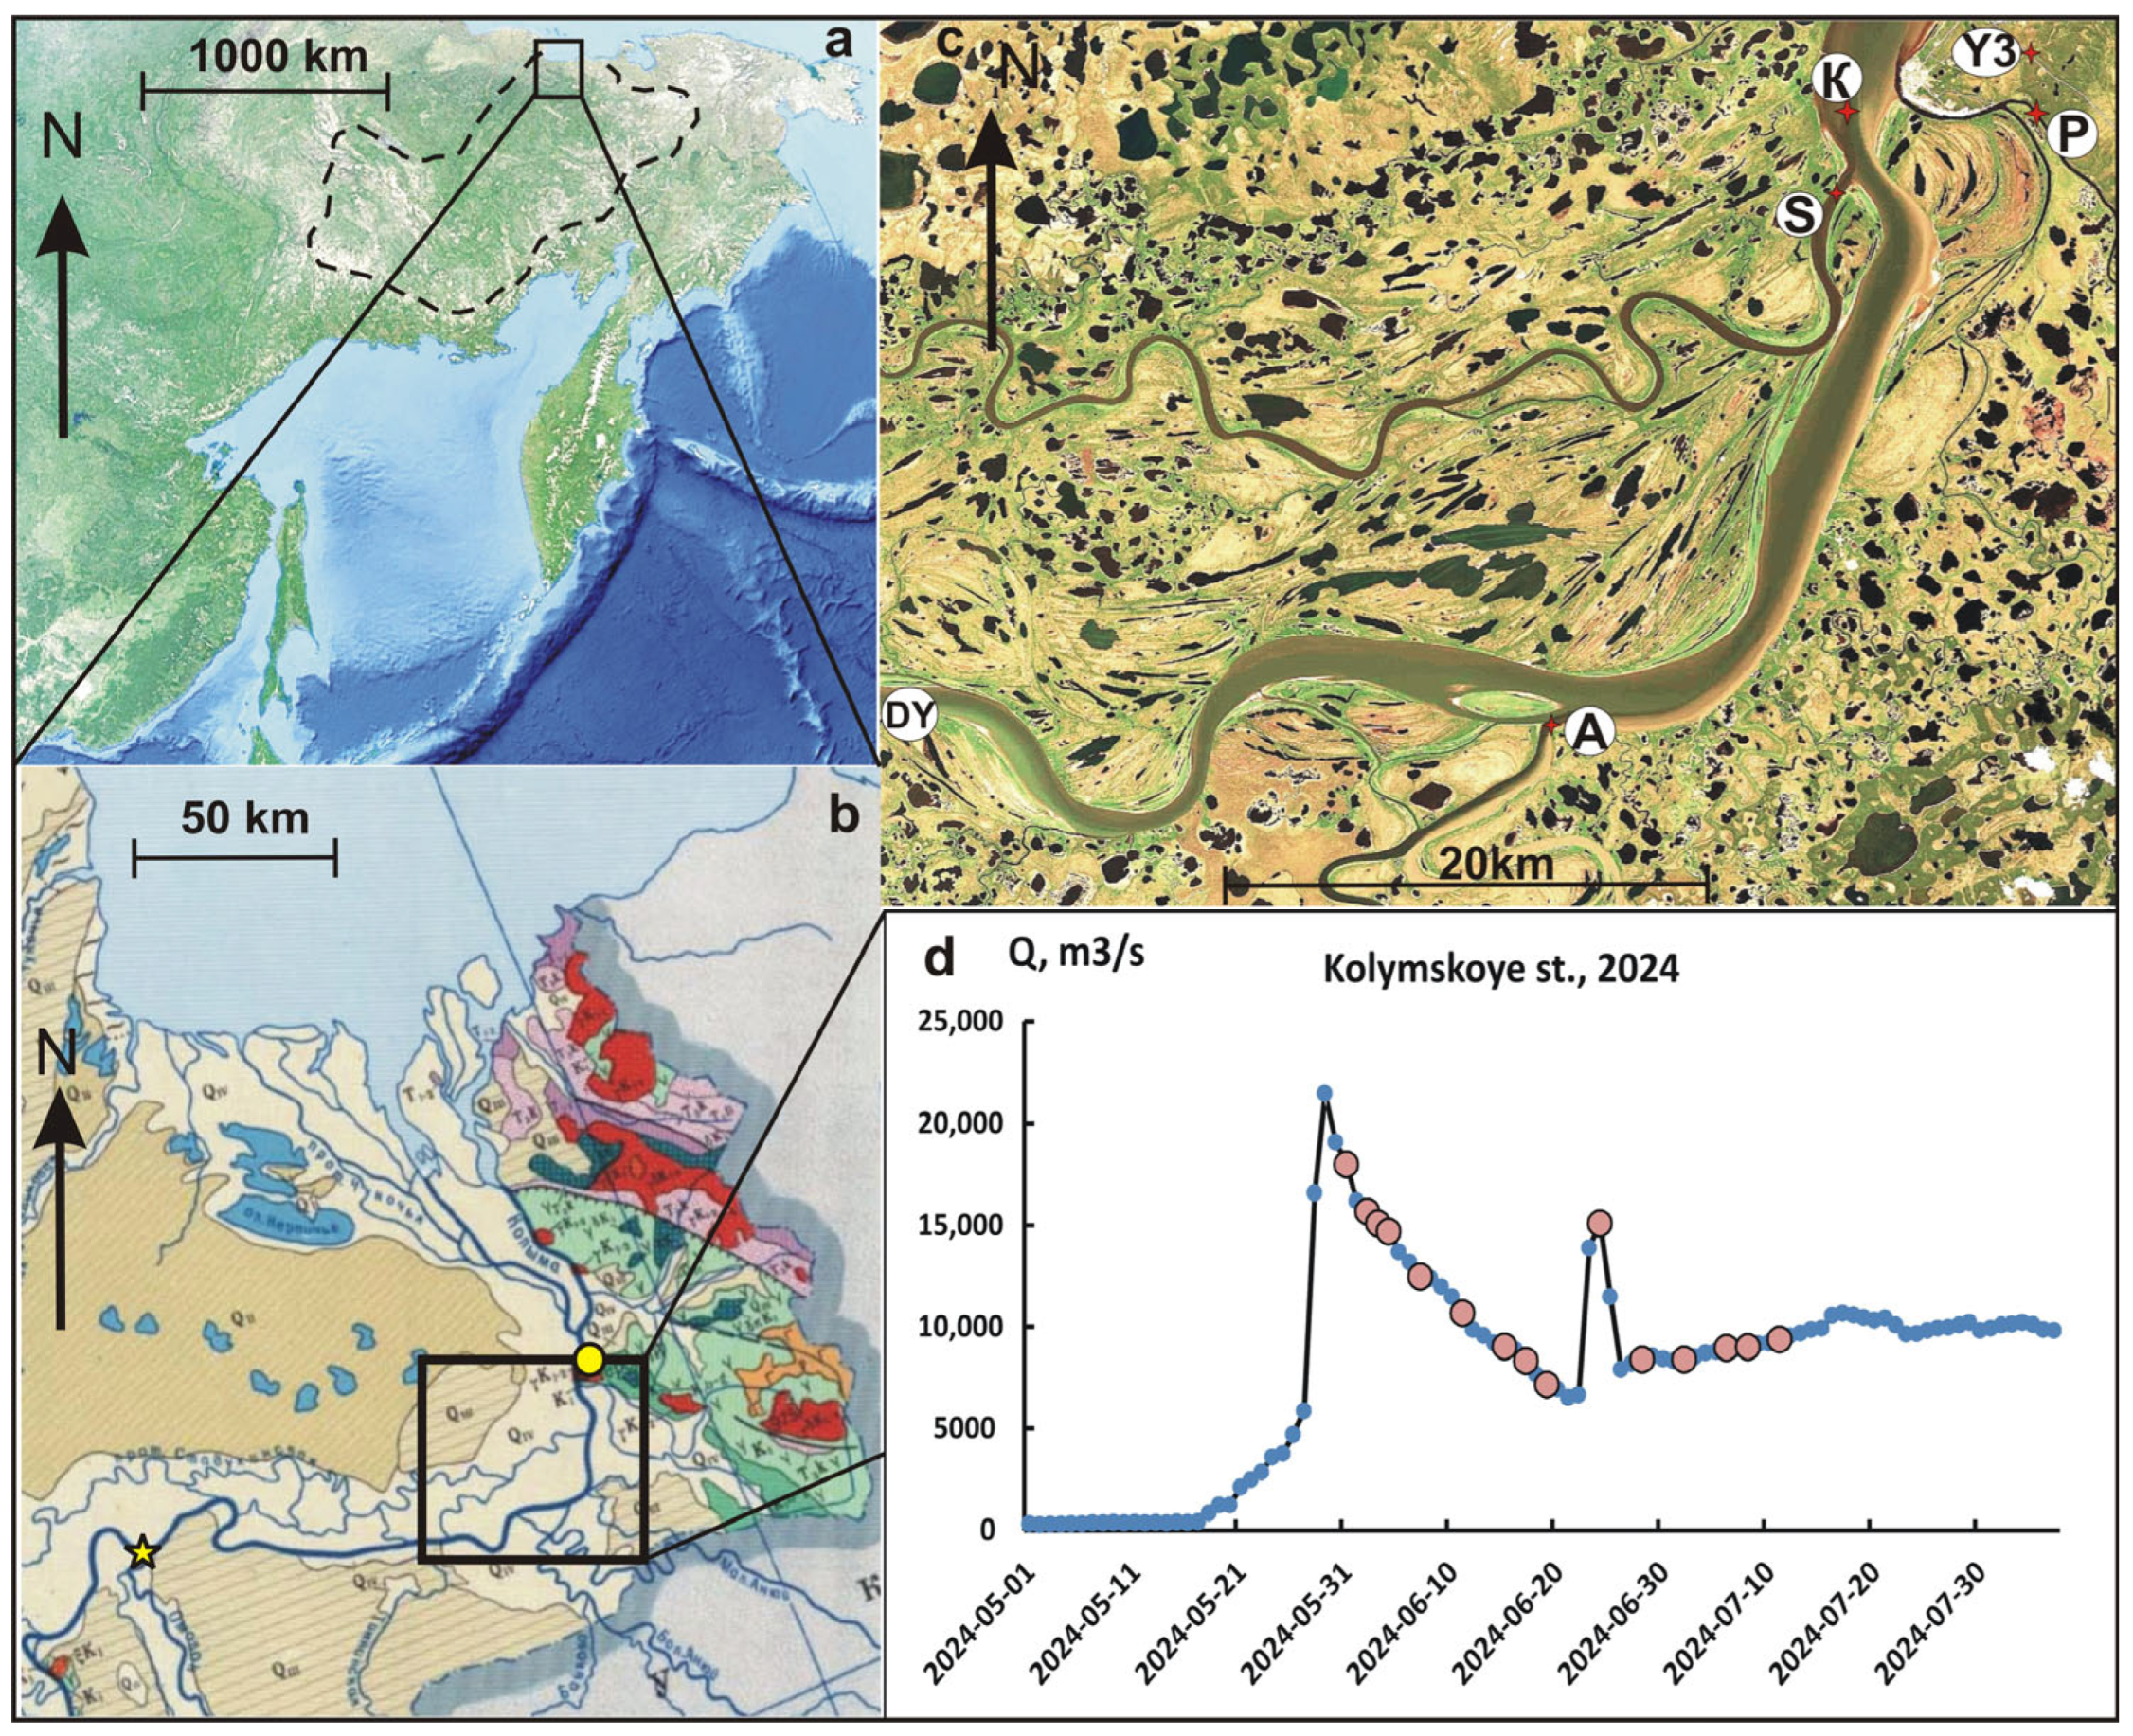
The Kolyma River, inputting into the East Siberian Sea, is 2130 km long and has a basin area of 647,000 km2 and is one of the six largest rivers in the Arctic Basin [2]. The upper reaches of the river are located in the Magadan Region on the Okhotsk-Kolyma Plateau; the lower reaches are in Yakutia, mainly in the northeastern part of the Kolyma Lowland, where it adjoins the Yukaghir Plateau and the spurs of the Anyui Range. Therefore, the left tributaries of the lower Kolyma River drain lowland tundra–lake landscapes, and the right tributaries, including the largest Anyui River and Omolon River with basins of more than 100,000 km2, drain low-mountain taiga landscapes. Accordingly, the geological structure of the substrate of the entire left bank is represented by a complex of Quaternary deposits (QIII–QIV), and on the right bank, Quaternary deposits are distributed only within the river floodplains, which reach a width of 20–22 km, as well as foothills, where they are located up to 130–150 m elevation. The main part of the permafrost is represented by icy late Pleistocene loess-rich loams of the Ice Complex or the Yedoma, with a powerful system of polygonal wedge ices [19]. Low-mountain areas are composed of a complex of Cretaceous (K) and Triassic (T) sedimentary and effusive rocks, broken through by numerous Cretaceous intrusions of granitoids (γK) (Figure 1b). As already noted, a feature of the Kolyma River is the presence of permanent permafrost with a thickness of 150–200 m over the entire catchment area. The thickness of the seasonal thawing layer in the lower Kolyma River floodplain is 0.4–0.8 m [19,20]. The existence of constant talik (unfrozen groundwater zone) under the Kolyma River lower reaches main stream has not been proven, though it cannot be excluded [21].
The climate of the lower Kolyma basin is sharply continental, subarctic, with very cold winters and relatively warm summers: the average monthly temperature in January is −33 °C, the average monthly temperature in July is 13.2 °C, and the average annual temperature is −9.9 °C [19]. The annual precipitation is 240 mm, most of it in the form of rain in the summer. Water discharge in the lower reaches of the Kolyma River is monitored at the Kolymskoye gauging station, which covers 64% of the catchment area and is located 164 km upstream of the Cherskiy settlement and 283 km upstream of the river mouth. The water regime of the Kolyma River is characterized by a minimum discharge of 300–1000 m3/s during the freeze-up period from October to May, a spring freshet of 15,000–30,000 m3/s in late May–early June, gradually decreasing to 7000 m3/s at the end of June, and then the discharge fluctuates from 5000 to 15,000 m3/s depending on the presence or absence of summer rain floods [22]. A similar seasonal pattern of water discharge was observed during our study in 2024 (Figure 1d).
Figure 1. (a) Location of the study area in the northeast of the Russian Federation with boundary of Kolyma River basin marked by dash line; (b) diagram of the geological structure of the lower Kolyma River basin, a yellow star marks Kolymskoye gauging post, and a yellow circle marks the Cherskiy settlement; (c) satellite image from Sentinel 2 MSI 24 June 2024 with sampling points in the lower reaches of the Kolyma in June–July 2024: K—Kolyma, P—Panteleikha, Y3—Rodinka creek, A—Anyui, S—Stadukhinskaya Protoka, and DY—Duvanny Yar; and (d) change in water discharge at the Kolymskoye gauging post from 1 May to 8 August 2024 [22], marked by small blue circles; dates of sampling in this study are marked by pink circles. (For interpretation of the references to color in all figures and in the legends, the reader is referred to the web version of this article).
Water 17 02400 g001
We studied the period from late May to mid-July 2024 with sampling from 1 June to 12 July at approximately the same time, around 10 am, at the two permanent stations—directly in the middle of the main channel of the Kolyma River (K, ten times), and in the Panteleikha River (P, ten times)—the watercourse draining the Kolyma floodplain. There is an abundance of thermokarst lakes at the lower reaches and spurs of the Anyui Ridge in the upper reaches of the Panteleikha River. Judging by determinations made in August 2019, the water discharge of the Panteleikha River was 22–34 m3/s [15]. In addition, at the beginning and end of the study in 2024, samples were taken from the Rodinka creek (Y3, three times)—the right tributary of the Panteleikha River, draining seasonally and thawing loess Pleistocene deposits (yedoma). In early June, the Anyui River and the Stadukhinskaya Protoka River—the right and left tributaries of the lower reaches of the Kolyma—were also sampled. Wedge ice was collected from permafrost deposits exposed in the loose cliffs on the right bank of the Kolyma River at the Duvanny Yar location (Ice Complex key section) [19] (Figure 1c). The Anyui River drains mainly in its low mountain and in its upper reaches, mid-mountain high-boreal taiga landscapes of the Anyui Ridge. The Stadukhinskaya Protoka River flows through the eastern part of the Kolyma Lowland, covered with tundra landscapes with a large number of thermokarst lakes (Figure 1c).
To assess the place of the 2024 freshet in the overall pattern of seasonal and interannual variability of the water regime at the lower reaches of the Kolyma River, data were used on temperature, specific conductivity, and DOC content in waters in the Kolyma main stream, measured with equipment from the North-East Scientific Experimental Station of the PGI FEBRAS, at the Cherskiy settlement, and water discharges at the Kolymskoye gauging post for the period from May to October 2014 and 2015 [22].
From the remote sensing data for 24 June 2024 (satellite image from Sentinel 2 MSI) (Figure 1c), it is obvious that, at least in terms of suspended matter content, the Kolyma River runoff structure is spatially heterogeneous: the tributaries contain different amounts of suspended matter compared with the main river stream, and this heterogeneity persists at a distance of several tens of kilometers after the inflow of the tributaries (Figure 1c). It forces us to be cautious at the extrapolating point of the sampling data when calculating the fluxes of chemical elements and compounds from the Kolyma River runoff, and in this study, the changes in the concentrations of chemical elements will mainly be discussed.

2.2. Sampling, Processing, and Analysis

Water samples were collected from a boat slowly moving upstream, into pre-washed 2-L polyethylene containers after 3–4 times rinsing with the water being collected. Disposable plastic gloves were used during the sampling and processing. Specific conductivity, temperature, and pH were measured at the sampling site with a YSI probe. Within 1 h after sampling, the sample was divided into several aliquots after thorough mixing. An aliquot of 200–300 mL was filtered through a Pall GWV capsule filter with a pore size of 0.45 μm. The first 150–250 mL were used to wash the capsule filter and tubes; the remaining 50 mL of the filtrate was collected in pre-washed polypropylene 30 and 10 mL test tubes with sealed plastic caps for subsequent determination of the elemental composition and analysis of the content of coarse colloids by the intensity of dynamic light scattering (DLS). The second 50 mL aliquot was filtered through a sterile Millipore syringe filter (0.45 μm cellulose acetate membrane) into pre-washed 30 and 10 mL tubes. Another 0.5–1.0 L subsample of aliquot was filtered through a pre-weighed 47 mm Millipore Durapore PVDF 0.45 μm membrane filter for subsequent gravimetric determination of the suspended matter content, and its complete digestion by a mixture of HF and HNO3 acids upon heating and determination of the elemental composition of the suspended solids by ICP-MS. Filtrates of 18 Mom deionized water were used as blank samples. All filtrates were stored in a refrigerator at a temperature of 2–4 °C. Upon returning to the stationary laboratory, the filtrates after syringe and capsule filters were acidified with twice-distilled HNO3 to pH = 1 to determine the concentration of major cations and trace elements by ICP-MS. In all filtrates, as well as in the original unfiltered samples, the intensity of DLS was determined to assess the content of coarse colloids (0.05–0.45 μm).
The concentration of chemical elements in the acidified filtrates and in the digested suspended matter was determined by the ICP-MS method on an Agilent-7700 device (Santa Clara, CA, USA) at the Collective Use Center of the FEGI FEBRAS. Analytical detection limits were 0.1–1 ng/L for Cd, Ba, Y, Zr, Nb, REEs, Hf, Pb, Th, U, Ga, Ge, Rb, and Sr; 10 ng/L for Ti, V, P, Cr, Mn, Co, Ni, Cu, Zn, and As; and 100 ng/L for Fe, Al, Na, K, Ca, and Mg. Reproducibility was determined by analyzing the parallel samples that differed by no more than 5%. Accuracy was determined by analyzing the SRLS-6 standard sample for water and the fully digested BCSS-2 standard for filters with suspended solids. The discrepancy with the passport data did not exceed 15–18%. The concentration of chemical elements in the filtrates after capsule filters and after syringe filters of 0.45 μm was interpreted as the content of the sum of dissolved and colloidal forms <0.45 μm. The data from blank experiments were usually insignificant compared to the results of the samples. At the same time, results for Cr and Pb in some number of samples were in an order of μg/L that is obviously higher than published data for Kolyma River [7,11] and world’s rivers’ average. Accidental contamination at sampling and/or filtration was suggested as a reason, because other field campaigns with the same methodology gave results for dissolved Pb and Cr lower values of one to two orders of magnitude [23], which is close to the reliable published data. Data on Pb and Cr were excluded from further discussion in this paper. The concentration of dissolved organic carbon (DOC) was determined in filtrates after 0.45 μm capsule filters by high-temperature catalytic oxidation on a Shimadzu TOC device with an accuracy of 2% and a detection limit of 0.1 mgC/L.
The content of coarse colloids (0.05–0.45 μm) in filtrates, as well as suspended particles smaller than 10 μm in unfiltered samples, was assessed by the intensity of the dynamic light scattering (DLS) method [24] on a Photocor Compact Z device (Russia). Experiments with suspensions of polymethylmethacrylate (PMME) particles of 0.08–2.0 μm in size and 1–50 mg/L in content have shown that the DLS intensity is proportional to the mass concentration of particles [24]. This allows us to consider the DLS intensity of 0.45 μm filtrates as an estimate of the content of coarse colloids (0.05–0.45 μm). The value of 0.05 μm is assumed as the lower size limit of coarse colloids determined by the DLS intensity in river water filtrates. Smaller colloidal particles (down to 0.003–0.005 μm) can be determined by DLS at a concentration of more than 100 mg/L [25], which is not realistic for any river water. That is, the sensitivity of the DLS is not enough to reliably register the content of particles smaller than 0.05 microns at the concentration observed in river waters.
All processing and analytical works, except for the ICP-MS analysis, were carried out at the Center for Collective Use of the PGI FEBRAS. Statistical data processing was carried out by the PAST ver. 4.05 package [26]. Due to the restricted number of observations and the often abnormal distribution, nonparametric criteria were mainly used: the Mann–Kendall test for assessing the significance of the trends, and the Mann–Whitney test for assessing the difference in the medians. Correlation was assessed by Pearson and Spearman coefficients. A significance level of 0.05 was used if otherwise not marked.

3. Results

3.1. General Hydrochemical Parameters
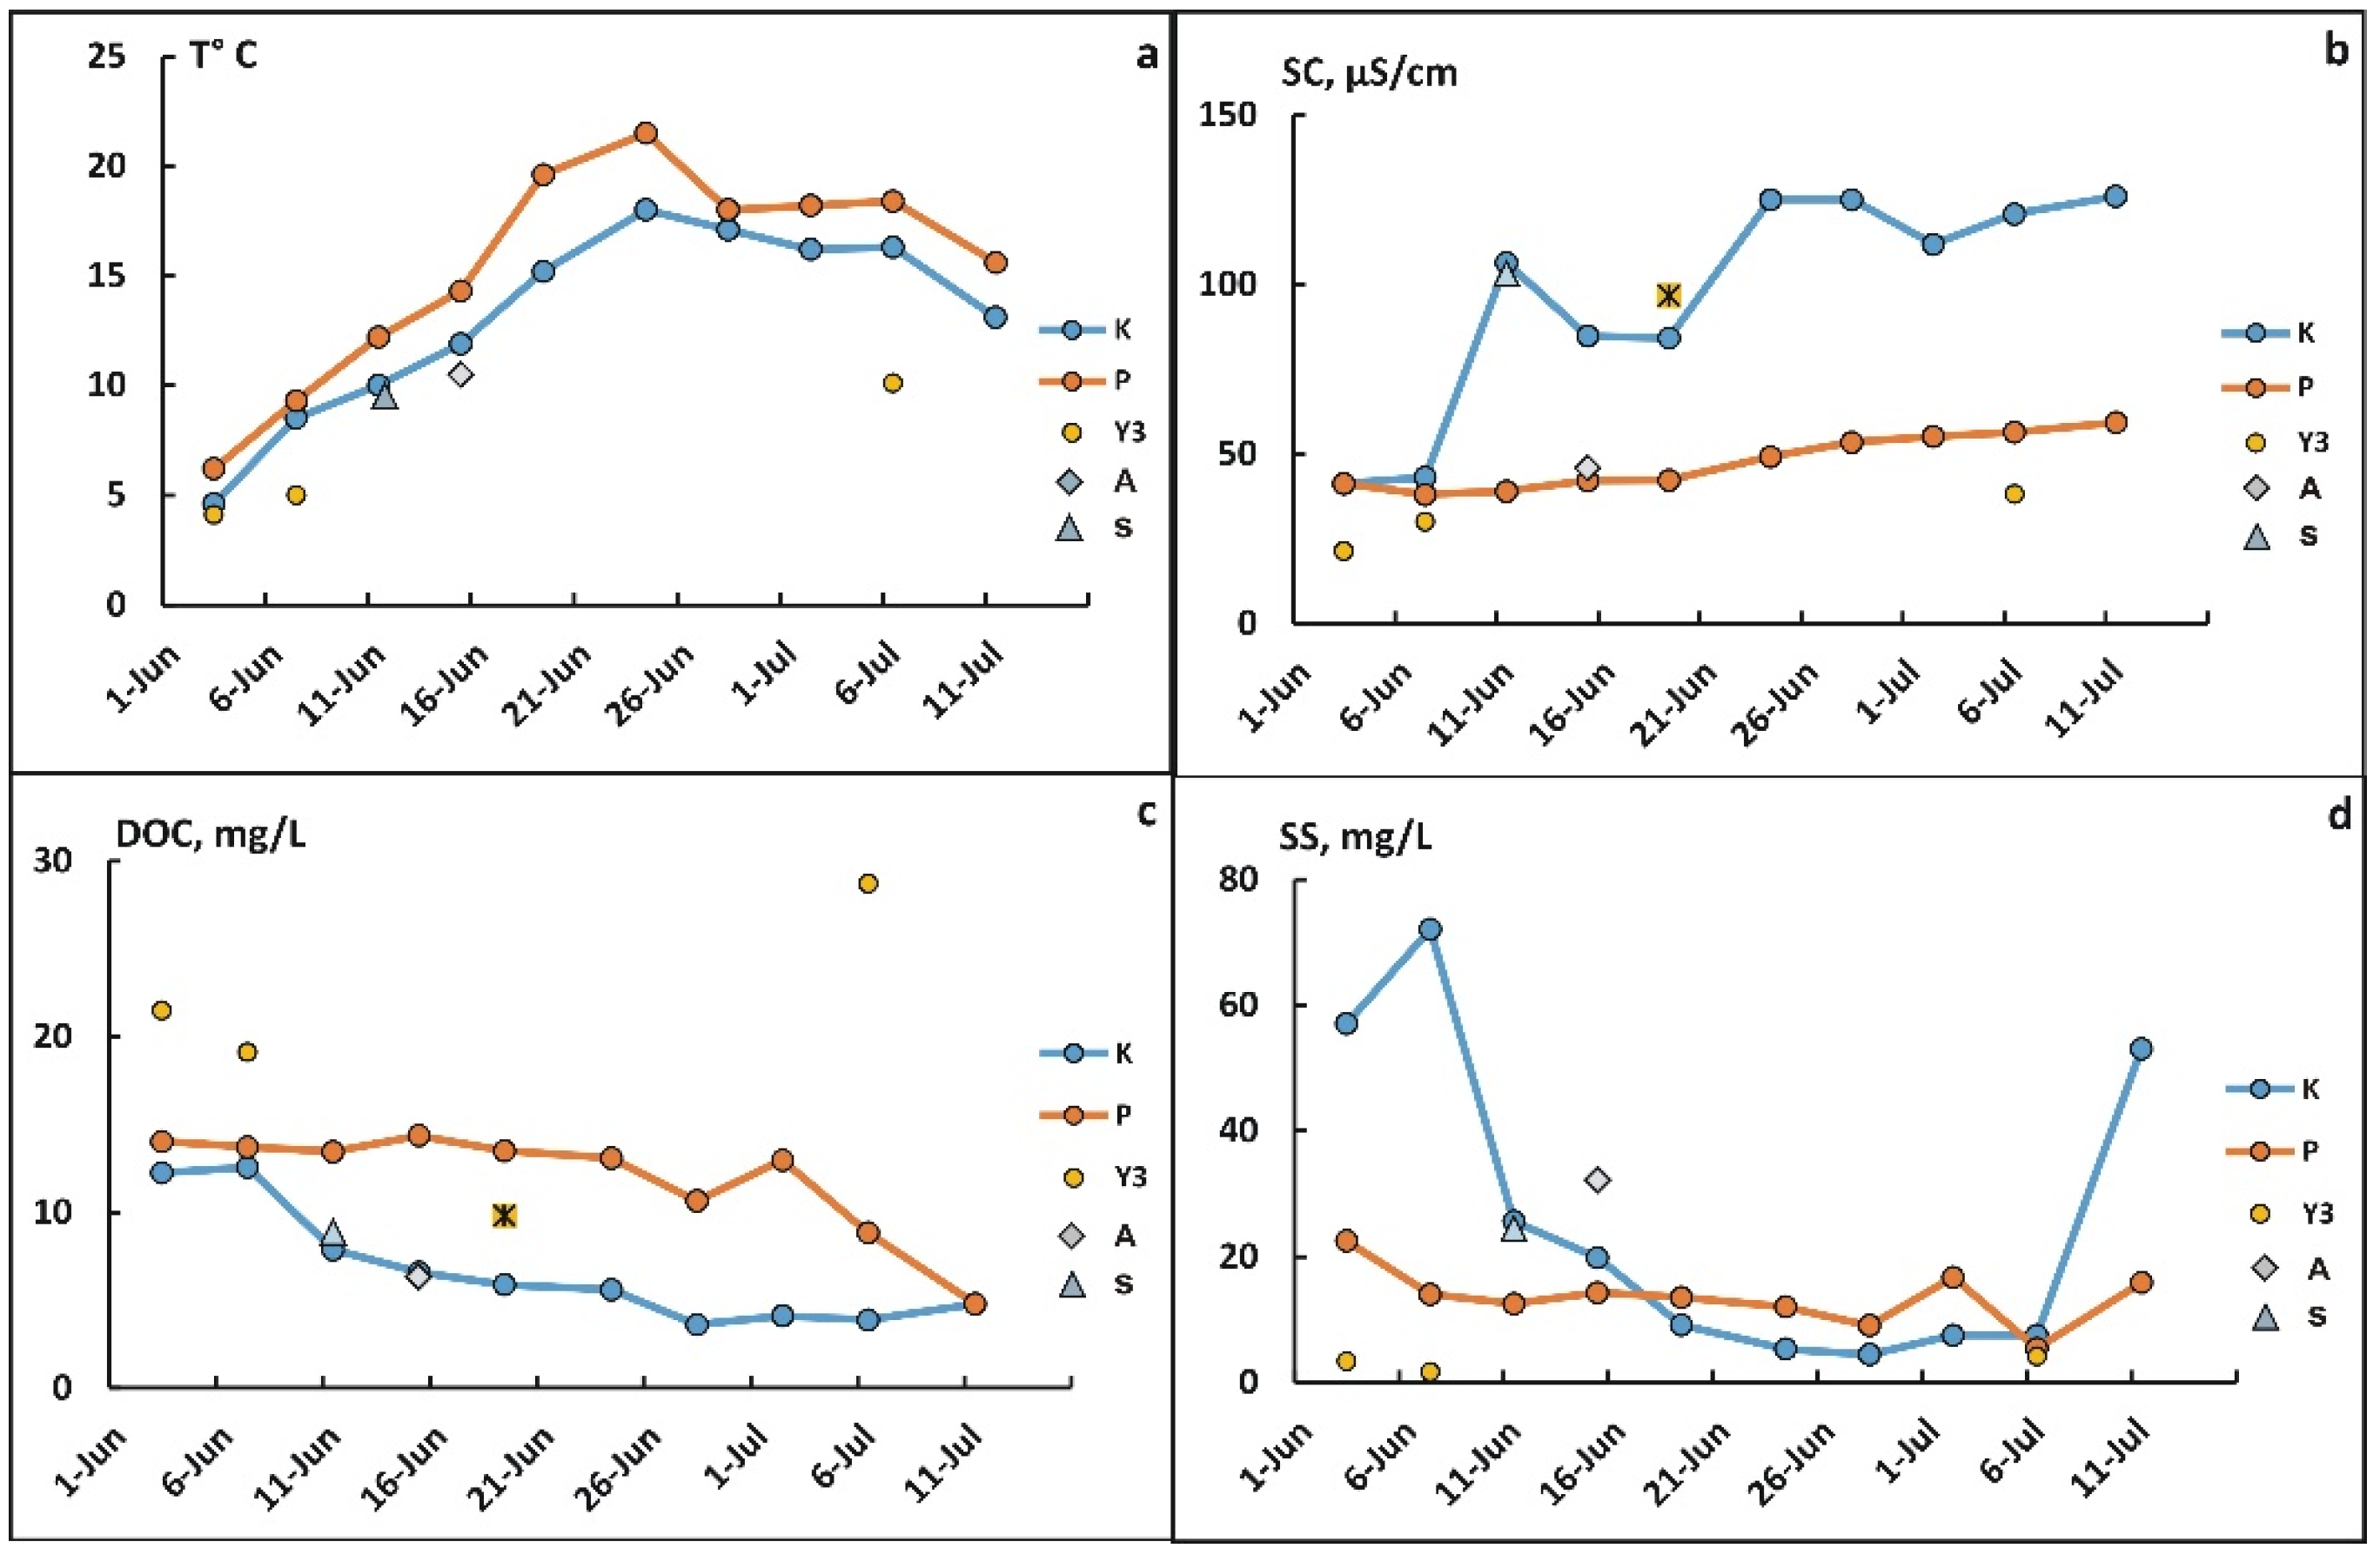
The freshet peak in both the main stream of the Kolyma River and the Panteleikha River is characterized by a minimum specific conductivity (SC) and a maximum DOC. During the freshet decline, the conductivity increases, and the DOC concentration decreases (Figure 2b,c). This corresponds to the usually observed trends in the change in the chemical composition of waters during the freshet decline, caused by a decrease in the quota of meltwaters that are weakly mineralized but have an increased DOC content [8,10,17,18]. The suspended matter content was also maximal at the freshet peak, sharply decreased at the beginning of the freshet decline, and continued to diminish further, but in the middle of July, it increased again due to summer rain floods observed near the Cherskiy settlement (Figure 2d).
It should be noted that there is some discrepancy between the field observations and water discharge data from the Kolymskoye gauging post. For example, the three-day peak in water content recorded in mid-June at the Kolymskoye (Figure 1d, [22]) had no effect on the level and composition of the waters we sampled on 24 June 2024 near the Cherskiy settlement (Figure 2), located 164 km downstream. On the other hand, a rise was observed in the water level in the main stream of the Kolyma River on 10–11 July near the Cherskiy settlement, with the flow of water upstream of the Panteleikha and a corresponding change in the chemical composition and turbidity. However, it was not reflected in the data at the Kolymskoye gauging post (Figure 1d).
The lower reaches of the Panteleikha River are filled with water from the main channel of the Kolyma and the Anyui rivers during the freshet peak, and then they gradually release water into the main stream of the Kolyma, depending on the level of the latter. Therefore, at the peak of the freshet, the chemical composition of the waters of the Panteleikha River and the main stream of the Kolyma River are almost the same. The lower content of suspended solids in the Panteleikha is an exception (Figure 2d) due to sedimentation at the obviously lower current speed. It can be assumed that water exchange in the Panteleikha River is notably weaker than in the Kolyma main stream. As a result, the water is warmer, and the hydrochemical parameters are more stable in the Panteleikha: an increase in EC and a decrease in the DOC content are observed only as trends, although in July, the decrease in the DOC accelerates and is comparable with the Kolyma River (Figure 2c).
Figure 2. Measurements of (a) water temperature; (b) specific conductivity (SC, µS/cm); (c) dissolved organic carbon (DOC, mg/L); and (d) suspended particles (SS, mg/L) in the waters of the lower reaches of the Kolyma River during the freshet 2024: (K) is Kolyma, (P) is Panteleikha, Y3 is Rodinka creek, the triangle is Stadukhinskaya Protoka (S), the diamond is the Anyui (A), and the asterisk in the square is the meltwater of the ice wedge from the Duvanny Yar (DY) location.
Water 17 02400 g002
The suspended matter content in the Panteleikha River was 5–20 mg/L (Figure 2d). The pH of the Kolyma River main stream and Panteleikha River varied from 7.41 to 8.18 and from 6.65 to 8.07, respectively. The waters of the Rodinka creek (Y3), draining seasonally and thawing yedoma sediments, remained cold (10 °C) even in mid-July and weakly mineralized (specific conductivity 38.2 μS/cm), with a minimum suspended matter content (1.7–4.1 mg/L), but were most enriched in DOC (19.1–28.7 mgC/L).
Time series graphs of the water discharge, specific conductivity, DOC, and temperature during freshet 2024 and May–October 2014–2015 are rather similar in terms of trends of changes and general magnitude (Figure 3). However, some interannual variability in the characteristics takes place. First of all, water discharge at the freshet peak in 2024 was 15,100 m3/s compared with 19,500 m3/s in 2015 and 25,200 m3/s in 2014 (Figure 3c). These interannual differences inversely correspond to interannual variations in the specific conductivity at the peak of freshet: 41–43 μS/cm in 2024 compared with 28–36 μS/cm in 2014–2015 (Figure 3a). At the waning of spring flooding 2024, the specific conductivity of the waters quickly increased by 2–3 times during the first decade of June, though in 2014–2015, the dynamic of the specific conductivity increase was not so fast (Figure 3a). The DOC content, on the contrary, was maximal at the freshet peak and decreased by 3–4 times during the decline. At the same time, in contrast to SC, the dynamics of DOC changes in 2024, 2014, and 2015 practically coincided (Figure 3b) despite the obvious differences in the dynamics of the water discharge (Figure 3c).

3.2. Content of Coarse Colloids and Suspended Matter According to DLS Intensity Data
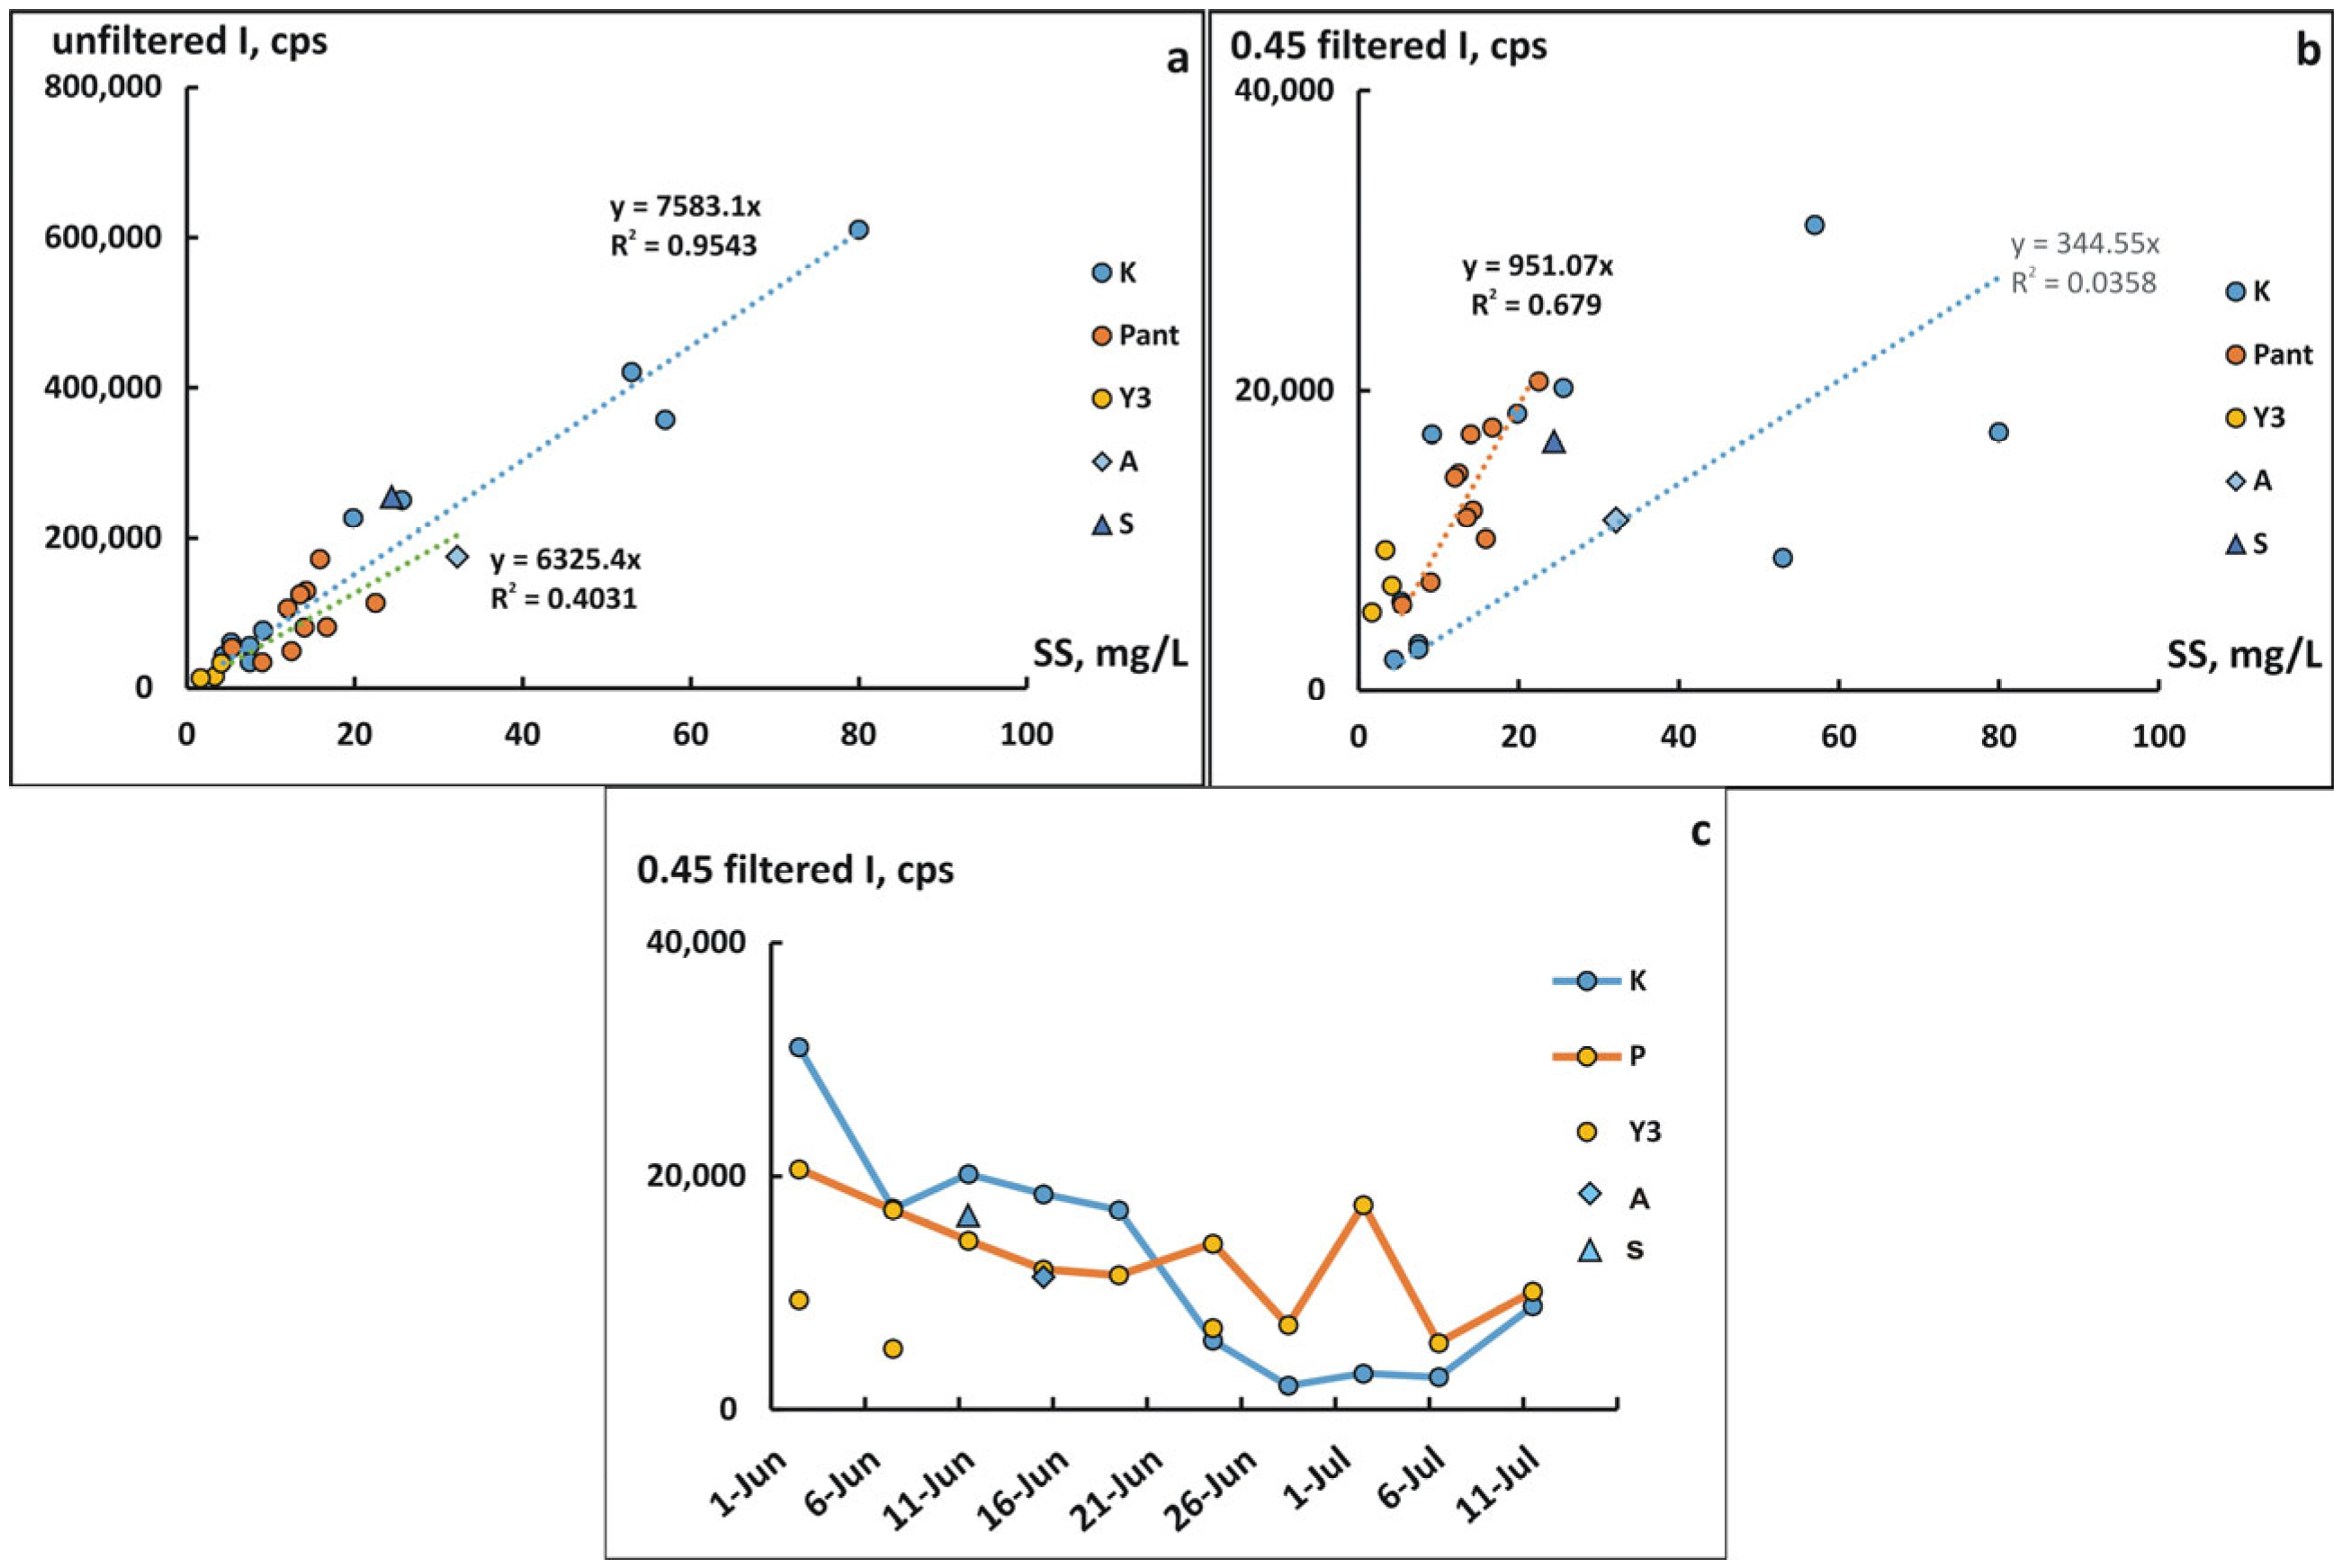
Colloids (0.001–1.0 µm), and especially coarse colloidal particles, continue to be a less-studied fraction of river waters despite the major problems that were formulated thirty years ago [27,28], and significant progress in the study of colloidal fractions of chemical elements has been achieved so far [6,13,16]. The shortage of direct data on the mass content of coarse colloids in river water is one of the reasons for this situation, leading to the use of the DLS method. The dynamic light scattering (DLS) intensity values (cps, counter per sec) in unfiltered waters were linearly dependent on the suspended matter content determined gravimetrically for all watercourses studied (Figure 4a). The DLS intensity in 0.45 μm filtrates obtained through Millipore syringe filters was almost an order of magnitude lower than in unfiltered water samples (Figure 4b). DLS intensity of the filtrates is correlated with suspended matter content less than 25 mg/L. At a higher suspended matter content, the relationship with the DLS intensity of filtrates is disrupted (Figure 4b). This is probably explained by the greater role in suspension during floods of fine sand and silt material larger than 10 µm, which is not determined by the DLS method.
Judging by the decrease in the intensity of DLS in the filtrates of the waters from the main stream of the Kolyma River at the decline of the freshet, there is a significant fall in the content of coarse (0.05–0.45 μm) colloids. In the Panteleikha River, the downward trend is not so clear (Figure 4c). In the Rodinka creek (Y3), which drains seasonally, thawing permafrost, the content of coarse colloids, estimated by the intensity of DLS, is notably lower at the beginning of June, in accordance with the very low content of suspended solids as such. However, a month later, when the content of suspended matter in the Kolyma and Panteleikha rivers decreases to 5–7 mg/L, that is close to the 4 mg/L observed in the Y3 Rodinka creek, the contents of coarse colloids are equalized as well (Figure 4b,c).
Figure 4. Dependence of the DLS intensity (I, cps) on the suspended matter content (SS, mg/L) (a) for unfiltered samples and (b) for the 0.45 μm filtrates and (c) changes in the DLS intensity of fractions <0.45 μm in the waters of the Kolyma and Panteleikha rivers during the waning of the 2024 freshet. (K) is Kolyma, (P) is Panteleikha, Y3 is Rodinka creek, the triangle is Stadukhinskaya Protoka (S), and the diamond is the Anyui (A).
Water 17 02400 g004

3.3. Concentration of Elements in 0.45 µm Filtrates Obtained by Different Methods

In this study, filtrates <0.45 μm were obtained by two methods: a Pall GWV capsule filter with a filtration area of 700 cm2 and a Millipore sterile syringe filter with a filtration area of 8 cm2. For the majority of chemical elements, the results for filtrates obtained by different methods correlated with a Pearson’s coefficient of more than 0.90, and the coefficients of determination in the corresponding regression equations between the results were close to 1.0 ± 0.05 (Figure S1). It indicates the reliability of the results obtained by ICP-MS analysis and the compatibility of the data in the filtrates after capsule and syringe filters of 0.45 μm. It should be noted that correlation coefficients for the Ga, Cu, Cd, Se, Cs, W, Re, Bi, and Tl decreased to 0.60–0.83, though they were still significant. Only for Sn, Ag, Nb, Sb, and Te, i.e., for 5 elements out of 56 analyzed, the correlation coefficients were <0.5. Probably, it indicates the insufficient sensitivity of the ICP-MS machine used for the analysis of these elements, and they are not discussed further. In addition, the data on the concentration of Cr and Pb in some filtrates seems suspiciously high due to probable contamination during sample processing, and they are not discussed as well.

3.4. Changes in the Concentration of Chemical Elements in Fractions <0.45 µm During Freshet
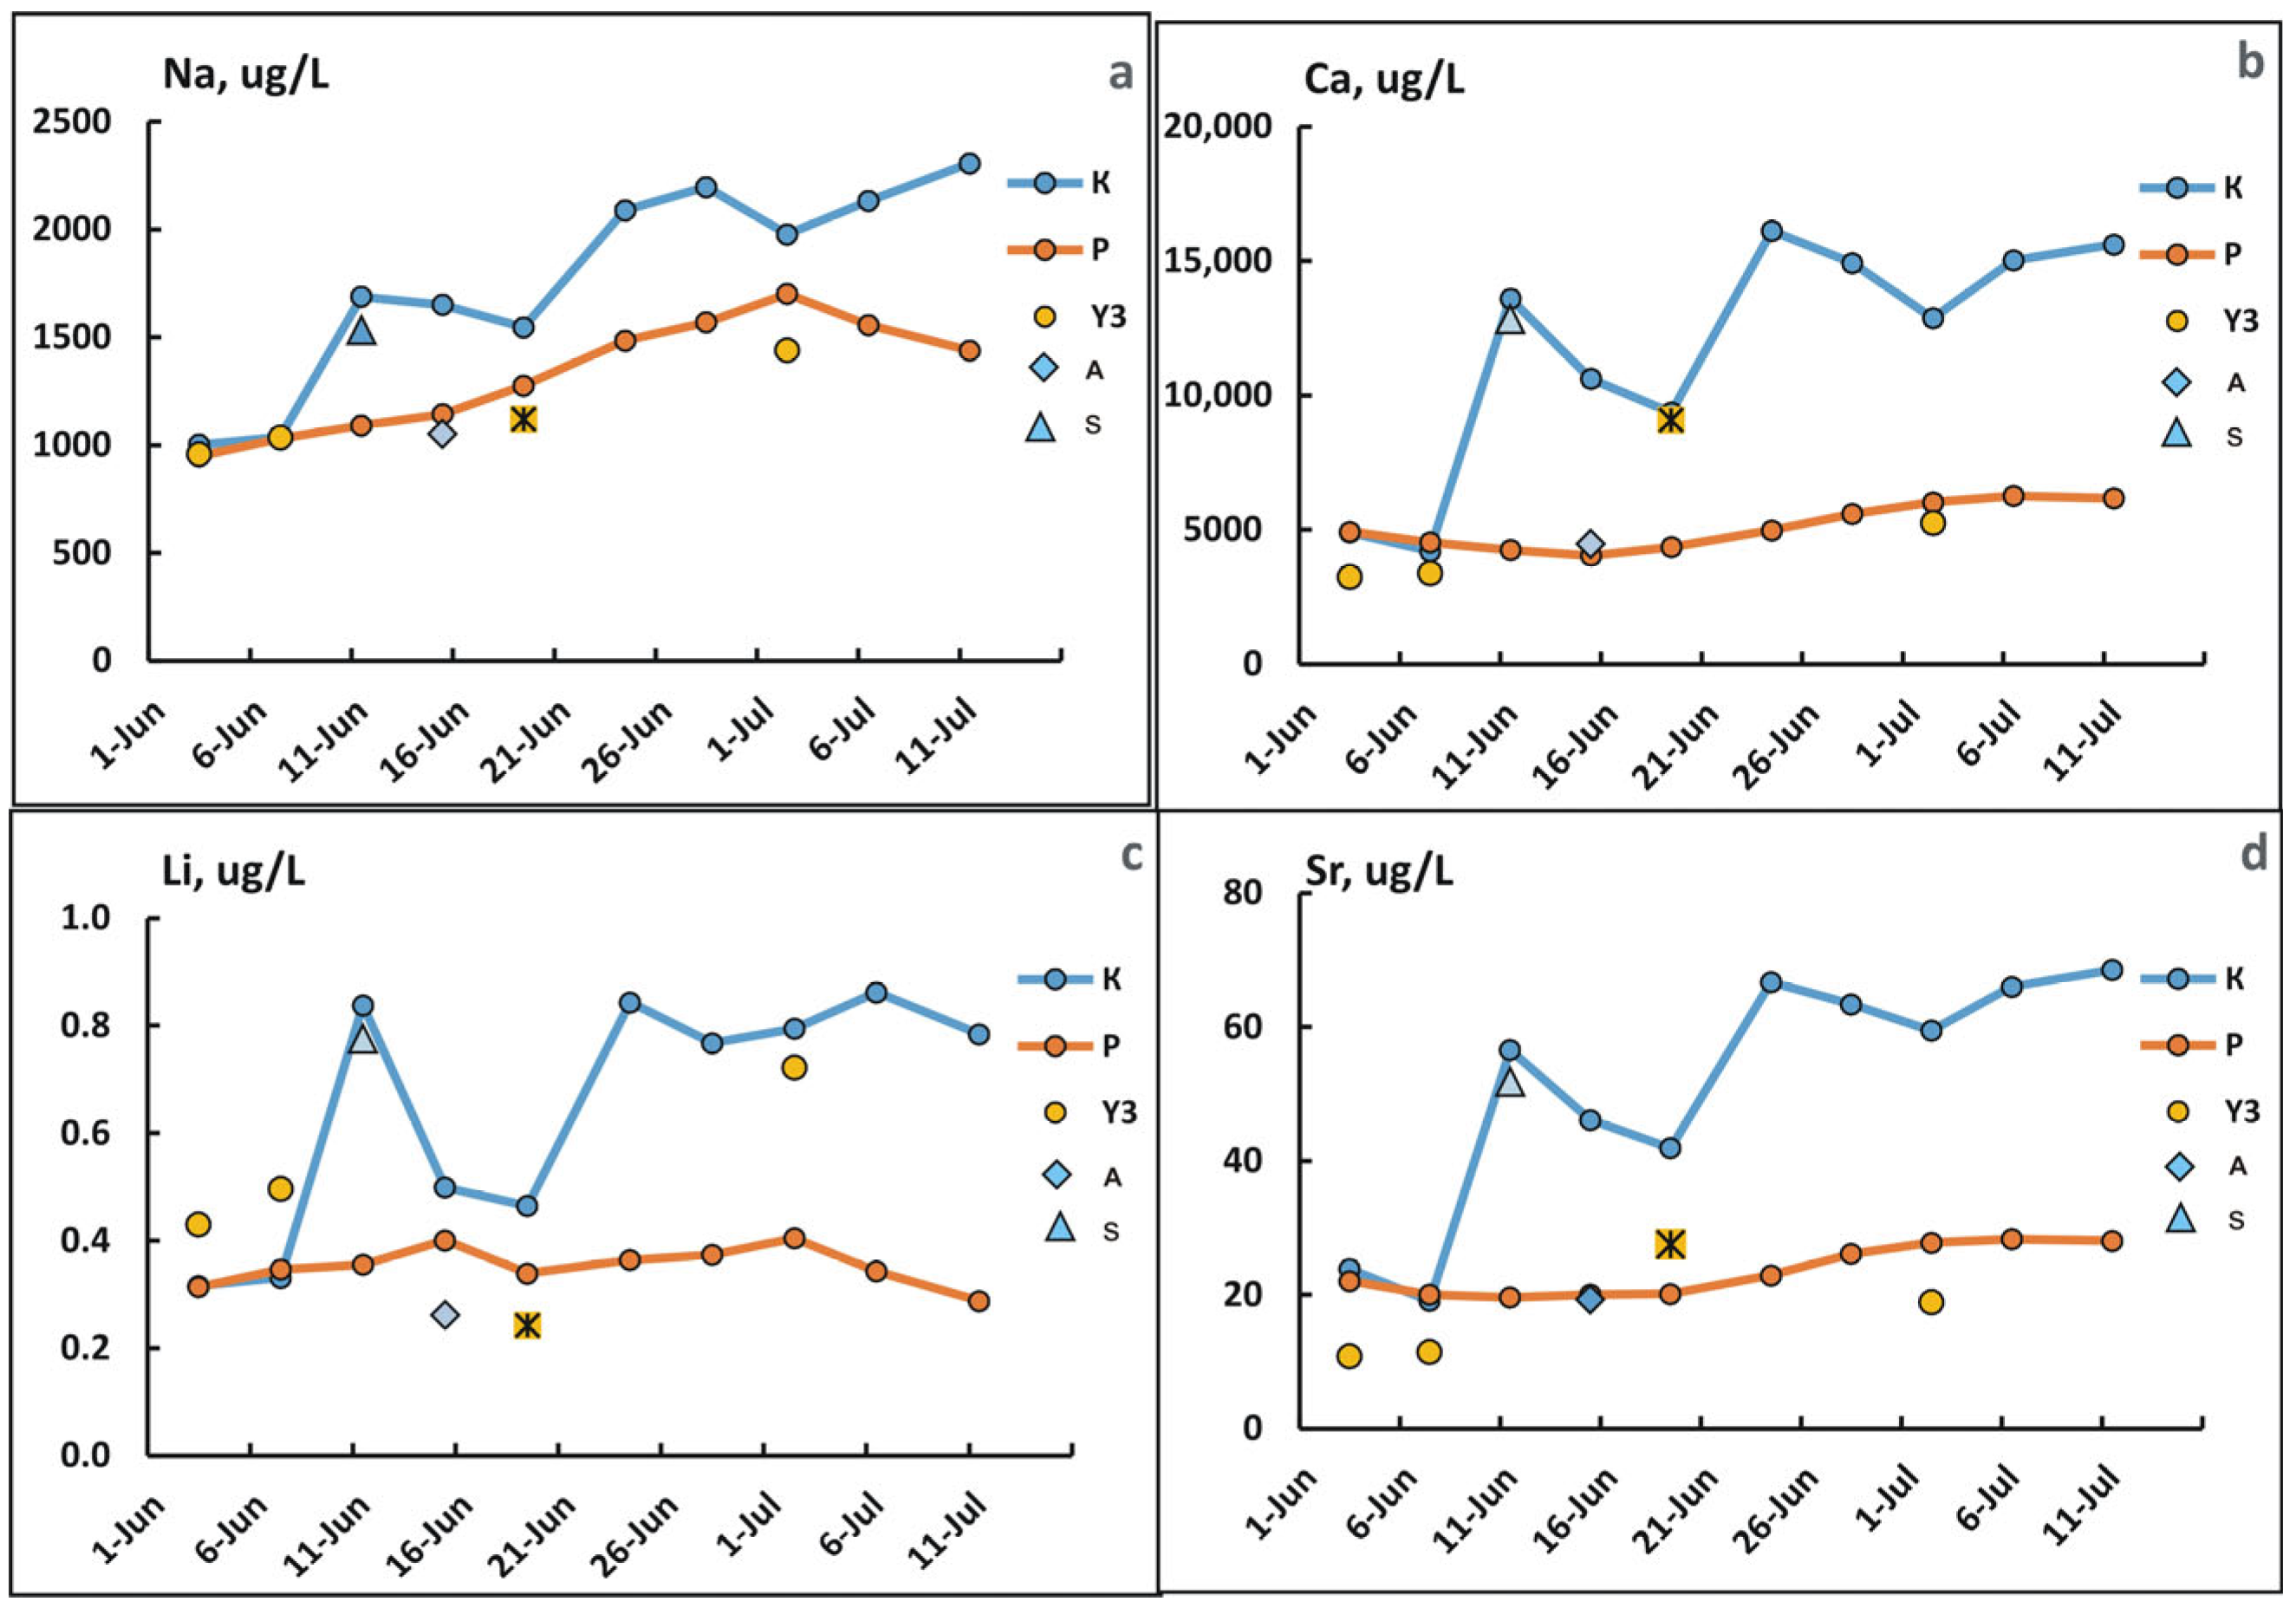
Based on the changes in concentration in filtrates after syringe filters of 0.45 µm during the Kolyma River freshet, the chemical elements are divided into three groups. The first group of elements includes alkaline and alkaline–earth major cations (Na, K, Ca, and Mg), as well as trace elements (Li, Sr, and Ba) with similar chemical properties and prevalences of dissolved ionic forms. These chemical elements demonstrate a distribution correlated with a specific conductivity (Figure 2b): minimum and similar concentrations in both the Kolyma and Panteleikha rivers at the freshet peak, with a further increase during the decline of water discharge significantly manifested for the main stream of the Kolyma River. In the Panteleikha River, the increase is weak or insignificant (Figure 5).
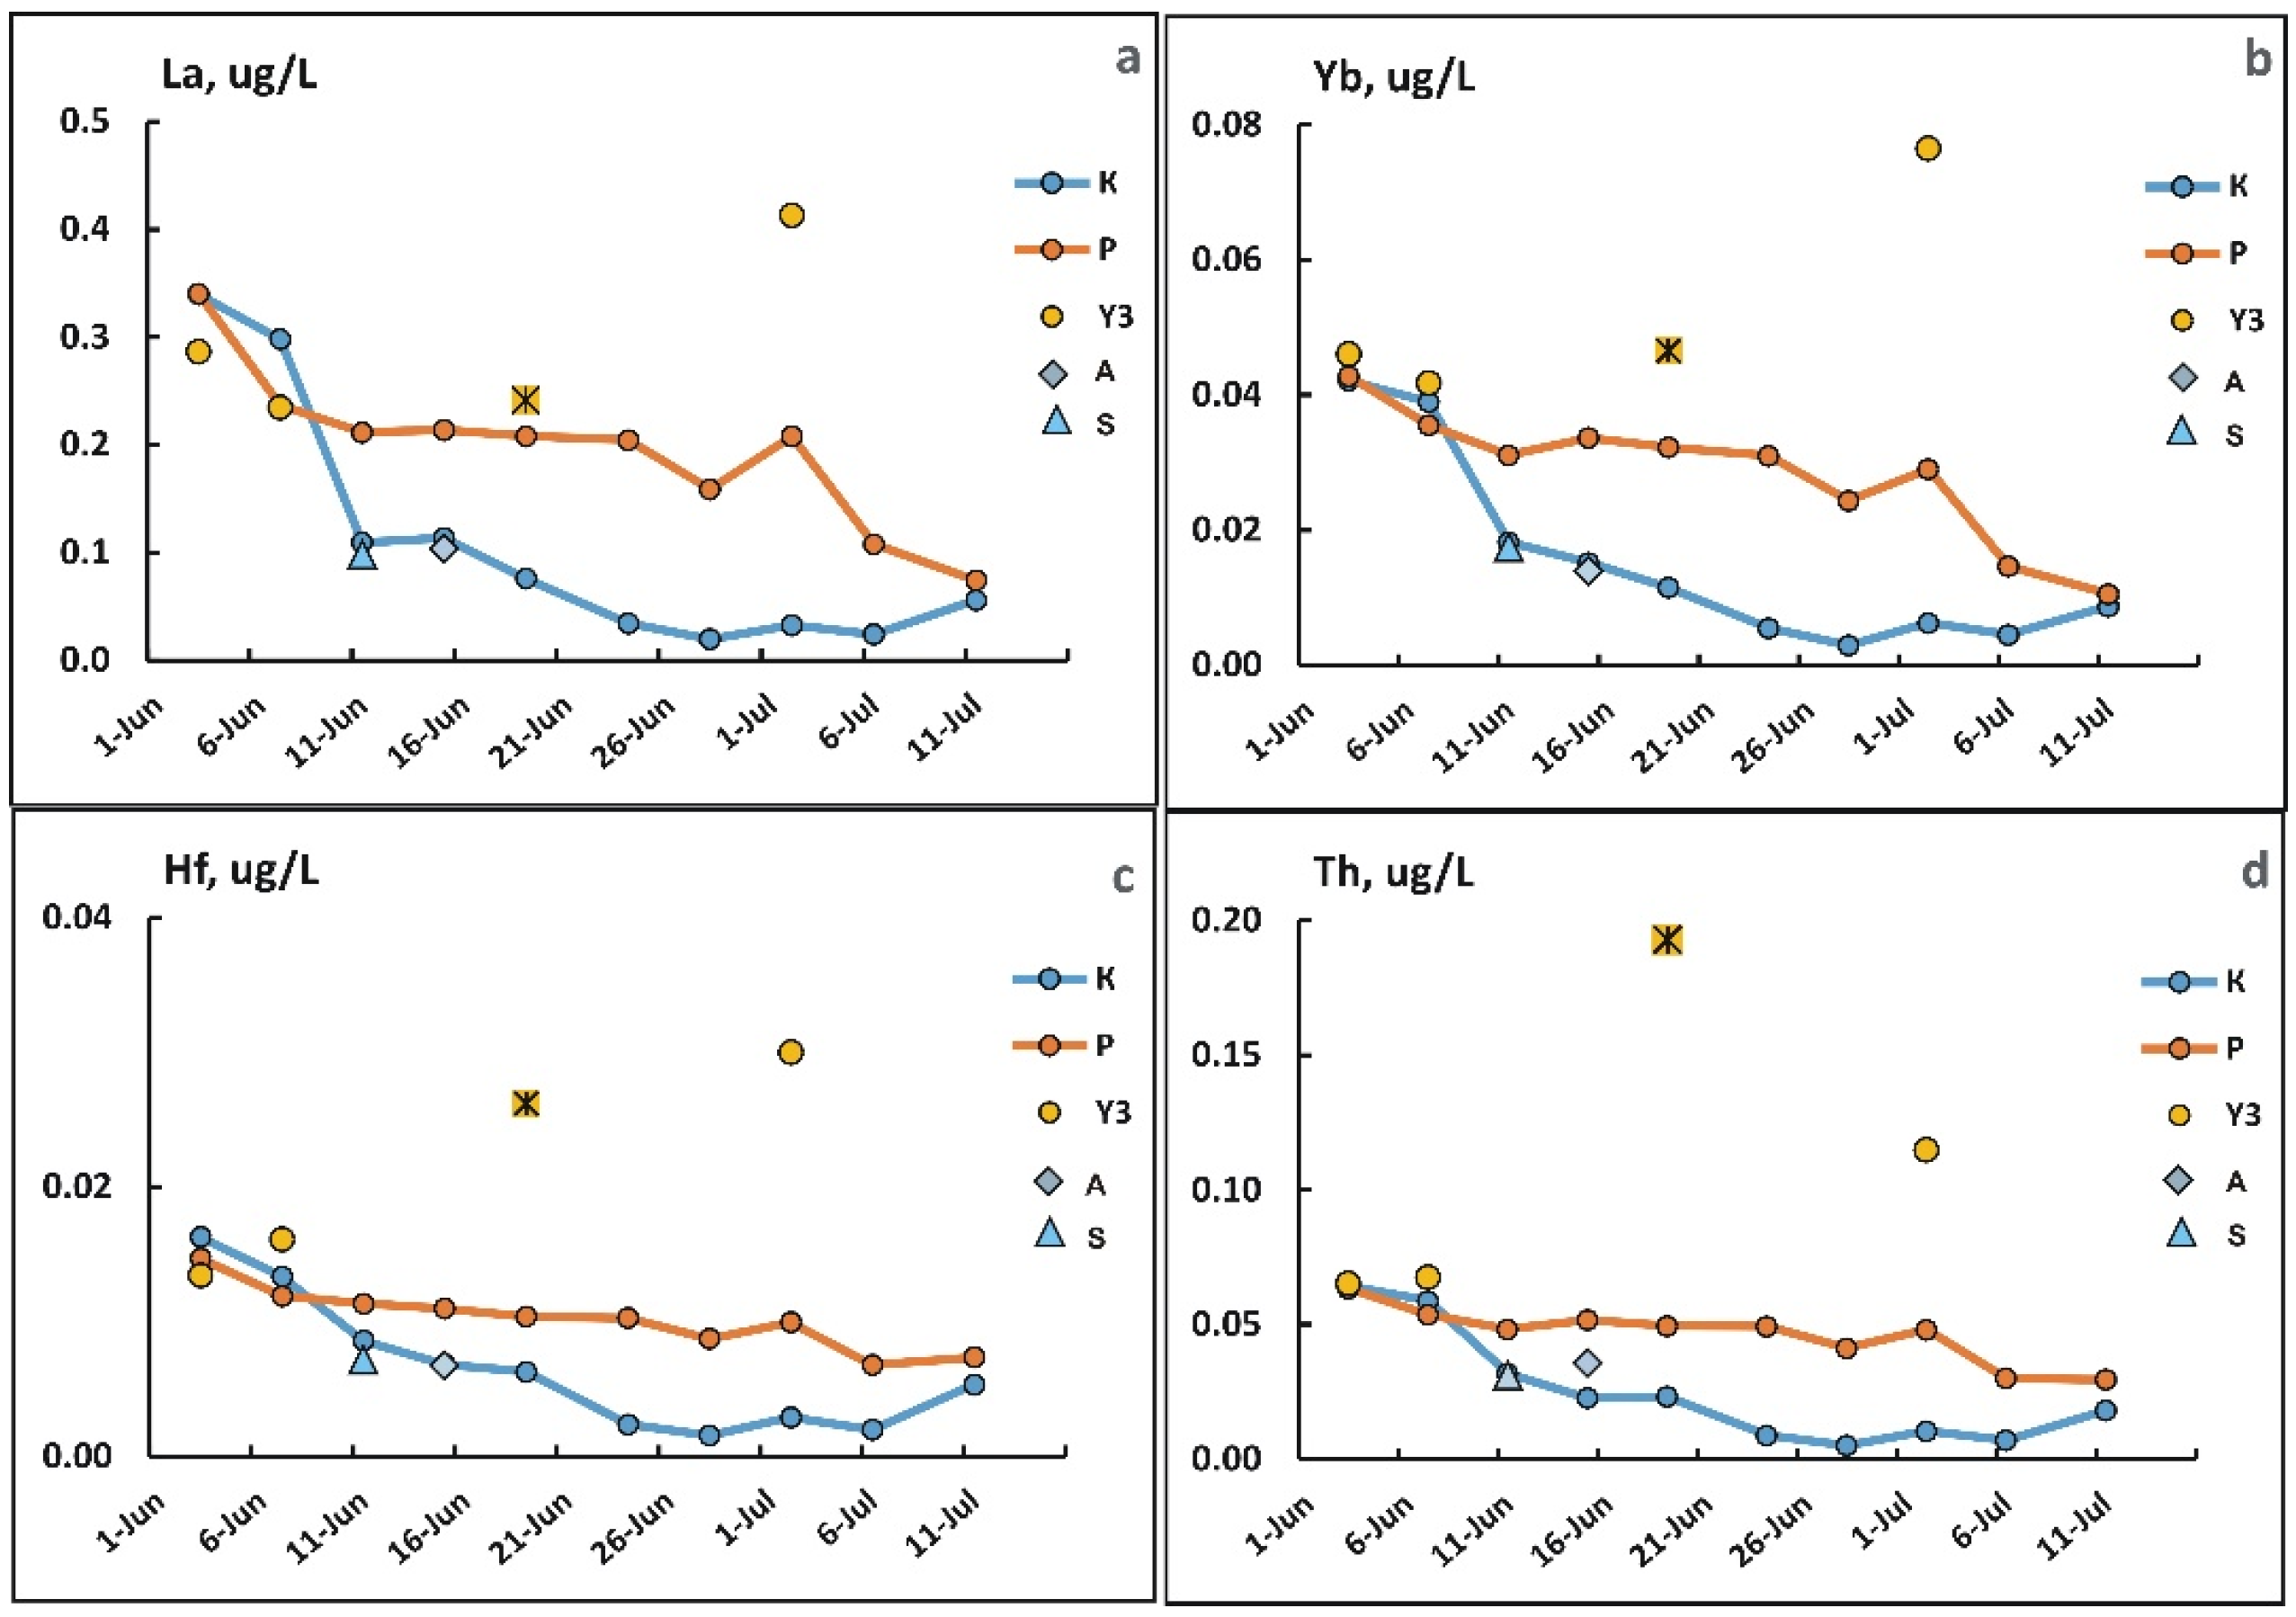
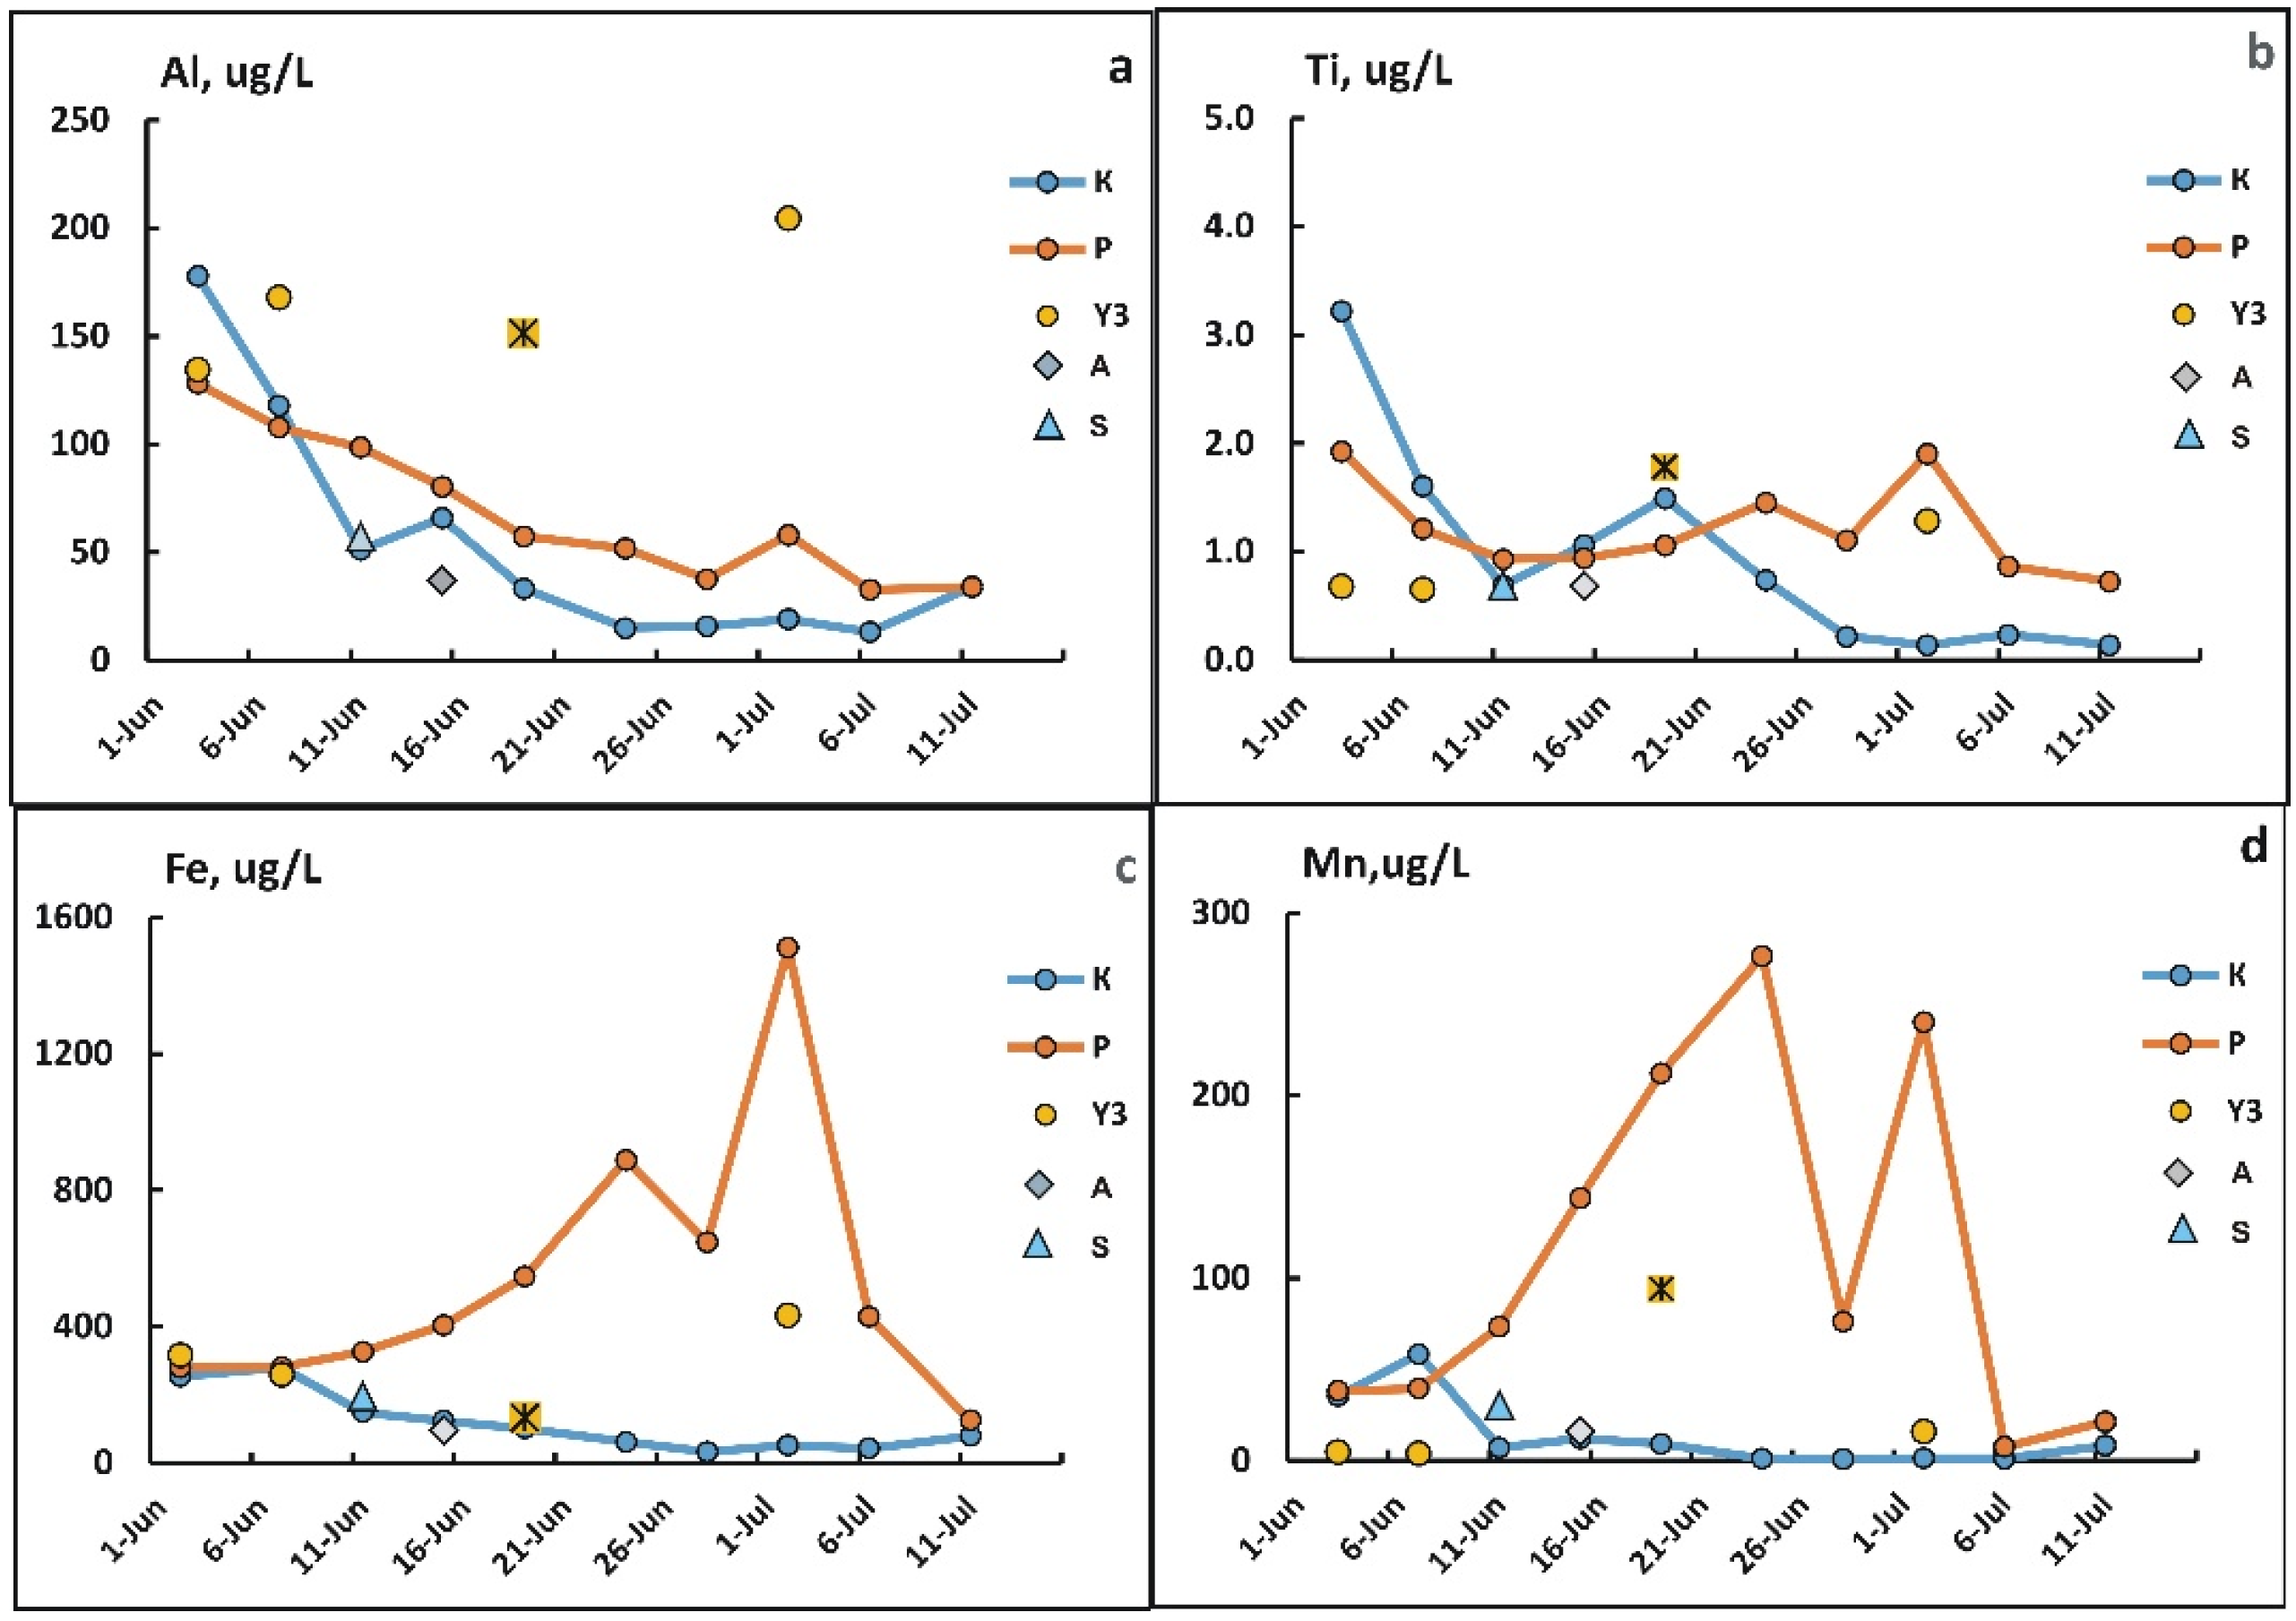
The second group includes hydrolysates (Al, Ti, REEs, Hf, Zr, Th, Y, Ge, Sc, and Be), with a maximum concentration in filtrates <0.45 μm at the freshet peak and significant trends in decreasing concentrations during the freshet decline in the main stream of the Kolyma River. However, their concentration here increases again during the summer rain flood in mid-July. In the Panteleikha River, the decrease in the concentration of hydrolysates is not so pronounced, and in the waters of the Y3 creek and the ice wedges of the Pleistocene Ice Complex (Yedoma), their concentration can even increase (Figure 6a,b and Figure 7).
Figure 6. Changes in the concentration of Al (a), Ti (b), Fe (c), and Mn (d) in fractions <0.45 µm at the watercourses of the lower reaches of the Kolyma River during the freshet.
Water 17 02400 g006
Figure 7. Changes in the concentration of La (a), Yb (b), Hf (c), and Th (d) in fractions <0.45 µm of the watercourses of the lower reaches of the Kolyma River during the freshet.
Water 17 02400 g007
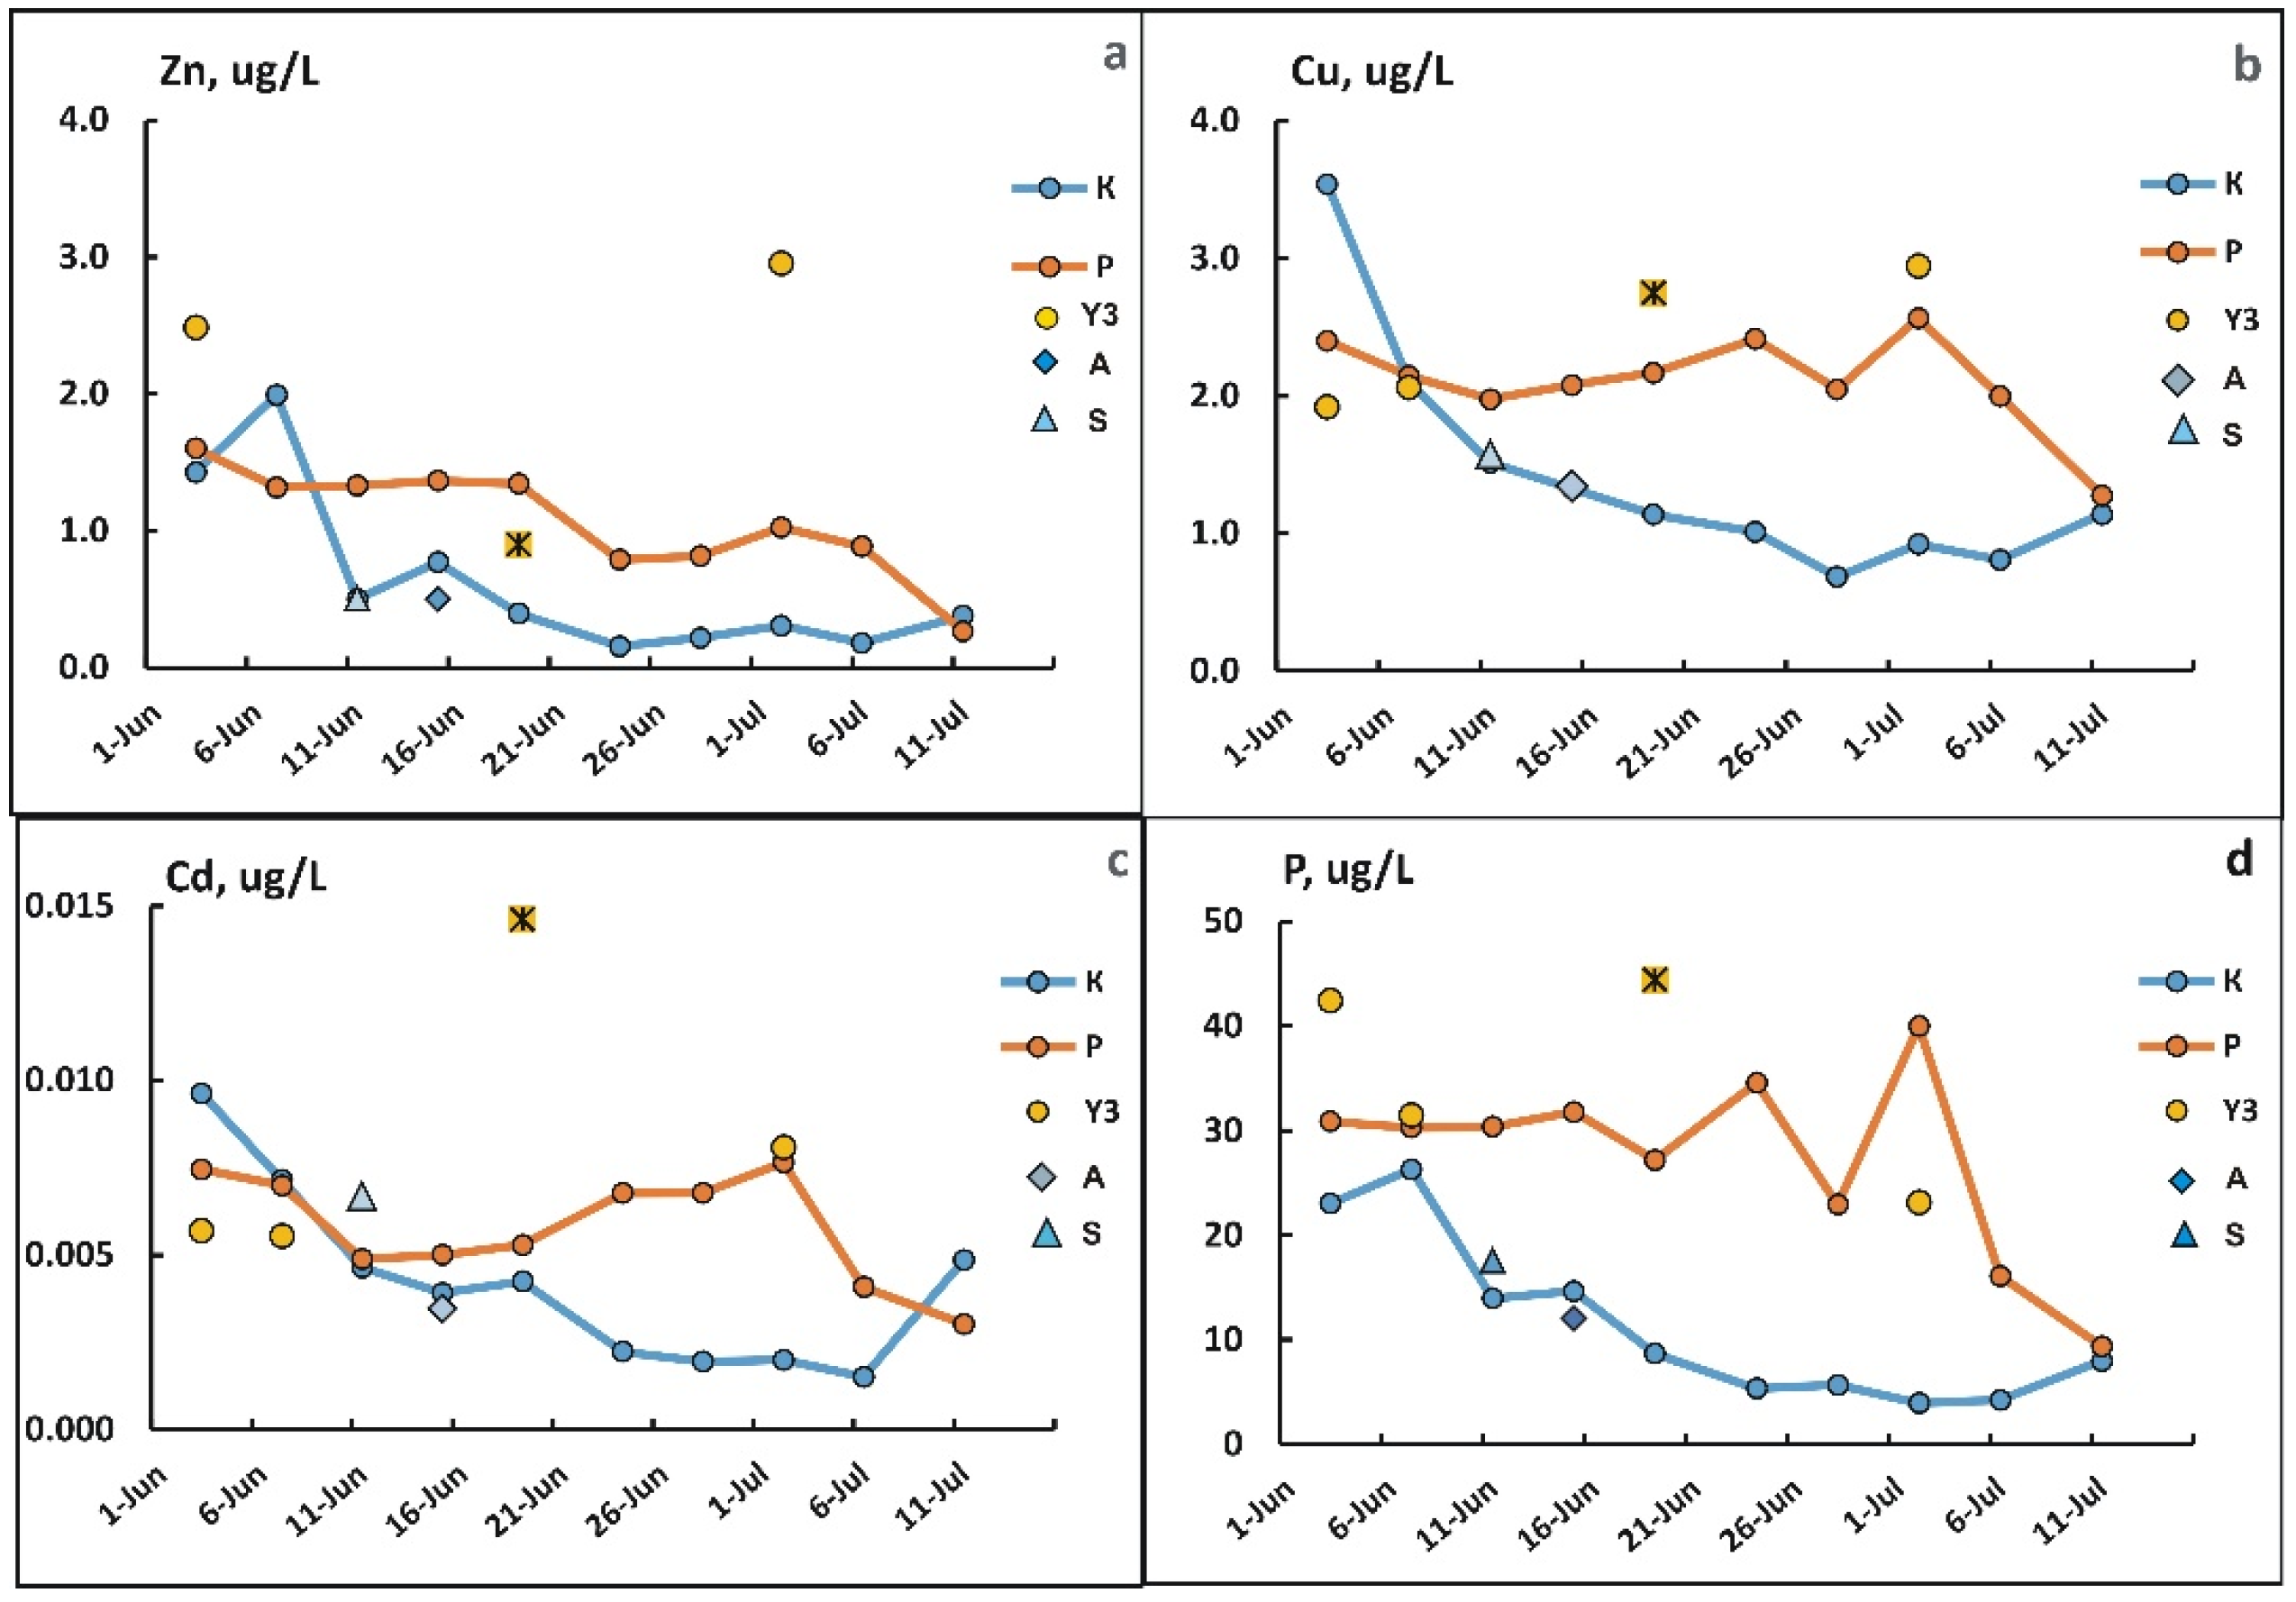
The concentration of Fe and Mn in the filtrates was also maximal at the freshet peak, significantly decreased during freshet decline in the main stream of the Kolyma River, and again increased during the summer rain flood (Figure 6c,d). However, in the Panteleikha, a 4–6-fold increase in the concentrations of Fe and Mn was observed at the end of June during the decline of the freshet. In July, during the summer rain flood, the concentration of Fe and Mn in filtrates <0.45 μm in the Panteleikha River again decreased to a level close to the one observed in the Kolyma River (Figure 6c,d). Zn, Cu, Ni, and Cd, as well as P, also demonstrated a significant decrease in the fraction <0.45 μm in the main stream of the Kolyma River during the freshet decline (Figure 8). In the waters of the Panteleikha River, a significant decrease was observed only for Zn (Figure 8a) and Ni, while for Cu, Cd, and P, the concentration fluctuated throughout June at the level of the beginning of the freshet, and for P even exceeded it, and only in July did it decrease simultaneously with a decrease in the DOC (Figure 8d).
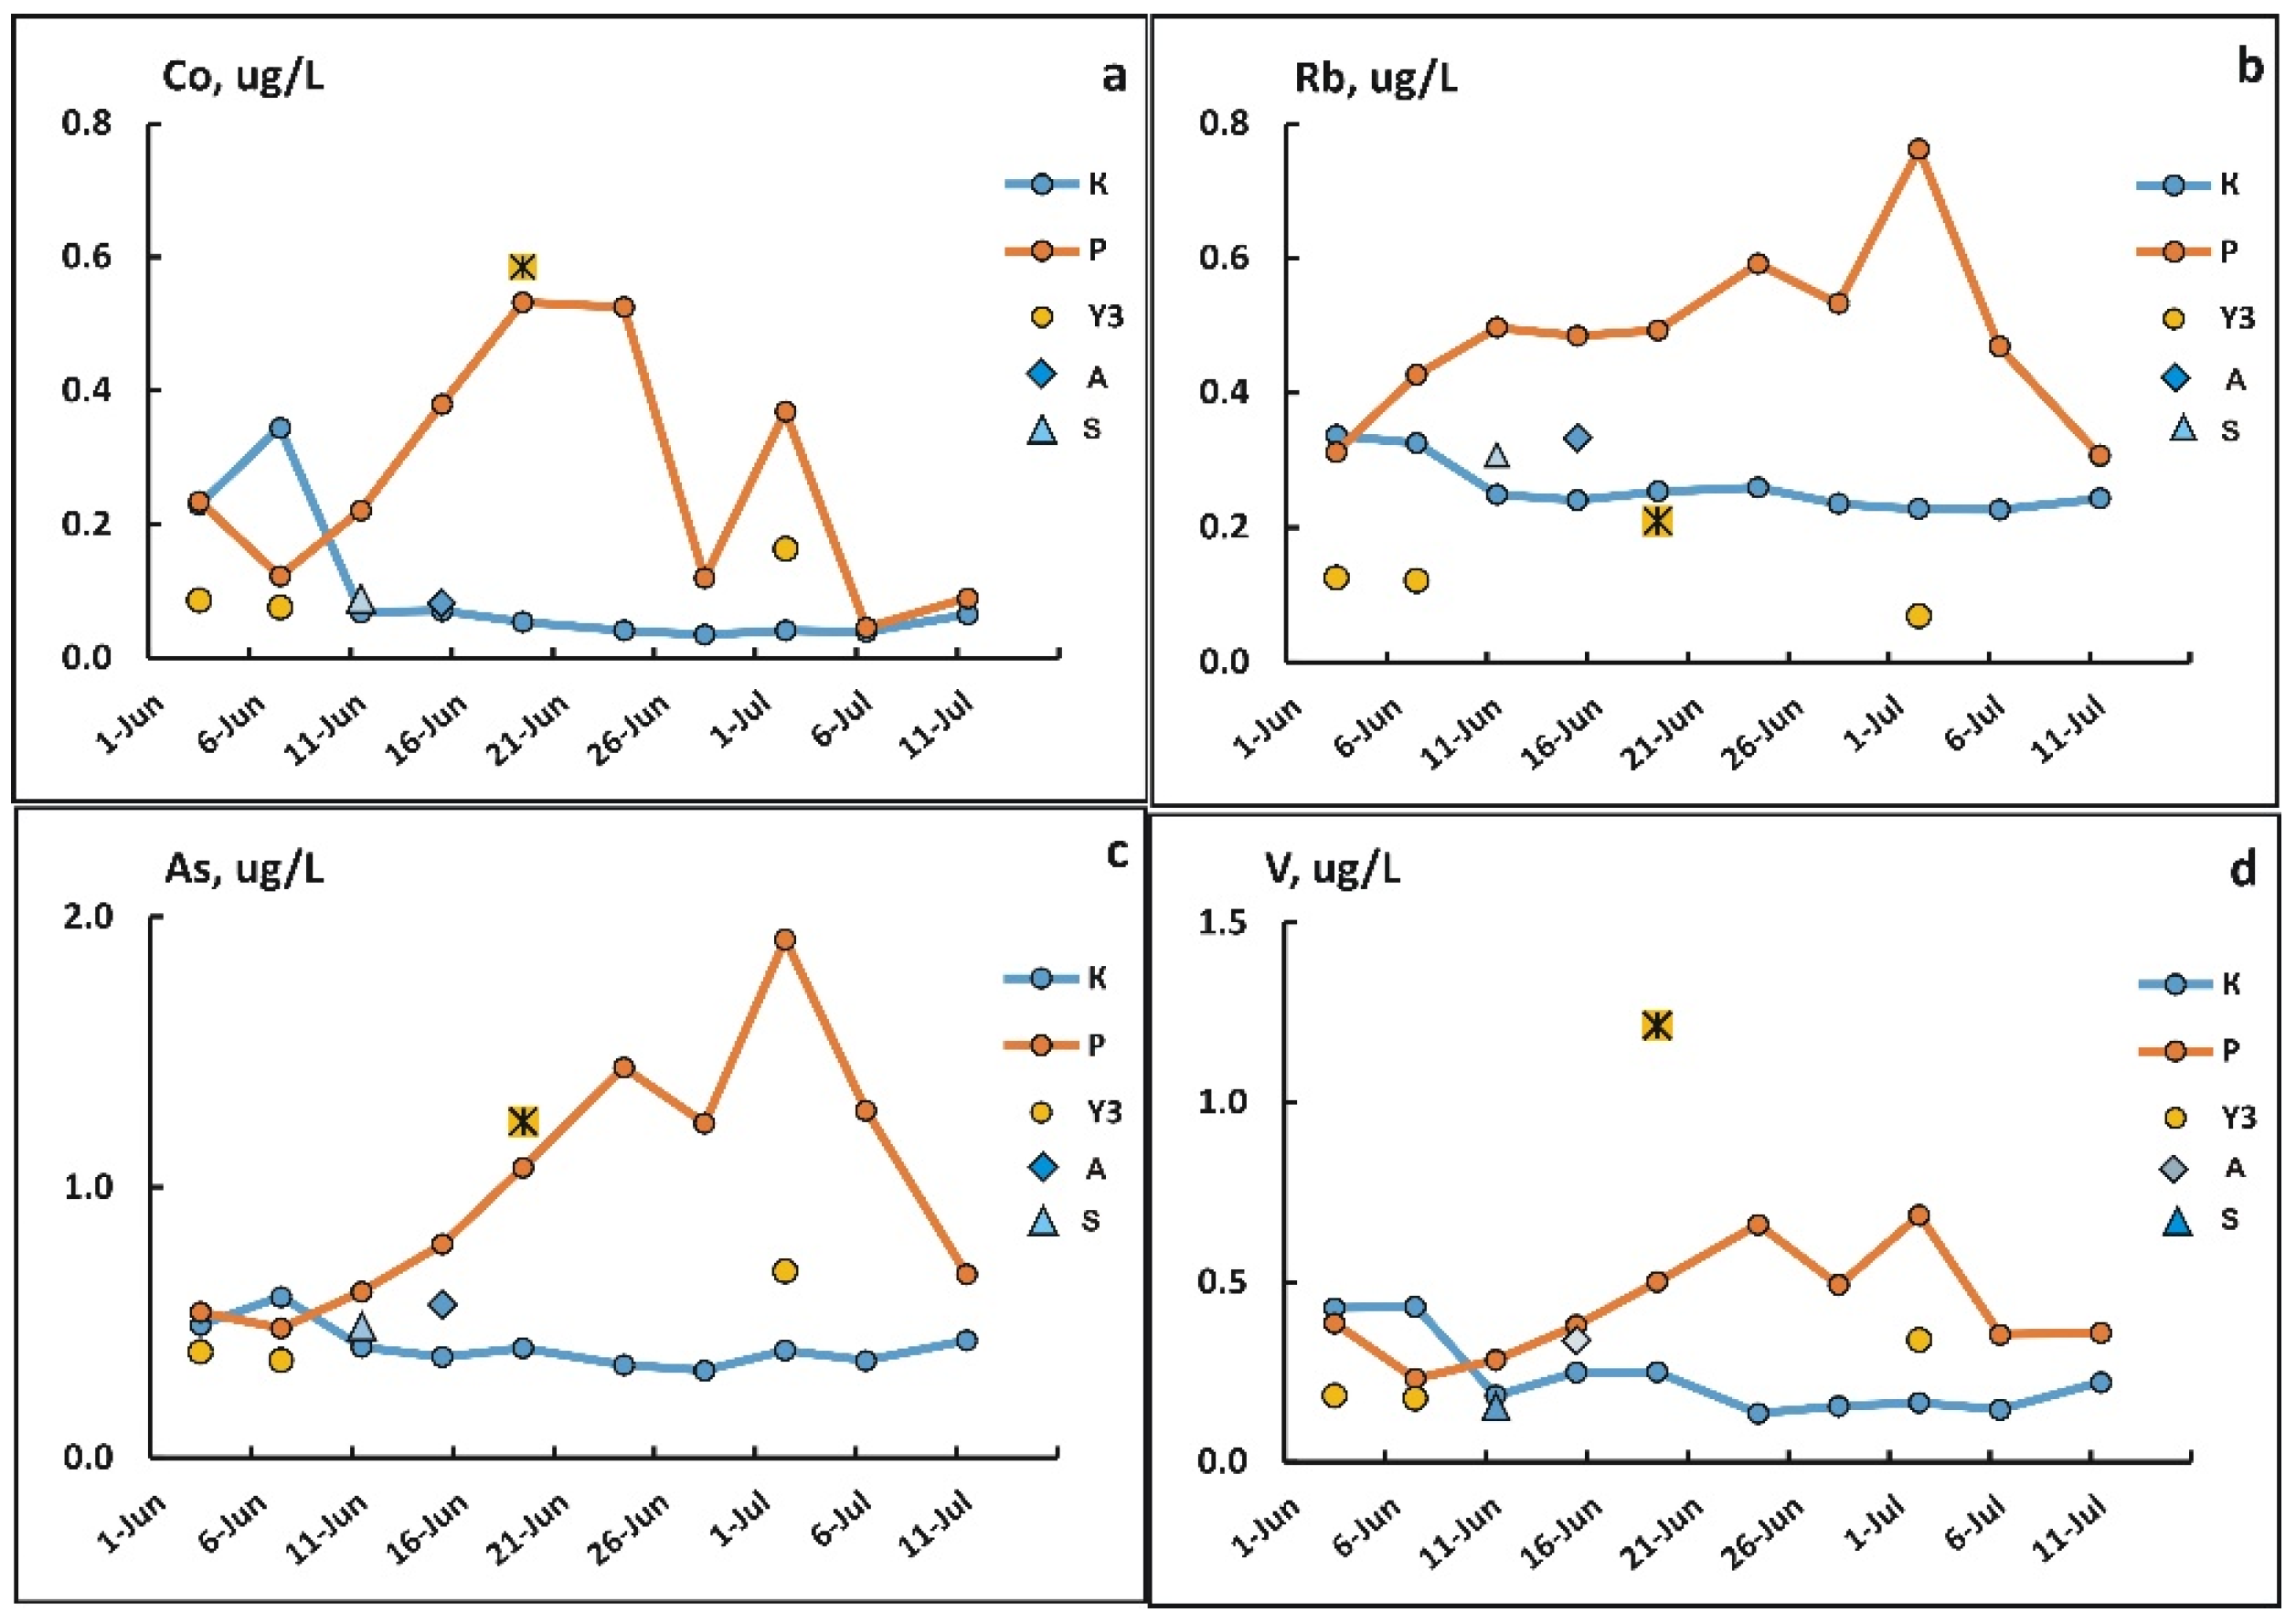
The third group includes Co, Rb, As, and V (Figure 9). For these elements, the concentration in the main stream of the Kolyma and in the Panteleikha River at the freshet peak was quite similar, but then it differed in magnitude and the direction of change. In the main stream of the Kolyma River, the concentration of Co, Rb, As, and V decreased insignificantly during the freshet, and only Co had an elevated concentration at the freshet peak. However, in the Panteleikha River, the concentration of <0.45 µm forms of Rb, Co, V, and As increased 2–5 times during June, but in July, it decreased again to the level observed at the freshet peak (Figure 9). It should be noted that changes in the concentrations of these elements in the Panteleikha River are similar to Fe and Mn (Figure 6c,d) but are not as contrasting. In addition to the above-mentioned elements that demonstrated significant trends in concentration changes in waters of the main stream of the Kolyma River or Panteleikha River, there are a number of elements with insignificant (±20–30%) changes in both rivers during the freshet: U, Sb, Se, Mo, W, Cs, and Ga.
Figure 8. Changes in the concentration of Zn (a), Cu (b), Cd (c), and P (d) in fractions <0.45 µm of the watercourses of the lower reaches of the Kolyma River during the freshet.
Water 17 02400 g008
Figure 9. Changes in the concentration of Co (a), Rb (b), As (c), and V (d) in fractions <0.45 µm of the watercourses of the lower reaches of the Kolyma River during the freshet.
Water 17 02400 g009
When assessing the concentration of dissolved/colloidal forms of the chemical elements in the Kolyma River compared to other rivers, the seasonal variations described above should be taken into account. Table 1 shows data on the average concentrations of chemical elements in the <0.45 μm fraction of water in the main stream of the Kolyma River, sampled in the first half of June and from 16 June to 11 July and of the Panteleikha River for the entire observation period in 2024. The water samples from the Anuyi and Staduhinskaya Protoka rivers, and two samples from the Panteleikha River with a chemical composition close to the Kolyma River main stream due to filling by flood waters, are considered as Kolyma River data in Table 1. A detailed description on which samples were used for the calculation in Table 1 is provided in the Supplementary Materials Table S1. For comparison, data on the Kolyma River base flow obtained by [11] for July-August 2019–2021, and by [12] for April-November 2004–2006, as well as the average for the rivers of the world [29], are provided.

3.5. Changes in Concentrations of Elements in the Suspended Solids

The concentration of most chemical elements in the suspended matter of the low Kolyma watercourses during the freshet changes had a coefficient of variation CV <20% and without obvious trends (Table 2, Figure S2). The exceptions are two groups of elements: (1) Al, Ti, and Sc and (2) Fe, Mn, and P. The first group is characterized by a diminished concentration in the suspended solids of the Panteleikha River, with the exception of the freshet peak and the period of the July rain flood (Figure S2). Both are the periods when the water and suspended matter of the Panteleikha River were under the maximum influence of the Kolyma River main stream. The elements of the second group demonstrate a stable notable (3–4 times) increase in concentration of the suspended matter of the Panteleikha River in the second half of June–early July. The most pronounced increase was observed for Mn (Figure S2). This upsurge comes to naught during the July rain flood, when the lower reaches of the Panteleikha River are almost completely filled with waters from the main stream of the Kolyma River. An increase in Mn from 600–1200 to 1800–2700 µg/g was observed in suspended solids at the freshet waning in the Kolyma River as well (Figure S2c). Similarly to Table 1, the data on the suspended solids for the Kolyma River in Table 2 includes data for the Anuyi, Staduhinskaya Protoka, and Panteleikha rivers at the freshet peak and during summer rain flood in July when the chemical composition of these watercourses was close to the Kolyma River mainstream. For comparison, the data was used on the chemical composition of riverine suspended solids sampled during all seasons in the permafrost-bearing zone of the Ob River basin in 2016 [14] and in the middle course of the Ob River in 2018–2019 [30]. The global assessment of the chemical composition of the river suspended solids [31] was used as well.

4. Discussion

4.1. Features of the 2024 Freshet Compared to the Water Regimes of 2014 and 2015

The notably higher specific conductivity (EC) of waters in the main stream of the Kolyma River at the peak of the 2024 freshet (41.2 μS/cm) compared to 2014 and 2015 (35.7 and 28.4 μS/cm, respectively) indicates a lower water flux at the 2024 freshet. This is confirmed by the difference in discharges during sampling at the freshet peak by the Kolymskoye gauging station: 25,200, 19,500, and 15,100 m3/s in 2015, 2014, and 2024, respectively [22]. The fast EC growth at the freshet waning in 2024 compared with 2014–2015 also agrees with the interannual variability in the water discharge dynamic (Figure 3c). The concentration of DOC in the Kolyma River main stream at the freshet peak in 2024 exceeded that of 2014–2015 (12.5, 10.6, and 8.2 mgC/L, respectively), i.e., at a lower discharge, a higher concentration of DOC takes place. At first glance, it contradicts the usually observed relationship between the DOC and water discharge when the DOC concentration is directly proportional to discharge [1]. This discrepancy can be explained by the fact that during the freshet, the water and DOC fluxes in the Kolyma River, and in other Arctic rivers as well, have different sources. Water is a product of melting snow cover and DOC is mainly washed out from the plant litter and topsoil layer, because DOC content in the snow waters themselves does not exceed 0.5–1.9 mg/L [32]. Therefore, the observed pattern of the interannual variability in the DOC concentration at the freshet peak corresponds to the scenario when different volumes of meltwater drain approximately the same volume of the soil and plant litter layers at the catchment area. Thus, the freshet of 2024 can be characterized as quite low water, which means there was a low snowfall in the winter of 2023–2024, since snowmelt provides 82% of the Kolyma River freshet [33]. However, a reasonable relationship between the variability in specific conductivity and DOC in the Kolyma River main stream and water discharge at the Kolymskoe gauging post [22] for 2024, compared with 2014 and 2015, allows us to suppose the general consistency of the freshet in 2024 with the hydrological regime of the Kolyma River and to relate our data with ones from other years [7,11,12].

4.2. Causes of Changes in the Chemical Composition of Waters in the Lower Reaches of the Kolyma River During Freshet
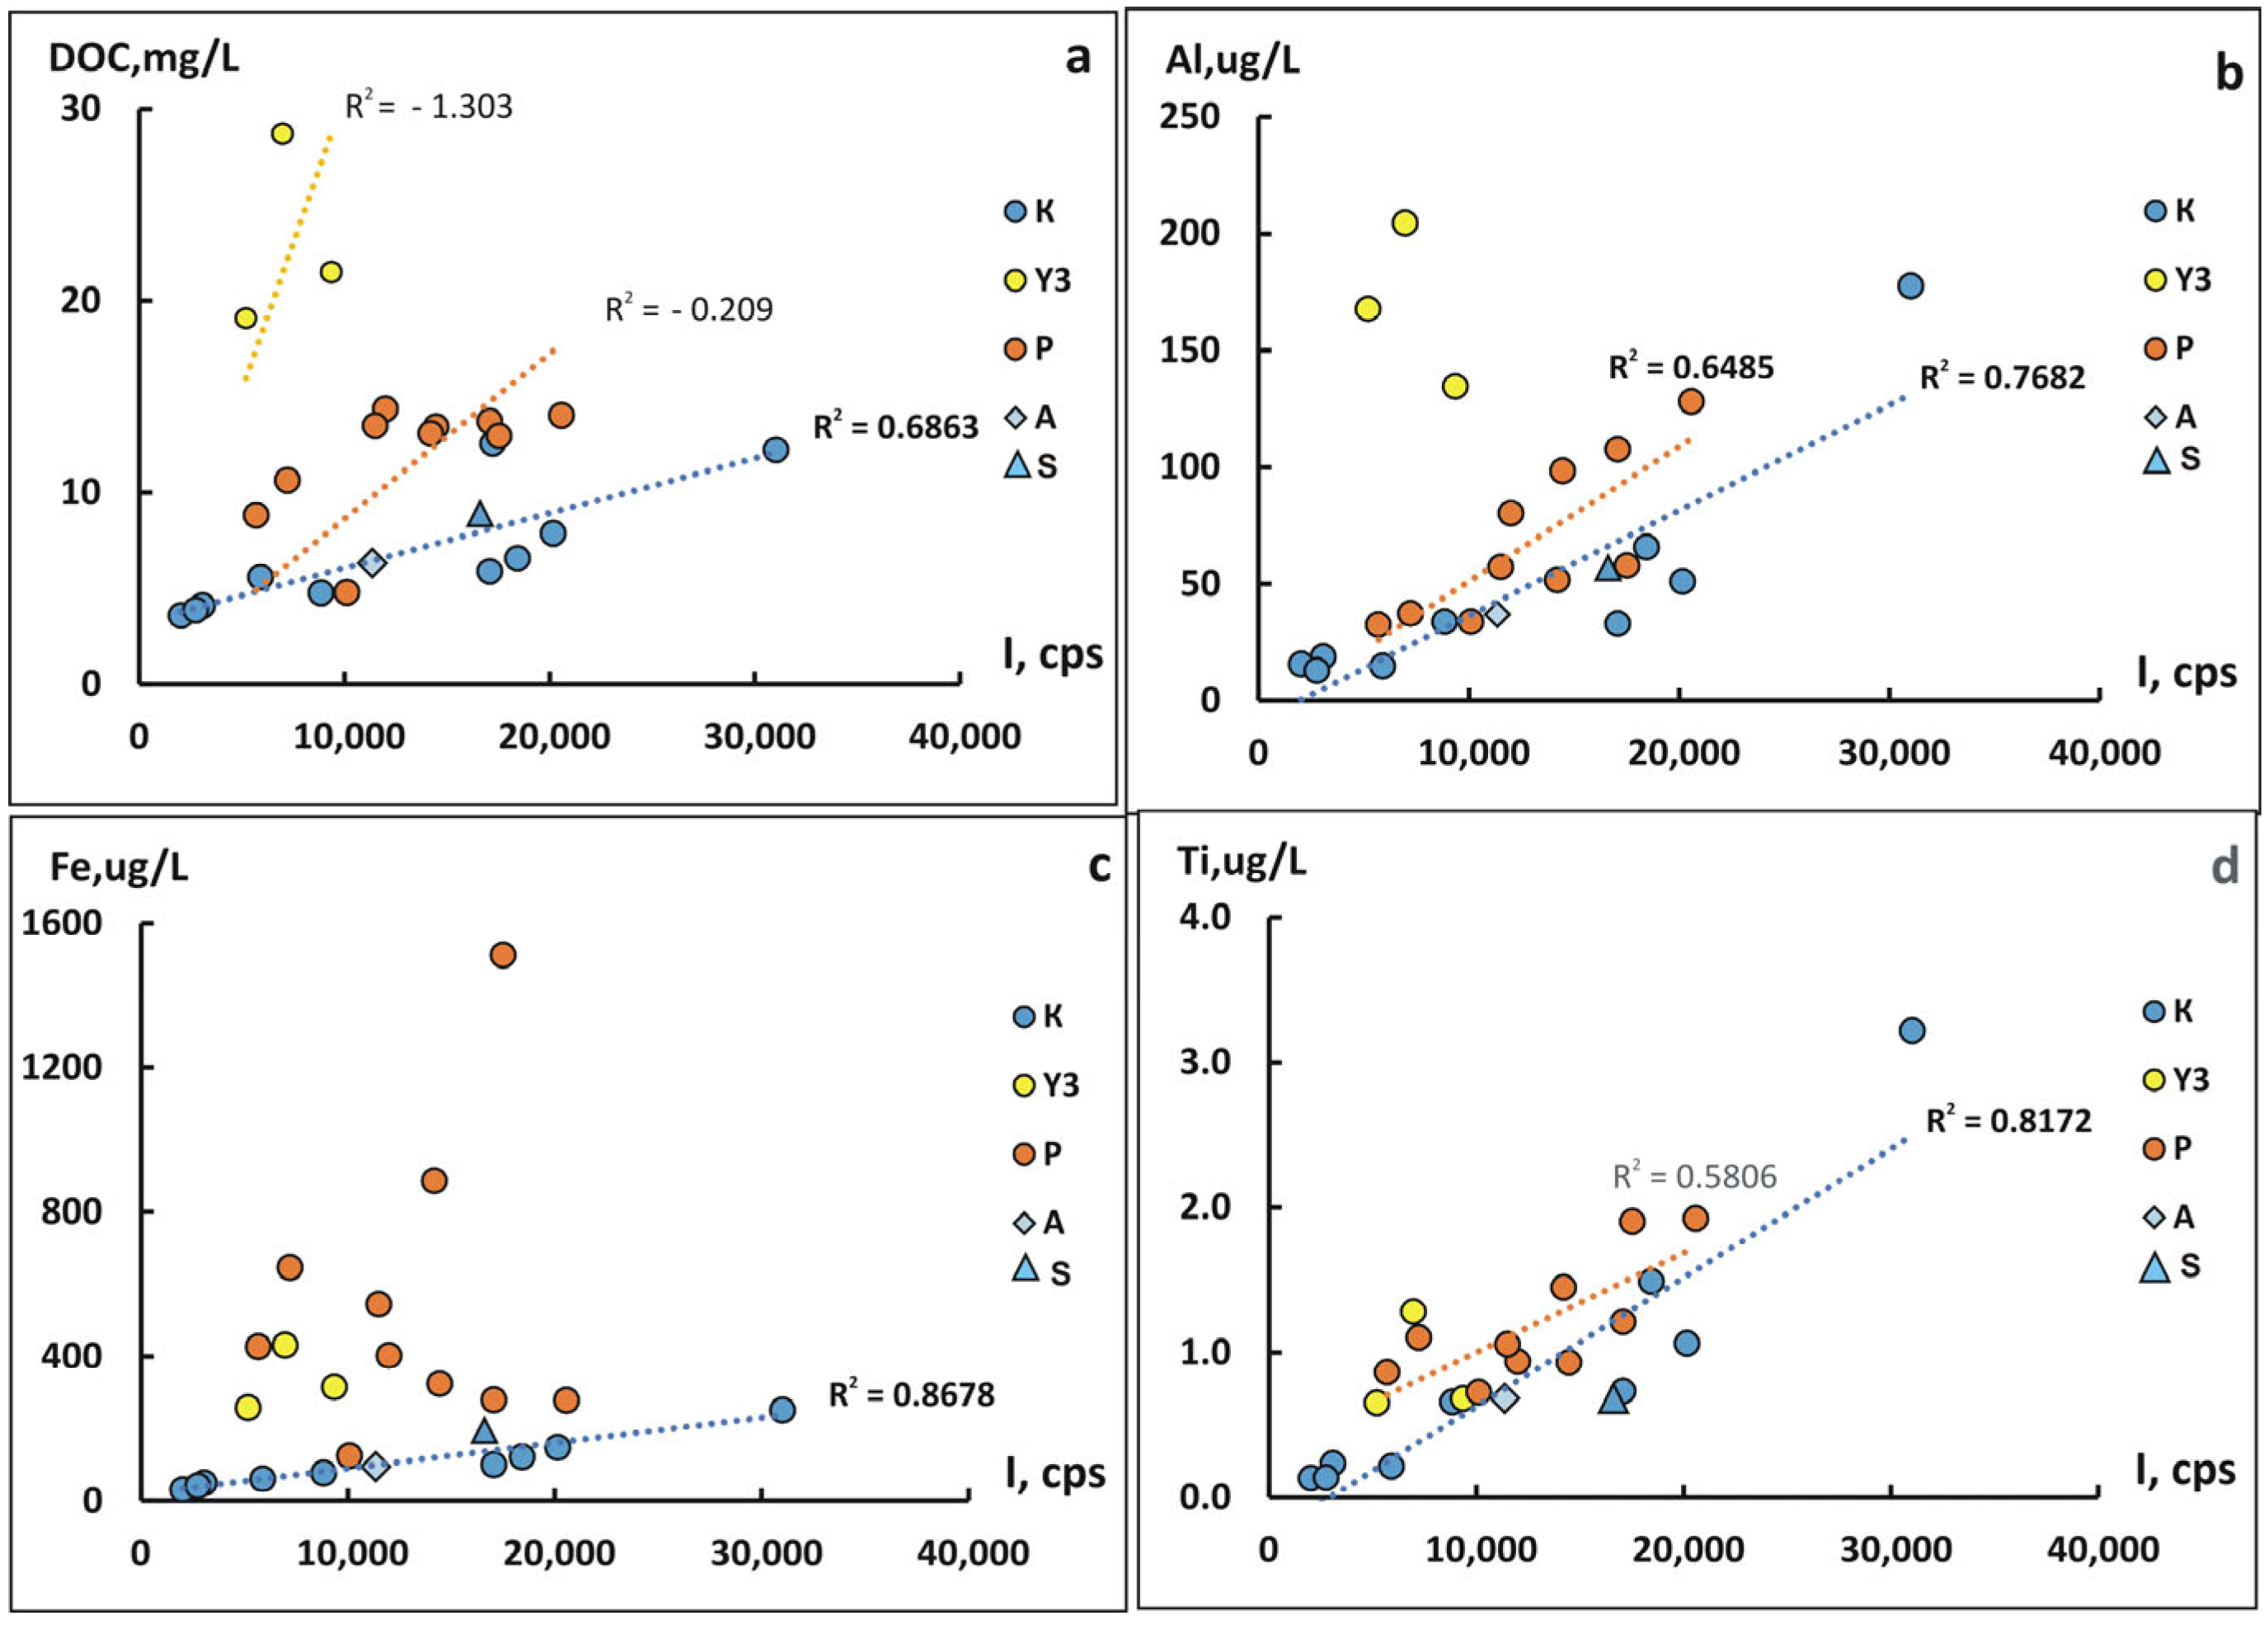
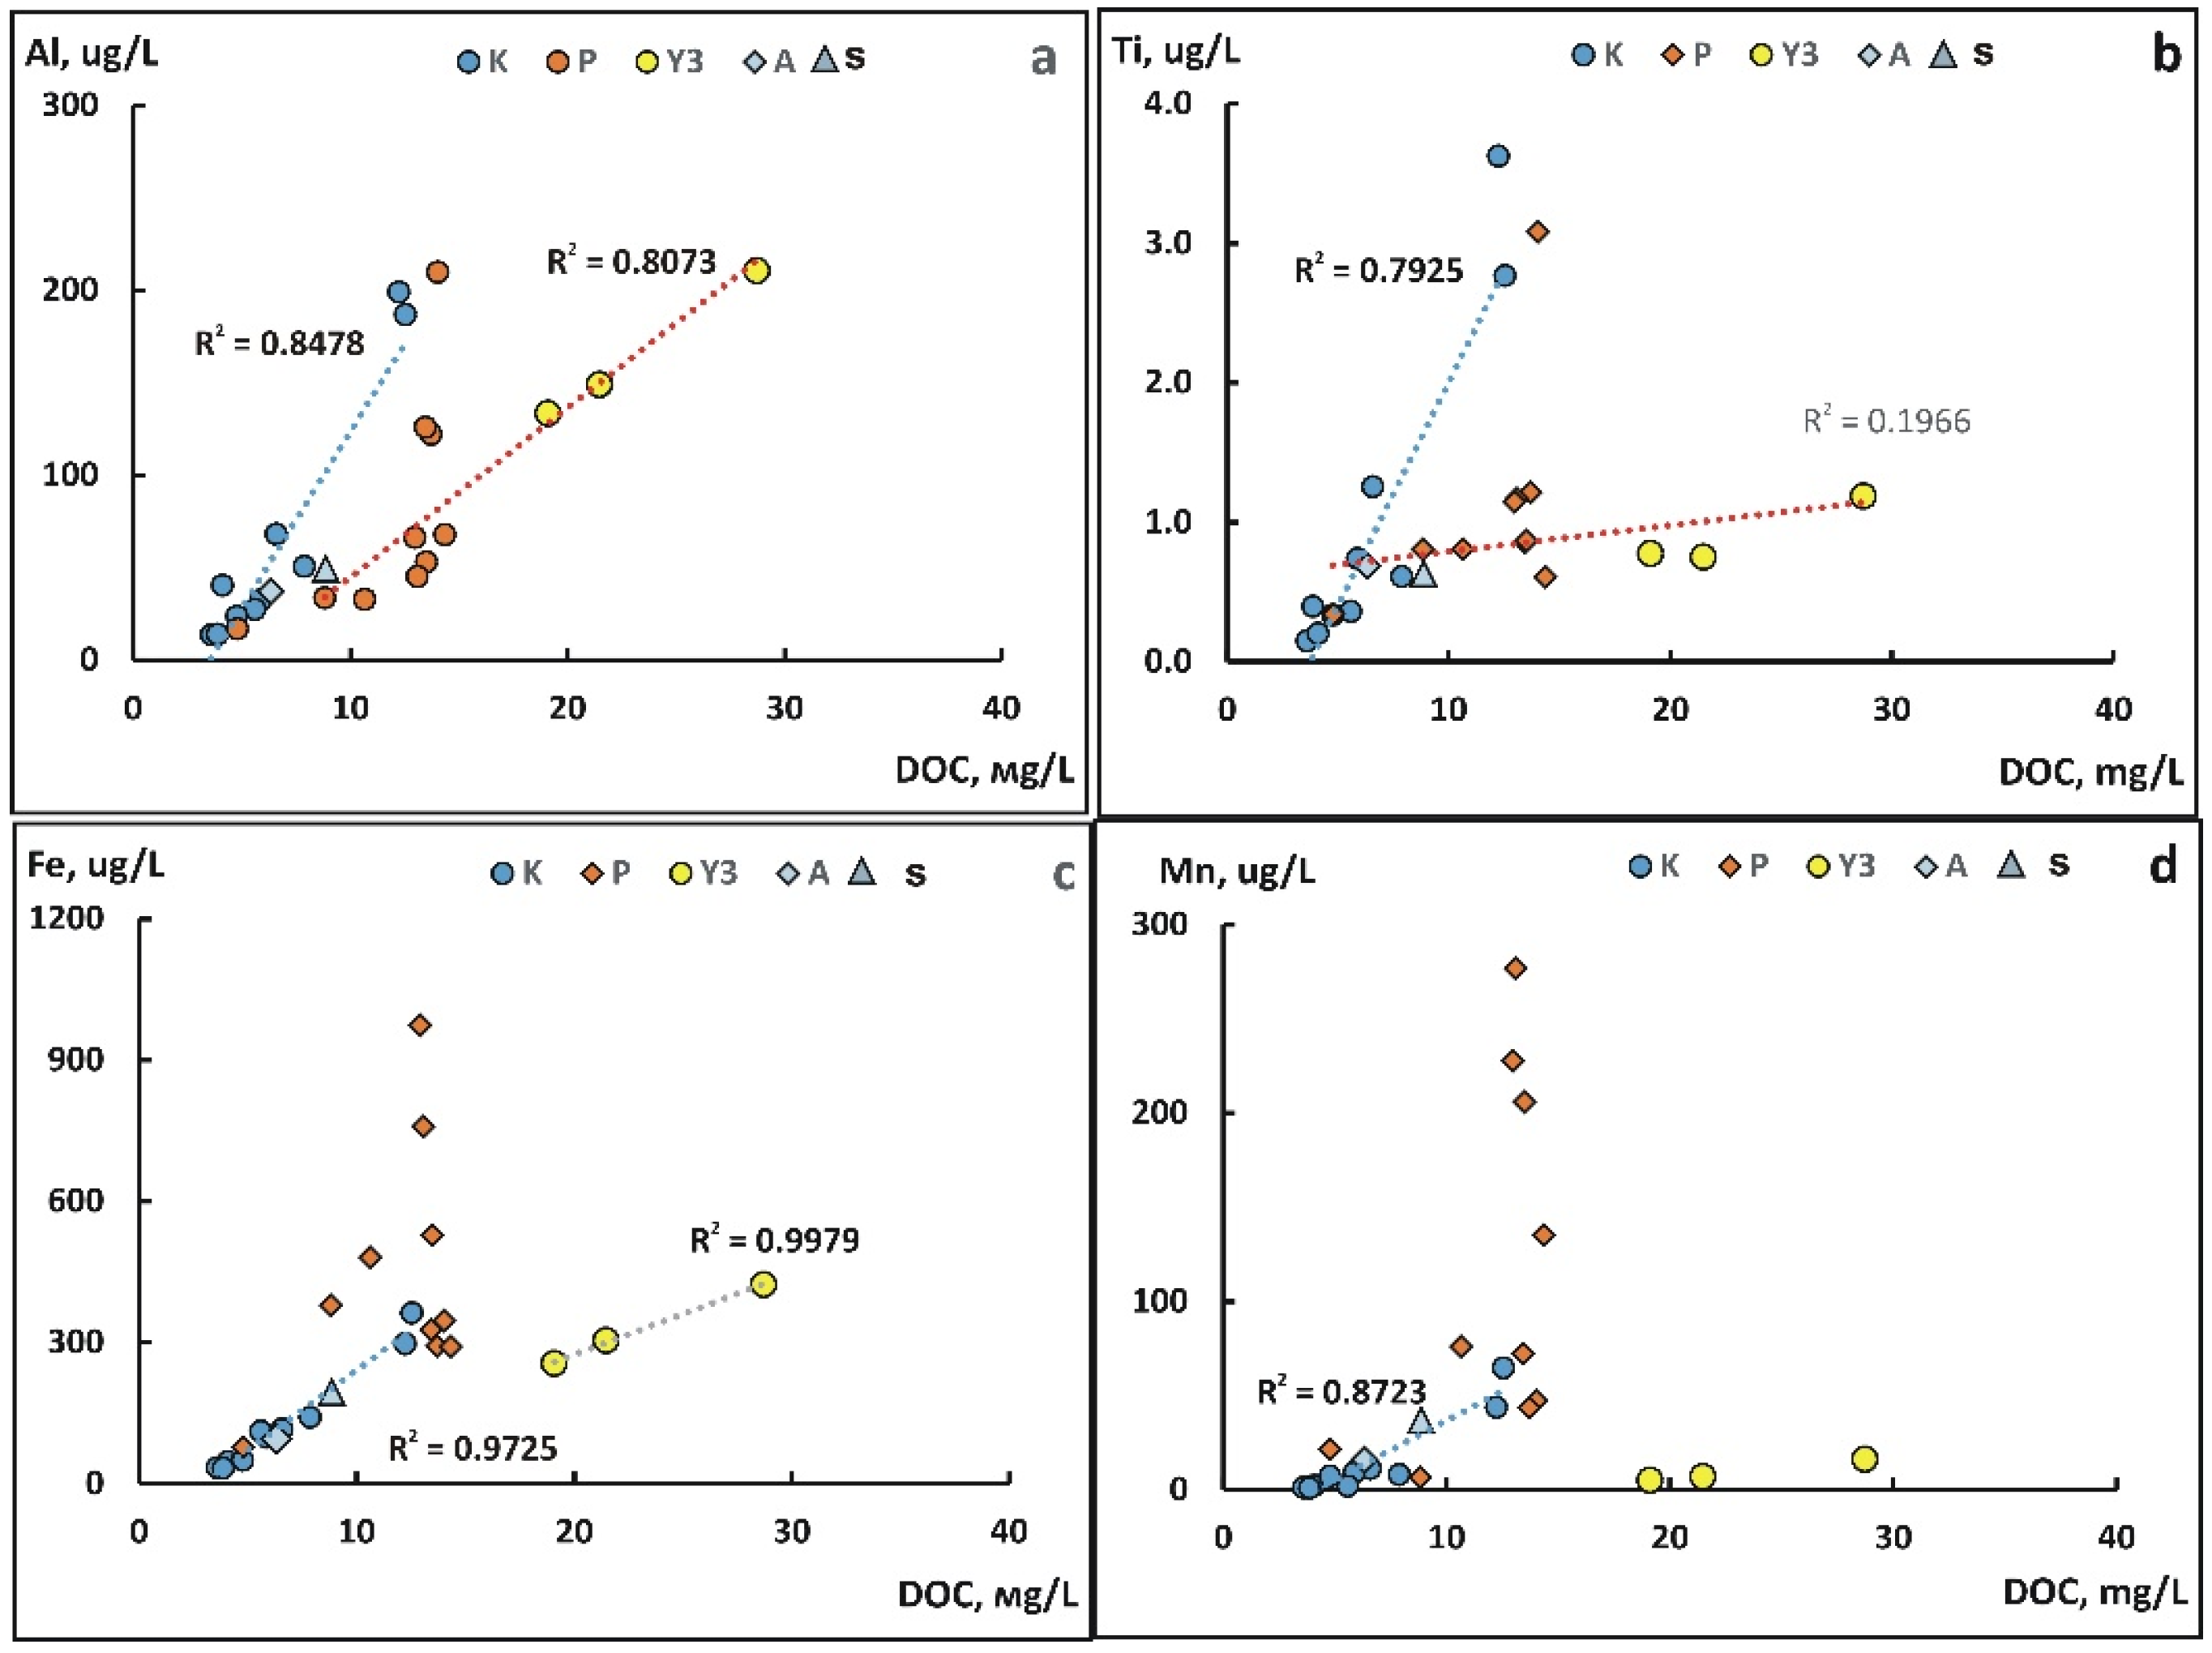
As shown in Section 3.4, during the freshet in the lower Kolyma watercourses, notable changes in the concentration of many chemical elements are observed in the 0.45 µm filtrates, which comprise dissolved and some colloidal, including coarse colloidal (0.05–0.45 µm), forms of elements. Analysis of the variability in concentrations of the chemical elements in the filtrates was based on their relationship with supposed major master variables: the content of coarse colloids and DOC. Correlation matrices are presented in the Supplementary Materials and related coefficients of determination are shown in Figure 10, Figure 11, Figure 12, Figure 13, Figure 14 and Figure 15.
High variability of the chemical composition of waters during the spring freshet for large Arctic rivers has been noted repeatedly [5,8,9,10,17]. A reduced level of total mineralization, and the concentration of major cations, alkalinity (DIC), and trace elements migrating mainly in dissolved forms (Li, Sr, and Ba), always accompany the freshet peak. An increase in the concentration of these elements is observed during the freshet decline [13,17]. Obviously, the main reason for such a pattern is a change in the quota of low-mineralized meltwater, which is maximal at the peak and decreases during the waning of the freshet. In the Panteleikha River and other floodplain watercourses filled with meltwater during the freshet peak, the increase in mineralization during water decline occurs more slowly than in the main stream of the Kolyma River, which is logically explained by the diminished rate of water exchange.
Contrariwise, the maximum content of DOC, Fe, Al, and other hydrolysates in filtrates was observed at the freshet peak, which is also consistent with the data obtained for other rivers of the Arctic basin [9,10,13,17]. Coinciding trends for the decrease in the content of coarse colloids, DOC, and hydrolysates in filtrates during the freshet decline led to the significant correlation between these parameters, despite the difference in forms of occurrence and controlling processes. In particular, in the main stream of the Kolyma River, the content of DOC demonstrates a significant correlation with coarse colloids 0.05–0.45 μm (Figure 10a).
However, detailed studies with cascade ultrafiltration and field-flow fractionation have shown unambiguously that the DOC in river waters of the boreal and arctic zones migrate mainly in small colloidal <0.003 μm (<3 KDa) and/or dissolved forms <0.001 μm [13,23,34]. The minimal influence of the filters clogging in the DOC analysis supports this hypothesis [35]. Therefore, the correlation between the DOC and the content of coarse colloids in the main stream of the Kolyma River is only due to the coinciding response of these characteristics to a common factor: a decrease in water flux. There is no cause-and-effect relationship between the DOC and coarse colloids. This is supported by the fact that in the Panteleikha River and the Y3 creek, where the water dynamic is not a key factor, there is no correlation between the DOC and coarse colloids (Figure 10a). At the same time, a significant correlation of Al and Ti with the content of coarse colloids both in the main stream of the Kolyma River and in the Panteleikha River indicates the significant role of coarse colloids in the migration of these metals. Only in the Y3 creek there is no connection between Al and Ti and the content of coarse colloids (Figure 10b,d), and coarse colloidal forms of these metals are negligible in Y3 creek. For Fe, a connection with the content of coarse colloids is observed only in the main stream of the Kolyma River (Figure 10c). The dominance of coarse colloidal forms of Fe here could be assumed based on the data obtained for other rivers of the boreal and Arctic zones [10,13,17]. At the same time, there is an obvious lack of a link between the concentration of Fe and the content of coarse colloids in the Panteleikha River and in the Y3 creek (Figure 10c). It indicates that in these watercourses, during the freshet, the input and migration of Fe take place as dissolved and/or fine colloidal forms.
Figure 10. Dependence of the concentration of (a) DOC in filtrates <0.45 µm, as well as (b) Al, (c) Fe, and (d) Ti on the content of coarse colloids estimated by the intensity of DLS. Here and in Figure 11, Figure 12, Figure 13, Figure 14 and Figure 15, the blue circle is Kolyma (K), the brown circle is Panteleikha (P), the yellow circle is Rodinka creek (Y3), the triangle is Stadukhinskaya Protoka (S), and the diamond is the Anyui (A). Explanation is the same for Figure 11, Figure 12, Figure 13, Figure 14 and Figure 15.
Water 17 02400 g010
Additional information on the controlling processes could be provided by the dependence of elements’ concentrations on the DOC in the filtrates (Figure 11). Two groups of samples are distinguished for Al and Ti, (Figure 11a,b): the first includes samples from the main stream of the Kolyma River and samples from the Panteleikha River, collected at the beginning and end of the sampling period. The second group includes samples from the Panteleikha River, collected during the period of gradual transformation of the chemical composition (Figure 2, Figure 3, Figure 4, Figure 5, Figure 6, Figure 7, Figure 8 and Figure 9), as well as water from the Y3 creek. A significant correlation between Al and the DOC content was observed in the second group (Figure 11a). This indicates the possibility of the presence of organic fine colloidal forms of Al here. A similar link between Al and fine organic colloids was observed in the rivers from northwestern Russia [10,35]. At the same time, the relationship with the DOC was not significant for Ti in the Panteleikha River (Figure 11b).
Figure 11. Relationship between the concentration of (a) Al, (b) Ti, (c) Fe, and (d) Mn and the concentration of DOC in filtrates <0.45 µm during the freshet decline in the watercourses of the Kolyma River low reaches.
Water 17 02400 g011
Three groups of samples with different patterns of relationships with the DOC were observed for Fe (Figure 11c). The water of the Kolyma River main stream shows a significant correlation between the DOC and dissolved/colloidal Fe due to the common influence of a decrease in water discharge. Water from the Panteleikha River has a high variability of dissolved Fe regardless of the DOC. The water of the Y3 creek, despite the small number of samples, shows variations in dissolved Fe proportional to the DOC concentration (Figure 11c). Such a distribution reflects the different sources of Fe: (1) coarse colloidal forms of Fe in the main stream of the Kolyma River, (2) dissolved forms of Fe not associated with the DOC in the Panteleikha River, and (3) fine organic colloidal Fe forms in the Y3 creek. The latter is typical for the waters of swampy landscapes [4,13,23]. The relationship between Mn and the DOC content is observed in the main stream of the Kolyma River and is absent in the Panteleikha River, i.e., it is similar to Fe (Figure 11c,d). However, in the Y3 creek, the Mn concentration is minimal, in accordance with the minimal affinity of this metal to DOC compared with other hydrolysates [23].
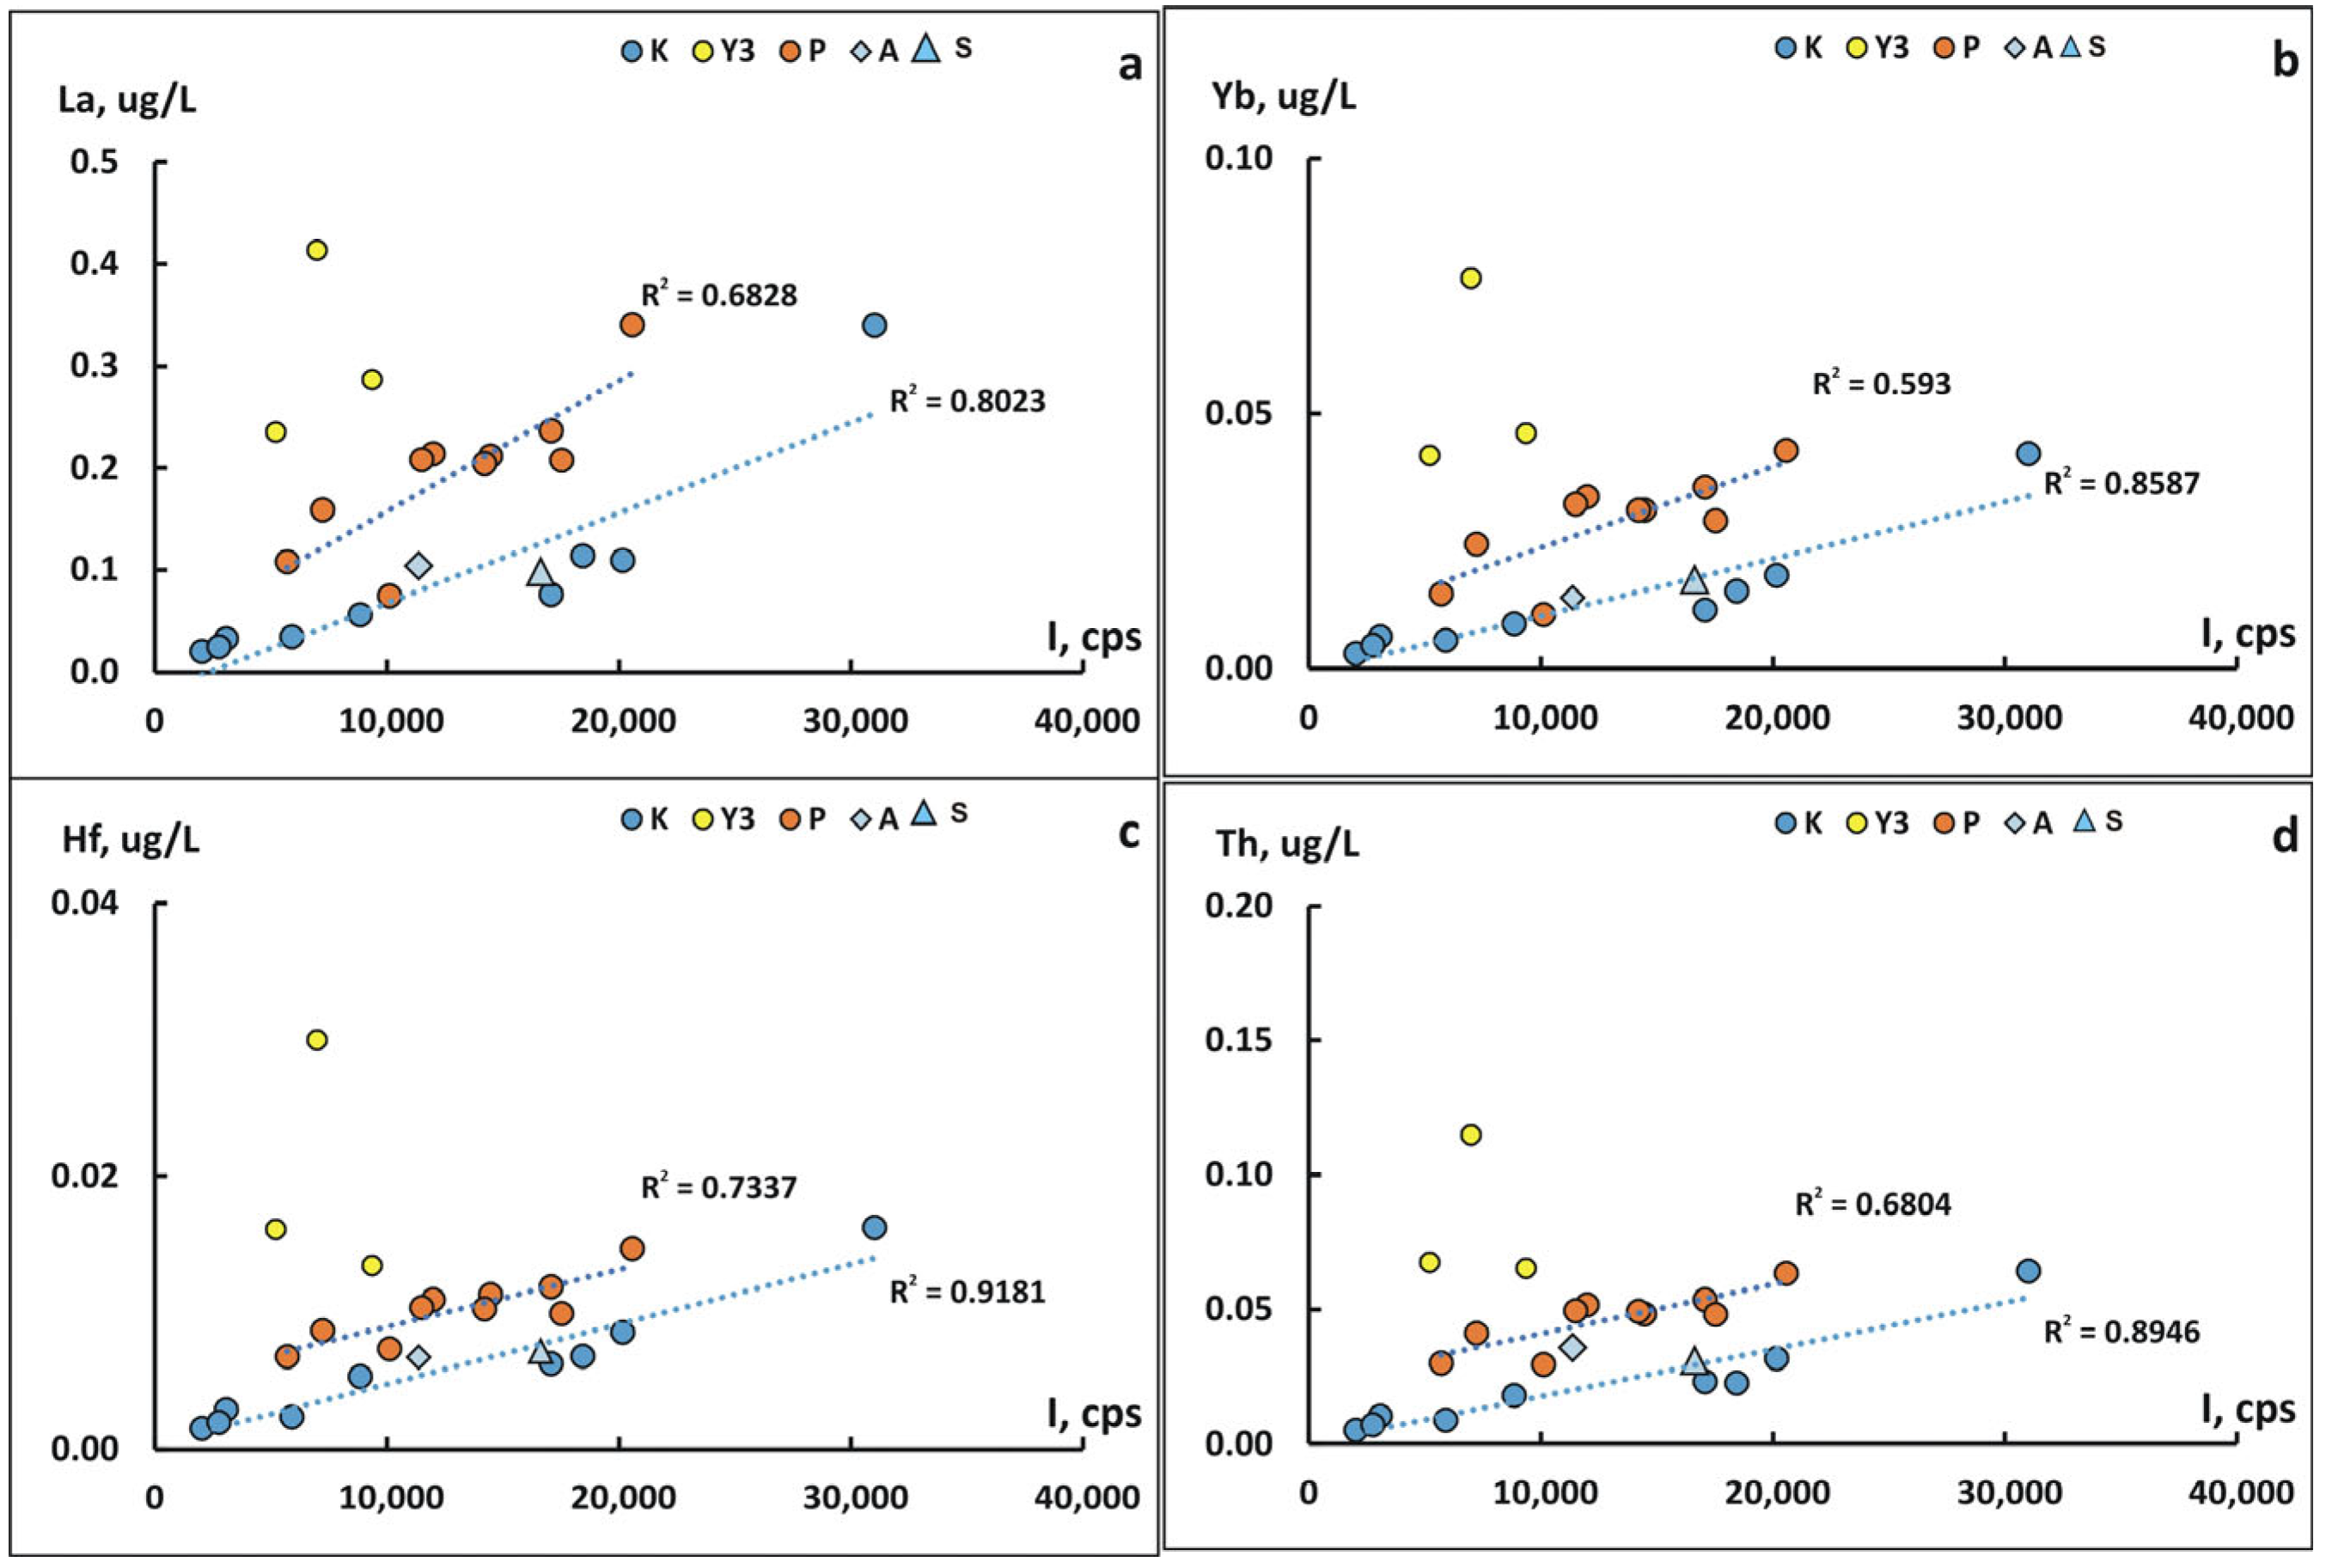
The increase in the Fe and Mn concentration in the Panteleikha River without a connection with the contents of coarse colloids and the DOC allows us to suggest redox processes as a major reason for the mobilization of dissolved forms of Fe and Mn to the floodplain streams in summer. It is corroborated by a more detailed survey of the pristine Arctic Taz River with a vast floodplain and numerous lakes and watercourses [5]. Trace elements of hydrolysates, including REEs, demonstrate the significant link with the content of coarse colloids in the main stream of the Kolyma River, similar to Fe and Al. In the Panteleikha River, the relationship between the concentration of hydrolysates and the content of coarse colloids weakens, and in the Y3 creek, it is absent (Figure 12).
Figure 12. Dependence of the concentration of (a) La, (b) Yb, (c) Hf, and (d) Th in filtrates <0.45 µm on the content of coarse colloids estimated by the intensity of DLS.
Water 17 02400 g012
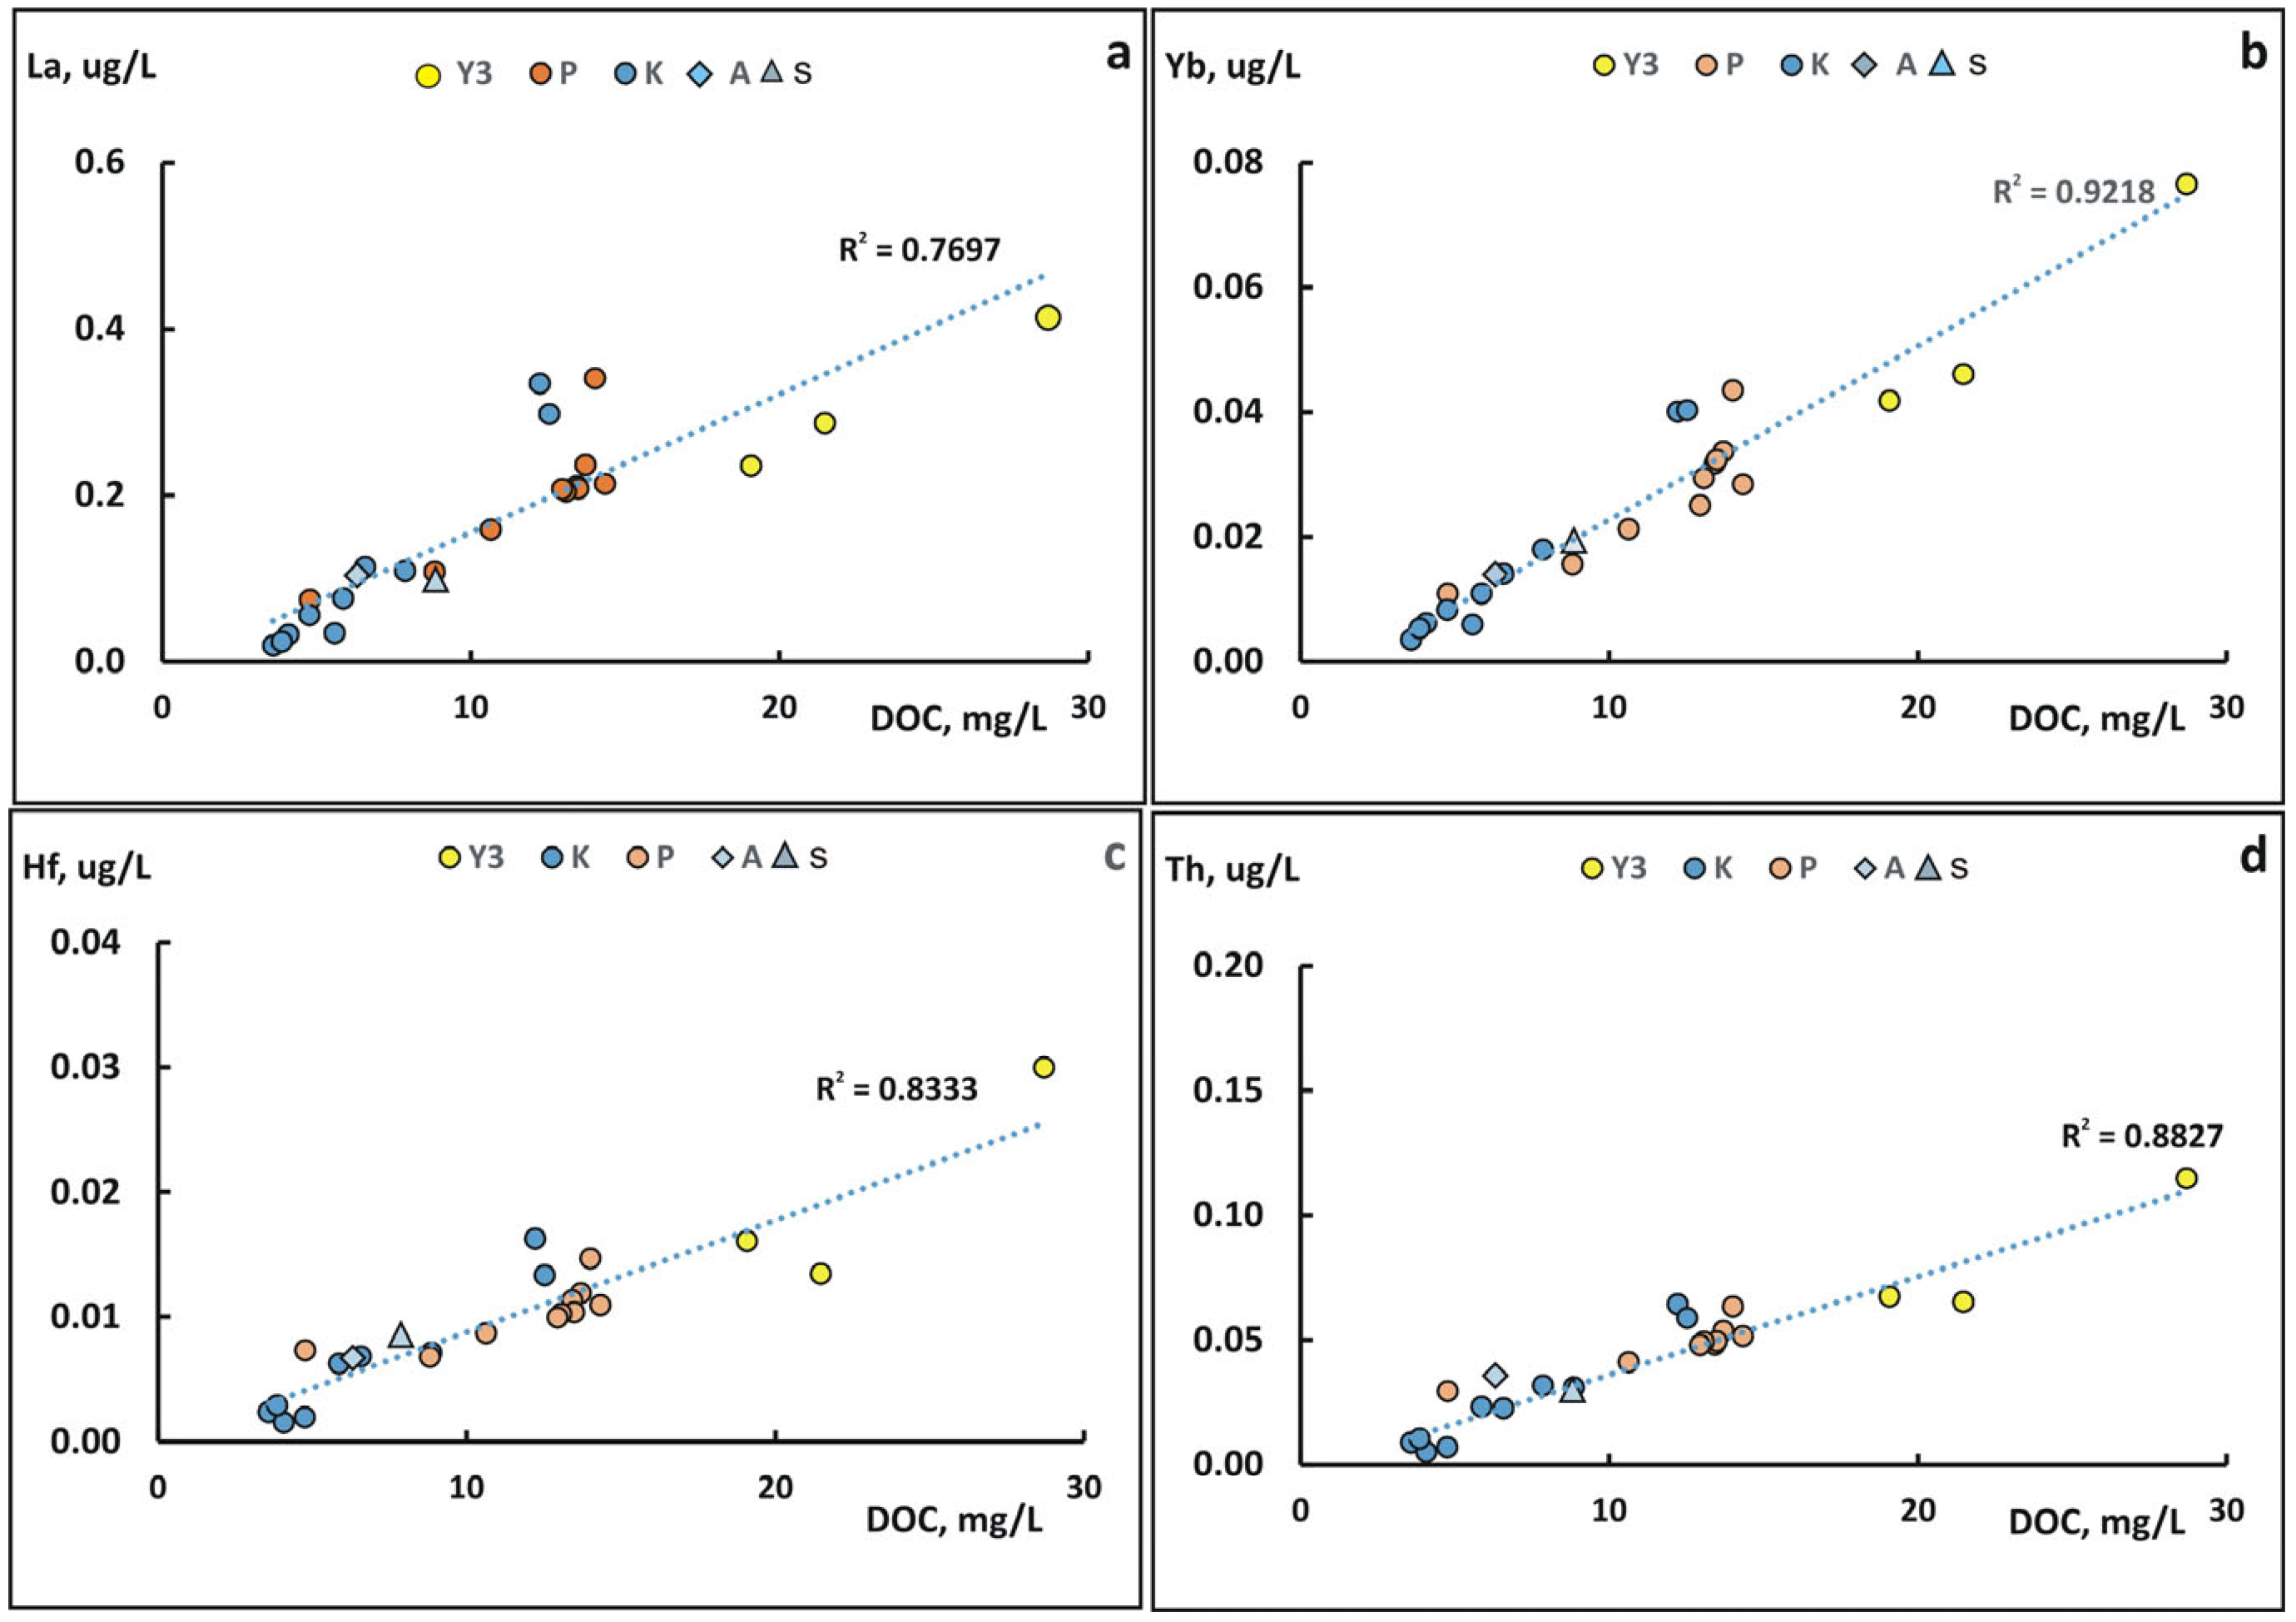
At the same time, REEs and other trace elements of hydrolysates reveal a significant correlation with the DOC content, and the pattern of this dependence is quite similar for the Kolyma River main stream, the Panteleikha River, and Y3 creek (Figure 13). This indicates the general control of the DOC over the migration of trace hydrolysates in the Kolyma watercourses at the freshet. It is supported by the results for other rivers of the boreal and Arctic zones [36,37,38]. However, a significant correlation of trace hydrolysates with the content of coarse colloids in the Panteleikha River (Figure 12) does not allow for excluding the role of coarse colloidal forms as well.
Figure 13. Relationship between the concentration of (a) La, (b) Yb, (c) Hf, and (d) Th, and the concentration of DOC in filtrates <0.45 µm during the freshet in the watercourses of the Kolyma River low reaches.
Water 17 02400 g013
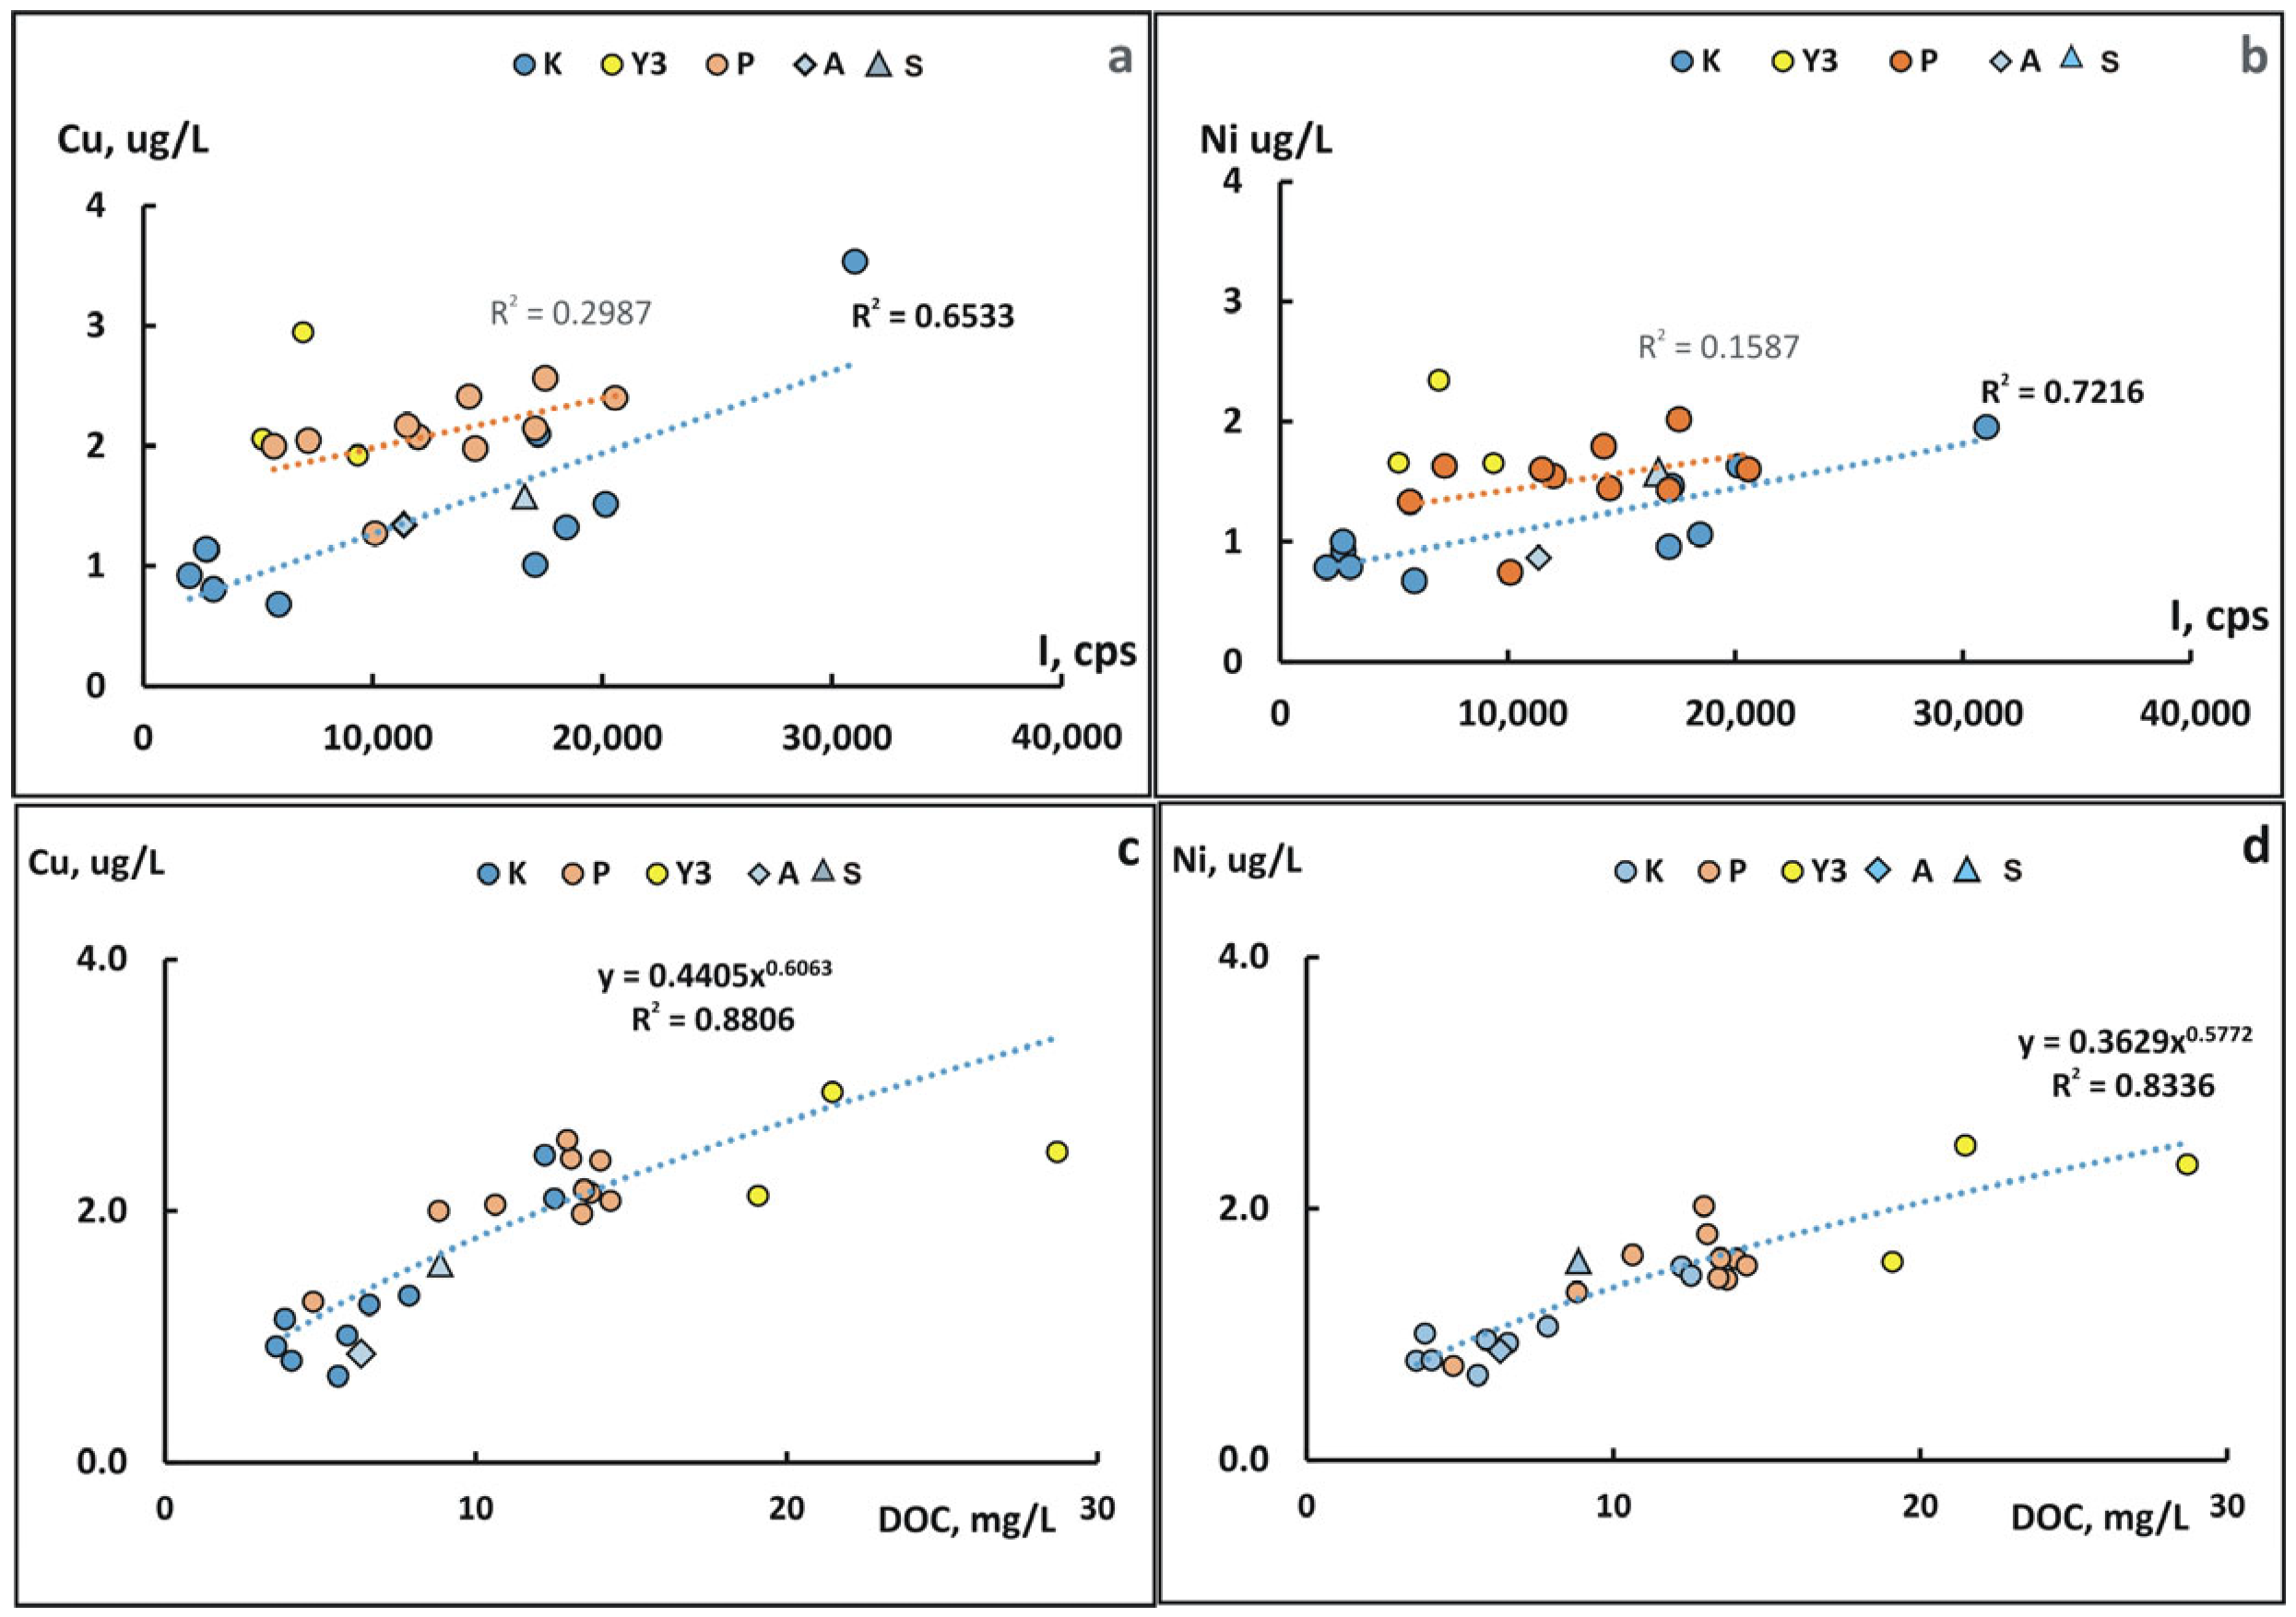
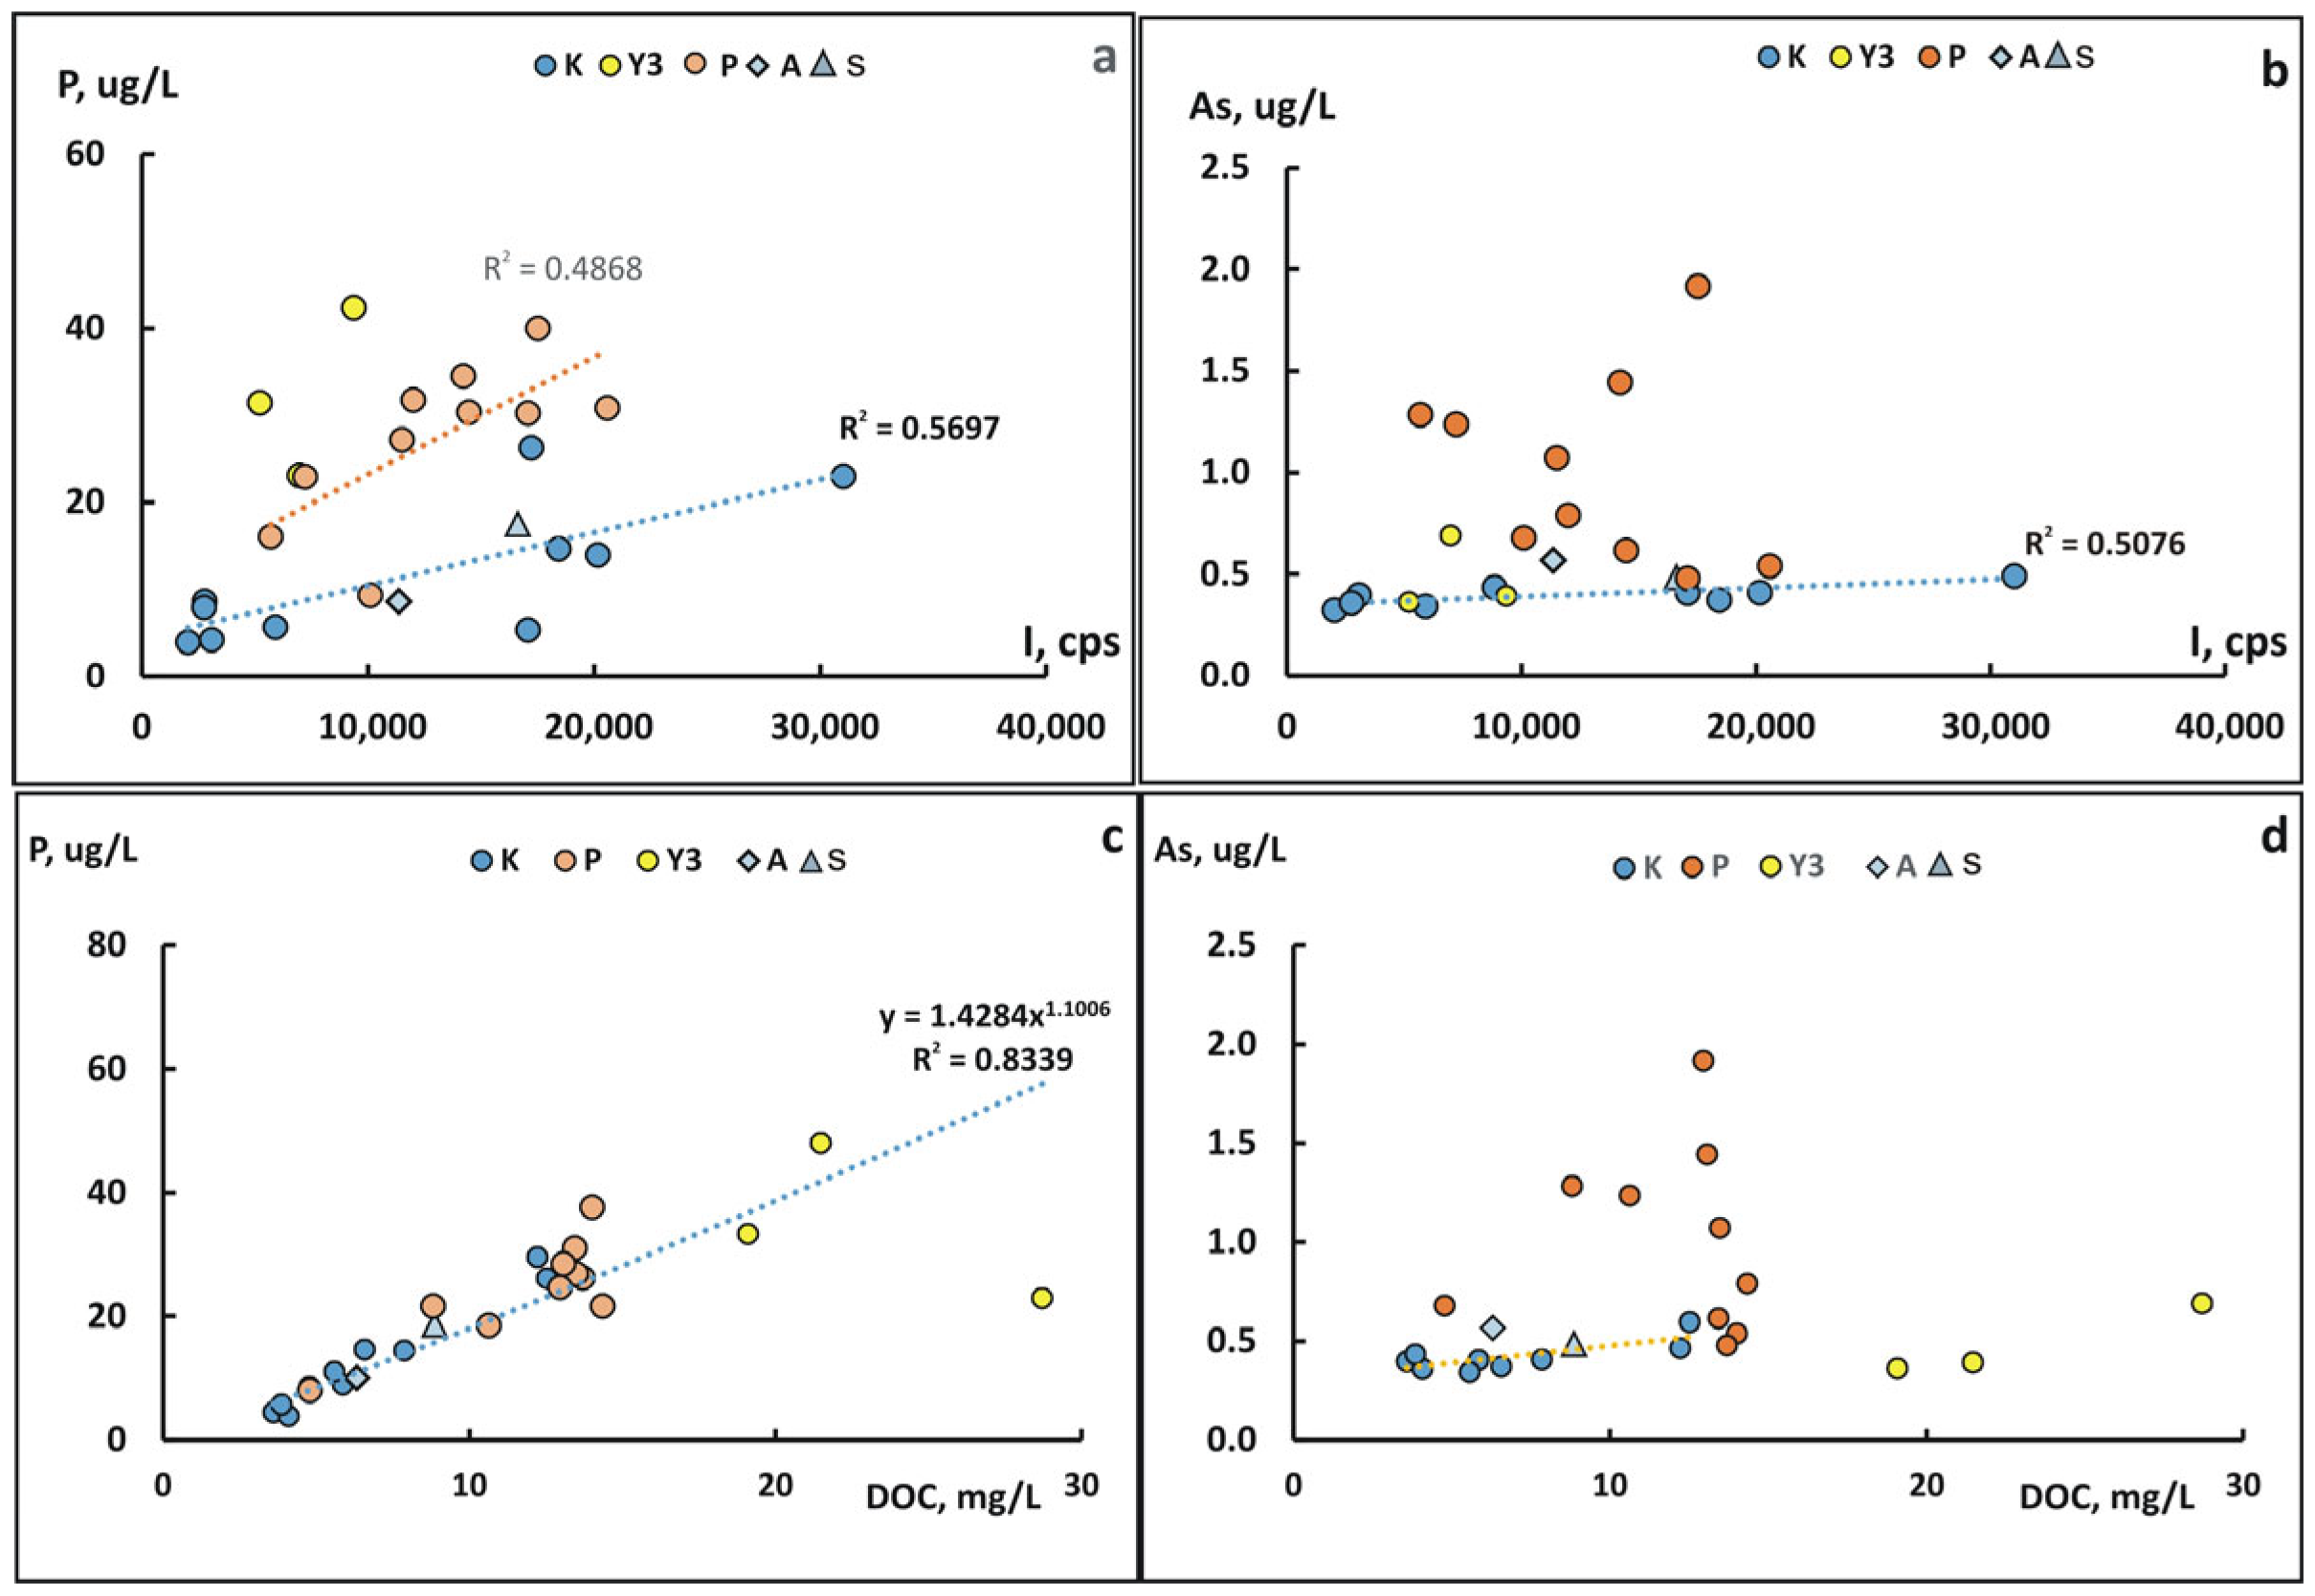
For “heavy metals” (Cu, Ni, Zn, and Cd), the relationship with the content of coarse colloids is significant for the main stream of the Kolyma River only. However, a significant relationship with the concentration of DOC was observed for all watercourses (Figure 14c,d as an example for Cu and Ni). Oxyanions P, As, V, and Co, often connected with Mn, also show a weak connection with coarse colloids in the main stream of the Kolyma River only (Figure 15a,b for P, As). Correlation with the DOC is significant for P but is absent for As (Figure 15c,d), V, and Co. This indicates that P, as well as Cu, Ni, REEs, and trace hydrolysates (Sc, Zr, Y, Hf, and Th) enter the Panteleikha River together with the DOC, mainly due to thawing and destruction processes of the topsoil and plant litter layer [5,17]. However, for As, V, Co, as well as for Fe and Mn, the influx from floodplain lakes and watercourses’ bottom sediments, probably due to redox processes, could be more important [5,9,10].
Figure 14. Relationship between the concentration of Cu (a,c) and Ni (b,d) in filtrates <0.45 µm with the content of coarse colloids (a,b) and with the concentration of DOC (c,d) during the freshet in the watercourses of the Kolyma River low reaches.
Water 17 02400 g014
Figure 15. Relationship between the concentration of P (a,c) and As (b,d) in filtrates <0.45 µm with the content of coarse colloids (a,b) and with the concentration of DOC (c,d) during the freshet in the watercourses of the Kolyma River low reaches.
Water 17 02400 g015
Thus, the core reason for the change in the chemical composition of the Kolyma River main stream waters during the spring freshet is a ratio of the water volumes provided by the flood peak and winter/spring base flow, because these two major components of Kolyma River spring flux have different chemical characteristics. A low specific conductivity (proxy of mineralization) with a low concentration of major cations and easily soluble trace elements (e.g., Li, Sr, and Ba), and a simultaneously enlarged concentration of DOC, P, coarse colloids (0.05–0.45 μm), heavy metals (Zn, Cu, Ni, and Cd), and hydrolysates (Fe, Al, Ti, REEs, Th, Zr, and Hf) are typical for the freshet peak period. An elevated specific conductivity and the diminished content of DOC are typical for the Kolyma River main stream at the base flow periods until October, before ice cover, and in May, before ice-off (Figure 3). During summer 2024, already in the second half of June, waters of the Kolyma River main stream returned to the base flow regime in terms of specific conductivity and DOC. It supports the spring freshet scale as a major factor for the seasonal variability in mineralization and the DOC in the Kolyma mainstream. Published data of trace elements in the Kolyma River main stream for July–August 2019–2020 [11] are similar to the data for the second half of June 2024. It allows us to assume that for the trace elements in the Kolyma main stream, the spring freshet is also a key factor for the seasonal changes in concentrations. At the same time, to make it certain, data on the trace elements during the ice cover period, especially before ice-off, is necessary. The summer rain floods also coincide with a decrease in mineralization and increase in the DOC, coarse colloids, hydrolysates, and heavy metals in the filtrates but are dependent on the summer floods’ discharge, which is notably less than the spring freshet [22].
The chemical composition of the big floodplain watercourse of the Panteleikha River at the freshet peak is close to the same in the Kolyma River main stream, reflecting the full filling of the floodplain by “spring freshet water”. Further changes in June were controlled by different factors. Specific conductivity, concentration of major cations, and soluble elements showed a slight increase (Sr, Ba) or insignificant variations (Li). Less active water exchange in Panteleikha River compared with the Kolyma main stream seems to be a logical reason for such slow changes in these chemical characteristics during freshet waning. Slow water exchange also can explain the slight decrease in the DOC, number of hydrolysates, and heavy metals in the Panteleikha River compared with the Kolyma main stream. At the same time, Fe and Mn, but also As, Co, Rb, V, and P, revealed a significant upsurge in the Panteleikha River during the second half of June. The latter group of elements showed 2–4 times more growth, but Fe and Mn increased 5–7 times. The only explanation of such a pattern could be the additional input of these elements to the Panteleikha River from the thawing floodplain landscapes, with small tributaries, and from bottom sediments due to redox processes. The lack of correlation between Fe, Mn, As, Co, V, and the content of coarse colloids and DOC indicates the dominance of the low-molecular dissolved forms of these elements in their input to the Panteleikha River, and it is a collateral sign of the input from bottom sediments of floodplain channels and lakes [5,37]. The assessment of the role of additional input from down reaching floodplain sources to the overall Kolyma River fluxes of Fe, Mn, As, Co, V, and P needs a detailed study, due to the obvious spatial heterogeneity of the Kolyma River watercourse (Figure 1c).

4.3. The Role of Suspended Forms in the Content of Chemical Elements in the Kolyma River During Freshet

Based on the global assessment of particulate matter in the rivers, a major part of many chemical elements is the transport by rivers with suspended solids [39]. The quota of suspended forms is controlled by three factors. First, the chemical properties of elements determine the solubility of their compounds. Second are the concentrations of chemical elements in the suspended solids (µg/g dry weight) that are determined by the genesis of solids (mineral or organic), mineralogical composition, and possible authigenic and sorption/desorption processes [14,30,31,38,40]. The third factor is the content of suspended solids (mg/L) in the rivers, which is most variable, because it directly depends on the water discharge.
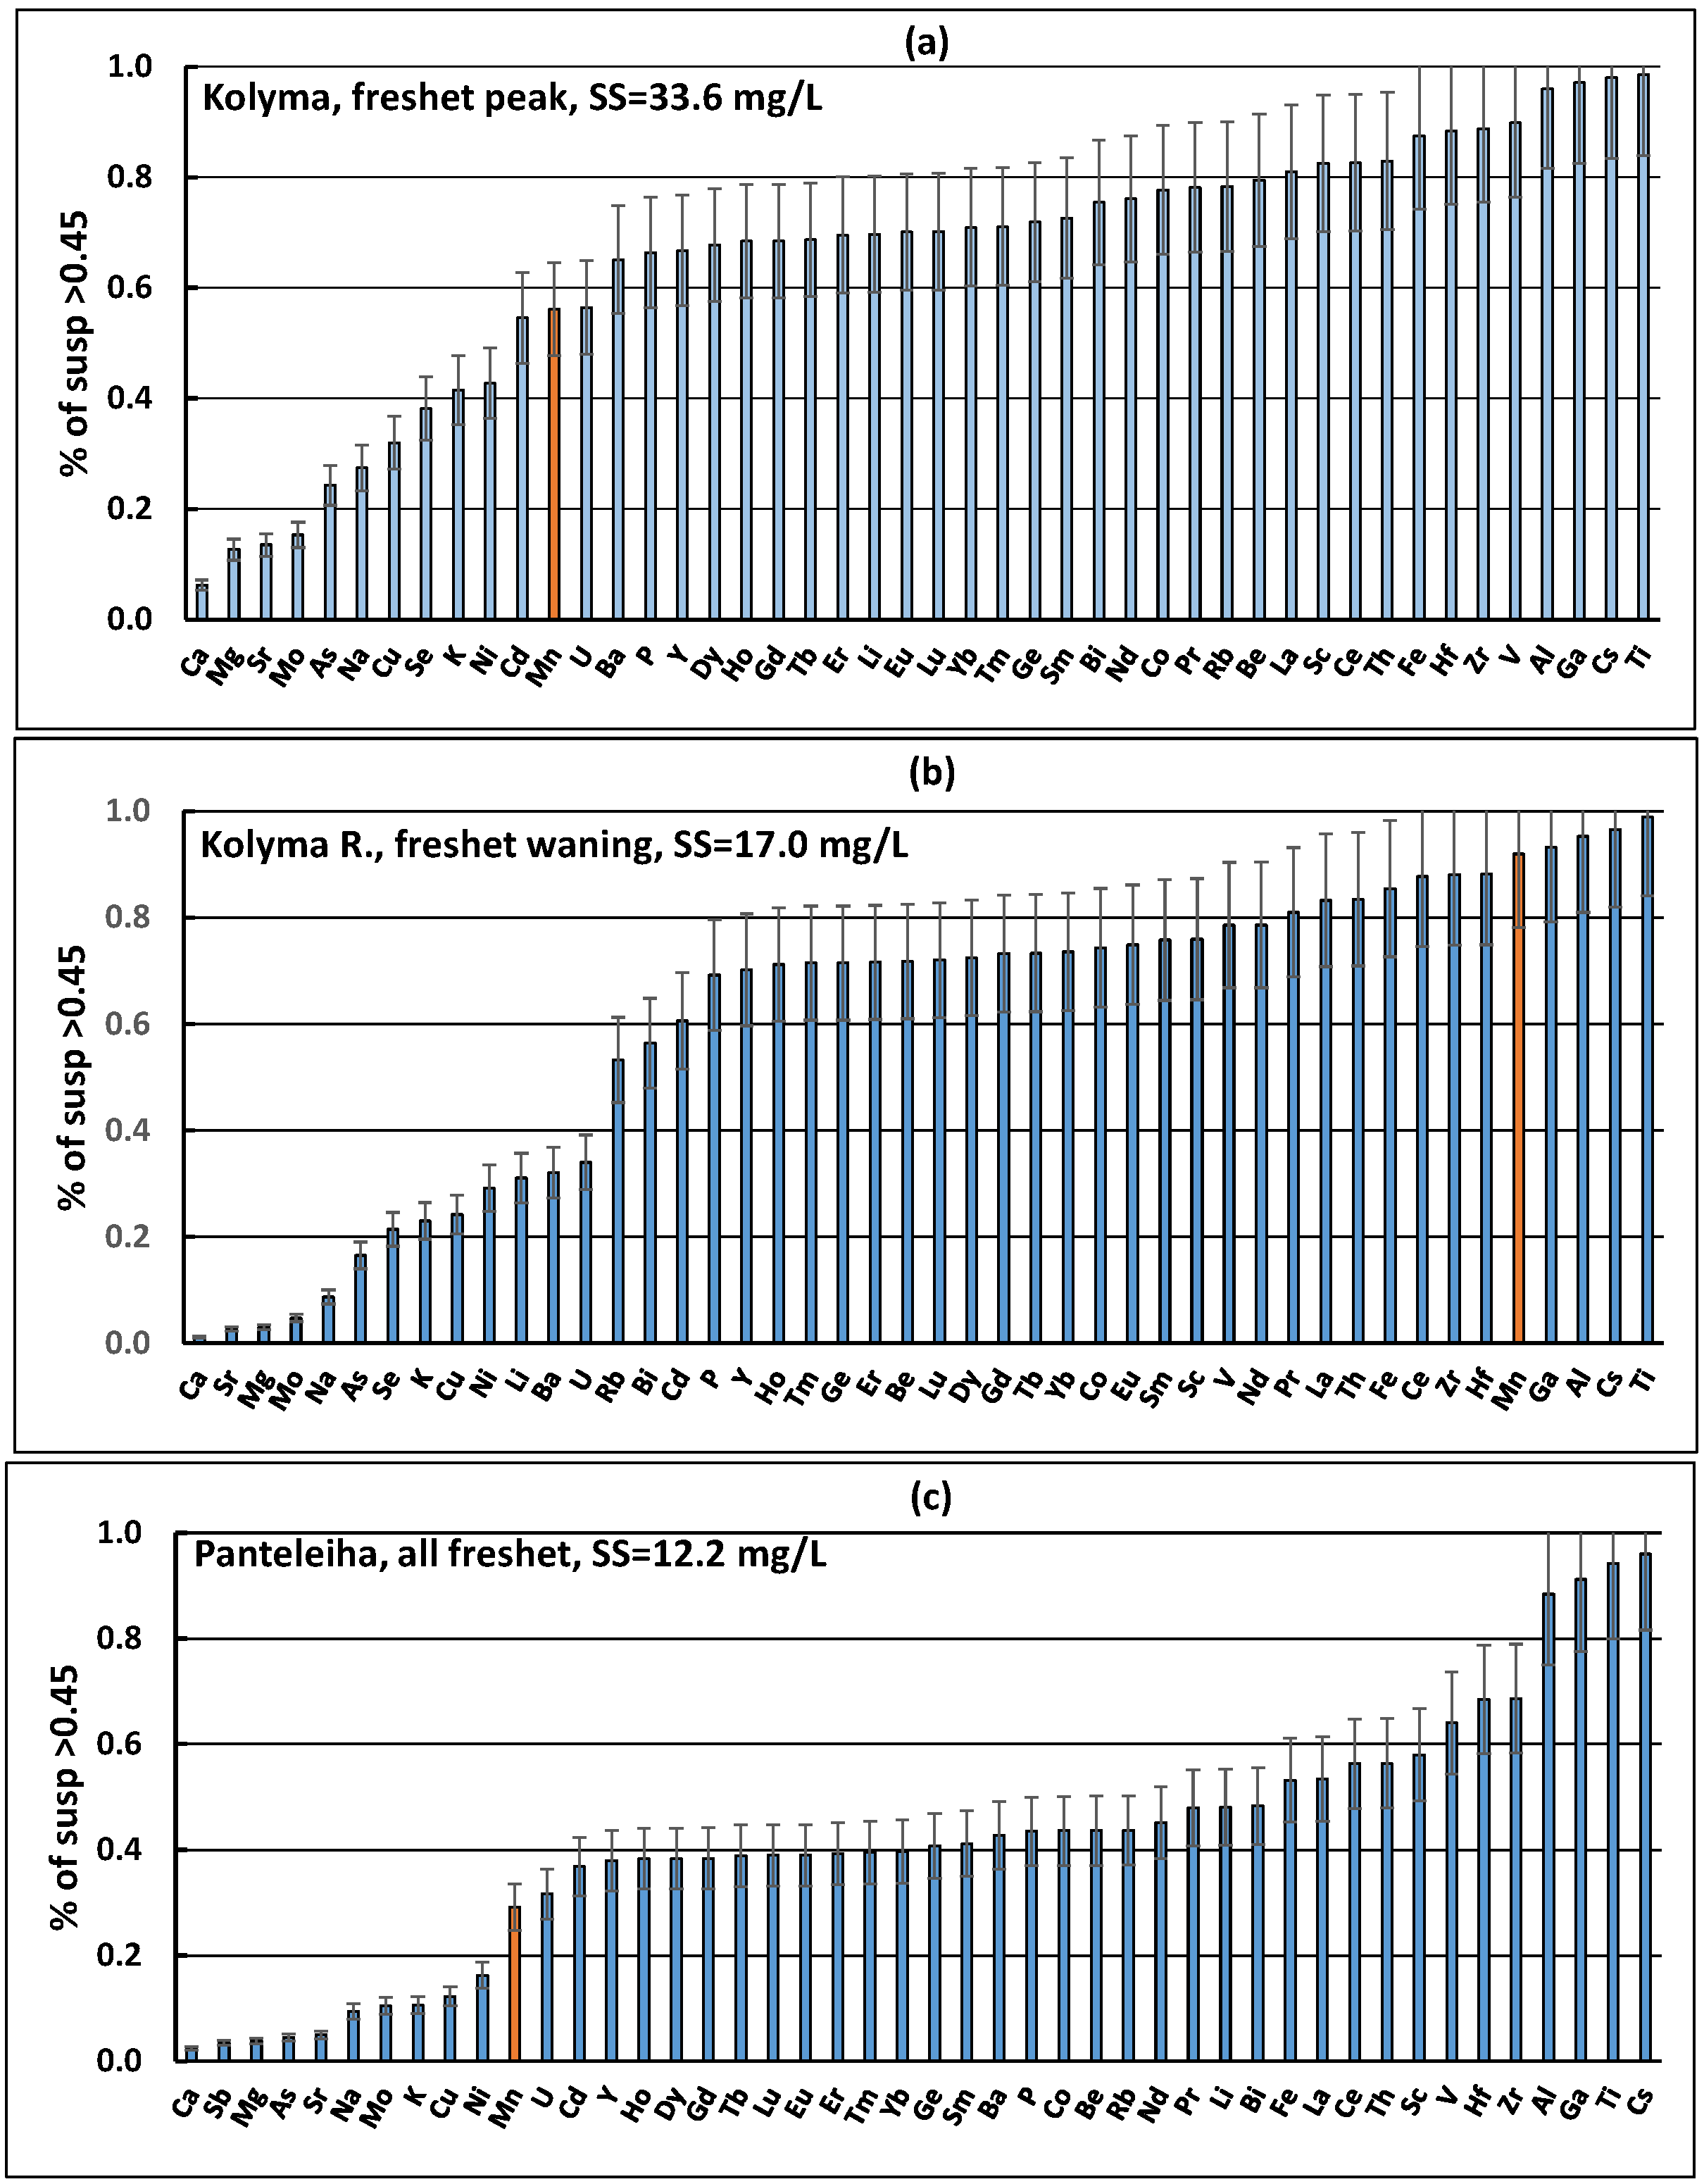
In the suspended solids of the Kolyma River main stream during the freshet, concentrations of chemical elements are rather stable (CV <20%) (Table 2, Figure S2). As a result, despite the notable (two times) decrease in suspended solids content, the quotas of the suspended forms of elements are similar at the peak and waning of the freshet in the Kolyma River. The row of elements by the quota of suspended forms does not change notably during the freshet (Figure 16a,b). Mn is the only exception, with a significant increase in the suspended forms quota from 56% at the freshet peak to 92% at the freshet decline. Double enrichment of the Kolyma River suspended solids by Mn (Figure S2c) is a reason for this. Simultaneously, a decrease in dissolved Mn (Figure 6d) allows us to assume oxidation of Mn2+ with further sorption on the suspended solids takes place [31].
The concentration of chemical elements in the suspended solids of the Panteleikha River is not so stable with the diminished concentration of Al and Ti at the elevation of P (Table 2, Figure S2). It marks their more biogenic nature compared with the main stream of the Kolyma. Moreover, suspended solids of the Panteleikha River during the second half of June are enriched notably by P and especially by Fe and Mn (Figure S2). For Fe and Mn, an increase in the suspended solids begins after the rise in their concentration in the filtrates <0.45 µm (Figure 6c,d). It means the “secondary” genesis of the enrichment of suspended solids by Fe and Mn is the oxidation and transformation into the solid hydroxide coating phases, dissolving metals mobilized from the bottom sediments and thawing topsoils [5,30,36].
All these geochemical processes do not have a significant affect on the quota of suspended forms of elements in the Panteleikha River. The order of elements by the change in the quota of particulate forms (Figure 16c) is very similar to the same obtained in the Kolyma River main stream at the peak of the freshet (Figure 16a). The major difference is a lower quota of suspended forms for the elements from Cd to Zr in the Panteleikha River (40–60%) compared with the Kolyma main stream (60–85%). Probably, the low content of suspended solids is a key factor controlling the role of suspended forms in these rivers during the freshet.

4.4. Comparison of the Chemical Composition of the Lower Reaches of the Kolyma with Other Rivers
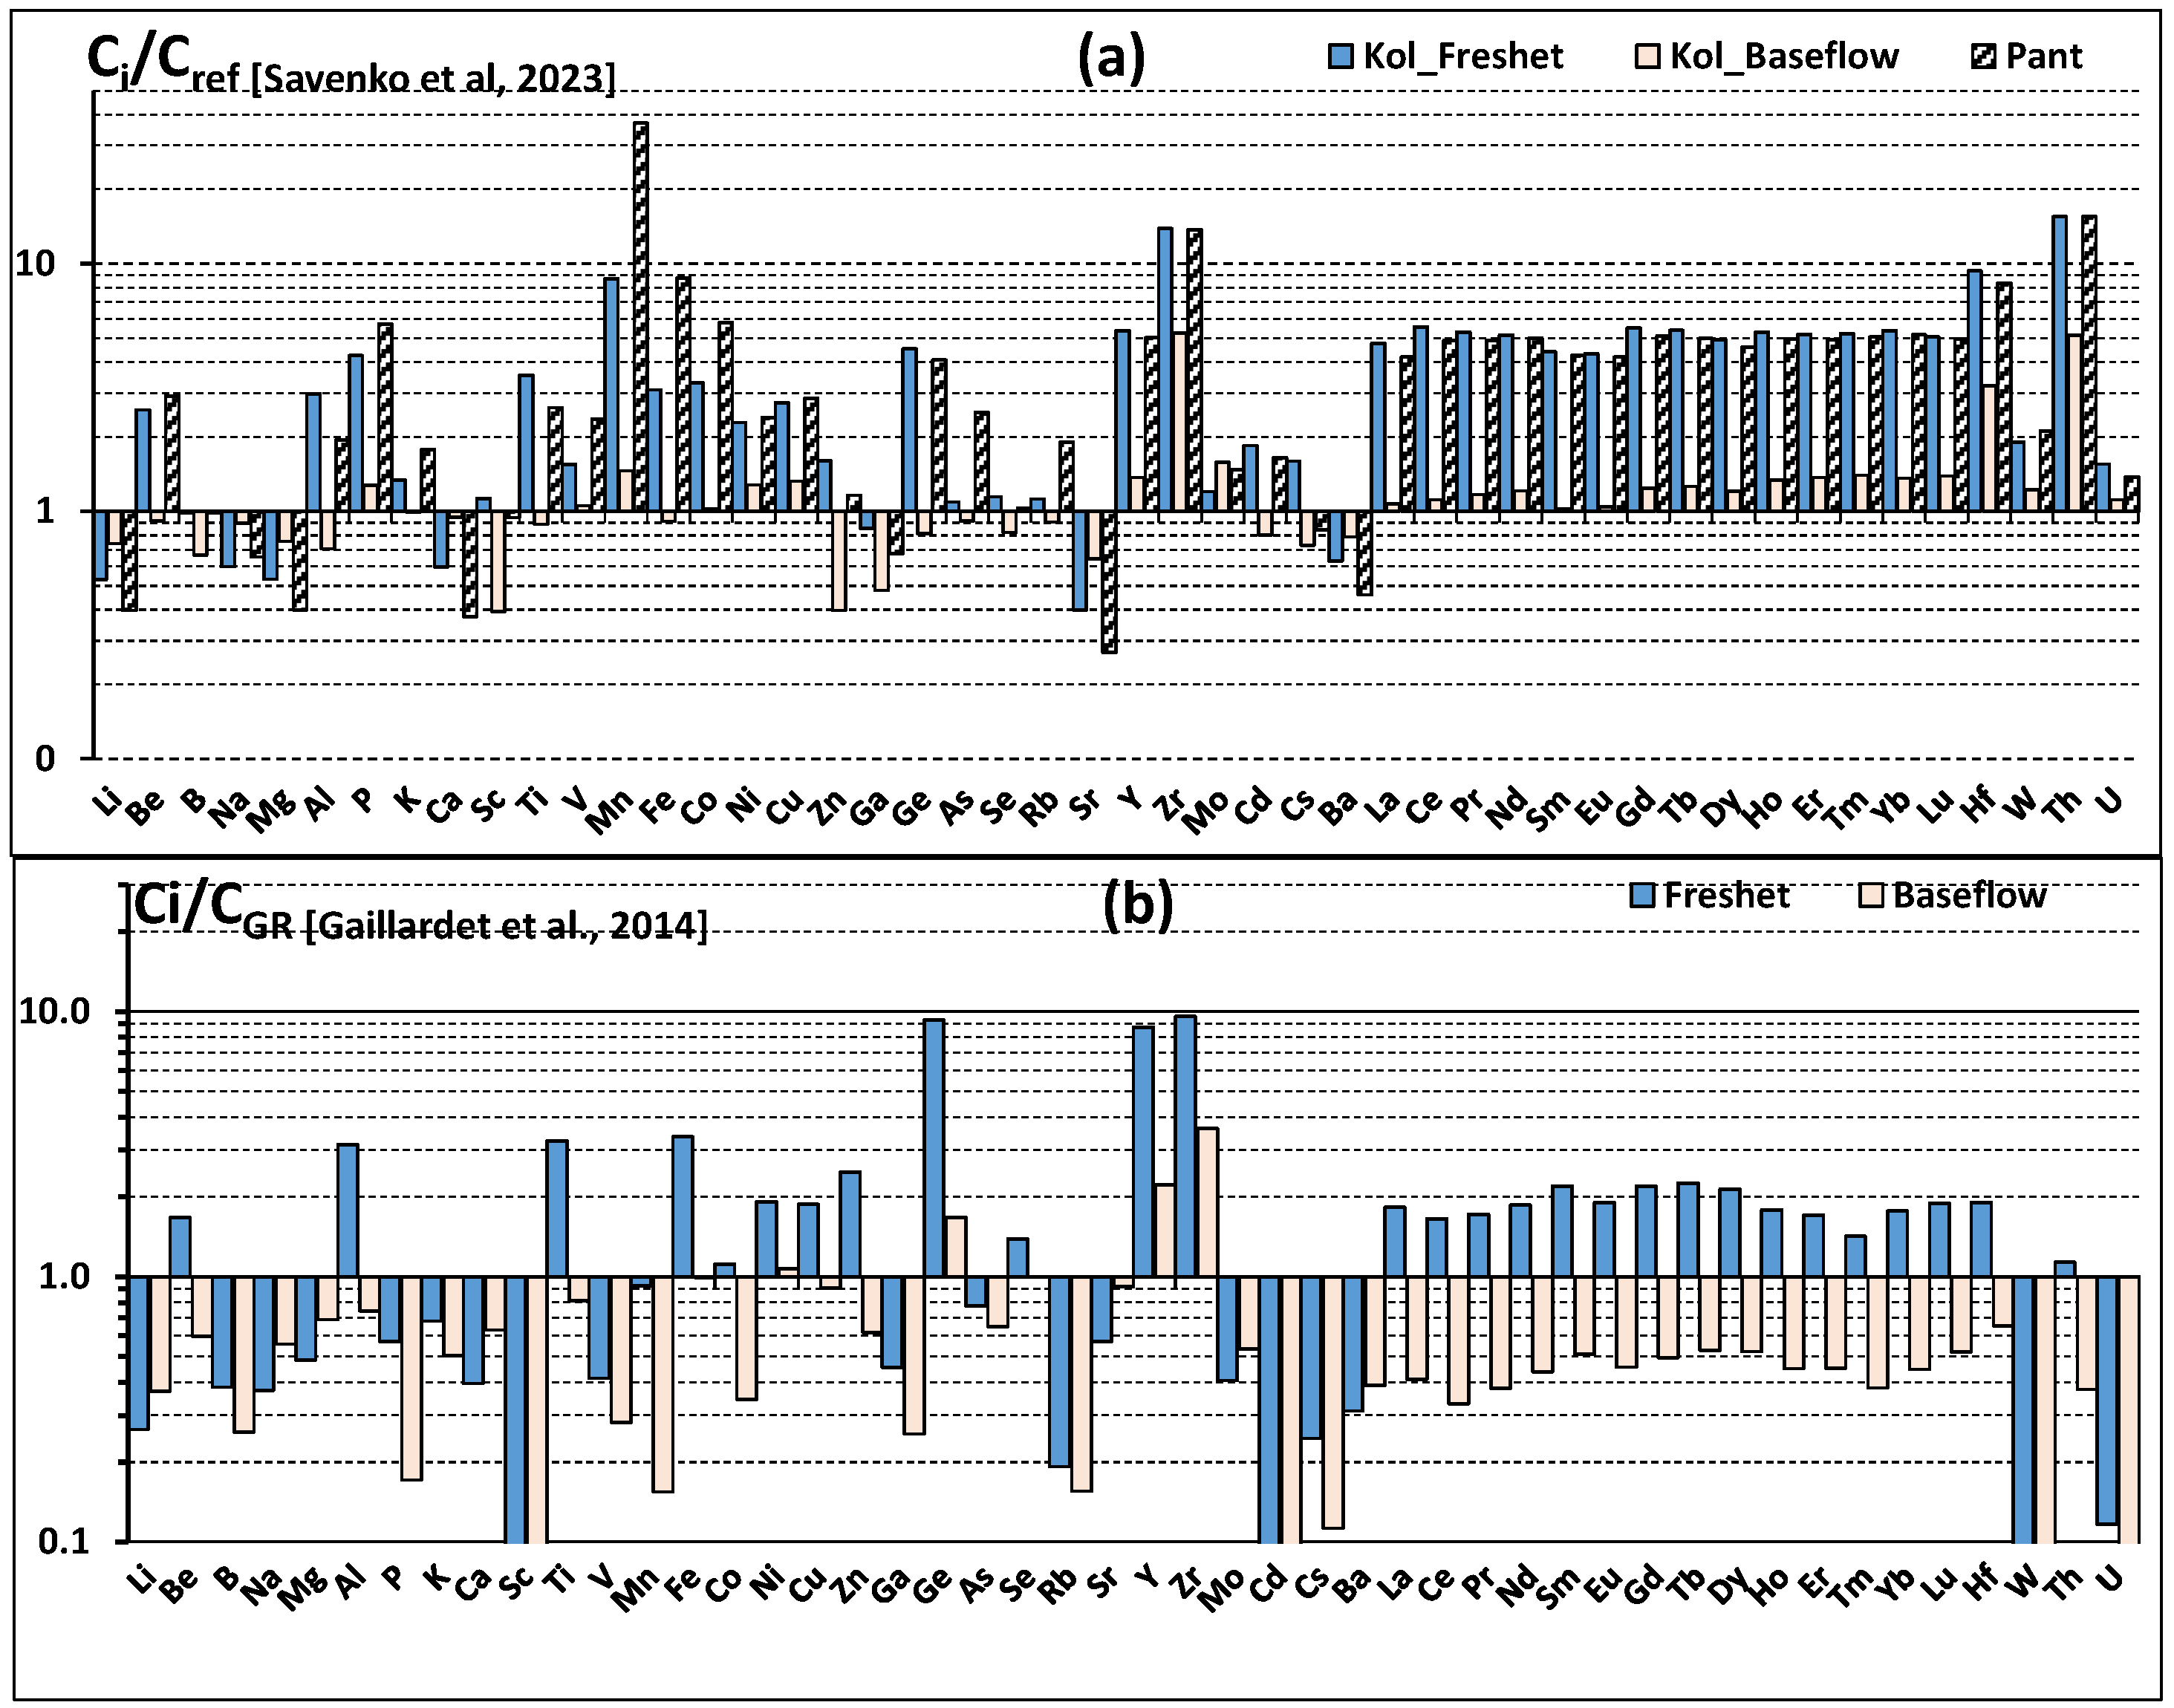
In recent reviews on the trace element compositions of the dissolved runoff of Arctic rivers, the general similarity, or even depletion, against modern estimates for the world’s rivers are argued [7,12]. Moreover, the Kolyma River has a minimal averaged concentration of trace elements compared with other large Arctic rivers: North Dvina, Pechora, Ob, Yenisei, and Lena, in accordance with the most severe climate and impaired weathering within the watershed of the Kolyma River, as assumed in [11]. It has to be noted that published data for the Kolyma River are related to the base flow period July-August. Results for the main stream of the Kolyma for the base flow regime (end of June–July 2024) are in good agreement with these published data (Figure 17a).
However, the freshet peak (first half of June) shows a notable enrichment by hydrolysates (5–15 times), DOC, and heavy metals (2–4 times) compared with the base flow of the Kolyma main stream [11] (Figure 17a). Coincidentally, a 2–3 times increase in water discharge for 2024 [22] allows us to assess the increase in freshets’ fluxes for hydrolysates at 10–45 times, and for heavy metals, at 4–12 times compared with the base flow regime. On other hand, the freshet high-water duration of 2 weeks is 8–9 times less than the ice-free period of the Kolyma River. It compensates for the influence of the freshet’s quota on the yearly fluxes of the chemical elements. For heavy metals, compensation is complete, though for hydrolysates, only partly. This assessment is very preliminary without data on the trace element concentrations throughout the year. However, year-round samples for the North Dvina, Pechora, and Taz rivers support such seasonal distributions of trace element fluxes [5,9,10].
Averaged concentrations of the majority of chemical elements in the <0.45 filtrates of the Panteleikha River are close to the freshet peak (Figure 17a), and, accordingly, enriched by the hydrolysates and heavy metals compared with the base flow period. A comparison of the data for the Kolyma River main stream during the base flow regime in July 2024 with an assessment of the world’s rivers [29] shows notable (4–10 times) diminishing for the majority of elements. During the freshet peak concentration of dissolved Al, Ti, Fe, Ni, Cu, Zn, Ge, Y, and Zr, REEs in the Kolyma River main stream surpass the global averages, but for a majority of these elements, enrichment does not exceed 2–3 times (Figure 17b). At the same time, the concentration of major cations and other elements existing as easily soluble compounds continues to stay depleted when compared with the global assessment in the Kolyma River, even at the freshet peak (Figure 17b). That is, data obtained during the spring freshet 2024 confirms the low level of mineralization and concentration of hydrolysates in the Kolyma River [7,11], in accordance with slow silicate weathering due to continuous permafrost and cold and dry climatic conditions within the river basin. A low quota of carbonates and evaporates at the watershed could be another reason for the hydrochemical features of the Kolyma River [41]. The concentration of a majority of the chemical elements in the suspended solids of the low reaches of the Kolyma River is 1.5–2 times less than the averaged data for the world’s rivers (Table 2). A low weathering degree and prevailing of rather coarse silt material in the Kolyma River suspended solids [15] could be a major reason of it.
Figure 17. (a) Comparison of averaged concentration of dissolved (<0.45 µm) elements in the main stream of Kolyma River at the freshet peak and the base flow and in the Panteleikha River (Pant) in June–July 2024 with published data for the Kolyma River base flow by [11]; (b) the same for the main stream of Kolyma River compare with average for the world’s rivers [29].
Water 17 02400 g017

5. Summary and Conclusions

Sampling of the lower reaches of the Kolyma River during the spring freshet of 2024 showed that in the main stem of the river there was a significant change in the chemical composition of water in the fraction <0.45 μm. Concentrations of DOC, P, Fe, Al, Ti, REEs, and Th, as well as Cu, Ni, Zn, Cd, and large colloids (0.05–0.45 μm) were at maximum at the peak of the floods in early June and decreased by 3–10 times over two weeks. This indicates a sharp large-scale mobilization by meltwater of the DOC and low-mobility hydrolysate elements accumulated in the upper soil layer of landscapes upstream of the Kolyma River during the previous summer. Specific conductivity (as an indicator of mineralization) and the concentration of major cations and easily soluble elements (Li, Sr, and Ba), on the contrary, were at a minimum level at the peak and increased as the floods subsided. A number of elements (U, As, Sb, Se, Mo, V, W, Cs, Rb, and Ga) did not show significant changes in concentrations in the main stream of the Kolyma River.
A comparison of the 2024 freshet data with data on the specific conductivity and DOC concentrations for 2014 and 2015 indicates that the main factor controlling changes in the chemical composition of waters during the freshet is the volume of meltwater—low mineralized but enriched in DOC and a number of trace elements compared to the runoff during the base flow. Using data on water discharge at the Kolymskoye gauging post made it possible to characterize the 2024 freshet as low water with a fast return to the base flow during the first 2–3 weeks of June.
The chemical composition of the large floodplain watercourse—the Panteleikha River—corresponds to that of the main stream at the freshet peak, indicating that the floodplain watercourses have been filled with meltwater. During the flood decline, mineralization, DOC, and the concentration of trace hydrolysates in the Panteleikha River changed more slowly than in the main stream, in accordance with the lower rate of water exchange. The main feature of the chemical composition of the Panteleikha River was a notable increase in the concentration of forms <0.45 μm As, Rb, Co, V, and P (2–5 times) and Fe and Mn (5–7 times) during the freshet waning in June. It indicates the mobilization of dissolved forms of these elements due to redox processes in bottom sediments and during seasonal thawing of floodplain landscapes. In addition to biogeochemical processes on the floodplain, the chemical composition of the Panteleikha River is controlled by the water regime, and in July 2024, during the summer rain floods, the composition of the Panteleikha waters again became close to that in the main stream of the Kolyma River. The influence of floodplain watercourses on the total river runoff requires additional research due to the obvious spatial heterogeneity of the runoff structure of the main stem of the Kolyma River. Further work is also needed to characterize the trace element composition of the Kolyma River waters during the freeze-up period and before the river opens.
The chemical composition of suspended matter in the lower reaches of the Kolyma River watercourses is rather stable during the spring floods. Moreover, for a majority of chemical elements, the Kolyma River suspended matter is depleted compared to the average data for the rivers of the world. Under these conditions, the main factor controlling the seasonal changes in the quotas of the suspended forms (>0.45 μm) in the balance of elements in river runoff is the variations in the suspended matter content. For the Kolyma River at the peak of the freshet with a suspended matter content of 33.6 mg/L, only for Ca, Mg, Na, Sr, Mo, As, Cu, Se, and Ni did the proportion of suspended forms not exceed 50%, while for the remaining elements, transport in suspension dominated. During the summer low water, with a suspended matter content of 17 mg/L, the list of elements for which the dissolved forms exceed 50% additionally includes Li, K, Ba, and U.
Concentrations of the majority of chemical elements in the Kolyma River main stream during waning of the spring freshet are notably depleted compare with world’s averages and other Arctic rivers. During the freshet peak, concentrations of hydrolysates increased and exceeded the world averages, but the majority of elements with a prevalence of soluble forms continue to be at the diminished level. The hydrochemical features of the Kolyma River are logically explained by the peculiarities of watershed and climatic conditions.

Supplementary Materials

The following supporting information can be downloaded at: https://www.mdpi.com/article/10.3390/w17162400/s1, Figure S1: Comparison of the concentration of elements in the 0.45 um filtrates after capsule filters (GWV) and after syringe filters (Milli 0.45); Figure S2: Changes in the concentration of chemical elements in the suspended solids of the lower reaches of the Kolyma River watercourses during the freshet; Table S1: Shulkin Kolyma dataset.

Author Contributions

Conceptualization, V.S.; sampling and processing, V.S., S.D., and A.D.; chemical analysis, V.S., E.E., and T.L.; validation and data curation, V.S., S.D., and A.D.; writing—original draft preparation, V.S.; writing—review and editing, V.S., S.D., and A.D. All authors have read and agreed to the published version of the manuscript.

Funding

This research was partially funded by Russian Science Foundation grant no. 23-27-00029 to VS.

Data Availability Statement

Dataset available on request from the authors.

Acknowledgments

Authors express deep gratitude to the staff of the North East Scientific Experimental Station of PGI FEB RAS (Cherskiy settlement) for their support in the sampling and providing conditions for their processing. The authors appreciate their anonymous reviewers for the valuable comments that allowed them to improve the paper significantly.

Conflicts of Interest

The authors declare no conflicts of interest.

Abbreviations

The following abbreviations are used in this manuscript:
PGI FEBRASPacific Geographical Institute Far Eastern Branch Russian Academy of Sciences
FEGI FEBRASFar Eastern Geological Institute Far Eastern Branch Russian Academy of Sciences
DLSDynamic Light Scattering

References

  1. Finlay, J.; Neff, J.; Zimov, S.; Davydova, A.; Davydov, S. Snow-melt dominance of dissolved organic carbon in high-latitude watersheds: Implications for characterization and flux of river DOC. Geophys. Res. Lett. 2006, 33, L10401. [Google Scholar] [CrossRef]
  2. Holmes, R.M.; McClelland, J.W.; Peterson, B.J.; Tank, S.E.; Bulygina, E.; Eglinton, T.I.; Gordeev, V.V.; Gurtovaya, T.Y.; Raymond, P.A.; Repeta, D.J.; et al. Seasonal and annual fluxes of nutrients and organic matter from large rivers to the Arctic Ocean and surrounding seas. Estuaries Coasts 2012, 35, 369–382. [Google Scholar] [CrossRef]
  3. McClelland, J.W.; Holmes, R.M.; Raymond, P.A.; Striegl, R.G.; Zhulidov, A.V.; Zimov, S.A.; Zimov, N.; Tank, S.E.; Spencer, R.G.M.; Staples, R.; et al. Particulate organic carbon and nitrogen export from major Arctic rivers. Glob. Biogeochem. Cycles 2016, 30, 629–643. [Google Scholar] [CrossRef]
  4. Pokrovsky, O.S.; Manasypov, R.M.; Loiko, S.; Krickov, I.A.; Kopysov, S.G.; Kolesnichenko, L.G.; Vorobyev, S.N.; Kirpotin, S.N. Trace element transport in western Siberia rivers across a permafrost gradient. Biogeosciences 2016, 13, 1877–1900. [Google Scholar] [CrossRef]
  5. Pokrovsky, O.S.; Manasypov, R.M.; Chupakov, A.V.; Kopysov, S.G. Element transport in the Taz River, western Siberia. Chem. Geol. 2022, 614, 121180. [Google Scholar] [CrossRef]
  6. Stolpe, B.; Guo, L.; Shiller, A.M. Binding and transport of rare earth elements by organic and iron-rich nanocolloids in Alaskan rivers, as revealed by field-flow fractionation and ICP-MS. Geochim. Cosmochim. Acta 2013, 106, 446–462. [Google Scholar] [CrossRef]
  7. Savenko, A.V.; Savenko, V.S. Trace Element Composition of the Dissolved Matter Runoff of the Russian Arctic Rivers. Water 2024, 16, 565. [Google Scholar] [CrossRef]
  8. Rember, R.D.; Trefry, J.H. Increased concentrations of dissolved trace metals and organic carbon during snowmelt in rivers of the Alaskan Arctic. Geochim. Cosmochim. Acta 2004, 68, 477–489. [Google Scholar] [CrossRef]
  9. Chupakov, A.V.; Pokrovsky, O.S.; Moreva, O.Y.; Shirokova, L.S.; Neverova, N.V.; Chupakova, A.A.; Kotova, E.I.; Vorobyeva, T.Y. High resolution multi-annual riverine fluxes of organic carbon, nutrient and trace element from the largest European Arctic river, Severnaya Dvina. Chem. Geol. 2020, 538, 119491. [Google Scholar] [CrossRef]
  10. Chupakov, A.V.; Pokrovsky, O.S.; Moreva, O.Y.; Kotova, E.I.; Vorobyeva, T.Y.; Shirokova, L.S. Export of organic carbon, nutrients and metals by the mid-sized Pechora River to the Arctic Ocean. Chem. Geol. 2023, 632, 121524. [Google Scholar] [CrossRef]
  11. Savenko, A.V.; Savenko, V.S.; Efimov, V.A.; Pokrovsky, O.S. Trace element composition in the waters of the Kolyma mouth section. Dokl. Earth Sci. 2023, 509, 272–275. [Google Scholar] [CrossRef]
  12. Gordeev, V.V.; Pokrovsky, O.S.; Zhulidov, A.V.; Filippov, A.S.; Gurtovaya, T.Y.; Holmes, R.M.; Kosmenko, L.S.; McClelland, J.W.; Peterson, B.J.; Tank, S.E. Dissolved Major and Trace Elements in the Largest Eurasian Arctic Rivers: Ob, Yenisey, Lena, and Kolyma. Water 2024, 16, 316. [Google Scholar] [CrossRef]
  13. Pokrovsky, O.S.; Viers, J.; Shirokova, L.S.; Shevchenko, V.P.; Filipov, A.S.; Dupré, B. Dissolved, suspended, and colloidal fluxes of organic carbon, major and trace elements in the Severnaya Dvina River and its tributary. Chem. Geol. 2010, 273, 136–149. [Google Scholar] [CrossRef]
  14. Krickov, I.V.; Lim, A.G.; Manasypov, R.M.; Loiko, S.V.; Vorobyev, S.N.; Shevchenko, V.P.; Dara, O.M.; Gordeev, V.V.; Pokrovsky, O.S. Major and trace elements in suspended matter of western Siberian rivers: First assessment across permafrost zones and landscape parameters of watersheds. Geochim. Cosmochim. Acta 2020, 269, 429–450. [Google Scholar] [CrossRef]
  15. Magritsky, D.V.; Frolova, N.I.; Agafonova, S.A.; Efimov, V.A.; Vasilenko, A.N.; Sazonov, A.A.; Efimova, L.E. Hydrological conditions at the mouth of the Kolyma river in summer 2019. Vestn. Mosc. State Univ. Geogr. 2022, 1, 134–151. [Google Scholar]
  16. Guo, L.; Cai, Y.; Belzile, C.; Macdonald, R. Sources and export fluxes of inorganic and organic carbon and nutrient species from the seasonally ice-covered Yukon river. Biogeochemistry 2012, 107, 187–206. [Google Scholar] [CrossRef]
  17. Bagard, M.-L.; Chabaux, F.; Pokrovsky, O.S.; Viers, J.; Prokushkin, A.S.; Stille, P.; Rihs, S.; Dupre, B. Seasonal variability of element fluxes in two Central Siberian rivers draining high latitude permafrost dominated areas. Geochim. Cosmochim. Acta 2011, 75, 3335–3357. [Google Scholar] [CrossRef]
  18. Pokrovsky, O.S.; Lim, A.G.; Krickov, I.V.; Korets, M.A.; Shirokova, L.S.; Vorobyev, S.N. Hydrochemistry of Medium-Size Pristine Rivers in Boreal and Subarctic Zone: Disentangling Effect of Landscape Parameters across a Permafrost, Climate, and Vegetation Gradient. Water 2022, 14, 2250. [Google Scholar] [CrossRef]
  19. Fedorov-Davydov, D.G.; Davydov, S.P.; Davydova, A.I.; Shmelev, D.G.; Ostroymov, V.E.; Kholodov, A.L.; Sorokovikov, V.A. The temperature regime of soils in Northern Yakutia. Earth’s Cryosphere 2018, 22, 12–19. [Google Scholar]
  20. Romanovsky, V.E.; Drozdov, D.S.; Oberman, N.G.; Malkova, G.V.; Kholodov, A.L.; Marchenko, S.S.; Moskalenko, N.G.; Sergeev, D.O.; Ukraintseva, N.G.; Abramov, A.A.; et al. Thermal state of permafrost in Russia. Permafr. Periglac. Process. 2010, 21, 136–155. [Google Scholar] [CrossRef]
  21. Glotov, V.Y.; Glotova, L.P.; Ushakov, M.V. Anomalous changes of Kolyma-river runoff condition in winter period. Earth’s Cryosphere 2011, 1, 52–60. (In Russian) [Google Scholar]
  22. Shiklomanov, A.I.; Holmes, R.M.; McClelland, J.W.; Tank, S.E.; Spencer, R.G.M. Arctic Great Rivers Observatory. Discharge Dataset, Version 20240813. Available online: https://arcticgreatrivers.org/ (accessed on 15 October 2024).
  23. Ilina, S.M.; Lapitskiy, S.A.; Alekhin, Y.V.; Viers, J.; Benedetti, M.; Pokrovsky, O.S. Speciation, Size Fractionation and Transport of Trace Elements in the Continuum Soil Water–Mire–Humic Lake–River–Large Oligotrophic Lake of a Subarctic Watershed. Aquat. Geochem. 2016, 22, 65–95. [Google Scholar] [CrossRef]
  24. Shulkin, V.M. Application of Dynamic Light Scattering for Assessing the Content of Large Colloidal and Suspended Particles in River Waters. Dokl. Earth Sci. 2025, 521, 8. [Google Scholar] [CrossRef]
  25. Filella, M.; Zhang, J.; Newman, M.E.; Buffle, J. Analytical applications of photon correlation spectroscopy for size distribution measurements of natural colloidal suspensions: Capabilities and limitations. Colloids Surf. A Physicochem. Eng. Asp. 1997, 120, 27–46. [Google Scholar] [CrossRef]
  26. Hammer, Ø.; Harper, D.A.T.; Ryan, P.D. PAST: Paleontological Statistics Software Package for Education and Data Analysis. Palaeontol. Electron. 2001, 4, 1–9. [Google Scholar]
  27. Buffle, J.; Leppard, G.G. Characterization of aquatic colloids and macromolecules. 1. Structure and behavior of colloidal material. Environ. Sci. Technol. 1995, 9, 2169–2175. [Google Scholar] [CrossRef]
  28. Gustafsson, C.; Gschwend, P.M. Aquatic colloids: Concepts, definitions, and current challenges. Limnol. Oceanogr. 1997, 43, 519–528. [Google Scholar] [CrossRef]
  29. Gaillardet, J.; Viers, J.; Dupre, B. Trace Elements in River Waters. In Treatise on Geochemistry, 2nd ed.; Holland, H.D., Turekian, K.K., Eds.; Elsevier: Amsterdam, The Netherlands, 2014; Volume 7, pp. 195–235. [Google Scholar]
  30. Krickov, I.V.; Lim, A.G.; Shevchenko, V.P.; Starodymova, D.P.; Dara, O.M.; Kolesnichenko, Y.; Zinchenko, D.O.; Vorobyev, S.N.; Pokrovsky, O.S. Seasonal Variations of Mineralogical and Chemical Composition of Particulate Matter in a Large Boreal River and Its Tributaries. Water 2023, 15, 633. [Google Scholar] [CrossRef]
  31. Viers, J.; Dupré, B.; Gaillardet, J. Chemical composition of suspended sediments in World Rivers: New insights from a new database. Sci. Total Environ. 2009, 407, 853–863. [Google Scholar] [CrossRef]
  32. Shevchenko, V.P.; Pokrovsky, O.S.; Vorobyev, S.N.; Krickov, I.V.; Manasypov, R.M.; Politova, N.V.; Kopysov, S.G.; Dara, O.M.; Auda, Y.; Shirokova, L.S.; et al. Impact of snow deposition on major and trace element concentrations and elementary fluxes in surface waters of the Western Siberian Lowland across a 1700 km latitudinal gradient. Hydrol. Earth Syst. Sci. 2017, 21, 5725–5746. [Google Scholar] [CrossRef]
  33. Welp, L.R.; Randerson, J.T.; Finlay, J.C.; Davydov, S.P.; Zimova, G.M.; Davydova, A.I.; Zimov, S.A. A high-resolution time series of oxygen isotopes from the Kolyma River: Implications for the seasonal dynamics of discharge and basin-scale water use. Geophys. Res. Lett. 2005, 32, L14401. [Google Scholar] [CrossRef]
  34. Stolpe, B.; Guo, L.; Shiller, A.M.; Aiken, G.R. Abundance, size distributions and trace-element binding of organic and iron-rich nanocolloids in Alaskan rivers, as revealed by field-flow fractionation and ICP-MS. Geochim. Cosmochim. Acta 2013, 105, 221–239. [Google Scholar] [CrossRef]
  35. Shulkin, V.M.; Bogdanova, N.N.; Elovskiy, E.V. Effect of Filter Clogging on the Determination of Concentrations of Chemical Elements Migrating in River Water as Components of True Solutions or in Colloidal Forms. Water Resour. 2022, 49, 122–133. [Google Scholar] [CrossRef]
  36. Pokrovsky, O.S.; Schott, J. Iron colloids/organic matter associated transport of major and trace elements in small boreal rivers and their estuaries (NW Russia). Chem. Geol. 2002, 190, 141–179. [Google Scholar] [CrossRef]
  37. Ingri, J.; Widerlund, A.; Land, M.; Gustafsson, O.; Andersson, P.; Ohlander, B. Temporal variations in the fractionation of the rare earth elements in a boreal river; the role of colloidal particles. Chem. Geol. 2000, 166, 23–45. [Google Scholar] [CrossRef]
  38. Dahlqvist, A.K.; Ingri, J.; Larsson, T.; Stolpe, B.; Turner, D. Temporal variations of colloidal carrier phases and associated trace elements in a boreal river. Geochim. Cosmochim. Acta 2007, 71, 5339–5354. [Google Scholar] [CrossRef]
  39. Gordeev, V.V.; Lisitzin, A.P. Geochemical interaction between the freshwater and marine hydrospheres. Russ. Geol. Geophys. 2014, 55, 561–581. [Google Scholar] [CrossRef]
  40. Hirst, C.; Andersson, P.S.; Shaw, S.; Burke, I.T.; Kutscher, L.; Murphy, M.J.; Maximov, T.; Pokrovsky, O.S.; Morth, C.M.; Porcelli, D. Characterisation of Fe-bearing particles and colloids in the Lena River basin, NE Russia. Geochim. Cosmochim. Acta 2017, 213, 553–573. [Google Scholar] [CrossRef]
  41. Gaillardet, J.; Dupre, B.; Lourval, P.; Allegre, C.J. Global silicate weathering and CO consumption rates deduced from the chemistry of large rivers. Chem. Geol. 1999, 159, 3–30. [Google Scholar] [CrossRef]
Figure 3. Measurements of changes in (a) specific conductivity SC, (b) dissolved organic carbon DOC, (c) water discharge, and (d) temperature in the main course of the Kolyma River in June–July 2024 and in May–October 2014 and 2015.
Water 17 02400 g003
Figure 5. Changes in the concentration of Na (a), Ca (b), Li (c), and Sr (d) in fractions <0.45 µm in the watercourses of the lower reaches of the Kolyma River during the freshet. (K) is Kolyma, (P) is Panteleikha, Y3 is Rodinka creek, the triangle is Stadukhinskaya Protoka (S), the diamond is the Anyui (A), and the asterisk in the square is the meltwater of the ice wedge from the Duvanny Yar (DY) location. Explanation is the same for Figure 6, Figure 7, Figure 8 and Figure 9.
Water 17 02400 g005
Figure 16. Quota of the suspended (>0.45 μm) forms of elements in the Kolyma River main stream at the peak (a) and waning (b) of freshet and in the Panteleikha River during all freshets (c).
Water 17 02400 g016
Table 1. Concentration of dissolved/colloidal forms (<0.45 µm) of chemical elements (µg/L, mean ± std) in the main stream of the Kolyma River during the peak (1–15.06) and the subsidence (16.06–11.07) of the freshet and in the Panteleikha River during all freshets compared with published data for the Kolyma River base flow [11,12] and averages of the world’s rivers [29].
ElementKolyma, 1–15.06,
n = 7
Kolyma, 16.06–11.07,
n = 7
Panteleikha
n = 8
[11][12][29]
Li0.49 ± 0.230.68 ± 0.230.37 ± 0.030.92-1.8
Be0.015 ± 0.0060.005 ± 0.0020.017 ± 0.0030.0058-0.009
B3.9 ± 0.92.65 ± 0.353.92 ± 0.413.981.9410.2
Na1270 ± 3401899 ± 4461389 ± 317212016903400
Mg2210 ± 9863147 ± 9221659 ± 256416024004560
Al100.7 ± 45.923.8 ± 10.465.4 ± 27.533.851.532
P21.7 ± 8.16.5 ± 2.329 ± 75.1-38
K682 ± 104505 ± 55904 ± 1085104801000
Ca7936 ± 422412,621 ± 42684995 ± 85413,300969020,000
Sc0.095 ± 0.0310.034 ± 0.0140.08 ± 0.020.0850.40.07
Ti1.60 ± 0.820.40 ± 0.281.18 ± 0.350.450.670.49
V0.29 ± 0.120.20 ± 0.070.45. ± 0.170.190.330.71
Mn31 ± 175.3 ± 5.9133 ± 1003.64.534
Fe222 ± 6765.5 ± 26.4628 ± 40671.93166
Co0.17 ± 0.110.05 ± 0.020.289 ± 0.190.050.040.15
Ni1.53 ± 0.270.86 ± 0.111.60 ± 0.220.671.150.80
Cu2.08 ± 0.751.01 ± 0.222.17 ± 0.210.761.451.48
Zn1.49 ± 0.50.37 ± 0.151.08 ± 0.40.930.330.60
Ga0.014 ± 0.0040.008 ± 0.0020.011 ± 0.0020.0160.0160.03
Ge0.063 ± 0.030.011 ± 0.050.057 ± 0.020.0140.0110.007
As0.48 ± 0.080.40 ± 0.081.10 ± 0.470.440.580.62
Se0.097 ± 0.0180.07 ± 0.010.088 ± 0.0120.085-0.07
Rb0.31 ± 0.060.25 ± 0.040.53 ± 0.110.280.191.63
Sr34.2 ± 16.555.0 ± 18.223.1 ± 3.785.65560
Y0.349 ± 0.1410.089 ± 0.0440.327 ± 0.0710.0650.0960.04
Zr0.37 ± 0.120.14 ± 0.080.37 ± 0.050.0270.130.04
Mo0.17 ± 0.0870.22 ± 0.120.21 ± 0.180.140.130.42
Cd0.007 ± 0.0020.003 ± 0.0010.006 ± 0.0010.0010.00560.080
Cs0.003 ± 0.0010.001 ± 0.0010.001 ± 0.00050.0017-0.011
Ba7.2 ± 2.28.9 ± 2.35.2 ± 0.511.47.223
La0.219 ± 0.1110.049 ± 0.0310.193 ± 0.0410.0460.0490.120
Ce0.433 ± 0.2350.087 ± 0.0640.381 ± 0.0960.0780.0960.262
Pr0.069 ± 0.0340.015 ± 0.0090.064 ± 0.0140.0130.0160.040
Nd0.283 ± 0.1360.067 ± 0.0380.275 ± 0.0610.0550.0770.152
Sm0.079 ± 0.0360.018 ± 0.0100.077 ± 0.0180.0180.0210.036
Eu0.019 ± 0.0080.004 ± 0.0030.018 ± 0.0040.00430.0060.010
Gd0.088 ± 0.0390.020 ± 0.0110.082 ± 0.0190.0160.0270.040
Tb0.012 ± 0.0050.003 ± 0.0010.011 ± 0.0030.00230.0030.0055
Dy0.064 ± 0.0260.016 ± 0.0080.060 ± 0.0120.0130.0210.03
Ho0.013 ± 0.0050.003 ± 0.0010.012 ± 0.0030.00240.0040.007
Er0.034 ± 0.0140.009 ± 0.0040.032 ± 0.0070.00660.0120.02
Tm0.005 ± 0.0020.001 ± 0.0010.005 ± 0.0010.001-0.0033
Yb0.030 ± 0.0130.008 ± 0.0040.029 ± 0.0070.00560.0100.017
Lu0.005 ± 0.0020.001 ± 0.0010.004 ± 0.0010.00090.00150.0024
Hf0.011 ± 0.0040.004 ± 0.0020.010 ± 0.0020.00120.00650.0059
W0.004 ± 0.0010.002 ± 0.0010.004 ± 0.0010.00190.0050.10
Th0.046 ± 0.0170.015 ± 0.0110.046 ± 0.0080.0030.0250.041
U0.043 ± 0.0090.031 ± 0.0100.039 ± 0.0040.0280.0500.37
Note: n—number of samples, - not available.
Table 2. Concentration of chemical elements (µg/g, % d.w., and mean ± std) in the suspended solids (SS > 0.45 µm) of Kolyma and Panteleikha rivers during the freshet 2024 (1.06–11.07) and averaged data for the SS of the Ob River basin [14,30] and the world’s rivers [31].
ElementKolyma, 1.06–11.07,
n = 14
Panteleikha
n = 8
[14][30][31]
Li42.6 ± 10.229.5 ± 5.910.225.2035.0
Be1.5 ± 0.21.1 ± 0.1-1.931.7
Na *1.53 ± 0.181.13 ± 0.290.380.460.82
Mg *0.76 ± 0.120.52 ± 0.110.410.671.44
Al *5.61 ± 1.024.09 ± 0.82.414.328.63
P1210 ± 2471905 ± 418418740601000
K *1.40 ± 0.190.89 ± 0.190.631.382.15
Ca *1.22 ± 0.190.97 ± 0.240.603.772.60
Sc11.8 ± 2.09.4 ± 1.4--14
Ti3191 ± 5551761 ± 438823722103900
V92 ± 1867 ± 1056.6159120
Mn1290 ± 7333411 ± 2729582945601150
Fe *4.05 ± 0.465.50 ± 1.506.786.045.03
Co14.1 ± 2.114.8 ± 3.921.818.6019.0
Ni36 ± 826 ± 323.158.0050
Cu28 ± 326 ± 314.045.5045
Zn96 ± 1379 ± 1482.1156.00130
Ga15.4 ± 2.310.0 ± 1.76.0116.8020
Ge3.2 ± 0.43.2 ± 0.60.301.191.40
As5.4 ± 1.84.2 ± 2.013.955.6014.0
Se1.8 ± 0.31.8 ± 0.3--1.50
Rb40 ± 1435 ± 62319.7077
Sr131 ± 1495 ± 21115252.00150
Y17.0 ± 3.016.8 ± 2.08.757.7025.0
Zr89.4 ± 10.270.4 ± 11.334.579150
Mo0.99 ± 0.071.1 ± 0.310.451.311.80
Cd0.29 ± 0.030.3 ± 0.090.310.620.50
Cs4.2 ± 1.23.1 ± 0.51.391.215.20
Ba500 ± 57336 ± 46329402500
La20.8 ± 4.018.9 ± 3.212.212.932
Ce44.9 ± 6.840.9 ± 2.925.531.7068
Pr5.4 ± 0.85.0 ± 0.62.93.767.7
Nd20.4 ± 2.819.1 ± 2.411.315.4029
Sm4.74 ± 0.64.52 ± 0.532.243.215.80
Eu1.02 ± 0.130.97 ± 0.110.520.731.40
Gd4.37 ± 0.624.26 ± 0.492.202.955.60
Tb0.64 ± 0.090.61 ± 0.060.300.410.79
Dy3.28 ± 0.443.14 ± 0.281.732.304.50
Ho0.66 ± 0.080.62 ± 0.050.330.420.90
Er1.90 ± 0.231.77 ± 0.130.971.192.60
Tm0.27 ± 0.030.25 ± 0.020.140.160.38
Yb1.76 ± 0.191.59 ± 0.100.911.032.50
Lu0.26 ± 0.030.24 ± 0.020.130.150.40
Hf2.42 ± 0.271.88 ± 0.314.572.954.40
W0.87 ± 0.190.61 ± 0.151.042.741.40
Th6.14 ± 1.145.14 ± 0.492.753.9010.0
U1.72 ± 0.241.51 ± 0.110.682.332.40
Notes: n—number of samples; *—Na, Mg, K, Ca, Al, and Fe in %, others in µg/g dry weight.
Disclaimer/Publisher’s Note: The statements, opinions and data contained in all publications are solely those of the individual author(s) and contributor(s) and not of MDPI and/or the editor(s). MDPI and/or the editor(s) disclaim responsibility for any injury to people or property resulting from any ideas, methods, instructions or products referred to in the content.