1. Introduction
Conventional agricultural practices (e.g., monoculture and tillage) can deplete soils of micronutrients and destabilize the topsoil when improperly managed. Rainfall runoff leaving agricultural land has the potential to transport pollutants to downstream water bodies and contribute to surface water impairments [
1,
2,
3,
4,
5]. These impairments negatively affect the recreational, navigational, and consumptive use of contaminated water sources [
6,
7].
The adoption of regenerative agricultural practices (e.g., no-till or minimal tillage, efficient irrigation, cover crops) has been proposed to improve soil health and benefit water resources. Numerous studies have shown a reduction in soil erosion and runoff volume when shifting from conventional to conservation or no-till practices and using a cover crop. This conversion has been linked to reduced pollutant loading, improved SOC content, increased infiltration, and increased yields in regions with sufficient rainfall and irrigation supply [
8,
9,
10]. Reductions in runoff volume as well as nutrient concentrations and loadings from plots with these practices have demonstrated the potential for water quality benefits in agricultural watersheds [
11,
12].
The benefits of these practices in water-stressed environments are not as uniformly documented. The Southern Great Plains (SGP) environment presents challenges to crop production such as limited rainfall, frequent drought, inconsistent irrigation water quantity and quality, soil type, climate, and temperature swings [
13,
14,
15]. Increasing temperatures in Texas, Oklahoma, and Kansas over the last several decades have coincided with less frequent but more intense rainfall events [
16]. Declining surface and groundwater resources have reduced irrigation viability and threaten profitable cotton production. Benefits from regenerative agricultural practices may be reduced in consistency as well [
17]. Inconsistent environmental benefits and the economic risks associated with regenerative agriculture have slowed adoption willingness by SGP producers [
18].
It is critical to understand how regenerative practices may help enhance crop resilience to climate change, extend the longevity of soil and water resources, and ultimately benefit the economic stability and agricultural viability of these regions. Exploring the changes to soil health and water quality from the introduction of regenerative agricultural practices in the SGP must first be performed at the plot scale [
19,
20]. The objective of this study is to measure the impacts of cover crops and conservation tillage on total runoff, nutrient and sediment concentrations and loadings, and soil moisture in cotton plots in southwestern Oklahoma.
A plot-based experimental approach was taken to address the objectives of this study. Twelve plots were delineated with a designated treatment. Three replications of four treatments were employed using the presence or absence of a winter wheat cover crop and given a specific cotton seeding rate. Runoff was monitored and collected using H-flumes and ISCO automated samplers. The objective of this study was to examine the effectiveness of these practices and compare the differences in runoff water quality and quantity, as well as the impacts to soil health.
We hypothesized the following:
- (1)
Runoff volumes will be reduced on plots with cover crops when compared to plots without cover crops.
- (2)
Runoff volumes will be reduced on plots with a higher cotton seeding rate due to increased plant density when compared to plots with a lower seeding rate.
- (3)
Nutrient concentrations and loadings will be reduced in runoff from plots with cover crops when compared to plots without cover crops.
- (4)
Runoff volumes, nutrient concentrations, and nutrient loadings will exhibit the strongest differences during periods of active cover crop growth.
- (5)
Soil moisture levels will experience the strongest differences between treatments during periods of active cover crop growth.
This research aims to improve the understanding of how regenerative agriculture impacts water quality in the SGP and similar environments. Rainfall runoff events transport sediment, nutrients, and bacteria from the field to downstream water bodies, which can contribute to eutrophication and other processes harmful to human and animal health. Minimizing these nutrient losses and transitioning to practices with sustainable water consumption will be crucial for economic stability in these regions.
2. Materials and Methods
2.1. Site Description
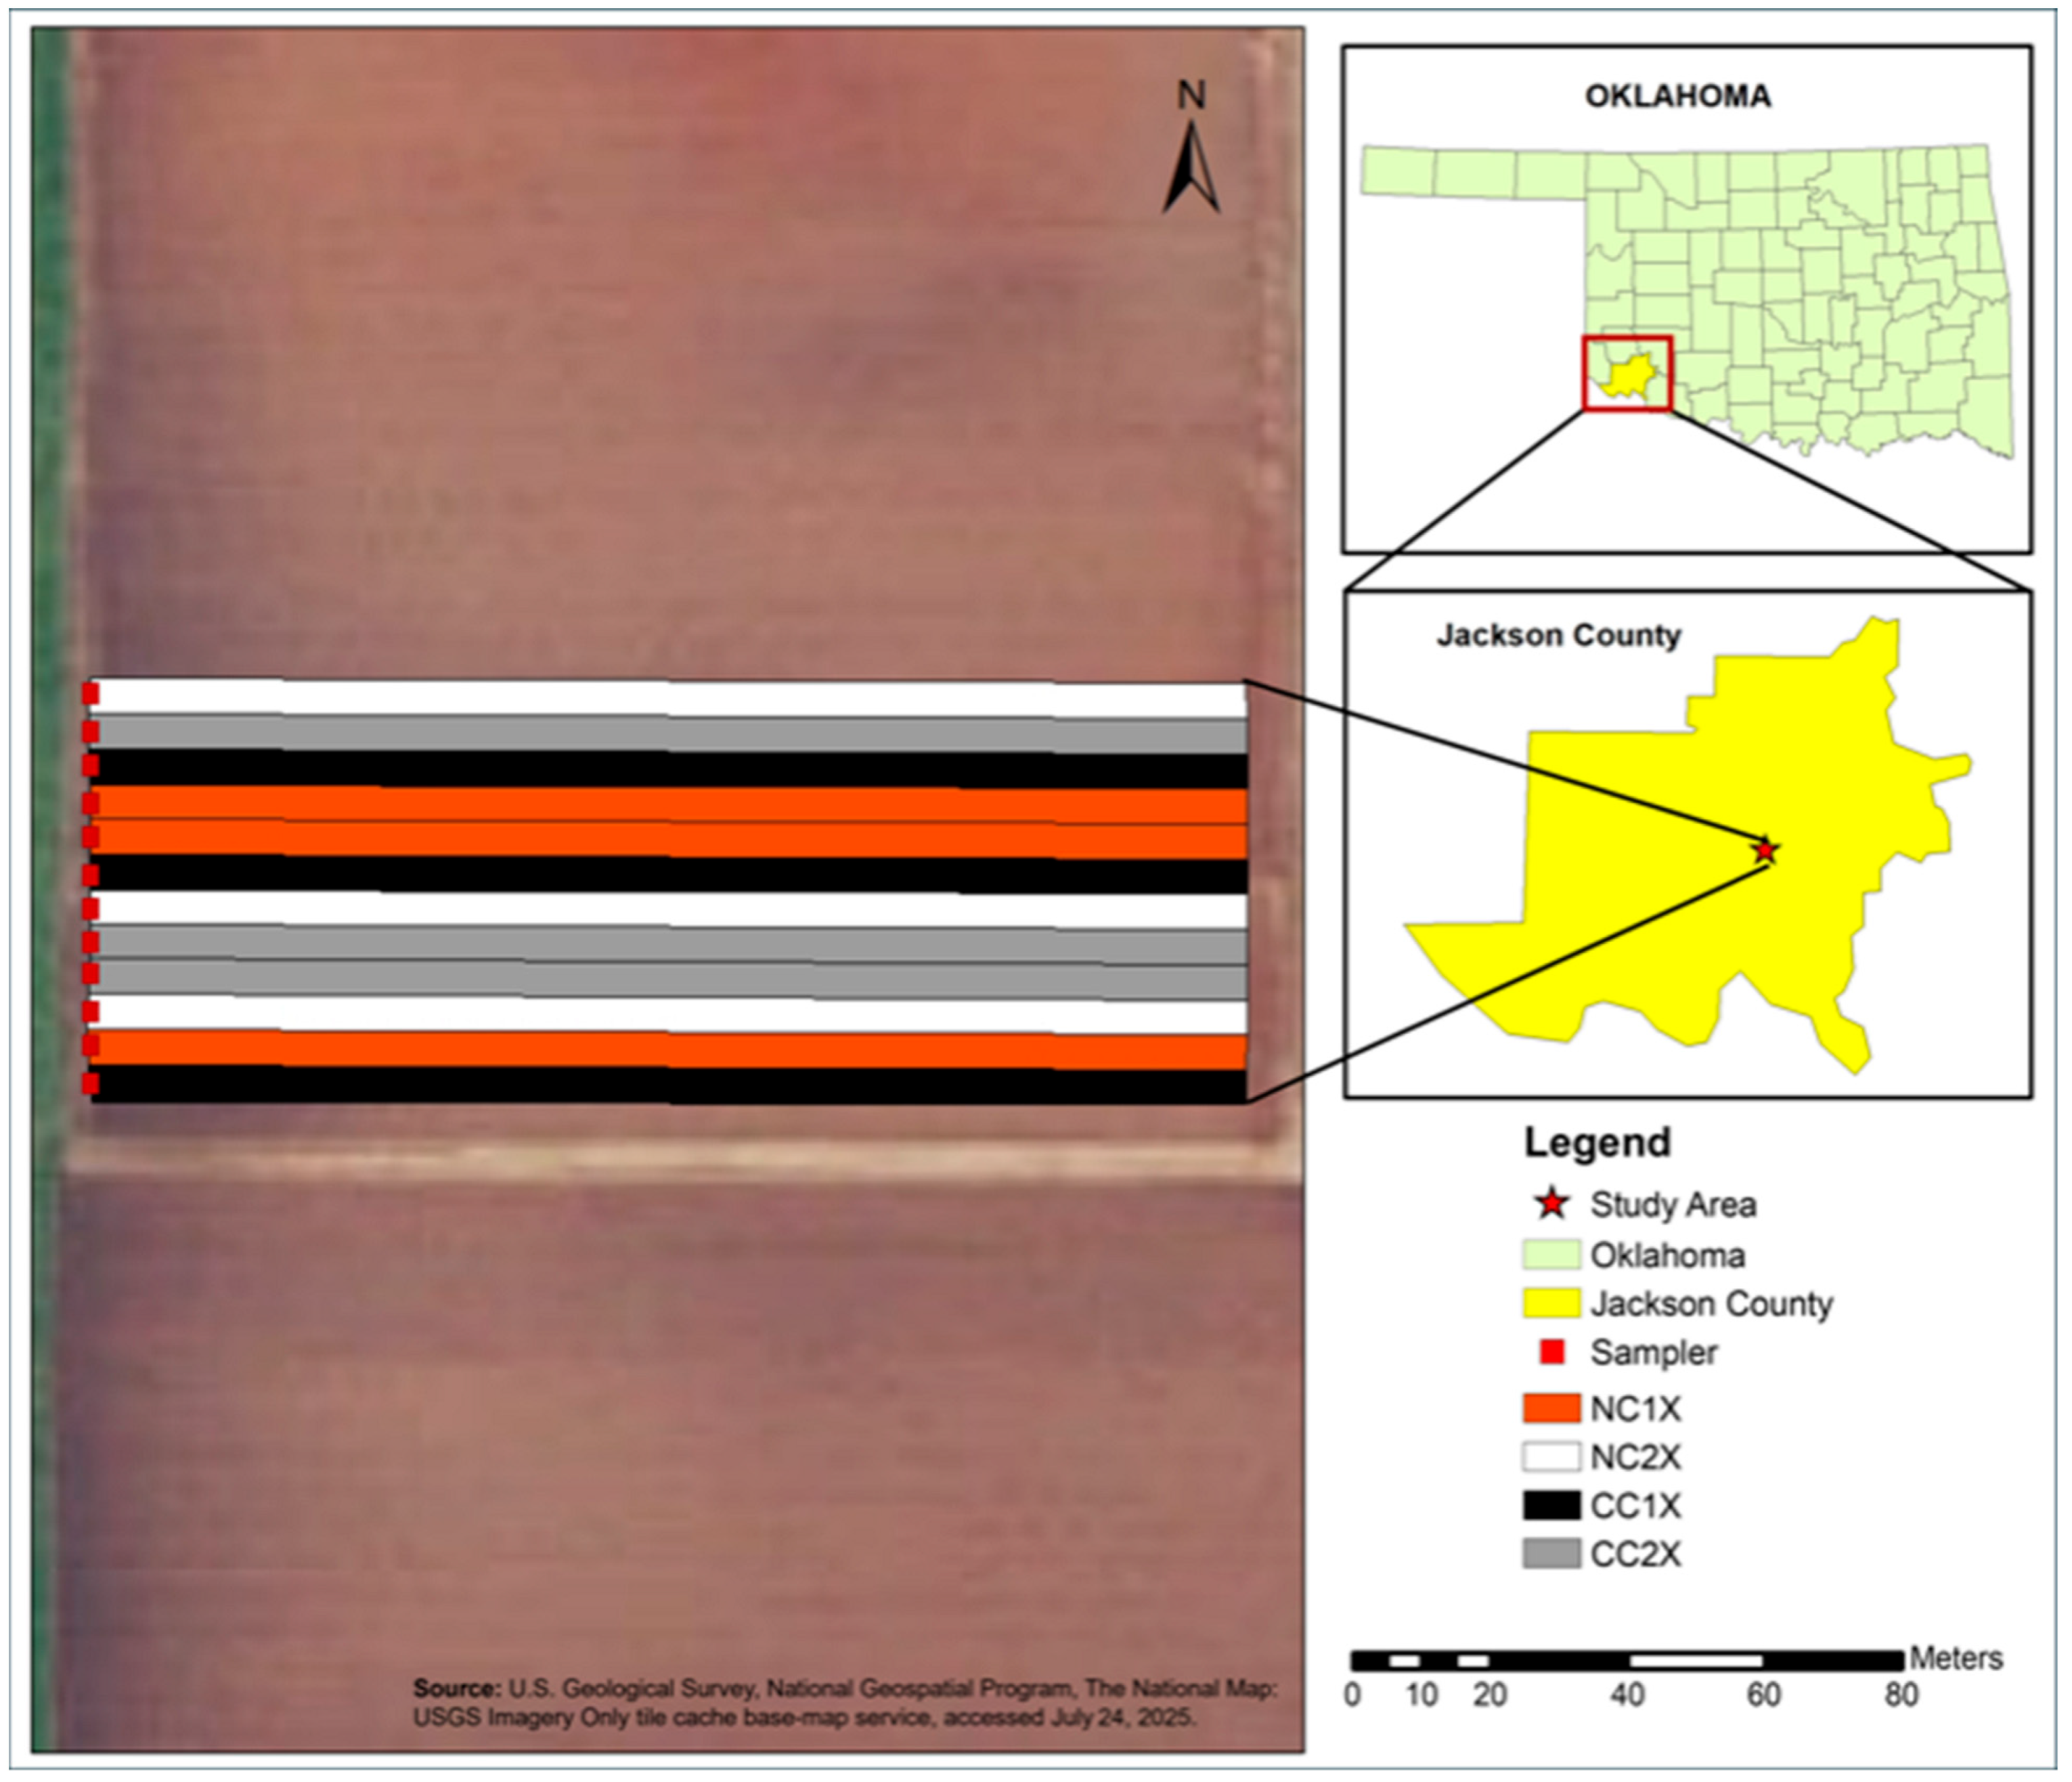
A plot experiment was conducted at the Oklahoma State University Southwest Research and Extension Center (SREC), located 5 km south of Altus, OK (
Figure 1). Prior land use for the study site included continuous cotton production using conventional tillage. The study area and surrounding acreage consists of Hollister silty clay loam (HolA) soils situated on shallow slopes (0–1%). Variable silt concentrations can be found in the A and upper B horizons, but clay is predominant throughout the profile. Hollister soils are classified under the hydrologic group D and have high runoff potential and low infiltration rates [
21]. The 30-year annual rainfall for this region is 713 mm on average, but the yearly totals can vary dramatically [
22].
2.2. Study Design
Twelve 0.22-hectare experimental plots were created for this study and arranged in a randomized complete block design with four treatments and three replications. Each plot was wide enough to accommodate eight rows of cotton and was individually monitored for rainfall runoff (
Figure 1). Earthen berms were built around each plot to ensure that runoff is not impacted by surrounding land use or management. These berms were reshaped in year 1 following cotton termination. The near uniform soil type, size, and slope of these plots provided an ideal location to assess regenerative practices. Treatment designations compared standard and intensive seeding rates on plots with and without cover crops (
Table 1).
The winter wheat cover crop seeding rate was 56 kg ha−1. The intensive cotton seeding rate treatment received 130,410 seeds per hectare, and the standard cotton seeding rate treatment received 65,205 seeds per hectare. The intensive seeding rate treatment was implemented two weeks earlier than the standard seeding rate treatment, reflecting the common practice in the region of earlier planting for irrigated versus non-irrigated cotton.
Intensive seeding rate plots also had higher fertilizer rates. On 11 May 2022, the intensive seeding rate plots received 299 L ha−1 of 26-9-0, supplying 104.4 kg ha−1 nitrogen, 36.1 kg ha−1 phosphorus, and 0 kgha−1 potassium. On the same date, the standard seeding rate plots received 149.6 L ha−1 of 26-9-0, supplying 52.2 kg ha−1 nitrogen, 18.0 kg ha−1 of phosphorus, and 0 kg ha−1 potassium. On 4 May 2023, the intensive plots received 299 L ha−1 of 32-0-0 fertilizer, supplying 128.5 kg ha−1 of nitrogen, while the standard plots received 149.2 L ha−1, supplying 64.2 kg ha−1 of nitrogen.
Glyphosate was applied for controlling weeds and terminating the wheat cover crop. Glyphosate applications were made on 13 May and 20 May in 2022 and 20 April, 9 May, 23 May, and 17 June in 2023. Application volumes ranged from 2.2 to 3.5 L ha−1 across these dates and were the same for each treatment on a given date. The effects of seeding and fertilizer rate will be considered during the assessment of the data.
2.3. Runoff Sample Collection and Processing
Runoff monitoring was conducted for two growing seasons from April 2022 to December 2023. H-flumes (0.46 m) equipped with refrigerated automated samplers (Teledyne ISCO, Avalanche, Lincoln, NE, United States) were installed at the outflow of each plot. The depth and stage in the flume were measured using a bubbler (ISCO 730 Bubbler Flow Module) for the determination of discharge and volume [
23]. Each sampler recorded continuous refrigerator temperatures, and flume water levels every five minutes. Data from the samplers were retrieved using an ISCO 581 Rapid Transfer Device (RTD) manufactured by Teledyne ISCO. These data were downloaded into ISCO Flowlink 5.1 software for processing.
Samplers were programmed to collect flow-weighted runoff samples from each rain event. Each sampler was enabled when the flume stage surpassed 1.19 mm and stayed enabled until the water level dropped below this threshold. A 250 mL sample was taken for every 1.32 mm of runoff leaving the 0.22 ha plot. This equated to a 250 mL sample being collected for every 2.9 cubic meters of runoff. Each sample was deposited into a 20 L bottle within the sampler [
24] and stored at 3 ± 1 °C until they were taken to the laboratory for analysis [
23]. Small runoff events during the study period that did not enable the samplers were monitored for discharge and runoff volume, but no samples were collected for water quality analysis.
Samples were retrieved within 24 h of each runoff event. Samples were delivered to the Oklahoma Department of Agriculture, Food, and Forestry (ODAFF) lab in Oklahoma City for an analysis of total phosphorus (TP), total Kjeldahl nitrogen (TKN), nitrates (NO
3−), and nitrites (NO
2−) from April 2022 to April 2023. These samples were acidified in the field using 50% sulfuric acid (H
2SO
4) and delivered on ice to the lab [
25]. Beginning on 26 April 2023, samples were no longer acidified and were delivered to the Texas A&M Vernon lab for an analysis of the constituents listed previously plus total solids (TS),
E. coli, and ortho phosphate (Ortho p). To assess potential differences due to using two labs, the concentrations measured at ODAFF were compared to those measured at Vernon for each site. None of the nitrogen (TN, TKN, NO
3−, NO
2−) data had significantly different means when comparing the two sub-datasets from each lab (
p = 0.21 to 0.37). The TP data showed a significant reduction in year 2 when samples were analyzed by the Vernon lab; however, as will be discussed later, this can likely be explained by the fact that no phosphorus was applied in the fertilizer in year 2.
Soil moisture measurements were taken monthly to a depth of 10 cm using a FieldScout TDR 150 handheld digital moisture sensor (Spectrum© Technologies, Inc., Aurora, IL, United States). Soil moisture measurements were occasionally not possible due to soil hardness. Soil salinity was reported as bulk electrical conductivity (mS cm−1), and soil moisture was reported as percent volumetric water content (VWC). A measurement was taken within the row of cotton at each plot.
The fractional green canopy cover of the crop was measured using the photo-recognition software in the Canopeo Application for iOS [
26]. Cotton cover at all plots was photographed monthly during the spring and summer, and wheat cover was photographed monthly during the winter for treatments 3 and 4. Average crop height was recorded at these times using a manual tape measure from the ground to the top of the highest leaf in three different rows within a plot.
2.4. Data Validation and Statistical Analysis
Flume water level data for each plot was exported into Microsoft Excel to calculate event-based runoff volume and perform quality assurance and control. Runoff volumes were compared to daily rainfall data, which were retrieved from the Oklahoma Mesonet Altus station located roughly 400 m from the plots [
27]. Runoff data that could not be validated due to occasional ISCO mechanical failures (i.e., power failures, RTD corruption, and level measurement errors) were not utilized in statistical analysis.
All runoff, nutrient, bacteria, and soil data were analyzed at the treatment level. The median runoff volume was taken from the three replicates of each treatment for a given event to account for variability between plots and limit the influence of outlier values on the runoff volume for each event. Median nutrient, sediment, and bacteria values from each treatment were used to remain consistent with the runoff analysis. Runoff volume was also compared to the rainfall measured at each individual event.
Runoff, nutrient concentrations, nutrient loadings, soil moisture, crop coverage, and crop height datasets were tested for normality and equal variances using the Shapiro–Wilk and Levene’s tests, respectively [
28,
29]. Tests were performed in the Minitab Statistical Software Version 21.0. The results of these tests indicated that nonparametric statistics would be required to analyze the runoff and nutrient data, given that the residuals of these data failed to meet the normality assumptions of parametric statistics. An ANOVA was used for the soil and crop datasets, along with normalized comparisons of runoff to rainfall ratio data [
29].
The Kruskal–Wallis test was used to compare differences across all treatments, and the Mann–Whitney test was used to compare differences between two specific treatments. The test statistic that was adjusted for ties was reported when treatment mean ranks had ties. This did not impact statistical significance (p < 0.05) for any dataset.
Nutrient loading was calculated for each event by multiplying the nutrient concentration by the volume of runoff and dividing it by the area of each watershed [
30]. The Kruskal–Wallis test was used to compare statistical differences in the loadings for each treatment group [
29].
3. Results
3.1. Runoff
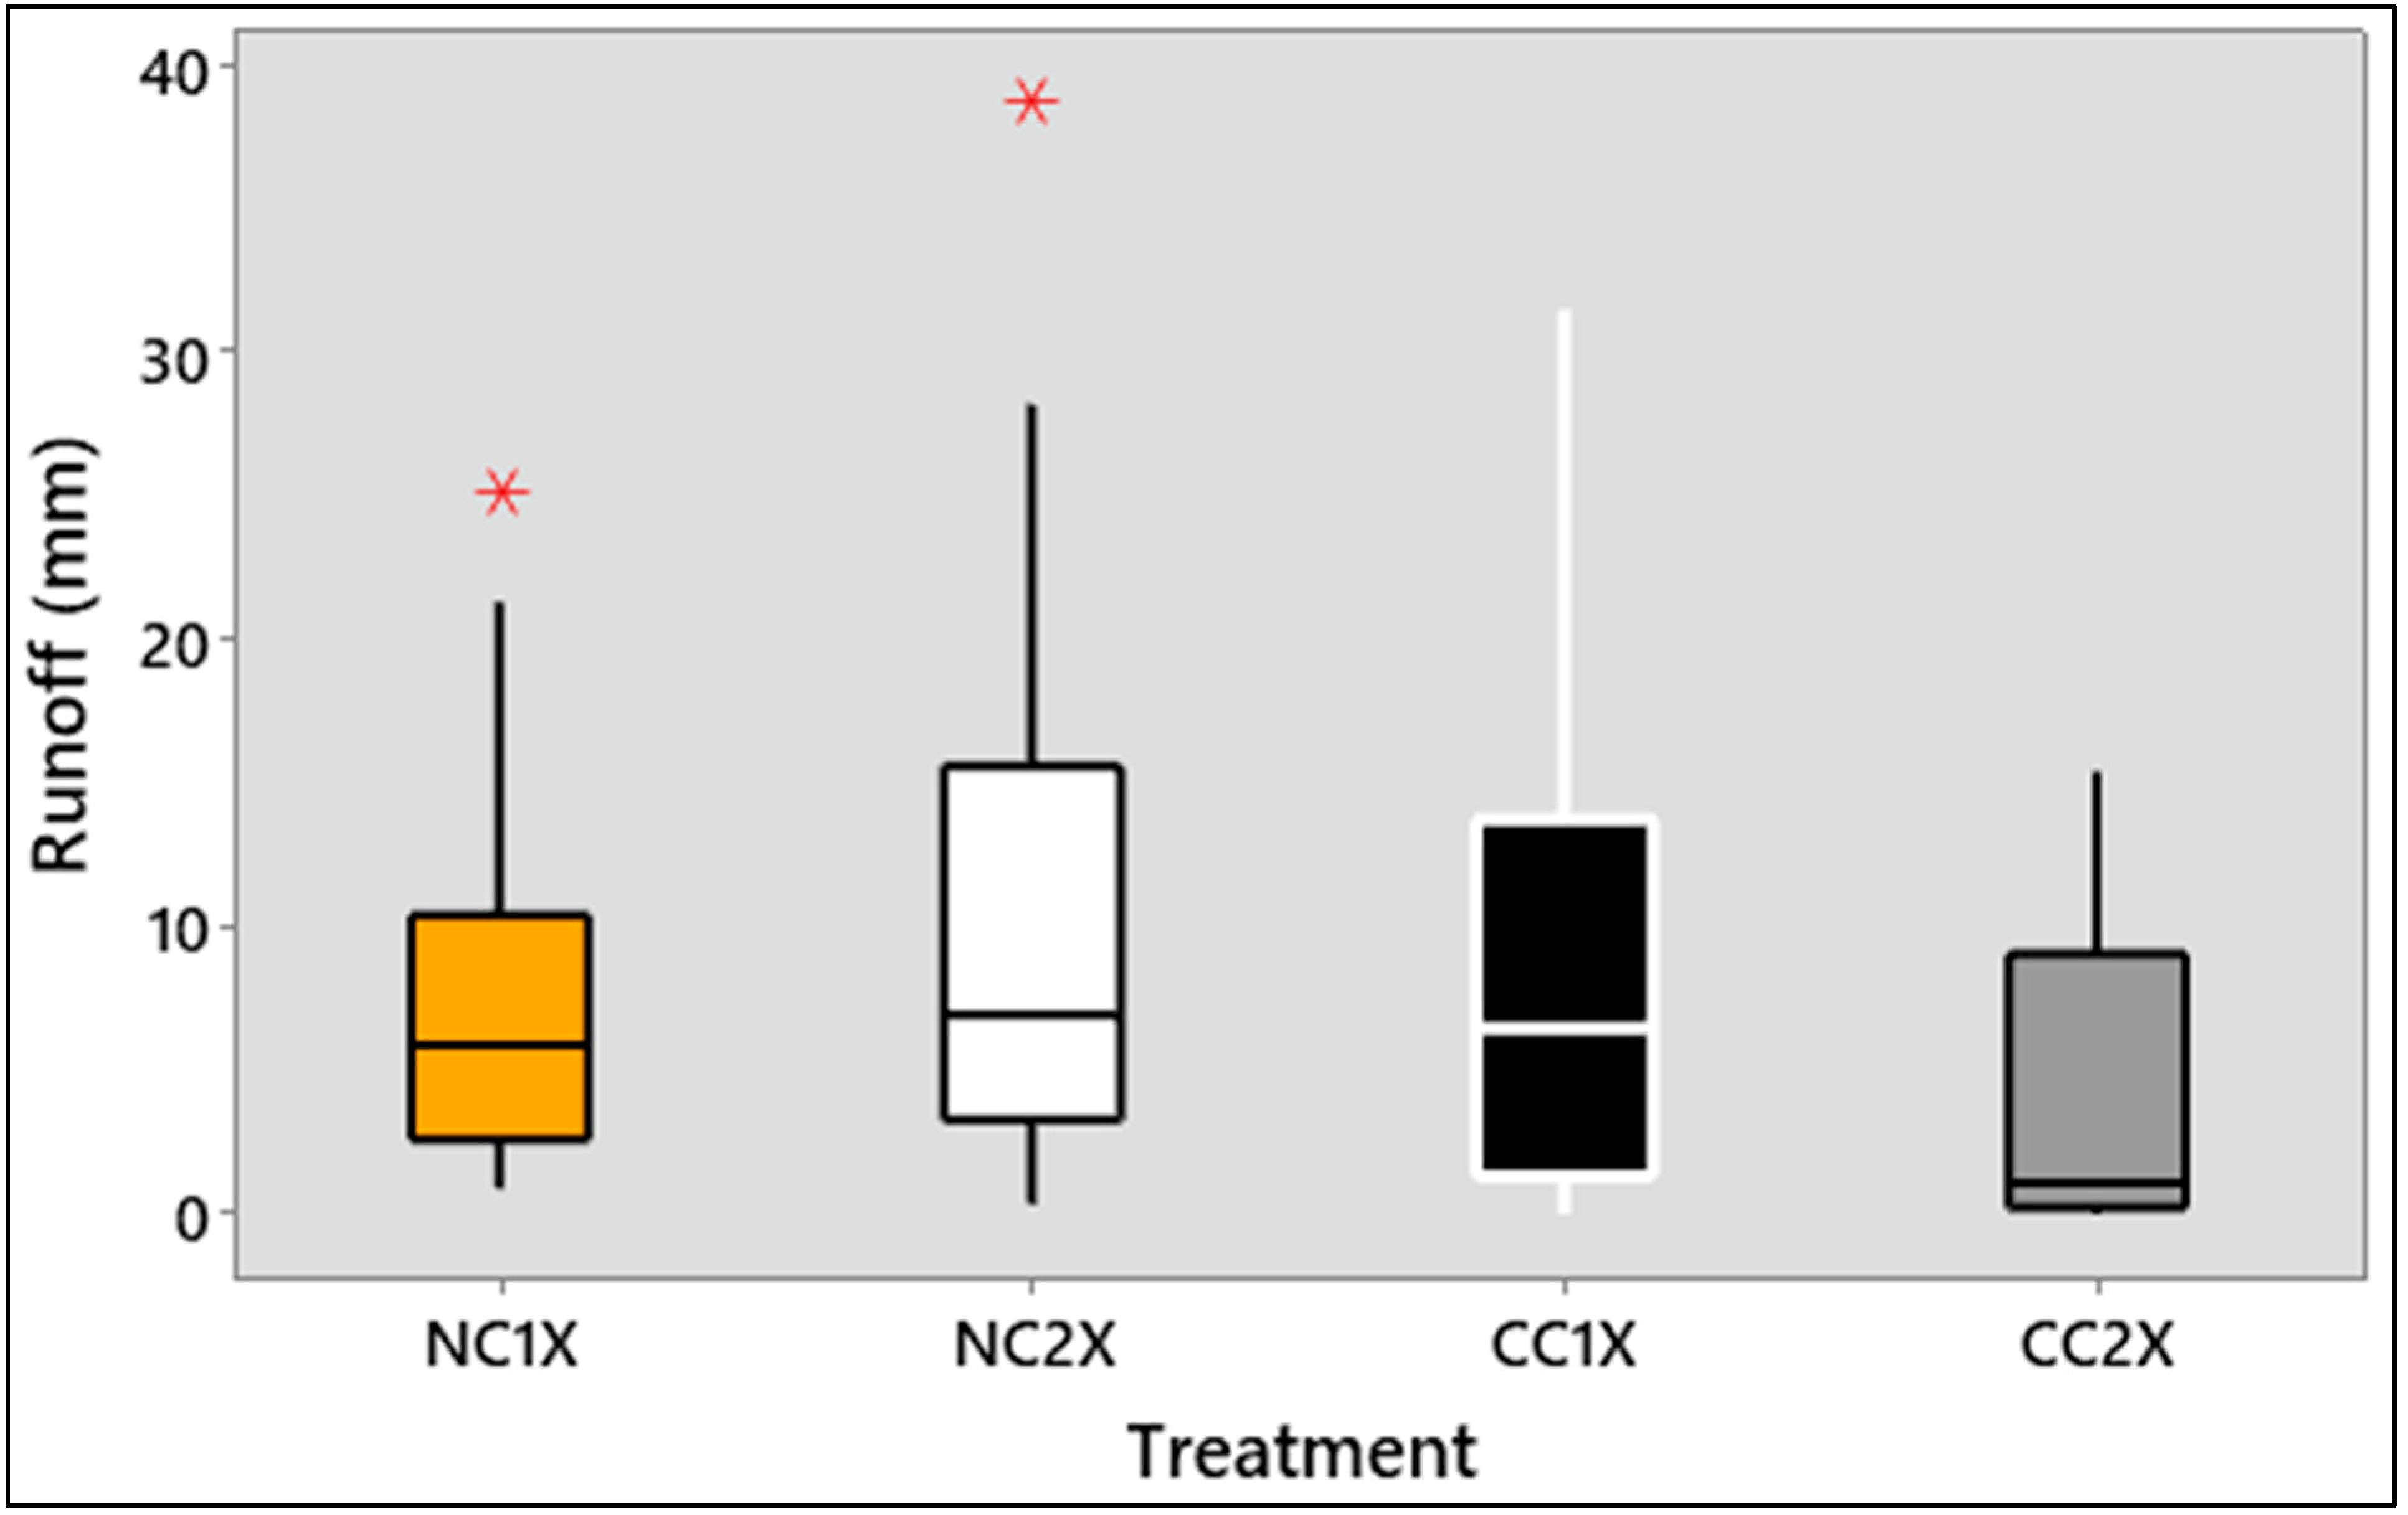
The plots experienced 715.5 mm of rainfall during the 19-month study, which is equivalent to 451 mm on an annual basis. This is lower than the 30-year annual average in the region of 713 mm. Twenty runoff events produced valid runoff data for analysis. CC2X plots showed significantly lower runoff when compared to plots in treatments 1 and 2 that were without cover crops. Total runoff for CC2X plots was 45% lower than that for NC1X plots (
p = 0.013) and 58% lower than that for NC2X plots (
p = 0.011). The difference between cover crop plots approached statistical significance (
p = 0.055) with CC2X plots exhibiting 49% less total runoff than CC1X plots.
Figure 2 represents this data grouped by treatment via box plots.
Runoff depth was also compared to rainfall depth for each individual event (
Table 2). CC2X plots yielded significantly less runoff than all other treatments (
p < 0.001) when using this approach. Runoff depths from CC2X plots averaged 8% of the rainfall depth. In comparison, other treatments yielded mean runoff depths of 31–45% of the rainfall depth.
3.2. Nutrients
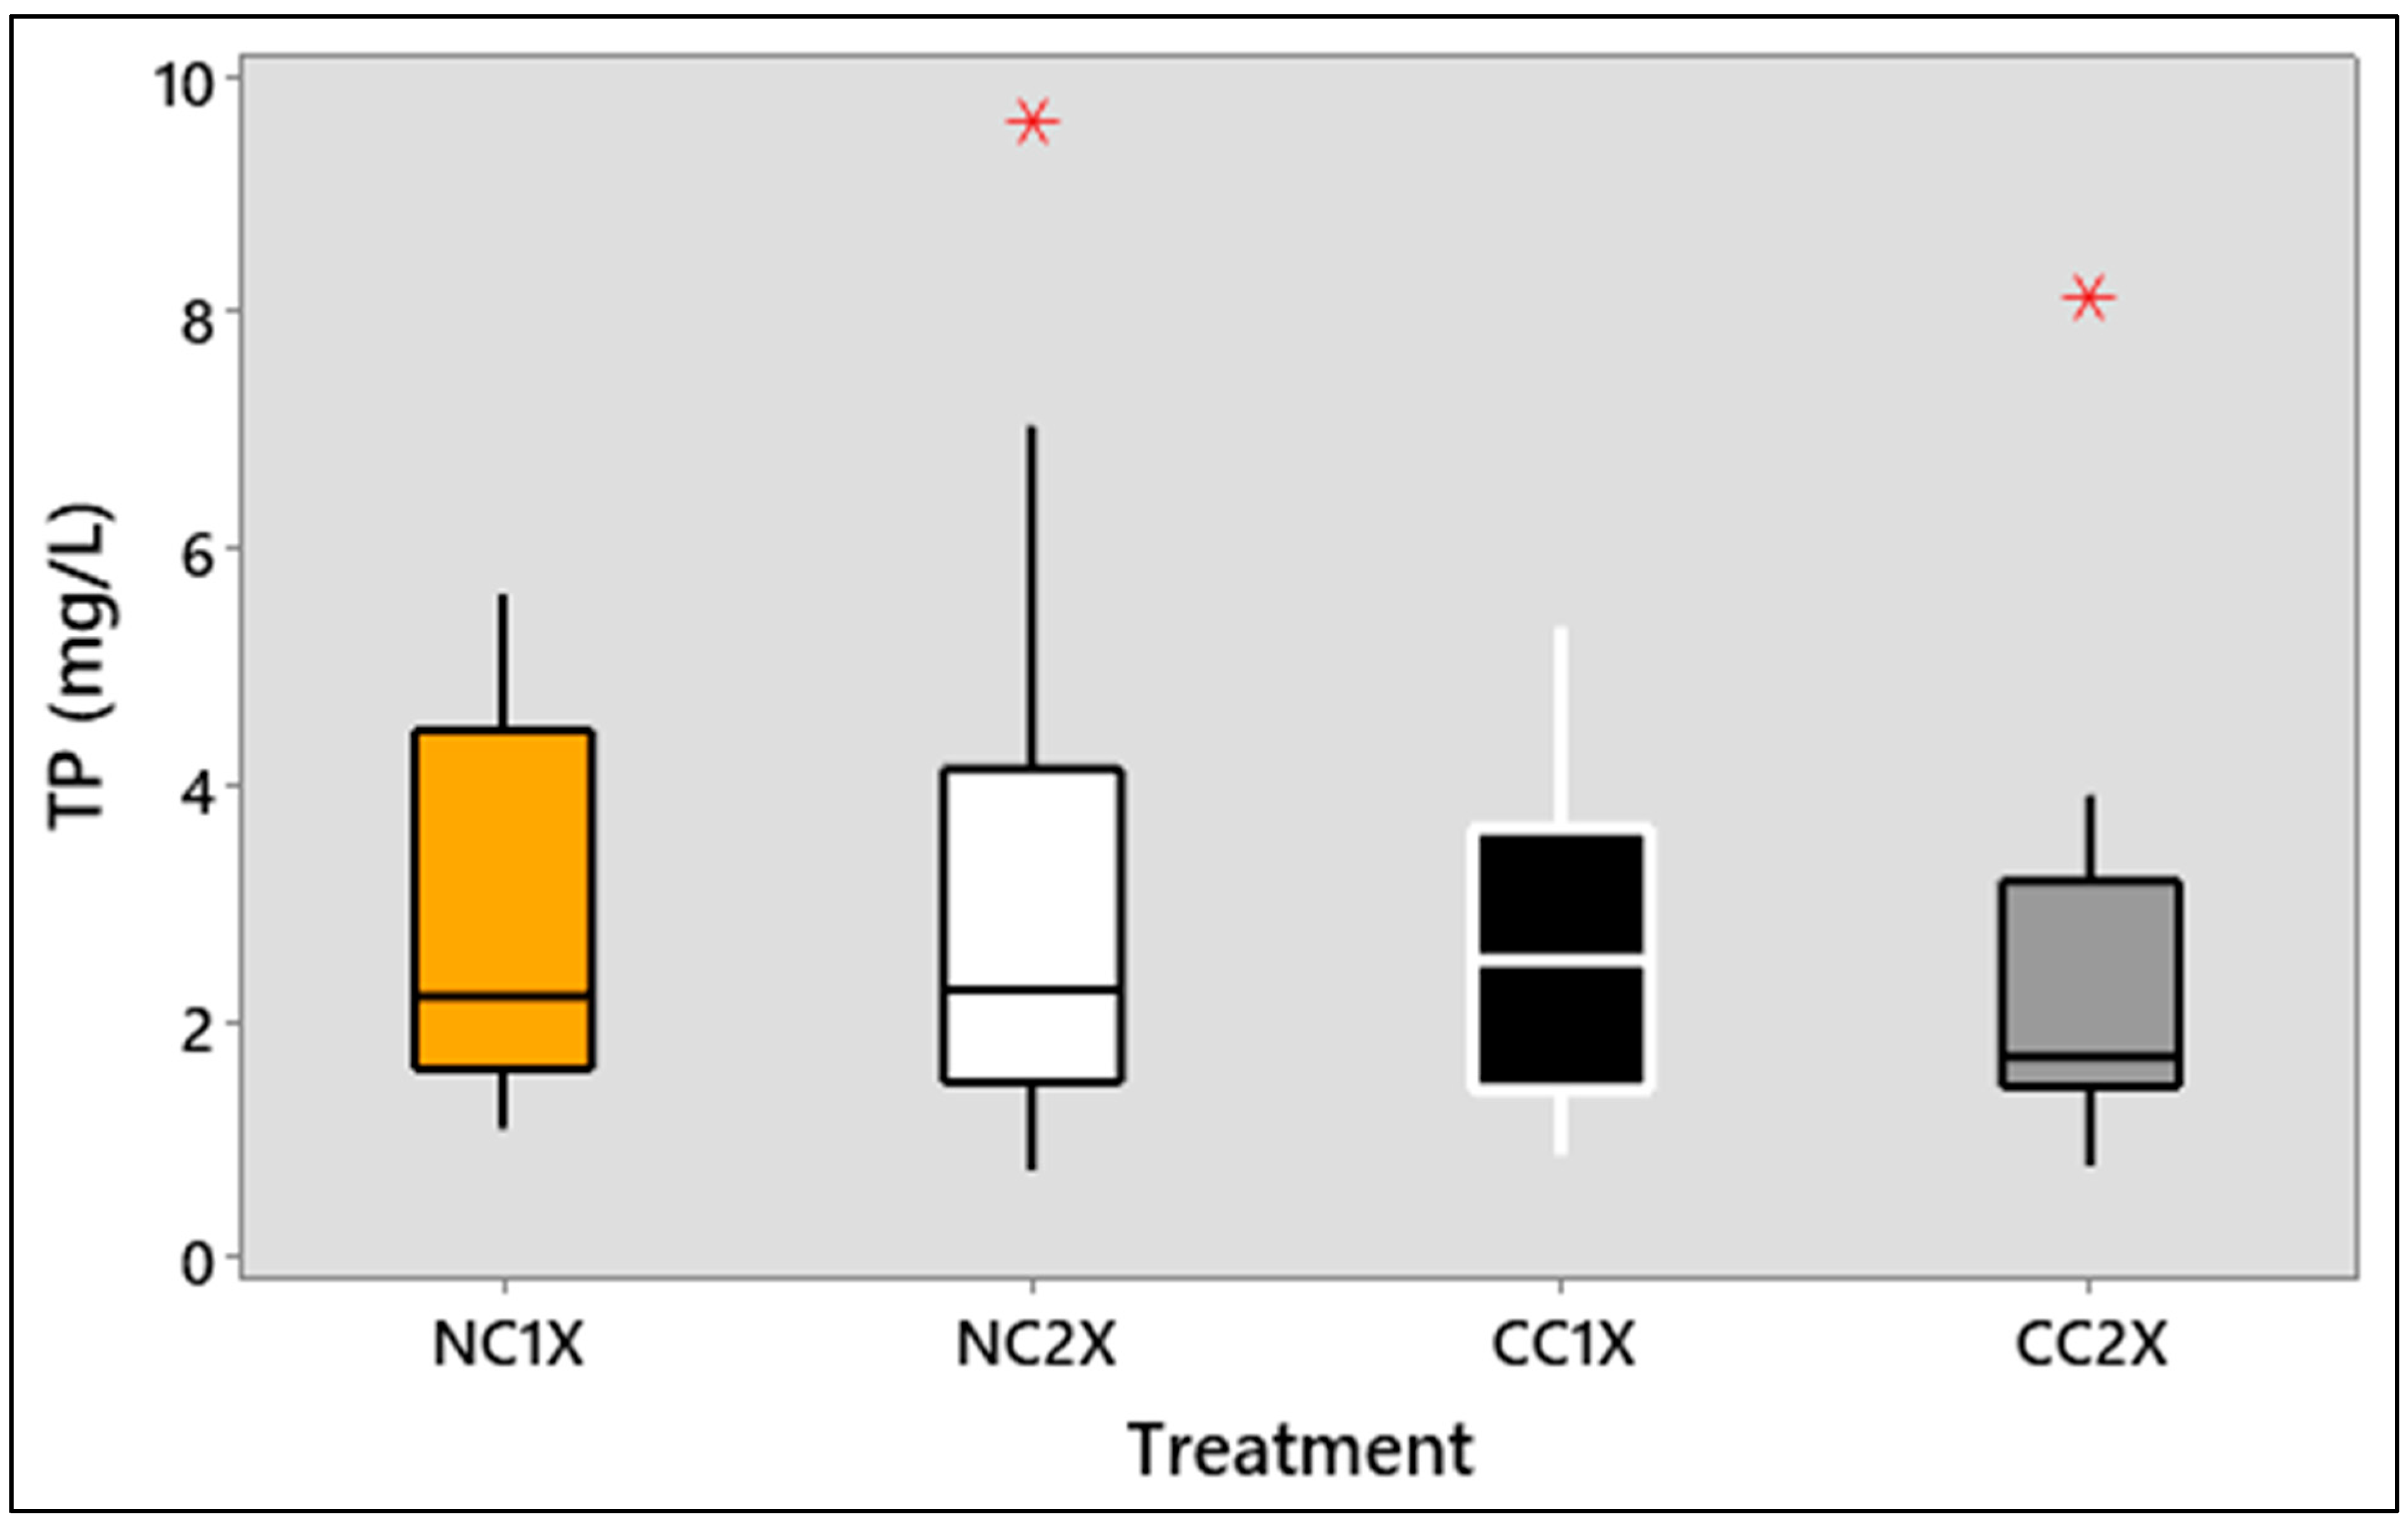
Water samples from 16 events were analyzed for TP concentration, represented via box plots from each treatment (
Figure 3). There was no statistical significance between the treatments (
p = 0.921). TP loadings were also not significantly different among treatments (
p = 0.355). Ortho phosphate concentrations (analyzed in year 2) were not significantly different (
p = 0.919).
Total nitrogen concentrations from these same 16 runoff events were derived from the summation of TKN, NO
3−, and NO
2− concentrations (
Figure 4). No statistically significant differences were found between treatments for TN (
p = 0.661), TKN (
p = 0.594), NO
3− (
p = 0.382), or NO
2− (
p = 0.953). TKN comprised 87–93% of the TN concentrations.
Median total nitrogen loadings from each treatment were also calculated for each event. The TKN loadings on average accounted for 87–95% of the TN loadings at every plot. These loading values showed no significant differences between treatments (p = 0.608).
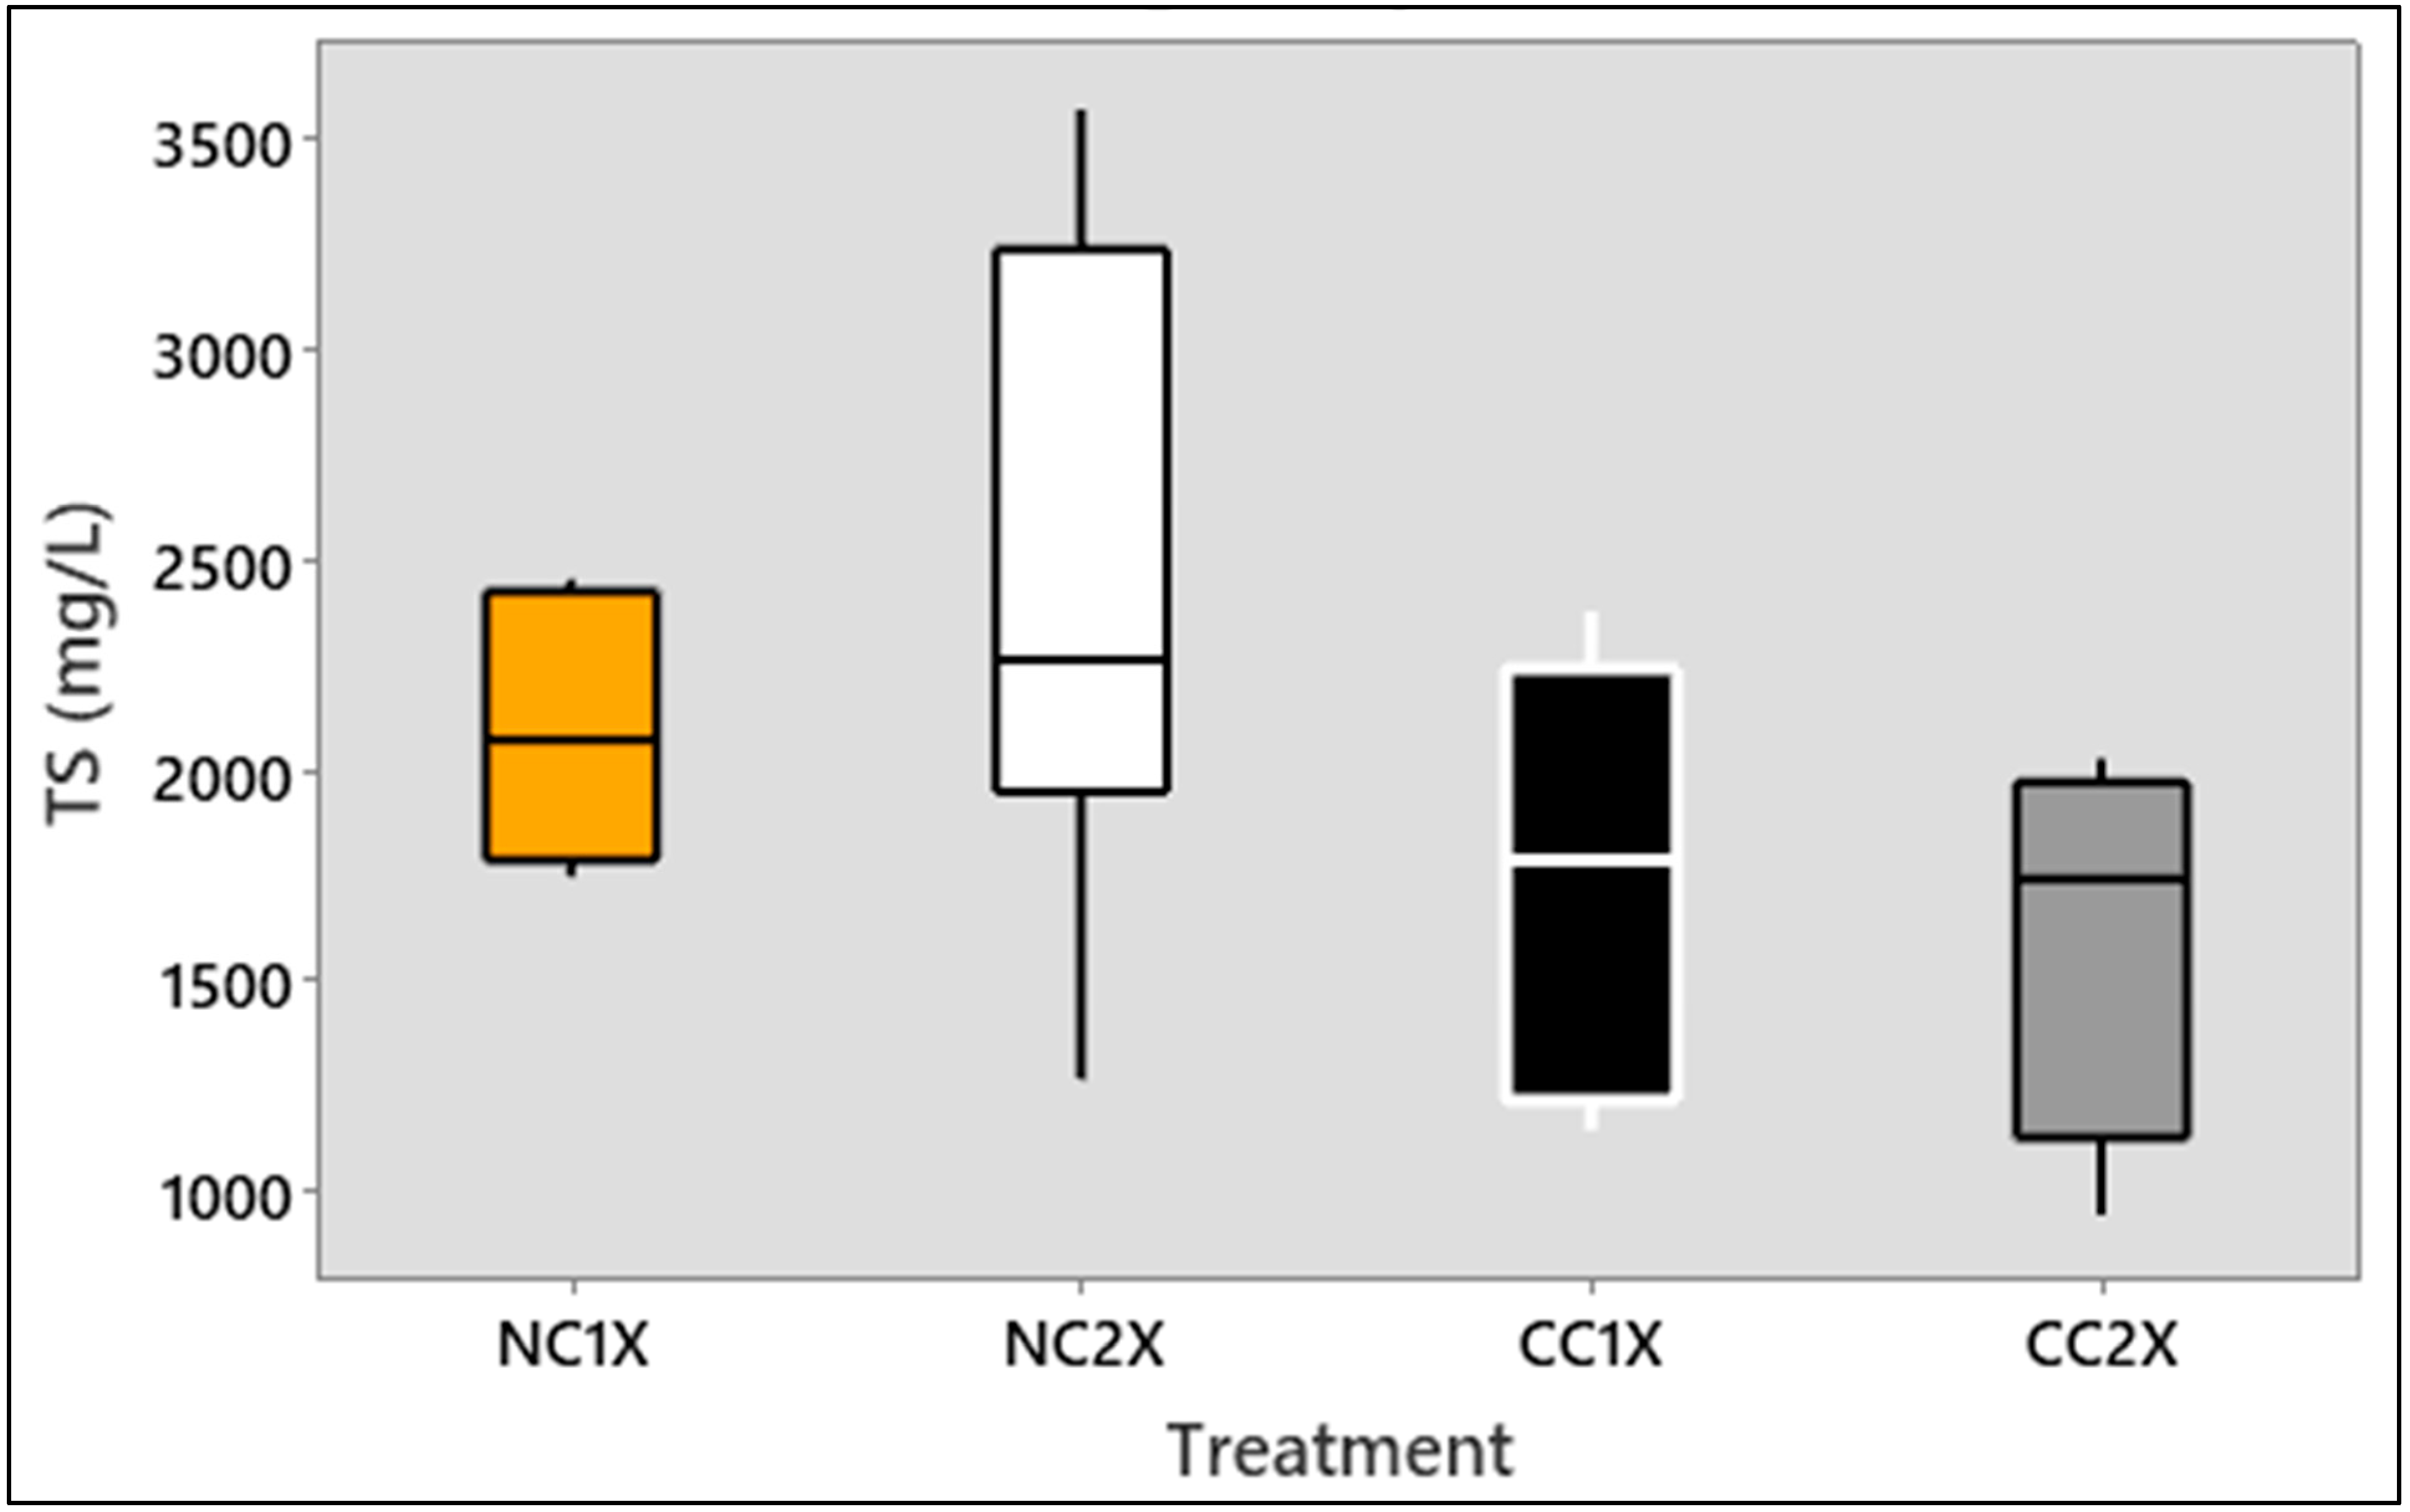
3.3. Total Solids
The laboratory measurements of TS are represented in
Figure 5. The concentrations of total solids were lower in runoff from treatments with cover crops but not statistically significant (
p = 0.134). Loading calculations of total solids were performed for each treatment and similarly showed no significant difference among treatments (
p = 0.576).
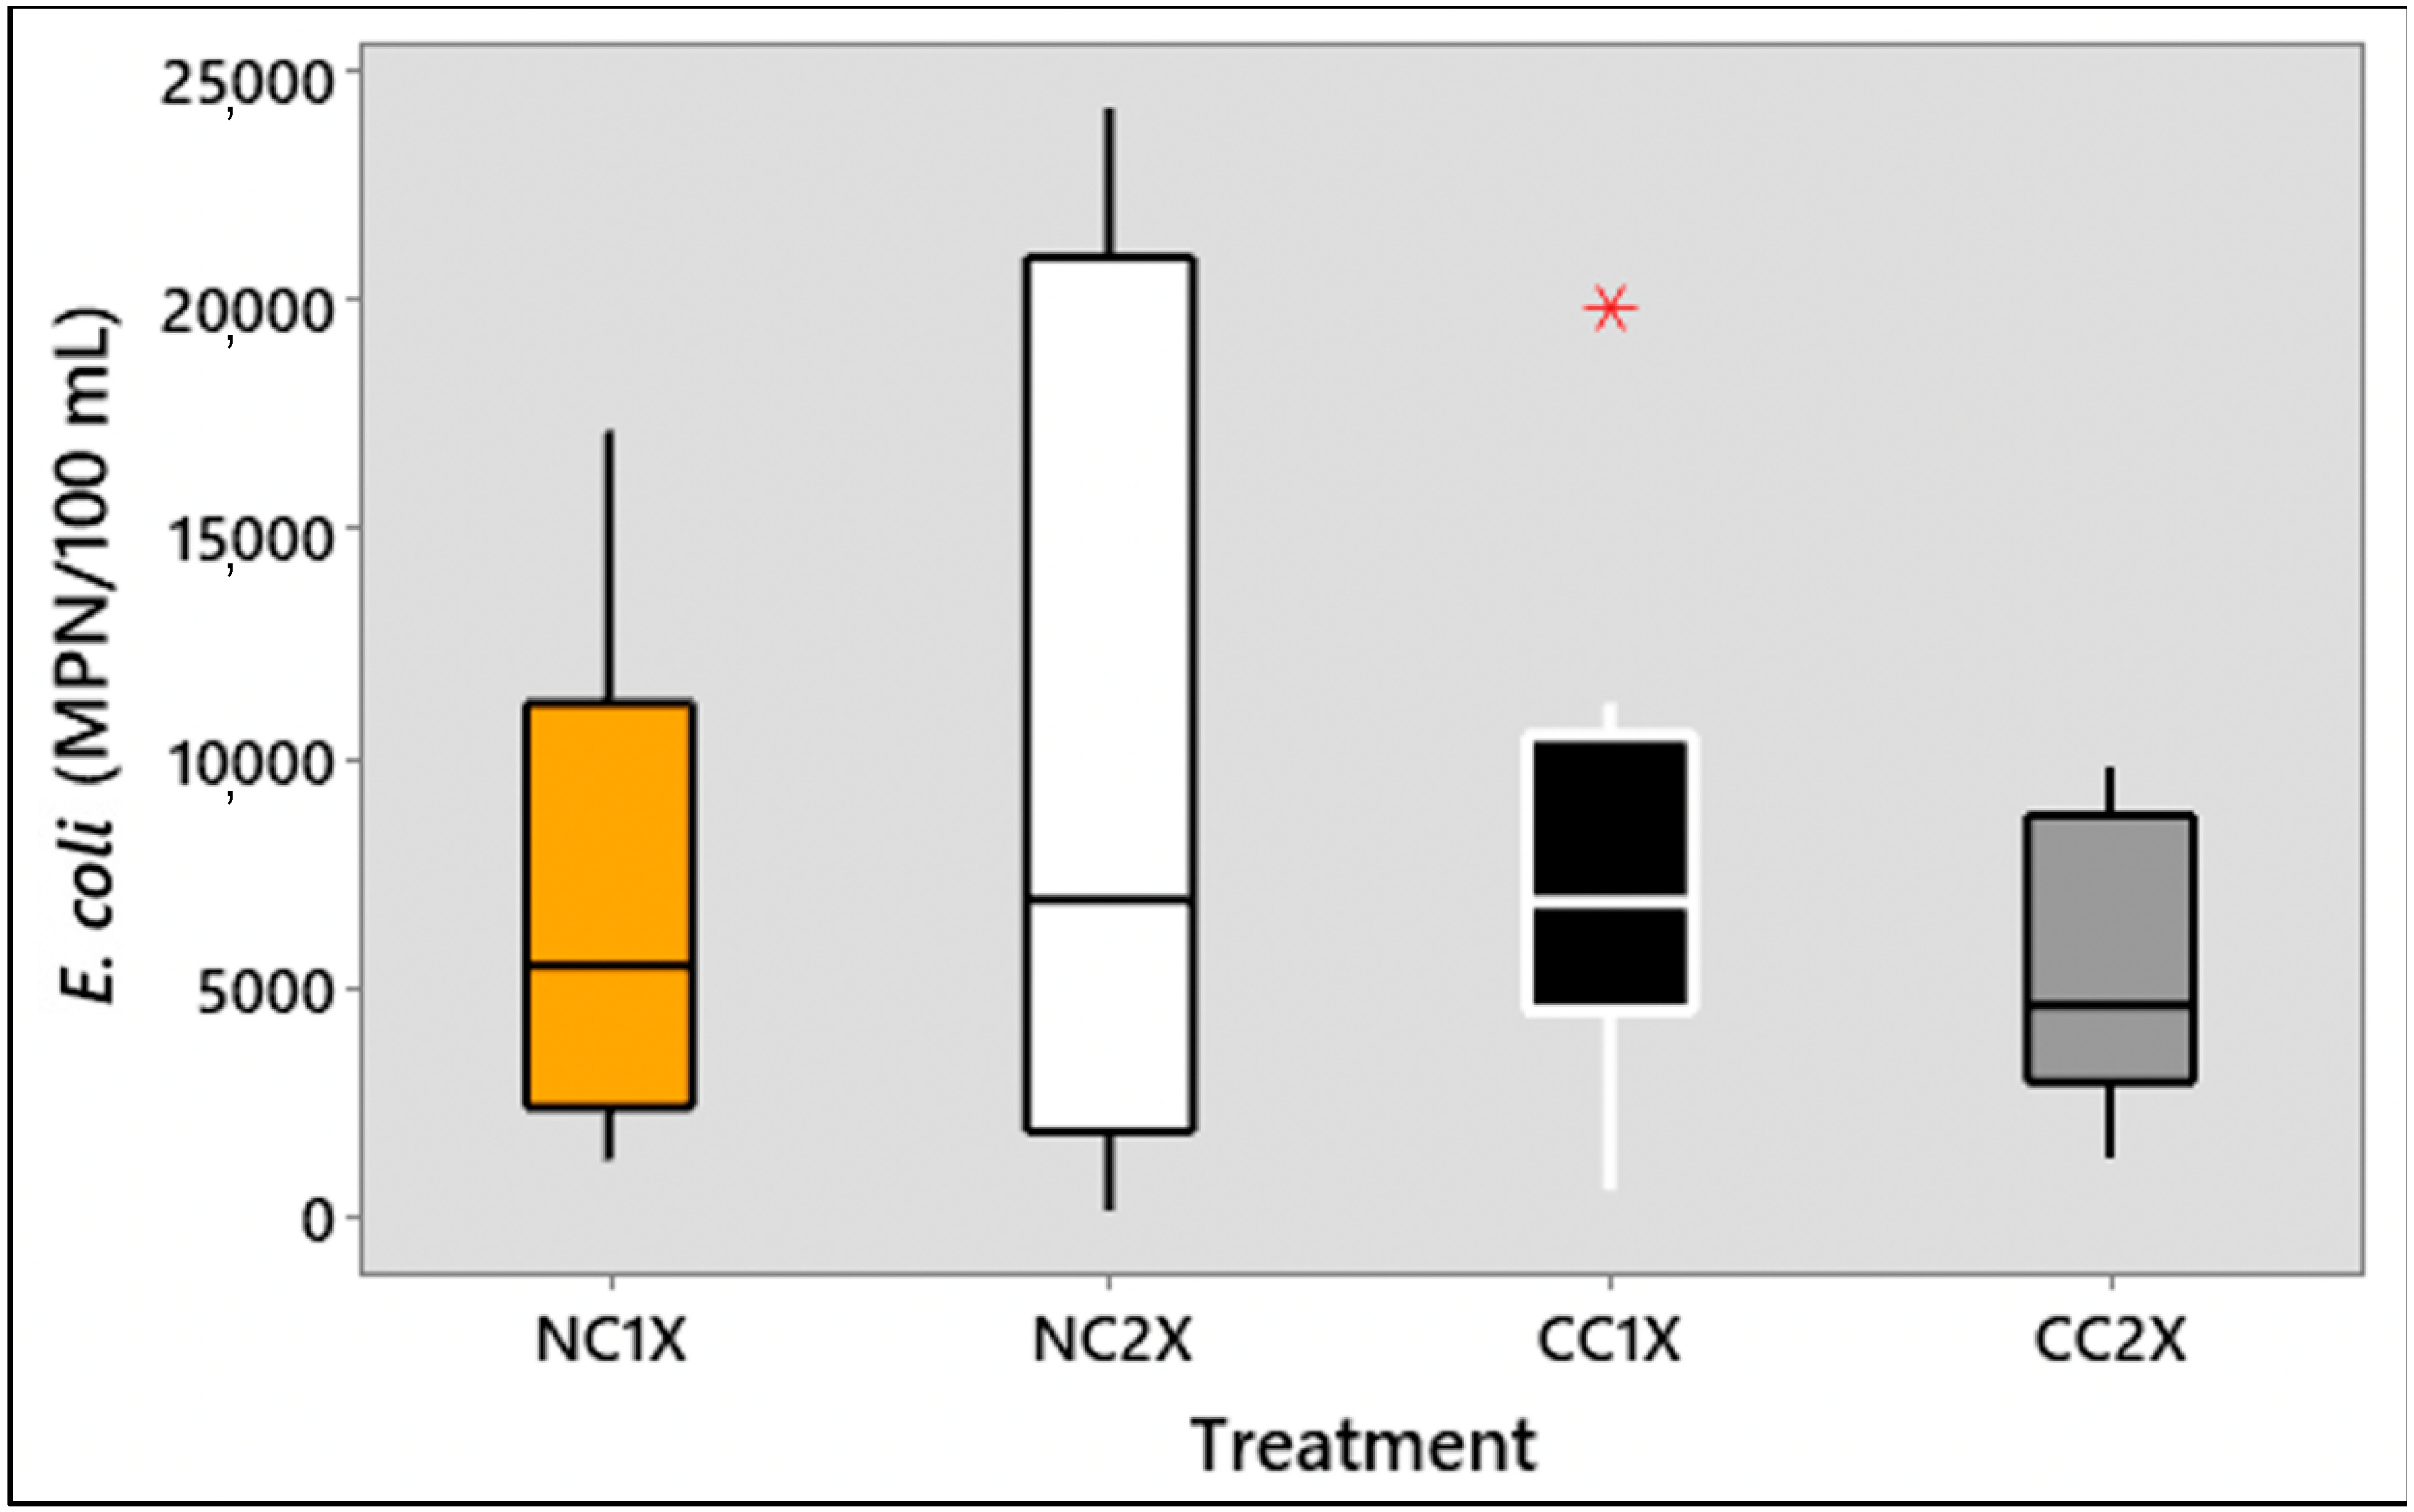
3.4. Bacteria
E. coli concentrations (
Figure 6), which were measured in year two only, are reported in the most probable number of colony-forming units (MPN). Median concentrations ranged from 135 to 2.42 × 10
4 MPN 100 mL
−1. Median
E. coli loadings ranged from 8.47 × 10
3 to 5.38 × 10
6 MPN ha
−1. Although the concentrations and loadings in CC1X and CC2X plots were lower than those in non-cover crop plots, these concentrations and loadings exhibited no statistical differences between treatments (
p = 0.811 and 0.842, respectively).
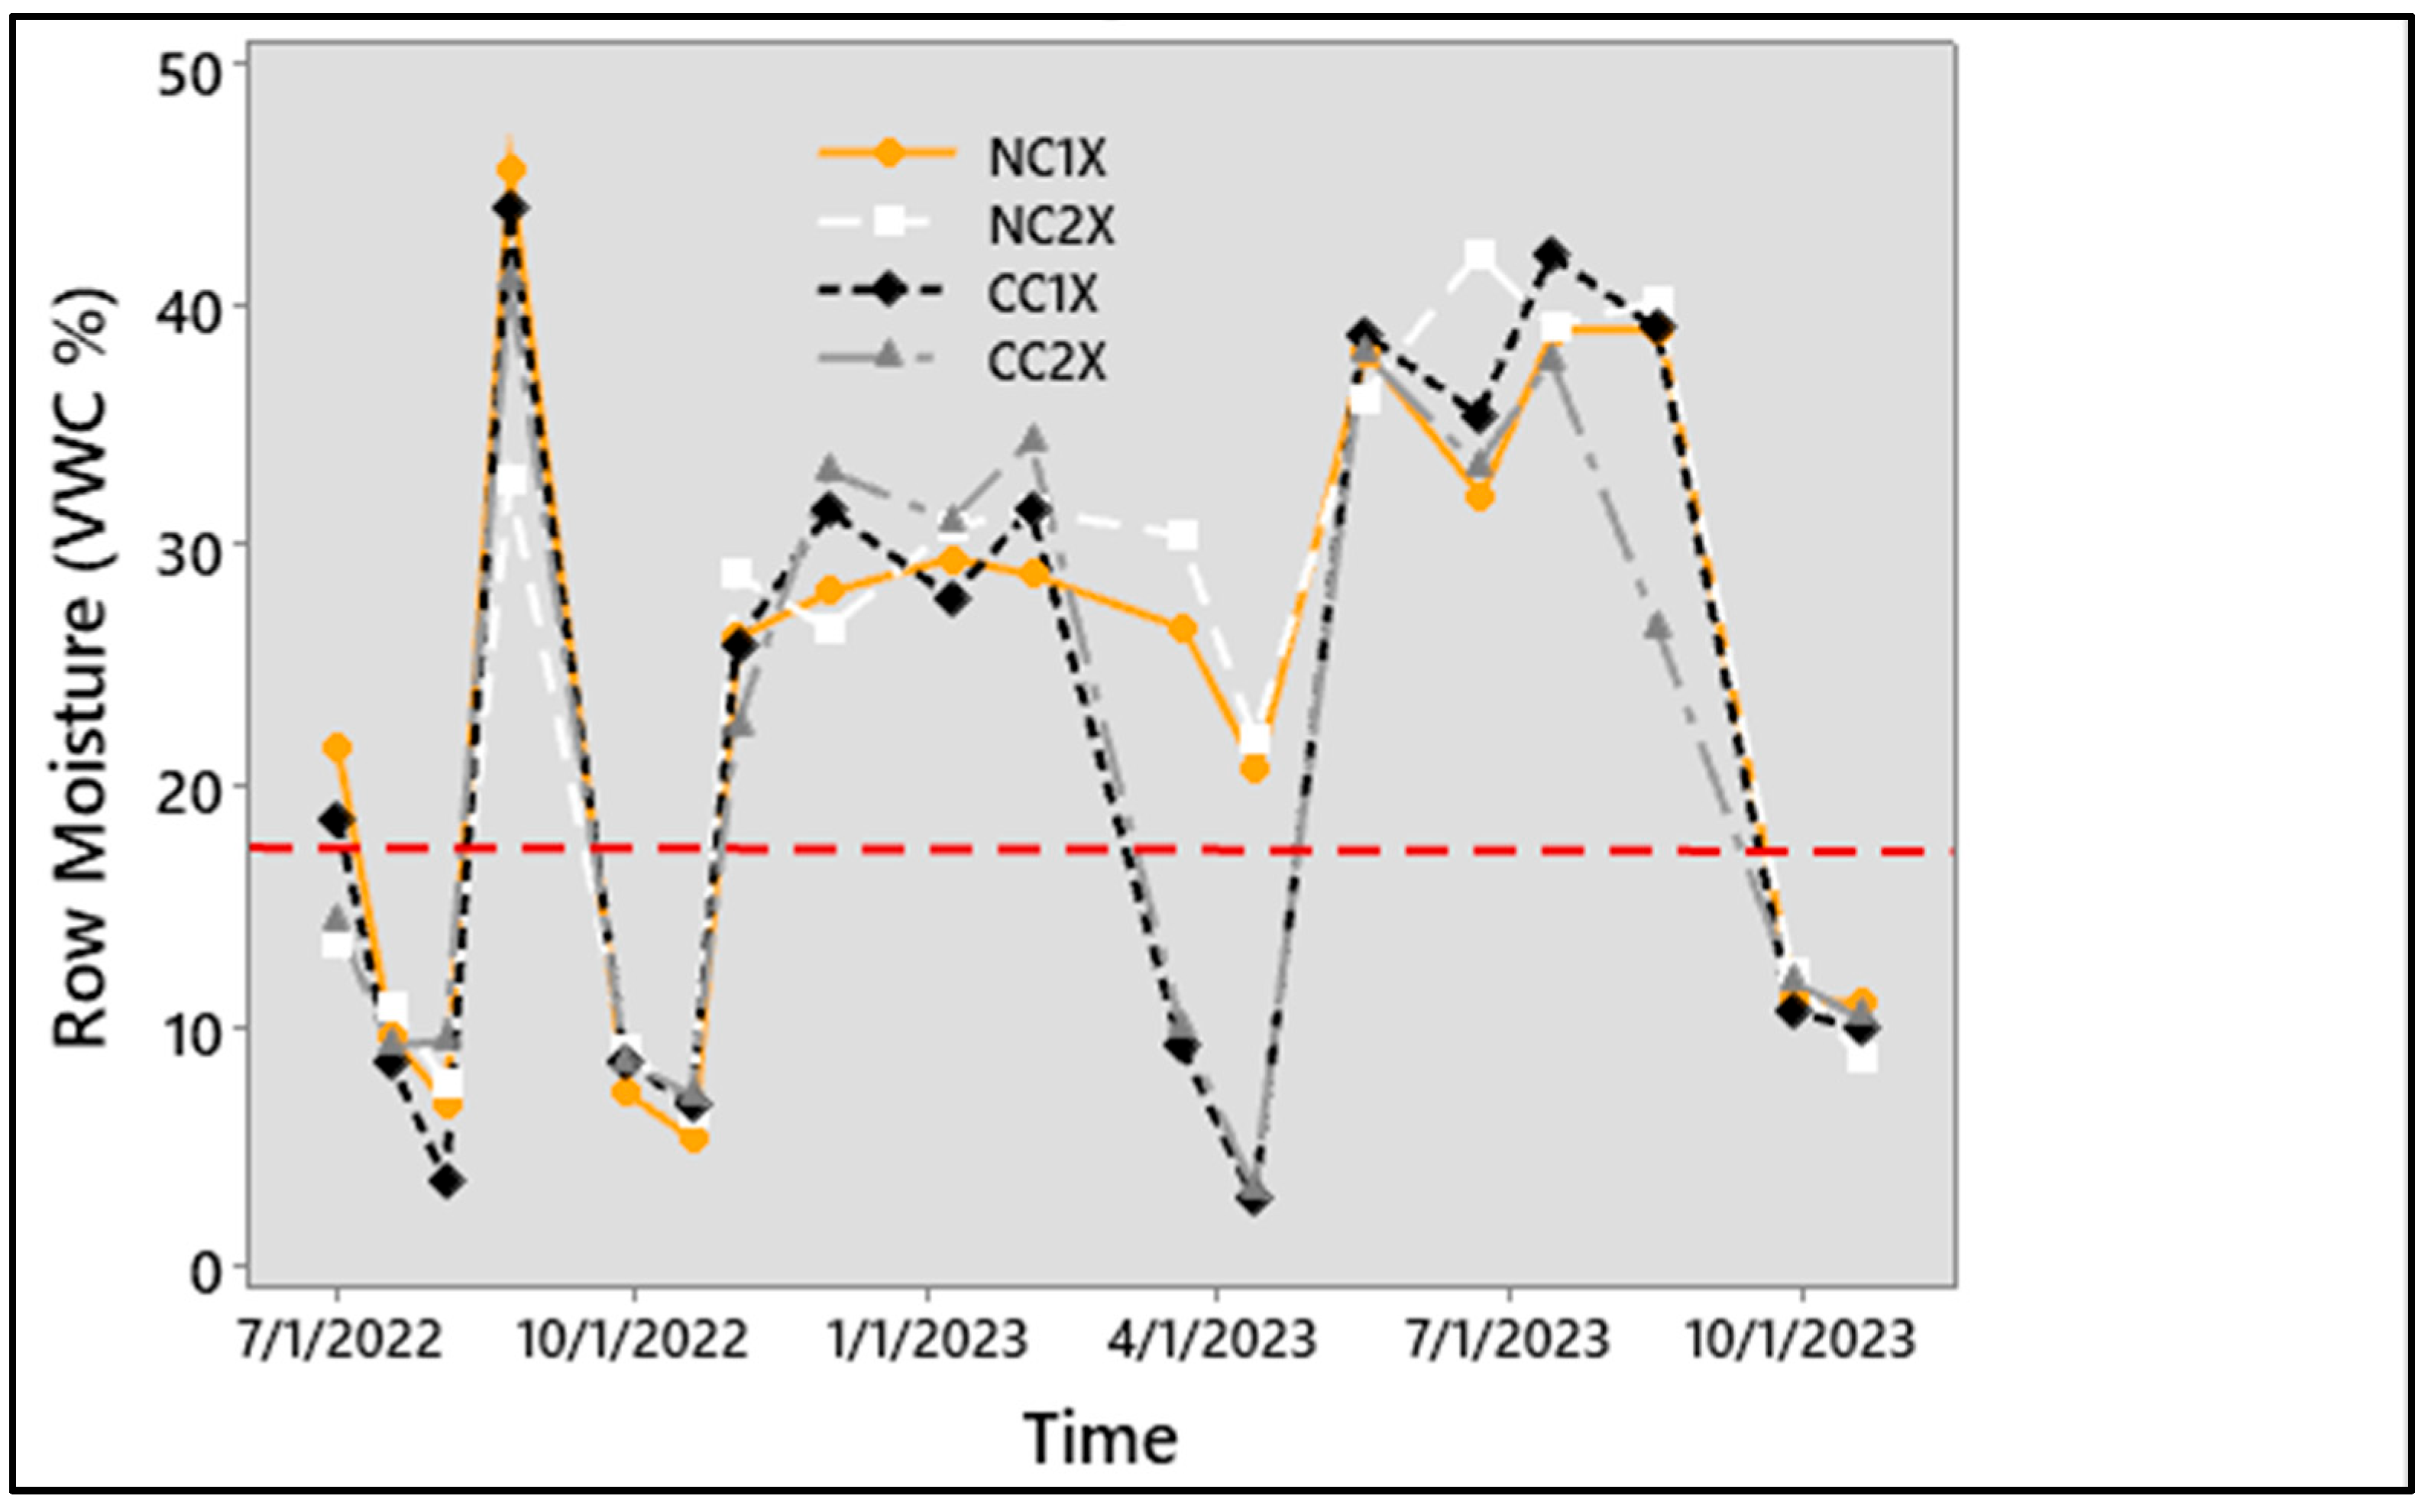
3.5. Soil Moisture and Crop Data
Monthly soil moisture readings from each plot were averaged and plotted as a function of time (
Figure 7). An ANOVA was used to test the entire study period and revealed no significant differences between treatments (
p = 0.914). Significant soil moisture reductions (
p < 0.001) were observed in the cover crop treatments when analyzing times of active cover crop growth in the spring (1 March 2023 to 14 April 2023).
The fractional green canopy coverage for each plot was measured monthly, and the treatment median comparisons resulted in no significant difference (p = 0.083). A significant increase in coverage in treatments 3 and 4 was detected when analyzing the period from 5 November 2022 to 14 April 2023 (p = 0.007), which coincided with the time that winter wheat was growing in treatments 3 and 4. Similarly, differences in crop height were not detected in our measurements between treatments for the duration of this study (p = 0.119), but treatments 3 and 4 had significantly higher crop height when winter wheat was actively growing (p = 0.009). Both growing seasons resulted in a failed cotton crop, with all plots estimated at 2.2 kg ha−1.
4. Discussion
4.1. Runoff
We found significant runoff reductions at sites with an intensive cotton seeding rate and a cover crop when compared to other treatments. However, a significant reduction was not observed at sites with a standard cotton seeding rate and cover crop (CC1X) when compared to plots without a cover crop. This could be partially attributed to the higher percent canopy cover and canopy heights measured in CC2X plots, along with the higher seeding rate of cotton for this treatment.
Variable and inconsistent runoff reduction from conservation tillage or the addition of a winter cover crop has been observed in similar studies performed in the Great Plains. A 4-year study in Manhattan, Kansas, compared a variety of phosphorus fertilizer management practices with the presence and absence of a winter cover crop on fields with a corn and soybean rotation. Significant differences in mean annual runoff were not observed in the first three years of this study. During year 4, cover cropped plots saw a significant reduction in annual runoff (222 mm) when compared to plots without a cover crop (287 mm) (
p < 0.05) [
31].
Research from El Reno, Oklahoma, compared rainfall runoff from plots with native grass to conventionally tilled wheat from 1977 to 1983 and added a no-till wheat treatment from 1984 to 1990. No significant differences were observed across the duration of this study, with considerable annual fluctuation from rainfall variability [
32].
A study near Vernon, Texas, found significant reductions when comparing the mean runoff at no-till plots with a winter cover (2.6 and 10 mm) to the mean runoff at conventionally tilled plots without cover (9.4 and 20 mm) (
p < 0.05). These sites also compared the presence and absence of livestock grazing as a method of cover crop termination. There were no significant differences between the grazed and ungrazed cover crop sites (
p < 0.05) [
8].
The percentage of rainfall that ran off at the Altus plots (8% for CC2X, 31–45% for all other treatments) is substantially higher than the long-term averages from Woodward and El Reno (7–12% for wheat and 3–7% for grassed watersheds). Differences in rainfall volume and intensity could contribute to annual runoff differences between these studies. Strong, heavy rain events that result from convective storms in the spring and summer have a high propensity to produce runoff on small plots. Additionally, clay-dominated soil types in Altus offer a higher runoff potential than the silt loam soils in El Reno and Woodward [
21,
32].
Comparing runoff at each plot within individual events provides further insight. Only 2 of the first 14 rain events showed significant differences between treatments. Conversely, significant reductions were detected in CC2X plots during five of the final six events. The nature and timing of these significant events later in this study suggest that differences in vegetation cover may be beginning to show up in the runoff data. A second year of winter cover crop employment could be expected to result in increased interception, evaporation, and infiltration of rainfall [
1,
3].
Previous studies suggest that a noticeable buildup of soil carbon (and subsequent reductions in surface runoff) may take 5 or more years to occur [
13,
33]. The accumulation of SOC is often slower in the SGP due to a drier climate and low biomass of cotton. Changes may take 10–15 years to reverse decades of tillage and monocropping [
34]. This timescale is beyond the timeframe for this study, but this trend will need to be monitored as this study progresses to see whether these differences persist.
4.2. Nutrients
A nutrient analysis of runoff samples did not yield significant differences in the concentrations or loadings of TP, Ortho p, or TN from runoff samples; however, there are a few potential trends emerging. Total phosphorus was measured across both years of this study and ranged from 0.71 to 9.61 mg L−1. The average concentration from plots with a winter cover crop was 2.47 mg L−1 as compared to 3.03 mg L−1 for plots without a winter cover crop (p = 0.921). In year two of this study, all plots yielded lower average TP concentrations and loadings when compared to year one. This can be primarily attributed to a change in fertilizer mix that did not include any phosphorus in year two.
Comparisons between treatments when examining constituents with the TP and TN concentrations did not produce statistical significance, but it is interesting to note that Ortho p concentrations increased slightly under winter cover treatments. Dissolved, bioavailable forms of phosphorus leach from plant residue and can be transported with runoff. A previous study assessed dissolved phosphorus concentrations in runoff from variable land management practices in El Reno and Woodward. Runoff from no-till wheat exhibited 58–308% higher dissolved phosphorus concentrations when compared to conventionally tilled plots and native grass. Major factors that control the concentration of Ortho p and other dissolved nutrients in runoff include the crop termination method, resulting residue, and timing in relation to runoff events [
32,
35,
36].
Phosphorus and nitrogen loadings displayed marginal and insignificant reductions (0.05–0.6 kg ha
−1 TP, 0.2–1.2 kg ha
−1 TN) at cover cropped treatments (
p = 0.545). Potential explanations include the short study period, rainfall characteristics, timing of fertilizer application, land cover, and slope [
32]. Previous longer-term studies observed reductions in TP loading with the employment of cover crops [
1,
37,
38].
4.3. Sediments
The total solid concentration results between treatments were not statistically significant (
p = 0.134), but they suggest that total solids might be slightly reduced under a winter cover crop. Treatments 3 and 4 have lower mean values (1.68 × 10
3 mg L
−1) and ranges (9.50 × 10
2–2.38 × 10
3 mg L
−1) when compared to treatments 1 and 2 (mean: 2.27 × 10
3 mg L
−1, range: 1.27 × 10
3–3.57 × 10
3 mg L
−1). Long-term sediment runoff datasets in El Reno show a mean concentration of 3.52 × 10
2 mg L
−1. The median value from this dataset is 1.39 × 10 mg L
−1, which indicates a skewed dataset with a wide range of concentrations [
4]. The disparity of ranges in this and other studies further highlights the variability in soil erosion and sediment transport in runoff events.
Total solid loadings showed no significant differences across all treatments. Values from treatments 3 and 4 were slightly reduced in terms of mean and range (
p = 0.576), which can be attributed to the lower volume of runoff measured at these plots. Sediment erosion is particularly important for clay-dominated soils like those found in this study location. Clay particles display strong attractive forces to the soil matrix, and erosion and the subsequent transport of clay particles to water bodies only occur during intense rainfall runoff events. However, once in a water body, these particles will stay in suspension for long periods until water flow or movement ceases. Their slow deposition rate contributes to high turbidity in watersheds where sediment erosion is high. This can be detrimental to aquatic life, as sunlight cannot penetrate the water profile. Aquatic plants are less successful at photosynthesizing and producing dissolved oxygen, and sensitive species struggle to adapt to these poor conditions [
6,
39].
4.4. Bacteria
E. coli concentrations (
p = 0.811) and loadings (
p = 0.842) showed no significant differences between treatments. There was higher variability under treatments 2 and 3. Wildlife accounted for the entirety of bacteria in runoff samples, as there was no grazing in this study. Concentrations ranged from 1.35 × 10
2 to 2.42 × 10
4 MPN 100 mL
−1, and event loadings ranged from 8.47 × 10
3 to 5.378 × 10
6 MPN ha
−1. There were no livestock at the site, and wildlife populations at the site were not quantitatively assessed, making it difficult to definitively conclude why such variation in concentrations and loadings occurred. Further complicating the quantification and source tracking of
E. coli in the environment is its ability to naturally spread and persist for long periods of time [
40].
Previous studies in Oklahoma have also reported highly variable bacterial concentrations leaving cropped and grazed watersheds. Values at the Oklahoma State University Cross Timbers Experimental Range near Stillwater, OK, ranged from 3.00 to 1.41 × 10
5 MPN 100 mL
−1 over a 2-year study [
41]. The complicated process of the transport and die-off of bacteria in natural systems across various landscape scales could partially explain this range [
42]. In addition, wildlife and livestock population, grazing intensity, and the timing of presence in relation to rainfall runoff events can affect the resulting bacterial concentrations [
43,
44]. At small scales,
E. coli concentrations exhibit substantial variation due to a variety of factors, and thus edge-of-field runoff is not currently subject to US EPA surface water standards [
45].
Despite these uncertainties, it is important to understand how agricultural practices can influence bacterial loadings. Current data and research have found difficulty in providing explanations or constraints on the factors influencing edge-of-field concentrations and loads. Compiling additional test results from future years in this study will be instrumental in understanding whether a winter cover will have a significant impact on bacterial loadings. It will be important to consider these values within the context of this study and the difficulty of quantifying the location and timing of wildlife inputs [
46,
47].
4.5. Soil and Crop Data
Soil moisture measurements were taken monthly at each plot, with no significant reductions in moisture (p = 0.914) under cover cropped plots when compared to plots without cover crops across the entire study period. Significant reductions (p < 0.001) were detected when analyzing the times of active spring cover crop growth (1 March 2023 to 14 April 2023). Additional evapotranspiration via the wheat cover crop accounts for soil moisture reductions. Soil moisture values at cover crop plots noticeably rebounded after several rain events in the months of May and June. This rebound occurred after cover crop termination and cotton planting.
Agricultural producers in the region are concerned that the addition of a winter cover crop will reduce soil moisture levels and will subsequently harm their cash crop. Soil moisture data were only compiled from one season of cover crop implementation which makes it difficult to draw definitive conclusions. Previous research in the Texas High Plains region addressed these concerns for conventional and no-till cotton production. The results indicate that soil moisture is reduced in the rooting zone during cover crop growth but typically rebounds following cover crop termination. Prior research found no significant difference in lint yields when comparing cover cropping to control treatments [
48].
The eventual drop in surface soil moisture percentages at all plots in July and August of both years of this study is concerning. No discernable differences in the data could be found regarding the timing of soil moisture decreases across treatments. The permanent wilting point for plants in these soils has been estimated to be at ~15% volumetric water content (VWC) [
49]. Measurements averaged 8.8% VWC during this time of year across all treatments, which is well below the permanent wilting point threshold. This data is unable to confirm the soil moisture percentages deeper in the profile, but the lack of irrigation and low soil moisture were likely major contributors to the failed cotton crops in consecutive years. Cotton yields were estimated at 2.2 kg ha
−1 across all treatments due to drought conditions during the growing season and were not harvested in either year of this study. Common biological responses of cotton plants to drought conditions include poor boll quality and the dropping of bolls, which was observed in this study [
50].
5. Conclusions
This study explored agricultural and ecosystem benefits from implementing cover crops on SGP cotton production by analyzing runoff from 20 events collected during two growing seasons.
The key findings indicate that implementing a winter wheat cover crop in conjunction with an intensive cotton seeding rate (CC2X) significantly reduced runoff volume. Neither implementing a cover crop alone (CC1X) nor implementing an intensive cotton seeding rate alone (NC2X) yielded significant runoff volume reductions. Hypotheses 1 and 2 were therefore partially rejected. No significant nutrient concentration or loading reductions were observed at plots with cover crops despite observed runoff reductions. Hypothesis 3 was rejected as a result.
No significant differences were detected in runoff or nutrient data during this period. Hypothesis 4 was rejected based on these findings. Soil moisture levels were significantly lower during peak cover crop growth in March and April. Hypothesis 5 therefore failed to be rejected.
This study experienced limitations due to the short timescale, drought, and mechanical failures. Soil carbon accumulation was likely negligible within this study’s timescale. Drought prevented irrigation and severely hampered cotton production. Various mechanical failures further reduced the dataset size and statistical conclusiveness of the remaining valid data.
Despite these limitations, this study adds to a growing framework of knowledge about regenerative agriculture in the SGP. The long-term monitoring of runoff water quality and soil health over several consecutive growing seasons is needed to fully address our research objectives [
18,
34]. Cover crop impact on soil moisture and soil salinity should be measured more frequently and at various depths in the rooting zone. A comparison of irrigated to dryland cotton production under the presence and absence of cover crops is another key area to be explored in future research. The continued assessment of regenerative agriculture effectiveness in this region is needed to determine strategies that improve agricultural production and resilience amidst intensifying climate conditions [
14,
48,
51].
Author Contributions
Conceptualization: K.L.W. and L.F.G.; Formal analysis: J.L.E., K.L.W., L.F.G. and T.E.O.; Funding acquisition: K.L.W. and L.F.G.; Investigation: J.L.E., K.L.W. and L.F.G.; Methodology: J.L.E., K.L.W. and L.F.G.; Project administration: K.L.W. and L.F.G.; Resources: J.L.E., K.L.W. and L.F.G.; Supervision: K.L.W., L.F.G., T.E.O. and S.H.S.; Validation: J.L.E., K.L.W., L.F.G., T.E.O. and S.H.S.; Visualization: J.L.E. and J.F.B.; Writing—original draft: J.L.E.; Writing—review and editing: K.L.W., L.F.G., T.E.O., S.H.S. and J.F.B. All authors have read and agreed to the published version of the manuscript.
Funding
This project is supported by Agriculture and Food Research Initiative Competitive Grant no. 2021-68012-35897 from the USDA National Institute of Food and Agriculture.
Data Availability Statement
The data supporting the findings of this study are not publicly available at this time as the project is still ongoing. The data will be made available upon reasonable request after the completion of the project.
Acknowledgments
We acknowledge Abu Mansaray, Paul DeLaune, Mike Schulz, Blake Sisson, Austin Phillippe, Tracy Beck, Breanna Barker, and Sierra Schupp for their contributions to this work.
Conflicts of Interest
The authors declare no conflicts of interest.
Abbreviations
ISCO, ISCO Avalanche automated sampler; NO3−, total nitrate; NO2−, total nitrite; ODAFF, Oklahoma Department of Agriculture, Food, and Forestry; Ortho P, ortho phosphate; RTD, rapid transfer device; SGP, Southern Great Plains; SOC, soil organic carbon; SREC, Southwest Research and Extension Center; TDS, total dissolved solids; TKN, total Kjeldahl nitrogen; TP, total phosphorus; TS, total solids; VWC, volumetric water content
References
- Aryal, N.; Reba, M.L.; Straitt, N.; Teague, T.G.; Bouldin, J.; Dabney, S. Impact of cover crop and season on nutrients and sediment in runoff water measured at the edge of fields in the Mississippi Delta of Arkansas. JSWC 2018, 73, 24–34. [Google Scholar] [CrossRef]
- Cooke, G.D.; Welch, E.B.; Jones, J.R. Eutrophication of Tenkiller Reservoir, Oklahoma, from nonpoint agricultural runoff. LRM 2011, 27, 256–270. [Google Scholar] [CrossRef]
- Dabney, S.M.; Delgado, J.A.; Reeves, D.W. Using Winter Cover Crops to Improve Soil and Water Quality. Commun. Soil Sci. Plan 2001, 32, 1221–1250. [Google Scholar] [CrossRef]
- Nelson, A.M.; Moriasi, D.N.; Fortuna, A.-M.; Steiner, J.L.; Starks, P.J.; Northup, B.; Garbrecht, J. Runoff water quantity and quality data from native tallgrass prairie and crop–livestock systems in Oklahoma between 1977 and 1999. JEQ 2020, 49, 1062–1072. [Google Scholar] [CrossRef]
- Wine, M.L.; Zou, C.B.; Bradford, J.A.; Gunter, S.A. Runoff and sediment responses to grazing native and introduced species on highly erodible Southern Great Plains soil. J. Hydrol. 2012, 450–451, 336–341. [Google Scholar] [CrossRef]
- Smith, V.H.; Tilman, G.D.; Nekola, J.C. Eutrophication: Impacts of excess nutrient inputs on freshwater, marine, and terrestrial ecosystems. Environ. Pollut. 1999, 100, 179–196. [Google Scholar] [CrossRef]
- U.S. Environmental Protection Agency. Causes of CyanoHABs [Overviews and Factsheets]. Available online: https://www.epa.gov/cyanohabs/causes-cyanohabs (accessed on 6 June 2018).
- Mubvumba, P.; DeLaune, P.B. Water quality effects of cover crop, grazing and tillage implementation in a long-term no-till wheat system. Soil Tillage Res. 2023, 225, 105547. [Google Scholar] [CrossRef]
- Poeplau, C.; Don, A. Carbon sequestration in agricultural soils via cultivation of cover crops—A meta-analysis. Agric. Ecosyst. Environ. 2015, 200, 33–41. [Google Scholar] [CrossRef]
- Qi, J.-Y.; Han, S.-W.; Lin, B.-J.; Xiao, X.-P.; Jensen, J.L.; Munkholm, L.J.; Zhang, H.-L. Improved soil structural stability under no-tillage is related to increased soil carbon in rice paddies: Evidence from literature review and field experiment. Environ. Technol. Innov. 2022, 26, 102248. [Google Scholar] [CrossRef]
- LaCanne, C.E.; Lundgren, J.G. Regenerative agriculture: Merging farming and natural resource conservation profitably. PeerJ 2018, 6, e4428. [Google Scholar] [CrossRef]
- Lankford, B.; Orr, S. Exploring the Critical Role of Water in Regenerative Agriculture; Building Promises and Avoiding Pitfalls. Front. Sustain. Food Syst. 2022, 6, 1–17. [Google Scholar] [CrossRef]
- Blanco-Canqui, H.; Ruis, S.J.; Holman, J.D.; Creech, C.F.; Obour, A.K. Can cover crops improve soil ecosystem services in water-limited environments? A review. Soil Sci. Soc. Am. J. 2022, 86, 1–18. [Google Scholar] [CrossRef]
- DeLaune, P.B.; Mubvumba, P.; Fan, Y.; Bevers, S. Cover crop impact on irrigated cotton yield and net return in the southern Great Plains. Agron. J. 2020, 112, 1049–1056. [Google Scholar] [CrossRef]
- Muller, A. Benefits of Organic Agriculture as a Climate Change Adaptation and Mitigation Strategy for Developing Countries. IOP Conf. Ser. Earth Environ. Sci. 2009, 6, 372032. [Google Scholar] [CrossRef]
- Modala, N.R.; Ale, S.; Goldberg, D.W.; Olivares, M.; Munster, C.L.; Rajan, N.; Feagin, R.A. Climate change projections for the Texas High Plains and Rolling Plains. Theor. Appl. Climatol. 2017, 129, 263–280. [Google Scholar] [CrossRef]
- Nielsen, D.C.; Lyon, D.J.; Hergert, G.W.; Higgins, R.K.; Holman, J.D. Cover Crop Biomass Production and Water Use in the Central Great Plains. Agron. J. 2015, 107, 2047–2058. [Google Scholar] [CrossRef]
- Lewis, K.L.; Burke, J.A.; Keeling, W.S.; McCallister, D.M.; DeLaune, P.B.; Keeling, J.W. Soil Benefits and Yield Limitations of Cover Crop Use in Texas High Plains Cotton. Agron. J. 2018, 110, 1616–1623. [Google Scholar] [CrossRef]
- Rust, N.A.; Stankovics, P.; Jarvis, R.M.; Morris-Trainor, Z.; de Vries, J.R.; Ingram, J.; Mills, J.; Glikman, J.A.; Parkinson, J.; Toth, Z.; et al. Have farmers had enough of experts? Environ. Manag. 2022, 69, 31–44. [Google Scholar] [CrossRef]
- VeVerka, J.S.; Udawatta, R.P.; Kremer, R.J. Soil health indicator responses on Missouri claypan soils affected by landscape position, depth, and management practices. JSWC 2019, 74, 126–137. [Google Scholar] [CrossRef]
- Web Soil Survey. 2023. Available online: https://websoilsurvey.nrcs.usda.gov/app/WebSoilSurvey.aspx (accessed on 11 October 2023).
- Mesonet. 2023. Available online: https://www.mesonet.org/about/mesonet-sites (accessed on 23 April 2024).
- Wagner, K.L.; Gregory, L.; Gerlich, J.A.; Rhodes, E.C.; deVilleneuve, S. Edge-of-Field Runoff Analysis following Grazing and Silvicultural Best Management Practices in Northeast Texas. Water J. 2023, 15, 3537. [Google Scholar] [CrossRef]
- Harmel, D. Cumulative uncertainty in measured streamflow and water quality data for small watersheds. J. ASABE 2006, 49, 689–701. [Google Scholar] [CrossRef]
- O’Dell, J.W. Determination of phosphorus by semi-automated colorimetry. In EMSL-Cincinnati; Elsevier: Amsterdam, The Netherlands, 1996; pp. 479–495. [Google Scholar] [CrossRef]
- Patrignani, A.; Ochsner, T.E. Canopeo: A Powerful New Tool for Measuring Fractional Green Canopy Cover. Agron. J. 2015, 107, 2312–2320. [Google Scholar] [CrossRef]
- McPherson, R.A.; Fiebrich, C.A.; Crawford, K.C.; Kilby, J.R.; Grimsley, D.L.; Martinez, J.E.; Basara, J.B.; Illston, B.G.; Morris, D.A.; Kloesel, K.A.; et al. Statewide monitoring of the mesoscale environment: A technical update on the Oklahoma Mesonet. J. Atmos. Oceanic Technol. 2007, 24, 301–321. [Google Scholar] [CrossRef]
- Helsel, D.R.; Hirsch, R.M.; Ryberg, K.R.; Archfield, S.A.; Gilroy, E.J. Statistical methods in water resources. In Techniques (4-A3); U.S. Geological Survey: Reston, VA, USA, 2020. [Google Scholar] [CrossRef]
- Minitab Support. [Mtbtopic]. 2024. Available online: https://support.minitab.com/en-us/minitab/ (accessed on 23 April 2024).
- Wagner, K.L. Evaluation of Methods to Assess and Reduce Bacterial Contamination of Surface Water from Grazing Lands. Ph.D. Thesis, Texas A&M University, College Station, TX, USA, 2011. Available online: https://www.proquest.com/docview/909603199/abstract/451B690BFCF841CBPQ/1 (accessed on 15 October 2023).
- Carver, R.E.; Nelson, N.O.; Roozeboom, K.L.; Kluitenberg, G.J.; Tomlinson, P.J.; Kang, Q.; Abel, D.S. Cover crop and phosphorus fertilizer management impacts on surface water quality from a no-till corn-soybean rotation. J. Environ. Manag. 2022, 301, 113818. [Google Scholar] [CrossRef]
- Sharpley, A.N.; Smith, S.J. Wheat tillage and water quality in the Southern plains. Soil Tillage Res. 1994, 30, 33–48. [Google Scholar] [CrossRef]
- Hux, B.A.; DeLaune, P.B.; Schirmarcher, M.T.; Gentry, T.J.; Mubvumba, P. Winter cover crop impact on soil health in Texas Rolling Plains dryland cotton. Agrosyst. Geosci. Environ. 2023, 6, e20352. [Google Scholar] [CrossRef]
- Mikha, M.M.; Benjamin, J.G.; Vigil, M.F.; Nielson, D.C. Cropping Intensity Impacts on Soil Aggregation and Carbon Sequestration in the Central Great Plains. Soil Sci. Soc. Am. J. 2010, 74, 1712–1719. [Google Scholar] [CrossRef]
- Aronsson, H.; Hansen, E.M.; Thomsen, I.K.; Liu, J.; Øgaard, A.F.; Känkänen, H.; Ulén, B. The ability of cover crops to reduce nitrogen and phosphorus losses from arable land in southern Scandinavia and Finland. JSWC 2016, 71, 41–55. [Google Scholar] [CrossRef]
- Koudahe, K.; Allen, S.C.; Djaman, K. Critical review of the impact of cover crops on soil properties. Int. Soil Water Conserv. Res. 2022, 10, 343–354. [Google Scholar] [CrossRef]
- Hanrahan, B.R.; King, K.W.; Duncan, E.W.; Shedekar, V.S. Cover crops differentially influenced nitrogen and phosphorus loss in tile drainage and surface runoff from agricultural fields in Ohio, USA. J. Environ. Manag. 2021, 293, 112910. [Google Scholar] [CrossRef]
- Yoo, K.H.; Touchton, J.T.; Walker, R.H. Runoff, sediment and nutrient losses from various tillage systems of cotton. Soil Tillage Res. 1988, 12, 13–24. [Google Scholar] [CrossRef]
- Xia, Y.; Zhang, M.; Tsang, D.C.W.; Geng, N.; Lu, D.; Zhu, L.; Igalavithana, A.D.; Dissanayake, P.D.; Rinklebe, J.; Yang, X.; et al. Recent advances in control technologies for non-point source pollution with nitrogen and phosphorous from agricultural runoff: Current practices and future prospects. Appl. Biol. Chem. 2020, 63, 8. [Google Scholar] [CrossRef]
- Jang, J.; Hur, H.G.; Sadowsky, M.J.; Byappanahalli, M.N.; Yan, T.; Ishii, S. Environmental Escherichia coli: Ecology and public health implications-a review. J. Appl. Microbiol. 2017, 123, 570–581. [Google Scholar] [CrossRef]
- Phillippe, A.J. Determining Bacterial and Nutrient Concentrations and Loadings of Surface Runoff from Differing Grazer Access and Vegetative Cover in Northcentral Oklahoma. Master’s Thesis, Oklahoma State University, Stillwater, OK, USA, 2022. Available online: https://www.proquest.com/docview/2759093097/abstract/A8DEAB3AC9DD475DPQ/1 (accessed on 26 June 2025).
- Harmel, D.; Karthikeyan, R.; Gentry, T.; Srinivasan, R. Effects of Agricultural Management, Land Use, and Watershed Scale on E. coli Concentrations in Runoff and Streamflow. Trans. ASABE 2010, 53, 1833–1841. [Google Scholar] [CrossRef]
- Gregory, L.F.; Harmel, R.D.; Karthikeyan, R.; Wagner, K.L.; Gentry, T.J.; Aitkenhead-Peterson, J.A. Elucidating the Effects of Land Cover and Usage on Background Escherichia coli Sources in Edge-of-Field Runoff. JEQ 2019, 48, 1800–1808. [Google Scholar] [CrossRef]
- Wagner, K.L.; Redmon, L.A.; Gentry, T.J.; Harmel, R.D. Assessment of Cattle Grazing Effects on E. coli Runoff. Trans. ASABE 2012, 55, 2111–2122. [Google Scholar] [CrossRef]
- Recreational Water Quality Criteria; US EPA: Washington, DC, USA, 2012.
- Moyne, A.; Sudarshana, M.R.; Blessington, T.; Koike, S.T.; Cahn, M.D.; Harris, L.J. Fate of Escherichia coli O157:H7 in field-inoculated lettuce. Food Microbiol. 2011, 28, 1417–1425. [Google Scholar] [CrossRef]
- Zhao, Y.; Haley, O.C.; Xu, X.; Jaberi-Douraki, M.; Rivard, C.; Pliakoni, E.D.; Nwadike, L.; Bhullar, M. The Potential for Cover Crops to Reduce the Load of Escherichia coli in Contaminated Agricultural Soil. J. Food Prot. 2023, 86, 100103. [Google Scholar] [CrossRef]
- Burke, J.A.; Lewis, K.L.; DeLaune, P.B.; Cobos, C.J.; Keeling, J.W. Soil Water Dynamics and Cotton Production Following Cover Crop Use in a Semi-Arid Ecoregion. Agron. J. 2022, 12, 1306. [Google Scholar] [CrossRef]
- Yeo, I.-Y.; Lee, S.; Sadeghi, A.M.; Beeson, P.C.; Hively, W.D.; McCarty, G.W.; Lang, M.W. Assessing winter cover crop nutrient uptake efficiency using a water quality simulation model. Hydrol. Earth Syst. Sci. 2014, 18, 5239–5253. [Google Scholar] [CrossRef]
- Sharif, I.; Aleem, S.; Farooq, J.; Rizwan, M.; Younas, A.; Sarwar, G.; Chohan, S.M. Salinity stress in cotton: Effects, mechanism of tolerance and its management strategies. Physiol. Mol. Biol. Plants 2019, 25, 807–820. [Google Scholar] [CrossRef] [PubMed]
- Kumar, V.; Obour, A.; Jha, P.; Liu, R.; Manuchehri, M.R.; Dille, J.A.; Holman, J.; Stahlman, P.W. Integrating cover crops for weed management in the semiarid U.S. Great Plains: Opportunities and challenges. Weed Sci. 2020, 68, 311–323. [Google Scholar] [CrossRef]
Figure 1.
The study area and delineation for each treatment applied. The dimensions of the entire study area are 80 m by 275 m.
Figure 1.
The study area and delineation for each treatment applied. The dimensions of the entire study area are 80 m by 275 m.
Figure 2.
Box plots of median runoff values for each event at the NC1X, NC2X, CC1X, and CC2X plots. The Kruskal–Wallis test was used to compare all treatments, and the Mann–Whitney test was used to conduct pairwise comparisons. CC2X had significantly reduced runoff compared to all other treatments. Red asterisks indicate outlier events where p < 0.05.
Figure 3.
Box plots of median total phosphorus (TP) concentration in runoff samples for each event at the NC1X, NC2X, CC1X, and CC2X plots for the duration of this study. Pairwise comparisons found no significant differences across all treatments. Outliers are indicated by red asterisks.
Figure 3.
Box plots of median total phosphorus (TP) concentration in runoff samples for each event at the NC1X, NC2X, CC1X, and CC2X plots for the duration of this study. Pairwise comparisons found no significant differences across all treatments. Outliers are indicated by red asterisks.
Figure 4.
Box plots of median total nitrogen (TN) concentration in runoff samples for each event at the NC1X, NC2X, CC1X, and CC2X plots for the duration of this study. Pairwise comparisons found no significant differences across all treatments. Outliers are indicated by red asterisk.
Figure 4.
Box plots of median total nitrogen (TN) concentration in runoff samples for each event at the NC1X, NC2X, CC1X, and CC2X plots for the duration of this study. Pairwise comparisons found no significant differences across all treatments. Outliers are indicated by red asterisk.
Figure 5.
Box plots of median concentrations of total solids (TS) in runoff samples at NC1X, NC2X, CC1X, and CC2X plots for events after 26 April 2023. Pairwise comparisons found no significant differences across all treatments.
Figure 5.
Box plots of median concentrations of total solids (TS) in runoff samples at NC1X, NC2X, CC1X, and CC2X plots for events after 26 April 2023. Pairwise comparisons found no significant differences across all treatments.
Figure 6.
Box plots of median E. coli concentrations in MPN100 mL−1 at NC1X, NC2X, CC1X, and CC2X plots for events after 26 April 2023. Pairwise comparisons found no significant differences across all treatments. Outliers are indicated by red asterisk.
Figure 6.
Box plots of median E. coli concentrations in MPN100 mL−1 at NC1X, NC2X, CC1X, and CC2X plots for events after 26 April 2023. Pairwise comparisons found no significant differences across all treatments. Outliers are indicated by red asterisk.
Figure 7.
Line plots of row moisture measurements for NC1X, NC2X, CC1X, and CC2X, over time. The red dashed line represents a permanent wilting point (~18% VWC) for cotton in these soils.
Figure 7.
Line plots of row moisture measurements for NC1X, NC2X, CC1X, and CC2X, over time. The red dashed line represents a permanent wilting point (~18% VWC) for cotton in these soils.
Table 1.
Management practices employed in each treatment and corresponding plots.
Table 1.
Management practices employed in each treatment and corresponding plots.
| Treatment | Cover Crop | Seeding Rate | Plot |
|---|
| NC1X | No | Standard | 4, 5, 11 |
| NC2X | No | Intensive | 1, 7, 10 |
| CC1X | Yes | Standard | 3, 6, 12 |
| CC2X | Yes | Intensive | 2, 8, 9 |
Table 2.
Runoff volume by treatment compared to total rainfall for each event. Significant reductions in the runoff ratio using the Kruskal–Wallis test are indicated by YES. Data from 5/5/22 showed statistical reductions in runoff from plots that fell under treatments 3 and 4 when compared to treatments 1 and 2. All other events that showed significant reductions in runoff were from CC2X plots.
| Event | Rainfall | NC1X Runoff (mm) | NC1X Runoff (mm) | NC1X Runoff (mm) | NC1X Runoff (mm) | Significance |
|---|
| 5/5/22 | 25.40 | 6.69 | 5.80 | 2.54 | 2.06 | YES |
| 5/11/22 | 19.30 | 3.48 | 3.10 | 1.00 | 0.87 | No |
| 5/17/22 | 8.89 | 1.26 | 4.04 | 0.45 | 0.21 | No |
| 5/24/22 | 25.40 | 15.39 | 17.57 | 13.76 | 11.12 | No |
| 6/10/22 | 20.83 | 7.56 | 16.05 | 15.35 | 11.08 | No |
| 8/22/22 | 40.64 | 15.45 | 28.21 | 31.49 | 12.48 | No |
| 10/25/22 | 36.32 | 6.85 | 8.35 | 8.52 | 4.89 | No |
| 10/29/22 | 34.29 | 21.32 | 25.43 | 22.06 | 15.38 | No |
| 11/5/22 | 13.46 | 5.61 | 9.43 | 6.09 | 0.54 | No |
| 11/27/22 | 22.35 | 6.12 | 7.97 | 6.85 | 0.18 | No |
| 12/13/22 | 11.94 | 6.43 | 8.23 | 7.34 | 1.49 | No |
| 1/25/23 | 11.43 | 1.15 | 0.72 | 0.10 | 0.90 | No |
| 2/9/23 | 5.08 | 0.87 | 0.53 | 0.32 | 0.00 | No |
| 4/26/23 | 19.05 | 1.15 | 0.35 | 0.00 | 0.03 | No |
| 5/14/23 | 44.96 | 25.17 | 38.83 | 23.97 | 10.43 | YES |
| 5/28/23 | 19.05 | 11.33 | 14.22 | 13.66 | 4.63 | YES |
| 6/6/23 | 9.91 | 3.94 | 3.88 | 5.12 | 1.17 | YES |
| 6/7/23 | 9.14 | 2.27 | 2.80 | 2.25 | 0.23 | YES |
| 6/13/23 | 12.70 | 3.79 | 5.26 | 7.88 | 1.00 | YES |
| 7/15/23 | 13.21 | 4.29 | 5.88 | 4.28 | 0.01 | no |
| Disclaimer/Publisher’s Note: The statements, opinions and data contained in all publications are solely those of the individual author(s) and contributor(s) and not of MDPI and/or the editor(s). MDPI and/or the editor(s) disclaim responsibility for any injury to people or property resulting from any ideas, methods, instructions or products referred to in the content. |
© 2025 by the authors. Licensee MDPI, Basel, Switzerland. This article is an open access article distributed under the terms and conditions of the Creative Commons Attribution (CC BY) license (https://creativecommons.org/licenses/by/4.0/).


 ,
, 

