
Automated Machine Learning-Based Prediction of the Effects of Physicochemical Properties and External Experimental Conditions on Cadmium Adsorption by Biochar
 ,
,
Abstract
1. Introduction
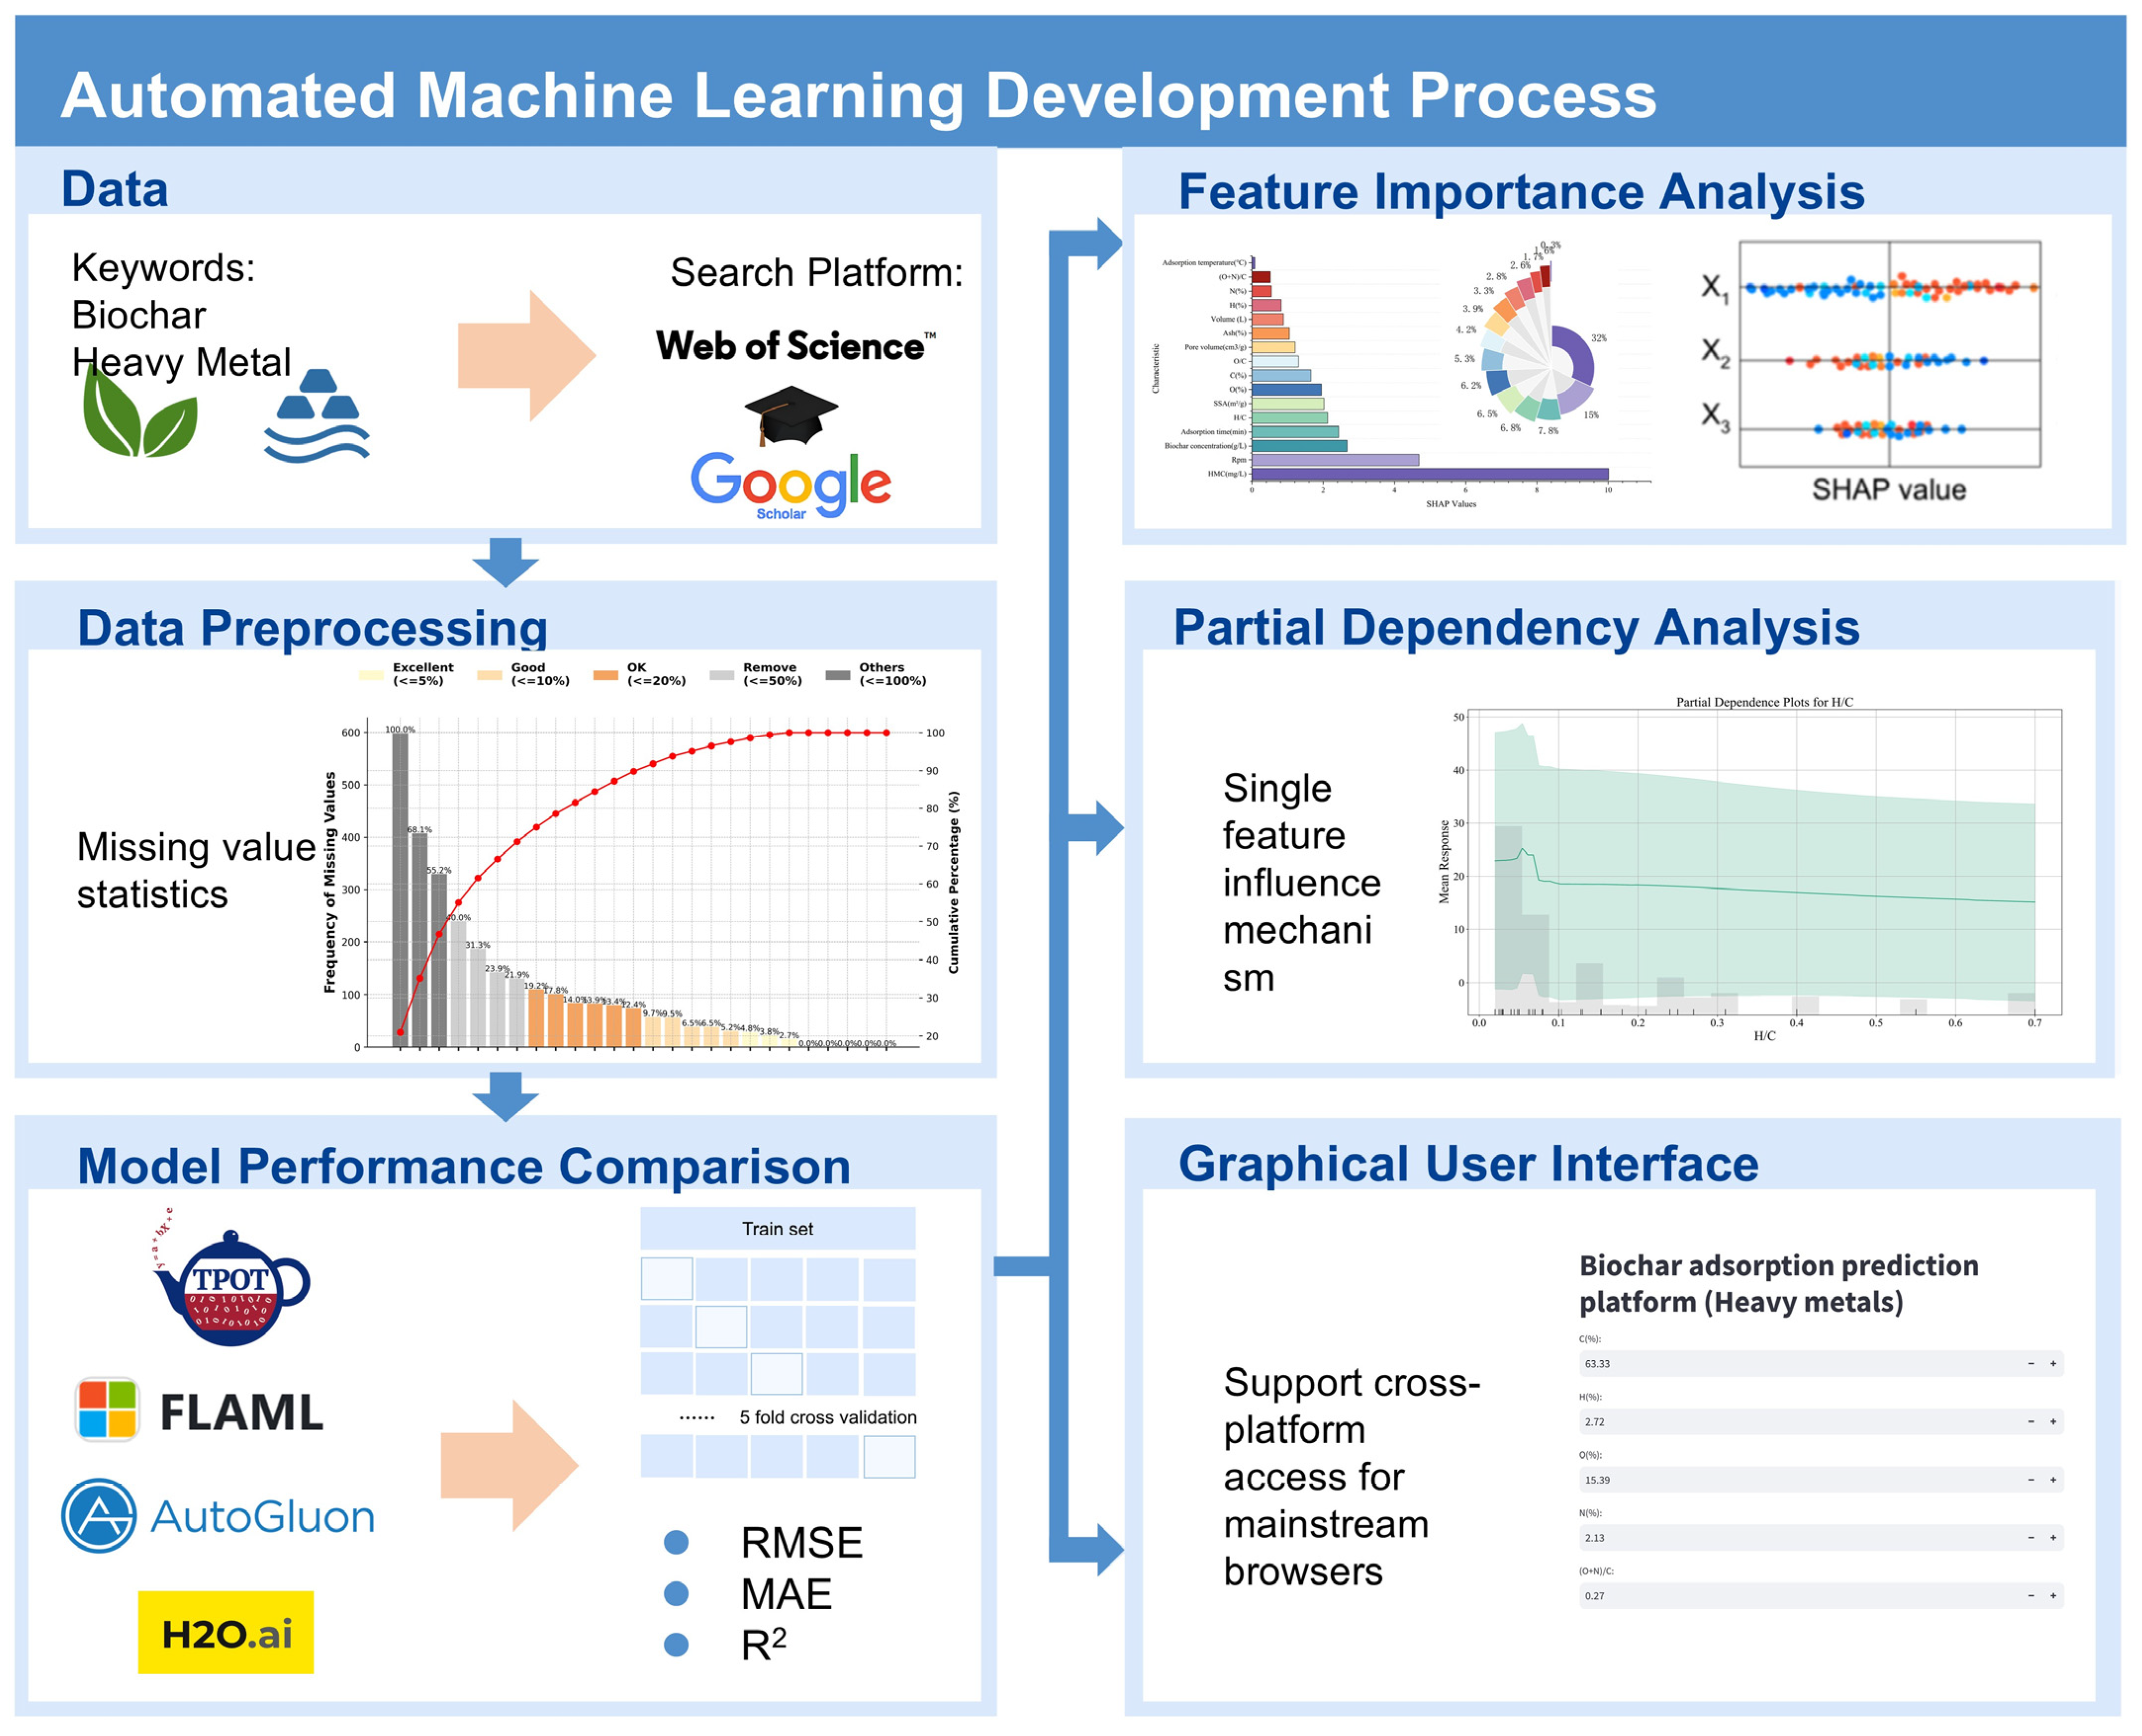
2. Method
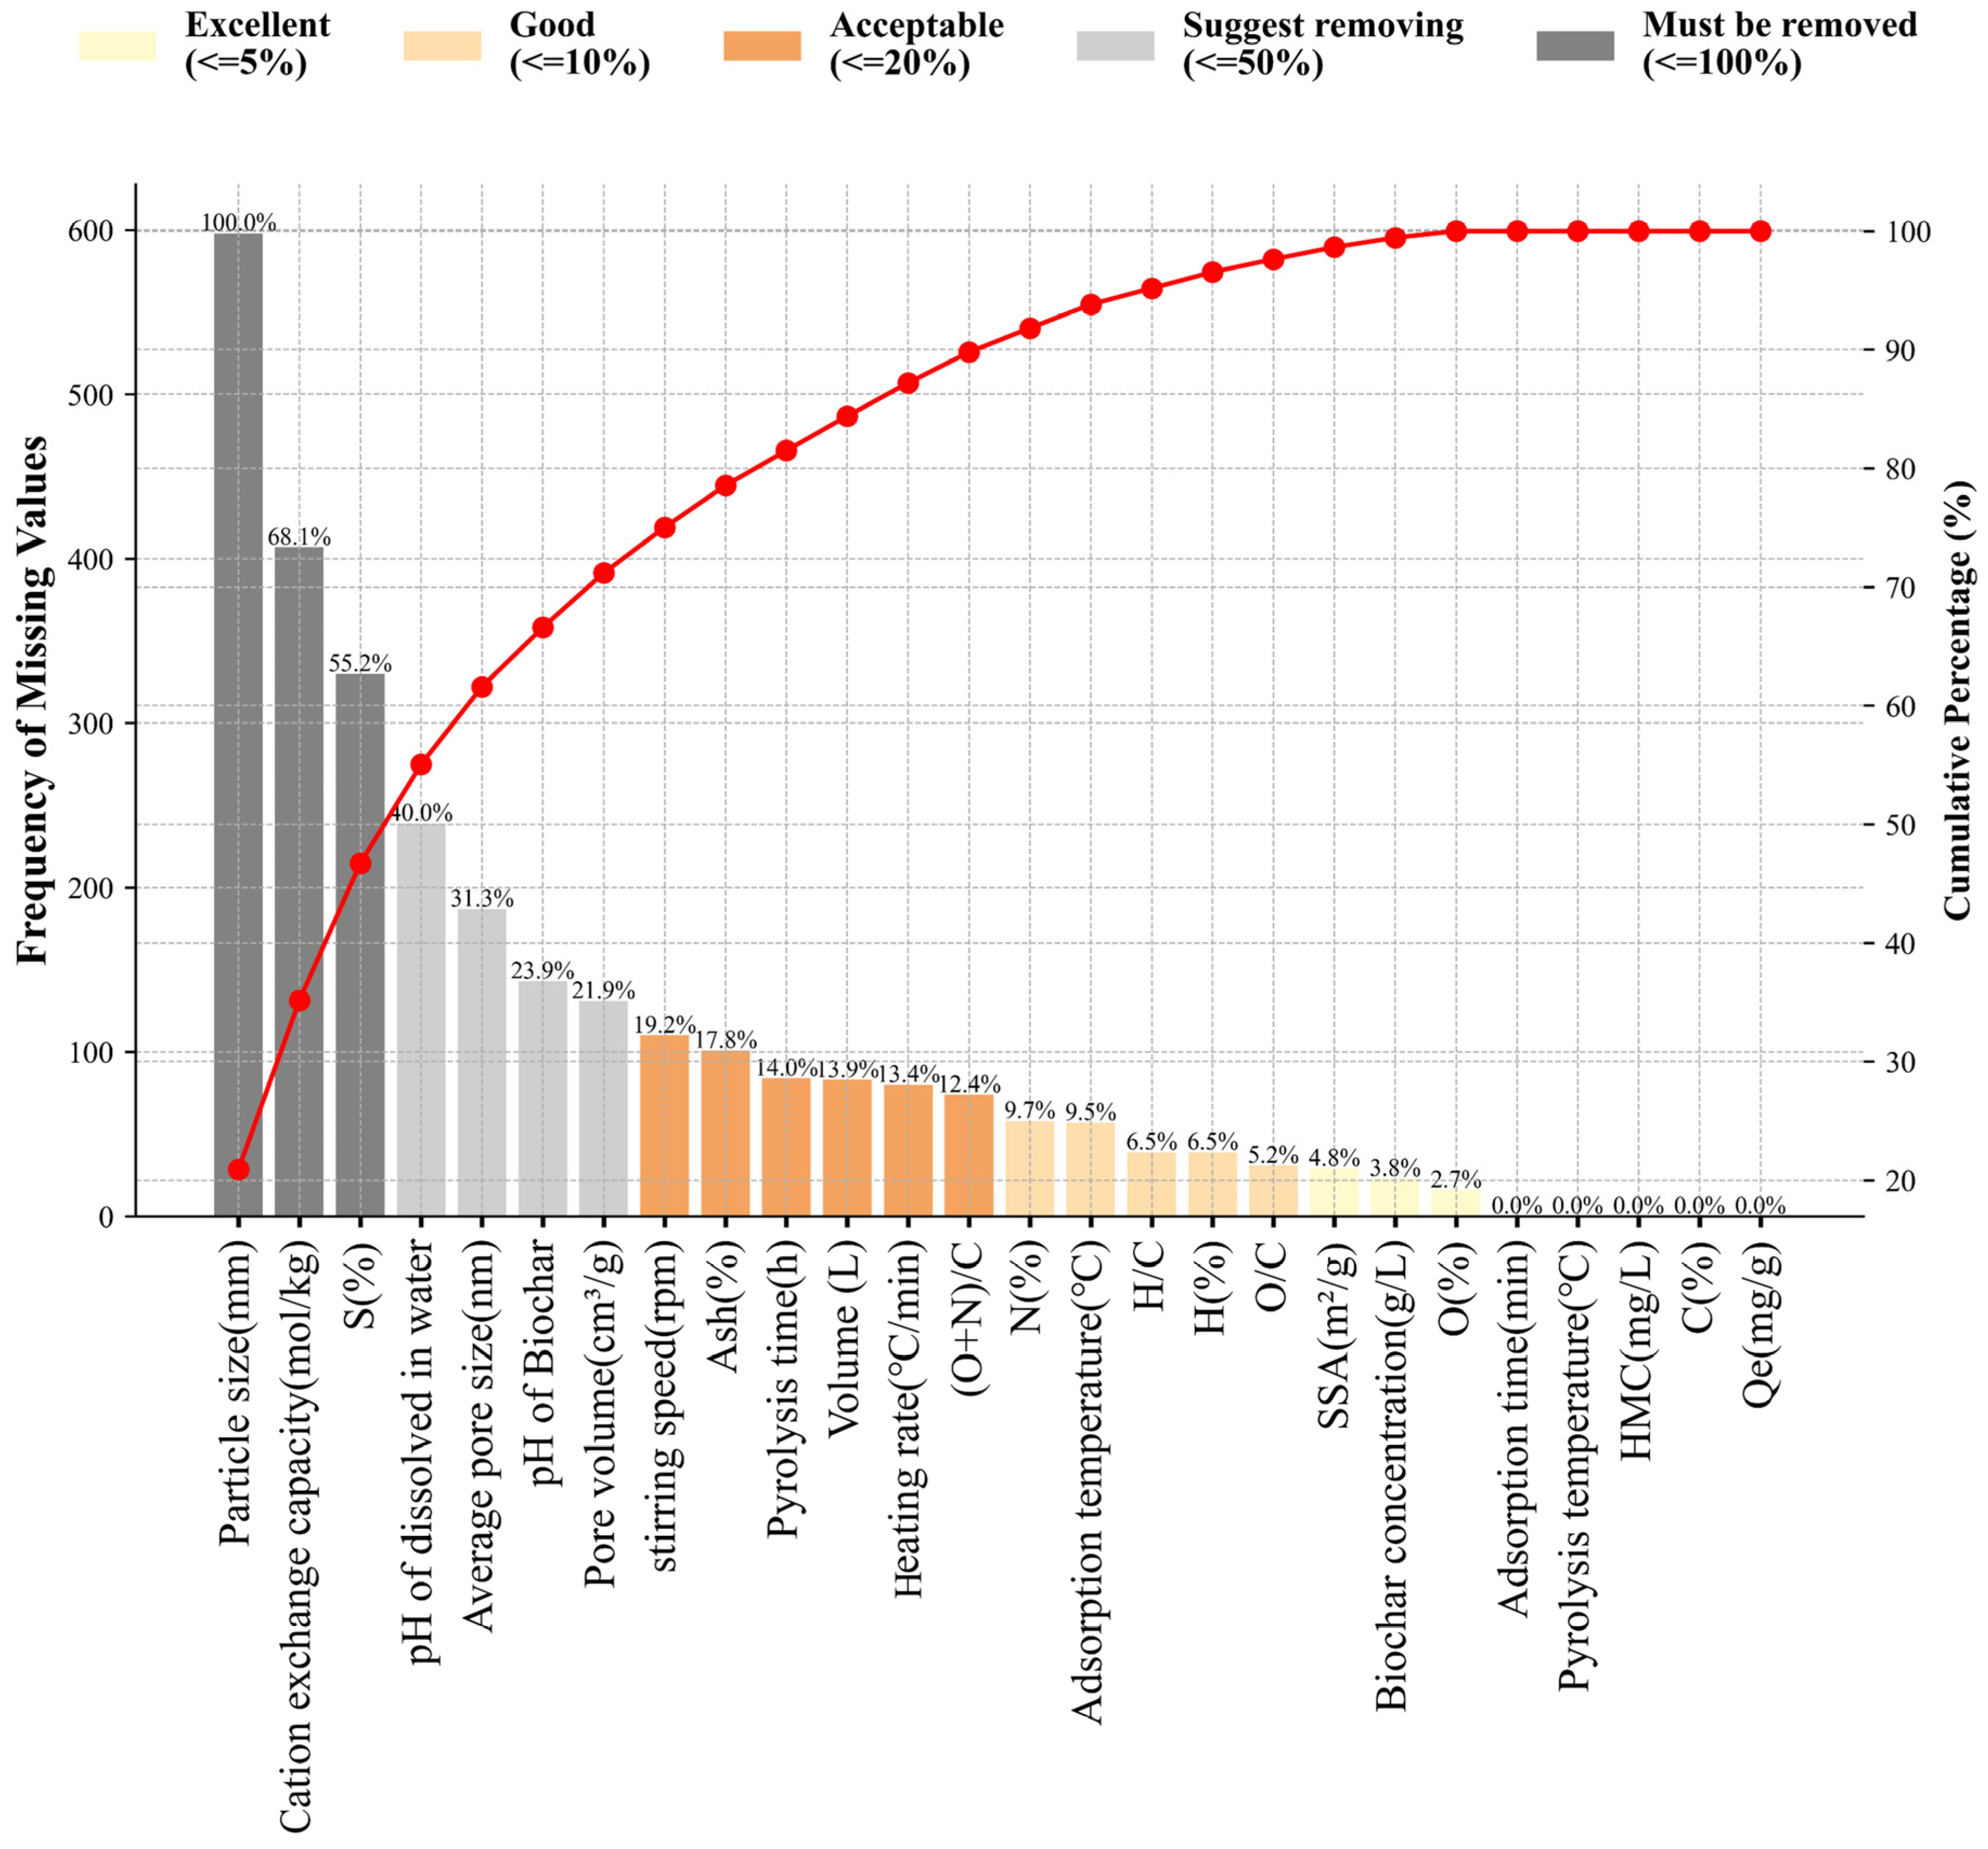
2.1. Data Collection and Preprocessing
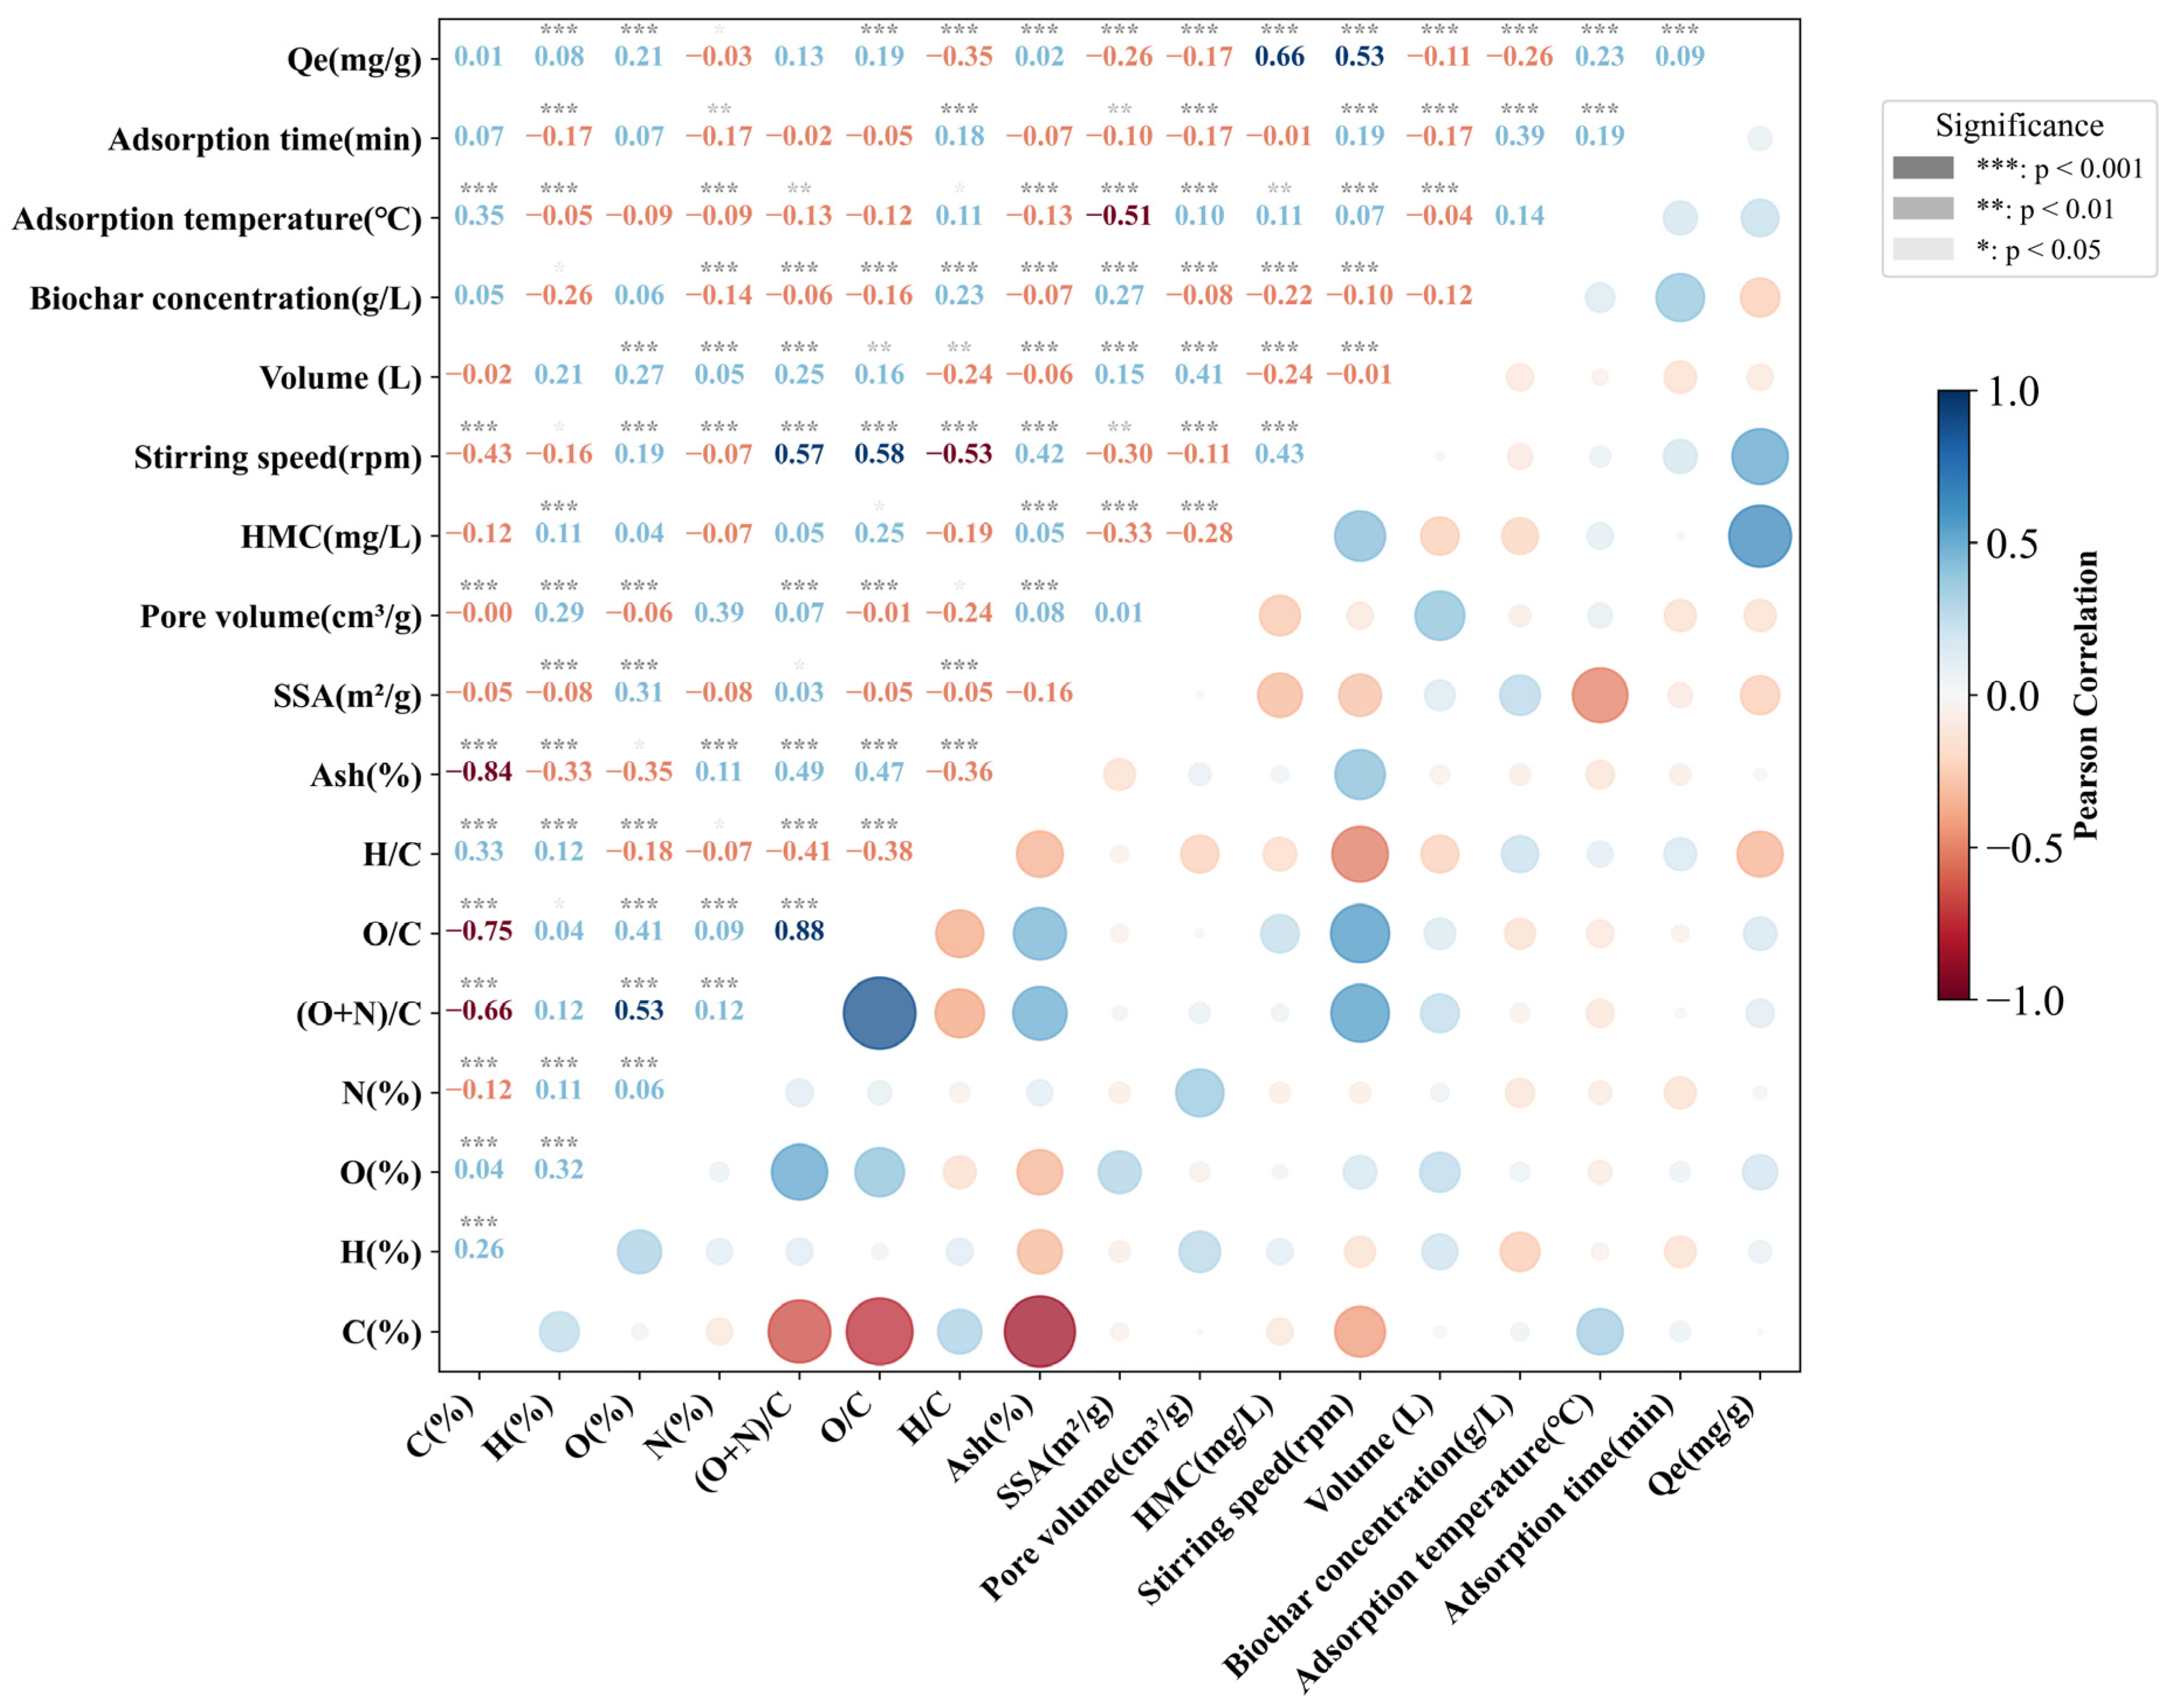
2.2. Correlation Coefficient Analysis
2.3. Implementation of AutoML
2.3.1. TPOT
2.3.2. FLAML
2.3.3. AutoGluon
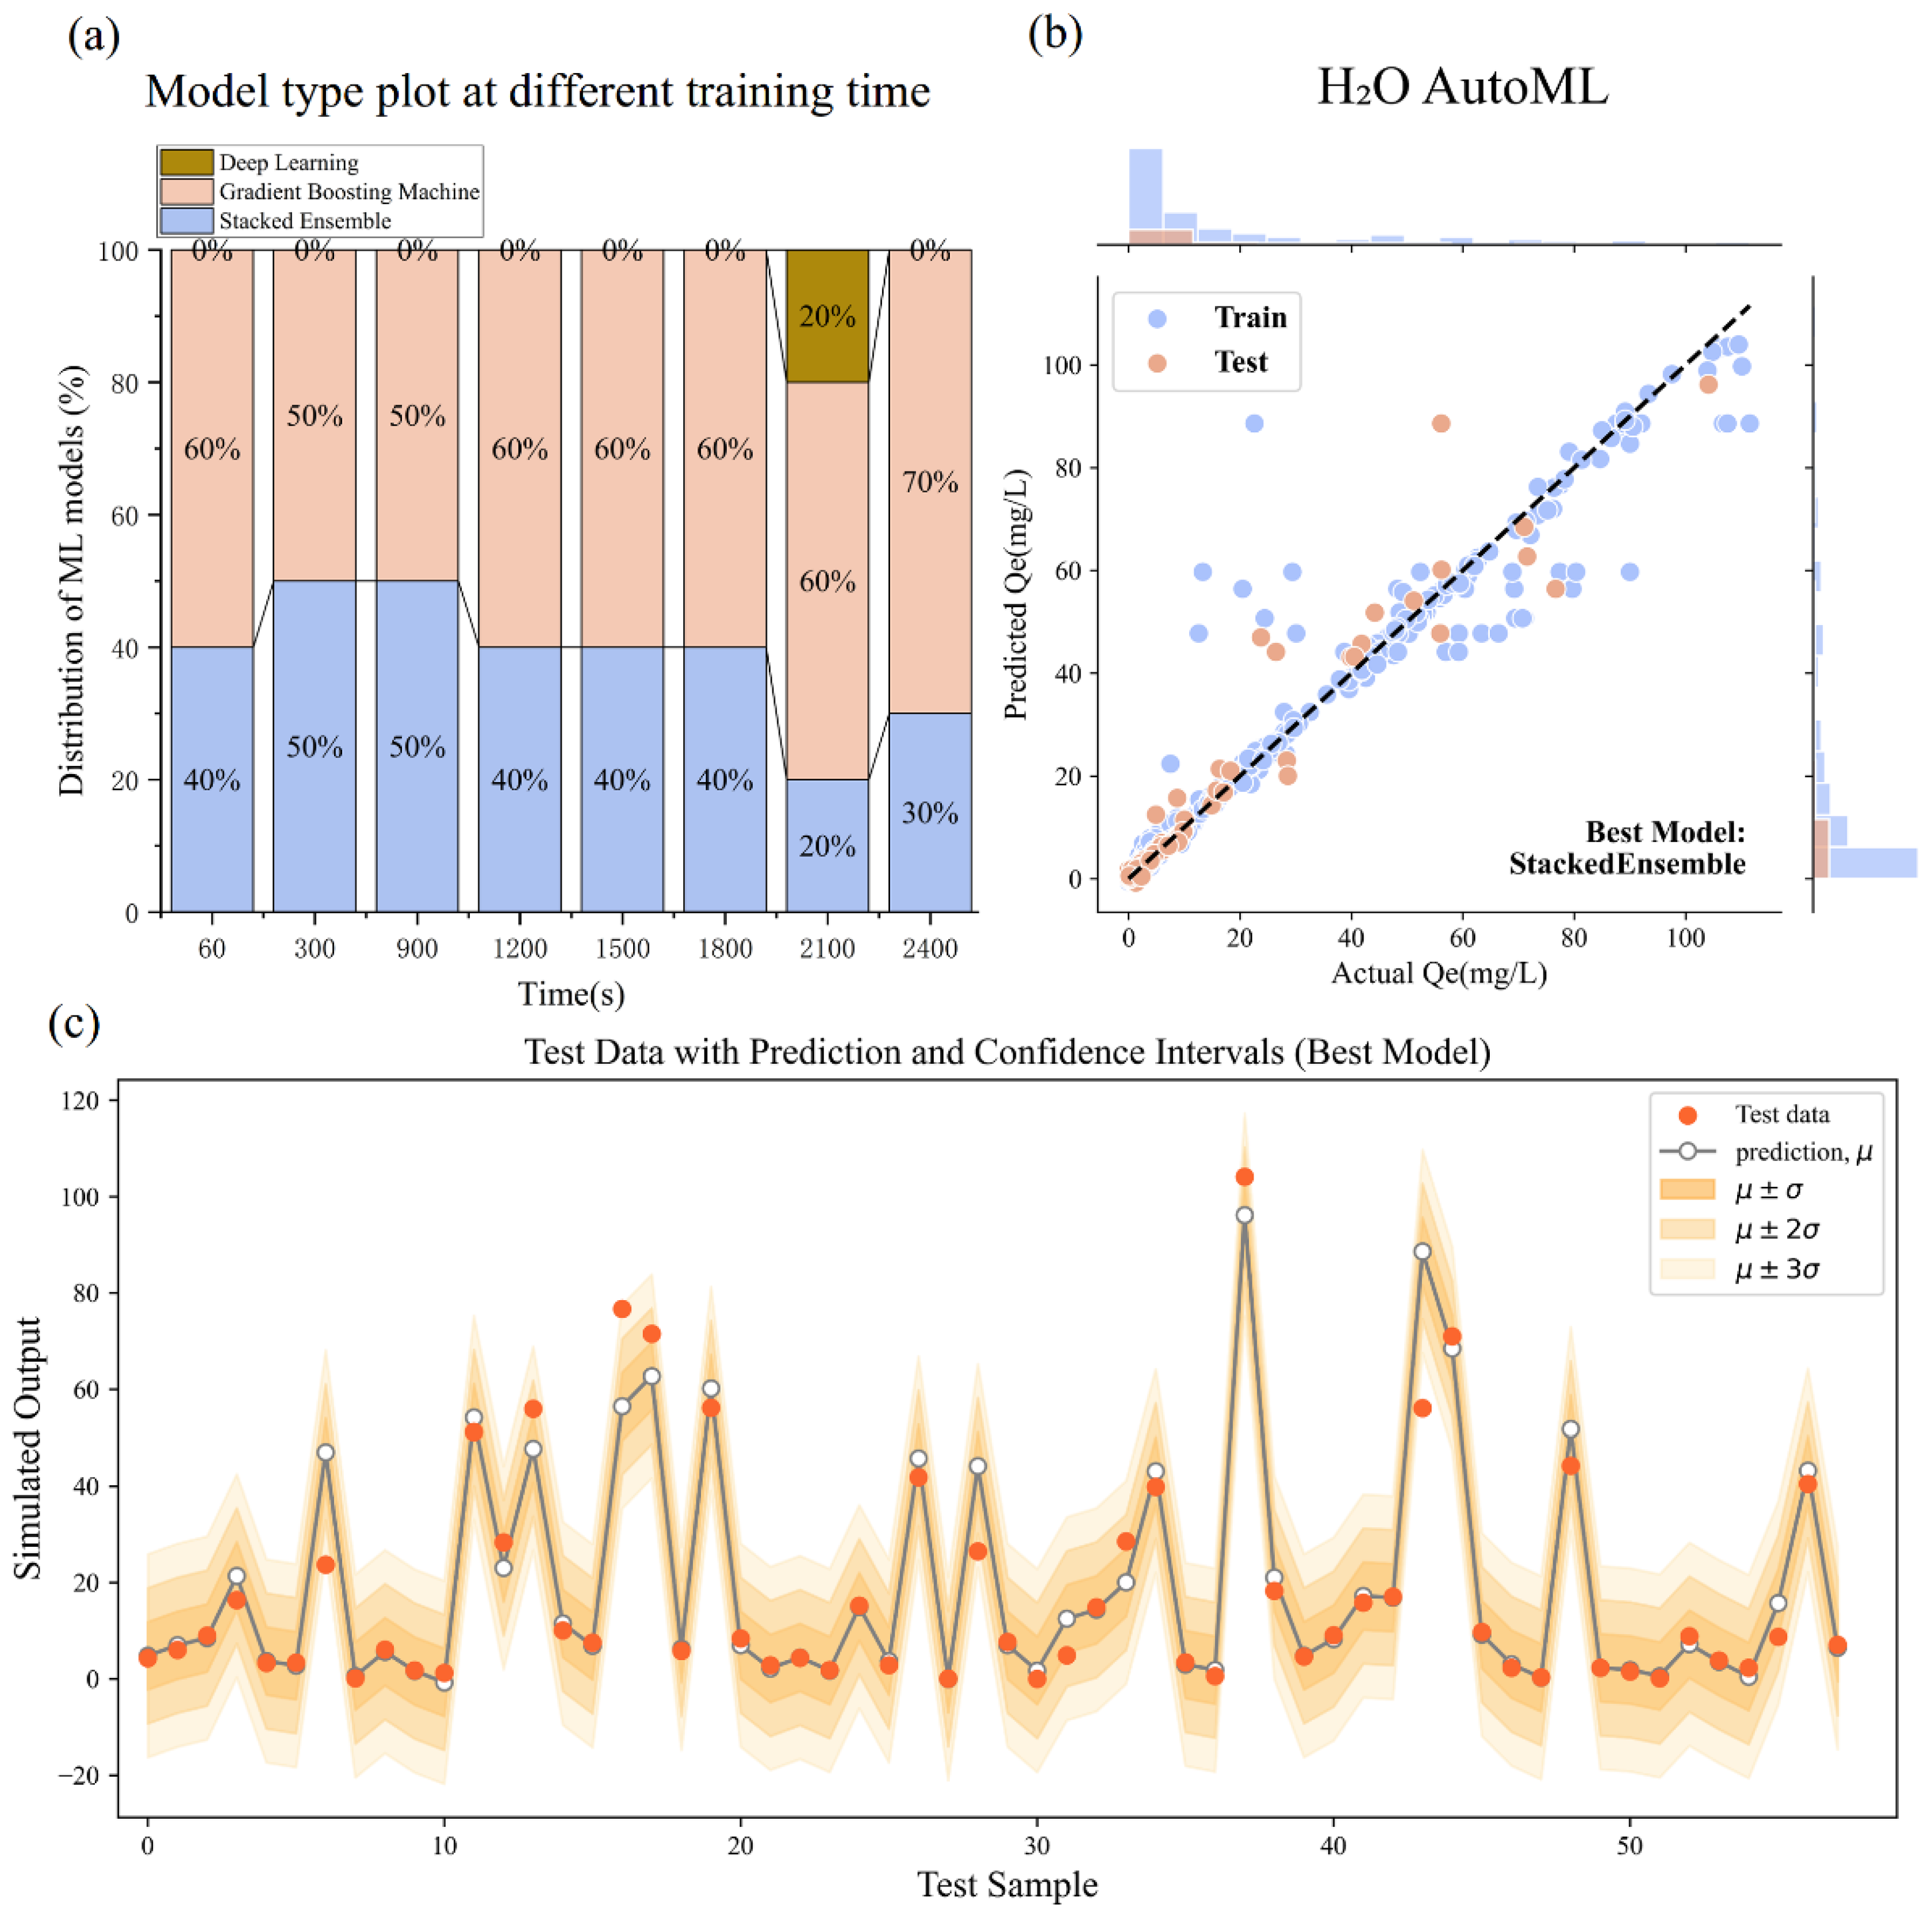
2.3.4. H2O AutoML
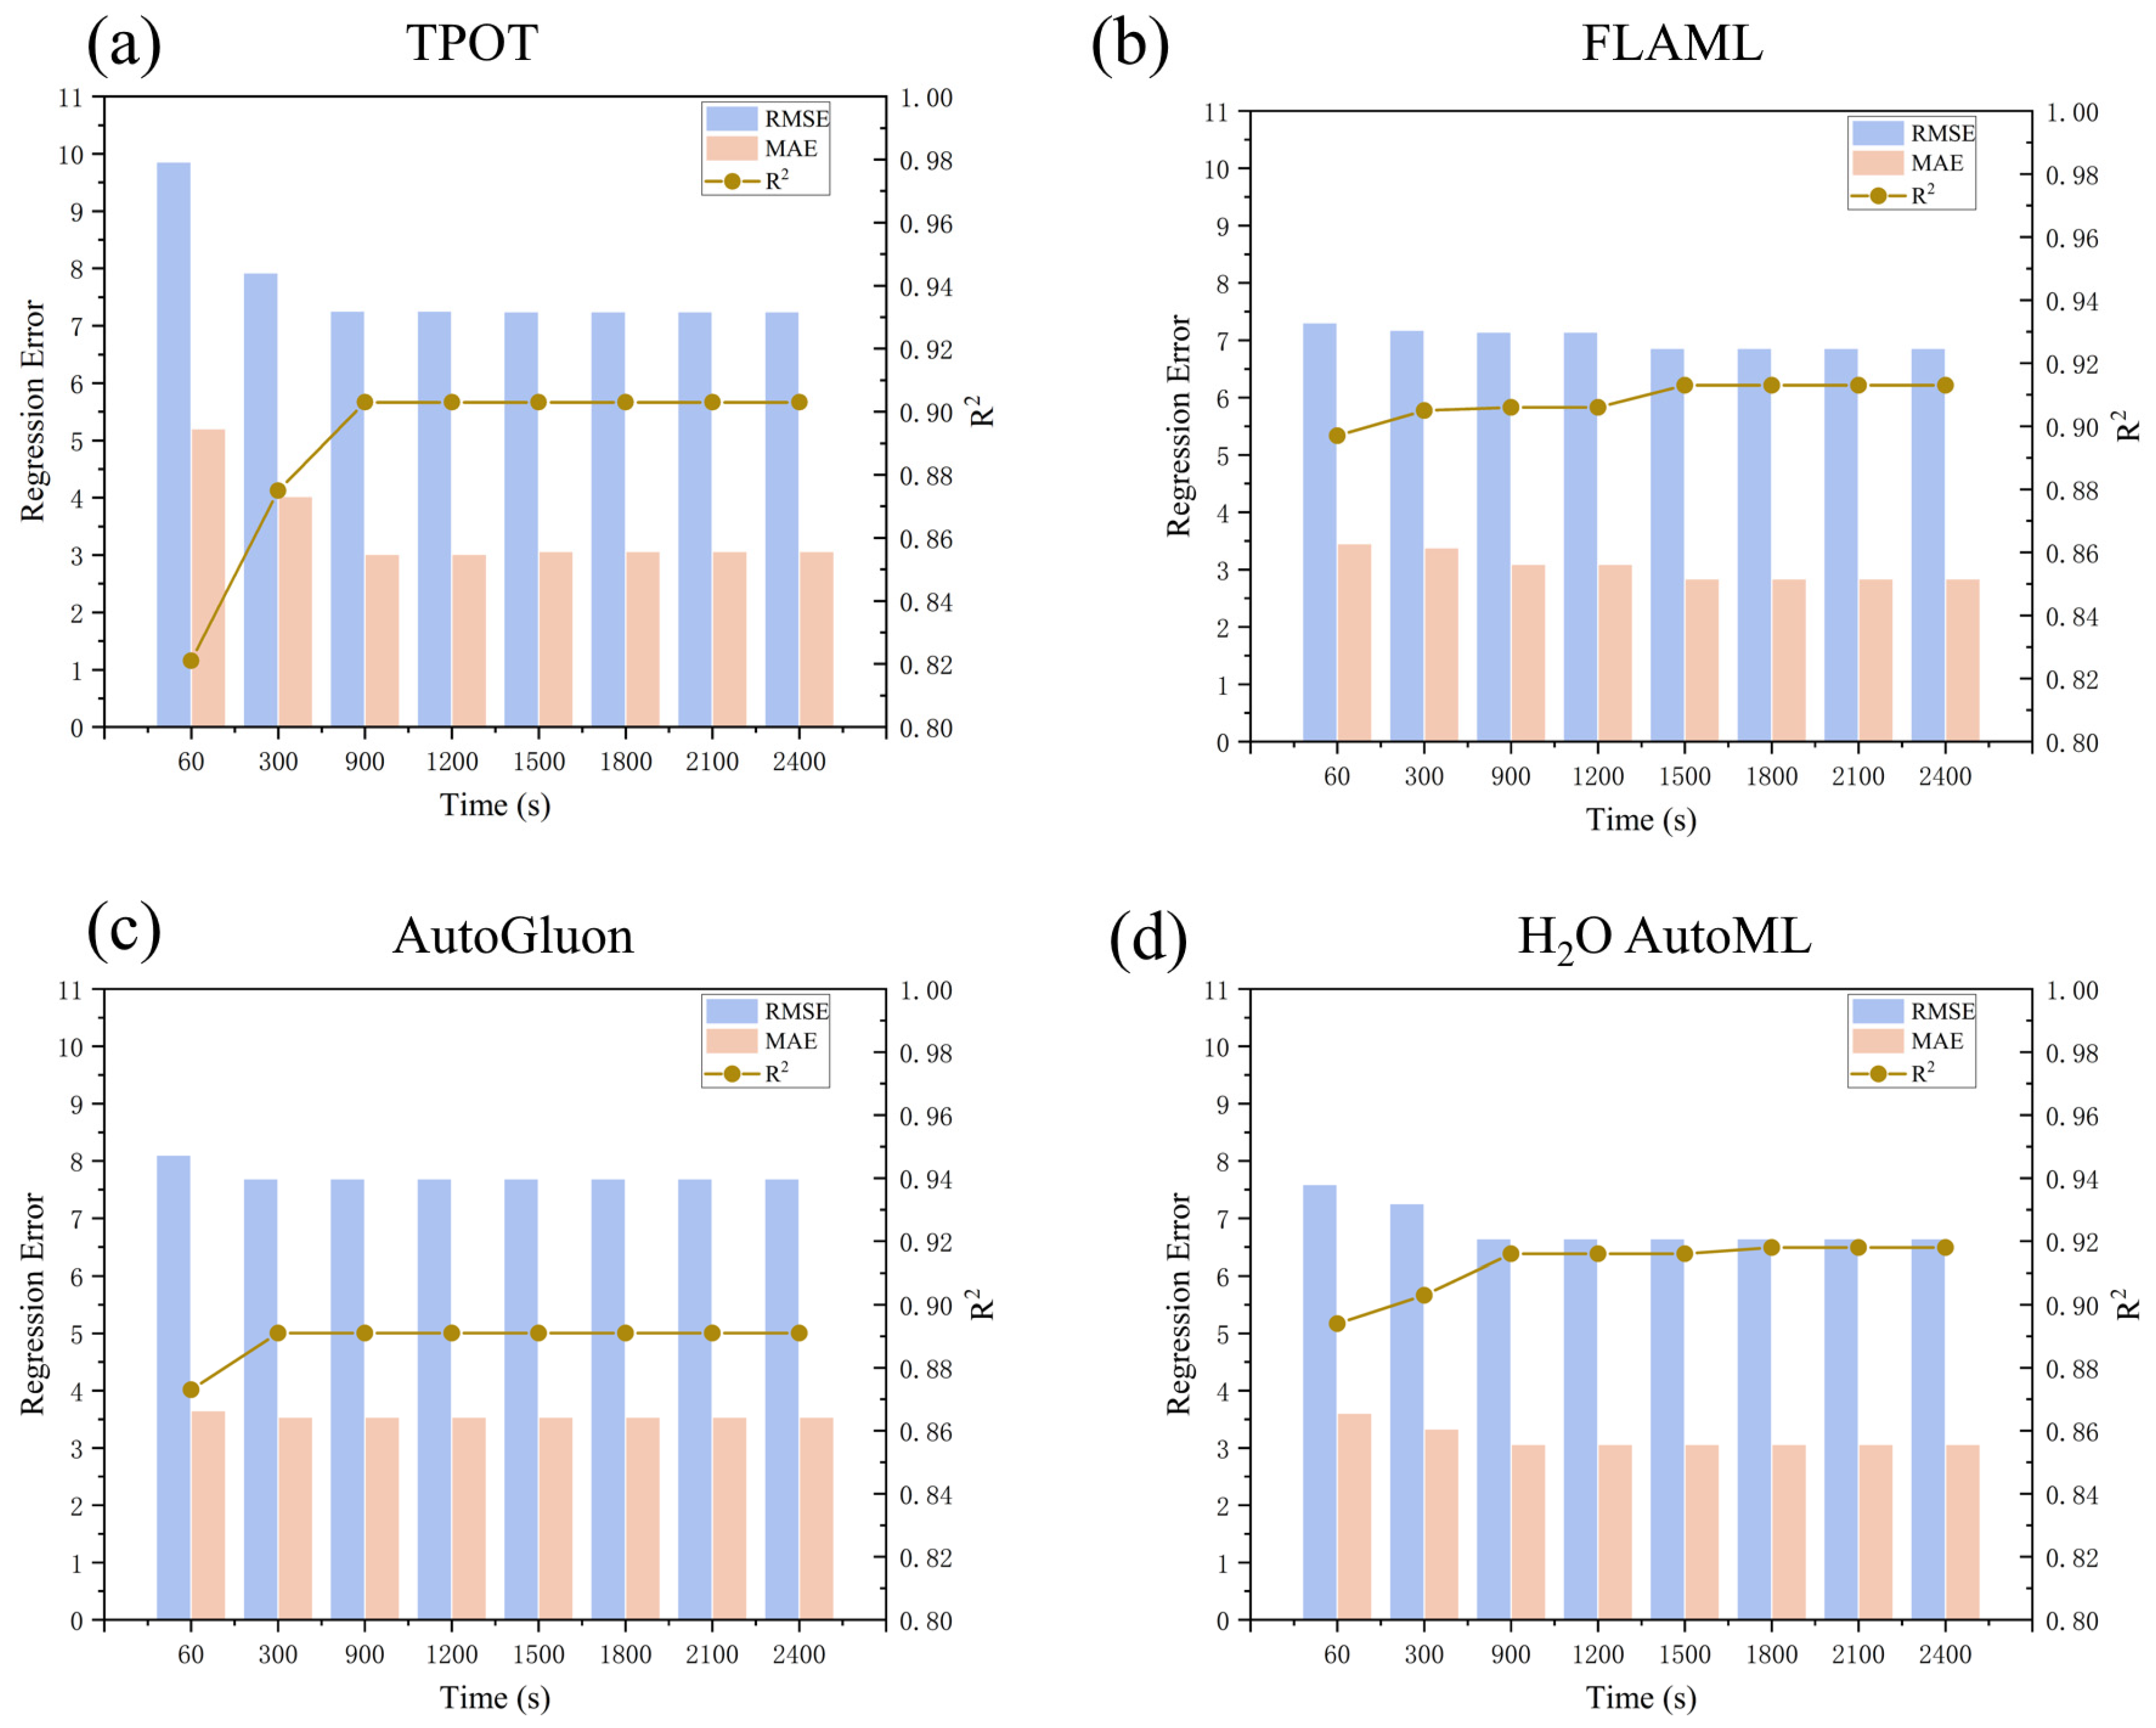
2.4. Evaluation of the AutoML
2.5. Interpretability Analysis
2.6. Graphical User Interface
3. Result
3.1. Data Visualization and Statistical Analysis
3.2. Model Performance Comparison
3.3. Feature Importance Analysis
3.4. Partial Dependency Analysis of Input Features
3.5. Optimization Design of Preparation Conditions
3.6. Graphic User Interface and Data Validation
4. Discussion
5. Conclusions
Supplementary Materials
Author Contributions
Funding
Data Availability Statement
Conflicts of Interest
Abbreviations
| Abbreviation | Full Name |
| AutoML | Automated Machine Learning |
| C | Carbon |
| Cd | Cadmium |
| CEC | Cation Exchange Capacity |
| ETMSE | ExtraTreesMSE |
| FLAML | Fast and Lightweight Automated Machine Learning |
| GBM | Gradient Boosting Machines |
| GLM | Generalized Linear Models |
| GUI | Graphical User Interface |
| H | Hydrogen |
| H/C | Hydrogen/Carbon Ratio |
| HMC | Initial Cd Concentration in the Solution |
| KNDist | KNeighborsDist |
| KNUnif | KNeighborsUnif |
| MAE | Mean Absolute Error |
| ML | Machine Learning |
| N | Nitrogen |
| NNTorch | NeuralNetTorch |
| O | Oxygen |
| (O+N)/C | (Oxygen + Nitrogen)/Carbon ratio |
| O/C | Oxygen/Carbon ratio |
| PDA | Partial Dependence Analysis |
| PDP | Partial Dependence Plot |
| pHpzc | Biochar pH Value |
| Qe | Adsorption Capacity |
| R2 | Coefficient of Determination |
| RF | Random Forest |
| RFMSE | RandomForestMSE |
| RMSE | Root Mean Squared Error |
| S | Sulfur |
| SCC | Spearman’s Rank Correlation Coefficient |
| SHAP | SHapley Additive exPlanation |
| SSA | Specific Surface Area |
| TPOT | Tree-based Pipeline Optimization Tool |
| WE_L2 | WeightedEnsemble_L2 |
References
- Xie, K.; Ou, J.; He, M.; Peng, W.; Yuan, Y. Predicting the Bioaccessibility of Soil Cd, Pb, and As with Advanced Machine Learning for Continental-Scale Soil Environmental Criteria Determination in China. Environ. Health 2024, 2, 631–641. [Google Scholar] [CrossRef]
- Liu, C.; Zhang, H.-X. Modified-Biochar Adsorbents (MBAs) for Heavy-Metal Ions Adsorption: A Critical Review. J. Environ. Chem. Eng. 2022, 10, 107393. [Google Scholar] [CrossRef]
- Du, Z.; Sun, X.; Zheng, S.; Wang, S.; Wu, L.; An, Y.; Luo, Y. Optimal Biochar Selection for Cadmium Pollution Remediation in Chinese Agricultural Soils via Optimized Machine Learning. J. Hazard. Mater. 2024, 476, 135065. [Google Scholar] [CrossRef]
- Wang, R.; Chen, H.; He, Z.; Zhang, S.; Wang, K.; Ren, N.; Ho, S.-H. Discovery of an End-to-End Pattern for Contaminant-Oriented Advanced Oxidation Processes Catalyzed by Biochar with Explainable Machine Learning. Environ. Sci. 2024, 58, 16867–16876. [Google Scholar] [CrossRef] [PubMed]
- Kwiatkowski, M.; Kalderis, D. A Complementary Analysis of the Porous Structure of Biochars Obtained from Biomass. Carbon Lett. 2020, 30, 325–329. [Google Scholar] [CrossRef]
- Qiu, B.; Tao, X.; Wang, H.; Li, W.; Ding, X.; Chu, H. Biochar as a Low-Cost Adsorbent for Aqueous Heavy Metal Removal: A Review. J. Anal. Appl. Pyrolysis 2021, 155, 105081. [Google Scholar] [CrossRef]
- Singh, V.; Pant, N.; Sharma, R.K.; Padalia, D.; Rawat, P.S.; Goswami, R.; Singh, P.; Kumar, A.; Bhandari, P.; Tabish, A.; et al. Adsorption Studies of Pb(II) and Cd(II) Heavy Metal Ions from Aqueous Solutions Using a Magnetic Biochar Composite Material. Separations 2023, 10, 389. [Google Scholar] [CrossRef]
- Moon, S.; Lee, Y.-J.; Choi, M.-Y.; Lee, C.-G.; Park, S.-J. Adsorption of Heavy Metals and Bisphenol A from Wastewater Using Spirulina Sp.-Based Biochar as an Effective Adsorbent: A Preliminary Study. J. Appl. Phycol. 2023, 35, 2257–2269. [Google Scholar] [CrossRef]
- Nguyen, X.C.; Nguyen, T.T.H.; Le, Q.V.; Le, P.C.; Srivastav, A.L.; Pham, Q.B.; Nguyen, P.M.; La, D.D.; Rene, E.R.; Ngo, H.H.; et al. Developing a New Approach for Design Support of Subsurface Constructed Wetland Using Machine Learning Algorithms. J. Environ. Manag. 2022, 301, 113868. [Google Scholar] [CrossRef] [PubMed]
- Hu, A.; Liu, Y.; Wang, X.; Xia, S.; Van Der Bruggen, B. A Machine Learning Based Framework to Tailor Properties of Nanofiltration and Reverse Osmosis Membranes for Targeted Removal of Organic Micropollutants. Water Res. 2025, 268, 122677. [Google Scholar] [CrossRef] [PubMed]
- Kandpal, S.; Tagade, A.; Sawarkar, A.N. Critical Insights into Ensemble Learning with Decision Trees for the Prediction of Biochar Yield and Higher Heating Value from Pyrolysis of Biomass. Bioresour. Technol. 2024, 411, 131321. [Google Scholar] [CrossRef] [PubMed]
- Jaffari, Z.H.; Abbas, A.; Kim, C.-M.; Shin, J.; Kwak, J.; Son, C.; Lee, Y.-G.; Kim, S.; Chon, K.; Cho, K.H. Transformer-Based Deep Learning Models for Adsorption Capacity Prediction of Heavy Metal Ions toward Biochar-Based Adsorbents. J. Hazard. Mater. 2024, 462, 132773. [Google Scholar] [CrossRef] [PubMed]
- Bennett, N.D.; Croke, B.F.W.; Guariso, G.; Guillaume, J.H.A.; Hamilton, S.H.; Jakeman, A.J.; Marsili-Libelli, S.; Newham, L.T.H.; Norton, J.P.; Perrin, C.; et al. Characterising Performance of Environmental Models. Environ. Model. Softw. 2013, 40, 1–20. [Google Scholar] [CrossRef]
- Zhang, C.; Tian, X.; Zhao, Y.; Lu, J. Automated Machine Learning-Based Building Energy Load Prediction Method. J. Build. Eng. 2023, 80, 108071. [Google Scholar] [CrossRef]
- Xu, R.-Z.; Cao, J.-S.; Ye, T.; Wang, S.-N.; Luo, J.-Y.; Ni, B.-J.; Fang, F. Automated Machine Learning-Based Prediction of Microplastics Induced Impacts on Methane Production in Anaerobic Digestion. Water Res. 2022, 223, 118975. [Google Scholar] [CrossRef]
- Bao, H.; Yin, W.; Wang, H.; Lu, Y.; Jiang, S.; Ajibade, F.O.; Ouyang, Q.; Wang, Y.; Nie, S.; Bai, Y.; et al. Automated Machine Learning-Based Models for Predicting and Evaluating Antibiotic Removal in Constructed Wetlands. Bioresour. Technol. 2023, 385, 129436. [Google Scholar] [CrossRef]
- Mészároš, L.; Šuránek, M.; Melichová, Z.; Frišták, V.; Ďuriška, L.; Kaňuchová, M.; Soja, G.; Pipíška, M. Green Biochar-Based Adsorbent for Radiocesium and Cu, Ni, and Pb Removal. J. Radioanal. Nucl. Chem. 2023, 332, 4141–4155. [Google Scholar] [CrossRef]
- Ren, X.; Xu, Y.; Yang, S.; Chen, Q.; Wei, T. Phosphorous-Functionalized Wheat Straw Biochar for the Efficient Removal of Cadmium and Lead in Aqueous Solution. Water. Air. Soil Pollut. 2023, 234, 555. [Google Scholar] [CrossRef]
- Jiang, J.; Xiang, X.; Zhou, Q.; Zhou, L.; Bi, X.; Khanal, S.K.; Wang, Z.; Chen, G.; Guo, G. Optimization of a Novel Engineered Ecosystem Integrating Carbon, Nitrogen, Phosphorus, and Sulfur Biotransformation for Saline Wastewater Treatment Using an Interpretable Machine Learning Approach. Environ. Sci. Technol. 2024, 58, 12989–12999. [Google Scholar] [CrossRef]
- Liu, B.; Xi, F.; Zhang, H.; Peng, J.; Sun, L.; Zhu, X. Coupling Machine Learning and Theoretical Models to Compare Key Properties of Biochar in Adsorption Kinetics Rate and Maximum Adsorption Capacity for Emerging Contaminants. Bioresour. Technol. 2024, 402, 130776. [Google Scholar] [CrossRef]
- Tian, Y.; Yang, X.; Chen, N.; Li, C.; Yang, W. Data-Driven Interpretable Analysis for Polysaccharide Yield Prediction. Environ. Sci. Ecotechnol. 2024, 19, 100321. [Google Scholar] [CrossRef]
- Wang, X.; Gao, Y.; Hou, J.; Yang, J.; Smits, K.; He, H. Machine Learning Facilitates Connections between Soil Thermal Conductivity, Soil Water Content, and Soil Matric Potential. J. Hydrol. 2024, 633, 130950. [Google Scholar] [CrossRef]
- Hu, J.; Xu, J.; Li, M.; Jiang, Z.; Mao, J.; Feng, L.; Miao, K.; Li, H.; Chen, J.; Bai, Z.; et al. Identification and Validation of an Explainable Prediction Model of Acute Kidney Injury with Prognostic Implications in Critically Ill Children: A Prospective Multicenter Cohort Study. eClinicalMedicine 2024, 68, 102409. [Google Scholar] [CrossRef]
- Fu, W.; Feng, M.; Guo, C.; Zhou, J.; Zhang, X.; Lv, S.; Huo, Y.; Wang, F. Machine Learning-Driven Prediction of Phosphorus Removal Performance of Metal-Modified Biochar and Optimization of Preparation Processes Considering Water Quality Management Objectives. Bioresour. Technol. 2024, 403, 130861. [Google Scholar] [CrossRef]
- Jas, K.; Mangalathu, S.; Dodagoudar, G.R. Evaluation and Analysis of Liquefaction Potential of Gravelly Soils Using Explainable Probabilistic Machine Learning Model. Comput. Geotech. 2024, 167, 106051. [Google Scholar] [CrossRef]
- Erickson, N.; Mueller, J.; Shirkov, A.; Zhang, H.; Larroy, P.; Li, M.; Smola, A. AutoGluon-Tabular: Robust and Accurate AutoML for Structured Data. arXiv 2020, arXiv:2003.06505. [Google Scholar]
- Angarita-Zapata, J.S.; Maestre-Gongora, G.; Calderín, J.F. A Bibliometric Analysis and Benchmark of Machine Learning and AutoML in Crash Severity Prediction: The Case Study of Three Colombian Cities. Sensors 2021, 21, 8401. [Google Scholar] [CrossRef] [PubMed]
- Ferreira, L.; Pilastri, A.; Martins, C.M.; Pires, P.M.; Cortez, P. A Comparison of AutoML Tools for Machine Learning, Deep Learning and XGBoost. In Proceedings of the 2021 International Joint Conference on Neural Networks (IJCNN), Virtual, 18–22 July 2021; pp. 1–8. [Google Scholar]
- Chen, H.; Cao, X.; Wang, J.; Huang, J.; Wang, Z.; Wei, J.; Zhao, D.; Guo, Y.; Peng, Y.; Miao, L. Machine Learning Accelerating the Condition Screening of Ceftriaxone Sodium Anaerobic Co-Metabolic Degradation. ACS EST Eng. 2024, 4, 947–955. [Google Scholar] [CrossRef]
- Rudin, C. Stop Explaining Black Box Machine Learning Models for High Stakes Decisions and Use Interpretable Models Instead. Nat. Mach. Intell. 2019, 1, 206–215. [Google Scholar] [CrossRef]
- Lundberg, S.M.; Erion, G.; Chen, H.; DeGrave, A.; Prutkin, J.M.; Nair, B.; Katz, R.; Himmelfarb, J.; Bansal, N.; Lee, S.-I. From Local Explanations to Global Understanding with Explainable AI for Trees. Nat. Mach. Intell. 2020, 2, 56–67. [Google Scholar] [CrossRef] [PubMed]
- Cui, Z.; Ke, R.; Pu, Z.; Ma, X.; Wang, Y. Learning Traffic as a Graph: A Gated Graph Wavelet Recurrent Neural Network for Network-Scale Traffic Prediction. Transp. Res. Part C Emerg. Technol. 2020, 115, 102620. [Google Scholar] [CrossRef]
- Tan, X.; Liu, Y.; Zeng, G.; Wang, X.; Hu, X.; Gu, Y.; Yang, Z. Application of Biochar for the Removal of Pollutants from Aqueous Solutions. Chemosphere 2015, 125, 70–85. [Google Scholar] [CrossRef]
- Ucun Özel, H.; Gemici, B.; Özel, H.; Berberler, E. Evaluating Forest Waste on Adsorptionof Cd(II) from Aqueous Solution: Equilibriumand Thermodynamic Studies. Pol. J. Environ. Stud. 2019, 28, 3829–3836. [Google Scholar] [CrossRef]
- Keiluweit, M.; Nico, P.S.; Johnson, M.G.; Kleber, M. Dynamic Molecular Structure of Plant Biomass-Derived Black Carbon (Biochar). Environ. Sci. Technol. 2010, 44, 1247–1253. [Google Scholar] [CrossRef]
- Tong, X.; Li, J.; Yuan, J.; Xu, R. Adsorption of Cu(II) by Biochars Generated from Three Crop Straws. Chem. Eng. J. 2011, 172, 828–834. [Google Scholar] [CrossRef]
- Wang, B.; Gao, B.; Fang, J. Recent Advances in Engineered Biochar Productions and Applications. Crit. Rev. Environ. Sci. Technol. 2017, 47, 2158–2207. [Google Scholar] [CrossRef]
- Inyang, M.I.; Gao, B.; Yao, Y.; Xue, Y.; Zimmerman, A.; Mosa, A.; Pullammanappallil, P.; Ok, Y.S.; Cao, X. A Review of Biochar as a Low-Cost Adsorbent for Aqueous Heavy Metal Removal. Crit. Rev. Environ. Sci. Technol. 2016, 46, 406–433. [Google Scholar] [CrossRef]
- Hong, S.M.; Morgan, B.J.; Stocker, M.D.; Smith, J.E.; Kim, M.S.; Cho, K.H.; Pachepsky, Y.A. Using Machine Learning Models to Estimate Escherichia Coli Concentration in an Irrigation Pond from Water Quality and Drone-Based RGB Imagery Data. Water Res. 2024, 260, 121861. [Google Scholar] [CrossRef]
- Xiang, J.; Lin, Q.; Cheng, S.; Guo, J.; Yao, X.; Liu, Q.; Yin, G.; Liu, D. Enhanced Adsorption of Cd(II) from Aqueous Solution by a Magnesium Oxide–Rice Husk Biochar Composite. Environ. Sci. Pollut. Res. 2018, 25, 14032–14042. [Google Scholar] [CrossRef]
- Zhang, J.; Liu, H.; Wu, J.; Chen, C.; Ding, Y.; Liu, H.; Zhou, Y. Rethinking the Biochar Impact on the Anaerobic Digestion of Food Waste in Bench-Scale Digester: Spatial Distribution and Biogas Production. Bioresour. Technol. 2025, 420, 132115. [Google Scholar] [CrossRef]
- Wang, X.; Zhou, W.; Liang, G.; Song, D.; Zhang, X. Characteristics of Maize Biochar with Different Pyrolysis Temperatures and Its Effects on Organic Carbon, Nitrogen and Enzymatic Activities after Addition to Fluvo-Aquic Soil. Sci. Total Environ. 2015, 538, 137–144. [Google Scholar] [CrossRef]
- Rombolà, A.G.; Fabbri, D.; Meredith, W.; Snape, C.E.; Dieguez-Alonso, A. Molecular Characterization of the Thermally Labile Fraction of Biochar by Hydropyrolysis and Pyrolysis-GC/MS. J. Anal. Appl. Pyrolysis 2016, 121, 230–239. [Google Scholar] [CrossRef]
- Fan, J.; Li, Y.; Yu, H.; Li, Y.; Yuan, Q.; Xiao, H.; Li, F.; Pan, B. Using Sewage Sludge with High Ash Content for Biochar Production and Cu(II) Sorption. Sci. Total Environ. 2020, 713, 136663. [Google Scholar] [CrossRef]
- Qu, J.; Meng, Q.; Peng, W.; Shi, J.; Dong, Z.; Li, Z.; Hu, Q.; Zhang, G.; Wang, L.; Ma, S.; et al. Application of Functionalized Biochar for Adsorption of Organic Pollutants from Environmental Media: Synthesis Strategies, Removal Mechanisms and Outlook. J. Clean. Prod. 2023, 423, 138690. [Google Scholar] [CrossRef]
- Berslin, D.; Reshmi, A.; Sivaprakash, B.; Rajamohan, N.; Kumar, P.S. Remediation of Emerging Metal Pollutants Using Environment Friendly Biochar-Review on Applications and Mechanism. Chemosphere 2022, 290, 133384. [Google Scholar] [CrossRef]
- Tan, X.-F.; Zhu, S.-S.; Wang, R.-P.; Chen, Y.-D.; Show, P.-L.; Zhang, F.-F.; Ho, S.-H. Role of Biochar Surface Characteristics in the Adsorption of Aromatic Compounds: Pore Structure and Functional Groups. Chin. Chem. Lett. 2021, 32, 2939–2946. [Google Scholar] [CrossRef]
- Zhang, A.; Li, X.; Xing, J.; Xu, G. Adsorption of Potentially Toxic Elements in Water by Modified Biochar: A Review. J. Environ. Chem. Eng. 2020, 8, 104196. [Google Scholar] [CrossRef]
- Tomczyk, A.; Sokołowska, Z.; Boguta, P. Biochar Physicochemical Properties: Pyrolysis Temperature and Feedstock Kind Effects. Rev. Environ. Sci. Biotechnol. 2020, 19, 191–215. [Google Scholar] [CrossRef]
- Kan, T.; Strezov, V.; Evans, T.J. Lignocellulosic Biomass Pyrolysis: A Review of Product Properties and Effects of Pyrolysis Parameters. Renew. Sustain. Energy Rev. 2016, 57, 1126–1140. [Google Scholar] [CrossRef]


| Time (s) | 60 | 300 | 900 | 1200 | 1800 | 2400 |
|---|---|---|---|---|---|---|
| Model Name | WE_L2 | WE_L2 | WE_L2 | WE_L2 | WE_L2 | WE_L2 |
| LGBMXT | LGBMXT | LGBMXT | LGBMXT | LGBMXT | LGBMXT | |
| CatBoost | CatBoost | CatBoost | CatBoost | CatBoost | CatBoost | |
| XGBoost | XGBoost | XGBoost | XGBoost | XGBoost | XGBoost | |
| LGBM | LGBM | LGBM | LGBM | LGBM | LGBM | |
| LGBML | LGBML | LGBML | LGBML | LGBML | LGBML | |
| ETMSE | ETMSE | ETMSE | ETMSE | ETMSE | ETMSE | |
| RFMSE | RFMSE | RFMSE | RFMSE | RFMSE | RFMSE | |
| NNTorch | NNTorch | NNTorch | NNTorch | NNTorch | NNTorch | |
| / | NNFAI | NNFAI | NNFAI | NNFAI | NNFAI | |
| / | KNDist | KNDist | KNDist | KNDist | KNDist | |
| / | KNUnif | KNUnif | KNUnif | KNUnif | KNUnif |
| Model ID | R2 | RMSE | MAE |
|---|---|---|---|
| StackedEnsemble_BestOfFamily_7 | 0.918 | 6.529 | 3.002 |
| GBM_grid_1_AutoML_8_51 | / | 6.646 | 3.060 |
| StackedEnsemble_AllModels_6 | 0.906 | 7.157 | 3.624 |
| GBM_grid_1_AutoML_8_167 | / | 7.061 | 3.241 |
| GBM_grid_1_AutoML_8_122 | / | 7.523 | 3.952 |
| GBM_grid_1_AutoML_8_65 | / | 8.275 | 4.033 |
| GBM_grid_1_AutoML_8_151 | / | 6.223 | 2.746 |
| GBM_grid_1_AutoML_8_70 | / | 7.356 | 3.317 |
| GBM_grid_1_AutoML_8_81 | / | 6.998 | 3.004 |
| StackedEnsemble_BestOfFamily_4 | 0.886 | 7.851 | 4.163 |
| GBM_grid_1_AutoML_8_43 | / | 7.664 | 3.514 |
| StackedEnsemble_BestOfFamily_6 | 0.883 | 7.974 | 4.102 |
| GBM_grid_1_AutoML_8_139 | / | 6.691 | 3.306 |
| GBM_grid_1_AutoML_8_71 | / | 7.874 | 3.851 |
| GBM_grid_1_AutoML_8_80 | / | 7.863 | 3.538 |
| DeepLearning_grid_1_AutoML_8_7 | / | 8.515 | 4.836 |
| GBM_grid_1_AutoML_8_72 | / | 7.162 | 3.446 |
| GBM_grid_1_AutoML_8_179 | / | 7.068 | 3.185 |
| GBM_grid_1_AutoML_8_120 | / | 7.206 | 3.053 |
| GBM_grid_1_AutoML_8_1 | / | 7.592 | 3.608 |
Disclaimer/Publisher’s Note: The statements, opinions and data contained in all publications are solely those of the individual author(s) and contributor(s) and not of MDPI and/or the editor(s). MDPI and/or the editor(s) disclaim responsibility for any injury to people or property resulting from any ideas, methods, instructions or products referred to in the content. |
© 2025 by the authors. Licensee MDPI, Basel, Switzerland. This article is an open access article distributed under the terms and conditions of the Creative Commons Attribution (CC BY) license (https://creativecommons.org/licenses/by/4.0/).
Share and Cite
Wang, S.; Song, X.; Duan, J.; Li, S.; Gao, D.; Liu, J.; Meng, F.; Yang, W.; Yu, S.; Wang, F.; et al. Automated Machine Learning-Based Prediction of the Effects of Physicochemical Properties and External Experimental Conditions on Cadmium Adsorption by Biochar. Water 2025, 17, 2266. https://doi.org/10.3390/w17152266
Wang S, Song X, Duan J, Li S, Gao D, Liu J, Meng F, Yang W, Yu S, Wang F, et al. Automated Machine Learning-Based Prediction of the Effects of Physicochemical Properties and External Experimental Conditions on Cadmium Adsorption by Biochar. Water. 2025; 17(15):2266. https://doi.org/10.3390/w17152266
Chicago/Turabian StyleWang, Shuoyang, Xiangyu Song, Jicheng Duan, Shuo Li, Dangdang Gao, Jia Liu, Fanjing Meng, Wen Yang, Shixin Yu, Fangshu Wang, and et al. 2025. "Automated Machine Learning-Based Prediction of the Effects of Physicochemical Properties and External Experimental Conditions on Cadmium Adsorption by Biochar" Water 17, no. 15: 2266. https://doi.org/10.3390/w17152266
APA StyleWang, S., Song, X., Duan, J., Li, S., Gao, D., Liu, J., Meng, F., Yang, W., Yu, S., Wang, F., Xu, J., Luo, S., Zhao, F., & Chen, D. (2025). Automated Machine Learning-Based Prediction of the Effects of Physicochemical Properties and External Experimental Conditions on Cadmium Adsorption by Biochar. Water, 17(15), 2266. https://doi.org/10.3390/w17152266