Article

Peculiarities of 222Radon and 238Uranium Behavior in Mineral Waters of Highland Terrains

1
Heat and Mass Transfer Laboratory, Geological Institute Russian Academy of Science, Pyzhevsky Lane 7, Bld. 1, 119017 Moscow, Russia
2
Geological Department, Lomonosov Moscow State University, Leninskiye Gory, 119991 Moscow, Russia
3
Laboratory of Hypergene Processes Geochemistry, Far East Geological Institute, Far Eastern Branch Russian Academy of Science, Prospect 100-Letya 159, 690022 Vladivostok, Russia
4
Lomonosov Moscow State University Branch in Dushanbe City, Dushanbe 734003, Tajikistan
*
Author to whom correspondence should be addressed.
Water 2025, 17(15), 2211; https://doi.org/10.3390/w17152211
Submission received: 3 July 2025 / Revised: 22 July 2025 / Accepted: 24 July 2025 / Published: 24 July 2025

Abstract

Mineral waters from two tectonically active mountain systems within the Alpine-Himalayan orogenic belt, the Pamir and the Greater Caucasus (Elbrus region), were analyzed for 222Rn activity and 238U concentrations to establish correlations with geological conditions, physicochemical characteristics of water, and to assess the potential health risk associated with 238U and 222Rn. It was found that in mineral waters of the Pamir, the concentrations of 238U (0.004–13.3 µg/L) and activity of 222Rn (8–130 Bq/L) are higher than in the Elbrus area: 0.04–3.74 µg/L and 6–33 Bq/L, respectively. Results indicate that uranium mobility in water is strongly influenced by T, pH, and Eh, but is less affected by the age of host rocks or springs′ elevation, whereas radon activity in waters depends on the age of rocks, spring elevation, 238U content, and values of δ18O and δ2H in water. This study reveals fundamental geological distinctions governing uranium and radon sources in the mineral waters of these regions. Isotopic evidence (222Rn and 3He/4He) demonstrates crustal radon sources prevail in Pamir, whereas the Elbrus system suggests mantle-derived components. The U concentrations do not exceed 30 µg/L, and most water samples (94%) showed 222Rn activities below 100 Bq/L, complying with the drinking water exposure limits recommended by the World Health Organization and European Union Directive. However, in intermountain depressions of the Pamirs, at low absolute elevations (~2300 m), radon concentrations in water can increase significantly, which requires special attention and study.

1. Introduction

Mineral waters originate from water–rock–gas interactions and serve as a valuable balneological resource, attracting significant research interest (e.g., [1,2,3,4]). During geological evolution, mineral waters may become enriched with various chemical elements and radionuclides, which can present health risks if consumed without regulation (e.g., [5,6,7]). The content of natural radionuclides in mineral waters can vary within several orders of magnitude and depends on the physical, chemical, and geological properties of the aquifer (e.g., [8,9,10]). Since the mid-1900s, numerous studies have explored the relationship between radionuclides in water and geological factors (e.g., [10,11,12,13,14,15]). As a result, radioactive isotopes are now widely applied in geology for tracking uranium deposits (using 4He, 222Rn), assessing degassing depth in hydrothermal systems (222Rn), predicting earthquakes and volcanic activity (222Rn, 226Ra, 4He, 40Ar), studying groundwater dynamics in oil provinces (3H), monitoring soil gases induced by hydraulic fracturing (222Rn), and many other applications.
The radionuclides uranium-238 and radon-222 share the same geologic source because radon-222 is a daughter isotope in the uranium-238 decay series (e.g., [16]). In groundwater, radon activity typically correlates with the local abundance of uranium/radium in rocks and soil (e.g., [17,18]). Groundwater in granitic massifs exhibits elevated radon activity and is widely used in balneotherapy (e.g., in Georgia [19], Romania [20], Poland [21], Russia [22], Kyrgyzstan [23], Tajikistan [24], and others). Most such sites are located at the foothills of mountain systems, within an elevation range of 100–2000 m above sea level (asl). Two of the most prominent radon therapy destinations in the Tien Shan highlands are Dzhete-Oguz (Kyrgyzstan, 2000 m asl) [23] and Khodzha-Obi-Garm (Tajikistan, 1960 m asl) [24]. Data on radionuclide distribution in mineral water above 2000 m elevation remain scarce (e.g., [25]).
The population in the high-altitude regions of the Pamirs (2000–7500 m) and the Elbrus area (1200–5000 m) is relatively small; approximately 36,000 people reside in the Elbrus region and about 250,000 in the Pamirs. However, these regions hold significant tourism potential, partly due to the abundance of natural mineral springs [26].
Over the past decades, extensive isotopic and geochemical data on groundwater in the Elbrus region have been collected [7,27]. In contrast, research on the mineral waters of the Pamirs was most active in the mid-20th century [28], with limited modern data available (e.g., [26,29]). Radionuclide behavior in these groundwaters and related health risks have never been assessed.
For the first time, this study analyzes the distribution of radon and uranium in mineral springs across two mountain systems within the Alpine-Himalayan orogenic belt—the Pamirs and the Elbrus area (Greater Caucasus), which are situated at elevations ranging from 1300 to 4000 m.
The aim of this work is to assess the level of uranium concentrations and radon activity in mineral waters of the Pamirs and the Elbrus area, to study the relationship with geological and geographical conditions, chemical and isotopic composition of water, and associated gases, and to assess the health risk of drinking mineral waters. A comprehensive understanding of the behavior and concentration of radionuclides in groundwater may be important for the development of effective strategies for the management of mineral water resources.

2. Objects and Methods
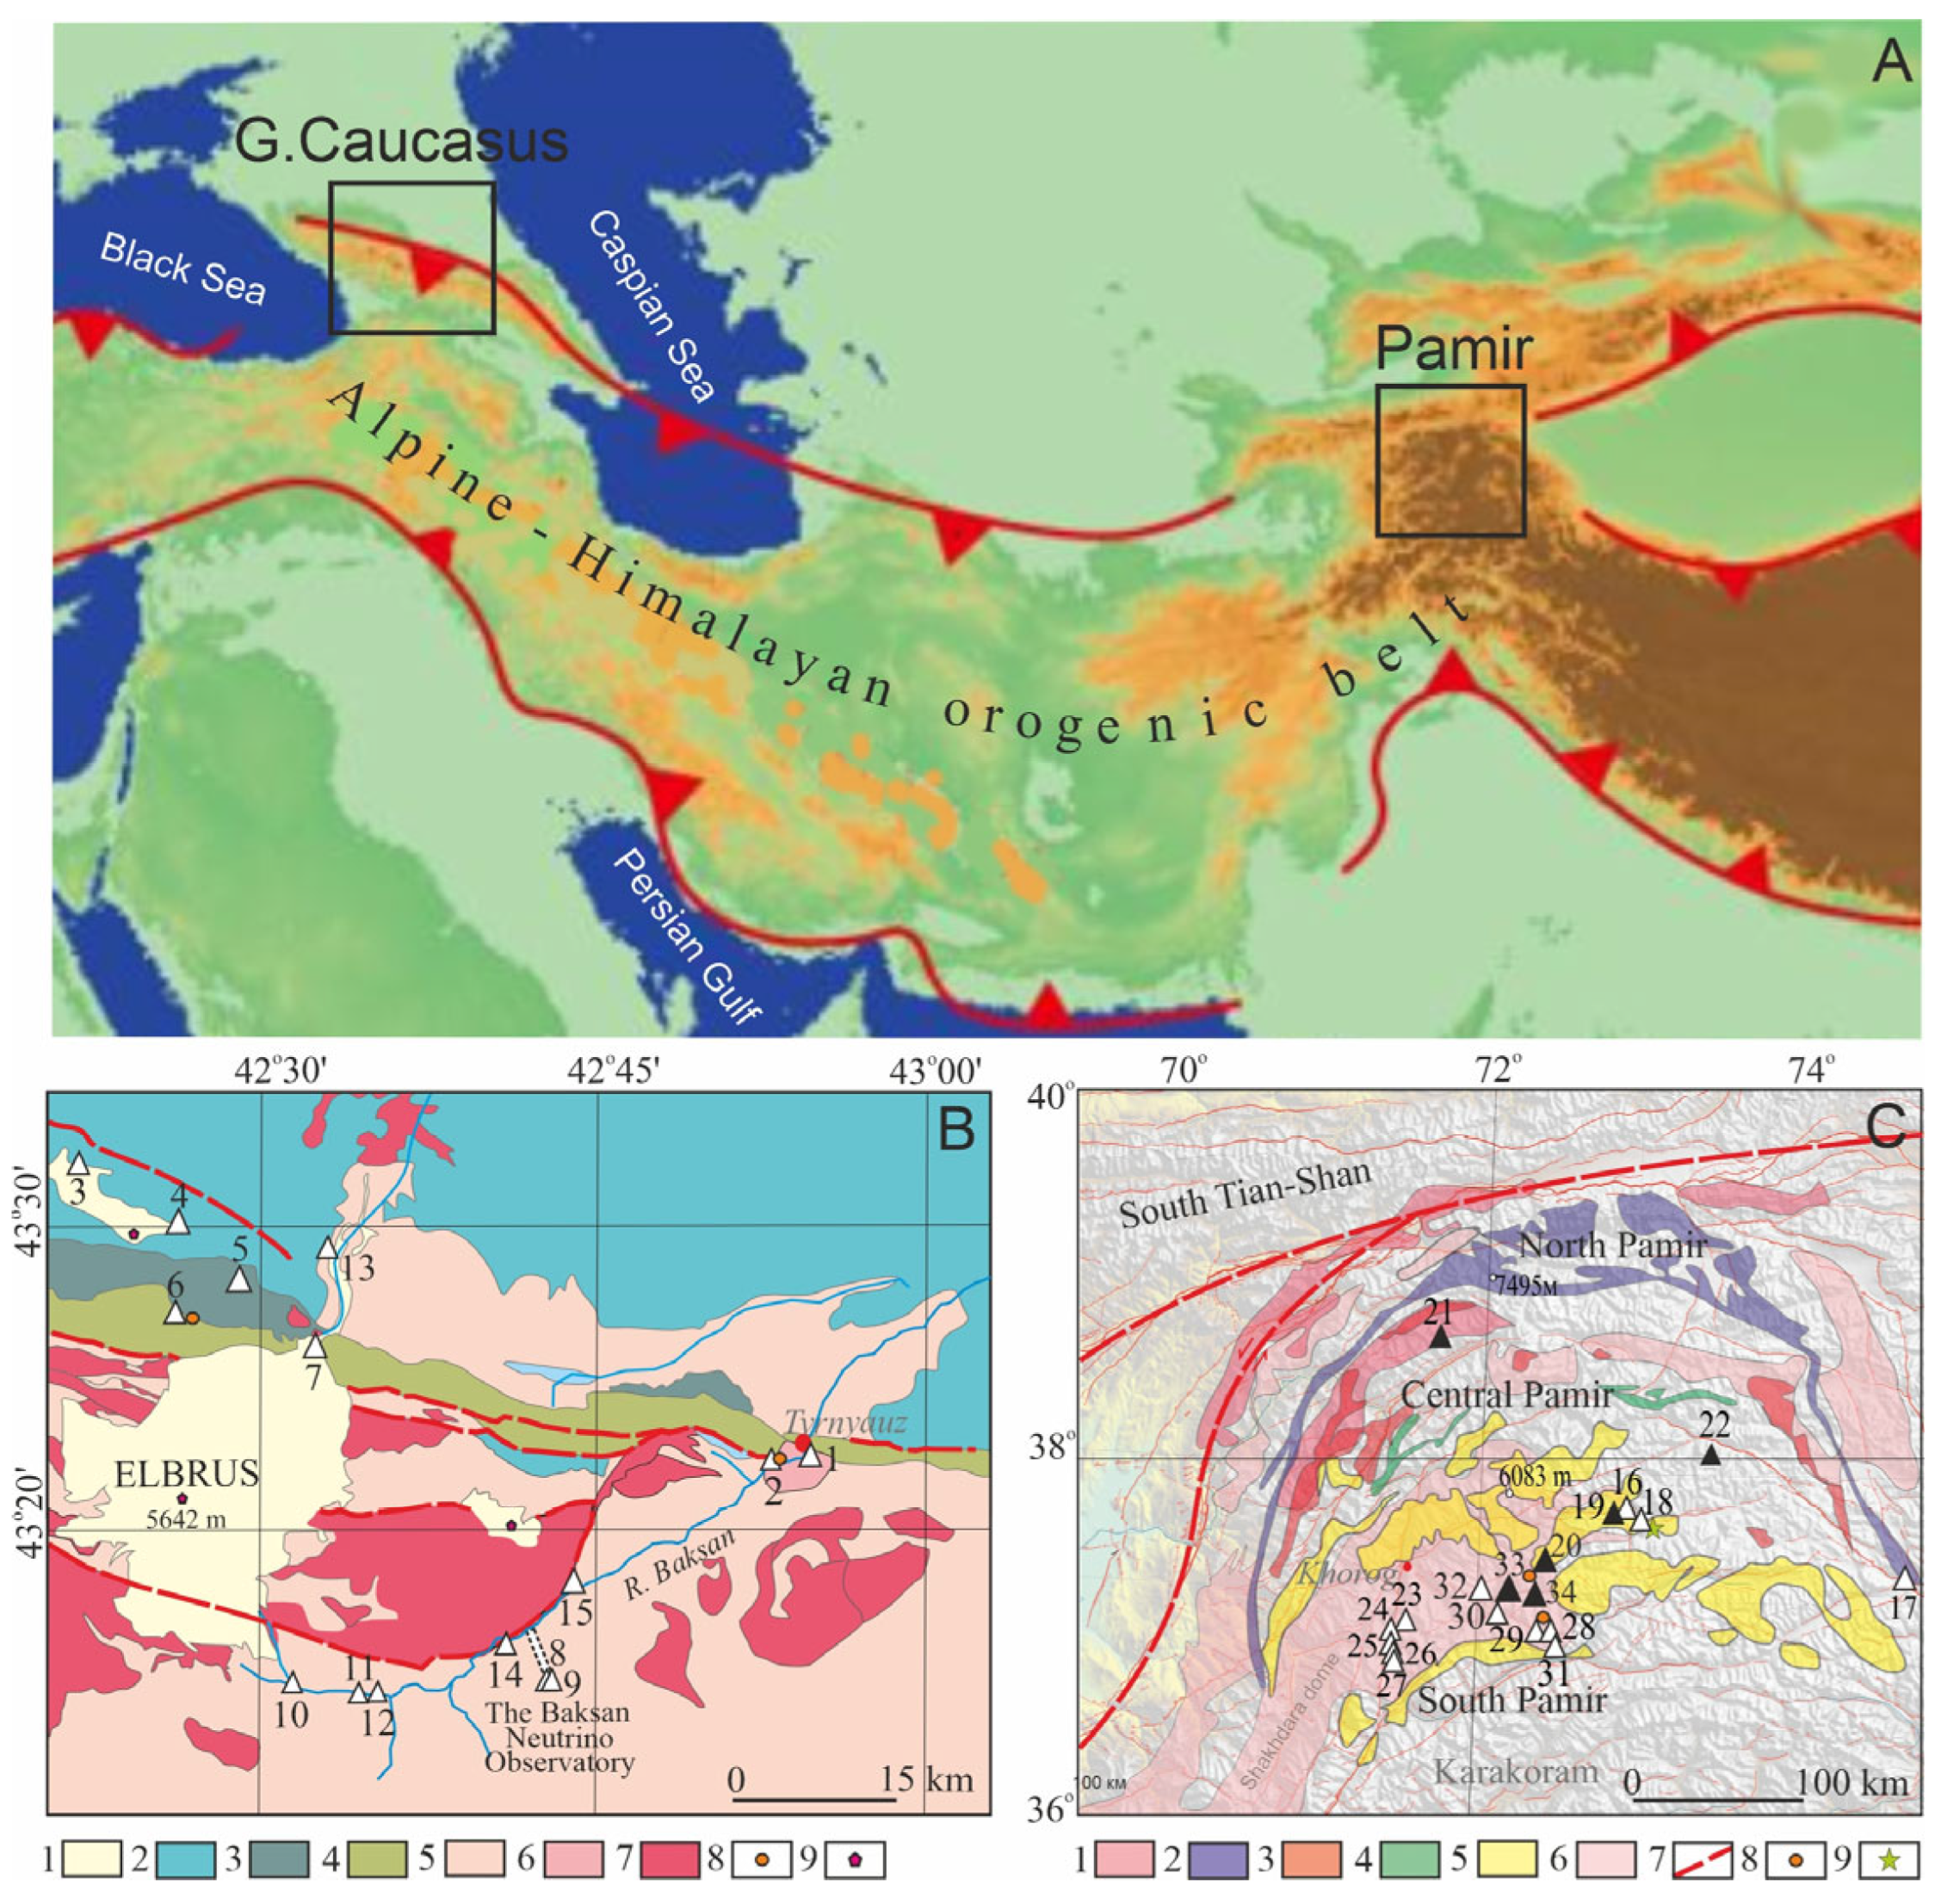
2.1. Study Area

During 2024–2025, we investigated CO2-rich and N2-rich mineral water manifestations (springs and wells) in two key segments of the Alpine-Himalayan orogenic belt: the Pamir (Tajikistan) and the Greater Caucasus (Elbrus area, Russia) (Figure 1). The geological and tectonic frameworks governing mineral water formation in these regions have been detailed in recent studies [7,26,30]. The geological settings of the Caucasus and Pamir exhibit key differences in their orogenic formation (types of orogenesis). The Caucasus formed under conditions of continental collision, specifically, the collision of the Arabian and Eurasian plates. This process was characterized by horizontal compression, leading to the development of fold-and-thrust structures, as well as volcanism resulting from partial crustal melting in the collision zone. In contrast, the Pamirs’ orogenesis involved both accretion (the incorporation of microcontinents and island arcs) and subsequent collision with Eurasia. While the Northern Pamirs display a collision-type origin similar to the Caucasus, the Central and Southern Pamirs preserve remnants of oceanic crust from the Tethys paleo-ocean. Accretion led to a key difference between the geological structure of the Central and Southern Pamirs and that of the Caucasus: vertically oriented rocks of oceanic origin and deep vertical faults (e.g., [28]). These features create favorable conditions for fluid circulation within the Pamirs and promote the formation of thermal waters. In contrast, natural thermal water discharges are rare within the Caucasus’ mountain structures.
The geological base of both regions is anchored by Precambrian rocks (gneisses, marbles, and migmatites), constituting the most ancient formations and covering significant areal extents. Paleozoic granites, granodiorites, and volcanic rocks are widespread in the central Caucasus and northern Pamir. The Elbrus area of the Greater Caucasus lacks Mesozoic units in its central orogenic structure (Figure 1), with such rocks occurring only as marginal elements, whereas the Pamirs’ southern and central sectors contain voluminous Jurassic-Cretaceous granitoid complexes. While Tertiary eruptives mark the Pamirs’ youngest formations (e.g., [31]), the Greater Caucasus shows recent geological activity through both Quaternary granites and Holocene volcanism (last Elbrus eruption, 1.5–1.7 ka) (e.g., [32]). Mineral springs rarely reach the surface in the mountain regions under study; the majority of the waters were found in the middle of the 20th century as a result of drilling operations (e.g., [27,28]). The physico-chemical composition of waters in the study areas also exhibits some differences (e.g., [7,26]). First of all, is the water temperature (Table 1). If the average water temperature for Pamir waters is 36.7 °C, then the waters of the Elbrus region are more than twice as cold—16.4 °C. Waters of the regions also differ in the values of mineralization (TDS). The TDS of Pamir waters ranges from 0.4 to 6.1 g/L (average: 1.9 g/L), whereas in the Elbrus area, mineralization reaches up to 10.6 g/L (average: 4.8 g/L). In the majority of the studied mineral waters from the Pamir and Caucasus regions, the dominant anion is HCO3, and HCO3-Cl-type waters are frequently observed (Figure 2). This is particularly characteristic of the Caucasus. HCO3-SO4, SO4-Cl, and SO4-type waters are also found in the Pamirs but are not typical of the Elbrus area.

2.2. Methods

A total of 34 mineral water discharges from the Elbrus area (15 samples) and the Pamir (19 samples) were collected for hydrochemical, isotopic, and gas composition analyses. Surface water samples were also collected, including five river water samples and two lake water samples. Several rock samples were also collected for chemical analysis and microscopic examination. The latitude and longitude of the sampling sites were recorded by a handheld GPS (eTrex 20, GARMIN, Olathe, KS, USA). Altitude above sea level, air temperature, and pressure data were collected on-site by a Multifunctional Environmental Meter (Kestrel 2500 NV, Boothwyn, PE, USA).
Measurements of electrical conductivity (EC), pH, Eh, and water temperature were performed in situ using hand-held meters Mettler Tolledo S2 Seven2Go (Zürich, Switzerland) calibrated before sampling.
For chemical and isotopic analyses, water samples were filtered through 0.45 µm mixed cellulose ester filters (Advantec, Tokyo, Japan) and stored in acid-washed high-density polyethylene bottles. Samples intended for cation analysis were acidified to pH < 2 using ultrapure HNO3. Dissolved carbonate species were determined by titration (e.g., [33]) with reagent-grade HCl (0.1 mol) and NaOH (0.02 mol) with phenolphthalein and methyl orange immediately after sampling. The concentrations of 238U and 232Th in waters were measured by inductively coupled plasma mass spectrometry (ICP-MS, X7 Quadrupole, Thermo Scientific, Waltham, MA, USA) in the Analytical Center of the Institute of Microelectronics Technology and High-Purity Materials, Russian Academy of Sciences, Chernogolovka, Moscow [34]. A Picarro 2170i laser isotope analyzer (Santa Clara, CA, USA) was used at the Collective Use Center of the Geological Institute of the Russian Academy of Sciences (Moscow, Russia) to determine the values of δ2H and δ18O.
Bubbling gas samples were collected from the natural springs and boreholes using standard techniques [35]. The composition of associated gases was determined in the Heat and Mass Transfer Laboratory (Geological Institute of the Russian Academy of Sciences, Moscow, Russia) using a gas chromatograph “Kristall 5000” (JSC SDB Chromatek, Yoshkar-Ola, Russia) with an inaccuracy no greater than 2–3 vol.%. The values of δ13C(CO2) and δ13C(CH4) were determined using the Thermo Electron system consisting of the Delta V Advantage mass spectrometer and the Trace GC Ultra gas chromatograph in the Laboratory of Isotope Geochemistry and Geochronology, Geological Institute, Russian Academy of Sciences, with an error of ±0.2%. All δ13C values are given in per mille (‰) relative to the VPDB standard.
Radon activity in water was measured in situ using a portable Alfarad+ radon monitor (NTM Zashita Co., Moscow, Russia). The method relies on the circulation and transfer of radon from the water sample into the working chamber of the radon measurement block via bubbling. A 50 mL water sample was collected in a capsule and then placed in the bubbler system, where air was passed through the water to facilitate the rapid release of 222Rn from the liquid into the gas phase. The released radon was transported through connecting tubing to the radiometer’s chamber, with complete transfer achieved in five minutes as per methodological specifications [36]. The instrument is capable of quantifying radon activity in water samples at concentrations as high as 800 Bq/L, with an associated uncertainty of ±30%, which is suitable for preliminary screening/field measurements [37]. To minimize statistical counting errors, extended measurement times were employed, water from each spring/well was analyzed five times, and the average value was calculated. Thus, measurement error did not exceed 5% (e.g., [38]). In this study, radon was measured as activities and uranium was measured as a concentration, which is consistent with common practice and with the MCLs or other human-health benchmarks available for these constituents.
The analyses of rocks were performed in the Geological Institute RAS, Moscow, Russia. Microelements Th and U were analyzed using the ICP MS technique with an Agilent 7500c spectrometer (Agilent Technologies Inc., Santa Clara, CA, USA). Analytical errors are 1–10%, depending on the concentrations. Uranium minerals were studied using Tescan Lyra 3 XMH (Tescan, Brno, Czech Republic) dual beam scanning electron microscope equipped with EDS Aztec X-Max 80 Standart (Oxford Instruments, Abingdon, UK).
Thermodynamic calculations were performed using the Aquachem 5.11 software with PhreeqC code [39,40]. The degree of statistical dependency of the system’s physicochemical properties and different constituents was determined using a nonparametric measure of Spearman’s rank correlation, which falls between r = +/−1. High correlations are indicated by absolute values of 0.8 < r ≤ 1, intermediate and high correlations are characterized by values of 0.5 < r ≤ 0.8, while independence across variables is shown by r = 0.

3. Results and Discussion

3.1. Geology, Orogeny, and Radionuclides Behavior

Rocks serve as the main source of radionuclides, and underground fluids (water and gases) contribute to their transport to the surface (e.g., [41]). To elucidate the origin of radionuclides in mineral waters, the relationship between the concentration (activity) of 222Rn and 238U in these waters, types of host rocks, and their geologic age was studied. According to the geological structure of the Pamirs, the collected mineral waters are associated with three main types of rocks: (1) Mesozoic granitoids (5 samples), (2) Paleozoic igneous and metamorphic rocks (2 samples), and (3) Precambrian metamorphic strata including gneisses, marbles, and migmatites (12 samples). Mineral springs of the Elbrus area also occur in three main rock associations: Cenozoic (Quaternary) granites/granodiorites/sedimentary rocks (4 samples), Paleozoic sedimentary/volcanic rocks (3 samples), and Precambrian gneisses/schists/migmatites (7 samples). This hierarchy demonstrates increasing mineral water affinity with older, more metamorphosed lithologies (Table 1). The analysis of geological conditions of Pamir and the Elbrus region revealed the main similarities and differences in the distribution of mineral waters in the studied territories, as well as variations in the levels of radionuclide content (Figure 3).
It can be seen that radon activity and uranium concentration are noticeably higher in Pamir waters than in Elbrus waters. The concentration of 232-thorium is very low in all studied waters (Table 1). These findings demonstrate that Precambrian basement rocks constitute a fundamental control on mineral water genesis in both studied regions. Simultaneously, Cenozoic rocks in the Caucasus and Mesozoic rocks in the Pamirs represent significant sources of mineral waters. Regarding rock age, an important clarification is needed. When discussing the influence of water-bearing rock age, we posit that older rocks are generally more susceptible to weathering, destruction, and typically exhibit higher fracturing density. This enhanced fracturing increases rock permeability to water and gases while expanding the reactive surface area with radioactive minerals. These effects are particularly pronounced in rocks involved in orogenic processes and tectonic activity, which explains the observed correlations. As direct quantification of rock fracturing in the study areas was unfeasible at this research stage, we used geological age as a proxy (assuming fracturing increases with age), through which certain dependencies were identified.
The distribution of 222-radon and 238-uranium in the mineral waters of the studied territories, based on the data from Table 1, is shown in Figure 4. The lack of elevation data in such representations severely undermines the reliability of conclusions, as critical altitude-related factors—climatic, orographic, geological, and hydrological—are disregarded. Consequently, this may result in oversimplifications or incorrect assumptions regarding radionuclide distribution and dynamics in mountainous regions. Due to the significant difference in the elevation of these mountain ranges—reaching up to 7649 m in the Pamirs and 5642 m at Mount Elbrus—the altitudes of the springs also vary considerably (Table 1). The mineral springs of the Pamirs are located between 2349 and 3867 m asl, while those in the Elbrus region occur at elevations of 1296 to 2667 m asl. Figure 5A shows the correlation between radon activity in the studied waters and spring elevation.
Radon levels show an inverse relationship with decreasing altitude for both the Pa-mir (r = −0.53) and the Elbrus area (r = −0.54) (Figure 5A). In Pamir waters, this dependence is most pronounced in Precambrian rocks (r = −0.5), and in Elbrus waters it is associated with Paleozoic and Cenozoic rocks (r = −0.8–−0.9). Based on the fact that this dependence is observed for both mountain structures, its essence is related to the physical properties of radon (high density of 9.73 kg/m3, about 7.6 times higher than the density of air, and short half-life—3.8 days). Geological conditions (fracturing, water availability, fluid flows, etc.) can also limit the access of radon to the upper parts of mountain structures. 222Rn is formed in the upper part of the Earth’s crust by the natural radioactive decay of uranium, when 226Rn ions formed during decay of 238U diffuse from the rock matrix to fracture surfaces. Separation of uranium and radium is often observed in the hypergenesis zone. Radium is deposited separately from uranium on the walls of fractures in rocks, tuffs, clays, etc. Emanating reservoirs are formed in this way [42]. Chemical peculiarities of uranium behavior in water determine the ways of its migration in the environment, while the main factor allowing radon to be fixed in mineral waters at significant altitudes is the proximity of the source of radon generation in rocks.
Uranium concentrations decrease with altitude only in the Pamir region (r = −0.54) (Figure 5B). However, in the highest Pamir mineral springs (above 3500 m asl)—those associated with Mesozoic rocks—a strong positive correlation is observed (r = 0.9, Figure 5B). Also, the highest uranium concentrations (18.6 µg/L) were determined in Sasykul Lake water, at an altitude of 3830 m asl. Samples of surface water (streams) located at altitudes above 3500 m also show uranium concentrations higher than in underground sources (9.0–11.6 µg/L). Thus, at altitudes above 3500 m, elevated uranium content in groundwater may be an indicator of its surface supply. The lowest position in the Pamir section is occupied by springs in Precambrian rocks (from 2400 to 3200 m above sea level). The largest number of natural mineral springs is located here. This indicates both the high cracking of ancient Precambrian rocks, which creates the best conditions for water circulation, and the influence of regional groundwater flow, which contributes to water unloading in the lowest structures of the Pamirs.
Uranium concentrations do not show significant correlations with elevation in waters from the Elbrus area (r = 0.3; Figure 5B). However, intermediate correlations are observed for waters circulating through Paleozoic and Cenozoic rocks (r = 0.7), likely due to a shift from reducing (Eh = −225 mV) to oxidizing conditions (Eh = +55 mV). The redox potential (Eh) shows a moderate positive correlation with uranium concentrations (r = 0.55) in these waters. This provides conditions for uranium oxidation to the hexavalent form, which is very soluble in water. At the same time, correlations of uranium with altitude are not observed for waters circulating in Proterozoic rocks (r = 0.2). Uranium concentrations in these mineral springs exhibit substantial variability (0.05–3.74 μg/L), likely reflecting differences in local uranium source availability. Some recent evidence suggests that the pronounced variability in dissolved uranium levels might reflect spatial variations in uranium enrichment within the granite body (e.g., [10,43]). Nevertheless, a moderate but significant positive correlation exists between redox potential (Eh) and uranium concentrations (r = 0.51), suggesting redox conditions influence uranium mobility.

3.2. Geochemical Aspects of 238U and 222Rn Migration

Radon, as an inert gas, does not react chemically with other elements, unlike its progenitor uranium. Consequently, the concentration of uranium in water can be used only indirectly to judge the pathways of radon input. Under favorable physicochemical conditions, uranium in water can be transported by groundwater to considerable distances and have large concentrations, but there will be no radon in the water. In turn, radon emanations in water can be caused by secondary mineral deposits (containing U and 226Ra) on rock fracture walls (e.g., [14,15,42]).
In order to establish relations between radon and uranium, as well as their sources in mineral waters of high-mountainous areas, it was necessary to consider geochemical patterns of migration of these elements.

3.2.1. Uranium

Uranium migration in the studied waters depends on water temperature, pH, and Eh (Figure 6A–C) and is independent of salinity (TDS). The correlation coefficients of uranium with water temperature for Pamir and Elbrus are −0.7 and −0.5, respectively (Figure 6A). The dependence of uranium concentrations on pH (Figure 6B) is more pronounced for Pamir mineral waters (r = −0.56) than in Elbrus waters (r = −0.32). A strong correlation (r = 0.76) of Eh with 238U was observed for all Pamir mineral waters (Figure 6C). For the mineral springs of Elbrus, the correlation is weaker, almost two times (r = 0.41). These correlations reflect the peculiarities of uranium migration in different chemical environments and, to a certain extent, characterize the hydrogeological conditions of the studied regions.
In natural conditions, uranium can be in tetravalent and hexavalent forms. In the active water exchange zones, where groundwater contains free oxygen, uranium undergoes oxidation to the hexavalent state (U+6), forming compounds that are well soluble in water. In groundwater, uranium is mainly present in its most mobile oxidized form of uranyl +6 as UO22+. In deep horizons under reducing conditions (in the zone of difficult water exchange), U in rocks is in the tetravalent form, forming very poorly soluble compounds. The redox potential (Eh) is a characteristic that affects uranium behavior in water. In accordance with the above, the maximum U concentrations in the studied waters are observed at positive values of Eh (0–+100 mV), and the minimum ones at negative values of Eh (−300–0 mV).
Redox conditions of waters characterize the depth of water circulation, which is confirmed by the increase in temperature of waters with negative Eh. The correlation coefficient of Eh with temperature is −0.6. Waters with high temperature generally contain less uranium (Figure 6A) and are discharged at higher absolute elevations (r = 0.56) (waters in Mesozoic granites, Figure 5B). As the altitude decreases, the temperature of the waters decreases (r = 0.57), and the uranium content increases (Figure 6A). Thus, the content of uranium is relatively higher in the waters of the zone of active water exchange compared to the zone of impaired water exchange.
Uranium concentrations in Pamir waters are also controlled by calcium and magnesium concentrations (r = 0.74). This indicates that, under certain conditions, uranium can move into the water by dissolution of carbonates and is also removed from the water together with secondary carbonates. For mineral waters of Elbrus, no such dependences were revealed (r = 0.1). The results align well with the geological framework of the studied regions. Water-rock interactions with carbonate formations are particularly evident in Pamir groundwaters, reflecting the region’s abundance of marine-origin rocks. In contrast, the Elbrus area shows limited carbonate distribution in its upper stratigraphic sections. The mineral springs north of Elbrus (#3–7, 13; Figure 1), where groundwater possibly interacts with Cretaceous marine sediments of the cover sequence, exhibit a strong positive correlation between calcium and uranium (r = 0.8). In other words, calcium, magnesium, and uranium share common sources in Pamir waters but have distinct sources in the Elbrus region.
Associated gases also affect the processes of interaction of water with rock (e.g., [44]). The calculated correlation coefficients between 238U and CH4 for the waters of Pamir and Elbrus are very close and are −0.66 and −0.61, respectively, which is in good agreement with the fact that the presence of CH4 and other reducing agents reduces the solubility of uranium [45]. The presence of CO2 in water, on the contrary, promotes the solubility of uranium [28]. CO2 acidifies the solution (reduces pH), enhancing dissolution of uranium-bearing minerals. In slightly acidic to neutral waters (pH 5–7), uranium (U6+) forms stable complexes with carbonate ions (CO32−): UO22+ + 3CO32− ↔ UO2(CO3)34−. These complexes enhance uranium solubility, preventing its precipitation. A positive correlation between uranium and CO2 is characteristic of the Pamir waters (r = 0.69), while in the Elbrus area, only waters with CO2 content > 90 vol.% show a positive correlation (r =0.69). A group of mineral waters (#1, 2, 6, 12, and 14) with concentrations < 90 vol.% show a strong negative correlation (r = −0.8). However, with the observed decrease in CO2 in these waters, pH and Eh conditions remain favorable for uranium accumulation (e.g., [46]). This could result from oxidizing conditions (e.g., dissolved O2), competition for sorption sites (e.g., [10]), or other factors. Further research is required to resolve these complex interactions. The δ13C determinations of methane showed its thermogenic genesis for the Pamirs (from −17.1 to −29.2‰), while sources with microbial methane are also characteristic of the Elbrus region (Table 1). Studying the genesis of methane in the Elbrus region, Lavrushin [27] concluded that methane is of crustal origin, and the heterogeneity of values is associated with the influence of magmatic activity, which determines the generation temperatures and isotopic characteristics of CH4. The formation of isotopically heavy methane in Pamir gases is associated with crustal melting and isotope exchange processes in the CO2-CH4 system.

3.2.2. Radon

As mentioned above, the studied mineral waters of Pamir and the Elbrus region significantly differ from each other in temperature and TDS (Table 1). At the same time, general dependences of radon concentration on temperature or TDS for both Pamir and Elbrus waters were not found (r = 0.2). For mineral waters of the Pamir, statistically significant patterns are not revealed, but the highest correlation coefficient (r = 0.4) is observed in CO2-rich waters confined to Proterozoic rocks. Correlations of radon with pH and Eh for waters of both regions are below the significance level, and the correlation coefficient is from −0.3 to 0.1.
Significant correlations 222Rn are established only for waters distributed in Proterozoic rocks of Elbrus: rtemp = −0.72, rTDS = −0.81. This occurs because the solubility of radon decreases with increasing temperature and mineralization [47]. A strong positive correlation (r = 0.93) exists between TDS and temperature in these waters, suggesting that elevated temperatures enhance rock leaching processes.
As shown in Figure 7A, 222Rn concentrations in waters from the Pamir moderate correlate with uranium concentrations (r = 0.6). The strongest correlation (r = 0.8) is observed in Proterozoic rocks, while waters circulating through Mesozoic formations show a weaker relationship (r = 0.4). This pattern aligns with the diffusion model of radon origin (e.g., [15]).
Figure 7B demonstrates a moderate but significant positive correlation (r = 0.5) between 222Rn and uranium concentrations in Elbrus waters. Only one well within Elbrus shows elevated radon concentrations (#1, Table 1), approximately three times higher than other mineral waters. The well is about 500 m deep, and the uranium-to-radon ratios indicate that these mineral waters have an additional source of radon, which is not directly related to uranium entering the water. Potential additional radon sources include: (i) secondary mineral phases precipitated on fracture surfaces containing trapped 226Ra, and (ii) associated carrier gases that mobilize and transport radon to the surface (e.g., [41]). These processes increase radon concentrations near the surface, and do not affect U concentrations in the water (e.g., [15]).
Correlations between the daily activity of radon and dissolved CO2 in fresh groundwater were found in the territory of the Western Caucasus [48]. Statistical calculations on CO2-rich waters (CO2 > 90%, Table 1) show that the correlation coefficients of 222Rn with the Σ U + Th for Pamir reach 0.89, and for Elbrus 0.56. This again confirms that CO2 has a great influence on the radionuclide geochemistry of the studied areas.

3.3. Probable Sources of Radionuclides: Insight from Mineral Equilibrium Calculations

The results of chemical analysis of rocks show that the highest concentrations of U are observed in Mesozoic granites of Pamir (4–12 ppm), whereas quaternary granites from the Elbrus area contain from 4 to 5 ppm of U. Microprobe studies have shown that the main U and Th mineral concentrator is silicates ((Th,U)SiO4, uranothorite) and uranyl and thorium oxides (thorianite and uraninite, Figure 8A,B). The low concentrations of uranium in the rock, along with the rare and microscopic grain sizes of uranium minerals, generally correspond to the overall low level of groundwater radioactivity compared to the waters in the Tien Shan granites [49]. The uranium concentrations in gneisses and carbonates are lower than in granites: 1–2 ppm and <0.25 ppm, respectively.
Calculations of mineral saturation indices (SI) can help clarify the nature of processes controlling the concentration of elements in groundwater. Using the PhreeqC code [40], saturation indices were calculated for typical minerals present in the rocks under study: aluminosilicates, carbonates, halides, and sulfates. The obtained values were compared with uranium and radon concentrations. The dynamics of changes in saturation indices, i.e., saturation of water in relation to the minerals of the rocks, represented in Figure 9, approximate the evolution of the mass transfer process (e.g., [50]).
Statistical analysis revealed that against the general background (gray dots), a distinct group of springs stands out (#10, 14, 15, 19, 21, 25, 26, 27, 28, 29, 32, in Table 1), showing uranium enrichment as waters reach saturation with respect to aluminosilicates (SI albite, r = 0.78, Figure 9A). An intermediate correlation was observed between uranium and halides (SI halite, r = 0.68, Figure 9B), and a weak correlation for sulfates (SI gypsum, r = 0.48) and carbonates (SI dolomite, r = 0.41, Figure 9C). This group primarily includes springs from the Pamirs (8 springs) and the Elbrus region (3 springs). Most of the springs are related to the Proterozoic rocks, and only three springs on the Pamir are related to the Mesozoic and Paleozoic rocks (#17, 18, 20). Based on these findings, the most probable source of uranium in these waters is aluminosilicates and evaporites.
In the remaining waters (gray dots in Figure 9, characterized by low uranium concentrations), either the necessary conditions for uranium accumulation are absent, or the waters circulate in uranium-depleted rocks. For example, the mineral waters of the Elbrus region, which have the highest U contents (1.5–3.7 µg/L), are undersaturated with respect to albite (SI = −1.1), dolomite (SI = −2.4), and gypsum (SI = −1.9). This suggests that uranium could be released through the dissolution of these minerals. These waters exhibit low radon activity (7–10 Bq/L). Conversely, the waters in the Elbrus region with the highest radon concentrations contain very low U concentrations. These waters are supersaturated with respect to albite (SI = 1.5), potassium feldspar (SI = 1.5), and dolomite (SI = 0.5), indicating that dissolution of these minerals is unlikely. Moreover, uranium (or radium) may be scavenged during carbonate precipitation [51]. The low saturation indices for gypsum (SI = −3.7) suggest its possible dissolution and subsequent release of uranium into the water.
The observed correlation between 238U and 222Rn with the saturation indices of evaporites (halides and sulfates) suggests favorable conditions for the release of radionuclides into water during the dissolution of these mineral phases. Elevated radioactivity in anhydrite-bearing strata and carbonate reservoirs has been documented in sedimentary oil and gas basins (e.g., [52,53]). The radioactivity of evaporites is attributed to the fact that seawater evaporation leads to the enrichment of dissolved elements, including uranium and thorium. Based on the data in Figure 9B,E, water-rock interaction with ancient evaporites appears to be a common process, to varying degrees, in most of the studied waters from both regions. However, these processes seem to play a more significant role in the mineral waters of the Pamirs compared to the Elbrus region. Only three springs in the Elbrus area exhibit a clear relationship between uranium and mineral saturation indices (Figure 9A–C), whereas such associations are more pronounced in Pamir waters.
The processes of pre-concentration and evaporite formation appear to be currently active in the Pamirs. A notable example is the Sasik-kul Salt Lake, which has a salinity of about 100 g/L and a uranium concentration exceeding 18 mg/L. Studying radon distribution in this lake is an important objective for upcoming research.
Interestingly, the designated “uranium-rich group” (Figure 9) also shows a correlation with radon. The highest correlation coefficients are observed between: radon and sulfates (r = 0.71); radon and carbonates (r = 0.57); and radon and aluminosilicates (r = 0.37) (Figure 9D–F). This suggests that sulfates and carbonates are the primary minerals controlling radon activity in these waters. This process may occur through the release or uptake of 226Ra by secondary carbonates or sulfates (e.g., [10]).
According to a comparative investigation, these processes, which are so typical of the mineral waters of Pamir, very slightly reflect in the hydrochemical environment of Elbrus. This highlights the different mechanisms controlling radon influx in mineral waters of these regions. The interaction of water with carbonates and sulfates in the Pamirs is facilitated by the abundant marine-derived rocks in the region. The dissolution of evaporites has been identified as one of the dominant processes controlling the chemical composition of mineral waters in the Pamir region [26]. In contrast, in the studied area of the Elbrus region, this phenomenon is observed only in the eastern part, where a well with high radon concentrations is located. The primary process controlling the chemical composition of the mineral water of the Elbrus region is interaction with aluminosilicates [7]. The limited distribution of evaporites in the upper geological section of the Elbrus region indicates a fundamentally different geological control of radon behavior compared to the Pamirs.

3.4. Radionuclides, Stable Isotopes, and Associated Gases

Figure 10A shows δ18O and δ2H isotope ratios in mineral waters of the Pamir and the Elbrus Mountains. For the mineral waters of Elbrus, δ18O values range from −14.2 to −7.9‰ (SMOW), while δ2H values vary from −98.3 to −50.2‰ (SMOW). For Pamir waters, δ18O values range from −18.8 to −13.1‰ (SMOW), and δ2H values range from −140.0 to −98.0‰ (VSMOW). These data indicate that meteoric precipitation is the typical source of all the types of studied mineral waters (Figure 10A).
The altitude effect (δ18O vs Elevation), which is well manifested in surface waters of regions [54,55], is not found in underground mineral waters of single mountain structures of Pamir (r = −0.3) or Elbrus (r = −0.1). For groundwater in these regions, this is attributed to changes in the isotopic composition of water during its evolution within rock formations: the mixing of atmospheric precipitation with older waters, varying circulation times for different sources, and other isotopic effects (temperature-related, gas-related, etc.). Nevertheless, the altitudinal dependence is clearly visible when examining the isotopic values of mineral groundwater from the Pamir and Elbrus regions together (r = −0.66, Figure 10B). The correlation coefficient between elevation and δ2H is more strong: r = −0.72. The δ18O values in water also correlate with groundwater temperature (r = −0.56). Thus, the regional isotopic characteristics of these mountain systems are reflected in groundwater and follow altitude effects (Figure 10B).
A notable distinction between the mineral waters of the studied regions lies in the composition of associated gases. The Elbrus area exclusively hosts CO2-dominated cold mineral waters, reflecting mantle-derived fluid inputs [27]. The concentration of CO2 in this area ranges from 30.1 to 98.9 vol.% (Table 1), whereas N2 contents exhibit significant variation, from 0.7 to 62.8 vol.%. Only four samples (#1, 6, 12, 14) contained significant nitrogen, with concentrations ranging from 21.4 to 62.8 vol.%. The Pamirs, in contrast, exhibit both CO2-rich waters (cold and thermal) and a significant group of thermal N2-rich mineral waters, suggesting varied fluid origins and pathways [26].CO2 and N2 show significant variability, with concentrations ranging from 0.11 to 99.6 vol.% and 0.28 to 98.0 vol.%, respectively (Table 1).
A correlation was found between the isotopic composition of water and the content of associated gases: CO2 (r18O = 0.6; r2H = 0.5) and N2 (r18O = −0.6 and r2H = −0.5). This is because the isotopically light waters of the high mountains contain N2 and little CO2. The proportion of CO2 increases significantly with decreasing altitude (r = −0.58). In very rare cases, the groundwater CO2 flux reaches high altitudes (3788 m asl, #18); mostly, CO2 dominates at altitudes below 3000 m asl (Figure 10B).
Figure 10A shows that nitrogen-rich waters (#19, 20, 21, 22, and 34, Table 1) exhibit the lightest isotopic signatures (δ18O from −15.8 to −18.8‰, δ2H from −140 to −115‰). Notably, these are thermal waters with temperatures ranging from 20 to 80 °C. Such a depleted isotopic composition in thermal waters is evidently linked to their formation at high elevations under cold paleoclimatic conditions (e.g., [56]). The δ18O and δ2H values likely reflect the influence of Pamir glacial meltwater, which serves as the source for modern nitrogen-rich thermal springs. As seen in Figure 10B, these nitrogen-rich thermal waters are predominantly found above the lower glacial boundary (3500–4000 m asl).
The majority of nitrogen-rich mineral waters in the Pamirs exhibit low radon levels (up to 44 Bq/L, Figure 10C) and show no correlation between radon and δ18O (r = −0.30). Only one spring—Zagitor (#21), the sole natural N2-rich manifestation at a lower elevation (2350 m asl)—displays high 222Rn activity in water (130 Bq/L). Figure 10B,C demonstrate that this spring’s isotopic characteristics align with trends and fields typical of CO2-rich waters. Field surveys further revealed that the spring is located atop a large travertine deposit and has very low water and gas discharge rates. It is highly probable that the CO2 source of this once evidently powerful CO2-rich spring has been depleted, possibly due to tectonic shifts, resulting in nitrogen becoming the dominant gas. The elevated radon concentrations further support this hypothesis.
Analysis of data excluding the Zagitor source revealed that in nitrogen-rich waters, radon content correlates with δ18O values (r = −0.52, Figure 9C) and with water temperature (r = 0.56). The inverse correlation between radon and δ18O suggests dilution of groundwater by atmospheric precipitation, which leads to decreased radon concentrations and heavier water isotopic composition.
The positive correlation with spring temperatures (22–79 °C) may indicate active water-rock interaction processes occurring at elevated temperatures in deep aquifers. This leads to the release of radon from mineral formations. The inverse correlation between 238U and temperature (r = −0.55) points to reducing conditions characteristic of deep aquifer systems. Also, some radon escapes from the water due to a decrease in solubility at higher temperatures. Consequently, the free gases of nitrogen-rich thermal waters should exhibit elevated radon concentrations.
CO2-rich waters from Pamir and Elbrus exhibit a moderate δ18O-elevation correlation (r = −0.66; Figure 10B). Interestingly, the correlation between elevation and radon activity in water shows exactly the same coefficient (r = −0.67, Figure 10C). The strongest correlation between radon and δ18O is observed in Pamir’s CO2-rich waters (r = −0.86). This indicates predominant radon transport with isotopically light (glacial) waters. As the water’s isotopic composition becomes heavier (due to dilution by atmospheric precipitation), the waters become depleted in radon.
Despite the relatively high temperatures of Pamir’s CO2-rich mineral waters (15–60 °C), radon-temperature correlations are very weak (r = −0.43). We suggest that active mixing of water by CO2 gas bubbles disrupts radon-water equilibrium effects, which cancel out temperature dependencies while not affecting water isotopes.
For Elbrus CO2-rich waters, the correlation between radon and δ18O is insignificant (r = 0.23). This is likely due to the region’s hydrogeological conditions [26]: most waters are shallow and influenced by atmospheric precipitation, while the sample also includes deep wells with low discharge rates (>radon half-life period) that exhibit active degassing.
Thus, it was established that radon activity in underground mineral waters within the altitudes from 2300 to 3792 m asl is related to isotopic characteristics of water, temperature, and gas factor. Such effects have not been previously observed in mineral waters of the highlands. The identified correlations suggest complex physical processes differentially control radon distribution in these waters. Probably, the established dependences can be considered as indicator characteristics. However, further research is required to fully characterize these mechanisms.
It should be noted that correlations between uranium and water isotopes in mineral waters are either absent or statistically insignificant (r = −0.36 to 0.0). This is primarily due to the distinct chemical behavior of uranium under different geochemical conditions. In contrast, radon exhibits more conservative behavior.
Furthermore, radon appears unrelated to the CO2 source, as no significant correlations with δ13C(CO2) were identified. Based on available geophysical and geochemical evidence, the most probable CO2 origin for the Pamir region is intracrustal melting [26,57]. For the Elbrus area, however, the CO2 shows a clear mantle-derived signature (−4 to −8‰ δ13C), consistent with deep-seated mantle sources (e.g., [58]).

3.5. 3He/4He Ratio and Radon Sources

During the radioactive decay of the U series, a large amount of 4He is formed, which changes the 3He/4He ratio and can also be used to determine the origin of radon. For mineral springs in the Pamir and Elbrus regions, limited determinations of 3He/4He ratios and 222Rn concentrations are available (e.g., [58,59,60]). However, even the available data clearly demonstrate the difference between the sources of helium and radon in the studied regions. Figure 11 demonstrates distinct differences in 3He/4He ratios and 222Rn concentrations between Pamir and Elbrus mineral waters. According to helium systematics, mantle-derived gases ascending through deep faults exhibit significantly higher 3He/4He ratios, typically several times greater than atmospheric values (3He/4He)air = 1.39 × 10⁻⁶). Elevated 3He/4He ratios are also characteristic of regions with high heat flow values [59]. Recent estimates indicate that the mantle helium fraction in associated gases of the Elbrus region may exceed 30% [58].
In contrast to the Elbrus region, Pamir springs exhibit low 3He/4He ratios and elevated 222Rn concentrations, consistent with crustal radiogenic contributions. The correlation coefficient (r = −0.73) indicates an inverse relationship between mantle-derived gas inputs and radon concentrations in water. Specifically, increased mantle degassing corresponds to decreased radon levels, while reduced deep degassing leads to higher radon activity.

3.6. Health Risk Assessment from Mineral Water Consumption

This section’s goal is to evaluate the potential risk that human health poses from mineral waters containing the studied radionuclides.
Uranium and radon have distinct toxicological profiles due to differences in their chemical properties, routes of exposure, and mechanisms of biological damage (e.g., [6,16,19,51]. Due to the low specific activity of 238U (radioactive concentration), the mass of uranium required to produce significant activity is quite large (1 mg of 238U has an activity of only 12.5 Bq) [6]. But, natural uranium induces nephrotoxicity, which has a lower threshold than radiotoxicity. Therefore, the guideline value for U based on chemical toxicity (µg/L), which poses significant health risks, particularly kidney damage, when ingested in high concentrations through drinking water.
The primary health effect of radon is lung cancer, resulting from inhalation in indoor air. Along with soil and atmospheric air, water, and food, trace amounts of radon enter living organisms, where they become sources of ionizing radiation. Elevated levels of radon cause radiation sickness, damage blood-forming organs, and lead to lung cancer.
The content of radon and uranium in water is regulated. The concentrations of 238U in mineral waters from the Pamir and Elbrus regions do not exceed the limits for potable water (15–30 µg/L) according to many international standards, including the US EPA [61], the World Health Organization [62], and Russian water quality standards [63]. The maximum permissible concentrations of radon in drinking water differ significantly across regions, from 11 Bq/L (United States) to 100 Bq/L (Europe, [37]). According to Russian Radiation Safety Standards [64], the radon content in drinking water should not exceed 60 Bq/L. Mineral waters with at least 185 Bq/L are classified as radon waters and can be used in balneotherapy [65].
The European Union (EU), the World Health Organization (WHO), and the U.S. Environmental Protection Agency (EPA) continually develop and refine regulations to limit public exposure to radionuclides in drinking water [66]. However, 222Rn (radon) and its decay products are excluded from the Total Indicative Dose (TID)—a parametric value of 0.1 mSv/year [66]. This 0.1 mSv/year threshold represents a very low risk level, equivalent to a cancer risk of 5.5 × 10⁻⁶. Such values are comparable to carcinogenic chemicals studied in the Elbrus area [7]. Notably, this dose is only achievable if exposure persists continuously over a full year. Calculations reveal that 222Rn contributes no more than 0.9 mSv/year (average: 0.3 mSv/year) to the total annual effective dose in Pamir’s mineral waters, and even less in Elbrus—0.24 mSv/year (average: 0.08 mSv/year) (Figure 12A,B). These low values suggest minimal activity from regulated radionuclides (224Ra, 226Ra, 234U, 238U) (e.g., [9,67]).
Figure 12 is based on the above results, indicating that groundwater at high altitudes (more than 3500 m asl) practically does not contain radon. It can be seen that only one sample of mineral water taken from a well (#1, Table 1) in the granite massif of the Elbrus region exceeds the maximum permissible concentration of 222Rn (Figure 12A).
In accordance with previous studies, this water has exceeded normative values for other elements as well [7]. The radon activity in subsurface mineral fluids is obviously greater east of Mount Elbrus, in the direction of young granite batholiths and Mesozoic sedimentary coverings. According to [68,69], these formations include substantial uranium deposits with strong radon emissions (Rn > 200 Bq/L). Mineral waters in this Caucasus region have served balneotherapeutic purposes for a century (e.g., [70]).
As can be seen, the 222Rn radiation hazard of mineral springs of Pamir is noticeably higher: out of 19 springs, 12 confined to granites and gneisses show values higher than recommended—0.1 mSv/year. Exceeding the TID of 0.1 mSv/y does not mean that the water is unsuitable for drinking. However, further investigation of radium content is required.
In the highlands, the distribution of radon in the groundwater is greatly influenced by the many mountain peaks. In the studied Pamir region alone, there are five mountain peaks exceeding 5000 m in elevation (Figure 12B). Under these conditions, radon activity—both in air and groundwater—remains very low, ensuring safe exposure levels for humans. However, in intermountain depressions at lower elevations (~2300 m), radon concentrations in water can rise substantially, warranting targeted investigation and monitoring.

4. Conclusions

This study presents the first comparative analysis of 222Rn and 238U distribution in mineral waters of two contrasting highland systems of the Alpine-Himalayan orogenic belt: the Pamir and the Elbrus area. The mineral springs occur at elevations ranging from 1296 to 3867 m asl, with temperatures reaching up to 79 °C. The gas composition is dominated by CO2 and N2, with CO2 being particularly prevalent in most springs.
The following significant findings have been drawn after comprehensive investigations:
1.
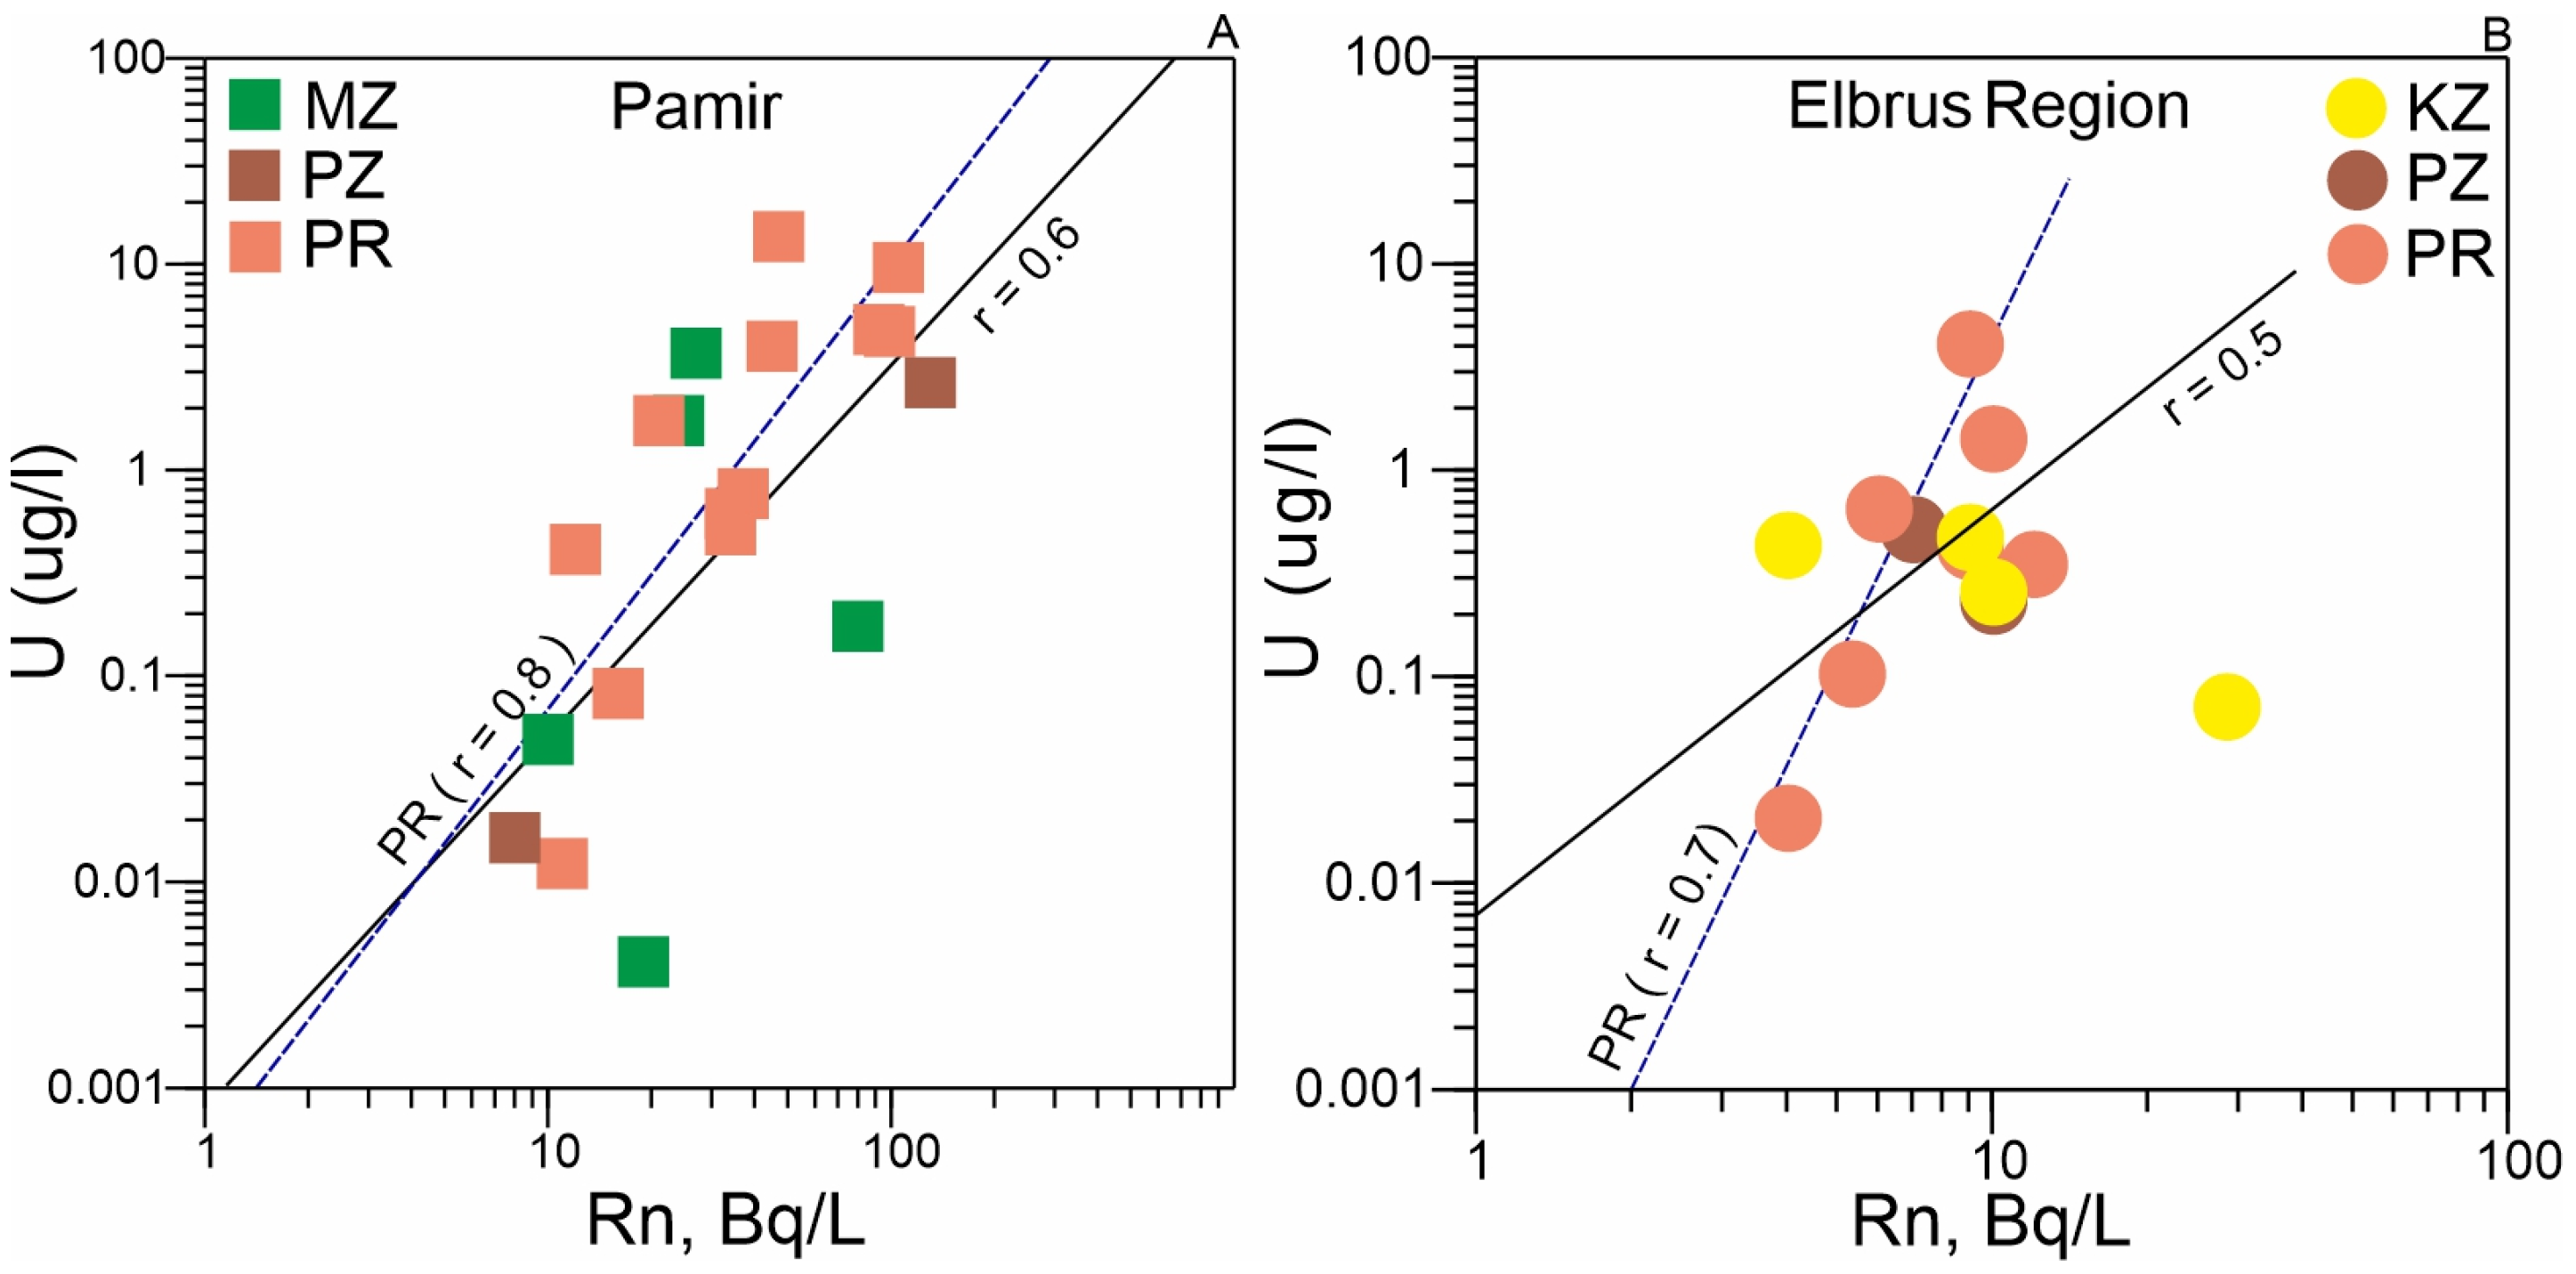
It has been established that the concentrations of 238U and the activity of 222Rn in the mineral waters of the Pamirs are higher than in the waters of the Elbrus area. In both regions, radon activity shows a strong correlation with uranium concentrations in mineral waters associated with Proterozoic-age rocks, the most ancient geological formations in these areas.
2.
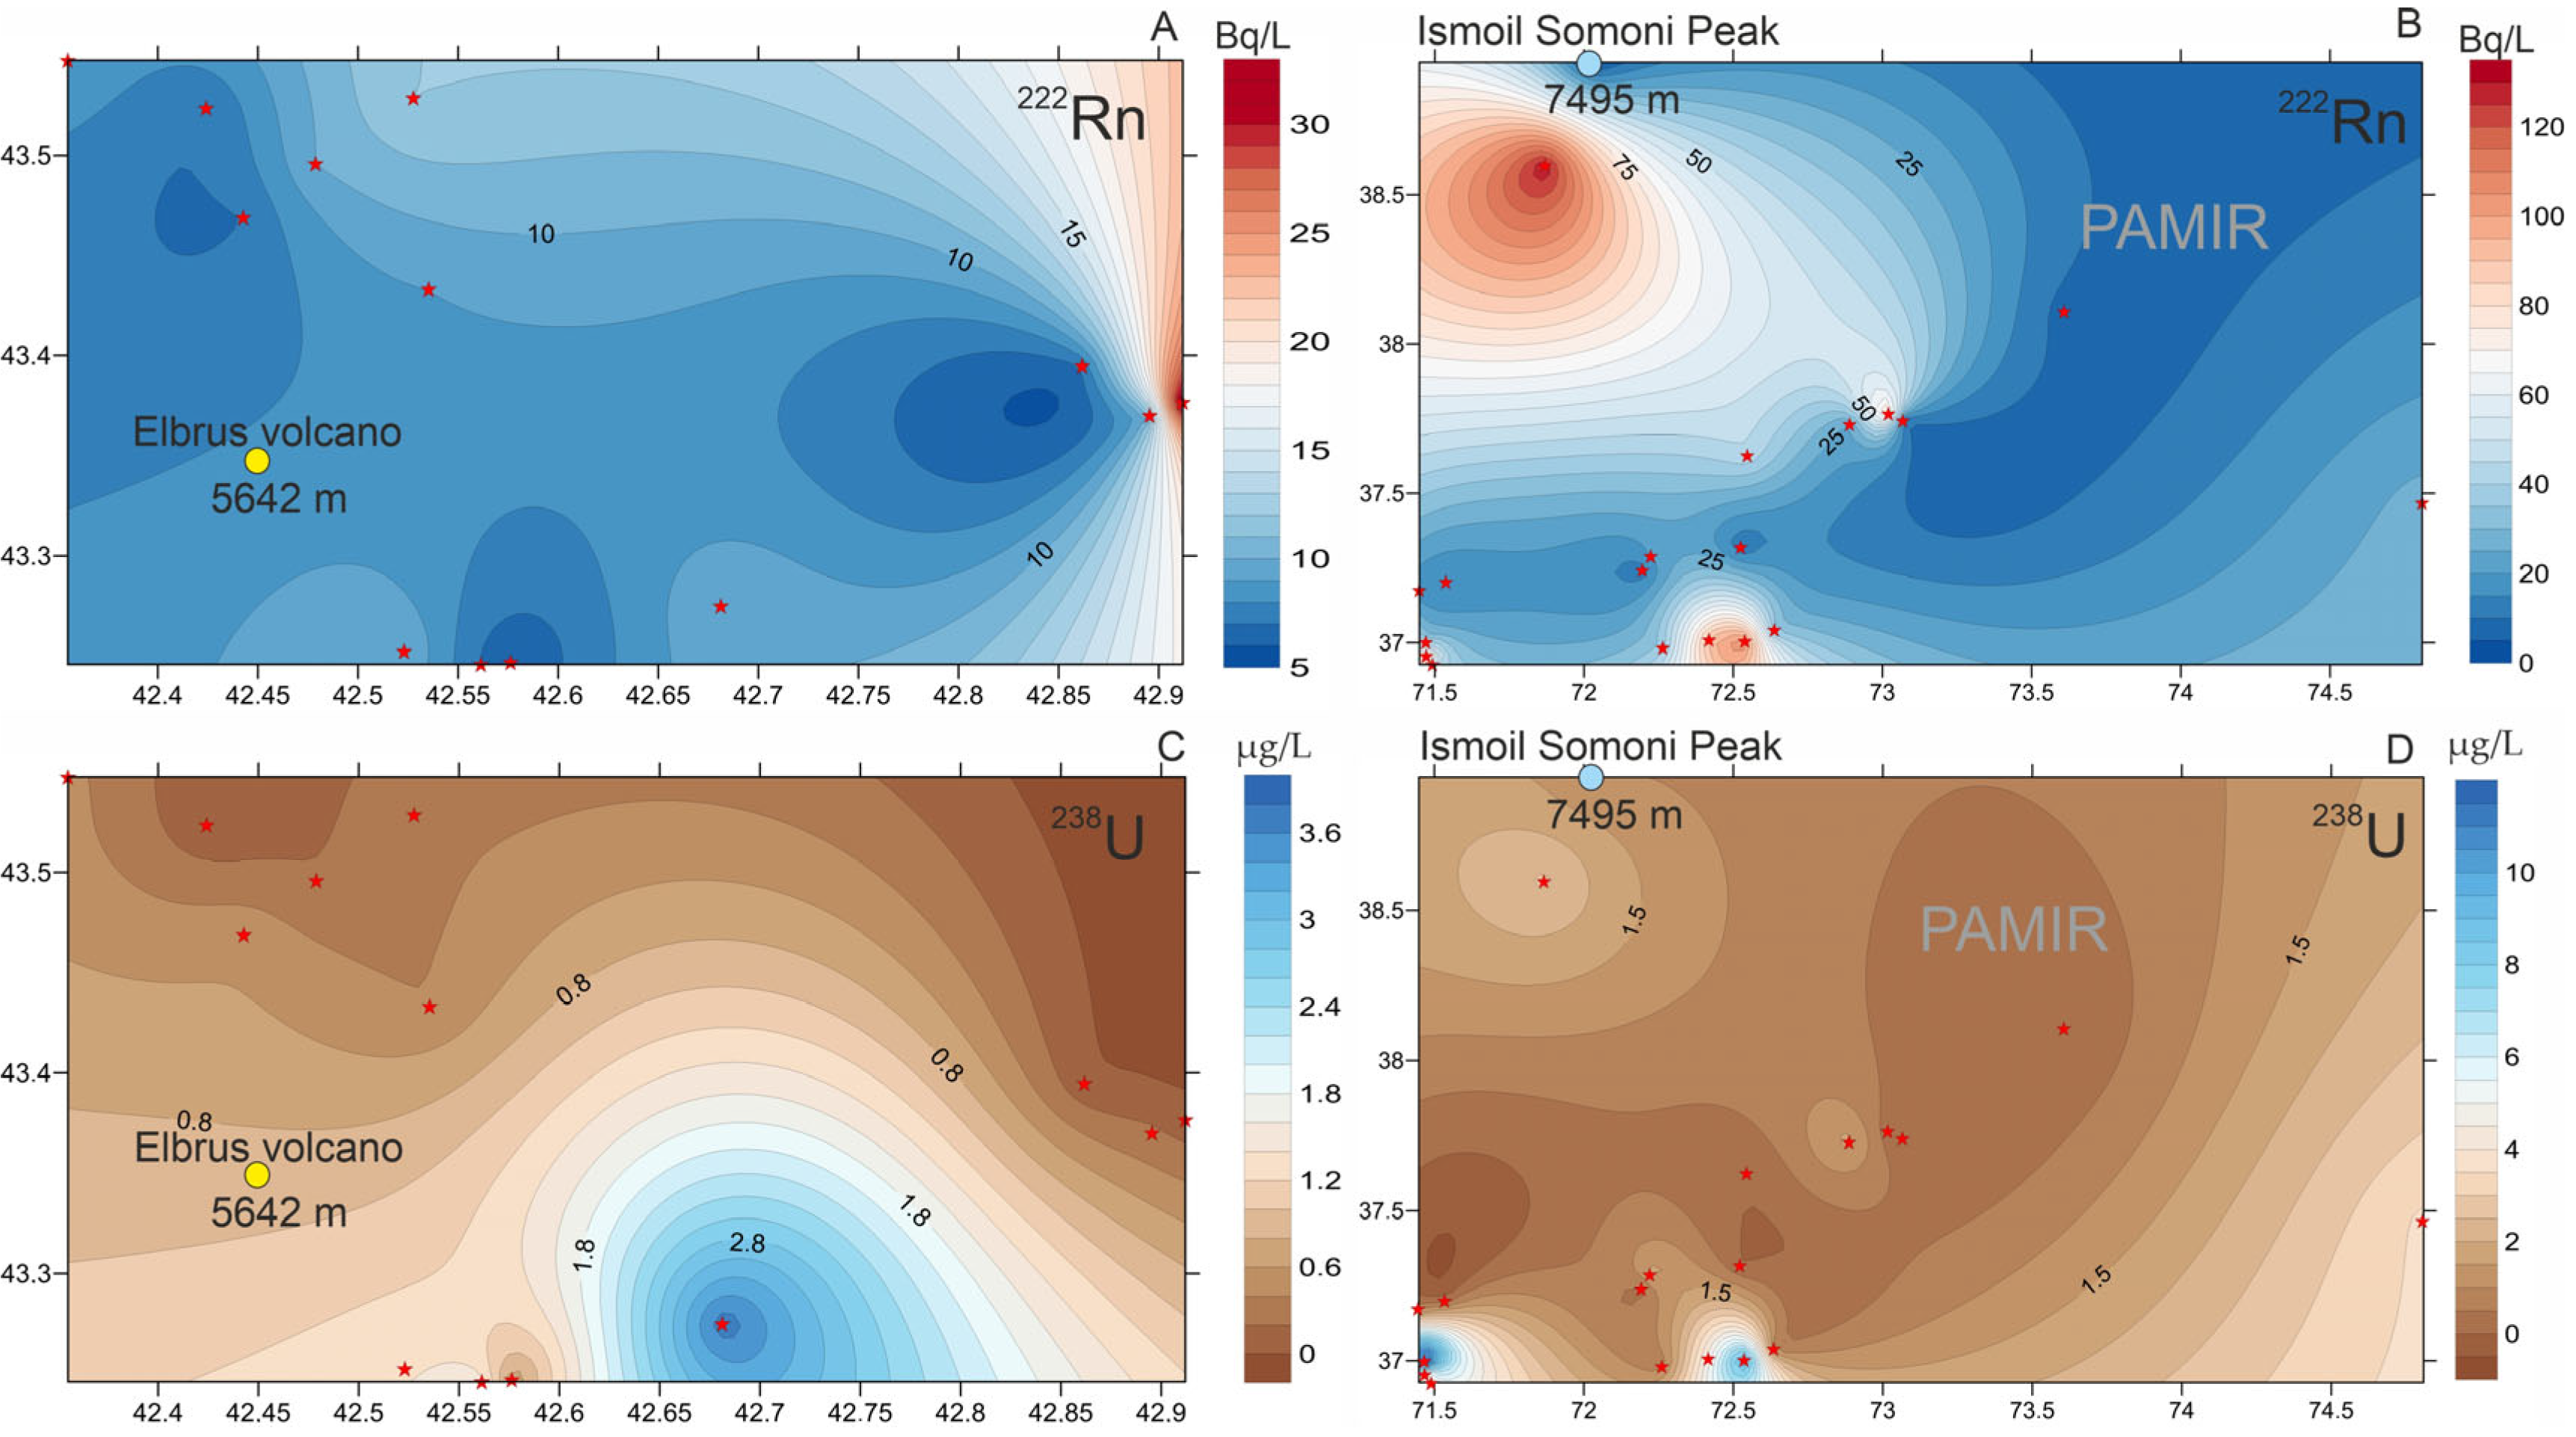
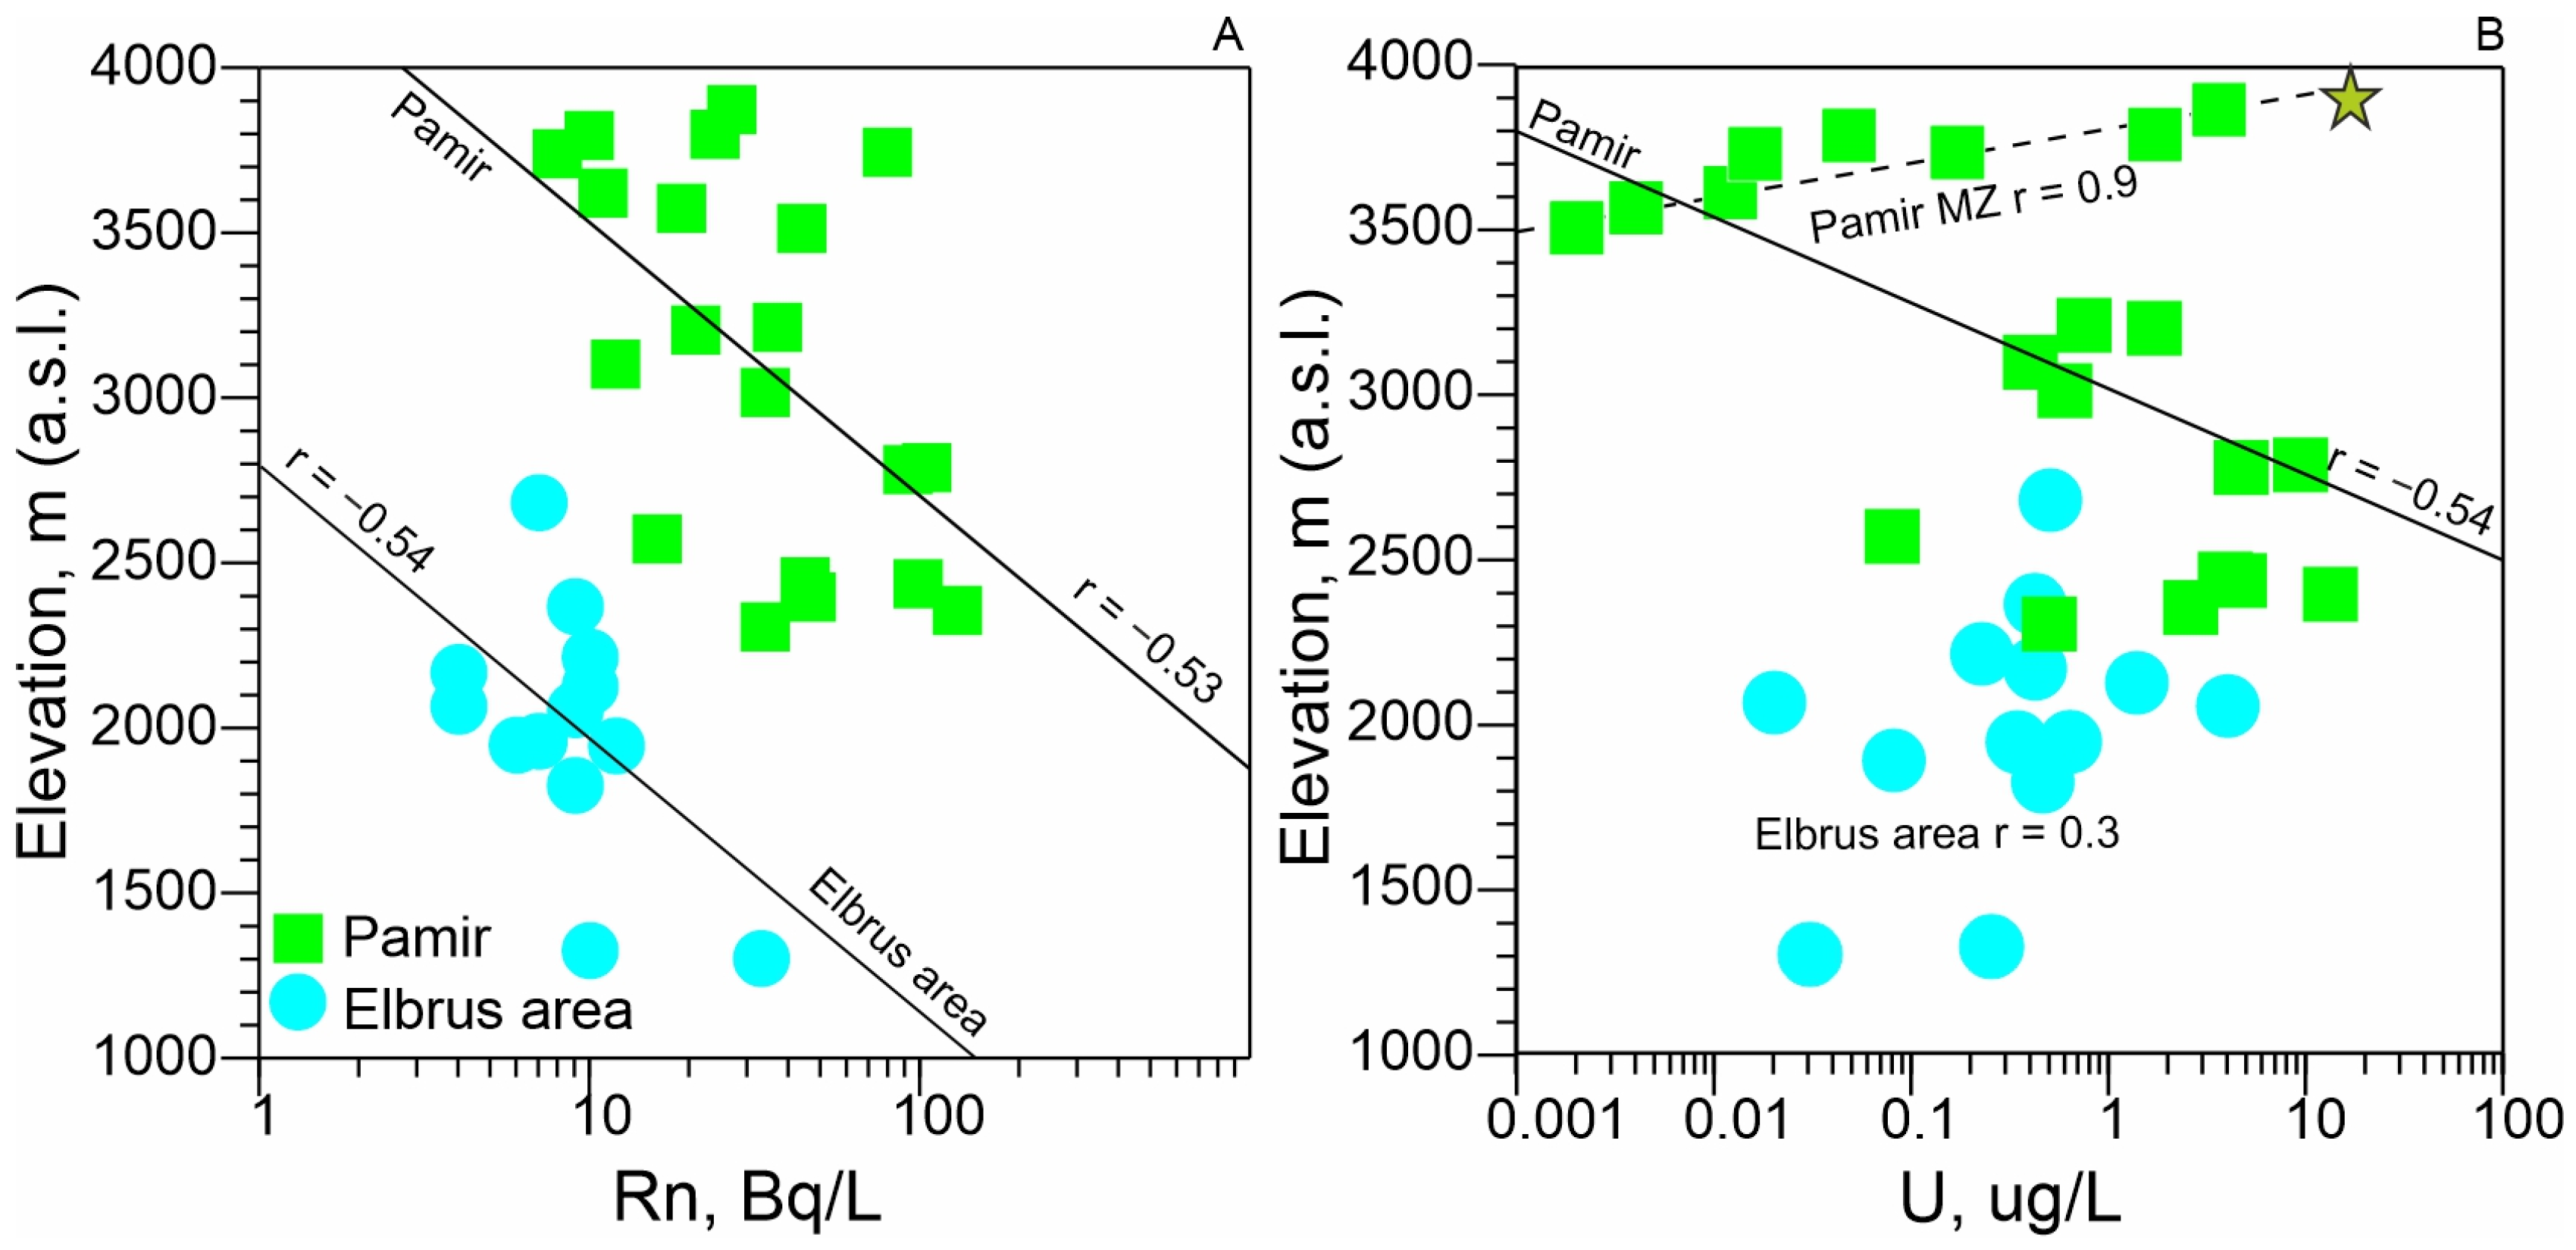
Altitude dependencies of uranium and radon distribution have been established. With increasing altitude, radon activity in groundwater decreases. This can be explained by both the physical properties of 222Rn (high density) and hydrogeological characteristics (low circulation rate exceeding the half-life of radon). On the contrary, the concentration of 238U tends to increase with increasing altitude of the mountain structure, which is associated with oxidizing conditions of the groundwater environment, favorable for its migration.
3.
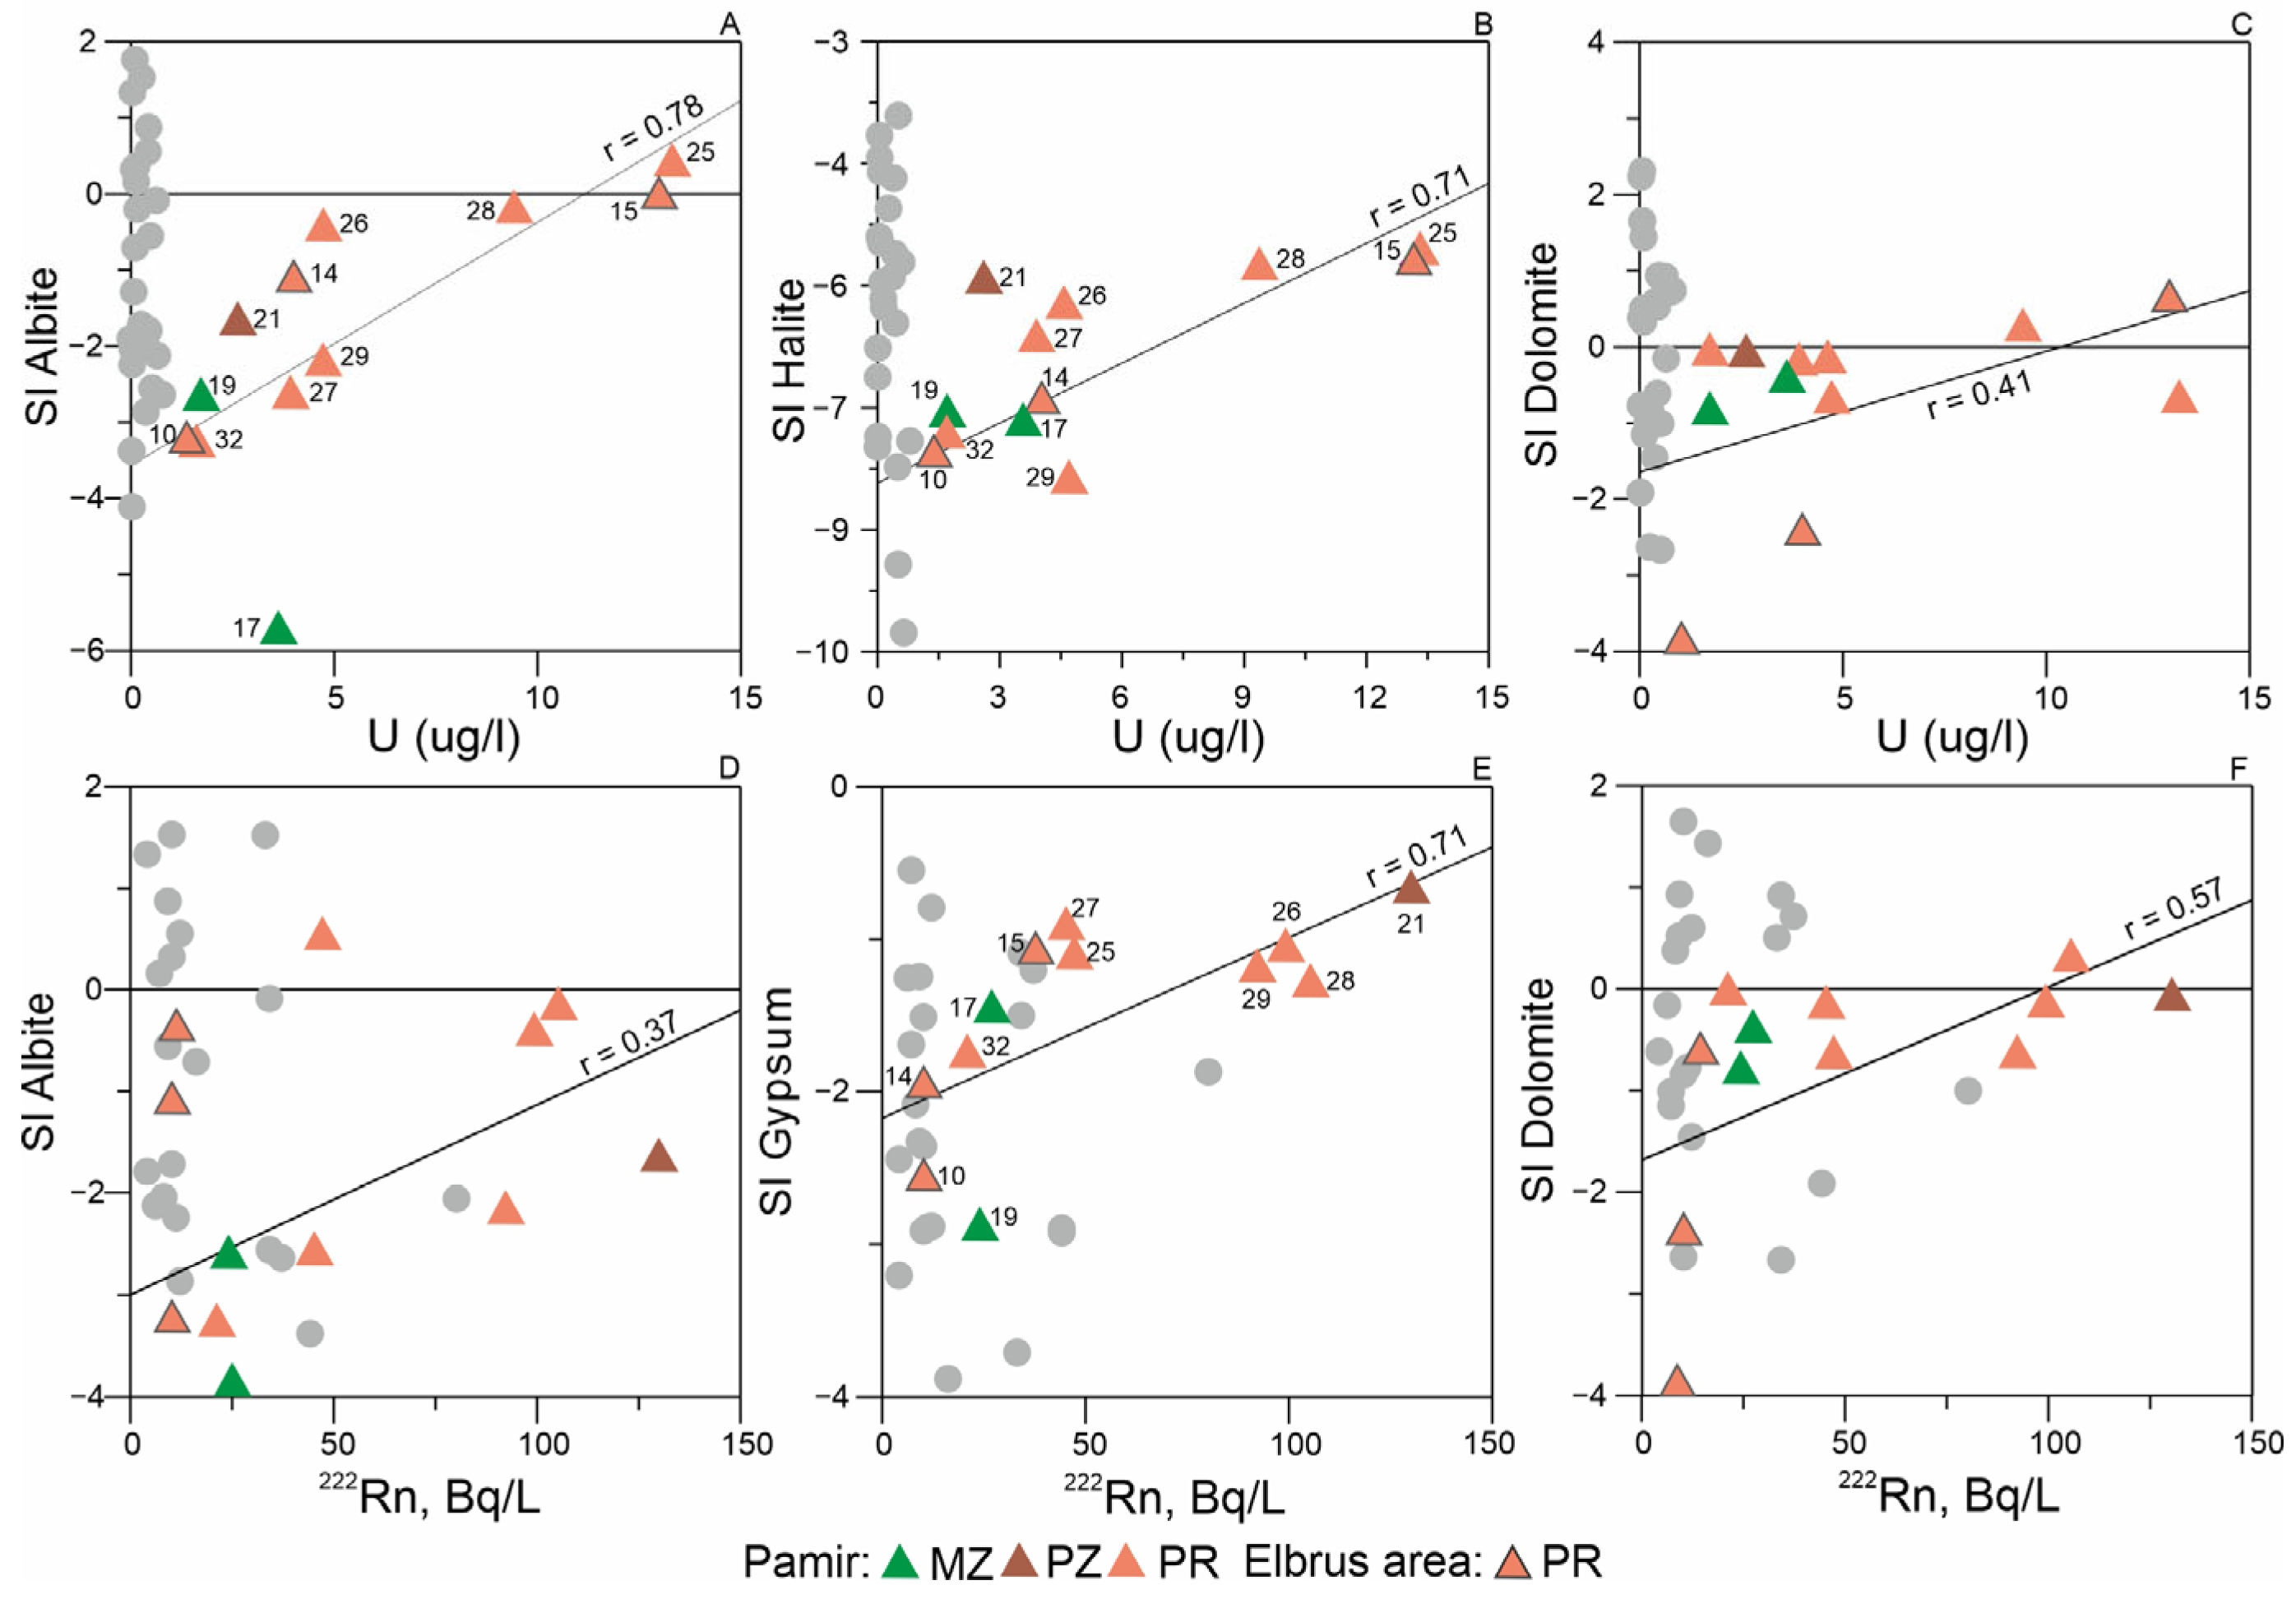
Thermodynamic calculations revealed key processes influencing uranium and radon incorporation into groundwater. The results demonstrate that: Uranium mobilization is controlled by water-aluminosilicate interactions, which are enhanced in the presence of CO2; Radon activity is governed by both aluminosilicate and evaporite interactions. These processes are particularly pronounced in Pamir waters due to abundant marine-origin rocks. In contrast, the Elbrus region shows generally low radon concentrations due to limited evaporite distribution in its upper geological sections.
4.
The obtained data align well with previous studies, confirming that waters in the Elbrus region exhibit mantle-derived signatures, whereas Pamir waters reflect intracrustal melting processes. Pamir springs show low 3He/4He ratios and elevated 222Rn levels, consistent with a dominant crustal radiogenic contribution. In contrast, Elbrus groundwaters display higher 3He/4He values, indicating mantle input—a feature typical of regions with high heat flow.
5.
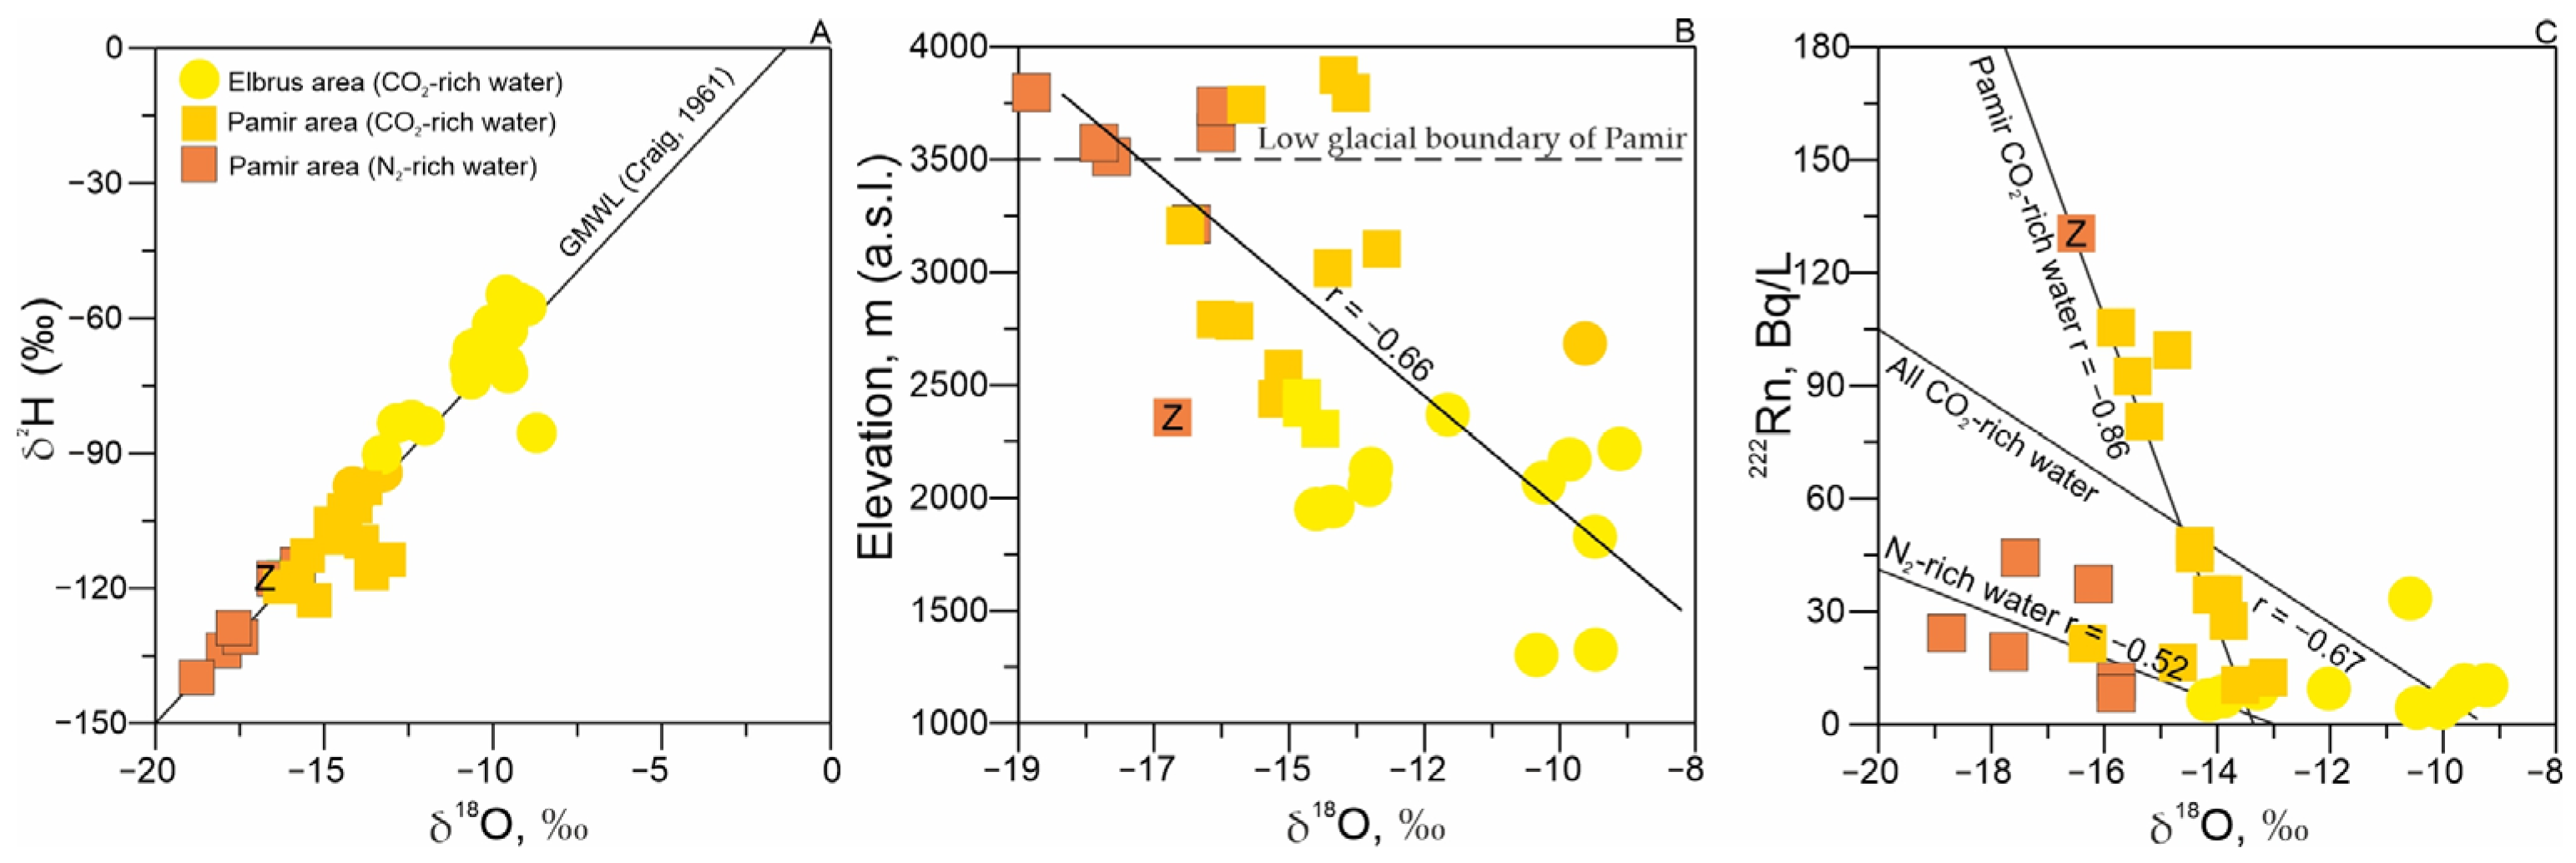
It was found that radon activity in high-altitude mineral waters (2300–3792 m above sea level) has been linked to isotopic composition, temperature, and gas content. Such effects had not previously been reported in high-mountain mineral waters. The observed correlations suggest complex physical processes governing radon distribution, which may serve as potential indicator characteristics. However, further research is needed to fully elucidate these mechanisms.
The strongest radon–δ18O correlation occurs in CO2-rich Pamir waters, implying that radon is primarily transported by isotopically light (glacial) waters. As the isotopic composition becomes heavier (due to mixing with atmospheric precipitation), radon concentrations decrease.
6.
Health risk assessments of the Pamir and Elbrus mineral waters have shown that neither uranium nor radon negatively impacts human health. Concentrations of 238U do not exceed drinking water limits (15–30 μg/L). Studies confirm that at altitudes above 3000 m, radon activity in groundwater is very low, ensuring safe human exposure levels. However, in intermountain basins at lower altitudes (~2300 m), radon concentrations in water can rise significantly, necessitating further study and monitoring.

Author Contributions

Conceptualization, G.C. and V.L.; methodology, G.C., N.K. and V.L.; software, N.K. and A.P.; validation, F.S., V.L. and G.C.; resources, G.C. and F.S.; writing—original draft preparation, G.C.; visualization, G.C.; supervision, V.L.; project administration, G.C.; funding acquisition, G.C. All authors have read and agreed to the published version of the manuscript.

Funding

This research was funded by the Russian Science Foundation, grant No. 24-27-00005.

Data Availability Statement

Data are contained within the article.

Acknowledgments

The authors thank numerous field assistants for their support and the local population and municipal authorities for their collaboration.

Conflicts of Interest

The authors declare no conflicts of interest.

References

  1. Quattrini, S.; Pampaloni, B.; Brandi, M.L. Natural mineral waters: Chemical characteristics and health effects. Clin. Cases Miner. Bone Metab. 2016, 13, 173–180. [Google Scholar] [CrossRef] [PubMed]
  2. Routh, H.B.; Bhowmik, K.R.; Parish, L.C.; Witkowski, J.A. Balneology, mineral water, and spas in historical perspective. Clin. Dermatol. 1996, 14, 551–554. [Google Scholar] [CrossRef] [PubMed]
  3. Albertini, M.C.; Dachà, M.; Teodori, L.; Conti, M.E. Drinking mineral waters: Biochemical effects and health implications—The state-of-the-art. Int. J. Environ. Health 2007, 1, 153–169. [Google Scholar] [CrossRef]
  4. Protano, C.; Vitali, M.; De Giorgi, A.; Marotta, D.; Crucianelli, S.; Fontana, M. Balneotherapy using thermal mineral water baths and dermatological diseases: A systematic review. Int. J. Biometeorol. 2024, 68, 1005–1013. [Google Scholar] [CrossRef] [PubMed]
  5. Teixeira, F.J.; Gomes, C.S.F. Mineral Water: Essential to Life, Health, and Wellness. In Minerals Latu Sensu and Human Health; Gomes, C., Rautureau, M., Eds.; Springer: Cham, Switzerland, 2021. [Google Scholar] [CrossRef]
  6. Kryshev, A.I.; Sazykina, T.G.; Pavlova, N.N. Issues of establishing the permissible discharge levels of 238U to surface waters taking into account its radiation and toxic effects. Radiat. Hyg. 2020, 13, 41–46. [Google Scholar] [CrossRef]
  7. Chelnokov, G.; Lavrushin, V.; Ermakov, A.; Guo, Q.; Aidarkozhina, A.; Kharitonova, N.; Bragin, I.; Pavlov, A. Toxic Element Contamination Sources in the Surface and Groundwater of the Elbrus Region: Geochemistry and Health Risks. Water 2024, 16, 701. [Google Scholar] [CrossRef]
  8. Le Druillennec, T.; Ielsch, G.; Bour, O.; Tarits, C.; Tymen, G.; Alcalde, G.; Aquilina, L. Hydrogeological and geochemical control of the variations of 222Rn concentrations in a hard rock aquifer: Insights into the possible role of fracture-matrix exchanges. Appl. Geochem. 2010, 25, 345–356. [Google Scholar] [CrossRef]
  9. Fonollosa, E.; Peñalver, A.; Borrull, F.; Aguilar, C. Radon in spring waters in the south of Catalonia. J. Environ. Radioact. 2016, 151, 275–281. [Google Scholar] [CrossRef] [PubMed]
  10. Cho, B.-W.; Kim, D.-S.; Kim, M.-S.; Hwang, J.-H.; Choo, C.-O. Hydrogeochemical Characteristics of Uranium and Radon in Groundwater from the Goesan Area of the Ogcheon Metamorphic Belt (OMB), Korea. Sustainability 2021, 13, 11261. [Google Scholar] [CrossRef]
  11. Rogers, A.S. Physical behavior and geologic control of radon in mountain streams. U.S. Geol. Surv. Bull. 1958, 1052-E, 187–211. [Google Scholar]
  12. Szabo, Z.; Zapecza, O.S. Geologic and geochemical factors controlling uranium, radium-226, and radon-222 in groundwater, Newark Basin, New Jersey. In Field Studies of Radon in Rocks, Soils. and Water; Gundersen, L.C.S., Wanty, R.B., Eds.; C.K. Smoley: Boca Raton, FL, USA, 1991; pp. 243–265. [Google Scholar]
  13. Cecil, L.D.; Green, J.R. Radon-222. In Environmental Tracers in Subsurface Hydrology; Cook, P.G., Herczeg, A.L., Eds.; Springer: Boston, MA, USA, 2000. [Google Scholar] [CrossRef]
  14. Andrews, J.N.; Wood, D.F. Mechanism of radon release in rock matrices and entry into groundwaters. Inst. Min. Metall. Trans. 1972, B81, 198–209. [Google Scholar]
  15. Wood, W.W.; Kraemer, T.F.; Shapiro, A. Radon (222Rn) in ground water of fractured rocks: A diffusion/ion exchange model. Groundwater 2004, 42, 552–567. [Google Scholar] [CrossRef] [PubMed]
  16. DeSimone, L.A.; McMahon, P.B.; Rosen, M.R. The Quality of Our Nation’s Waters: Water Quality in Principal Aquifers of the United States, 1991–2010 (Circular 1360); United States Geological Survey: Reston, VA, USA, 2014. [CrossRef]
  17. Sukanya, S.; Noble, J.; Joseph, S. Application of radon (222Rn) as an environmental tracer in hydrogeological and geological investigations: An overview. Chemosphere 2022, 303 Part 3, 135141. [Google Scholar] [CrossRef] [PubMed]
  18. Girault, F.; Perrier, F. The Syabru-Bensi hydrothermal system in central Nepal: 2. Modeling and significance of the radon signature. J. Geophys. Res. Solid Earth 2014, 119, 4056–4089. [Google Scholar] [CrossRef]
  19. Okrostsvaridze, A.; Tormey, D.; Gabrielashvili, R. New Insight into Formation of Tskaltubo Radon-Containing Healing Springs, Georgia, the Caucasus. Int. J. Geol. Earth Sci. 2025, 11, 17–22. [Google Scholar] [CrossRef]
  20. Cosma, C.; Moldovan, M.; Dicu, T.; Kovacs, T. Radon in water from Transylvania (Romania). Radiat. Meas. 2008, 43, 1423–1428. [Google Scholar] [CrossRef]
  21. Kozlowska, B.; Walencik, A.; Dorda, J.; Zipper, W. Radon in groundwater and dose estimation for inhabitants in Spas of the Sudety Mountain area. Pol. Appl. Radiat. Isot. 2010, 68, 854–857. [Google Scholar] [CrossRef] [PubMed]
  22. Chelnokov, G.A.; Lavrushin VYu Bragin, I.V.; Kharitonova, N.A.; Bushkareva KYu Pavlov, A.A.; Chelnokova, B.I. Radon Concentrations in Mineral Waters of the Sikhote-Alin, Primorsky Krai. Russ. J. Pac. Geol. 2023, 17, 284–296. [Google Scholar] [CrossRef]
  23. Kharitonova, N.A.; Sokolovskaya, M.A.; Baranovskaya, E.I.; Chelnokov, G.A.; Karabtsov, A.A.; Chernoshchekov, L.N.; Bragin, I.V. Trace elements in thermal waters of the northern Tien Shan: Distribution and fate. Mosc. Univ. Bull. Ser. 4 Geol. 2024; 79, 632–648, (In Russian). [Google Scholar] [CrossRef]
  24. Demonova, A.; Kharitonova, N.; Sardorov, A. Chemical composition of thermal waters of Khoja-Obi-Garm Spa. In Proceedings of the 42 World Congress of the International Society of Medical Hydrology and Climatology, Moscow, Russia, 5–8 June 2017; p. 39. [Google Scholar]
  25. Khan, F.; Khattak, S.A.; Khan, W.; Ullah, Z.; Alig, F.; Wan, Q. Concentrations of Radon in the Water of Balakot-Bagh Fault Line Region, Lesser Himalayas, North Pakistan. Dokl. Earth Sci. 2024, 517 Pt 1, 1262–1268. [Google Scholar] [CrossRef]
  26. Chelnokov, G.; Lavrushin, V.; Bragin, I.; Abdullaev, A.; Aidarkozhina, A.; Kharitonova, N. Geochemistry of Thermal and Cold Mineral Water and Gases of the Tien Shan and the Pamir. Water 2022, 14, 838. [Google Scholar] [CrossRef]
  27. Lavrushin, V.Y. Subsurface Fluids of the Greater Caucasus and Its Surrounding; Transactions of the Geological Institute; Nauka: Moscow, Russia, 2012; p. 348. (In Russian)
  28. Krainov, S.R.; Petrova, N.G. Minor elements in mineral waters of the Pamir. Geochem. Int. 1962, 4, 366. (In Russian) [Google Scholar]
  29. Kireeva, T.A.; Salikhov, F.S.; Bychkov, A.Y.; Kharitonova, N.A. Chemical composition of waters and formation conditions of some thermal springs in Tajikistan. Geochemistry 2020, 65, 379–391. [Google Scholar] [CrossRef]
  30. Soloviev, S.G.; Kryazhev, S.G.; Dvurechenskaya, S.S.; Kryazhev, V.S.; Emkuzhev, M.S.; Bortnikov, N.S. The superlarge Tyrnyauz skarn W-Mo and stockwork Mo(-W) to Au(-Mo, W, Bi, Te) deposit in the Northern Caucasus, Russia: Geology, geochemistry, mineralization, and fluid inclusion characteristics. Ore Geol. Rev. 2021, 138, 2–26. [Google Scholar] [CrossRef]
  31. Mechie, J.; Yuan, X.; Schurr, B.; Schneider, F.; Sippl, C.; Ratschbacher, L.; Minaev, V.; Gadoev, M.; Oimahmadov, I.; Abdybachaev, U.; et al. Crustal and uppermost mantle velocity structure along a profile across the Pamir and southern Tien Shan as derivedfrom project TIPAGE wide-angle seismic data. Geophys. J. Int. 2012, 188, 385–407. [Google Scholar] [CrossRef]
  32. Gurbanov, A.G.; Sobisevich, A.L.; Sobisevich, L.E.; Nechaev, Y.N.; Arbuzkin, V.N. Prutski Activity of Elbrus Volcano (North Caucasus). Russ. J. Earth Sci. 2004, 6, 279–291. [Google Scholar] [CrossRef]
  33. Fletcher, P.J.; Jacobus, F.S. Determination of carbonate and hydrogencarbonate by titration using sequential injection analysis. Anal. Chim. Acta 2003, 485, 187–194. [Google Scholar] [CrossRef]
  34. Karandashev, V.K.; Leikin, A.Y.; Khvostikov, V.A.; Kutseva, N.K.; Pirogova, S.V. Water Analysis by Inductively Coupled Plasma Mass Spectrometry. Inorg. Mater. 2016, 52, 1391–1404. [Google Scholar] [CrossRef]
  35. Arnorsson, S.; Bjarnasson, J.O.; Giroud, N.; Gunnarsson, I.; Stefansson, A. Sampling and analysis of geothermal fluids. Geofluids 2006, 6, 203–216. [Google Scholar] [CrossRef]
  36. Radon Monitot Alfarad+. User’s Manual. Moscow. 2021. Available online: https://ntm.ru/UserFiles/File/document/ION/Aplus/Alpharad_manual.pdf (accessed on 3 July 2025). (In Russian).
  37. EURATOM Council Directive 2013/51/Euratom Laying Down Requirements for the Protection of the Health of the General Public with Regard to Radioactive Substances in Water Intended for Human Consumption. 2013. Available online: https://eur-lex.europa.eu/LexUriServ/LexUriServ.do?uri=OJ:L:2013:296:0012:0021:EN:PDF (accessed on 3 July 2025).
  38. Novikov, D.A.; Kopylova, Y.G.; Pyryaev, A.N.; Maksimova, A.A.; Derkachev, A.S.; Sukhorukova, A.F.; Dultsev, F.F.; Chernykh, A.V.; Khvashchevskaya, A.A.; Kalinkin, P.N.; et al. Radon-rich waters of the Tulinka aquifers, Novosibirsk, Russia. Groundw. Sustain. Dev. 2023, 20, 100886. [Google Scholar] [CrossRef]
  39. AquaChem. User’s Manual, v.5.11; Schlumberger: Houston, TX, USA, 2011. [Google Scholar]
  40. Parkhurst, D.L.; Appelo, C.A.J. A Computer Program+ for Speciation, Batch-Reaction, One-Dimensional Transport, and Inverse Geochemical Calculations; U.S. Geological Survey: Denver, CO, USA, 1999; p. 312.
  41. Girault, F.; Viveiros, F.; Silva, C.; Thapa, S.; Pacheco, J.E.; Adhikari, L.B.; Bhattarai, M.; Koirala, B.P.; Agrinier, P.; France-Lanord, C.; et al. Radon signature of CO2 flux constrains the depth of degassing: Furnas volcano (Azores, Portugal) versus Syabru-Bensi (Nepal Himalayas). Sci. Rep. 2022, 12, 10837. [Google Scholar] [CrossRef] [PubMed]
  42. Perelman, A.I. Geochemistry of Elements in the Hypergenesis Zone; Nedra: Moscow, Russia, 1972; 288p. (In Russian) [Google Scholar]
  43. Yun, U.; Kim, M.S.; Jeong, D.H.; Hwang, J.H.; Cho, B.W. Uranium and radon concentrations in groundwater of the Daejeon granite area: Comparison with other granite areas. J. Eng. Geol. 2018, 28, 631–643. [Google Scholar]
  44. Kharaka, Y.; Hitchon, B.; Hanor, J. Groundwater and Petroleum; The Groundwater Project: Guelph, ON, Canada, 2023; 375p. [Google Scholar] [CrossRef]
  45. Gaskova, O.L.; Bukaty, M.B. Solubility of uranium dioxide during underground disposal of radioactive wastes and spent nuclear fuel. Chem. Sustain. Dev. 2004, 12, 649–655. [Google Scholar]
  46. Smedley, P.L.; Kinniburgh, D.G. Uranium in natural waters and the environment: Distribution, speciation and impact. Appl. Geochem. 2023, 148, 105534. [Google Scholar] [CrossRef]
  47. Schubert, M.; Paschke, A.; Lieberman, E.; Burnett, W. Air-water partitioning of Rn-222 and its dependence on water temperature and Salinity. Environ. Sci. Technol. 2012, 46, 3905–3911. [Google Scholar] [CrossRef] [PubMed]
  48. Nevinsky, I.; Tsvetkova, T.; Nevinskaya, E. Measurement of radon in ground waters of the Western Caucasus for seismological application. J. Environ. Radioact. 2015, 149, 19–35. [Google Scholar] [CrossRef] [PubMed]
  49. Demonova, A.Y.; Kharitonova, N.A.; Chelnokov, G.A.; Bragin, I.V.; Tarasenko, I.V. Microcomponent composition of low-mineralized nitrogen thermes of the Gissar Ridge (Pamir-Alay Mountain system). Bull. Tomsk. Polytech. Univ. Geo. Аssets Eng. 2019, 330, 7–20. [Google Scholar]
  50. Zuddas, P. Water-Rock Interaction Processes Seen through Thermodynamics. Elements 2010, 6, 305–308. [Google Scholar] [CrossRef]
  51. Wood, W. Hydrogeochemistry—A Journey of Discovery; The Groundwater Project: Guelph, ON, Canada, 2025; 262p. [Google Scholar] [CrossRef]
  52. Key, R.M.; Guinasso, M.L.; Schink, D.R. Emanation of 222Rn from marine sediments. Mar. Chem. 1979, 7, 221–250. [Google Scholar] [CrossRef]
  53. Bogomolov, G.V.; Gribik, Y.G. Radioactivity of Groundwater as a Search Criterion for Oil and Gas Potential (Using the Pripyat Trough as an Example) Minsk, Science and Technology. 1982. Available online: http://www.geolib.ru/OilGasGeo/1988/04/Stat/stat10.html (accessed on 4 July 2025). (In Russian).
  54. Liu, Q.; Tian, L.D.; Wang, J.L.; Wen, R.; Weng, Y.B.; Shen, Y.P.; Vladislav, M.; Kanaev, E. A study of longitudinal and altitudinal variations in surface water stable isotopes in West Pamir, Tajikistan. Atmos. Res. 2014, 153, 10–18. [Google Scholar] [CrossRef]
  55. Vasil’chuk, Y.; Chizhova, J.; Frolova, N.; Budantseva, N.; Kireeva, M.; Oleynikov, A.; Tokarev, I.; Rets, E.; Vasil’chuk, A. A variation of stable isotope composition of snow with altitude on the Elbrus mountain, Central Caucasus. Geogr. Environ. Sustain. 2020, 13, 172–182. [Google Scholar] [CrossRef]
  56. Plyusnin, A.M.; Zamana, L.V.; Shvartsev, S.L.; Tokarenko, O.G.; Chernyavskii, M.K. Hydrogeochemical peculiarities of the composition of nitric thermal waters in the Baikal Rift Zone. Russ. Geol. Geophys. 2013, 54, 495–508. [Google Scholar] [CrossRef]
  57. Wang, S.; Zhou, X.; Tian, J.; He, M.; Li, J.; Dong, J.; Li, L.; Li, Z.; Xing, L.; Zheng, G. Constraints on geological structures and dynamics along the Tian Shan-Pamir orogenic belt with helium isotopes in hot springs. Appl. Geochem. 2024, 160, 105859. [Google Scholar] [CrossRef]
  58. Aydarkozhina, A.S.; Lavrushin, V.Y.; Ermakov, A.V.; Chelnokov, G.A.; Zhang, L. CO2-rich thermal waters of the Neutrino research tunnel (Baksan Neutrino observatory, North Caucasus). Dokl. Earth Sci. 2024, 515, 526–534. [Google Scholar] [CrossRef]
  59. Sharif-Zade, V.B.; Verkhovskii, A.B.; Loktev, V.A.; Markov, I.M.; Meshik, A.P.; Shukolyukov, Y.A. Isotopes of noble gases in the nitrogen thermal waters and carbon dioxide waters of the southern Pamir. Geokhimiya 1988, 8, 1187–1198. (In Russian) [Google Scholar]
  60. Polyak, B.G.; Tolstikhin, I.N.; Yakovlev, L.E.; Marty, B.; Cheshko, A.L. Helium isotopes, tectonics and heat flow in the Northern Caucasus. Geochim. Cosmochim. Acta 2000, 64, 1925–1944. [Google Scholar] [CrossRef]
  61. US EPA (17 September 2013). “Basic Information About Radionuclides in Drinking Water”. Available online: http://water.epa.gov/drink/contaminants/basicinformation/radionuclides.cfm (accessed on 3 July 2025).
  62. WHO (World Health Organization). Uranium in Drinking Water, Background Document for Development of WHO Guide-Lines for Drinking-Water Quality, 3rd ed.; World Health Organization: Geneva, Switzerland, 2004; Volume 1, pp. 197–209. [Google Scholar]
  63. Federal Center of Hygiene and Epidemiology. Maximum Allowable Concentrations (MACs) of Chemicals in the Water of Water Objects Used for Drinking and Domestic Recreation Purposes; Federal Center of Hygiene and Epidemiology Publisher: Moscow, Russia, 2008; 11p. (In Russian) [Google Scholar]
  64. NRB 99/2009; Radiation Safety Standards. Federal Center for Hygiene and Epidemiology of Rospotrebnadzor: Moscow, Russia, 2009.
  65. Kulikov, G.V.; Zhevlakov, A.V.; Bondarenko, S.S. Mineral Therapeutic Waters of the USSR; A Reference Book; Nedra: Moscow, Russia, 1991. (In Russian) [Google Scholar]
  66. Nuccetelli, C.; Risica, S. Societe Francaise de Radioprotection—SFRP, BP72, 92263 Fontenay-aux-Roses Cedex (France). Radionu-clides in drinking water: The approach of the European Union, the World Health Organization and the US Environmental Protection Agency, from knowledge to action. In Proceedings of the Second European IRPA Congress on Radiation Protection—Radiation Protection, Paris, France, 15–19 May 2006. [Google Scholar]
  67. Malakootian, M.; Khashi, Z.; Iranmanesh, F.; Rahimi, M. Radon concentration in drinking water in villages nearby Rafsanjan fault and evaluation the annual effective dose. J. Radioanal Nucl.Chem. 2014, 302, 1167–1176. [Google Scholar] [CrossRef]
  68. Karpenko, E.I.; Sanzharova, N.I.; Spiridonov, S.I.; Serebryakov, I.S. Radioeco-logical situation in the area, where the former uranium mining company “Almaz” was located. Radiat. Risk 2009, 4, 73–81. (In Russian) [Google Scholar]
  69. Miklyaev, P.S.; Petrova, T.B.; Shchitov, D.V.; Sidyakin, P.A.; Murzabekov, M.A.; Marennyy, A.M.; Nefedov, N.A.; Sapozhnikov, Y.A. The results of long-term simultaneous measurements of radon exhalation rate, radon concentrations in soil gas and groundwater in the fault zone. Appl. Radiat. Isot. 2021, 167, 109460. [Google Scholar] [CrossRef] [PubMed]
  70. Fillimonova, E.; Kharitonova, N.; Baranovskaya, E.; Maslov, A.; Aseeva, A. Geochemistry and therapeutic properties of Caucasian mineral waters: A review. Environ. Geochem. Health 2022, 44, 2281–2299. [Google Scholar] [CrossRef] [PubMed]
Figure 1. An overview map of the location of the study sites (A), as well as the geological structures of the Elbrus area (B) and Pamir (C) (modified after [7,26]) with sampling sites (numbers according to Table 1). White triangles are CO2-rich mineral waters; black triangles are N2-rich mineral waters, numbers according to Table 1. Geological description of Elbrus area: 1—Neogene-Quaternary volcanic rocks (andesite, dacite); 2—Lower Jurassic sedimentary rocks (sandstone, siltstone, conglomerate); 3—Carboniferous sedimentary and volcanic rocks; 4—Devonian-Lower Carboniferous sedimentary and volcanic rocks; 5—Proterozoic crystalline schist, gneiss, migmatite; 6—Pleistocene granite; 7—Middle-Late Paleozoic granodiorite to granite; 8—Rock sampling point; 9—Quaternary volcanoes (inactive). Pamir: 1—Paleozoic intrusives and volcanic rocks; 2—Permotriassic igneous rocks; 3—Tertiary igneous rocks; 4—Jurassic granitoids; 5—Cretaceous granitoids; 6—Precambrian metamorphic strata; 7—The main tectonic dislocations; 8—Rock sampling point; 9—Salt lake Sasik-Kul.
Water 17 02211 g001
Figure 2. The main ion balance in the studied mineral waters of the Pamir and Elbrus area.
Water 17 02211 g002
Figure 3. Box and Whisker Plot for radionuclides in water from different host-rocks of the Pamir and Elbrus area.
Water 17 02211 g003
Figure 4. Spatial distribution of 222Rn and 238U in underground mineral waters of the Elbrus (A,C) and Pamir (B,D). Red stars—studied mineral springs.
Water 17 02211 g004
Figure 5. Dependence of radon (A) and uranium (B) concentration in mineral waters on the altitude of the springs location and geological age of the host rocks. Green star—uranium content in Sasik-Kul Lake (Pamir).
Water 17 02211 g005
Figure 6. Dependence of U concentrations in mineral waters of Pamir and Elbrus on physico-chemical parameters T (A), pH (B), and Eh (C).
Water 17 02211 g006
Figure 7. Correlations of 238U concentrations with 222Rn activity in mineral waters from the Pamir (A) and Elbrus (B) exhibit correlations dependent on geological environment.
Water 17 02211 g007
Figure 8. Representative backscattered electron images of 238U phases identified in water-bearing granites of the Elbrus area (A) and Pamir (B). Electron microscopic image and EMF spectrum of the composition (platinum deposition).
Water 17 02211 g008
Figure 9. Correlations of 238U and 222Rn concentration with saturation indices (SI) values: (A)—238U vs. Albite; (B)—238U vs. Halite; (C)—238U vs. Dolomite; (D)—222Rn vs. Albite; (E)—222Rn vs. Gypsum; (F)—222Rn vs. Dolomite.
Water 17 02211 g009
Figure 10. Stable isotope ratios in the mineral waters of the Pamirs and the Elbrus (A), the dependence of the δ18O on the elevation of the springs (B), and the radon activity in the water depending on the δ18O values (C). The color shows waters with a different composition of associated gases. Z—N2-rich Zagitor spring, former CO2-rich spring.
Water 17 02211 g010
Figure 11. 3He/4He versus 222Rn relationships for mineral springs of the Pamir and Elbrus regions. 3He/4He data are from [58,59,60]. R/Ra = (3He/4He)sample/(3He/4He)air. Symbols and numbers follow Figure 7 and Table 1.
Water 17 02211 g011
Figure 12. Estimates of annual effective doses (mSv/y) due to ingestion of 222Rn with mineral waters: (A)—for the Elbrus, and (B)—for Pamir. Yellow stars—mineral springs represent a very low risk level, equivalent to a cancer risk of 5.5 × 10⁻⁶. Red stars—caution is warranted as prolonged daily consumption may pose potential health risks.
Water 17 02211 g012
Table 1. The isotope-geochemical characteristics of mineral waters and associated gases of the studied highland regions. (*-data from [19]; Still—no babble gas). The age abbreviations: KZ—Cenozoic Era, PZ—Paleozoic Era, MZ—Mesozoic Era, PR—Proterozoic Eon. The ‘Host rocks’ refers to permeable geological formations (aquifers) that store and transmit groundwater.
NameAgeHost Rocks TypesElevation m. a.s.lTypeTDS, g/LT, °CpHEh,
mV
238UThδ18Oδ2H222RnN2CH4CO2Heδ13C(CO2)δ13C(CH4)
µg/LVSMOW, ‰Bq/L%‰, VPDB‰, VPDB
RockWaterAssociated Gases
Mineral Waters of the Elbrus (№ 1-15) and Pamir (№ 16-34) Areas
1Tyrnyauz park (well)KZGranites
(Eldzurty)
1296Na-HCO3-Cl5.4176.7−710.070.02−10.6−72.13321.41.2276.70.032−11−61.1
2Parametric (well)1320Na-HCO35.7176.4−500.250.002−9.6−70.5108.60.4590.40.001−7.3−22.3
3Shaushiib (spring)Granodiorite, andesite, dacite1820Na-HCO3-Cl10.6106.4430.460.007−9.6−54.990.950.01198.80.008−5.7
4Toxana (low spring)2163Na-HCO33.05.46.2−480.040.03−10.1−61.770.450.01298.90.001−5.8−63.1
5Ingushli (upper spring)PZSedimentary and volcanic rocks2209Na-HCO3-Cl1.96.45.9540.220.009−9.2−56.7100.70.00898.70.001-
6Toxana (upper spring)2677Ca-HCO3-SO41.97.26.31070.550.002−9.8−62.7758.30.1340.60.048−9.5−48.3
7Djilusu (well)2362Na-Ca-HCO33.1226.4−140.410.007−12.0−84.290.60.00598.90.001−5.8−18.3
8Neutrino tunnel (lake)PRGranites, gneisses, crystalline schists2060Na-HCO3-Cl8.5346.8920.050.02−8.4−83.971.80.3997.10.001−7.3−26
9Neutrino tunnel (spring)2060Na-Cl-HCO37.3416.7190.050.02−10.5−66.861.60.3997.10.001−8
10Terskol (spring)2121Ca-HCO3-Cl0.39.65.8611.370.34−13.3−94.5100.90.3897.30.001−7.2 *
11Poliana Narzanov (well)1954Ca-Na-HCO32.3126.1101.510.007−13.9−98.370.90.00197.80.003−8.3
12Badaevka (well)1942Ca-HCO31.3176.7390.630.002−14.2−97.56590.1537.70.009−9.2
13Ingushli (low spring)1940Na-HCO3-Cl1.5166.5320.350.005−7.9−50.21210.0198.80.0004−4.8
14Serebryni Klych (well)2050Ca-HCO30.6156.403.740.001−13.3−90.51062.8 *0.000230.1 *0.014−8.0 *
15Baksan (upper spring)1557Ca-HCO3-SO42.4146.1350.130.0001−10.6−73.86stillstillstillstill
16Madjura (spring)MZGranitoids3737Na-HCO31.5516.6−1400.170.006−15.3−1238040.93.5553.80.48−8.8−27.9
17Kizilrabat (spring)3867Ca-HCO31.3396.303.60.006−13.8−982719.60.1679.70.021−4.4
18Yashikul (geyser)3788Na-HCO34.0417.3−150.050.014−13.6−1171020.4797.20.11−5.7−29.2
19Sasik-Bulak (well)3792Na-HCO30.4328.7271.70.007−18.8−1402490.60.0018.10.36−16.9
20Djelandy (well)3568Na-SO40.4799.4−2240.0040.006−17.7−12944970.720.120.07−20.9−18.9
21Zagitor (spring)PZIgneous and
metamorphic
rocks
2349Na-Ca-SO4-Cl1.8217.1352.60.014−16.5−11713094.10.00023.20.3−12.6
22Modyan (spring)3733Na-HCO31.1637.5180.020.01−15.8−115888.30.748.10.12−13.9−17.6
23Garm-ChashmaPRGneisses, marbles,
migmatites, evaporites
2566Na-HCO33.3606.7−2810.080.006−14.7−109161.70.00997.80.001−4.5
24Sist (spring)2300Ca-HCO3-SO40.9115.9980.50.014−14.1−10234stillstillstillstills
25Barshor (spring)2390Ca-Na-HCO3-Cl2.9156.19513.30.006−14.3−1044720.00197.20.003−5.3
26AVJD (low spring)2431Ca-Na-HCO31.8316.41353.90.014−14.5−10699stillstillstillstillstill
27AVJD (well)2436Ca-HCO31.8356.2694.60.015−14.1−10345stillstillstillstillstill
28Sherigin (spring)2783Ca-Na-HCO3-Cl2.7346.309.40.010−15.8−1181050.30.00199.50.0001−5.2
29Vranch (spring)2776Ca-HCO31.9196.1264.70.005−15.5−113926.70.01392.90.053−5.8
30Sovetbond (spring)3096Na-HCO3-Cl6.1236.4−60.40.010−13.1−114120.280.000299.60.0009−7.9
31Sharalai (spring)3010Na-HCO32.7447.1710.60.011−13.9−110342.20.09970.01−5.7
32Kauk (spring)3199Ca-HCO30.5347.3761.70.003−16.3−12021stillstillstillstillstill
33Bibi-Fatima (spring)3208Ca-SO4-HCO30.7457.6830.750.005−16.2−11837stillstillstillstillstill
34Naspar (spring)3614Na-SO4-HCO30.6229.4−1010.010.009−15.8−11711980.080.110.3−10.9
Disclaimer/Publisher’s Note: The statements, opinions and data contained in all publications are solely those of the individual author(s) and contributor(s) and not of MDPI and/or the editor(s). MDPI and/or the editor(s) disclaim responsibility for any injury to people or property resulting from any ideas, methods, instructions or products referred to in the content.

