Abstract
Korean rockfish, Sebastes schlegeli, a coastal species, is vulnerable to pollutants such as microplastics and bacteria. While interactions between microplastics and other pollutants have been studied, little is known about microplastic and bacteria interactions. This study examined the effects of combined exposure to polystyrene microplastics in the form of microbeads (MB; 0.2 µm, 5 and 50 beads/L) and Streptococcus iniae (1 × 10⁵ and 1 × 10⁷ CFU/mL) for five days on oxidative stress and apoptosis in Korean rockfish. We assessed the mRNA expression and activity of oxidative stress markers (SOD, CAT, H2O2, NO, CYP1A1, GST), plasma LPO levels, and caspase-3 expression in liver tissue. Co-exposure to high MB and S. iniae concentrations significantly elevated oxidative stress and apoptosis markers, suggesting enhanced toxicity. This may result from MB facilitating pathogen transport into the fish, indicating microplastics can act as vectors for bacterial infection in aquatic environments.
1. Introduction
Plastic pollution has emerged as a severe global challenge. Because of increasing plastic consumption and improper waste-disposal practices, excessive amounts of plastic debris have accumulated in marine environments, which consequently harm marine ecosystems [1]. Among plastic debris, small fragments measuring less than 5 mm are defined as microplastics, and are divided by origin into primary and secondary types. Primary microplastics are particles such as those found in personal care products that are intentionally manufactured in micro-sizes for a wide variety of industrial applications. Conversely, larger plastic items gradually fragment and degrade into secondary microplastics because of environmental factors like temperature fluctuations, wave action, and UV-B radiation [2]. Despite removal efficiencies exceeding 90% in wastewater treatment plants (WWTPs), significant quantities of microplastics are nevertheless released into aquatic environments. Consequently, microplastic pollution poses a substantial problem, particularly in coastal marine areas [3,4]. Fish living in microplastic-laden settings continuously ingest these particles, which promotes their bioaccumulation. This allows microplastics to penetrate the food chain, eventually transferring to humans, thereby constituting a major potential risk to the integrity of aquatic life and human welfare [5].
Due to their hydrophobic surface properties, microplastics have a high potential for the adsorption and concentration of pollutants such as heavy metals, polycyclic aromatic hydrocarbons (PAHs), and bacteria [6]. Within marine environments, microplastics provide surfaces that act as substrates for the attachment of a diverse array of microorganisms, including bacteria. Subsequent colonization leads to biofilm formation on microplastic surfaces [7]. Not only are these biofilm-coated microplastics more likely to be mistaken for food and ingested by fish, their subsequent bioaccumulation can also adversely impact physiological functions [8]. Coastal areas are susceptible to pollution from external sources, including microplastics, and have diverse marine environments. Notably, the Korean rockfish, Sebastes schlegeli, a commercially significant aquaculture species in South Korea, is extensively cultured in marine net cages within these coastal zones [9]. The high-density aquaculture conditions, often followed in pollution-prone coastal areas, may induce chronic stress in Korean rockfish. This stress is a major factor contributing to increased disease susceptibility. Streptococcus iniae represents the key bacterial pathogen leading to major economic impact on the Korean rockfish aquatic cultivation domain [10,11]. S. iniae is a Gram-positive bacterium and the causative agent of streptococcosis, which can cause infections in marine fish species [12]. When S. iniae afflicts fish, they typically present with indicators like disorientation, lethargy, ulceration, and exophthalmia. In severe cases, infection can lead to mortality, resulting in substantial economic losses to the aquaculture industry [13].
Fish exposed to bacteria and external pollutants such as microplastics generate reactive oxygen species (ROS) and reactive nitrogen species (RNS) intracellularly, leading to oxidative stress [14,15]. ROS include species such as hydrogen peroxide (H2O2), hydroxyl radical (OH−), and superoxide anion (O2−), while RNS include nitric oxide (NO) and nitrogen dioxide (NO2) [16]. Excessive intracellular accumulation of ROS and RNS can induce lipid peroxidation (LPO) and apoptosis, exerting detrimental effects on organisms [14]. To prevent such adverse outcomes, organisms can eliminate excessive ROS production using antioxidants. Key antioxidant enzymes include superoxide dismutase (SOD) and catalase (CAT) [17]. The enzyme SOD promotes the disproportionation of O2− into O2 and H2O2. The produced H2O2 then undergoes decomposition by CAT in the cytoplasm, yielding nontoxic water (H2O) [17]. Furthermore, external pollutants typically stimulate the activity of cytochrome P450 family 1, subfamily A, polypeptide 1 (CYP1A1), and glutathione S-transferases (GST) within the fish body, inducing oxidative stress in the liver tissue [18,19].
CYP1A1 is readily activated in response to external pollutants, and is thus frequently employed as a biomarker in environmental toxicology studies. When microplastics and bacteria enter the bodies of fish exposed to contaminated environments, CYP1A1 is activated in the liver tissue as a part of Phase I detoxification. Phase II detoxification involves the utilization of antioxidant enzymes to eliminate ROS [20]. GST plays a protective role by reacting with glutathione (GSH) to eliminate toxic metabolites and inhibit LPO caused by oxidative stress, thereby protecting cells. Moreover, GST plays a crucial role in maintaining the intracellular antioxidant defense system when ROS production is increased by external pollutants [21]. However, excessive generation of ROS that is not eliminated by this antioxidant defense system can still induce LPO and apoptosis. LPO, which is involved in lipid oxidation, and brings about the formation of toxic ketones and aldehydes, is thus used as a key indicator of oxidative stress [22]. Apoptosis plays a vital role in the maintenance of tissue homeostasis by removing damaged or infected cells. This process involves caspases, differentiated by how they work into initiator caspases (e.g., caspase-2, -8, -9) and executioner caspases (e.g., caspase-3, -6, -7) [23]. These caspases are activated via extrinsic and intrinsic pathways. Notably, caspase-3 is involved in both pathways and performs a critical function in the apoptotic execution phase. Activation of caspase-3 induces downstream events such as nuclear envelope breakdown, chromatin condensation, and DNA fragmentation, thereby promoting apoptosis [24].
While many studies have explored the physiological impacts of microplastic and heavy metal interactions on fish, investigation into the outcomes of simultaneous exposure to microplastics and bacteria continues to be scarce [22,25]. This study sought to explore the impact of simultaneous exposure to microplastics and S. iniae on oxidative stress and apoptosis in Korean rockfish, a species inhabiting coastal zones prone to contamination with external pollutants such as microplastics. Although the immersion method is commonly employed in bacterial infection studies to simulate natural infection pathways, it has limitations in consistently and uniformly inducing S. iniae infection in experimental subjects [26]. Consequently, to ensure consistent and stable pathogen delivery, we used intraperitoneal (IP) injection. This approach allowed a more precise evaluation of the physiological responses of Korean rockfish exposed to microplastics and subsequently challenged with the pathogen via IP injection. Based on this experimental design, we evaluated the alterations in the oxidative stress status of Korean rockfish by investigating the mRNA levels of genes tied to oxidative stress, measuring the activity of relevant enzymes, and utilizing both in situ hybridization and terminal deoxynucleotidyl transferase dUTP nick-end labeling (TUNEL) assays.
2. Materials and Methods
2.1. Experimental Organism
Specimens of Korean rockfish S. schlegeli were obtained from a commercial aquaculture operation located in Tongyeong, Gyeongsangnam-do, Republic of Korea. The experimental subjects, characterized by an average total length of 14.3 ± 1.5 cm and an average mass of 40.5 ± 14.2 g, were subjected to a seven-day acclimation period within 300 L aquariums employing recirculating filtration systems. During this acclimation phase, the water temperature and salinity were precisely controlled at 20 ± 0.4 °C and 34 ± 0.2 psu, respectively. After a 24 h period of food deprivation, the experimental protocol was initiated with a photoperiod regimen of 12 h light (7:00 to 19:00).
2.2. Experimental Design
Polystyrene, a widespread plastic polymer, is a major component of marine plastic pollution, notably through microbeads (MB) found in cosmetics and personal care items [27,28]. In this experiment, 0.2 µm MB (F8811, Thermo Fisher Scientific, Waltham, MA, USA) characterized by a density of 1.055 g/cm3, and of yellow-green fluorescence, were used at two concentrations: 5 beads/L (MB5) and 50 beads/L (MB50), both prepared in deionized water. Korean rockfish were subjected to these MB solutions, with specific concentrations for each experimental group being achieved by diluting MB directly in their respective tanks, and concurrently IP injected with S. iniae (FP5228; National Institute of Fisheries Science, Busan, Republic of Korea) at 1 × 10⁵ CFU/mL (Si5) or 1 × 10⁷ CFU/mL (Si7). The high concentration of S. iniae used in this study was based on the protocol in a previous study by Min et al. [29], who demonstrated that infection with 107 CFU of S. iniae, particularly when combined with temperature fluctuations, elicited pathogenic effects and immune responses. The bacteria were cultured overnight in Brain Heart Infusion Broth at 25 °C, then washed with phosphate-buffered saline (PBS) and adjusted for the infection test. The experimental groups included MB5, MB50, Si5, Si7, MB5+Si5, MB5+Si7, MB50+Si5, and MB50+Si7, with a PBS control group. Before conducting this study, a preliminary experiment was performed to confirm whether the injection itself affects the physiological responses of Korean rockfish. There was no notable difference observed in the results between the control group and the experimental group administered only PBS. Daily, one-third of the water in each tank was replaced with clean water containing an identical concentration of MB. A total of 108 fish were distributed across nine tanks (12 fish per tank), and samples were collected from 3 fish per tank at 0, 1, 3, and 5 day after exposure. At this stage, 0 day signifies the moment just prior to both MB exposure and S. iniae injection for all experimental groups.
2.3. Experimental Sampling and Complementary DNA Synthesis
To collect samples, the fish were first anesthetized with clove oil (C8392; Sigma-Aldrich, St. Louis, MO, USA). From the caudal blood vessel, blood was subsequently obtained with heparin-lined injectors, and plasma was separated through centrifugation at 4 °C, 12,000× g for 15 min, before being stored at 80 °C. Liver tissue was also collected and immediately frozen at 80 °C. Samples intended for RNA and DNA extraction were kept frozen, whereas those intended for histological examination were fixed in 4% paraformaldehyde. The liver was used to extract the total RNA with TRI Reagent® (TR188, Molecular Research Center, Cincinnati, OH, USA). Analysis by a BioDrop spectrophotometer (BioDrop, Cambridge, UK) indicated good RNA quality, with an A260/A280 ratio of 1.8–2.0 for purity and an A260/A230 ratio of 2.0–2.2 for contamination. Using an oligo(dT)15 anchor primer and Moloney murine leukemia virus (M-MLV) reverse transcriptase (Promega, Madison, WI, USA), 2.0 µg of total RNA was converted into complementary DNA (cDNA). This cDNA was subsequently diluted at a ratio of 1:99 and kept at 20 °C until it was needed for quantitative PCR (qPCR) analysis.
2.4. Gene Expression by qPCR
qPCR was used to determine the relative mRNA expression of CYP1A1, GST, and caspase-3 using cDNA reverse transcribed from total RNA. The amplification primers designed based on nucleotide sequences from the National Center for Biotechnology Information (NCBI) database are listed in Table 1. The qPCR analysis utilized a Bio-Rad CFX96™ real-time PCR detection system (Bio-Rad Laboratories, Hercules, CA, USA) with iQ™ SYBR Green Supermix (Bio-Rad). An initial denaturation at 95 °C for 3 to 5 min initiated the thermal cycling process. This was succeeded by 30 to 40 cycles, where each cycle comprised denaturation for 10 s at 95 °C, primer-specific annealing for 15 s, and extension for 20 s at 72 °C. The ef1α gene was used as the internal reference for normalization. The 2−ΔΔCt method was employed to determine the relative mRNA expression, with the results shown as variations compared to the internal controls’ cycle threshold. Three technical replicates were analyzed per experimental condition to evaluate statistical significance.

Table 1.
Primers used for qPCR amplification and in situ hybridization.
2.5. SOD and CAT Activity in the Liver
To measure SOD activity, the liver was initially rinsed with phosphate-buffered saline (PBS) and homogenized in sucrose buffer containing 0.25 M sucrose, 10 mM Tris, and 1 mM EDTA (pH 7.4). The homogenate was then centrifuged at 10,000× g and 4 °C for 60 min, and the resulting supernatant was collected. SOD activity in the supernatant was subsequently assessed using a BO-SOD-250 assay kit (BIOMAX, Seoul, Republic of Korea) according to the manufacturer’s protocol. The absorbance was recorded at 450 nm using a Victor X3 multilabel plate reader (Perkin Elmer, Waltham, MA, USA). CAT activity was measured using the BO-CAT-400 assay kit (BIOMAX, Seoul, Republic of Korea) with the prepared supernatant. Briefly, 25 µL of supernatant was dispensed into each microplate well, followed by the addition of 25 µL of a freshly prepared 40 µM H2O2 solution (diluted from 20 mM H2O2 stock in 1 × reaction buffer). After a 30 min incubation protected from light, 50 µL of an Oxi-Probe/HRP working solution was added to each well. CAT activity was determined by measuring absorbance at 560 nm using the same multilabel plate reader. All assays were conducted in triplicate for each experimental condition to ensure statistical validity.
2.6. H2O2 Levels in Plasma
The H2O2 concentration was measured using a Peroxide Detect kit (PD1, Sigma-Aldrich, St. Louis, MO, USA) following the supplier’s protocol. Blood was centrifuged, and the supernatant plasma was analyzed. The procedure involved adding standards, samples, and color reagents to a plate, followed by a 30 min incubation at 25 °C before measuring absorbance at 560 nm. To guarantee statistical robustness, all experimental conditions were tested in triplicate, and sample concentrations were calculated using a standard curve.
2.7. NO and LPO Levels in Plasma
NO levels were assessed using an assay kit (BM-NIT-200; BIOMAX Inc., Seoul, Republic of Korea) according to the protocol prescribed by the manufacturer, and absorbance was recorded at 450 nm. The kit measures total NO activity (an RNS) via the detection of both nitrite (NO2−) and nitrate (NO3−). LPO was evaluated separately using a commercially available enzyme-linked immunosorbent assay (ELISA) kit (MBS285269; MyBiosource Inc., San Diego, CA, USA) in accordance with the manufacturer’s guidelines. LPO levels were determined from absorbance measurements at 450 nm.
2.8. Visualizing CYP1A1 mRNA Expression with In Situ Hybridization
To detect CYP1A1 mRNA expression in the liver, in situ hybridization was used in specific experimental groups (Si7, MB5+ Si7, MB50+Si5, and MB50+Si7) at 0 and 5 days after exposure. These groups were chosen based on CYP1A1 mRNA results to assess the impact of varying MB concentrations on outcomes under a combined-exposure setting. Sample processing involved fixation in 4% PFA (4 °C, ≥24 h), PBS rinsing, cryoprotection with 30% sucrose, embedding in OCT compound (Sakura Finetek, Osaka, Japan), sectioning, slide mounting, and storage at 20 °C. The probe that was specific to CYP1A1 (detailed in Table 1) was prepared by initially generating a template via PCR, purifying the product, and cloning it into the pGEM-T Easy Vector (Promega, Madison, WI, USA). Plasmids were verified by PCR using relevant primers, including T7 (sequence provided). T7 RNA polymerase and DIG RNA Labeling mix (Roche, Mannheim, Germany) facilitated the production of DIG-labeled RNA probes. Hybridization was carried out by incubating slides overnight (65 °C, humid chamber) with a mixture containing the probe, 50 µL yeast total RNA, and 950 µL hybridization buffer (recipe: 25 mL deionized formamide, 12.5 mL 20 × SSC, 500 µL 10% Tween-20, 460 µL 1 M citric acid pH 6.0, in DEPC water to 50 mL).
Signal detection was initiated by blocking the tissue sections in 10% calf serum/PBST (PBS with 0.1% Tween-20) for 1 h at 20 °C. Sections were then treated overnight (4 °C, dark) with 200 µL of AP-conjugated anti-DIG antibody (1:2000 in blocking solution; Roche, Basel, Switzerland). Post-antibody washes involved PBST (4 × 15 min), followed by alkaline Tris buffer (1 M Tris pH 9.5, 1 M MgCl2, 5 M NaCl, 10% Tween-20; 3 × 5 min). Color development was achieved by incubating sections (1 h, room temperature, dark, humid chamber) with a labeling mix composed of 1 mL alkaline Tris buffer, 4.5 µL NBT, and 3.5 µL BCIP, until adequate staining was observed. The reaction was halted by washing with PBST. The samples were subsequently mounted using Aqua Polymount (Warrington, PA, USA) and covered by a coverslip. A stereoscopic microscope (Nikon Eclipse Ci, Tokyo, Japan) was used to capture images of hybridization signals.
2.9. TUNEL Assay
The TUNEL assay was performed on the Si7, MB5+Si7, MB50+Si5, and MB50+Si7 experimental groups on days 0 and 5. These groups were selected based on the caspase-3 mRNA results to determine how differences in MB concentration affected the combined-exposure groups. The liver was stabilized in 10% neutral buffered formalin (F0196RG, BYLABS, Hanam-si, Republic of Korea). The DeadEnd™ Colorimetric TUNEL System (G7131, Promega, Madison, WI, USA) was applied for detecting apoptotic cells, strictly following the manufacturer’s protocol. Visualization of TUNEL-positive cells was accomplished with an Eclipse Ci optical microscope (Nikon Eclipse Ci, Tokyo, Japan). ImageJ 1.54 (LOCI, Madison, WI, USA) was used to measure signal intensity and thereby calculate the apoptotic area ratio.
2.10. Statistical Analysis
Statistical analyses were performed using SPSS version 29.0 (SPSS, Chicago, IL, USA). A two-way ANOVA was applied to determine the main influences of the experimental group and exposure duration, as well as their interaction. Following this, Tukey’s test supported subsequent multiple comparisons. Significance was set at p < 0.05, which denoted a 95% confidence level. Mean values ± standard deviation (SD) represent the data.
3. Results
3.1. Changes in SOD and CAT Activities in the Liver and H2O2 and NO Levels in Plasma
SOD and CAT activities in Korean rockfish exposed to MB, S. iniae, and a combination of both were assessed (Figure 1A,B). All groups except the Cont group showed increased SOD and CAT activity compared to the control group at all time points. On day 5, the combined groups had significantly higher SOD and CAT activities than the single groups (p < 0.05). The Si5 (SOD; 16.23 ± 0.66 ng/mL, CAT; 334.93 ± 10.76 mU/mL) and Si7 (SOD; 16.70 ± 0.07 ng/mL, CAT; 351.98 ± 5.48 mU/mL) groups showed no significant differences in SOD or CAT activities on day 5 (p > 0.05), except for the MB50+Si7 group, which showed progressive increases, with significantly higher SOD and CAT activities on days 3 and 5 compared to the other groups (p < 0.05). Results revealed the H2O2 and NO levels in plasma samples collected from Korean rockfish after exposure to MB, S. iniae, or a combination of both (Figure 1C, D). Compared to all other groups, the MB50+Si5 (H2O2; 361.87 ± 32.85 nmol peroxide/mL, NO; 5.06 ± 0.02 μmol/L) and MB50+Si7 (H2O2; 471.47 ± 2.13 nmol peroxide/mL, NO; 6.30 ± 0.22 μmol/L) groups exhibited elevated H2O2 and NO levels on day 5 (p < 0.05). NO levels remained statistically similar between the Si7 and MB5+Si5 groups throughout the post-exposure period (p > 0.05).
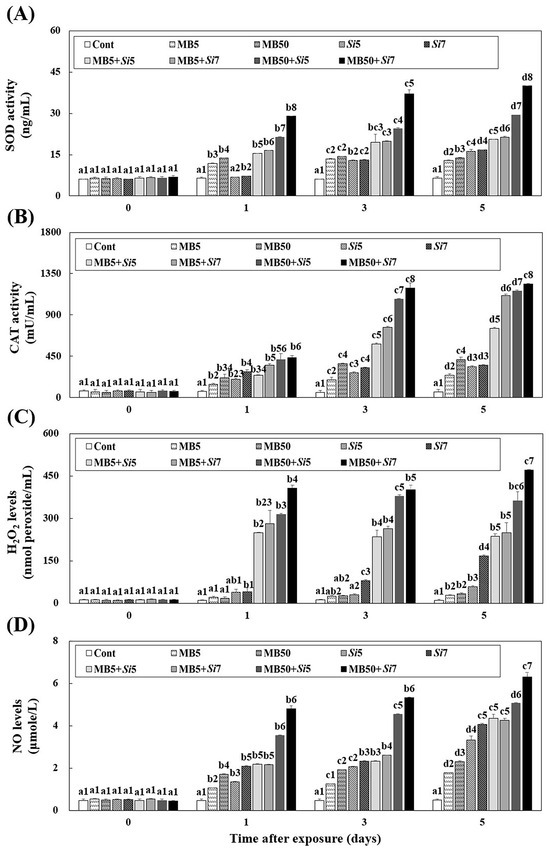
Figure 1.
Changes in the livers of Korean rockfish, following a five-day exposure to microbeads (MB) and Streptococcus iniae (Si), were measured. These measurements specifically tracked alterations in (A) superoxide dismutase (SOD) activity, (B) catalase (CAT) activity, (C) hydrogen peroxide (H2O2) levels, and (D) nitric oxide (NO) levels. Varying letters communicate substantial statistical distinctions (p < 0.05) regarding activity among Korean rockfish across various experimental groups and exposure times. These groups include single exposures (MB5, MB50, Si5, Si7), combined exposures to MB and S. iniae (MB5+Si5, MB5+Si7, MB50+Si5, MB50+Si7), and a control group (Cont). Different numbers highlight statistically significant variations (p < 0.05) in expression among Korean rockfish that received different treatments and concentrations, specifically when compared at identical exposure times. The mean value, accompanied by its standard deviation, is indicated for each entry, with computations based on three independent assessments (n = 3).
3.2. Changes in CYP1A1 and GST mRNA Expression in the Liver
This study examined the changes in CYP1A1 mRNA expression in the livers of Korean rockfish after exposure to MB, S. iniae, or a combination of both (Figure 2A). Except for the Cont group, CYP1A1 mRNA expression increased over time in both the single- and combined-exposure groups. An absence of meaningful disparities in CYP1A1 mRNA expression was found between the Cont and single-exposure groups, except for Si7 on days 1 and 3 (p > 0.05). On day 5, the combined-exposure groups, excluding MB5+Si5 (10.71 ± 3.05), exhibited significantly higher expression levels than the single-exposure groups (p < 0.05). Notably, the MB50+Si7 (28.59 ± 0.84) group displayed significantly higher CYP1A1 mRNA expression than the other combined-exposure groups on day 5 (p < 0.05). As shown in Figure 2B, 5 days after exposure, the GST mRNA expression levels in the combined-exposure experimental group were higher than those in the single-exposure experimental group (p < 0.05). There were no significant differences among the combined experimental groups, except for the low-concentration MB and S. iniae combined experimental group (MB5+Si5) (p > 0.05).
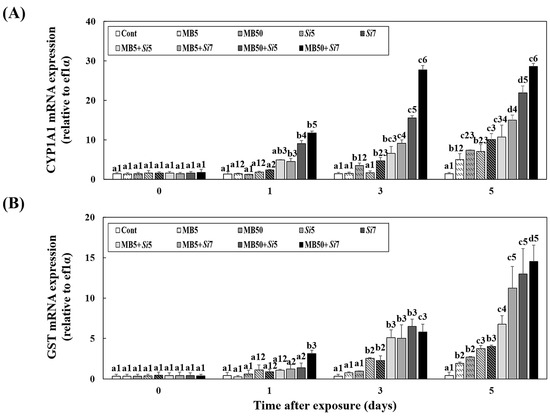
Figure 2.
Changes in the livers of Korean rockfish, following a five-day exposure to microbeads (MB) and Streptococcus iniae (Si), were measured. These measurements specifically tracked alterations in (A) CYP1A1 and (B) GST mRNA expression. Varying letters communicate substantial statistical distinctions (p < 0.05) regarding expression among Korean rockfish across various experimental groups and exposure times. These groups include single exposures (MB5, MB50, Si5, Si7), combined exposures to MB and S. iniae (MB5+Si5, MB5+Si7, MB50+Si5, MB50+Si7), and a control group (Cont). Different numbers highlight statistically significant variations (p < 0.05) in expression among Korean rockfish that received different treatments and concentrations, specifically when compared at identical exposure times. The mean value, accompanied by its standard deviation, is indicated for each entry, with computations based on three independent assessments (n = 3).
3.3. In Situ Hybridization mRNA Expression of CYP1A1
In situ hybridization was performed to visually confirm CYP1A1 mRNA expression in the liver (Figure 3). By day 5, both the single- and combined-exposure groups showed increased CYP1A1 mRNA signals compared to day 0. Consistent with the mRNA expression patterns, the combined-exposure groups exhibited stronger CYP1A1 mRNA signals than the single-exposure groups on day five. Notably, the MB50+Si7 group exhibited the most intense CYP1A1 mRNA signals among the combined groups on day 5, surpassing those of the MB5+Si5 and MB5+Si7 groups.
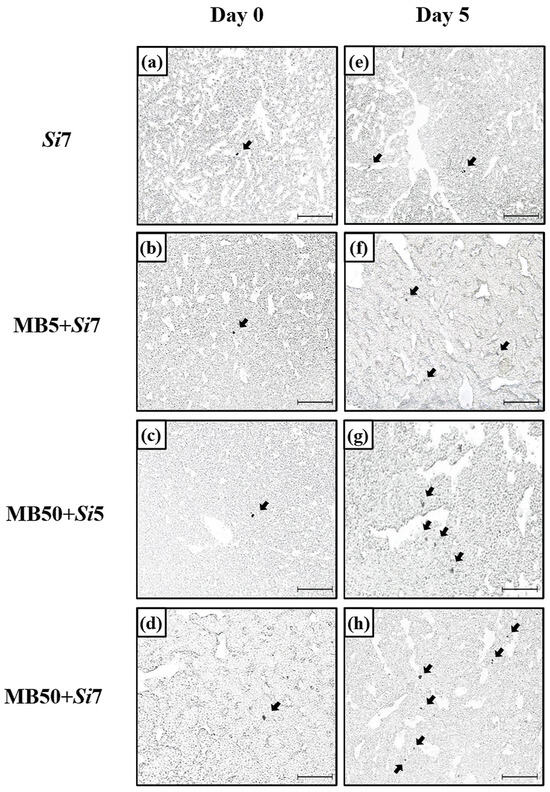
Figure 3.
In situ hybridization was used to observe CYP1A1 mRNA expression in Korean rockfish liver tissue across a five-day duration. Figure 3 shows the sites of CYP1A1 mRNA expression in the (a) Si7 group, (b) MB5+Si7 group, (c) MB50+Si5 group, and (d) MB50+Si7 group on day 0 and (e) Si7 group, (f) MB5+Si7 group, (g) MB50+Si5 group, and (h) MB50+Si7 group on day 5. Black arrows point to dark areas, indicating the presence of CYP1A1 mRNA expression in the liver. All images include 100 µm scale bars.
3.4. Changes in LPO Levels in Plasma
The LPO levels in the plasma of Korean rockfish were measured after exposure to MB, S. iniae, or a combination of both (Figure 4). In the MB5 group (day 0; 27.46 ± 5.00 ng/mL, day 1; 30.49 ± 4.22 ng/mL), there was no significant difference in LPO levels between days 0 and day 1 post-exposure (p > 0.05). On days 3 and 5 post-exposure, the combined-exposure groups (excluding MB50+Si5 and MB50+Si7) showed LPO levels that were not significantly different from those in the single-exposure groups (p > 0.05). On days 3 and 5, the MB50+Si7 (day 3; 241.81 ± 2.88 ng/mL, day 5; 262.41 ± 2.93 ng/mL) group had significantly higher LPO levels than the other groups (p < 0.05).
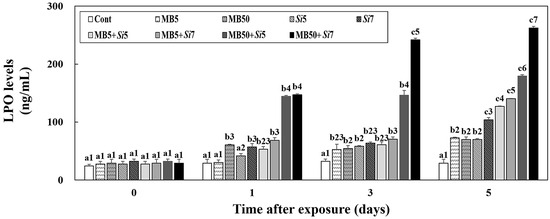
Figure 4.
Changes in the livers of Korean rockfish, following a five-day exposure to microbeads (MB) and Streptococcus iniae (Si), were measured. These measurements specifically tracked alterations in lipid peroxidation (LPO) levels. Varying letters communicate substantial statistical distinctions (p < 0.05) regarding activity among Korean rockfish across various experimental groups and exposure times. These groups include single exposures (MB5, MB50, Si5, Si7), combined exposures to MB and S. iniae (MB5+Si5, MB5+Si7, MB50+Si5, MB50+Si7), and a control group (Cont). Different numbers highlight statistically significant variations (p < 0.05) in expression among Korean rockfish that received different treatments and concentrations, specifically when compared at identical exposure times. The mean value, accompanied by its standard deviation, is indicated for each entry, with computations based on three independent assessments (n = 3).
3.5. Changes in Caspase-3 mRNA Expression in the Liver
The changes in caspase-3 mRNA expression levels in the livers of Korean rockfish following exposure to MB, S. iniae, or a combination of both are shown in Figure 5. On day 1 post-exposure, the single-exposure groups did not exhibit a significant difference in caspase-3 mRNA expression compared to the Cont (p > 0.05). However, the MB50+Si7 (70.44 ± 1.47) group exhibited significantly higher caspase-3 mRNA expression levels than the other groups on day 5 (p < 0.05). Furthermore, on days 3 and 5, the combined-exposure groups, excluding MB5+Si5 (day 3; 11.52 ± 0.43, day 5; 16.17 ± 0.41), exhibited higher caspase-3 mRNA expression levels than the single-exposure groups (p < 0.05).
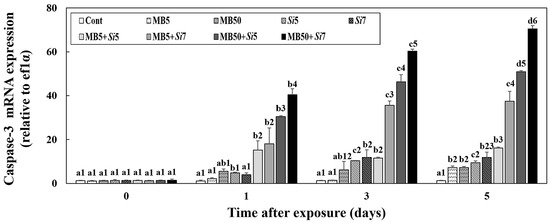
Figure 5.
Changes in the livers of Korean rockfish, following a five-day exposure to microbeads (MB) and Streptococcus iniae (Si), were measured. These measurements specifically tracked alterations in caspase-3 mRNA expression. Varying letters communicate substantial statistical distinctions (p < 0.05) regarding expression among Korean rockfish across various experimental groups and exposure times. These groups include single exposures (MB5, MB50, Si5, Si7), combined exposures to MB and S. iniae (MB5+Si5, MB5+Si7, MB50+Si5, MB50+Si7), and a control group (Cont). Different numbers highlight statistically significant variations (p < 0.05) in expression among Korean rockfish that received different treatments and concentrations, specifically when compared at identical exposure times. The mean value, accompanied by its standard deviation, is indicated for each entry, with computations based on three independent assessments (n = 3).
3.6. TUNEL Assay
Following exposure to MB, S. iniae, or a combination of both, the area of apoptosis in the liver of Korean rockfish was examined (Figure 6A). A time-dependent increase in the apoptotic area was observed, with cells from day 5 showing a greater area undergoing apoptosis than those from day 0. On Day 5, the combined-exposure groups showed a significantly larger apoptotic area than the single-exposure groups (p < 0.05). In particular, higher MB concentrations in the combined-treatment groups correlated with a larger area of cell death. Among all combined-exposure groups, the MB50+Si7 group exhibited a statistically significantly larger apoptotic area (p < 0.05).
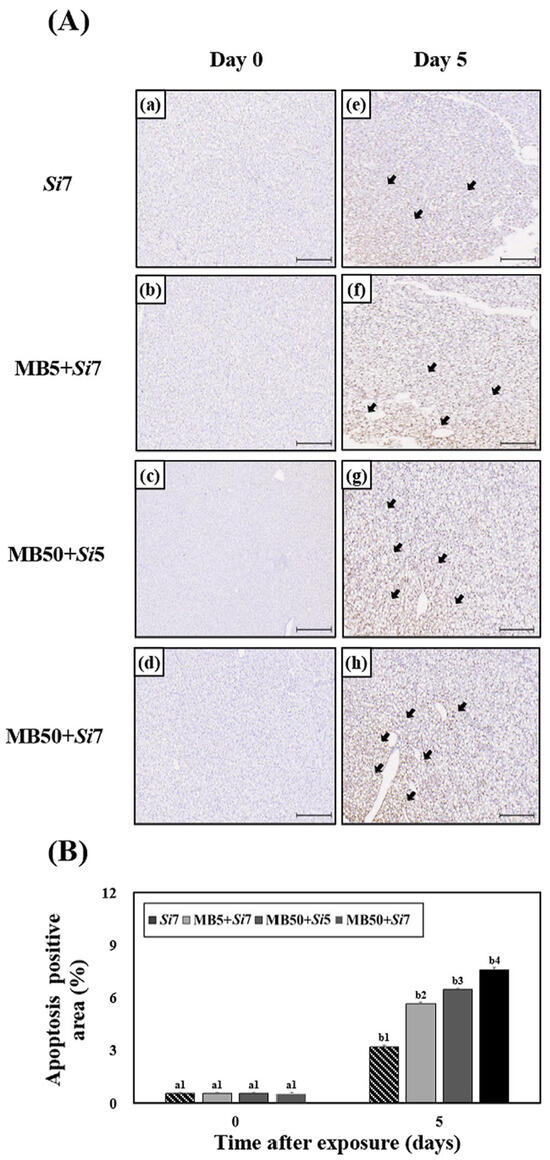
Figure 6.
For five days, Korean rockfish were exposed to microbeads (MB) and Streptococcus iniae (Si), and the resulting TUNEL assay images of their livers are shown in (A). (a) Si7 group, (b) MB5+Si7 group, (c) MB50+Si5 group, and (d) MB50+Si7 group on day 0 and (e) Si7 group, (f) MB5+Si7 group, (g) MB50+Si5 group, and (h) MB50+Si7 group on day 5. Black arrows point to the regions of apoptosis, with each scale bar representing 50 μm. The percentage of the apoptotic area from the images in (A) is represented in (B). Figure (B) uses varying letters to communicate substantial statistical distinctions (p < 0.05) regarding apoptosis area among Korean rockfish in identical treatment groups across various exposure durations. Conversely, different numbers in (B) highlight significant differences (p < 0.05) between Korean rockfish from different treatment groups when observed at the same exposure time. The mean value, accompanied by its standard deviation, is indicated for each entry, with computations based on three independent assessments (n = 3).
4. Discussion
ROS generated within organisms owing to various stressors, including exposure to microplastics and bacteria, are typically neutralized by antioxidant enzymes. Key antioxidant enzymes, such as SOD and CAT, as well as H2O2 levels, are often used as indicators of oxidative stress. This investigation found significantly elevated activity for radical-scavenging enzymes (SOD and CAT), alongside higher H2O2 concentrations, in the high-concentration combined-exposure group (MB50+Si7) compared to all other exposure groups. Banihashemi et al. [30] reported similar findings, with high levels of SOD activity in the liver of rainbow trout, Oncorhynchus mykiss, after 30 days of exposure to a combined environment of microplastics and bacteria (Yersinia ruckeri). This suggests that in our study, the interaction between MB and S. iniae likely potentiated toxicity compared to single exposures, consequently leading to increased SOD and CAT activities in an attempt to eliminate excessive production of ROS. However, the concurrently high H2O2 levels, despite the increased enzyme activity, implied that the toxicity was sufficiently severe such that the antioxidant defense system in the Korean rockfish was overwhelmed and unable to completely neutralize the ROS load. Furthermore, regarding RNS, Song et al. [31] reported increased NO levels in the hemolymph of bay scallops, Argopecten irradians, exposed to benzo[a]pyrene (BaP). In our study, levels of NO, an RNS indicative of oxidative stress, were higher in the high-MB-concentration combined group (MB50+Si7) than in the low-MB-concentration combined group (MB5+Si7). This suggests that the high MB concentration (50 beads/L) led to elevated oxidative stress compared to the low concentration (5 beads/L), likely due to enhanced interaction with S. iniae in the combined-exposure, thereby increasing NO production.
CYP1A1 serves as a key indicator for assessing the oxidative responses caused by external pollutants such as microplastics. Hence, our research endeavored to determine the magnitude of oxidative stress in Korean rockfish by scrutinizing the effects of joint MB and S. iniae exposure on CYP1A1 mRNA expression levels. In this study, high levels of CYP1A1 mRNA expression were observed in the high-concentration-MB combined-exposure groups (MB50+Si5 and MB50+Si7). This was likely because the interaction between high concentrations of MB and S. iniae within the rockfish body enhanced toxicity, thereby strongly inducing oxidative stress. Furthermore, the most abundant CYP1A1 mRNA signals were detected in the liver of Korean rockfish in the MB50+Si7 group. Kim et al. [32] previously reported increased CYP1A1 mRNA expression in the liver of goldfish, Carassius auratus, following combined exposure to 1.0 µm MB (10 and 100 beads/L) and BaP (10 µg/L), compared to single exposures. Although Kim et al. [32] did not directly investigate the interactions between MB and pathogens, their findings involving combined-exposure to BaP are comparable to our results because BaP is a substance known to be readily adsorbed onto microplastic surfaces, similar to the pathogen used in our study. Specifically, it appears that ingested MB interacts with S. iniae, enhancing its toxicity and elevating the ROS and RNS levels in Korean rockfish. Consequently, the observed increase in liver CYP1A1 mRNA expression likely represents a detoxification response to heightened stress.
Under exposure to microplastics and bacteria, leading to increased ROS production, GST plays a crucial role in maintaining the intracellular antioxidant defense system. In the present study, we confirmed increased GST mRNA expression levels in the liver of Korean rockfish in the combined-exposure groups compared to those exposed to either MB or S. iniae alone. Consistent with our findings on mRNA expression, Xu et al. [33] reported increased GST activity in the liver tissue of zebrafish, Danio rerio, subjected to combined exposure to microplastics (3 mg/L) and phenanthrene (0.2 mg/L), compared to single exposures. Furthermore, Junaid et al. [34] highlighted the potential for biofilms formed on microplastic surfaces to interact with pathogens, thereby increasing toxicity, and suggested that the exposure of aquatic organisms to such combined microplastic–pathogen environments is likely to induce oxidative stress. Our results suggest that the interaction between ingested MB and S. iniae leads to enhanced toxicity in Korean rockfish. Therefore, the observed increase in GST mRNA expression is considered a response aimed at detoxifying the elevated levels of ROS generated as a consequence of this heightened toxicity.
LPO is another biomarker frequently used to measure oxidative stress, and its levels can indicate the extent of cellular damage resulting from stress. In the MB50+Si7 combined-exposure group, LPO levels significantly increased on day 5 post-exposure compared to all other experimental groups. Comparable findings indicate increased LPO levels in Zhikong scallops, Chlamys farreri, following a 96 h exposure to Vibrio anguillarum, relative to controls, as detailed in prior research [35]. Synthesizing the physiological responses related to antioxidant enzymes and oxidative stress observed in this study, we conclude that the interaction between microplastics and S. iniae likely amplifies intracellular toxicity. This amplification appears to have generated ROS and RNS levels exceeding the organism’s capacity for neutralization, thereby inducing severe oxidative stress that ultimately promoted lipid peroxidation, leading to the observed increase in LPO levels.
Excessive oxidative stress can disrupt homeostasis and the internal balance within an organism, ultimately leading to apoptosis. Caspase-3 operates as a vital executioner caspase involved in both the extrinsic and intrinsic apoptotic pathways and plays a pivotal role in this process [24]. It has been reported that in goldfish, C. auratus, combined exposure to 0.2 µm MB (at concentrations of 10 and 100 beads/L) and BaP (5 µg/L) for 120 h resulted in increased caspase-3 mRNA expression in the liver compared to groups exposed to MB or BaP alone [22]. Aligning with these observations, our data indicated the most substantial rise in caspase-3 mRNA levels within the treatment group combining a high concentration of MB with S. iniae (MB50+Si7). This suggests that higher MB concentrations likely facilitate greater interactions with S. iniae, leading to increased intracellular toxicity, and consequently, further promotion of oxidative stress. TUNEL analysis corroborated these findings, revealing a larger area undergoing apoptosis in the high-concentration combination-exposure group (MB50+Si7) than in the other groups, which aligned with the changes observed in caspase-3 mRNA expression. Therefore, the combined-exposure to MB and S. iniae induced excessive oxidative stress in Korean rockfish. This stress response was particularly pronounced in the high-concentration combined-exposure group, ultimately affecting apoptosis.
5. Conclusions
Though the interactions between microplastics and other pollutants, for example, heavy metals, and their effects on the physiological shifts in water-dwelling species have received considerable research, studies focusing on the physiological impacts of fish being exposed to both microplastics and bacterial pathogens are scarce. The key findings of the present study regarding the effects of combined exposure to MB and S. iniae on oxidative stress and apoptosis in Korean rockfish can be summarized as follows: 1. Enhanced toxicity resulting from combined MB and S. iniae exposure led to elevated levels of the ROS indicator H2O2 and the immune-related RNS indicator NO. 2. Despite the activation of defense mechanisms, including the increased antioxidant enzyme (SOD and CAT) activities and the upregulation of detoxification gene (CYP1A1 and GST) expression, these responses were insufficient to fully mitigate the stress, resulting in increased lipid peroxidation (LPO) levels due to excessive oxidative stress. 3. In Korean rockfish subjected to high-concentration combined exposure (MB + S. iniae), the internal imbalance caused by excessive oxidative stress led to increased expression of the key apoptotic gene, caspase-3, and promoted apoptosis. These results suggest that microplastics may pose a potential risk through their interactions with various pathogens in aquatic environments, and they may promote infections in aquatic organisms in addition to the contamination of habitats.
Author Contributions
Performed data curation, Writing—original draft, Y.H.K.; Formal analysis, Designed the experiments, J.A.K.; Statistical analysis, Investigation, Y.-S.P.; Writing—review and editing, J.-H.K.; Writing—review and editing, Supervision, C.Y.C. All authors have read and agreed to the published version of the manuscript.
Funding
This work was supported by Korea Institute of Marine Science and Technology Promotion (KIMST) funded by the Ministry of Oceans and Fisheries (20220559).
Institutional Review Board Statement
Approval for animal research using this fish as an experimental organism was obtained from the Institutional Animal Care and Use Committee of National Korea Maritime and Ocean University (KMOU-IACUC-2024–06, 2 August 2024). All the standard ethical procedures were followed during this study.
Data Availability Statement
All relevant data are within the manuscript.
Acknowledgments
The authors extend their appreciation to the Korea Institute of Marine Science and Technology Promotion (KIMST) for financial support provided by the Ministry of Oceans and Fisheries (20220559).
Conflicts of Interest
The authors declare no conflicts of interest.
References
- Yan, H.; Cordier, M.; Uehara, T. Future projections of global plastic pollution: Scenario analyses and policy implications. Sustainability 2024, 16, 643. [Google Scholar] [CrossRef]
- Jaikumar, G.; Brun, N.R.; Vijver, M.G.; Bosker, T. Reproductive toxicity of primary and secondary microplastics to three cladocerans during chronic exposure. Environ. Pollut. 2019, 249, 638–646. [Google Scholar] [CrossRef] [PubMed]
- Wang, T.; Li, B.; Yu, W.; Zou, X. Microplastic pollution and quantitative source apportionment in the Jiangsu coastal area, China. Mar. Pollut. Bull. 2021, 166, 112237. [Google Scholar] [CrossRef] [PubMed]
- Ziajahromi, S.; Neale, P.A.; Silveira, I.T.; Chua, A.; Leusch, F.D. An audit of microplastic abundance throughout three Australian wastewater treatment plants. Chemosphere 2021, 263, 128294. [Google Scholar] [CrossRef] [PubMed]
- Ghasemi, A.; Shadi, A. Combined effects of microplastics and benzo [a] pyrene on Asian sea bass Lates calcarifer growth and expression of functional genes. Comp. Biochem. Physiol. Part C Toxicol. Pharmacol. 2024, 283, 109966. [Google Scholar] [CrossRef]
- Liu, R.; Wang, Y.; Yang, Y.; Shen, L.; Zhang, B.; Dong, Z.; Xing, B. New insights into adsorption mechanism of pristine and weathered polyamide microplastics towards hydrophilic organic compounds. Environ. Pollut. 2023, 317, 120818. [Google Scholar] [CrossRef]
- Ayush, P.T.; Ko, J.H.; Oh, H.S. Characteristics of initial attachment and biofilm formation of Pseudomonas aeruginosa on microplastic surfaces. Appl. Sci. 2022, 12, 5245. [Google Scholar] [CrossRef]
- Anastopoulos, I.; Pashalidis, I.; Kayan, B.; Kalderis, D. Microplastics as carriers of hydrophilic pollutants in an aqueous environment. J. Mol. Liq. 2022, 350, 118182. [Google Scholar] [CrossRef]
- Kang, J.H.; Ko, J.Y.; Yu, Y.B.; Choi, J.H.; Lee, J.H.; Kang, J.C. Toxic Effects of Microplastic on Hematological Parameters, Plasma Components, and Antioxidant Responses in the Korean Rockfish Sebastes schlegelii. Korean J. Fish. Aquat. Sci. 2024, 57, 227–238. [Google Scholar] [CrossRef]
- Oh, H.Y.; Lee, T.H.; Lee, D.Y.; Lee, C.H.; Sohn, M.Y.; Kwon, R.W.; Kim, K.D. Evaluation of garlic juice processing waste supplementation in juvenile black rockfish (Sebastes schlegelii) diets on growth performance, antioxidant and digestive enzyme activity, growth-and antioxidant-related gene expression, and disease resistance against Streptococcus iniae. Animals 2022, 12, 3512. [Google Scholar] [CrossRef]
- Sun, X.; Wang, X.; Booth, A.M.; Zhu, L.; Sui, Q.; Chen, B.; Xia, B. New insights into the impact of polystyrene micro/nanoplastics on the nutritional quality of marine jacopever (Sebastes schlegelii). Sci. Total Environ. 2023, 903, 166560. [Google Scholar] [CrossRef]
- Deng, M.L.; Yu, Z.H.; Geng, Y.; Wang, K.Y.; Chen, D.F.; Huang, X.L.; Lai, W.M. Outbreaks of Streptococcosis associated with Streptococcus iniae in Siberian sturgeon (Acipenser baerii) in China. Aquac. Res. 2017, 48, 909–919. [Google Scholar] [CrossRef]
- Locke, J.B.; Colvin, K.M.; Datta, A.K.; Patel, S.K.; Naidu, N.N.; Neely, M.N.; Buchanan, J.T. Streptococcus iniae capsule impairs phagocytic clearance and contributes to virulence in fish. J. Bacteriol. 2007, 189, 1279–1287. [Google Scholar] [CrossRef] [PubMed]
- Choi, C.Y.; Li, Z.; Song, J.A.; Park, Y.S. Water hardness can reduce the accumulation and oxidative stress of zinc in goldfish, Carassius auratus. Antioxidants 2022, 11, 715. [Google Scholar] [CrossRef] [PubMed]
- Subaramaniyam, U.; Allimuthu, R.S.; Vappu, S.; Ramalingam, D.; Balan, R.; Paital, B.; Sahoo, D.K. Effects of microplastics, pesticides and nano-materials on fish health, oxidative stress and antioxidant defense mechanism. Front. Physiol. 2023, 14, 1217666. [Google Scholar] [CrossRef] [PubMed]
- Donaghy, L.; Hong, H.K.; Jauzein, C.; Choi, K.S. The known and unknown sources of reactive oxygen and nitrogen species in haemocytes of marine bivalve molluscs. Fish Shellfish Immunol. 2015, 42, 91–97. [Google Scholar] [CrossRef]
- Olsvik, P.A.; Kristensen, T.; Waagbø, R.; Rosseland, B.O.; Tollefsen, K.E.; Baeverfjord, G.; Berntssen, M.H.G. mRNA expression of antioxidant enzymes (SOD, CAT and GSH-Px) and lipid peroxidative stress in liver of Atlantic salmon (Salmo salar) exposed to hyperoxic water during smoltification. Comp. Biochem. Physiol. Part C Toxicol. Pharmacol. 2005, 141, 314–323. [Google Scholar] [CrossRef]
- Wang, S.; Zhang, Q.; Zheng, S.; Chen, M.; Zhao, F.; Xu, S. Atrazine exposure triggers common carp neutrophil apoptosis via the CYP450s/ROS pathway. Fish Shellfish Immunol. 2019, 84, 551–557. [Google Scholar] [CrossRef]
- Xu, Z.; Cao, J.; Qin, X.; Qiu, W.; Mei, J.; Xie, J. Toxic effects on bioaccumulation, hematological parameters, oxidative stress, immune responses and tissue structure in fish exposed to ammonia nitrogen: A review. Animals 2021, 11, 3304. [Google Scholar] [CrossRef]
- Vazirzadeh, A.; Ergun, S.; Mossafa, H.; Farhadi, A.; Keshavarzifard, M.; Yigit, M.; Yilmaz, S. Microplastics contamination suppressed immune and health status in cage cultured Barramundi: An investigation on pollution sources, ecotoxicological impacts, and transcription of genes involved in detoxification. Aquaculture 2025, 594, 741370. [Google Scholar] [CrossRef]
- Lin, Y.; Miao, L.H.; Pan, W.J.; Huang, X.; Dengu, J.M.; Zhang, W.X.; Xi, B.W. Effect of nitrite exposure on the antioxidant enzymes and glutathione system in the liver of bighead carp, Aristichthys nobilis. Fish Shellfish Immunol. 2018, 76, 126–132. [Google Scholar] [CrossRef]
- Kim, J.A.; Park, Y.S.; Kim, J.H.; Choi, C.Y. Toxic effects of polystyrene microbeads and benzo [α] pyrene on bioaccumulation, antioxidant response, and cell damage in goldfish Carassius auratus. Ecotoxicol. Environ. Saf. 2024, 270, 115825. [Google Scholar] [CrossRef] [PubMed]
- Gao, D.; Xu, Z.E.; Qiao, P.; Liu, S.; Zhang, L.; He, P.; Min, W. Cadmium induces liver cell apoptosis through caspase-3A activation in purse red common carp (Cyprinus carpio). PLoS ONE 2013, 8, e83423. [Google Scholar] [CrossRef]
- Sun, S.; Xuan, F.; Fu, H.; Zhu, J.; Ge, X.; Wu, X. Molecular cloning, characterization and expression analysis of caspase-3 from the oriental river prawn, Macrobrachium nipponense when exposed to acute hypoxia and reoxygenation. Fish Shellfish Immunol. 2017, 62, 291–302. [Google Scholar] [CrossRef]
- Al Marshoudi, M.; Al Reasi, H.A.; Al-Habsi, A.; Barry, M.J. Additive effects of microplastics on accumulation and toxicity of cadmium in male zebrafish. Chemosphere 2023, 334, 138969. [Google Scholar] [CrossRef]
- Bromage, E.A.; Owens, L. Infection of barramundi Lates calcarifer with Streptococcus iniae: Effects of different routes of exposure. Dis. Aquat. Org. 2002, 52, 199–205. [Google Scholar] [CrossRef]
- Isobe, A. Percentage of microbeads in pelagic microplastics within Japanese coastal waters. Mar. Pollut. Bull. 2016, 110, 432–437. [Google Scholar] [CrossRef]
- Yin, L.; Chen, B.; Xia, B.; Shi, X.; Qu, K. Polystyrene microplastics alter the behavior, energy reserve and nutritional composition of marine jacopever (Sebastes schlegelii). J. Hazard. Mater. 2018, 360, 97–105. [Google Scholar] [CrossRef]
- Min, E.; Jeong, S.M.; Han, H.J.; Cho, M. Fluctuation of temperature induces pathogenicity of Streptococcus iniae and changes of immunology related genes of Korean rockfish, Sebastes schlegeli. Korean J. Ecol. Environ. 2023, 56, 420–429. [Google Scholar] [CrossRef]
- Banihashemi, E.A.; Soltanian, S.; Gholamhosseini, A.; Banaee, M. Toxicity effects of microplastics individually and in combination the fish pathogen Yersinia ruckeri on the rainbow trout (Oncorhynchus mykiss). Res. Sq. 2021, 1, 481553. [Google Scholar] [CrossRef]
- Song, J.A.; Kho, K.H.; Park, Y.S.; Choi, C.Y. Toxicity response to benzo [α] pyrene exposure: Modulation of immune parameters of the bay scallop, Argopecten irradians. Fish Shellfish Immunol. 2022, 124, 505–512. [Google Scholar] [CrossRef]
- Kim, J.A.; Kim, J.H.; Park, Y.S.; Kang, C.K.; Choi, C.Y. Micro-polystyrene plastic and benzo [α] pyrene exposure affects the endocrine system and causes physiological stress in Carassius auratus. Comp. Biochem. Physiol. Part C Toxicol. Pharmacol. 2023, 271, 109695. [Google Scholar] [CrossRef] [PubMed]
- Xu, K.; Zhang, Y.; Huang, Y.; Wang, J. Toxicological effects of microplastics and phenanthrene to zebrafish (Danio rerio). Sci. Total Environ. 2021, 757, 143730. [Google Scholar] [CrossRef]
- Junaid, M.; Siddiqui, J.A.; Sadaf, M.; Liu, S.; Wang, J. Enrichment and dissemination of bacterial pathogens by microplastics in the aquatic environment. Sci. Total Environ. 2022, 830, 154720. [Google Scholar] [CrossRef]
- Wang, X.; Wang, L.; Zhang, H.; Ji, Q.; Song, L.; Qiu, L.; Wang, L. Immune response and energy metabolism of Chlamys farreri under Vibrio anguillarum challenge and high temperature exposure. Fish Shellfish Immunol. 2012, 33, 1016–1026. [Google Scholar] [CrossRef]
Disclaimer/Publisher’s Note: The statements, opinions and data contained in all publications are solely those of the individual author(s) and contributor(s) and not of MDPI and/or the editor(s). MDPI and/or the editor(s) disclaim responsibility for any injury to people or property resulting from any ideas, methods, instructions or products referred to in the content. |
© 2025 by the authors. Licensee MDPI, Basel, Switzerland. This article is an open access article distributed under the terms and conditions of the Creative Commons Attribution (CC BY) license (https://creativecommons.org/licenses/by/4.0/).