Article

Climate Change for Lakes in the Coterminous United States in Relation to Lake Warming from 1981 to 2023

by
Roger W. Bachmann
School of Forest, Fisheries, and Geomatics Sciences, University of Florida, Gainesville, FL 32653, USA
Water 2025, 17(14), 2138; https://doi.org/10.3390/w17142138
Submission received: 18 May 2025 / Revised: 10 July 2025 / Accepted: 14 July 2025 / Published: 18 July 2025

Abstract

The goal of this study was to look at changes in mean air temperatures, minimum air temperatures, maximum air temperatures, dew points, and precipitation over each of 1033 lakes in the coterminous United States over the summer months in the years 1981–2024. Near-surface water temperatures in the same lakes were calculated with equations using 8-day mean daily air temperatures, latitude, elevation, and the year of sampling. Over the past 43 years, there have been changes in air temperatures over many lakes of the United States with generally increasing trends for minimum air temperatures and mean air temperatures during the months of June through September. The greatest increases have been in daily minimum air temperatures followed by the mean daily air temperatures. Maximum daily air temperatures did not show a statistically significant increase for the summer season but did show a significant increase for the month of September. Along with the changes in the climate, the near-surface water temperatures of the lakes of the United States on average showed increases of 0.33 °C decade−1 for the four summer months and increases for each of the summer months.

1. Introduction

It has long been known that climates have a strong effect on determining the temperatures of lakes. In 1968, Edinger et al. [1] developed a complex equilibrium model to calculate lake water temperatures using several meteorological variables. Many subsequent models recognized that air temperatures were very important in determining lake water temperatures but that other variables could be important as well. One regional study [2] showed the additional importance of wind speed, humidity and irradiance. Another study [3] indicated that longwave radiation, shortwave radiation, and specific humidity were important factors in lake warming. A study of Lake Constance [4] showed the importance of solar radiation and of longwave radiation as heat sources and that losses of heat by longwave emission and by latent heat flux were important losses. Another study on a global scale found that there was greater lake warming in drylands than in humid regions [5]. Warming was attributed to air temperature (74.4%), evaporation (4.1%), wind (9.9%), cloudiness (4.3%) net shortwave (3.1%), and net longwave (4.0%).
In some cases [6], lake warming can be calculated by using field measurements of lake temperatures that have been carried out for several years. More recently, use has been made of remote sensing data from satellites to obtain estimates of lake surface water temperatures [7,8,9,10,11,12,13]. The obtained water temperatures can then be used to develop and validate mathematical models to hindcast past water temperatures. For example, multiple regression using 8-day averages of mean air temperatures, latitude, elevation, and year were used to estimate surface water temperatures in the summer months for 48 United States between 1981 and 2018 [14]. Some other models used include air2water [15,16,17], Fresh-water Lake (Flake) [18], a multi-layer perception neural network (ML.PNN0) and a wavelet transform and ML.PNN integrated model (WT._ML.PNN) [19].
Various studies have found regional differences in warming rates of lakes. One study found that the rate of lake heating slows as air warms. Heating rates were higher in clear, cold, and deep lakes at high elevations than in warmer climates [2]. Another study showed that asymmetric seasonal warming rates led to amplified seasonality in alpine lakes in China [8]. Anther global study found that there was substantial warming after 1980, and the most responsive lakes were in the temperate zone [17]. In a study of the Tibetan Plateau, it was found that 70% of the lakes showed warming but 30% showed cooling [20]. Increased precipitation, permafrost degradation, and glacial meltwater were listed as causal factors. In a study of the climate and lake water in Florida with a subtropical climate, it was found that the increases in both mean air temperatures and lake surface water temperatures were less than those observed in the rest of the contiguous United States [21].
The timing of increases in lake temperatures varies from lake region to lake region. A study of Dianchi Lake in China showed significant increases in lake surface water temperatures in the months of February, March, and December [22]. In a study of Florida lakes, it was found that statistically significant increases in surface water temperatures were found only in August and September [21]. In a comparative study of 12 lakes in Wisconsin, Germany, and Finland, lake warming was found for only late summer and fall [6]. The German lakes had warming for all months while the three Finnish lakes had large increases in the spring associated with earlier ice-out.
Lake warming has not been a regular process but varies in part due to year to year variations in meteorological variables. For example, a global study [23] noted that global air temperature warming had a hiatus in the period 1998–2009. In the prior period, the lakes in their sample were warming with an average rate of 0.53 °C decade−1. During the hiatus, lake temperatures did not have significant changes. Another study [6] used a combination of lake measurements and modeled water temperatures in some Wisconsin lakes starting in 1894 that showed warmer epilimnetic temperatures in the 1930s–1940s followed by a cooling period in the 1950s–1980s with subsequent warming in the following years. Hindcasts of summer surface water temperatures in lakes of the United States for the period 1895–2018 show a similar pattern with a rise to a high point in the early 1930s followed by a decrease until about 1964, after which lake water temperatures began an increasing trend through 2018 [14]. A similar study of Florida lakes for the period 1985–2020 showed the same pattern [21].
While most studies of lake warming have focused on increases in average surface water temperatures, some recent studies have looked at lake heatwaves. A lake heatwave is defined as when the daily lake surface water temperatures exceed the 90% threshold of the seasonally varying climatology period for at least five consecutive days [8] A study of Chinese lakes from 1980 to 2021 showed that the duration of lake heatwaves have increased at a rate of 7.7 days decade−1 [8]. Another study in China indicated that dryland heatwaves emerge as dominant contributors to intensified lake surface water temperature warming [10]. Lake heatwaves have also been implicated in the deoxygenation of lakes [24].
This study is designed to build on the previous study [14] with a focus on the five climate variables found at our study lakes to look for patterns of change and distributions. Since we now have data sets through 2024, we also wanted to determine if the near-surface waters of these lakes continued to warm over an additional 5 years of record.
This study involved five objectives: (1) determine how the daily mean air temperatures, daily minimum air temperatures, and daily maximum air temperatures over a sample of United States lakes have changed during the months of June, July, August, and September from 1981 to 2023; (2) determine how daily dew point temperatures and precipitation amounts over a sample of United States lakes have changed during the months of June, July, August, and September from 1981 to 2023; (3) determine how daily mean near-surface water temperatures over a sample of US lakes have changed during the months of June, July, August, and September from 1981 to 2023; (4) determine with linear regression for each of the 1033 lakes if there have been changes in the five meteorological variables and the near-surface water temperatures; and (5) map the distributions of rates of changes in mean air temperatures and precipitation in the 1033 lakes to look for patterns from month to month.

2. Materials and Methods

2.1. Lake Sample

This study is based on a sample of 1033 United States lakes for the months of June, July, August, and September in the years of 1981–2023. These lakes were part of a statistically based sampling program of the 2007 National Lakes Assessment of the United States Environmental Protection Agency (USPA) [25] Weighted means of data from these lakes are representative of 49,803 natural and artificial lakes in the coterminous United States. The USEPA report [25] includes statistical weights, latitudes, longitudes, and elevations for each lake in the sample.

2.2. Meteorological Data

Meteorological data were obtained from the website of the PRISM Climate Group at Oregon State University (http://prism.oregonstate.edu (accessed on 12 February 2025)). Knowing the latitude and longitude of a lake, I could determine the means of the daily minimum, mean, and maximum air temperatures as well as the precipitation and dew point temperatures for any month going back to 1981. I also used the PRISM website to find the daily mean air temperatures for each of the 1033 lakes for the months of June, July, August, and September for the period 1981 through 2023. The PRISM website notes that daily data refer to the 24 h period ending at 12:00 Greenwich Mean Time (GMT, or 7:00 am Eastern Standard Time). “This means that PRISM data for May 26, for example, actually refers to the 24 h ending at 7:00 am EST on May 26.”

2.3. Analyses of Meteorological Variables

The monthly means of the five meteorological variables for each of the 1033 lakes in the statistical sample were used to determine weighted annual means for each of the months of June, July, August, and September and for the four months combined (summer) for the 43 years of record. Linear regression was used for the annual means for each of the four months and the summer to determine if there were statistically significant changes in the annual means of daily minimum, mean, and maximum air temperatures as well as the amounts of precipitation and dew point temperatures. Use was made of the JMP Statistical program v18.0, JMP Statistical Discovery, Cary NC, USA with a 0.05 level of probability to determine if there were statistically significant changes.

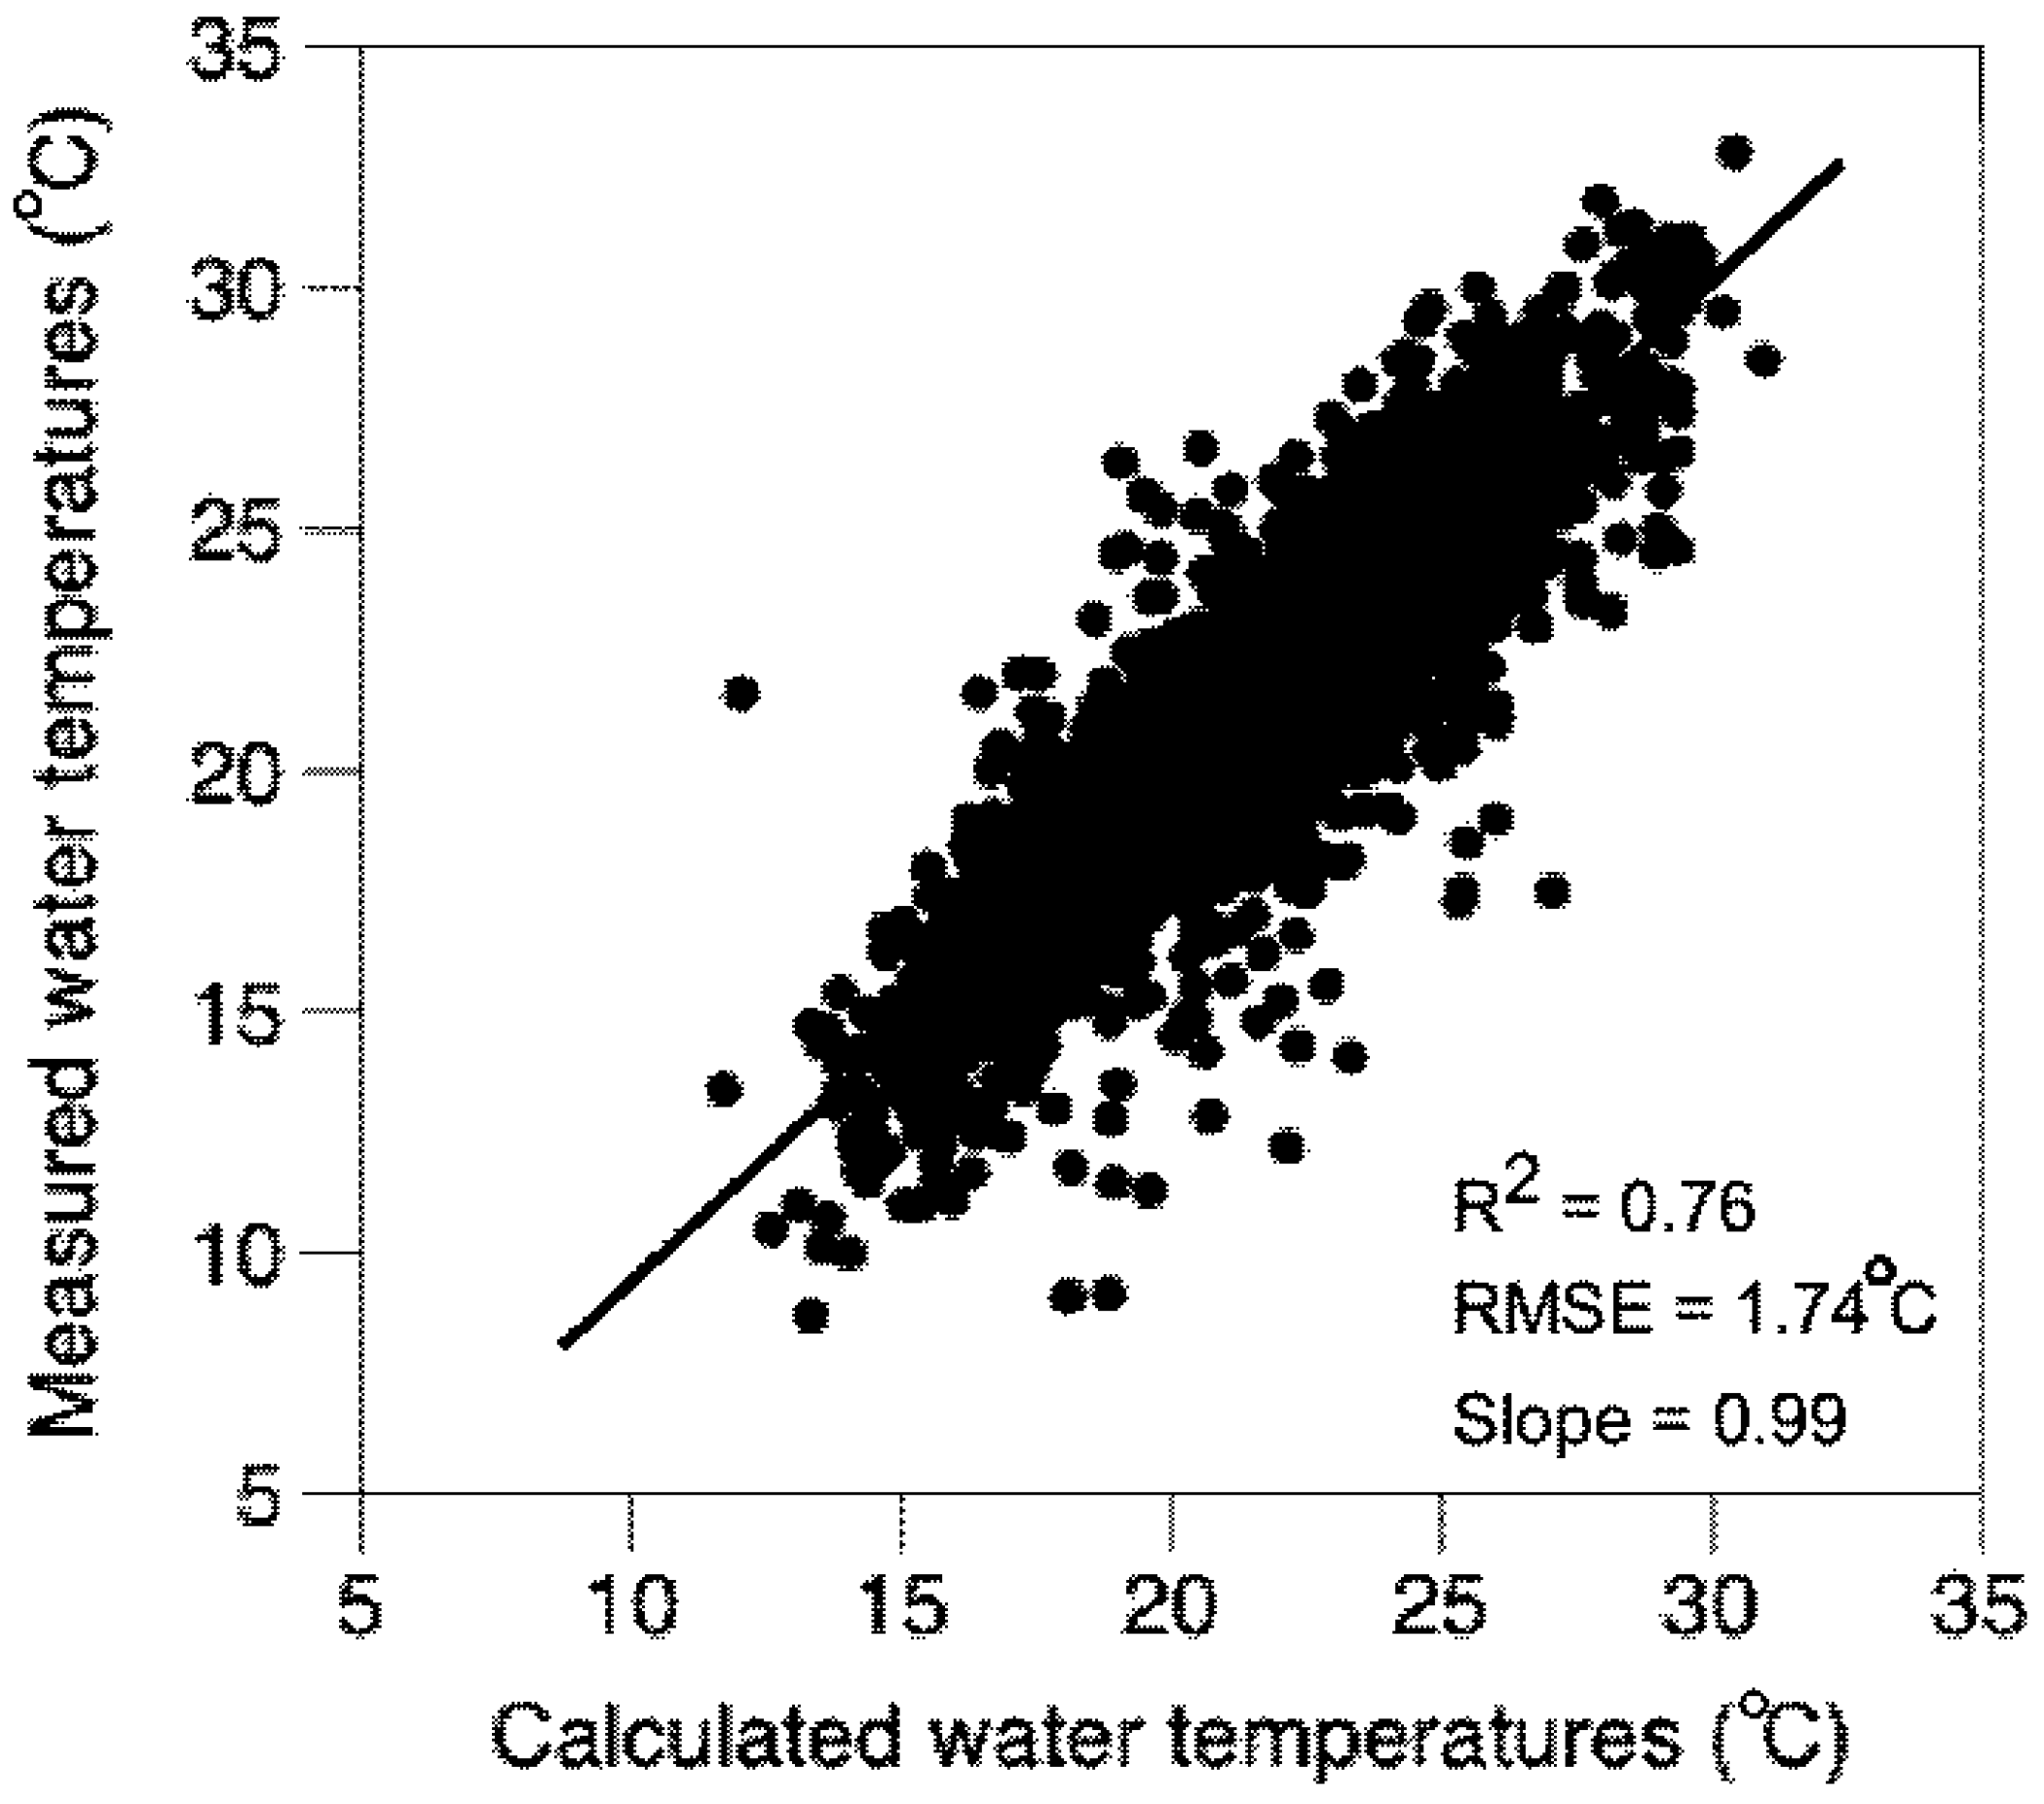
2.4. Calculation of Near-Surface Water Temperatures

In a previous study of United States lakes [14], multiple regressions were used to develop models to predict daily near-surface water temperatures using data from 8-day mean air temperatures, latitude, elevation, and year. The predictive equations were developed using near-surface water temperature data extracted from 5723 lakes over the time period 1981–2018 and were validated with data from US lakes sampled in the same time period. Those equations were used in this study to predict near-surface water temperatures for the time period 1981–2023. To validate their use in recent years, we obtained near-surface water quality data from 326 lakes sampled during 2019–2023 using the United States Geological Survey’s (USGS) Water Quality Portal (https://www.waterqualitydata.us/ (accessed on 24 September 2024)). The water temperatures taken at 1 m were considered as representative of near-surface water temperatures. The lake water temperatures were paired with 8-day mean air temperature (as determined from PRISM), latitudes, elevations, and the year of sampling using the predictive equations. The results for 2019–2023 were added to the validation data from the 1981–2018 study (2852 lakes) and a regression of measured water temperatures versus calculated water temperatures was used to determine how well the predicted equations were performing. Comparisons were made between the R2 and root mean squared error (RMSE) terms of the paired values for this study of 1981–2025 and the previous study [14] using 1981–2019 data.
Monthly mean water temperatures for each of the 1033 lakes for each of the 43 years were calculated using the predictive equations. Annual mean water temperatures for the 1033 lakes were calculated as weighted means. These were used in regressions of mean water temperatures in each month and the summer period versus years. If the regressions were statistically significant, their slopes would represent the rate of warming of United States lakes.

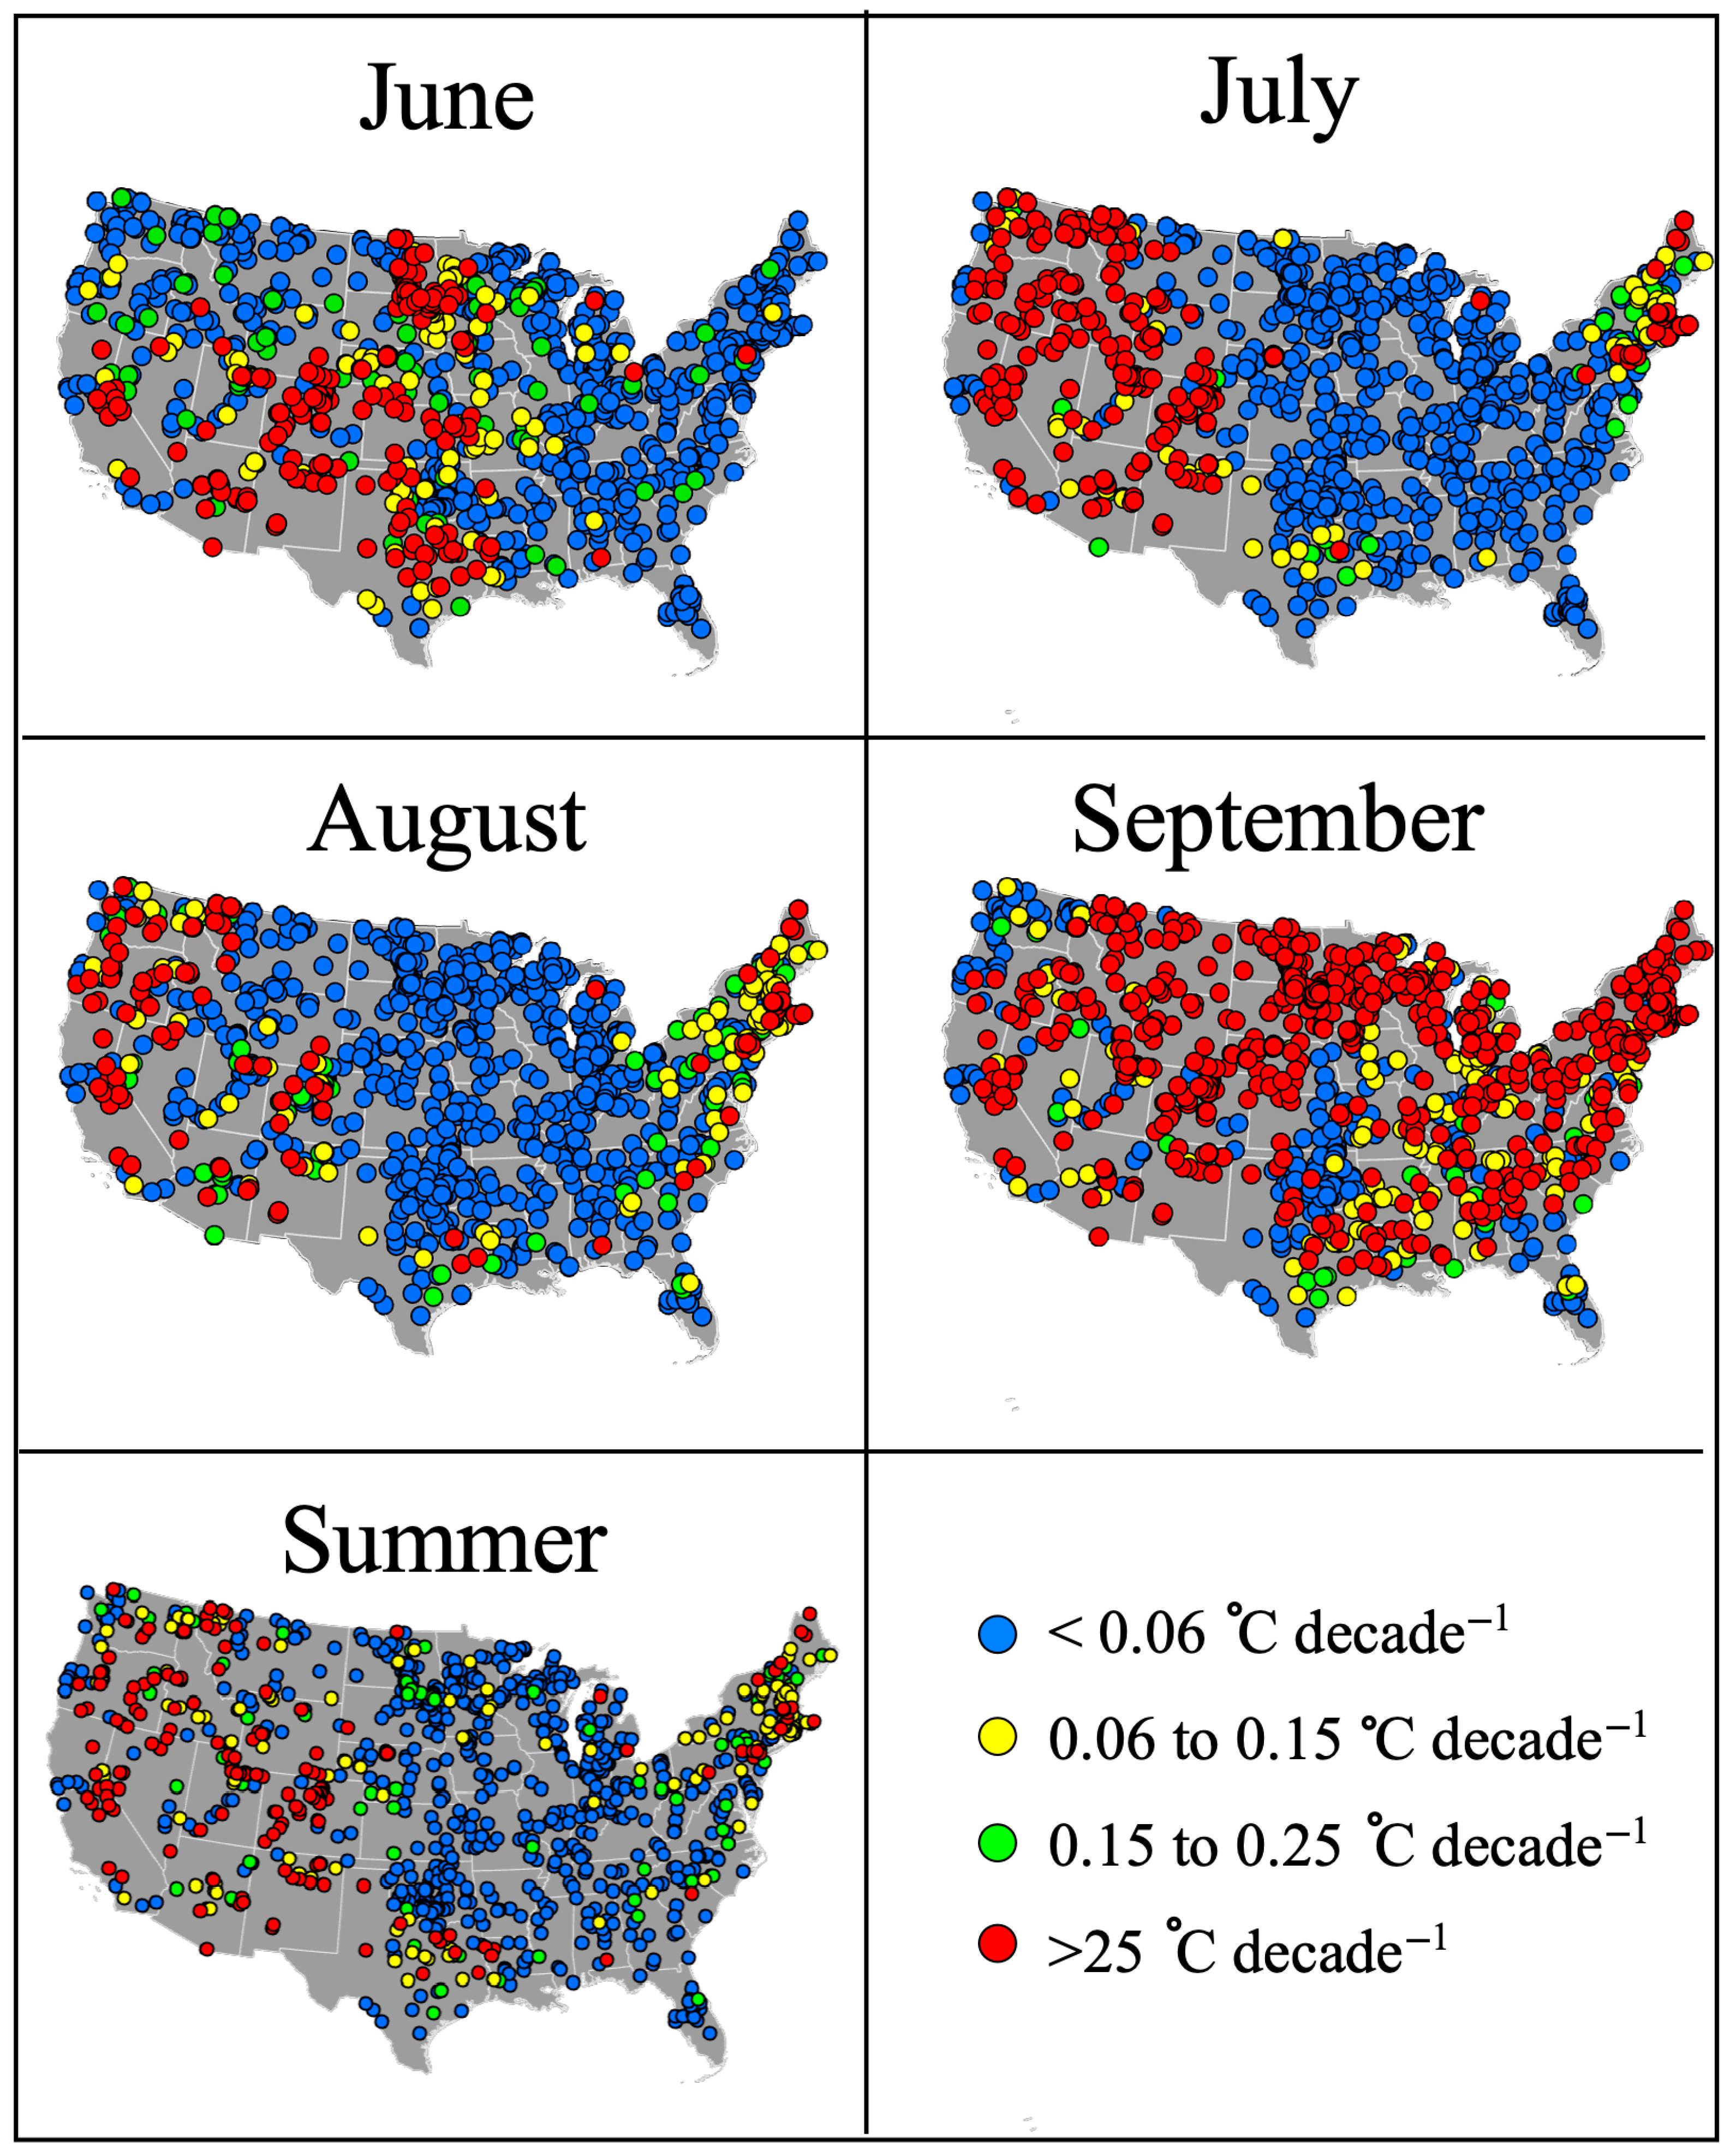
2.5. Rates of Change in Variables in Individual Lakes

In addition to overall means, I conducted individual time-series regressions for each lake (n = 1033) and analyzed the distribution of the slope coefficient to capture spatial variability in warming trends. This was performed for daily minimum, mean, and maximum air temperatures as well as the precipitation and dew point temperatures and the calculated water temperatures. I also plotted the rates of change in mean air temperatures and precipitation for the 1033 individual stations on a map of the coterminous Unites States to look for geographic patterns.

3. Results

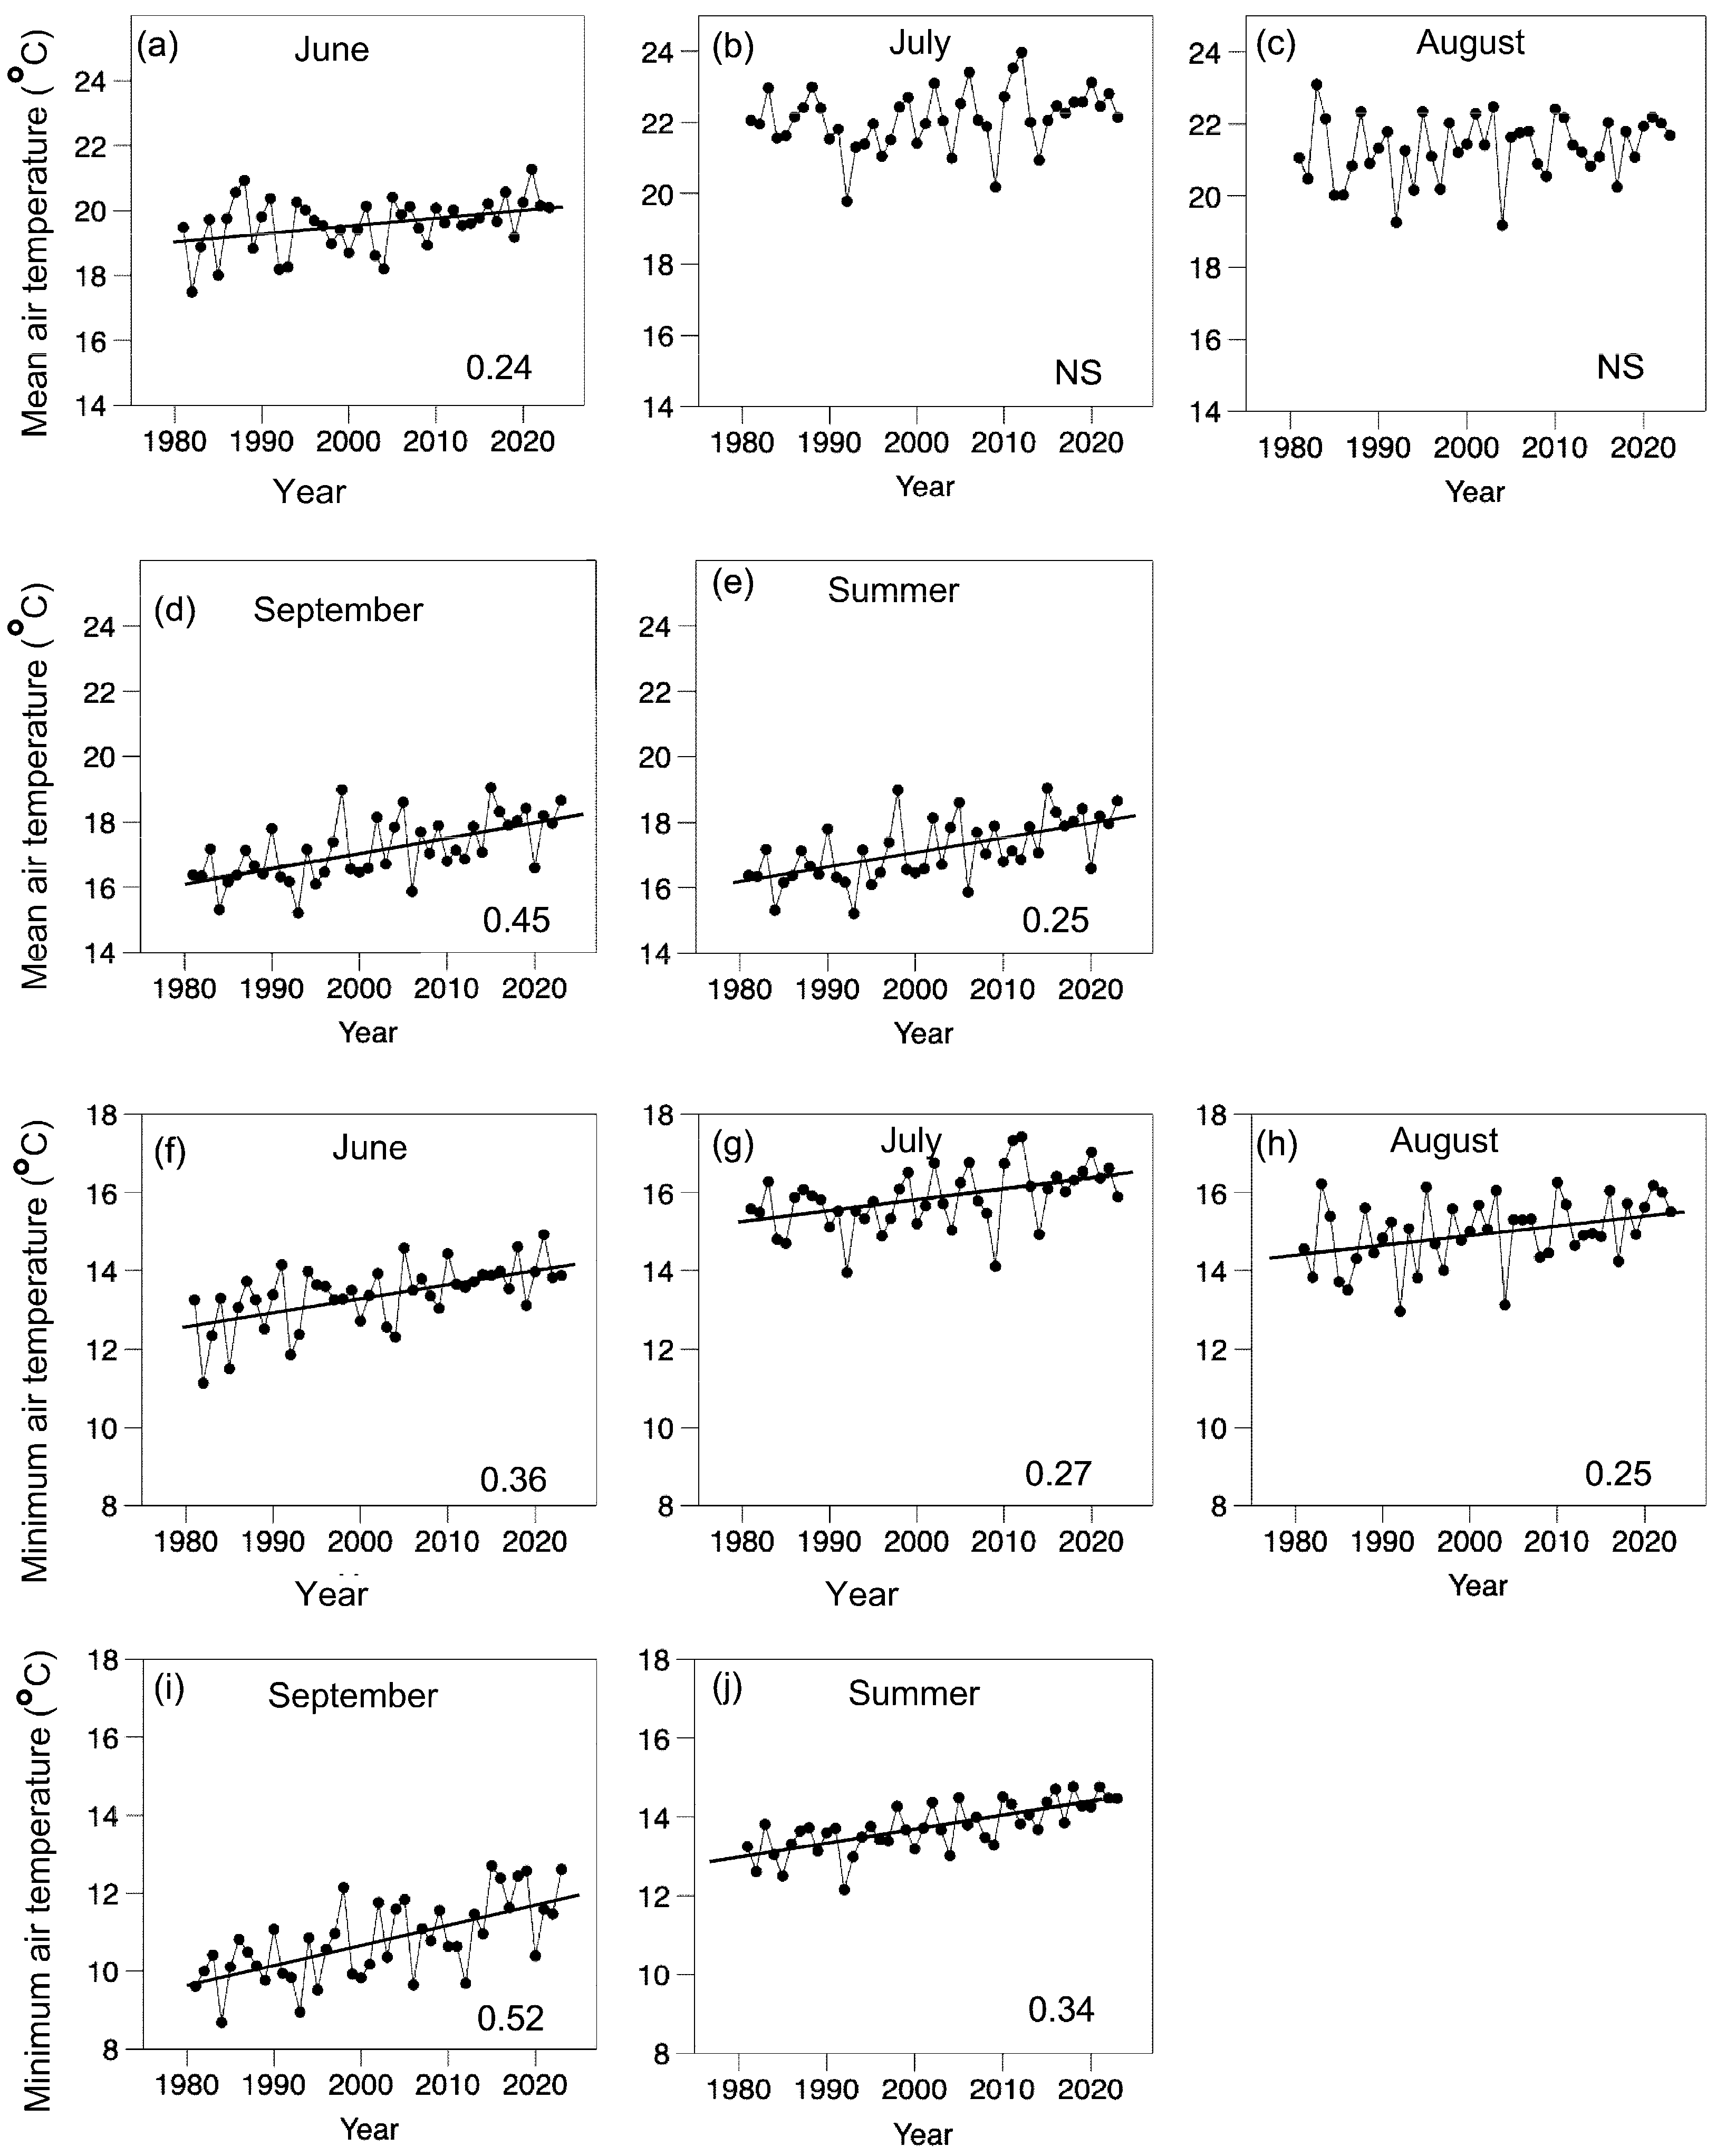
3.1. Changes in Mean Air Temperatures

Means of mean monthly air temperatures over United States lakes show considerable variability from year to year in the period 1981–2013 (Figure 1) There were statistically significant increases in the months of June and September and for the summer period (June through September), where the increase in mean daily air temperatures was 0.25 °C decade−1. The mean of the rates of change for the 1033 individual lakes (Table 1) had a value of 0.22°C decade−1. The individual values ranged from −0.00 to 0.91 °C decade−1. Increases in mean daily air temperatures for half of the lakes ranged from 0.00 to 0.35 °C decade−1.
The rates of change in mean daily air temperatures in the 1033 individual lakes show different patterns from month to month when plotted on the map of the United States (Figure 2). The lower rates tend to be clustered along the east coast in June. In July and August, they expand into the middle of the country as well. Then in September, there were many fewer lakes showing the lower rates of change. There were scattered high rates in the middle of the country in June, which then expanded into the western half of the country in July. There were fewer high rates in August but then a great expansion of high rate lakes in September. For the summer as a whole, lower rates seem to be found in the eastern half of the country with a scattering of higher rates in the western half.

3.2. Changes in Minimum Air Temperatures

Monthly mean minimum daily air temperatures showed statistically significant increases for each of the summer months and for the means of the four months for the summer (Figure 1). The summer means increase was 0.34 °C decade−1, indicating that the increase in minimum air temperatures was greater than the mean daily air temperatures over the sample lakes. The mean of the rates in the 1033 individual lakes of 0.34 °C decade−1 (Table 2) is higher than that for the mean daily air temperatures. The rates of change ranged from −0.29 to 1.32 °C decade−1, and half of them were between 0.23 and 0.49 °C decade−1.
The map of rates of changes in mean air temperatures in each of the 1033 lakes for the five time periods examined showed variability from month to month (Figure 2). In June, lower rates were present along the east coast. This group expands somewhat into the middle part of the country in July and August but largely disappears in September. The highest rates were found in the middle of the country in June and then covered most of the west in July. There are fewer points in August, but then most of the country has high rates during September. The summer as a whole had a mixture with most of the lower rates in the eastern half of the country with higher rates scattered in the western half.

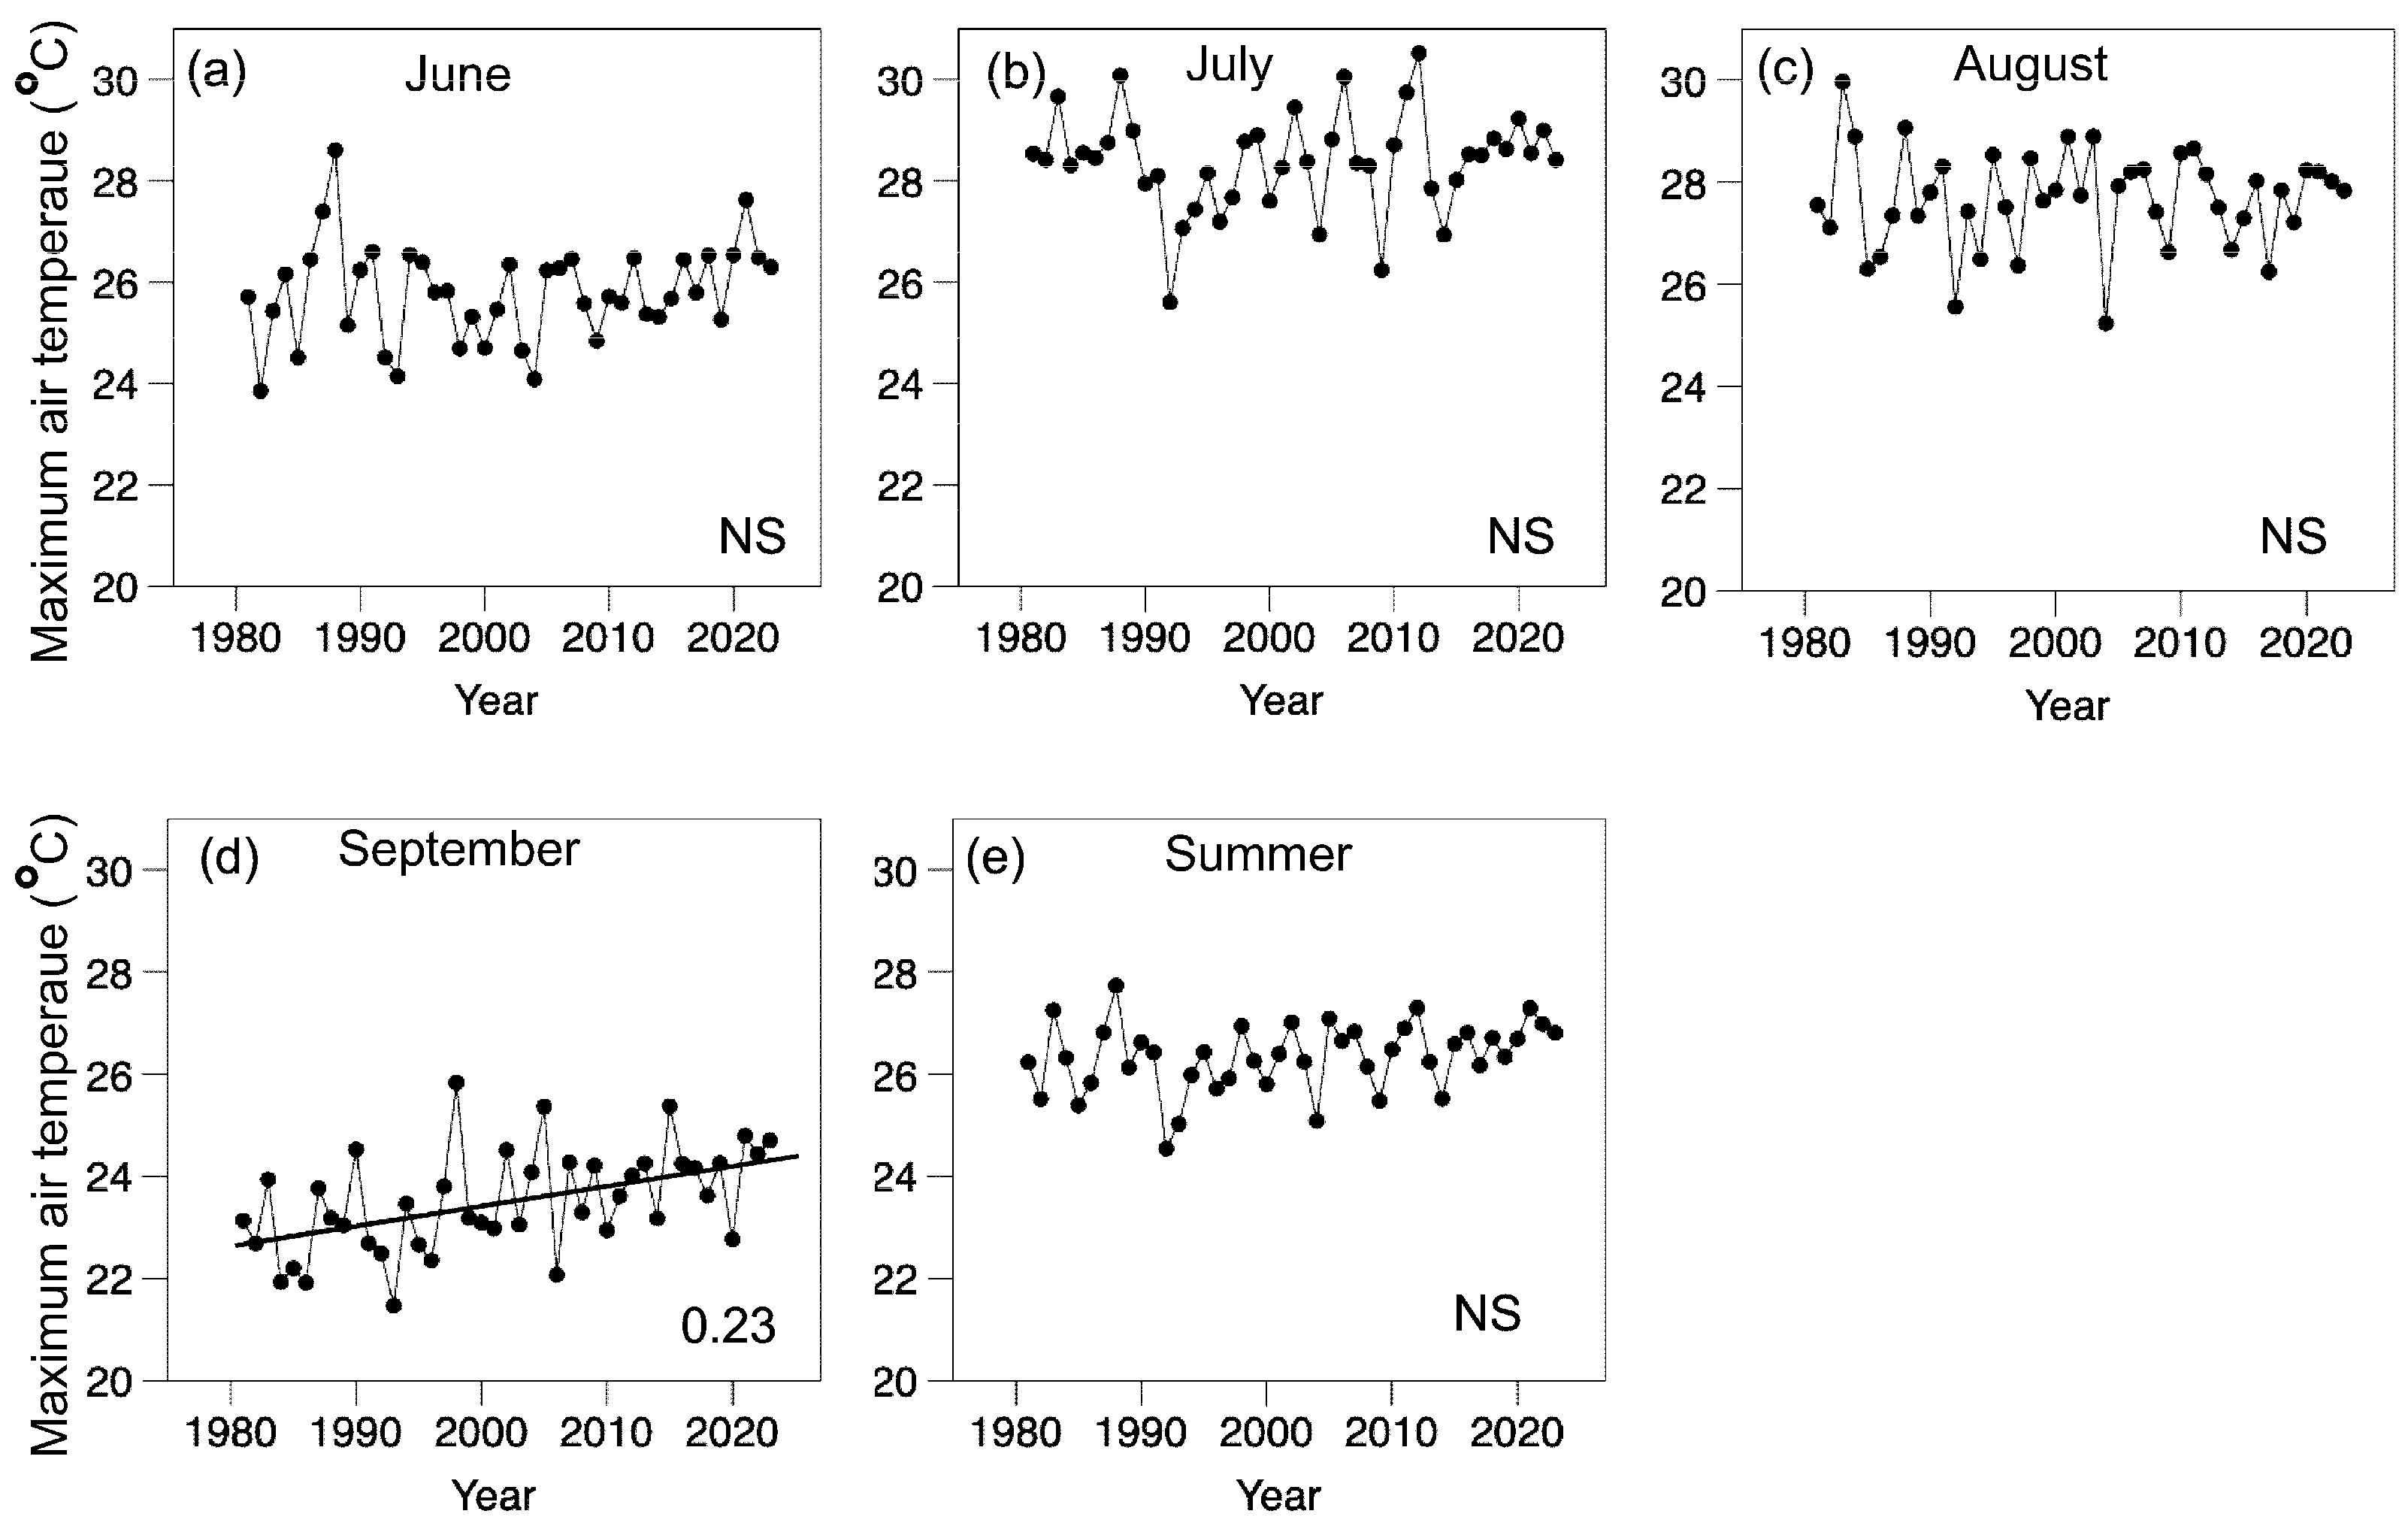
3.3. Changes in Maximum Air Temperatures

The mean of the maximum daily air temperatures only showed a statistically significant change in the period 1981–2023 for the month of September with a rate of 0.23 °C decade−1 (Figure 3). There was no statistically significant rate of change for the four months combined. The 1033 individual lakes showed daily maximum air temperatures that had a mean rate of 0.12 °C decade1 (Table 1). The individual rates ranged from −0.31 to 0.68 °C decade−1, and half of them were between 0.00 and 0.29 °C decade−1.

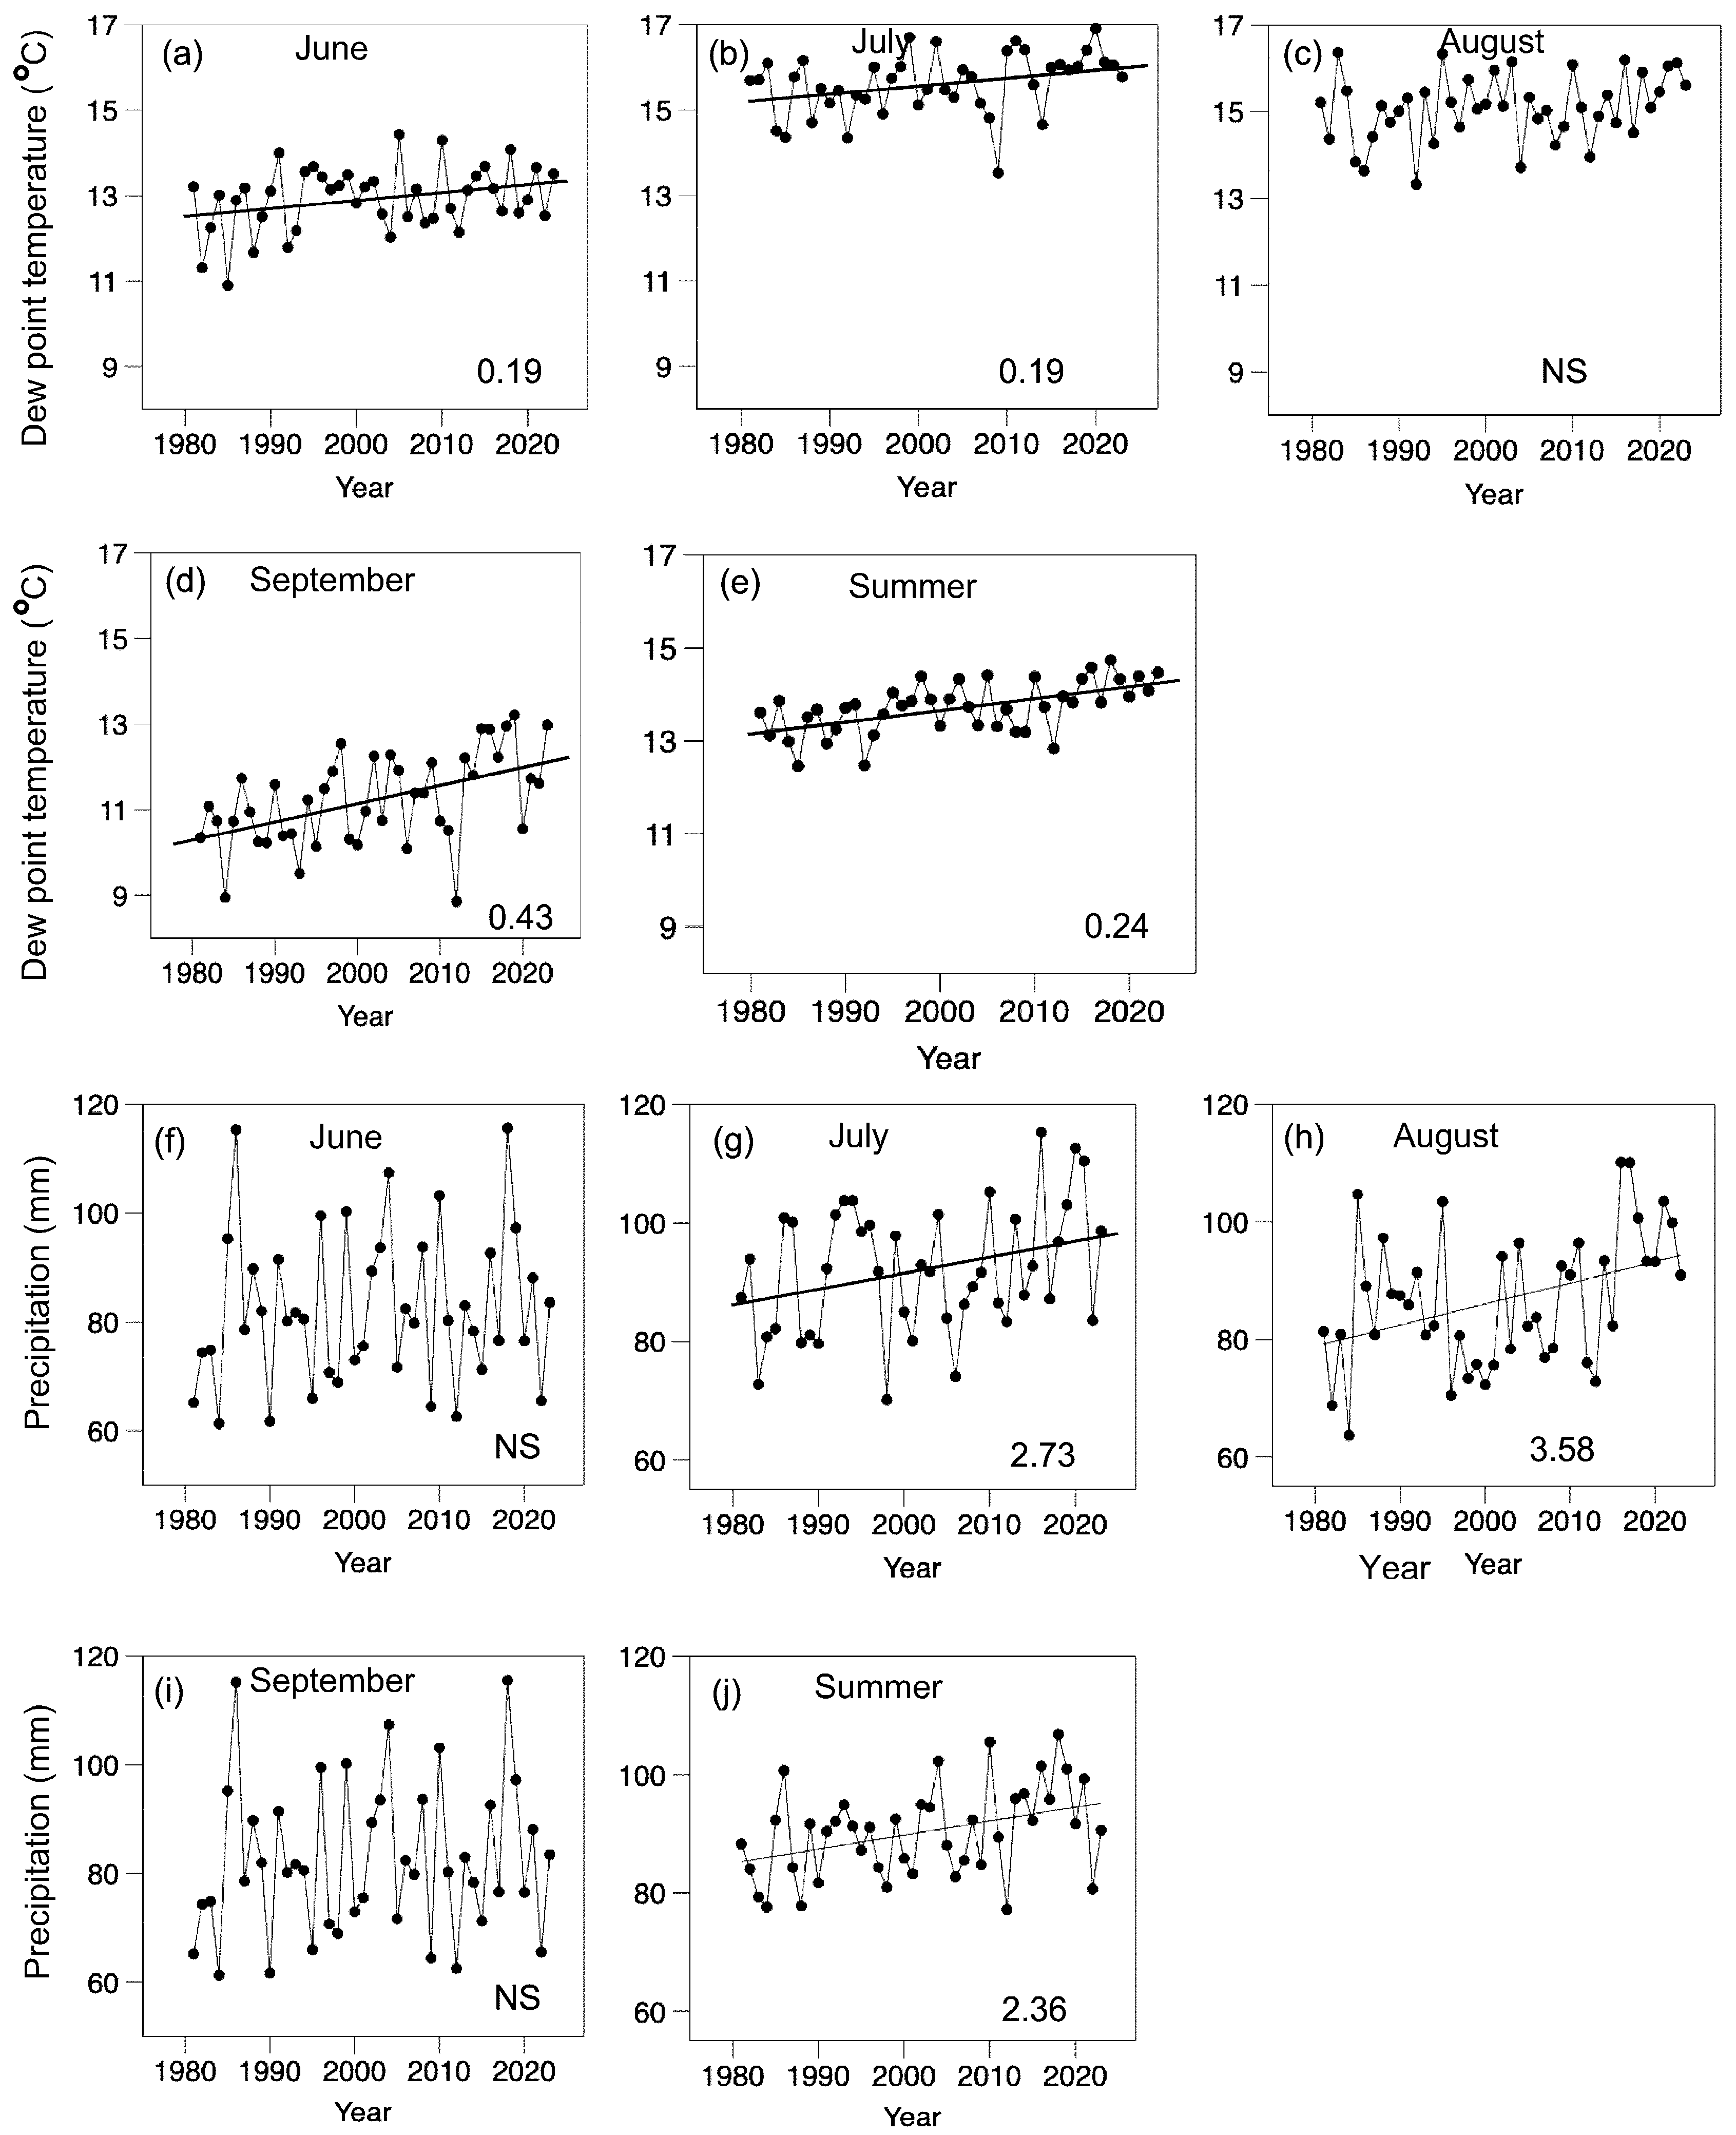
3.4. Changes in Dew Point Temperatures

The mean daily dew point temperatures had statistically significant increases for each month with the exception of August (Figure 4). The month of September had a high of 0.43 °C decade−1 and the summer mean was 0.24 °C decade−1. For the individual lakes, the mean rate was 0.18 °C decade−1 with a range of −0.61 to 0.74 °C decade−1 (Table 1).

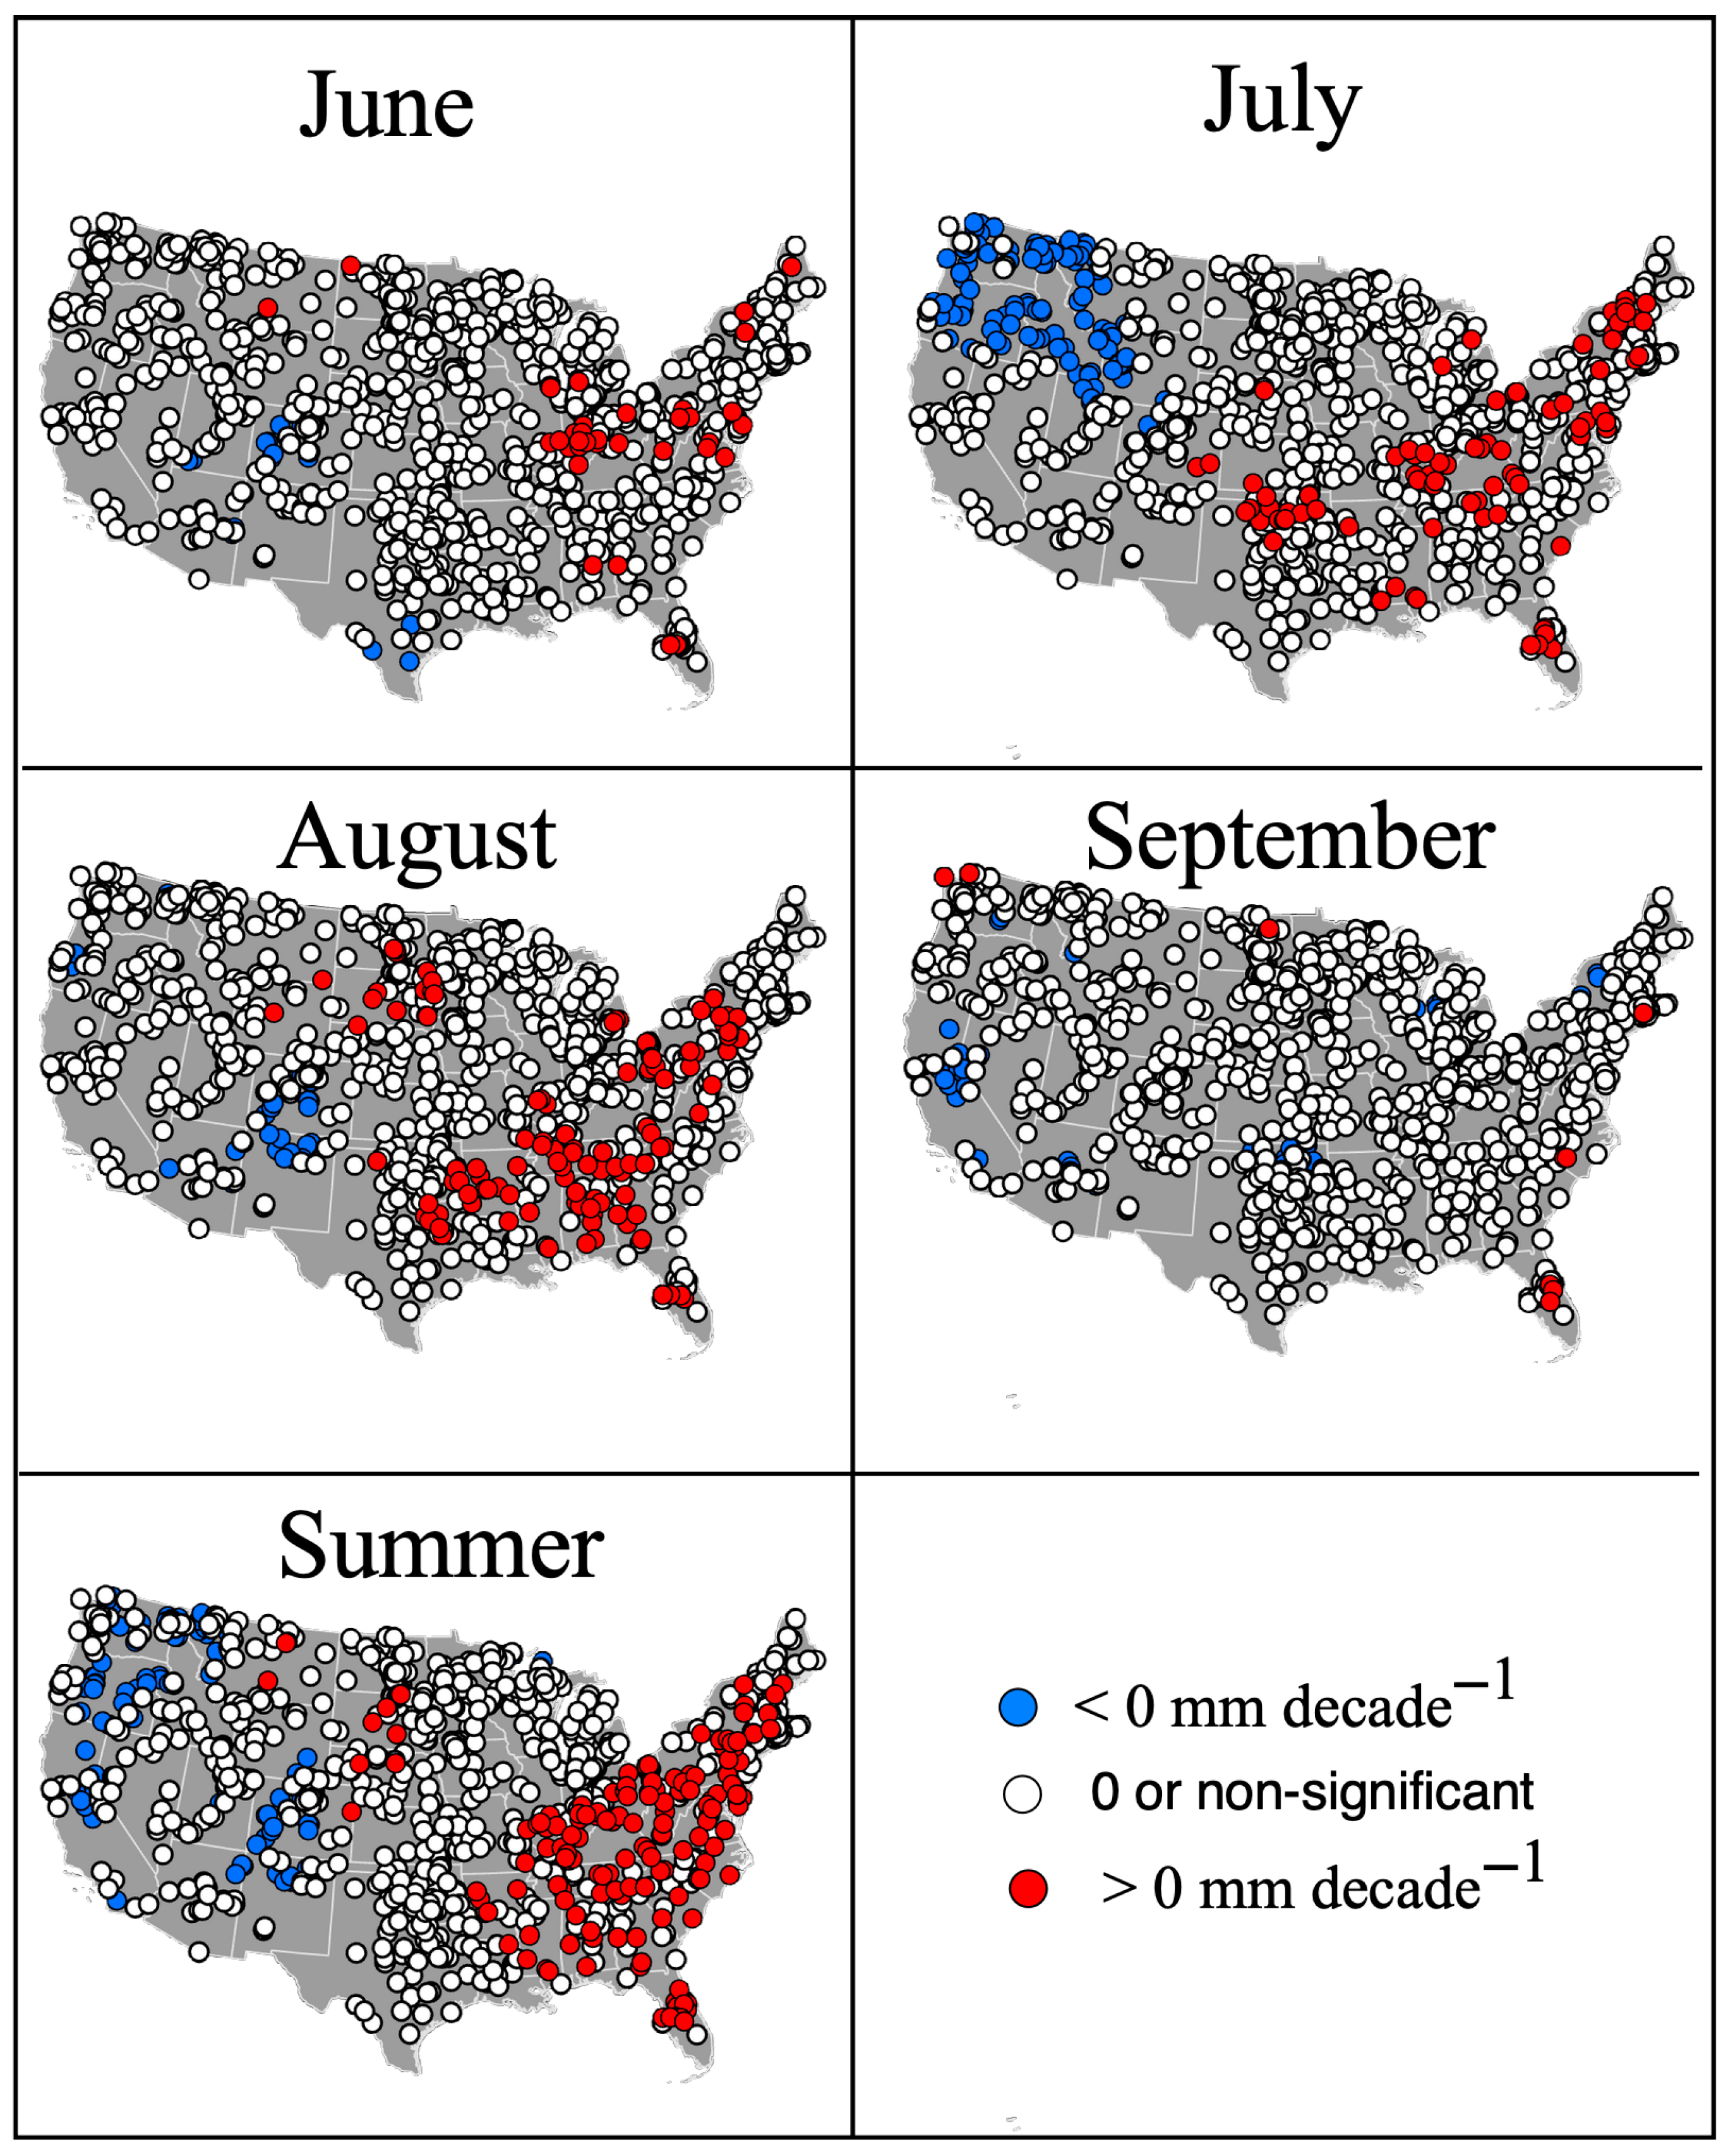
3.5. Changes in Precipitation

The mean rates of change in precipitation showed statistically significant increases for the months of July and August and for the summer months but not for June and September (Figure 4). The summer mean daily precipitation increased by 2.36 mm decade−1. For the individual lakes, precipitation was more variable than was true of the other meteorological variables with a coefficient of variation of 306% (Table 1). The mean rate of change in precipitation for the 1033 lakes was 1.08 mm decade−1 with a range of −9.05 to 21.23 mm decade−1. Half the lakes had no statistically significant change in precipitation in the course of 43 years. The map of rates of change in precipitation showed that for most months, precipitation rates did not differ from zero (Figure 5). There were a few small clusters in July and August. For the summer as a whole, there was a group of lakes with increases in precipitation along the east coast.

3.6. Water Temperature Model

In the validation of the model used to calculate water temperatures from 8-day means of mean air temperatures, latitude, elevation, and year for the period 1981–2023, a regression was run of measured water temperatures versus calculated water temperatures (Figure 6). The root mean squared error (RMSE) was 1.74 °C. This was very similar the previous RMSE of 1.69 °C found in the earlier study [14] with validation data from 1981 to 2018 indicating that the calculated water temperatures gave a good representation of water temperatures in the study lakes.

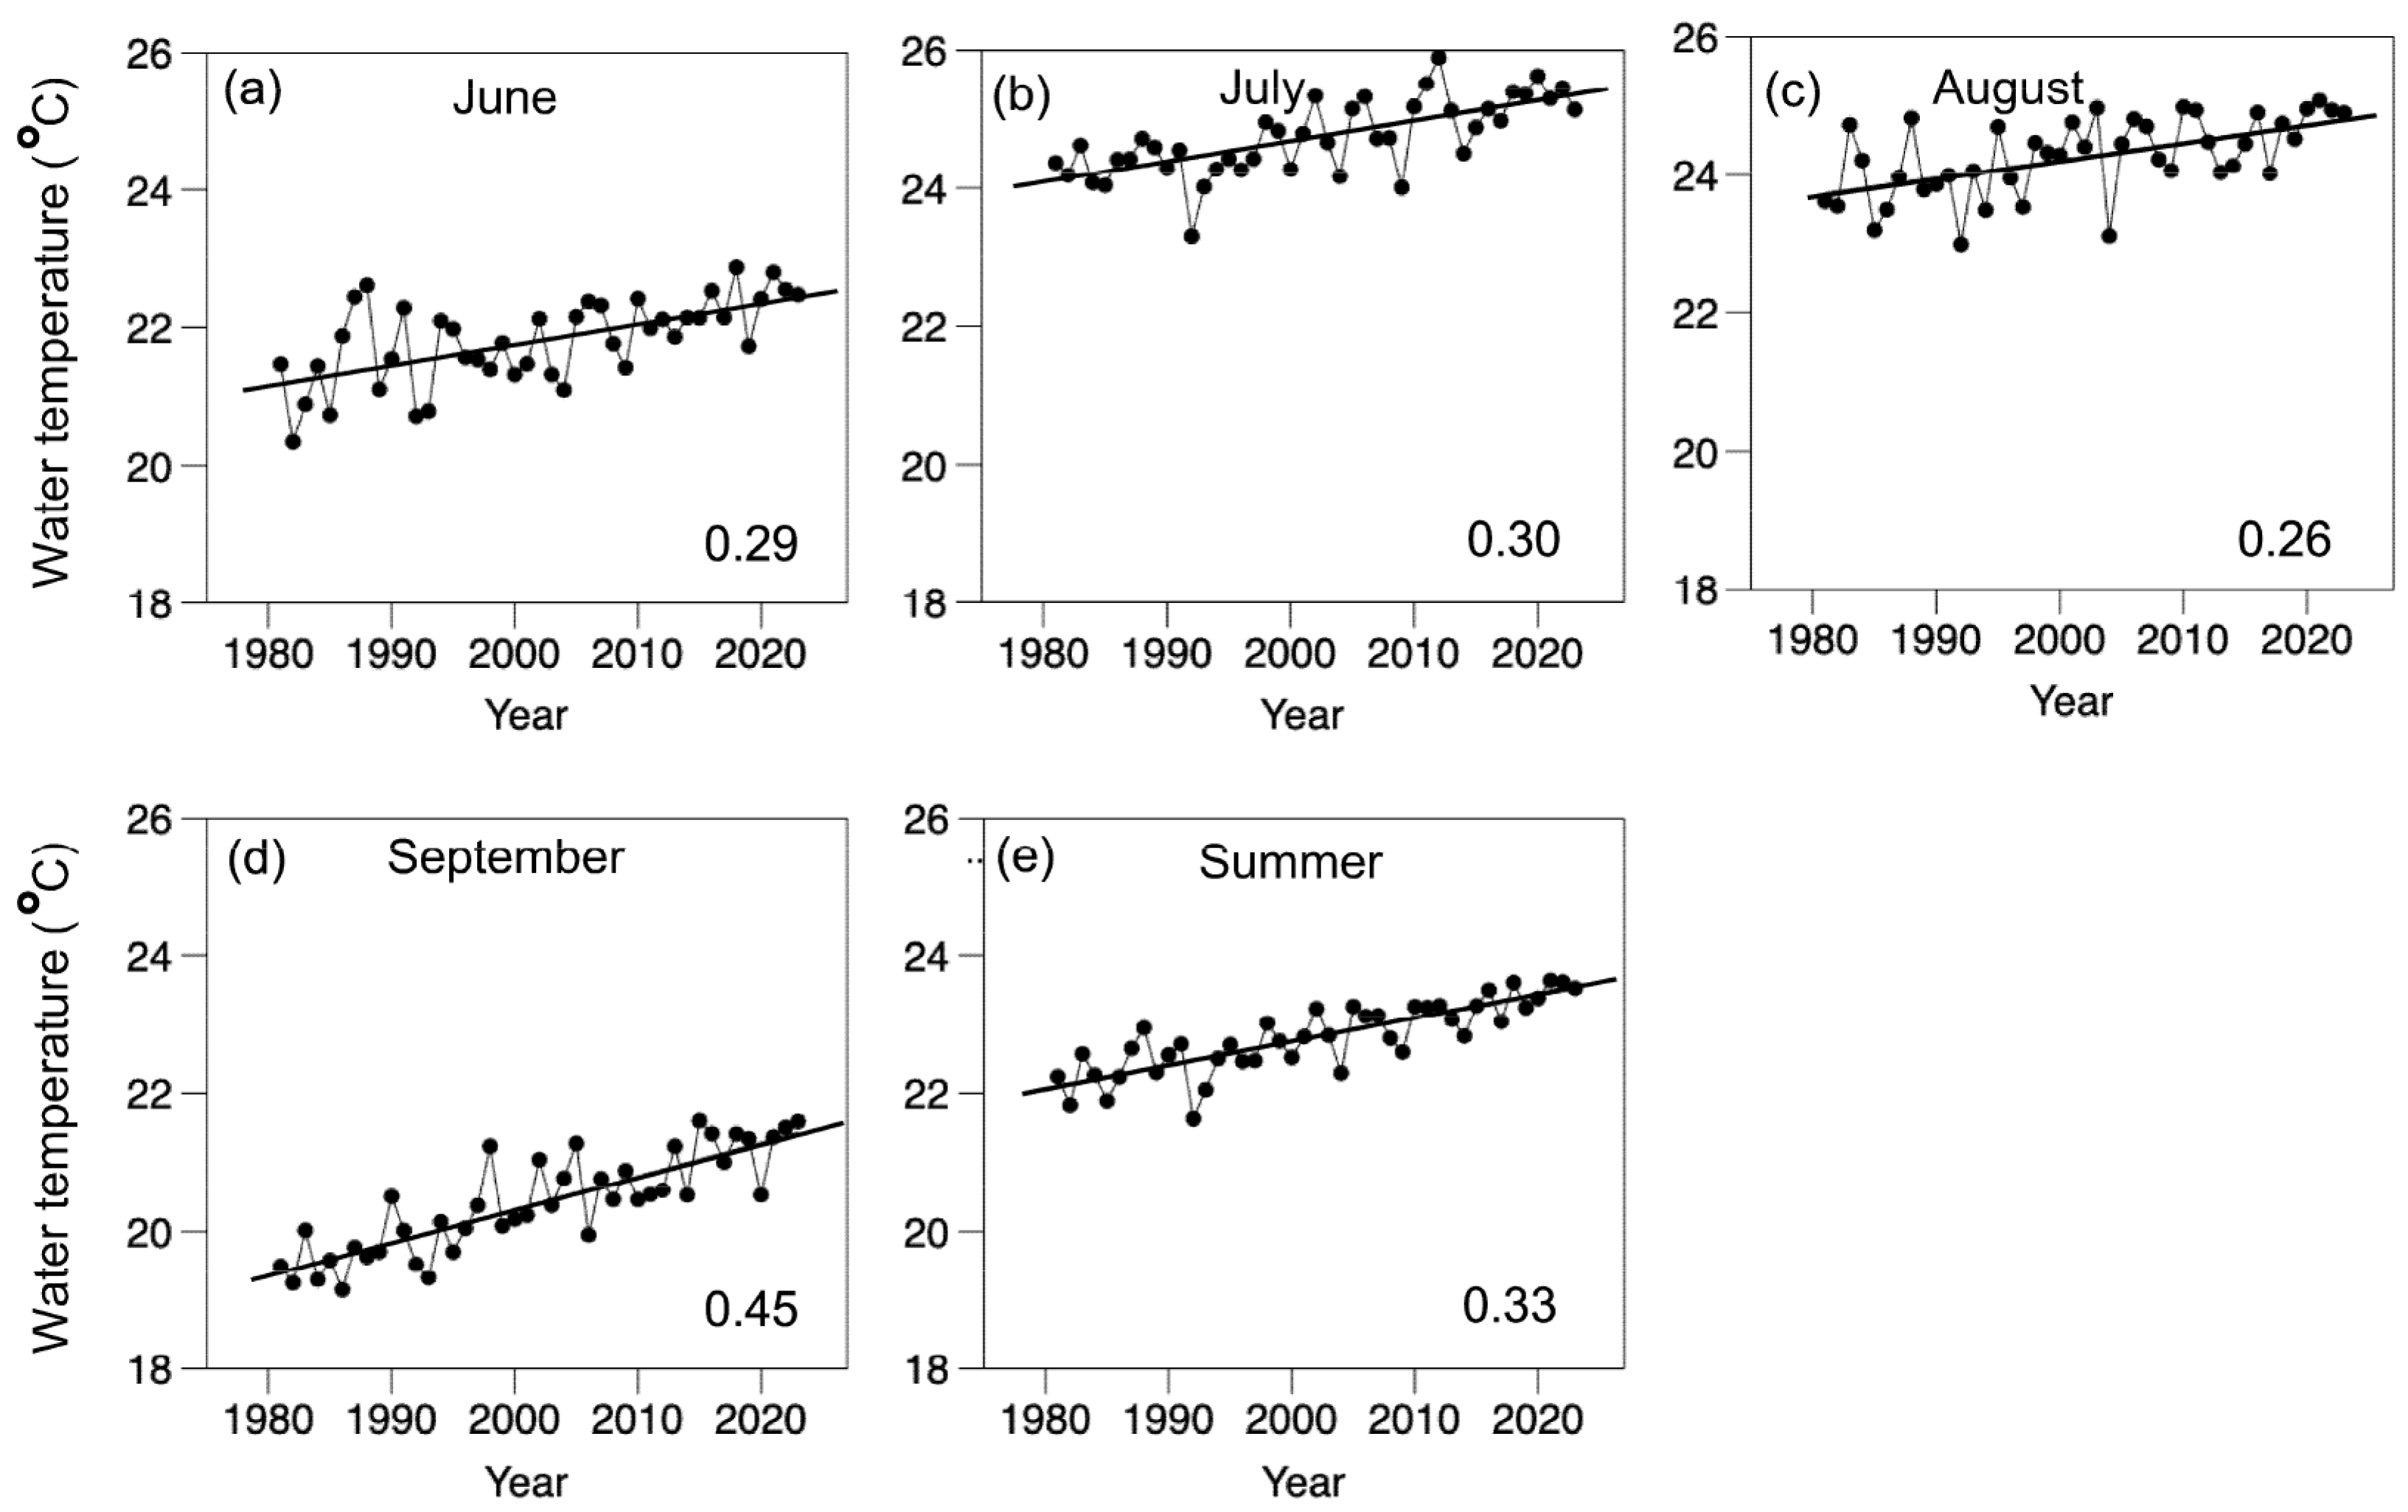
3.7. Changes in Water Temperatures

Mean daily near-surface water temperatures for the group of lakes showed statistically significant increases for each of the four months and their combined summer means (Figure 7). The greatest rate of change was in September with a rate of 0.45 °C decade−1. The summer rate of increase was 0.33 °C decade−1. In this study, we defined summer as the mean of June through September. We also looked at four other possible groups of months (Table 2) and found that the highest rate of 0.37 °C decade−1 was for the combination of August and September followed by July and September with a rate of near-surface water temperatures of 0.35 °C decade−1. The mean rate of increase in near-surface water temperatures for the 1033 individual lakes was 0.25 °C decade−1 (Table 1). The lake water temperature increases were less variable than the meteorological variables. For individual lakes, the rates of warming ranged from 0.09 to 0.71 °C decade−1 and half of the values were between 0.30 and 0.38 °C decade−1.

4. Discussion

Over the past 43 years there have been changes in the air temperatures over lakes of the United States both individually and as a group with generally increasing trends for minimum air temperatures and mean air temperatures during the months of June through September. The greatest increases have been in the daily minimum air temperatures followed by the mean daily air temperatures. Maximum daily air temperatures did not show a statistically significant increase for the summer season but did show a significant increase for the month of September. This signifies that the increases in mean daily air temperatures are due mainly to increases in the minimum air temperatures. Others have noted the same finding with minimum temperatures increasing at a faster rate than maximum temperatures. The result is that the difference between maximum and minimum daily temperatures is decreasing [26,27,28,29,30]. Trends in increases in minimum temperatures over global land areas have been attributed to changes in cloud cover, precipitation, cloud cover, and atmospheric circulation [30].
The mean dew point temperatures (Figure 4) also showed a statistically significant increase for the summer and for all months except for August. Their increase in the summer of 0.24 °C decade−1 was similar to that of the mean air temperatures at 0.24 °C decade−1 in the same months. The mean summer minimum temperature increases were greater at 0.34 °C decade−1. Others found similar increases in dew point temperatures [31,32].
The means of daily mean precipitation showed statistically significant increases for July and August and for the mean of all four summer months at 2.36 mm decade−1 (Figure 4). This finding is similar to what others have reported [33,34]. The regressions for the 1033 individual lakes show that most of the lakes do not show statistically significant changes in precipitation amounts over a 43-year period (Table 1). There does not seem to be an overall change in precipitation rates across all of the lakes in our sample.
This study showed a continuation of the trends in lake warming illustrated in a previous study [14] for the period 1981–2018. During the 43 years of this study, the near-surface water temperatures of the lakes of the United States on average have shown increases of 0.33 °C decade−1 for the four summer months as well as increases for each of the summer months (Figure 7). If summer is defined as August and September, the rate of increase would be of 0.37 °C decade−1 for July through September with an increase of 0.35 °C decade−1. The greatest rate of increase was found in the month of September with 0.45 °C decade−1. It is interesting to note that in comparing months, September also showed the greatest monthly increases in mean air temperature, minimum air temperature, maximum air temperature, and dew point temperature.
An examination of the plots of annual means of both the meteorological variables and near-surface water temperatures illustrates the high degree a variability from year to year for each of these variables. The same is true of the variability of the rates of changes among the 1033 lakes for all of the meteorological variables (Table 1). Changes in near-surface water temperatures for individual lakes had a range from 0.0 to 0.62 °C decade−1. This variability means that several years of data are necessary to make an accurate determination of the rates of warming of lakes.
This variability makes it difficult to make generalizations about climate change during the summer at United States lakes. There are differences from month to month and there are differences depending on geographic locations that change as illustrated by the maps of rates of change in mean daily air temperatures (Figure 2). The same kinds of differences were previously shown [14] for rates of change in near-surface water temperatures in United States lakes.
The results of this study apply to mean values for a large group of lakes; however, the variability found indicates that they have limitations in their application to individual lakes. When studying a single lake, one needs to assess climatic records for that location and also collect water temperature data to determine what predictive models might be used to hindcast past water temperatures. Lakes of great depth or area may not follow the same patterns shown here.
This study was focused on changes in climatic variables that may be important to near-surface water temperatures of lakes in the summer months. This time period was chosen in part because there is a concern about the biological impacts of increased water temperatures. This time period also avoids the problem of near-surface water temperatures in the winter months when a large fraction of the lakes have an ice cover. Also, there is an abundance of water temperature data available in the warmer months of the year.
The effects of climate change in the cooler months of the year are important for lakes. The climate determines when lakes freeze and thaw and also the patterns of water circulation and turnover. These can be of importance for processes like the circulation of nutrients and the timing of spring phytoplankton blooms. A different approach from the one used in this study will be required to understand the impacts of climate change in lakes during the cooler parts of the year.

5. Conclusions

Daily mean air temperatures in the summer months at lakes in the coterminous United States have increased in the period from 1981 through 2024. This has been due largely to increases in daily minimum air temperatures and not increases in maximum daily air temperatures. There have also been increases in the daily dew point temperatures. Lake near-surface water temperatures have been increasing in the same time period. Most lake locations did not show statistically significant changes in daily precipitation in the summer period. There is a great deal of variability from lake to lake and month to month in the trends detected for meteorological variables and near-surface lake water temperatures, so they have limitations in their application to individual lakes.

Funding

This research received no external funding.

Data Availability Statement

The basic data for this study are available from the cited sources in the Methods and Materials Section.

Acknowledgments

The ideas for this study benefitted from over 40 years of collaboration and discussions about limnology with Daniel E. Canfield Jr. who passed away in December 2024. The maps were created by Katherine Henning. Three anonymous reviewers made several suggestions for improvement of the manuscript.

Conflicts of Interest

The author declares no conflicts of interest.

References

  1. Edinger, J.E.; Duttweiler, D.W.; Geyer, J.C. The response of water temperatures to meteorological conditions. Water Resour. Res. 1968, 4, 1137–1143. [Google Scholar] [CrossRef]
  2. Zhou, J.; Leavitt, P.R.; Rose, K.C.; Wang, X.; Zhang, Y.; Shi, K.; Qin, B. Controls of thermal response of temperate lakes to atmospheric warming. Nat. Commun. 2023, 14, 6503. [Google Scholar] [CrossRef] [PubMed]
  3. Tong, Y.; Feng, L.; Wang, X.; Pi, X.; Xu, W.; Woolway, R.I. Global lakes are warming slower than surface air temperature due to accelerated evaporation. Nat. Water 2023, 1, 929–940. [Google Scholar] [CrossRef]
  4. Fink, G.; Schmid, M.; Wahl, B.; Wolf, T.; Wüest, A. Heat flux modifications related to climate-induced warming of large European lakes. Water Resour. Res. 2014, 50, 2072–2085. [Google Scholar] [CrossRef]
  5. Wang, S.; He, Y.; Hu, S.; Ji, F.; Wang, B.; Guan, X.; Piccolroaz, S. Enhanced warming in global dryland lakes and its drivers. Remote Sens. 2021, 14, 86. [Google Scholar] [CrossRef]
  6. Lathrop, R.C.; Kasprzak, P.; Tarvainen, M.; Ventelä, A.M.; Keskinen, T.; Koschel, R.; Robertson, D.M. Seasonal epilimnetic temperature patterns and trends in a suite of lakes from Wisconsin (USA), Germany, and Finland. Inland Waters 2019, 9, 471–488. [Google Scholar] [CrossRef]
  7. Sharma, S.; Gray, D.K.; Read, J.S.; O’reilly, C.M.; Schneider, P.; Qudrat, A.; Gries, C.; Stefanoff, S.; Hampton, S.E.; Hook, S.; et al. A global database of lake surface temperatures collected by in situ and satellite methods from 1985–2009. Sci. Data 2015, 2, 1–19. [Google Scholar] [CrossRef] [PubMed]
  8. Wang, X.; Shi, K.; Zhang, Y.; Qin, B.; Zhang, Y.; Wang, W.; Woolway, R.I.; Piao, S.; Jeppesen, E. Climate change drives rapid warming and increasing heatwaves of lakes. Sci. Bull. 2023, 68, 1574–1584. [Google Scholar] [CrossRef] [PubMed]
  9. Wang, W.; Shi, K.; Wang, X.; Zhang, Y.; Qin, B.; Zhang, Y.; Woolway, R.I. The impact of extreme heat on lake warming in China. Nat. Commun. 2024, 15, 70. [Google Scholar] [CrossRef] [PubMed]
  10. Wu, Y.; Ji, F.; Wang, S.; He, Y.; Hu, S. Increased Warming Efficiencies of Lake Heatwaves Enhance Dryland Lake Warming over China. Remote Sens. 2024, 16, 588. [Google Scholar] [CrossRef]
  11. O'Reilly, C.M.; Sharma, S.; Gray, D.K.; Hampton, S.E.; Read, J.S.; Rowley, R.J.; Schneider, P.; Lenters, J.D.; McIntyre, P.B.; Kraemer, B.M.; et al. Rapid and highly variable warming of lake surface waters around the globe. Geophys. Res. Lett. 2015, 42, 10–773. [Google Scholar] [CrossRef]
  12. Pareeth, S.; Salmaso, N.; Adrian, R.; Neteler, M. Homogenised daily lake surface water temperature data generated from multiple satellite sensors: A long-term case study of a large sub-Alpine lake. Sci. Rep. 2016, 6, 31251. [Google Scholar] [CrossRef] [PubMed]
  13. Winslow, L.A.; Hansen, G.J.; Read, J.S.; Notaro, M. Large-scale modeled contemporary and future water temperature estimates for 10774 Midwestern US Lakes. Sci. Data 2017, 4, 1–11. [Google Scholar] [CrossRef] [PubMed]
  14. Bachmann, R.W.; Canfield, D.E., Jr.; Sharma, S.; Lecours, V. Warming of near-surface summer water temperatures in lakes of the conterminous United States. Water 2020, 12, 3381. [Google Scholar] [CrossRef]
  15. Piccolroaz, S.; Healey, N.C.; Lenters, J.D.; Schladow, S.G.; Hook, S.J.; Sahoo, G.B.; Toffolon, M. On the predictability of lake surface temperature using air temperature in a changing climate: A case study for Lake Tahoe (USA). Limnol. Oceanog. 2018, 63, 243–261. [Google Scholar] [CrossRef]
  16. Zhu, S.; Ptak, M.; Sojka, M.; Piotrowski, A.P.; Luo, W. A simple approach to estimate lake surface water temperatures in Polish lowland lakes. J. Hydrol. Reg. Stud. 2023, 48, 101468. [Google Scholar] [CrossRef]
  17. Piccolroaz, S.; Woolway, R.I.; Merchant, C.J. Global reconstruction of twentieth century lake surface water temperature reveals different warming trends depending on the climatic zone. Clim. Change 2020, 160, 427–442. [Google Scholar] [CrossRef]
  18. Lang, J.; Ma, Y.; Li, Z.; Su, D. The impact of climate warming on lake surface heat exchange and ice phenology of different types of lakes on the Tibetan Plateau. Water 2021, 13, 634. [Google Scholar] [CrossRef]
  19. Zhu, S.; Ptak, M.; Yaseen, Z.M.; Dai, J.; Sivakumar, B. Forecasting surface water temperature in lakes: A comparison of approaches. J. Hydrol. 2020, 585, 124809. [Google Scholar] [CrossRef]
  20. Wan, W.; Zhao, L.; Xie, H.; Liu, B.; Li, H.; Cui, Y.; Ma, Y.; Hong, Y. Lake surface water temperature change over the Tibetan plateau from 2001 to 2015: A sensitive indicator of the warming climate. Geophys. Res. Lett. 2018, 45, 11–177. [Google Scholar] [CrossRef]
  21. Bachmann, R.W.; Canfield, D.E. An assessment of air and lake water temperatures (1981–2020) in Florida with a hindcast to 1895. Fla. Sci. 2024, 87, 38–60. [Google Scholar]
  22. Peng, Z.; Yang, J.; Luo, Y.; Yang, K.; Shang, C. Impact of climate warming on the surface water temperature of plateau lake. Acta. Geophys. 2021, 69, 895–907. [Google Scholar] [CrossRef]
  23. Winslow, L.A.; Leach, T.H.; Rose, K.C. Global lake response to the recent warming hiatus. Environ. Res. Lett. 2018, 13, 054005. [Google Scholar] [CrossRef]
  24. Zhang, Y.; Shi, K.; Woolway, R.I.; Wang, X.; Zhang, Y. Climate warming and heatwaves accelerate global lake deoxygenation. Sci. Adv. 2025, 11, eadt5369. [Google Scholar] [CrossRef] [PubMed]
  25. USEPA. National Lakes Assessment 2007; A Collaborative Survey of Lakes in the United States; EPA 841-R-16-009; United States Environmental Protection Agency: Washington, DC, USA, 2009.
  26. Qu, M.; Wan, J.; Hao, X. Analysis of diurnal air temperature range change in the continental United States. Weather Clim. Extrem. 2014, 4, 86–95. [Google Scholar] [CrossRef]
  27. Karl, T.R.; Kukla, G.; Gavin, J. Decreasing diurnal temperature range in the United States and Canada from 1941 through 1980. J. Appl. Meteorol. Climatol. 1984, 23, 1489–1504. [Google Scholar] [CrossRef]
  28. Cao, H.X.; Mitchell, J.F.B.; Lavery, J.R. Simulated diurnal range and variability of surface temperature in a global climate model for present and doubled C0 2 climates. J. Clim. 1992, 5, 920–943. [Google Scholar] [CrossRef]
  29. Lobell, D.B.; Bonfils, C.; Duffy, P.B. Climate change uncertainty for daily minimum and maximum temperatures: A model inter-comparison. Geophys. Res. Lett. 2007, 34, L05715. [Google Scholar] [CrossRef]
  30. Vose, R.S.; Easterling, D.R.; Gleason, B. Maximum and minimum temperature trends for the globe: An update through 2004. Geophys. Res. Lett. 2005, 32, L23822. [Google Scholar] [CrossRef]
  31. Robinson, P.J. Temporal trends in United States dew point temperatures. Int. J. Climatol. 2000, 20, 985–1002. [Google Scholar] [CrossRef]
  32. Knappenberger, P.C.; Michaels, P.J.; Schwartzman, P.D. Observed changes in the diurnal temperature and dewpoint cycles across the United States. Geophys. Res. Lett. 1996, 23, 2637–2640. [Google Scholar] [CrossRef]
  33. Higgins, R.W.; Silva, V.B.S.; Shi, W.; Larson, J. Relationships between climate variability and fluctuations in daily precipitation over the United States. J. Clim. 2007, 20, 3561–3579. [Google Scholar] [CrossRef]
  34. Harp, R.D.; Horton, D.E. Observed changes in daily precipitation intensity in the United States. Geophys. Res. Lett. 2022, 49, e2022GL099955. [Google Scholar] [CrossRef]
Figure 1. Monthly mean air temperatures in June (a), July (b), August (c), and September (d) and for the entire summer (e) and monthly minimum temperatures in June (f), July (g), August (h), and September (i) and for the entire summer (j). Fitted linear regression lines are shown when statistically significantly different from zero (p = 0.05). The numbers in the lower right corner are rates of change in °C decade−1.
Water 17 02138 g001
Figure 2. Rates of change in mean air temperatures over 1033 United States lakes in the time period 1981–2024.
Water 17 02138 g002
Figure 3. Monthly maximum air temperatures in June (a), July (b), August (c), and September (d) and for the entire summer (e). The fitted linear regression line is shown when statistically significantly different from zero (p = 0.05). The number in the lower right corner is the rate of change in °C decade−1.
Water 17 02138 g003
Figure 4. Monthly mean values for dew point temperatures in June (a), July (b), August (c), and September (d) and for the entire summer (e). Fitted linear regression lines are shown when statistically significantly different from zero (p = 0.05). The numbers in the lower right corner are rates of change in °C decade−1. Mean daily precipitation in June (f), July (g), August (h), and September (i) and for the entire summer (j). The numbers in the lower right corner are rates of change in mm decade−1.
Water 17 02138 g004
Figure 5. Rates of change in precipitation over 1033 United States lakes in the time period 1981–2024. White dots indicate lakes with no statically significant changes.
Water 17 02138 g005
Figure 6. Measured daily water temperatures versus calculated water temperatures for United States lakes for the years 1981–2023.
Water 17 02138 g006
Figure 7. Monthly calculated near-surface water temperatures in June (a), July (b), August (c), and September (d) and for the entire summer (e). Fitted linear regression lines are shown when statistically significantly different from zero (p = 0.05). The numbers in the lower right corner are rates of change in °C decade−1.
Water 17 02138 g007
Table 1. Summary statistics for the distributions of rates of temperature change (°C decade−1) or precipitation (mm decade−1) in the period 1981–2014 for 1033 lakes in the coterminous United States.
WaterMean AirMin AirMax AirPrecipDew Pt
Mean0.250.220.340.121.080.18
Standard Deviation0.070.180.210.193.850.21
Standard Error0.0020.0060.0070.0060.1200.006
Frequency Distributions
Minimum0.000.00−0.29−0.31−9.05−0.61
2.5%0.140.000.020.00−4.800.35
25%0.210.000.230.000.000.00
50%0.240.250.340.000.000.22
75%0.290.350.480.290.000.31
97.5%0.410.590.760.5411.680.58
Maximum0.620.911.320.6821.330.74
Table 2. Slopes (°C decade−1) with standard errors of the mean near-surface water temperatures in lakes of the coterminous United States versus years for different time periods in the summers of 1981–2024. The summer temperatures represent the mean summer temperatures for the months of June through September each year. Slopes for other combinations of 2 or more months are also presented.
Time PeriodRate of Change in Temperature
(°C Decade−1)
Standard Error of
The Mean (°C)
June0.290.06
July0.300.05
August0.260.06
September0.490.05
June–September0.330.04
June–August0.280.04
July–September0.350.04
July–August0.280.05
August–September0.370.04
Disclaimer/Publisher’s Note: The statements, opinions and data contained in all publications are solely those of the individual author(s) and contributor(s) and not of MDPI and/or the editor(s). MDPI and/or the editor(s) disclaim responsibility for any injury to people or property resulting from any ideas, methods, instructions or products referred to in the content.

