Article

Water Quality and Biological Response in the Deschutes River, Oregon, Following the Installation of a Selective Water Withdrawal

by
Joseph M. Eilers
1,*,
Tim Nightengale
2,† and
Kellie B. Vache
3
1
MaxDepth Aquatics, Inc., Bend, OR 97701, USA
2
R2 Resource Consultants, Inc., Redmond, DC 98052, USA
3
Electrical Engineering and Computer Science, Oregon State University, Corvallis, OR 97331, USA
*
Author to whom correspondence should be addressed.
Current address: Stantec, Seattle, DC 98004, USA.
Water 2025, 17(14), 2091; https://doi.org/10.3390/w17142091
Submission received: 30 May 2025 / Revised: 2 July 2025 / Accepted: 8 July 2025 / Published: 13 July 2025
(This article belongs to the Section Hydrology)

Abstract

Selective water withdrawals (SWWs) are frequently used to minimize the downstream effects of dams by blending water from different depths to achieve a desired temperature regime in the river. In 2010, an SWW was installed on the outlet structure of the primary hydropower reservoir on the Deschutes River (Oregon, USA) to increase spring temperatures by releasing a combination of surface water and bottom waters from a dam that formerly only had a hypolimnetic outlet. The objective of increasing spring river temperatures was to recreate pre-dam river temperatures and optimize conditions for the spawning and rearing of anadromous fish. The operation of the SWW achieved the target temperature regime, but the release of surface water from a hypereutrophic impoundment resulted in a number of unintended consequences. These changes included significant increases in river pH and dissolved oxygen saturation. Inorganic nitrogen releases decreased in spring but increased in summer. The release of surface water from the reservoir increased levels of plankton in the river resulting in changes to the macroinvertebrates such as increases in filter feeders and a greater percentage of taxa tolerant to reduced water quality. No significant increase in anadromous fish was observed. The presence of large irrigation diversions upstream of the reservoir was not accounted for in the temperature analysis that led to the construction of the SWW. This complicating factor would have reduced flow in the river leading to increased river temperatures at the hydropower site during the measurement period used to develop representations of historical temperature. The analysis supports the use of numerical models to assist in forecast changes associated with SWWs, but the results from this project illustrate the need for greater consideration of complex responses of aquatic communities caused by structural modifications to dams.

1. Introduction

The number of dams worldwide continues to increase raising concerns for the ecological integrity of rivers [1,2,3]. Dams provide important benefits, including flood control, river navigation, irrigation storage, and hydropower. Additionally, the use of reservoirs to mitigate the effects of climate change has offered another incentive for managing flows from reservoirs [4,5]. However, the waters downstream of dams have experienced ecological damage by blocking fish passage and reducing river water quality thus negatively impacting lotic biota [6,7]. One of the common water quality impacts involves the alteration of downstream river temperature. Release from reservoir surface waters can warm discharge waters, whereas hypolimnetic releases can cause rivers to be cooled to levels considered damaging to aquatic insects [8]. These types of problems have been addressed by using multiple outlets positioned at various depths in the reservoirs to provide discharge water with intermediate temperatures to meet the objectives of a particular application. Selective water withdrawals have been identified relatively early to mitigate the effects of dams [9] and have become widely adopted as a means to resolve riverine temperatures and other water quality challenges resulting from constructing dams [10,11,12].
Anadromous fish face a variety of challenges as they attempt to reproduce and thrive in river systems that are often dammed. Among these challenges are changes in river temperature, the alteration of flow regimes, impacts to habitat, increased turbidity, and the alteration of benthic communities. The dam on the Deschutes River is judged to have little impact on downstream geomorphology because it is operated as a run-of-river system [13]. Analyses conducted by fisheries biologists concluded that river temperatures had been excessively cooled by the hypolimnetic outlet and that spring temperatures needed to be increased to provide a more favorable thermal regime for returning anadromous fish. Additionally, the smolts migrating through Lake Billy Chinook, the uppermost impoundment, had poor success in reaching transport pens because of complex circulation patterns in the reservoir. The installation of a selective water withdrawal with a surface flow could potentially solve this problem by creating an attractant flow to fish collection facilities at the dam.
Here we report on one such case where a SWW was installed, not only to optimize downstream water temperature, but also to create an attractant flow in the reservoir, towards the dam, to facilitate the collection of smolts for transport below the hydropower project. Prior to the construction of the SWW, numerical modeling was conducted in the three hydropower impoundments and in the river below to assess whether the operation of the SWW would achieve the target temperatures of the release water and to ensure that its operation would not negatively affect downstream water quality. The modeling, as summarized in the environmental impact study [14], stated:
“Modeling conducted by the Joint Applicants…would…substantially improve water quality conditions in the project reservoirs and in the lower Deschutes River.” “We conclude that implementing SWW would provide a substantial benefit to water quality conditions and important beneficial uses. Many of these benefits would extend to all three of the project reservoirs and through the entire 100-mile length of the lower Deschutes River.”
The intent of this manuscript is to summarize the changes to the lower Deschutes River after the installation of the SWW and to evaluate its impacts on temperature, water quality, and aquatic habitat in the lower Deschutes River.

2. Study Site and SWW Operation

The Deschutes River basin drains 27,200 km2 and flows about 405 km north to its confluence with the Columbia River. The Deschutes River converges with the Metolius and Crooked Rivers at Lake Billy Chinook. The release water from Lake Billy Chinook passes into Lake Simtustus and the Reregulating Pool which are collectively referred to as the Pelton Round Butte Hydroelectric Project (referred to here as the “Project”; Supplemental Material Figure S1; Table S1). During the warmer months (May–Oct), water from Lake Billy Chinook passes through the hypolimnion of Lake Simtustus and is discharged from the base of Pelton Dam to the Reregulating Reservoir. Water from Lake Billy Chinook mixes minimally with the overlying water in Lake Simtustus and thus the water discharged during these warmer months is comprised almost entirely of water released from the upper reservoir. During cooler months, Lake Billy Chinook and Lake Simtustus mix and the release water becomes a blend of the three major tributaries to Lake Billy Chinook.
Prior to 2010, all water discharged from Lake Billy Chinook was withdrawn from the deep outlet. This meant that in the spring and summer, water released to the Deschutes River was cool, generally around 9.6 °C in May and 11.3 °C in June. These temperatures are less than the estimated river temperature of the Deschutes River prior to the construction of the three dams associated with the hydropower project and were judged by biologists to be detrimental to salmonids returning to spawn in the river [15]. As part of the negotiations for relicensing of the Project by the Federal Energy Relicensing Commission it was decided that the applicants (Portland General Electric [PGE] and the Confederated Tribes of the Warm Springs Reservation [CTWSR]) would modify the outlet structure of Round Butte Dam to allow for surface water to pass downstream. The chosen design was a selective water withdrawal (SWW) in which 40 to 100 percent of the release water from the impoundment would consist of surface withdrawal from the upper 12 m combined with 0 to 60 percent of the original hypolimnetic intake (Figure S2). These waters would be blended to achieve the desired temperature of the discharge waters, attempting to reproduce estimates of water temperature of the river prior to the construction of the hydroelectric project. The original documents submitted in preparation for approval of the SWW indicated that the new structure would allow for the deeper withdrawal to release up to 100% of the total discharge. However, the final structure, as built, allows for a maximum release of only 60% of the total flow from the bottom intake. The operation of the SWW typically consists of 100% surface withdrawal from November 4 to mid-May after which the proportion of withdrawal from the surface gate is gradually reduced to 40% by mid-July (2015 and 2016) or in mid-August (2017, a wet year; Figure S3).

3. Methods

The data employed in this study were derived from diverse sources and are summarized in Table 1. Discharge data in the Deschutes River were measured immediately downstream of the Reregulating Dam (Madras gage, Rkm 161, #14092500) and near the mouth (Moody gage, Rkm 1.4, #14103000) consisted of long-term 15 min data that was reduced to daily averages. Temperature data were collected at the USGS sites were initiated in 2011; however, temperature measurements were supplemented by measurements collected by PGE at the Madras gage. A 2 d hydrodynamic model, CE-QUAL-W2 [16], was calibrated to the three hydropower impoundments with details available in Eilers and Vache [17]. Travel time and water circulation in the major intermediate impoundment, Lake Simtustus, were measured by introducing rhodamine dye at the discharge from Round Butte Dam, impounding Lake Billy Chinook. The dye was measured at the discharge from Pelton Dam, which impounds Lake Simtustus, using a Turner Designs 10-AU fluorimeter. The input to the river model was based on measured water quality at the Madras gage output from the reservoir models and measured values at this site. The river model was based on the 1 d QUAL2Kw model [18].
The primary source of historical water quality data for the lower Deschutes River used in this analysis was from the state water quality management agency, the Oregon Department of Environmental Quality (DEQ), which has been collecting data at two sites on the lower Deschutes River for several decades. Some of the analytical methods have changed over the years, especially regarding the nutrients; however, before DEQ changes methods they conduct a series of analyses to verify the results of a change in methods are consistent (equal to or better) with previous methods [27]. However, to minimize the effect of the improvement of methods over the years, we elected to use data collected after 1984.
In addition to the data collected by DEQ, PGE implemented a detailed data collection effort focused on biological data and took place sporadically between 1999 and 2018 (Table 1). Periphyton was scraped from nine rocks selected at an average depth of 52 cm. Three aliquots were prepared from the rock scrapings for use in measuring benthic chlorophyll a, ash-free dry weight, and periphyton community composition. Periphyton community composition was conducted by staff with Rhithron Associates, Inc., Missoula, MT, USA. The taxonomy of algae and cyanobacteria continues to challenge, particularly for the Nostocales order of cyanophytes. Recently, investigators have begun reporting what was formerly called “Anabaena” as “Dolichospermum” based on a reclassification of the genus [28]. However, a more recent reclassification of the ADA clade using genetic groupings suggested that the planktonic form of Dolichospermum be kept as Anabaena [29], a practice that we adopted here. This decision was reinforced by the inclusion of samples from Lake Billy Chinook in the genetic analysis which showed the abundance of Anabaena and its genetic similarities to other samples from lakes in the Pacific Northwest.
Macroinvertebrates were collected and analyzed by R2 Consultants, Redmond, DC, USA, using kick-net techniques in which four samples were collected at each study site using a D-frame kick sampler with a 500-micron Nitex mesh, for a combined area of 0.74 m2 [22,23]. All samples were collected in riffles or shallow runs possessing coarse gravel to small cobble substrates. Standard samples were collected from areas possessing water depths between 30 cm and 90 cm, and mean water column velocities between 30 cm and 90 cm per second. At a subset of sites, “shallow” samples were also collected from areas that have water depths less than 30 cm and mean water column velocities between 30 cm and 90 cm per second to assess the macroinvertebrate community in the varial zone. Sample locations were randomly selected, although selection was limited to areas possessing the described habitat criteria. Sampling was not conducted at a specified location until depths were determined to be suitable with a top-setting wading rod and velocities determined to be suitable with a Swoffer (Edmonds, WA, USA) current meter. Each sample was collected from an area of the stream bottom that was 30 cm wide (i.e., width of kick net) and 60 cm long. This area of the stream bottom was vigorously kicked for one minute. Larger substrates were then scrubbed by hand to dislodge remaining organisms. Substrates were sampled to a depth of approximately 6 cm. A subset of at least 300 organisms were selected from randomly selected grids in a sorting tray and identified to the lowest practical unit.
Fisheries data regarding the return of sockeye and steelhead to the Project were based on counts provided by PGE and CTWSR as reported to the Federal Energy Relicensing Commission [24. Fish passage at Bonneville Dam, downstream of the confluence of the Deschutes River with the Columbia River was derived from counts reported by the Army Corps of Engineers [25]. An abundance of fall chinook, redband trout, and smallmouth bass in the Deschutes River was provided by the Oregon Department of Fish and Wildlife.

4. Results

4.1. River Temperature

The results of a dye study showed that water released from Lake Billy Chinook during the warmer months passed through Lake Simtustus with little mixing. A thermal barrier was typically established in Lake Simtustus in May and extended into October. Travel time through the hypolimnion of Lake Simtustus (12.2 km) was rapid, 31 h at a flow rate of 93.7 m3 s−1 and 30 h at a flow rate of 100.9 m3 s−1. The hydrodynamic model, CE-QUAL-W2, accurately reproduced the transit time and degree of mixing through Lake Simtustus (Figure 1). These features confirm that water quality in the lower Deschutes River during the warmer months is largely water released from the uppermost impoundment, Lake Billy Chinook.
The goal of discharging the desired water temperature criteria from the Project based on targets established in Huntington et al. [15] was largely successful (Figure 2). The target temperature of the spring release water increased to over 14 °C starting in 2010 and followed a regime of estimated pre-dam temperature throughout the remainder of the year. The mean monthly increase in temperature for the comparison started in March at 0.4 °C, peaked in May at 3.0 °C, and declined to 0.8 °C in July. The maximum daily increase in temperature for the 2009–2013 comparison was 4.2 °C, which also occurred in May. Releasing warmer water in the spring had the designed benefit of retaining cool water in the hypolimnion for release from late August through October and avoids releasing water considered too warm for fisheries goals. Release of warmer water in the warmer months increased temperature throughout the length of the river [17]. The release of warmer water does not result in an additive effect on the length of the river as the rate of increase declines as the river approaches an equilibrium. Nevertheless, the effects of increased temperature release were evident throughout the length of the river in post-SWW years.

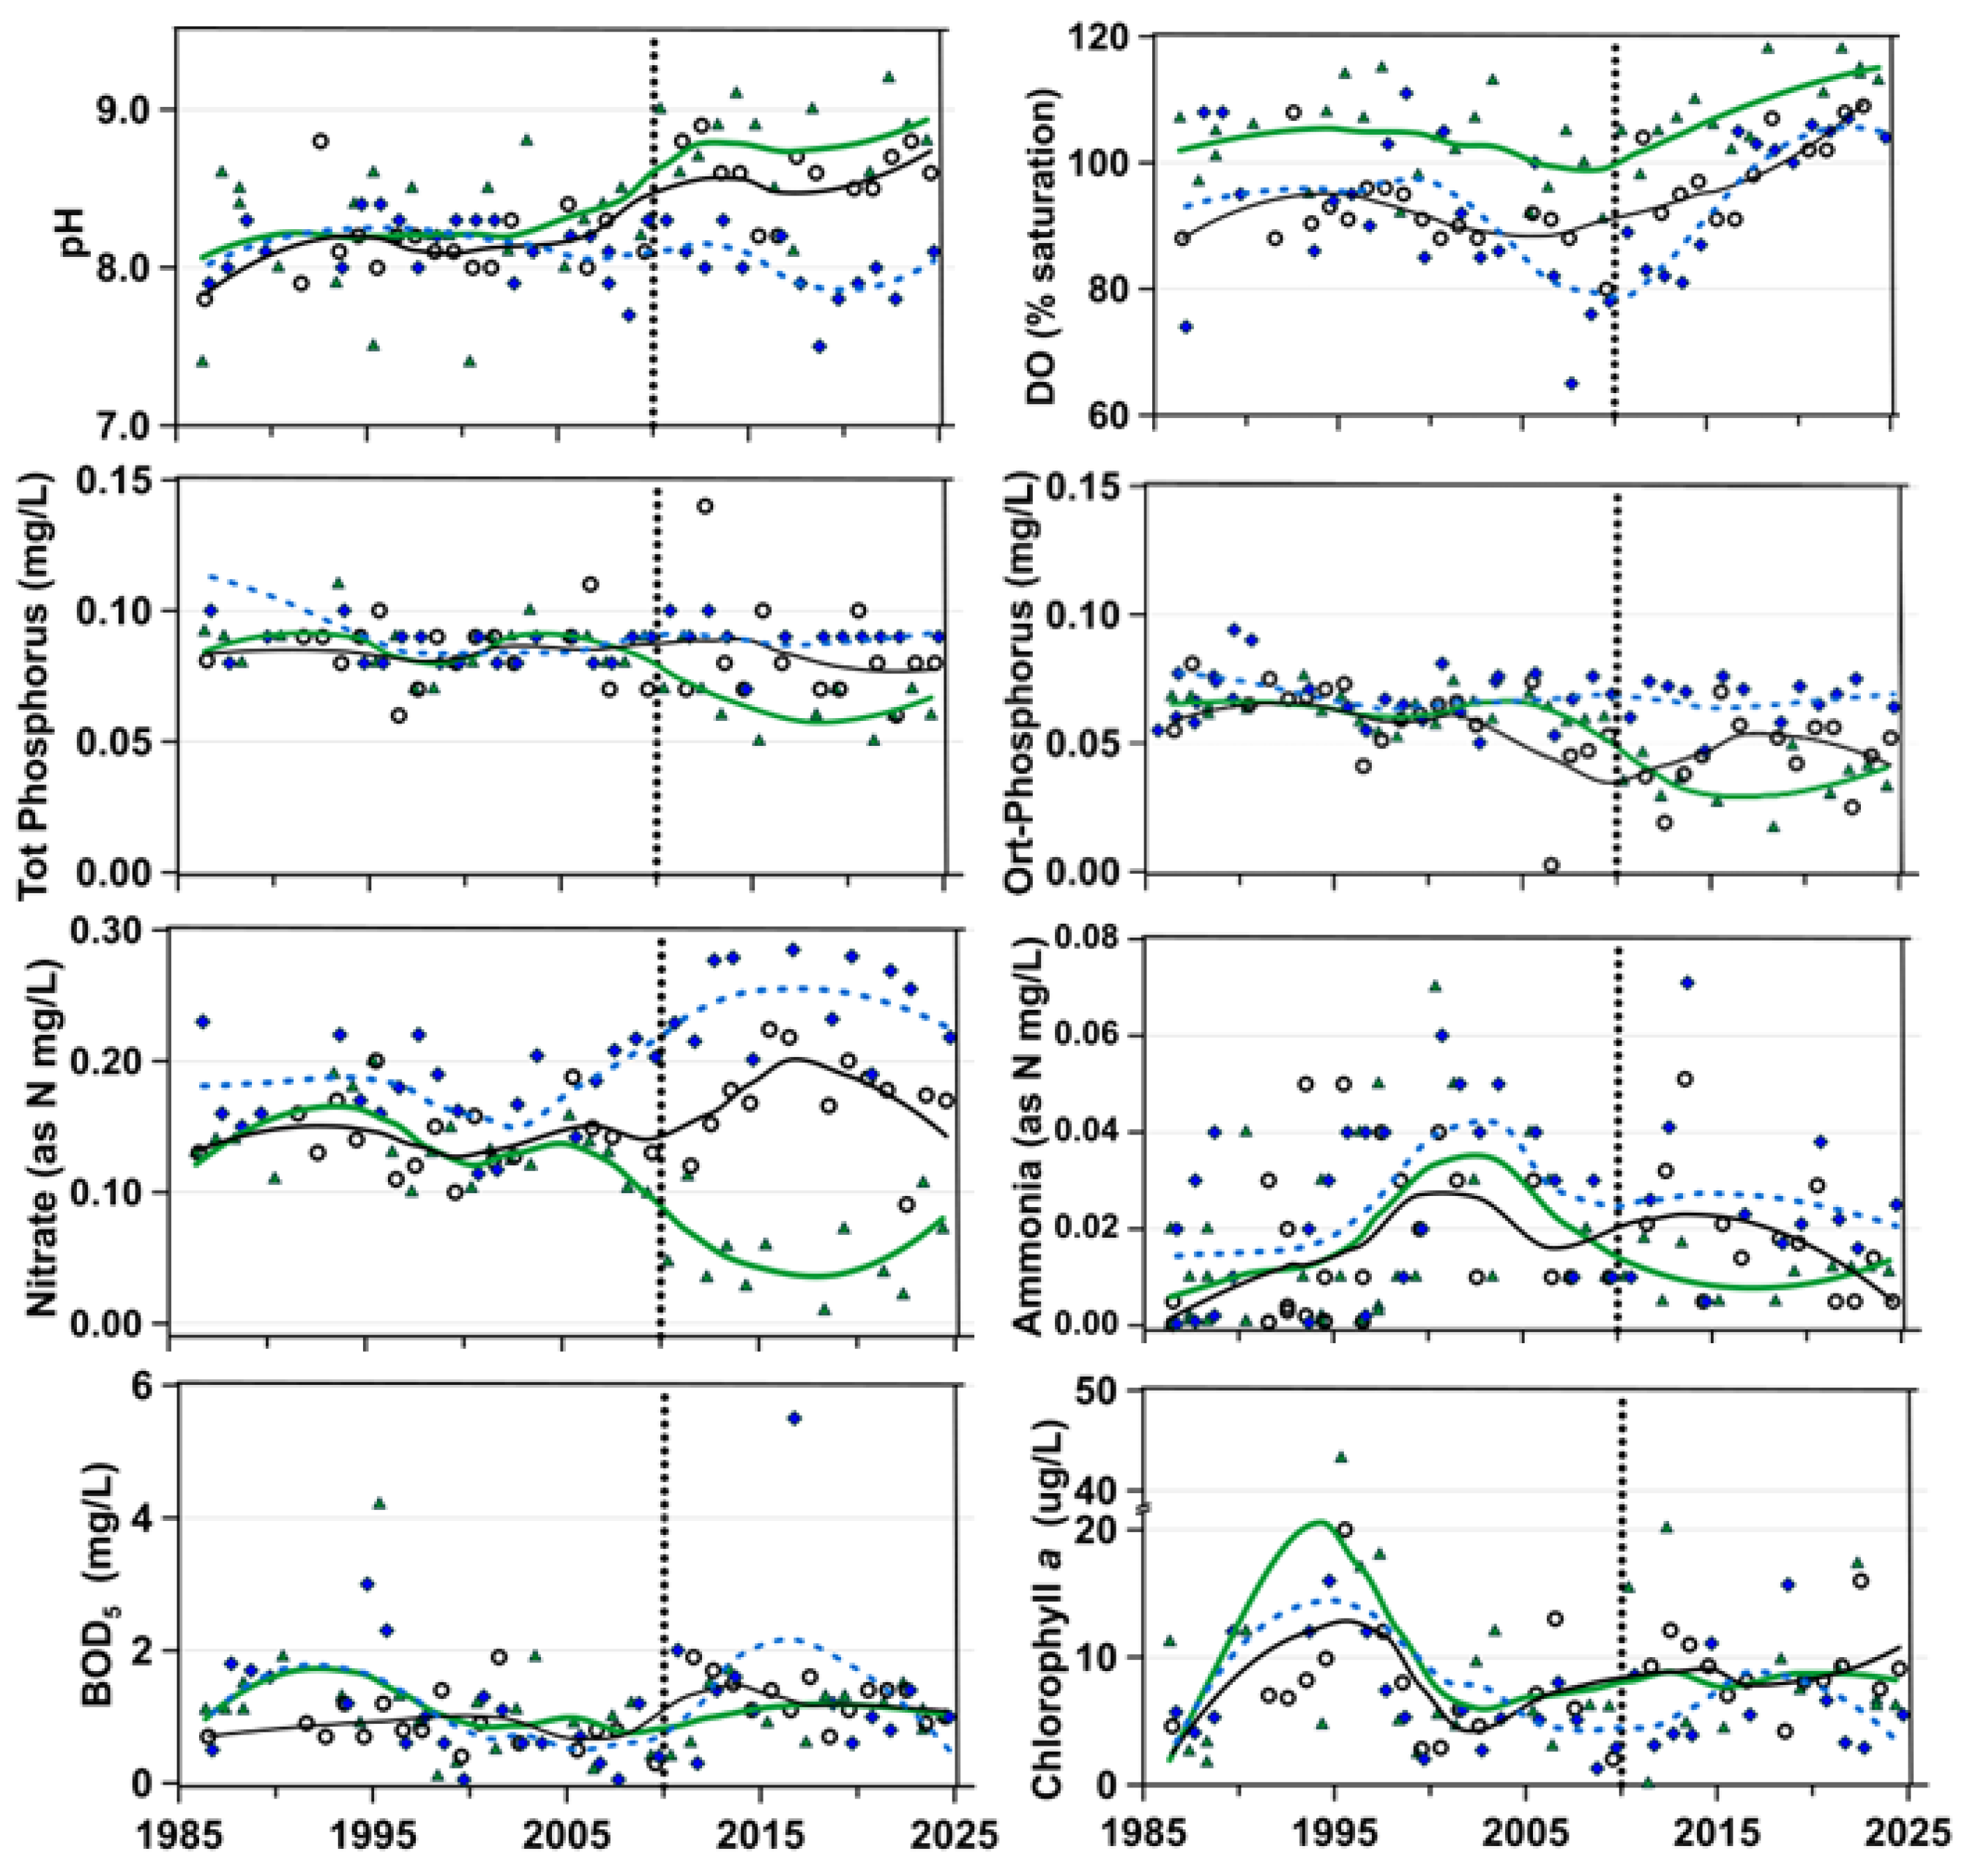
4.2. River Chemistry

Comparison of pre- and post-SWW water quality in the lower Deschutes River showed that monthly differences were evident for pH, dissolved oxygen (DO), phosphorus, nitrate, and BOD5. The greatest changes were measured at the Hwy 26 bridge located 4 km downstream of the Project. pH exhibited significant increases in May and July and a small yet significant decrease in September at the upstream site while showing smaller increases in June and August at the mouth (Figure 3 and Figure 4; Table 2). The models used to forecast changes in pH as a consequence of installing the SWW anticipated a slight increase in pH following installation of the SWW but not to the degree observed here [30,31]. Dissolved oxygen saturation increased for all three monitoring months at the upstream site but exhibited more modest changes at the mouth post-SWW. Total phosphorus and ortho-phosphorus exhibited significant declines at both sites in the post-SWW period. Nitrate concentrations exhibited the most dramatic changes at the upper site with a major decline in May and large increases in July and September. Little change in nitrate was observed at the mouth, largely because most of the nitrate had been assimilated in the river during pre- and post-SWW periods. The river modeling forecast an increase in nitrate during the spring and a decrease in the summer [31]. The results from river monitoring in 2015 and 2016 showed that the reduction in NO3 from the Reregulating Dam to the river mouth averaged over 93% during spring and early summer (Figure 5). The change in nitrate from the Project to the mouth is a conservative estimation of assimilation because of contributions of nitrate to the Deschutes River from several tributaries downstream of the hydroelectric dams (Figure S1). Ammonia showed small yet significant declines in April and August. Biochemical oxygen demand (BOD5) exhibited a significant increase in July at the upstream site and a significant increase in April at the downstream site. Chlorophyll a showed no change after the SWW.

4.3. Suspended Algae

There are no historical seston data to allow for comparison of pre- and post-SWW suspended algae in the river. However, from analysis of seston collected from 2015 to 2017 we can infer how suspended algae is likely to have increased with installation of the SWW. The vast majority of the seston currently released from the Reregulating Dam are planktonic as one would expect when there is a continuous surface release from the Lake Billy Chinook (Figure 6). The dominant planktonic taxa in the seston are Stephanodiscus spp. throughout the year and Anabaena spp. in the warmer months. However, the proportion of benthic-derived suspended algae increased downstream resulting in similar proportions of planktonic and benthic-derived algae biovolume at the mouth. The sestonic taxa derived from benthic periphyton were largely diatoms and include Cymbella, Gomphoneis, Cocconeis, Nitzschia, and Diatoma. Prior to the operation of the SWW, all water released from Lake Billy Chinook was discharged from the hypolimnion and it was likely that this hypolimnetic water had fewer viable algae. Thus, the pre-SWW seston in the river would have been comprised largely of benthic diatom taxa dislodged from the substrate and would have been substantially less than the total seston biovolume currently in the river.

4.4. Periphyton

There were no consistent pre-/post-treatment periphyton data collected in the lower Deschutes River to allow for a direct comparison. An analysis of the periphyton community in 2015–2019 indicated that annual changes in Cladophora could be attributed to the magnitude of spring discharge in the river [21]. In 2015 and 2016 when spring flows were low, Cladophora was the dominant periphyton taxon throughout the river. Following high flows in the springs of 2017 and 2019, Cladophora abundance was greatly reduced resulting in increased proportions of diatoms (2017) and cyanophytes (2019). Despite major changes in the availability of nitrate in the river between 2015 (low) and 2016 (high), Cladophora remained relatively unchanged, suggesting that hydrology was a much greater factor in affecting Cladophora abundance in the Deschutes River than annual fluctuations in nutrient chemistry. Anecdotal reports from long-time recreational and commercial river guides indicated that periphyton had become more abundant throughout the river after 2010. Stalked diatoms, such as Cymbella and Gomphoneis, were abundant in the river in the sampling from 2015 to 2019, which when combined with the filamentous cyanobacteria, could contribute to muculent coatings of the rocks (Figure S5).
Although there are no data to allow for a direct comparison of pre- and post-SWW periphyton data, an increase in river temperature, within the range reported, here would be expected to promote increased growth rates of algae and cyanobacteria [32,33,34,35]. Increased river temperature might also favor changes in species composition within the periphyton community as taxa with preferences for warmer water supplant the colder-water taxa. The increased temperature in the discharge waters during spring coincide with the period of increasing light duration and would further stimulate growth.

4.5. Macroinvertebrates

A companion study was conducted to evaluate the effects of installing the SWW on the macroinvertebrate community downstream of the Project. The Deschutes River is a highly productive system in which macroinvertebrate density in riffle areas commonly exceeds 10,000 individuals/m2. The benthic macroinvertebrate community is diverse with most sites supporting 30 to 50 taxa. The sites closest to the dam in the upper 6 km exhibited a higher proportion of non-insect taxa in the post-SWW period (p < 0.05) but the benthic community transitioned to a greater proportion of insect taxa further downstream. The number of benthic invertebrates increased substantially between 1999–2001 and 2013–2015, although reference sites located in the tributaries upstream of the Lake Billy Chinook also exhibited large increases in macroinvertebrate density. Turbellaria, polychaetes (esp. Manayunkia), and Entoprocta (Urnatella) showed substantial increases post-SWW (p < 0.05), but largely within the upper 6 km of the river. One of the most notable changes was an increase in the density of net-spinning caddisflies downstream of the Project, particularly in the fall (Figure 7). Hydropsyche increased an average of 2232 organisms/m2 and Cheumatopsyche increased 373 organisms/m2 during the fall, both of which are statistically significant. An additional site was added in October 2013 at Rkm 38.5 which yielded 5637 Hydropsychidae organisms/m2, indicating that abundance of net-spinning caddisflies extended far down river. Other insect larvae that exhibited increases were Glossosoma (a cased caddisfly) and the mayfly Ephemerella. Taxa that declined post-SWW included the cranefly Antocha sp. (a decline of 18/m2 in the fall and 177/m2 in the spring) and the stonefly Hesperoperla pacifica (a decrease of ~75/m2 in the spring), however abundance of Antocha declined elsewhere in the region, suggesting that their decline in the Deschutes River is unrelated to installation of the SWW. Dates of insect emergence were not measured in either period, although anecdotal reports suggested that notable taxa such as Pteronarcys californica altered the timing and duration of emergence during the pre- and post-SWW periods. Aquatic organisms thrive when the resources and river temperature are optimal, but significant changes in the aquatic community can occur when they experience sub-lethal increases in temperatures [36]. It seems reasonable to assume that changes in optimal temperatures can also result in measurable changes to macroinvertebrates.
The group to show the greatest increase in density following installation of the SWW was Oligochaeta. Their densities increased by more than 2000 individuals/m2 at the sites in the lower Deschutes River. However, they increased by an even greater degree at two of the reference sites (DE and CR) and thus we cannot necessarily attribute the increase in oligochaetes to changes associated with the SWW. In general, the relative abundance of taxa tolerant of poor water quality increased by 20 percent in the post-SWW spring period but remained relatively unchanged in the fall period. These findings are in general agreement with another study of macroinvertebrate response to increased river temperature following installation of a SWW that resulted in a greater number of non-insect taxa and filter feeders [37].

4.6. Fish

The response of the fisheries in the lower Deschutes River was not a component of this study. However, because the primary reason for installing the SWW and changing the temperature regime in the river was to enhance the anadromous fishery, we provide a brief summary of reported fish responses to the project in the context of understanding the other changes to the river. The principal fish species for which the SWW was designed to promote was the run of fall chinook (Oncorhynchus tshawytscha) which is both the largest individual fish as well as the most abundant anadromous fish run in the lower Deschutes River. Chinook spawn in the mainstem of the lower Deschutes River. The other two anadromous fish taxa, steelhead (Oncorhynchus mykiss) and sockeye (Oncorhynchus nerka) return to the fish collection trap at the base of the Reregulating Dam and are transported above Round Butte Dam to allow them to continue upstream migration. The primary native resident fish in the river is the redband trout (Oncorhynchus mykiss). Available information suggests that the population of the resident trout has remained relatively stable in recent decades [26]. The response of anadromous fish returns to the collection point at the Reregulating Dam tailrace since the addition of the SWW has been below expectations of PGE and the CTWS fish biologists [24]. One exception has been the robust return of steelhead observed in early 2025 which was facilitated by capturing the smolt in the tributaries to Lake Billy Chinook and transporting them downstream of the Project, thus bypassing the fish collection facility at the dam.
One response of the fisheries not related to changes in salmonids was an apparent increase in utilization of the lower third of the river by smallmouth bass (Micropterus dolomieu), a taxon not native to the basin [38]. It is unclear whether the apparent increase in bass in the lower reach of the river was caused by the change in the warmer temperature regime with the SWW or whether other factors such as the availability of food contributed to their advance upstream. The smallmouth bass use the lower one-third of the lower Deschutes River in the warmer months and leave the river in the colder seasons without having used the river for reproduction. The reach of the Deschutes River near the mouth served as a cold-water refugia for migrating salmonids pre-SWW. The warming of the mouth of the Deschutes River in the post-SWW period has substantially reduced the value of this portion of the river as thermal refugia in the summer.

5. Discussion

The change in the outlet structure from Lake Billy Chinook resulted in several unanticipated changes to the lower Deschutes River, in addition to the intended effect of increasing the temperature of water released in spring. The changes in water chemistry in the post-SWW period resulted in some notable responses, represented by measurable increases in river pH and dissolved oxygen. These are not unexpected effects because of the release of surface water from a highly productive impoundment. The SWW also resulted in a decrease in the total and ortho-phosphorus released downstream. The phosphorus concentrations are greater in the hypolimnion of Lake Billy Chinook, so the decrease in the release of hypolimnetic waters is consistent with the decrease in phosphorus. Although phosphorus is often a limiting nutrient in freshwater, here the decrease in phosphorus has no benefit for the lower Deschutes River because the system has naturally high concentrations of phosphorus from the weathering of volcanic rocks in the basin. Nitrogen is the primary limiting nutrient in the Deschutes River and we observed a more complicated response with nitrate. There is a large decrease in NO3 in the spring, but this pattern reverses in summer when the proportion of release water from the surface declines. The decrease in NO3 may forestall a rapid growth of periphyton during this period, but this effect is negated when hypolimnetic water is blended with the surface water starting in mid-June. The reason for the decrease in NO3 in the spring is that phytoplankton are utilizing NO3 in the epilimnion to support high rates of primary production. Ammonia also declines in the spring samples, although the concentrations of NH3 are far lower than NO3 and likely do not have much impact. Chlorophyll a showed no change at either site, an unexpected response given the release of surface water containing large amounts of phytoplankton. We infer that algae releases increased in the post-SWW period because of the large increase in filter-feeding caddisflies in the river. Why that change is not reflected in the chlorophyll results is unexplained at this point. BOD5 showed a small increase in July, but this increase would likely have no measurable effect on downstream water quality because of the short travel time in the river.
The results indicate that entrained phytoplankton declined by over an order of magnitude from the Project to the mouth, presumably as Hydropsychidae caddisflies captured algae in the seston. Samples of the periphyton showed the presence of large numbers of phytoplankton, such as Stephanodiscus niagarae, that could only have been derived from the hydropower impoundments [17]. The increase in net-spinning caddisflies was significant in the fall but was not evident in the spring samples. The density of polycheates, Turbularia, and bryzoan-related taxa increased dramatically at a short distance below the dams, presumably in response to an increase in plankton released from the project. The changes in the benthic community indicated an increase in pollution-tolerant taxa in the post-SWW period. This could have been caused solely by the increase in river temperature, although increases in pH and dissolved oxygen saturation would also promote shifts towards more tolerant and non-insect benthic taxa.
The primary impetus for installing the SWW and increasing river temperature was to recreate the temperature regime that presumably existed prior to the construction of the dams. However, the anticipated increase in anadromous fish species has not materialized. Additionally, warm-water fish species now frequent the lower third of the river during the summer, an indication that the river is warmer, perhaps even warmer than experienced during the pre-dam period.
The justification for increasing warmer water in the spring was based, in part, on an analysis suggesting that pre-dam water temperatures were slightly warmer than the post-dam water temperature releases prior to installation of the SWW [15]. The assumption guiding the installation of the SWW was that replicating a warmer spring pre-dam water temperature regime would provide more favorable conditions for anadromous fish to spawn and for their eggs to incubate. However, as noted earlier, there are several major reservoirs upstream of the project that store spring runoff for irrigation of cropland (Supplemental Material B). Rough calculations suggest that the volume of these diversions resulted in large reductions in discharge to the lower Deschutes River: allowing the active reservoir storage to release over a 100-day period, representing spring runoff, would result in increases in discharge of 48.8 m3/s to the Deschutes River and 28.3 m3/s to the Crooked River. This combined flow represents 52% of the average discharge of the Deschutes River at the Madras gage from January to April. An examination of the three tributaries above the hydropower reservoirs shows that average daily water temperature for the first 100 calendar days during the active reservoir fill period is less than 4 °C. The diversion of these cold, springtime flows for agricultural irrigation has likely caused an increase in water temperature in the upper Deschutes River and Crooked River. These calculations suggest that the target temperature regime used to develop a favorable temperature in the lower Deschutes River may be greater than the temperature regime that anadromous fish experienced prior to anthropogenic management of flows in the basin. Additionally, climate change has caused increases in the overall temperature of flows throughout the basin by at least 0.7 °C [39], a process that was not addressed in the analysis supporting a change in release waters from the Project. Lastly, the analysis of a change in water temperature for the Deschutes River targeted conditions thought to be optimal for anadromous fish and based exclusively on water temperature. It appears that insufficient consideration was given to the fact that the primary source water for the temperature manipulation was a hypereutrophic reservoir.
Most of the water quality models used in this study can reproduce water quality variables such as temperature, pH, and dissolved oxygen, but they struggle to capture spatiotemporal nutrient cycling through both biotic and abiotic components of natural systems. This gap between environmental engineering and aquatic ecology remains a significant challenge in trying to predict the consequences of hydrological modifications in river systems. The installation of the SWW has achieved two of its objectives: (1) generating an attractant flow to the dam to facilitate the collection of out-migrating smolts and (2) creating the pre-dam temperature regime in the Deschutes River. However, the blended release waters from the SWW altered water quality in the lower Deschutes River, despite forecasts that the river might benefit from the SWW.
The expected increase in anadromous fish returns, the primary objective for installing the SWW, has not been realized and the apparent increased presence of competing warm-water species would appear to be an undesirable effect of increasing river temperature. We conclude that the installation and operation of the selective water withdrawal at Round Butte Dam has resulted in a net reduction in water quality and aquatic habitat in the lower Deschutes River.
The results from the application of the hydrodynamic/water quality models ap peared to be the primary justification for installing the SWW at Lake Billy Chinook. This is consistent with a number of studies that have relied on various models to support decisions to install SWWs [9,11,12,40,41,42]. We support the use of numerical models to assist in optimizing temperature flow regimes for rivers, but biochemical responses of river systems to large boundary condition modifications can be complex. Models alone may not adequately capture these complexities, and should be applied iteratively with guidance from limnologists, water quality specialists, fish biologists, and engineers. Potential gaps between engineering-based approaches and biological response should be evaluated and addressed prior to major changes to dam operation. In addition, reservoir regulators and managers should approach modifications within an adaptive framework, facilitating post-installation evaluation of impact, and allowing for adjustment to management strategies to positively influence unanticipated responses.

Supplementary Materials

The following supporting information can be downloaded at: https://www.mdpi.com/article/10.3390/w17142091/s1, Figure S1: Deschutes River and Pelton Round Butte Hydroelectric Project; Figure S2: Schematic of selective water withdrawal (SWW) structure attached to original intake tower (Source: Portland General Electric). The surface intake receives water from the upper 12 m. The depth to the rim of the bottom intake is 62.4 m and the invert depth is 82.6 m. The maximum depth of the forebay is 120.1 m; Figure S3 Percentage of flow from the surface outlet for 2015-2018 from the SWW at Lake Billy Chinook. The balance of outlet discharge is comprised of flow from the original hypolimnetic outlet; Figure S4: Deschutes River basin showing location of major dams in the basin; Figure S5: Summary of periphyton community composition in the lower Deschutes River based on rock scraping from seven sites sampled from June through August. The units for total periphyton biovolume (top) are 109 μm3/cm2. See [21] for additional details; Table S1: Characteristics of the three hydroelectric impoundments comprising the Pelton Round Butte Project; Table S2: Major reservoirs in the Deschutes River basin used for irrigation.

Author Contributions

Methodology, T.N.; Validation, T.N.; Resources, K.B.V.; Data curation, J.M.E. and K.B.V.; Writing—review & editing, J.M.E. and K.B.V. All authors have read and agreed to the published version of the manuscript.

Funding

The data collected for the water quality and macroinvertebrates studies was funded by Portland General Electric and the Confederated Tribes of Warm Springs in contracts to MaxDepth Aquatics, Inc. and R2 Consultants. The interpretation of the data is solely the responsibility of the authors.

Data Availability Statement

The data collected in these studies are available from Portland General Electric. https://portlandgeneral.com/about/recreation-fish-wildlife/deschutes-river/water-quality.

Acknowledgments

We thank Portland General Electric and the Confederated Tribes of Warm Springs Reservation for supporting the water quality and macroinvertebrate studies. We thank Dan Brown, ODEQ, for assistance in accessing water quality data from AWQMS. We thank Benn Eilers for supervising the dye study of Simtustus Lake. We thank reviewers for providing constructive comments on the draft manuscript.

Conflicts of Interest

Author Joseph M. Eilers was employed by the company MaxDepth Aquatics, Inc. Author Tim Nightengale was employed by the company R2 Resource Consultants, Inc. The remaining authors declare that the research was conducted in the absence of any commercial or financial relationships that could be construed as a potential conflict of interest.

References

  1. Lehner, B.; Liermann, C.R.; Revenga, C.; Vorosmarty, C.; Fekete, B.; Crouzet, P.; Döll, P.; Endejan, M.; Frenken, K.; Magome, J.; et al. High-resolution mapping of the world’s reservoirs and dams for sustainable river-flow management. Front. Ecol. Environ. 2011, 9, 494–502. [Google Scholar] [CrossRef]
  2. Zarlf, C.; Lumsden, A.E.; Berlekamp, J.; Tydecks, L.; Tockner, K. A global boom in hydropower dam construction. Aquat. Sci. 2014, 77, 161–170. [Google Scholar] [CrossRef]
  3. Grill, G.; Lehner, B.; Thieme, M.; Geenen, B.; Tickner, D.; Antonelli, F.; Babu, S.; Borrelli, P.; Cheng, L.; Crochetiere, H.; et al. Mapping the world’s free-flowing rivers. Nature 2019, 569, 215–221. [Google Scholar] [CrossRef] [PubMed]
  4. Watts, R.J.; Richter, B.D.; Opperman, J.J.; Bowman, K.H. Dam reoperation in an era of climate change. Mar. Freshw. Res. 2011, 62, 321–327. [Google Scholar] [CrossRef]
  5. Benjankar, R.; Tonina, D.; McKean, J.A.; Sohrabi, M.M.; Chen, Q.; Vidergar, D. Dam operations may improve aquatic habitat and offset negative effects of climate change. J. Environ. Manag. 2018, 213, 126–134. [Google Scholar] [CrossRef]
  6. Cooper, A.R.; Infante, D.M.; Daniel, W.M.; Wehrly, K.E.; Wang, L.; Brenden, T.O. Assessment of dam effects on streams and fish assemblages of the conterminous USA. Sci. Tot. Environ. 2017, 865, 879–889. [Google Scholar] [CrossRef]
  7. Gillespie, B.R.; Desmet, S.; Kay, P.; Tillotson, M.R.; Brown, L.E. A critical analysis of regulated river ecosystem responses to managed environmental flows from reservoirs. Freshw. Biol. 2014, 60, 410–425. [Google Scholar] [CrossRef]
  8. Lehmkuhl, D.M. Change in thermal regime as a cause of reduction of benthic fauna downstream of a reservoir. J. Fish. Res. Bd. Can. 1972, 29, 1329–1332. [Google Scholar] [CrossRef]
  9. Fontane, D.G.; Labadie, J.W.; Loftis, B. Optimal control of reservoir discharge quality through selective withdrawal. Water Resourc. Res. 1981, 17, 1594–1602. [Google Scholar] [CrossRef]
  10. Hu, G.; Yang, Z.; Yue, Y.; Bai, F.; Ren, Y. Joint thermal regulation by selective withdrawal in a serial cascade reservoir systems effectively improves reservoir and downstream ecological health. Water Res. 2025, 281, 123659. [Google Scholar] [CrossRef]
  11. Aghasian, K.; Moridi, A.; Mirbagheri, A.; Abbaspour, M. Selective withdrawal optimization in a multipurpose water use reservoir. Inter. J. Environ. Sci. Tech. 2019, 16, 5559–5568. [Google Scholar] [CrossRef]
  12. Kim, S.K.; Choi, S.-U. Assessment of the impact of selective withdrawal on downstream fish habitats using a coupled hydrodynamic and habitat modeling. J. Hydrol. 2021, 593, 125665. [Google Scholar] [CrossRef]
  13. Fassnacht, H.; McClure, E.; Grant, G.; Klingeman, P. Downstream effects of the Pelton-Round Butte Hydroelectric Project on bedload transport, channel morphology, and channel-bed texture, Lower Deschutes River, Oregon. In A Peculiar River: Geology, Geomorphology, and Hydrology of the Deschutes River, Oregon; O’Connor, J.E., Grant., G.E., Eds.; American Geophysical Union: Washington, DC, USA, 2003. [Google Scholar]
  14. Federal Energy Regulatory Commission. Pelton Round Butte Hydroelectric Project, Oregon. Final Environmental Impact Statement. FERC/FEIS-0165F. FERC Project No. 2030. 2004; Federal Energy Regulatory Commission: Washington, DC, USA, 2003; pp. 169–202. ISBN 0-87590-356-8.
  15. Huntington, C.W.; Hardin, T.; Raymond, R. Water Temperature in the Lower Deschutes River, Oregon; Consultant report to Portland General Electric: Portland, OR, USA, 1999. [Google Scholar]
  16. Cole, T.M.; Wells, S.A. CE-QUAL-W2: A Two-Dimensional, Laterally Averaged Hydrodynamic and Water Quality Model, Version 3.5; U.S. Army Corps of Engineers: Washington, DC, USA, 2006. [Google Scholar]
  17. Eilers, J.M.; Vache, K. Water quality study for the Pelton Round Butte Project and the Lower Deschutes River: Monitoring and modeling. In Report Prepared for Portland General Electric & the Confederated Tribes of the Warm Springs Reservation of Oregon; 2021; p. 566. Available online: https://portlandgeneral.com/about/recreation-fish-wildlife/deschutes-river/water-quality (accessed on 1 July 2025).
  18. Peltier, G.J.; Chapra, S.C.; Tao, H. QUAL2Kw—A Framework for Modeling water quality in streams and rivers using a genetic algorithm for calibration. Environ. Model. Softw. 2006, 21, 419–425. [Google Scholar] [CrossRef]
  19. U.S. Geological Survey. Water Quality for the Nation. Oregon water conditions. Available online: https://waterdata.usgs.gov/or/nwis/current/ (accessed on 5 January 2024).
  20. Oregon Department of Environmental Quality. Ambient Water Quality Monitoring System. Available online: https://www.oregon.gov (accessed on 13 March 2025).
  21. Eilers, J.M.; Davis, C.; Vander Meer, D.; Vache, K. Spring peak flows control abundance of Cladophora in a hydropower-impacted river. River Res. Applic. 2022, 38, 1746–1756. [Google Scholar] [CrossRef]
  22. Nightengale, T.; Shelly, A. Addendum to Final Report: Lower Deschutes River Macroinvertebrate and Periphyton Study. Additional Analyses. Prepared for Portland General Electric Company, Portland, Oregon. Prepared by R2 Resource Consultants, Inc., Redmond, Washington. 2017. Available online: https://www.google.com/url?sa=t&source=web&rct=j&opi=89978449&url=https://assets.ctfassets.net/416ywc1laqmd/7pLjxWfvWdjKoZRqdgHt8S/aad4bf10c8b124f45e92cbcf665692c4/deschutes-macroinvertebrate-study-addendum.pdf&ved=2ahUKEwio_bmHqrmOAxVS4zQHHYeKLRcQFnoECBAQAQ&usg=AOvVaw06w7gjKa7AEBulV6i12plN (accessed on 13 March 2025).
  23. Nightengale, T.; Shelly, A.; Beamesderfer, R. Lower Deschutes River Macroinvertebrate and Periphyton Study. Final Report. Prepared for Portland General Electric Company, Portland, Oregon. Prepared by R2 Resource Consultants, Inc., Redmond, Washington. 2016. Available online: https://downloads.ctfassets.net/416ywc1laqmd/2gKvON9Ldy7lwI1aBmlkcZ/5210132094156f7c5f5ed11037a4d4c3/Deschutes-BMI-Final-Report (accessed on 10 January 2025).
  24. Portland General Electric Company and Confederated Tribes of the Warm Springs Reservation of Oregon. Pelton Round Butte Project (FERC 2030) 2023 Fish Passage Annual Report; Portland General Electric Company: Portland, OR, USA, 2024. [Google Scholar]
  25. Bonneville Power Administration. Fish Passage Center. Available online: https://www.fpc.org. (accessed on 10 January 2025).
  26. Jones, M.; Seals, J.; French, R. Redband trout density in the Lower Deschutes River, Oregon, River Miles 55.5 to 58.5, 2019. Appendix A. In Growth, Condition, and Age Structure of Redband Trout in the Lower Deschutes River, Oregon. Annual Monitoring Report; Seals, J., French, R., Jones, M., Eds.; Oregon Department of Fish & Wildlife: The Dalles, OR, USA, 2019. [Google Scholar]
  27. Mandera, Z. Oregon Department of Environmental Quality, Portland, OR. Pers. Comm, 12 August 2021. [Google Scholar]
  28. Wacklin, P.; Hoffmann, L.; Komárek, J. Nomenclatural validation of the genetically revised cyanobacterial genus Dolichospermum (Ralfs ex Bornet et Flahault) comb. nova. Fottea 2009, 9, 59–64. [Google Scholar] [CrossRef]
  29. Dreher, T.W.; Davis, E.W., II; Mueller, R.S.; Otten, T.G. Comparative genomics of the ADA clade within the Nostocales. Harmful Algae 2021, 104, 102037. [Google Scholar] [CrossRef] [PubMed]
  30. Khangaonkar, T.; Yang, Z.; DeGasperi, C.; Marshall, K. Modeling hydrothermal response of a reservoir to modifications at a high head dam. Water Intern. 2005, 30, 378–388. [Google Scholar] [CrossRef]
  31. Breithaupt, S.; Khangaonkar, T.; Yang, Z.; DeGasperi, C. Water quality model of the lower Deschutes River. In Report Prepared for Portland General Electric; Foster Wheeler Environmental Corporation: Portland, OR, USA, 2001. [Google Scholar]
  32. Singh, S.P.; Singh, P. Effect of temperature and light on the growth of algae species: A review. Renew. Sustain. Energy Rev. 2015, 50, 431–444. [Google Scholar] [CrossRef]
  33. Butterwick, C.; Heaney, S.I.; Talling, J.F. Diversity in the influence of temperature on the growth rates of freshwater algae, and its ecological relevance. Fresh. Biol. 2004, 50, 291–300. [Google Scholar] [CrossRef]
  34. Robarts, R.D.; Zohary, T. 1987. Temperature effects on photosynthetic capacity, respiration, and growth rates of bloom-forming cyanobacteria. New Zealand J. Mar. Freshw. Res. 1987, 21, 391–399. [Google Scholar] [CrossRef]
  35. Raven, J.A.; Geider, R.J. Temperature and growth. New Phycol. 1988, 110, 441–461. [Google Scholar] [CrossRef]
  36. Dallas, H.F.; Ross-Gillespie, V. Sublethal effects of temperature on freshwater organisms, with special reference to aquatic insects. Water SA 2015, 41, 712. [Google Scholar] [CrossRef]
  37. Murphy, C.A.; Johnson, S.L.; Gerth, W.; Pierce, T.; Taylor, G. Unintended consequences of selective water withdrawals from reservoirs alter downstream macroinvertebrate communities. Water Res. Resear. 2021, 57, e2020WR029169. [Google Scholar] [CrossRef]
  38. Oregon Department of Fish & Wildlife. Lower Deschutes River Smallmouth Bass 2016. Available online: https://www.deschutesriveralliance.org/deschutes-river-alliance-blog/2016/09/09/smallmouth-bass-in-the-lower-deschutes-river (accessed on 10 January 2025).
  39. Mote, P.W.; Salathé, E.P., Jr. Future climate in the Pacific Northwest. Clim. Change 2010, 102, 29–50. [Google Scholar] [CrossRef]
  40. Ebrahimi, S.A. Application of CE-QUAL-W2 model for optimal selective withdrawal of reservoir concerning water quality (case study: Shahr Bijar Dam Reservoir, Iran). Intern. J. Hydrol. Sci. Tech. 2025, 19, 268–294. [Google Scholar] [CrossRef]
  41. Soleimani, S.; Bozorg-Haddad, O.; Saadatpour, M.; Loáiciga, H.A. Optimal selective withdrawal rules using a coupled data mining model and genetic algorithm. J. Water Resour. Plann. Manag. 2016, 142, 04016064. [Google Scholar] [CrossRef]
  42. Vanda, S.; Nikoo, M.R.; Taravatrooy, N.; Al-Rawas, G.A.; Sadr, S.M.; Memon, F.A.; Nematollahi, B. A novel compromise approach for risk-based selective water withdrawal from reservoirs considering qualitative-quantitative aspects. Water Resour. Manag. 2023, 37, 4861–4879. [Google Scholar] [CrossRef]
Figure 1. Concentrations of rhodamine dye measured at the outlet of Lake Simtustus measured during two successive introductions of tracer (a) in August 2017. The bottom figure (b) shows a model (CE-QUAL-W2) simulation of the age of water (days) for the same period in 2017. The bottom withdrawal on Pelton Dam is displayed in the lower left of the bottom figure.
Water 17 02091 g001
Figure 2. (a) Daily average temperature of Deschutes River at the discharge from the Reregulating Dam for typical years prior to installation of the SWW (2009) and after (2013). (b) shows the minimum and maximum daily temperature for the period from May through July for the same two years. The two years were chosen for comparison because they had similar total discharge (128.1 m3/s and 127.4 m3/s for 2009 and 2013, respectively) and similar seasonal patterns.
Water 17 02091 g002
Figure 3. DEQ ambient monitoring data for the Deschutes River at the Hwy 26 bridge, 4 km downstream of the Reregulating Dam. Shown are data for May (green symbol and line), July (black symbol and line), and September (blue symbol and dashed line). A LOESS fit of the data is shown for each month. The vertical dashed line indicates the installation of the selective water withdrawal (SWW).
Water 17 02091 g003
Figure 4. DEQ ambient monitoring data for the Deschutes River at the mouth. Shown are data for April (green symbol and line), June (black symbol and line), and August (blue symbol and dashed line). A LOESS fit of the data is shown for each month. The vertical dashed line indicates the installation of the selective water withdrawal (SWW).
Water 17 02091 g004
Figure 5. Boxplots of nitrate concentrations by sample period in 2015 (a) and 2016 (b). The top of the boxplot represents the concentrations at the tailrace of the Reregulation Dam (RKM 161) and the bottom of the boxplot represents the concentrations at the mouth of the lower Deschutes River (RKM 1). There were 10 additional mainstem sites included in the boxplots.
Water 17 02091 g005
Figure 6. Percentage of planktonic algal and cyanobacterial biovolume present in the seston measured from February 2016 to October 2016 at the same six sites. Each site was sampled 11 times during the year.
Water 17 02091 g006
Figure 7. The abundance of Hydropsychidae during the pre-SWW period compared to the post-SWW period in fall (a) and spring (b). The three sites on the right represent upstream tributaries to Lake Billy Chinook and are included as reference sites where ME = Metolius River, DE = middle Deschutes River (upstream of Project) and CR = Crooked River.
Water 17 02091 g007
Table 1. A summary of the data sources used to assess changes in water quality and biota in the lower Deschutes River following the installation of the selective water withdrawal (SWW) on the outlet from Lake Billy Chinook in 2010.
Data GroupParametersSourceNoteReference
Hydrologydischarge, temperature aUSGS, PGE aMadras (#14092500); Moody (#14103000) [19]
dye studyPGE water quality studyAugust 2016; Pelton Dam tailrace[17]
ChemistrypH, DO, nutrients, BOD, chlorophyll aOregon Department
of Environ. Quality
Hwy 26 Bridge (#10506) and Deschutes River Park (#10411)[20]
Algaeperiphyton, suspended algaePGE water quality study; Rhithron Associates.2015–2019[17,21]
Macroinvertebratescommunity compositionPGE benthic study; R2 Consultants1999–2001 and 2013–2015[22,23]
Fisheriesanadromous fish returns
fall chinook, redband trout, SMB
PGE and CTWSR; USACE; ODFW1958–2020
1977–2020
[24,25,26]
Note: a Temperature data also measured by PGE at the Reregulating Dam tailrace (Rkm 161).
Table 2. The results of the two-sample t-test for water quality changes in the Deschutes River for 1985–2024 at the Hwy 26 bridge and river mouth. Significant differences (at p < 0.05) are shown in bold.
Parameter Hwy 26 Bridge (Rkm 157) Mouth (Rkm 0.16)
MonthDiffsetpMonthDiffsetp
pHMay0.5870.1194.940.000April0.1570.0782.000.053
July0.4450.0815.500.000June0.1290.0671.930.063
Sept−0.1600.0712.250.032Aug0.2540.0862.940.006
DO saturationMay6.022.462.450.020April3.041.861.640.111
July8.292.303.600.001June−1.532.000.770.449
Sept4.884.201.160.254Aug4.632.701.720.095
TPMay−21.73.715.850.000April−7.4021.20.350.729
July−1.16.00.180.856June−14.611.61.250.219
Sept−1.06.60.150.881Aug−7.6814.31.550.130
PO4May−28.42.810.300.000April−15.94.603.450.002
July−12.25.92.060.048June−18.43.065.990.000
Sept−2.23.600.600.553Aug−4.332.681.620.115
NO3May−80.410.97.350.000April−15.019.20.080.938
July28.411.42.490.019June−13.49.541.410.169
Sept66.212.35.370.000Aug11.516.50.690.493
NH3May−8.85.182.310.029 *April−5.462.412.270.030
July−1.05.530.190.854June−17.615.91.110.157 *
Sept−2.36.180.040.971Aug−9.122.723.350.002
Chloro-May−0.333.170.100.918April
phyll aJuly1.281.660.770.447June1.551.930.800.428
Sept−1.272.100.600.551Aug−0.020.770.020.981
BODMay−0.080.250.310.719 *April0.480.242.000.053
July0.440.133.360.002June0.170.190.880.386
Sept0.460.371.090.292 *Aug−0.460.540.850.403
Note: * Significance computed assuming unequal variance of pre- and post-SWW periods.
Disclaimer/Publisher’s Note: The statements, opinions and data contained in all publications are solely those of the individual author(s) and contributor(s) and not of MDPI and/or the editor(s). MDPI and/or the editor(s) disclaim responsibility for any injury to people or property resulting from any ideas, methods, instructions or products referred to in the content.

