1. Introduction
Floods are among the most devastating natural disasters, posing significant threats to human lives, property, and infrastructure. Accurate and timely flood forecasting is essential to mitigate these risks, providing authorities with critical information to implement preventative measures, allocate resources, and issue warnings. Traditional flood forecasting methods, such as hydrological models and numerical simulations, rely heavily on physical principles and detailed parameterization of complex watershed systems. However, these methods often require extensive calibration and are constrained by the availability and quality of input data. On the other hand, progress in artificial intelligence and machine learning has enabled data-driven methods like Long Short-Term Memory (LSTM) models, which have demonstrated strong potential in flood forecasting. Guo et al. [
1] highlighted that machine learning models can serve as surrogate models to replace physically based flood simulations, under the assumption that these models are capable of learning the behavior of the target system even without explicitly representing the underlying physical processes, provided that sufficient and representative data are available. However, the authors also acknowledged limitations in their study due to the lack of large-scale flood datasets. This scarcity was attributed to the long computational time required for physically based simulations and the challenges associated with the widespread deployment of sensors for collecting observational data, both of which constrained the predictive performance of their CNN model. A recent study by Guglielmo et al. [
2] introduced a novel approach for integrating physical principles into data-driven models, demonstrating enhanced predictive performance even when extrapolating beyond the training data boundaries or in data-scarce scenarios. This advancement suggests that applying data-driven models to real-world datasets from complex systems is becoming increasingly feasible and practical.
LSTM, a specialized type of recurrent neural network (RNN), has been widely used in sequence-based tasks due to its ability to capture long-term dependencies in data. This characteristic is particularly advantageous in hydrological forecasting, where the dynamics of rainfall-runoff processes exhibit temporal dependencies over extended periods. By learning patterns directly from historical data, LSTM models bypass the need for explicit physical equations, enabling them to model complex, nonlinear relationships between inputs (e.g., rainfall, temperature, and river flow) and outputs (e.g., water levels or discharge rates).
Despite its potential, the effectiveness of an LSTM model heavily depends on the selection of its hyper-parameters, which define the architecture and training process of the model. Hyper-parameters such as the number of neurons in the hidden layers, learning rate, dropout rate, batch size, and the number of training epochs significantly influence the model’s predictive accuracy, generalization ability, and training efficiency. The process of identifying the optimal combination of these hyper-parameters, known as hyper-parameter optimization, is crucial for achieving reliable flood forecasts.
Several optimization techniques have been developed to streamline the search for optimal hyper-parameters. Among these, Grid Search, Random Search, and Bayesian Optimization are commonly employed. Grid Search exhaustively evaluates all possible combinations of hyper-parameter values within a predefined range, ensuring a comprehensive search but often at a high computational cost. Random Search, on the other hand, samples hyper-parameter values randomly, providing a faster alternative with comparable performance in many cases. Bayesian Optimization uses a probabilistic model to guide the search for optimal hyper-parameters, balancing exploration and exploitation to identify promising configurations efficiently.
In the context of flood forecasting, the integration of these optimization algorithms into LSTM model development has demonstrated notable improvements in performance. For example, Bayesian Optimization has been shown to enhance model accuracy while reducing the time required for training, making it particularly suitable for time-sensitive applications like flood prediction. Additionally, the choice of input variables plays a critical role in the model’s success. For instance, variables such as average rainfall, point rainfall, upstream flow, and other meteorological parameters must be carefully analyzed to determine their relevance and correlation with the target variable. Selecting the most informative inputs ensures that the model captures the underlying hydrological processes effectively.
Recent studies have explored advanced techniques for improving flood forecasting and water level prediction. Long Short-Term Memory (LSTM) networks have shown promise in hydrological time series prediction [
3], but their performance depends heavily on hyper-parameter selection [
4]. To address this, researchers have applied various optimization methods. Particle Swarm Optimization (PSO) has been used to optimize LSTM hyper-parameters, improving flood forecasting accuracy and lead time [
4]. Bayesian optimization algorithms have also been applied to enhance the performance of Extreme Gradient Boosting (XGB) models for flood susceptibility mapping [
5]. Additionally, a hybrid model combining Random Search, LSTM, and Transformer architecture has shown promising results in rainfall-runoff simulation [
6].
Ruma et al. [
7] demonstrated the superiority of Long Short-Term Memory (LSTM) networks optimized with Particle Swarm Optimization (PSO) over traditional artificial neural networks (ANN) for water level forecasting in Bangladesh’s river network. Li et al. [
8] proposed a hybrid approach combining a hydrodynamic model with ANN-based error correction, which significantly improved flood water level forecasting accuracy. This method optimized Manning’s roughness coefficients and used partial mutual information for input variable selection. Aditya et al. [
9] compared the performance of ANN, adaptive neuro-fuzzy interference system (ANFIS), and adaptive neuro-GA integrated system (ANGIS) models for flood forecasting in India’s Ajay River Basin. Their results showed that the ANGIS model achieved the highest accuracy in predicting flood events. These studies highlight the potential of hybrid and optimized machine learning approaches in enhancing flood forecasting capabilities.
A noticeable gap exists in the current literature regarding the reproducibility of simulations using LSTM models. Most prior studies have primarily focused on evaluating the predictive performance of LSTM models, often overlooking the critical aspect of reproducibility. However, ensuring the consistency of a model’s predictive ability is essential for reliable real-world application, particularly in flood forecasting. Accurate and reproducible predictions are crucial for issuing timely and dependable flood warnings, which can significantly impact disaster preparedness and risk mitigation efforts.
This study focuses on optimizing an LSTM-based flood forecasting model by leveraging hyper-parameter optimization techniques. The target application is to predict river water levels at a specific station, a task that involves analyzing historical rainfall and water level data to make accurate and timely forecasts. Cross-correlation analysis is employed to identify the most influential input variables, ensuring the model incorporates only the most relevant data. Five key hyper-parameters—neuron units, learning rate, dropout rate, batch size, and number of epochs—are selected for optimization due to their significant impact on model performance.
To evaluate the effectiveness of different optimization techniques, three widely used algorithms—Grid Search, Random Search, and Bayesian Optimization—are applied to tune the LSTM model. The computational efficiency and predictive performance of the resulting models are compared to identify the most suitable approach for flood forecasting. Preliminary results indicate that, while Grid Search provides comprehensive coverage of the hyper-parameter space, it is computationally expensive. Random Search offers a faster alternative but lacks the systematic exploration of Bayesian Optimization, which consistently identifies optimal configurations with superior accuracy and efficiency.
The primary contribution of this research lies in providing actionable recommendations for the selection of input variables and optimization strategies aimed at developing robust and reliable flood forecasting systems. This is achieved by emphasizing the critical role of hyper-parameter optimization in enhancing the performance of LSTM models, supported by a comparative analysis of selected optimization techniques and an assessment of their respective strengths and limitations in practical applications. Apart from that, this study integrates the optimization of LSTM models using Grid Search, Random Search, and Bayesian Optimization into water level prediction, emphasizing not only traditional stochastic simulation but also reproducible simulation. The objective is to address the current research gap by presenting and discussing a comprehensive framework for LSTM-based flood forecasting that ensures reproducibility of results, an essential yet often overlooked aspect in existing studies.
The growing frequency and intensity of floods due to climate change underscore the need for advanced forecasting tools capable of providing accurate and timely predictions. LSTM models, when combined with effective hyper-parameter optimization techniques, represent a promising solution for addressing this challenge. By leveraging data-driven approaches and integrating optimization algorithms, this study aims to improve the accuracy, efficiency, and reliability of flood forecasts, contributing to enhanced disaster preparedness and resilience in vulnerable regions.
2. Study Area and Data Used
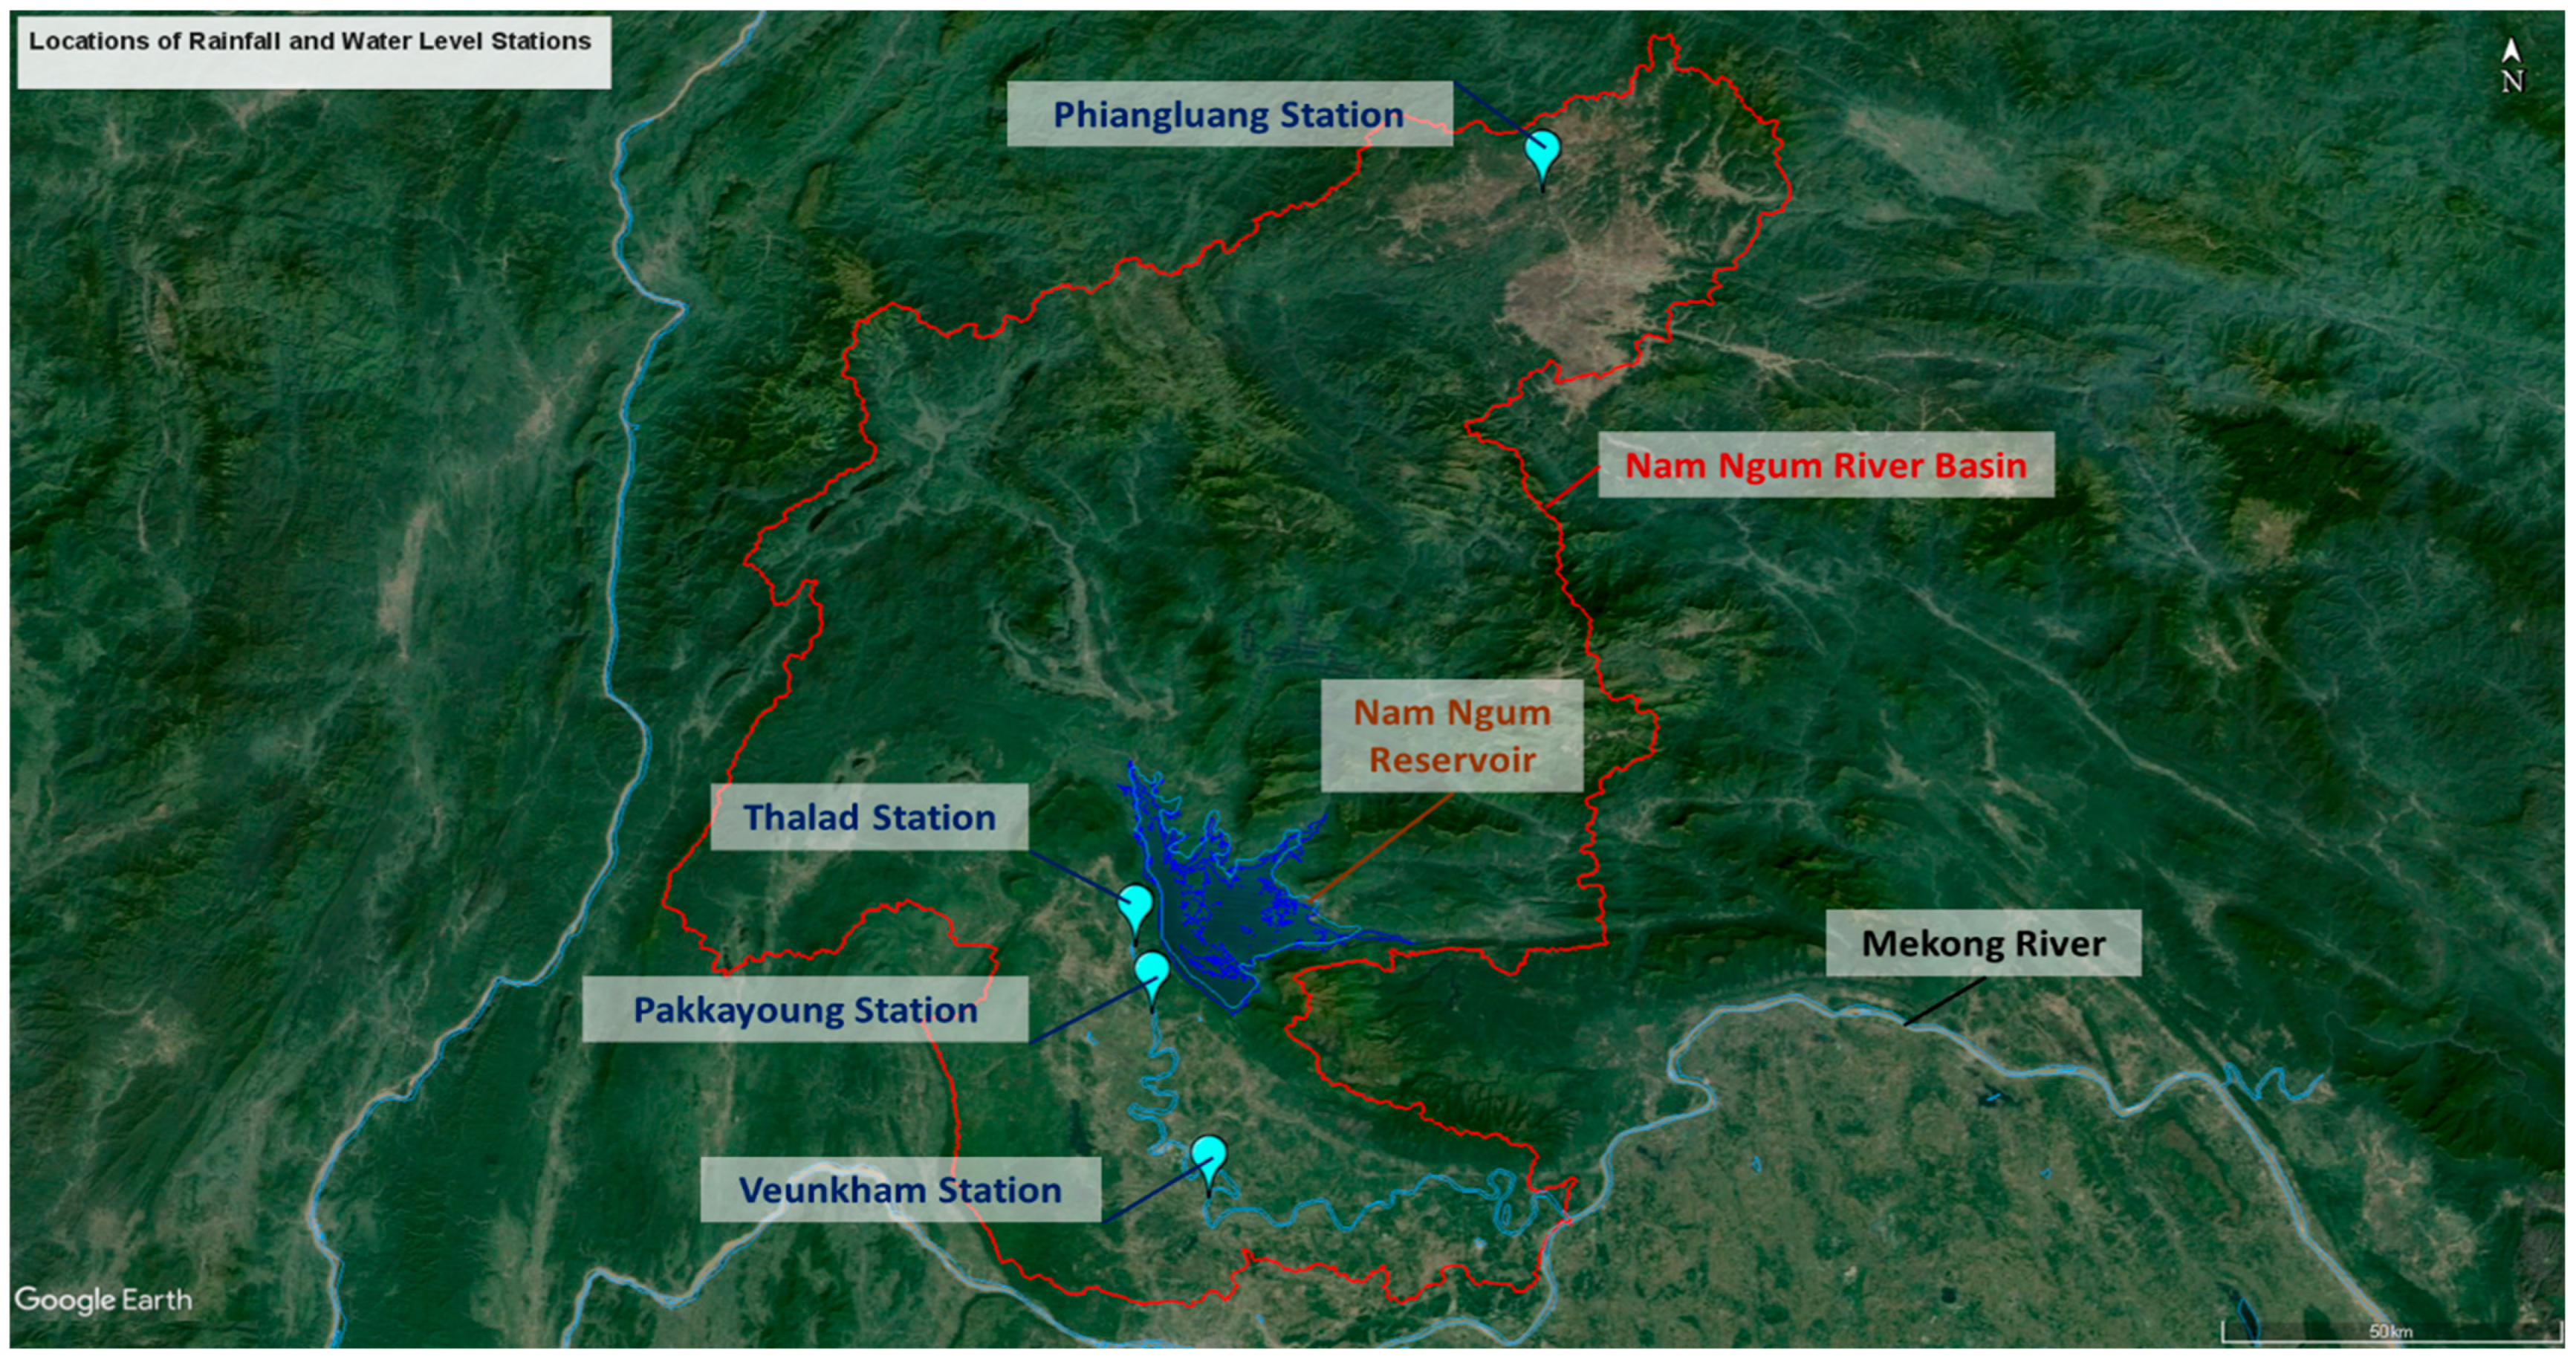
The Nam Ngum River Basin represents a critical natural asset for the Lao People’s Democratic Republic, significantly contributing to the nation’s food security. The basin’s principal watercourse, the Nam Ngum River, originates in the northeastern region and flows southward over a distance of approximately 420 km before converging with its major tributary, the Nam Lik River. After this confluence, the Nam Ngum River ultimately drains into the Mekong River at Pak Ngum. Covering a total catchment area of around 17,000 km
2, delineated by the red boundary in
Figure 1, the basin receives an average annual rainfall of about 2000 mm, with variations ranging from 1200 mm to 3500 mm. The wet season typically spans from June to October, followed by a distinct dry season for the remainder of the year. On average, the Nam Ngum River Basin contributes approximately 21,000 million cubic meters (mcm) of water annually to the Mekong River [
10].
Hydrological data were obtained from four monitoring stations within the Nam Ngum River Basin: Phiangluang, Thalad, Pakkayoung, and Veunkham. The Phiangluang station is located in the upper reaches of the Nam Ngum River, whereas Thalad, Pakkayoung, and Veunkham are situated downstream of the Nam Ngum Reservoir and main river.
Figure 1 illustrates the geographic distribution of these stations, which serve as the basis for the analysis conducted in this study. The coordinates for rainfall and water level measurements at each station are identical. Detailed information on the selected stations is presented in
Table 1, while
Table 2 summarizes key statistical characteristics of the hydrological variables. Among the stations, Veunkham, located furthest downstream, recorded the highest annual average rainfall at 1651 mm. In contrast, Phiangluang, the most upstream station, exhibited the lowest annual average rainfall (1283 mm) but experienced the highest recorded daily rainfall of 155.8 mm. The rainfall data used in this study represent daily cumulative rainfall, while the water level data correspond to daily average water levels.
Only the water level recorded at station Veunkham was used as the target output data, and the rainfall data collected from the selected four stations was used to generate the input feature in this study. Veunkham station was selected as the output station because it is strategically located at the most downstream point of the study area, near the border/outlet, before the Nam Ngum River converges with the Mekong River. This location is critical for downstream flood monitoring and transboundary water management, making it a highly relevant target for predictive modeling.
In this study, daily rainfall and water level data from the four selected stations within the Nam Ngum River Basin were employed to train the LSTM model. The available data spanned the period from January 2019 to October 2021, with any intervals containing missing values excluded from the model training process.
Table 3 presents a summary of the missing data for the Phiangluang, Thalad, and Veunkham stations. The hydrological datasets utilized in this study are consistent with those reported in [
11]. However, the dam release data from the upstream Nam Ngum Reservoir were inaccessible during the course of this study, which is acknowledged as a form of data limitation. It is believed that incorporating dam release information as one of the input features could enhance the predictive performance of the LSTM model.
4. Results and Discussions
4.1. Cross-Correlation Between Rainfall (Input) and Water Level (Output)
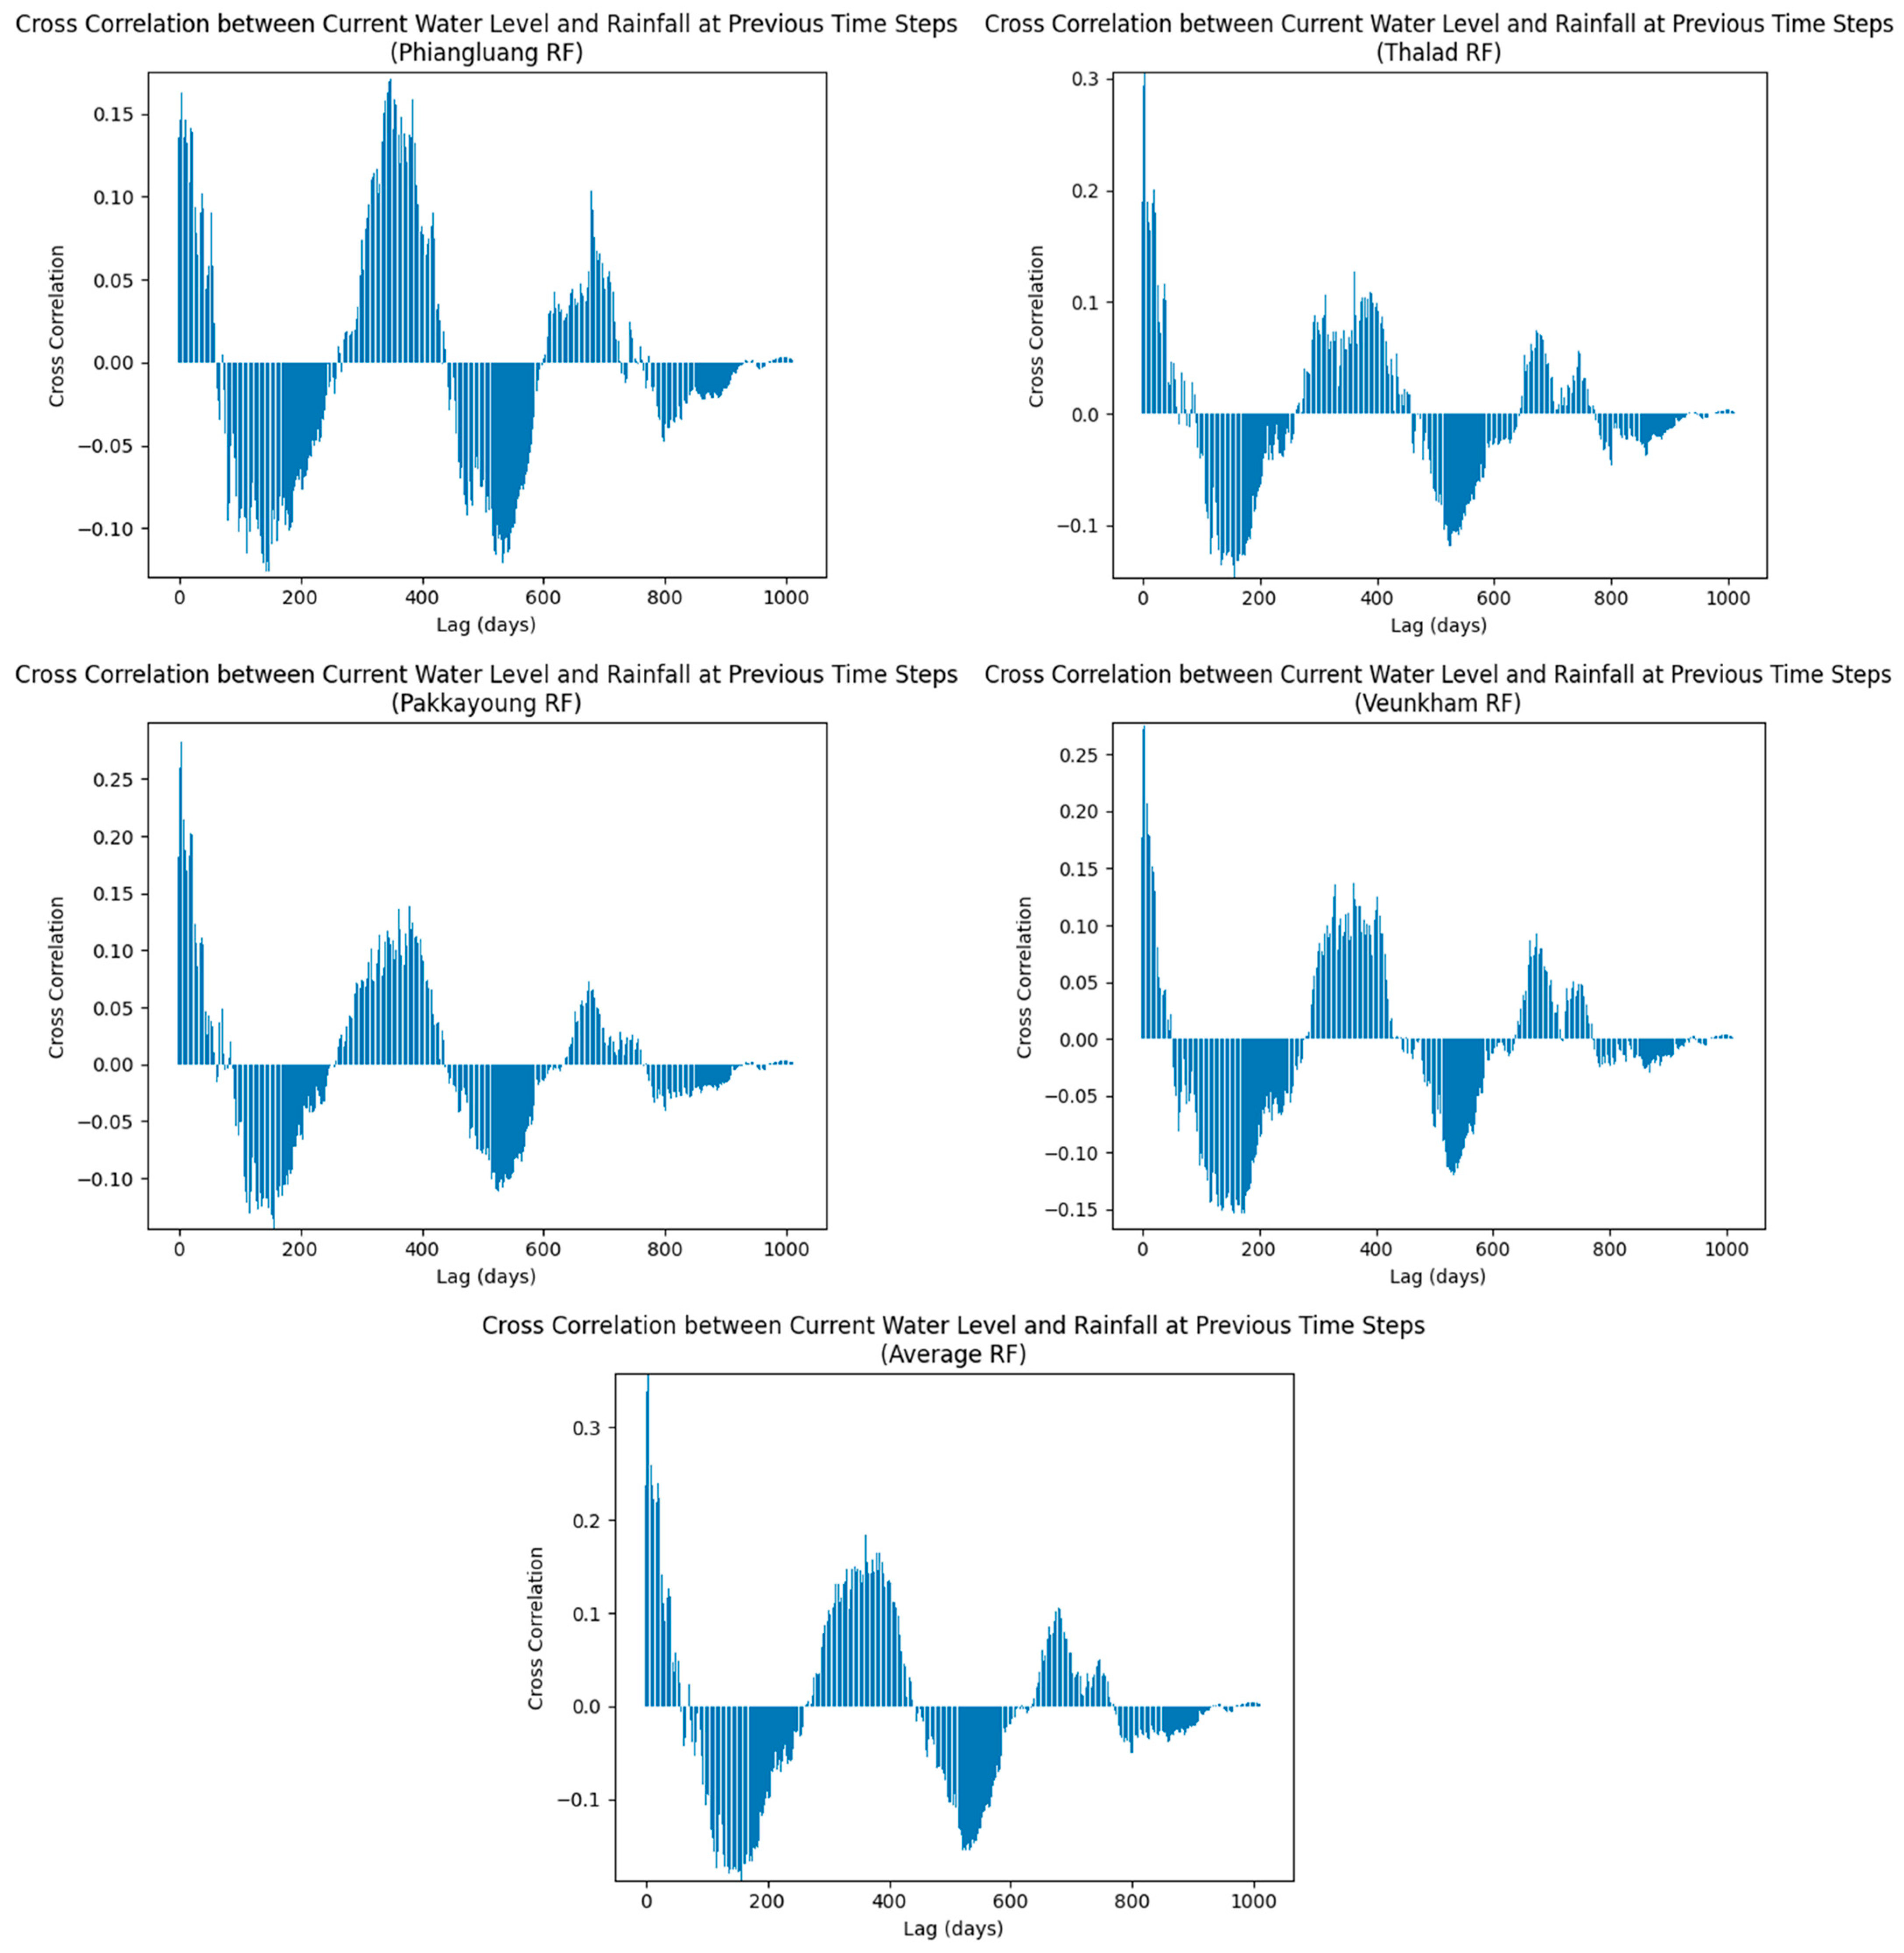
Concentration time is a widely utilized concept in hydrological modeling to characterize the temporal delay between rainfall events and the corresponding runoff response within a watershed. Traditionally, it has been estimated using empirical formulas such as the Kirpich method, which relies on the watershed’s physical characteristics. However, with the advancement of data-driven modeling approaches, the underlying relationship between rainfall and observed streamflow or river water level can now be examined through statistical methods such as cross-correlation analysis.
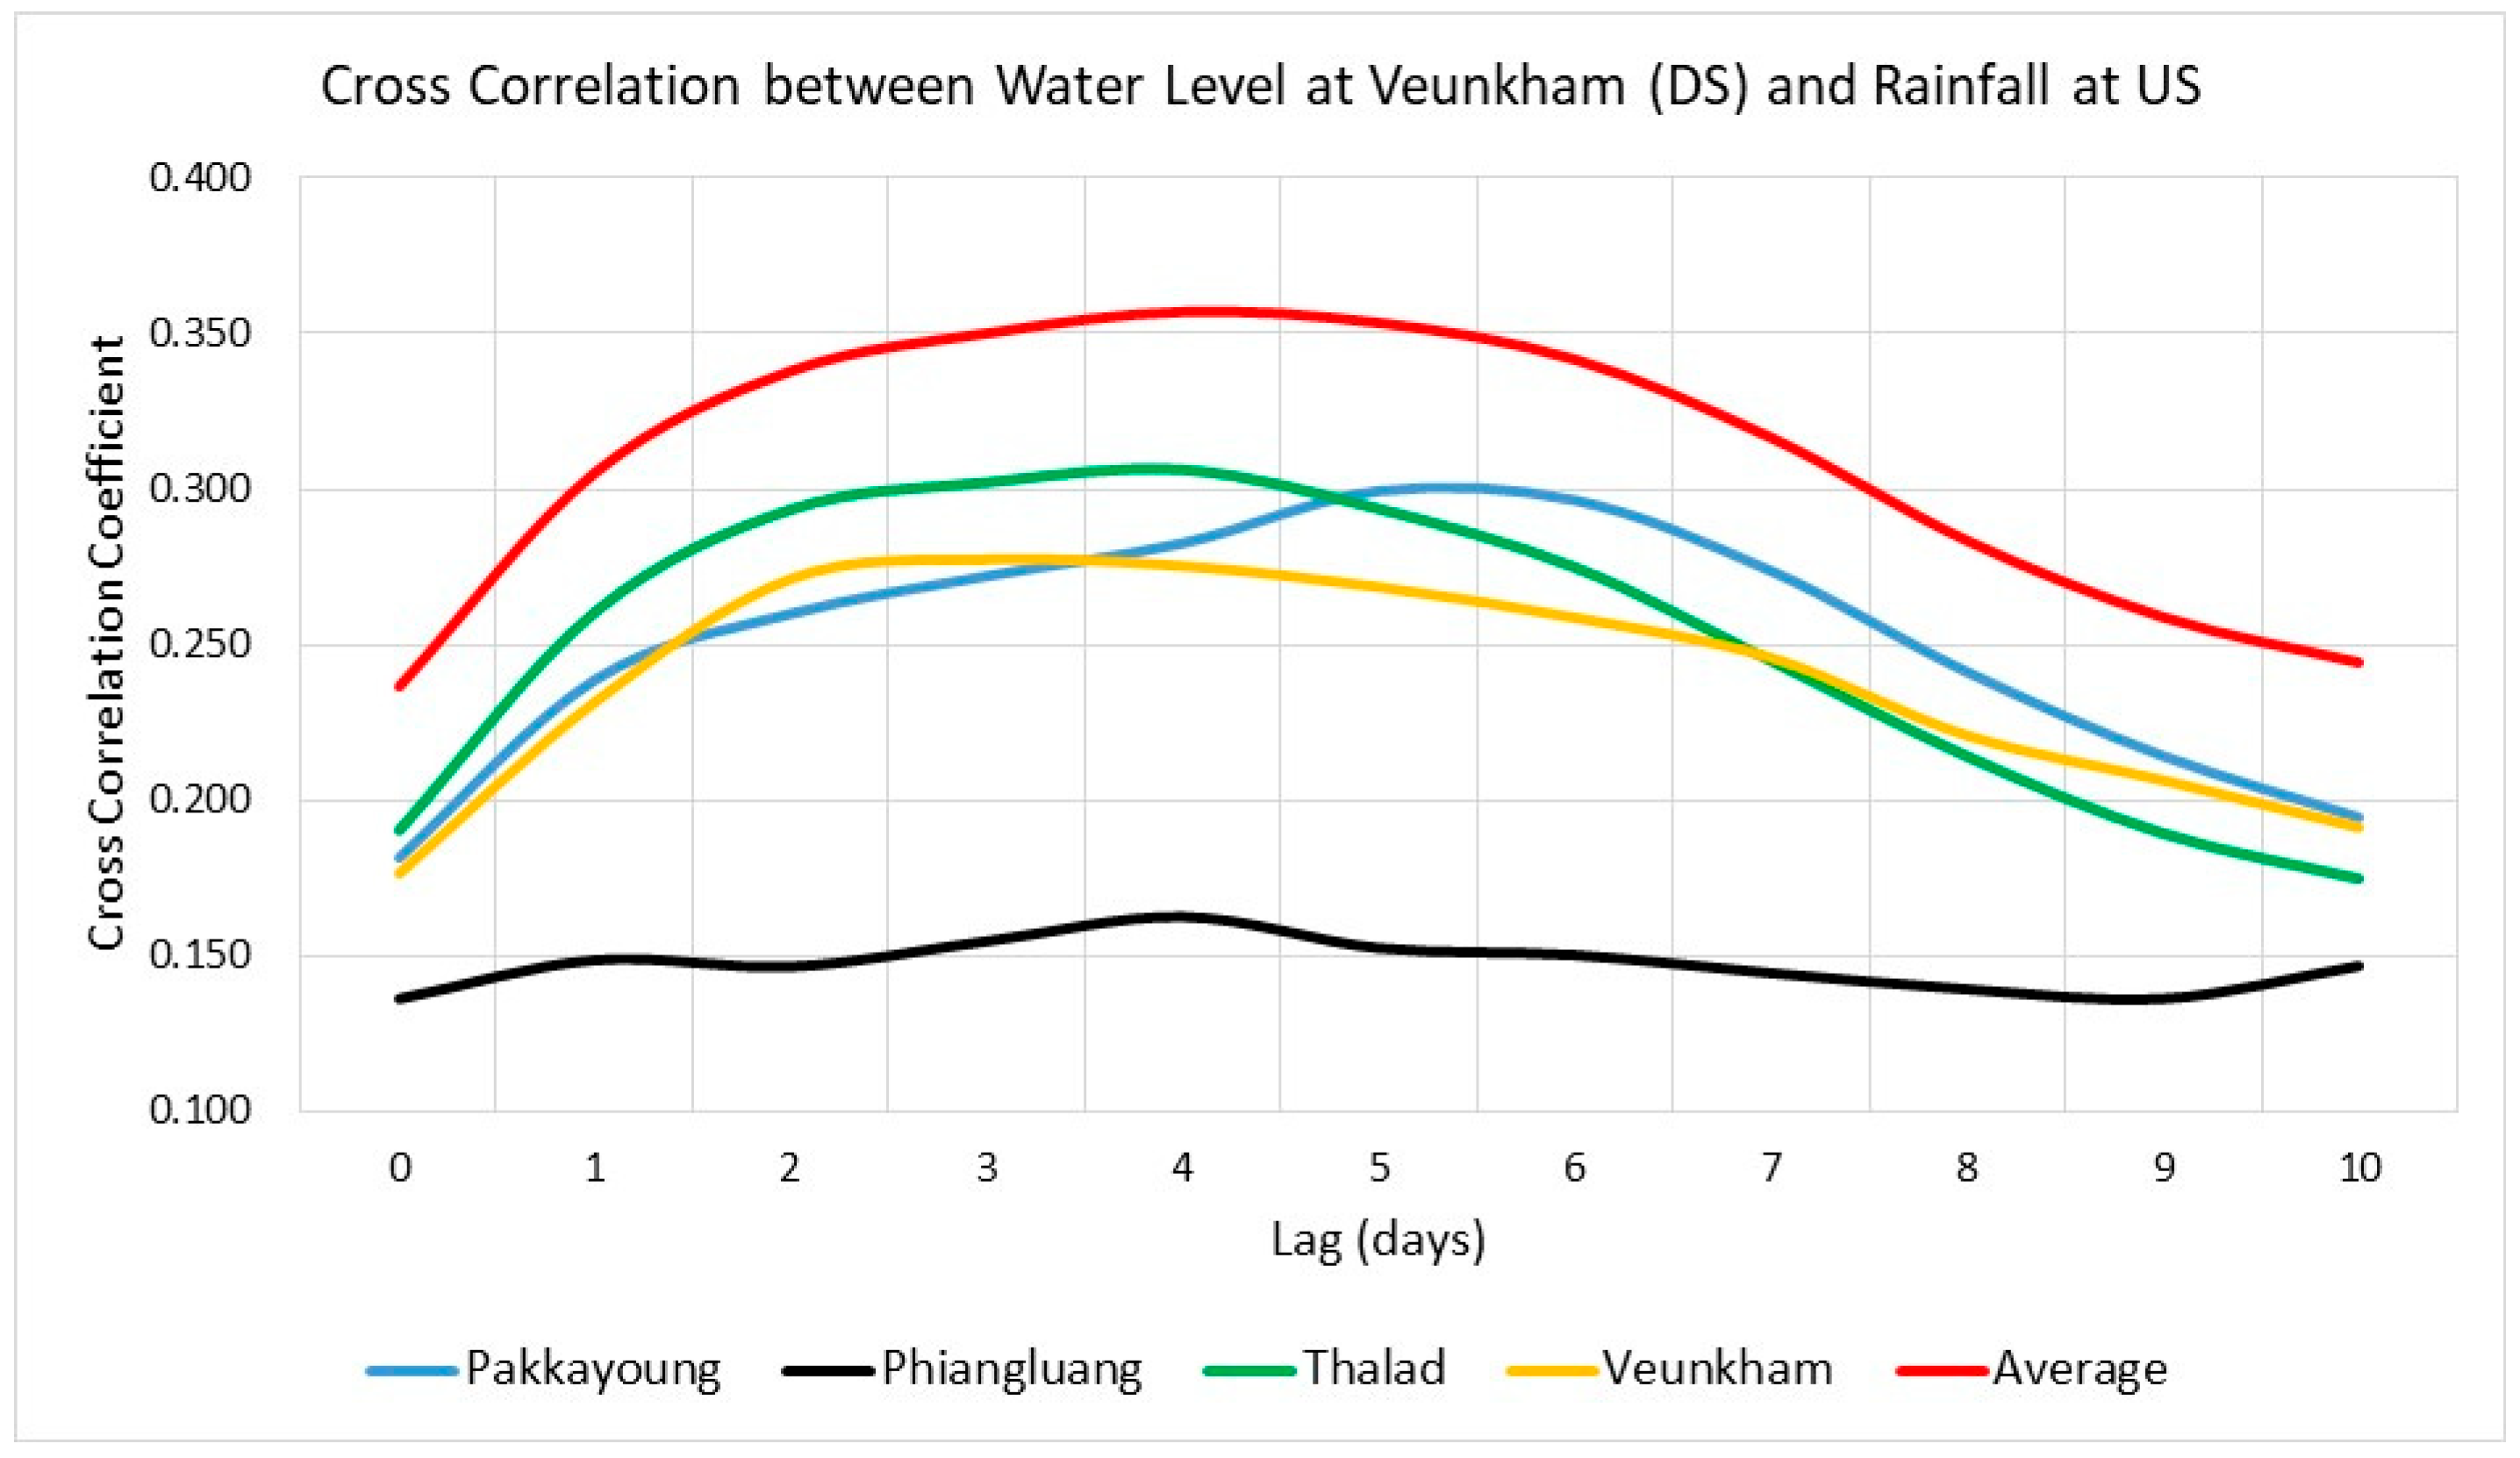
Figure 3 presents the cross-correlation coefficients calculated between water level and both point and average rainfall. A comparison of results between point rainfall and average rainfall (up to 10 lag times) is also presented in
Figure 4. The Pakkayoung station exhibited a maximum cross-correlation coefficient of 0.299 at a lag of 5 days. Similarly, the Phiangluang and Thalad stations reached their highest coefficients of 0.163 and 0.306 at a lag of 4 days, respectively, while the Veunkham station showed a peak coefficient of 0.278 at a 3-day lag. Osman et al. [
18] mentioned that a positive cross-correlation between rainfall and streamflow or water level with a lag indicates the presence of an autoregressive process. Furthermore, Wei et al. [
19] classified correlation coefficients between 0.4 and 0.6 as representing a ‘Medium’ degree of correlation, whereas coefficients ranging from 0.2 to 0.4 correspond to a ‘Weak’ correlation.
It can be observed from
Figure 4 that the point rainfall recorded at Phiangluang station exhibited the lowest cross-correlation with the water level observed at Veunkham station. This may be attributed to the geographical locations of the stations: Phiangluang station is situated at the most upstream part of the Ngam Ngum River, whereas Veunkham station is located at the most downstream part, as shown in
Figure 1. Additionally, the cross-correlogram for Phiangluang station indicates that its cross-correlation coefficient peaked again after a lag of over 300 days. It is unusual for rainfall events occurring more than 300 days earlier to exert an influence on the water level observed at the current time step. This anomaly further supports that point rainfall recorded at Phiangluang station cannot serve as a reliable precursor for the water level observed at Veunkham station.
The cross-correlation coefficients for point rainfall recorded at Thalad, Pakkayoung, and Veunkham stations were similar, likely due to the proximity of these stations to one another. Interestingly, the average rainfall calculated from the point rainfall data at Phiangluang, Thalad, Pakkayoung, and Veunkham stations yielded the highest cross-correlation with the water level at Veunkham station (represented by the red line in
Figure 4, with a maximum coefficient of 0.357 after 4 days of lag). This may inform that point rainfall is insufficient in covering the entire Ngam Ngum watershed due to its limited spatial coverage. Thus, this finding suggests that average rainfall should be used as the input feature, rather than point rainfall recorded at individual stations, to predict the water level at Veunkham station. This is supported by the high cross-correlation observed.
Table 6 summarizes the confidence intervals of the cross-correlation coefficients calculated between the point rainfall at each station and the average rainfall against the target water level variable. The numbers in parentheses indicate the lag days corresponding to each cross-correlation coefficient. The results show that all computed cross-correlation coefficients exceeded the critical threshold for the 95% confidence interval, indicating that they are statistically significant. In other words, the likelihood that these observed correlations occurred by random chance under the null hypothesis of no correlation is less than 5%. This suggests that rainfall, particularly average rainfall, was significantly correlated with the target water level variable at the given lag times. These findings further support the appropriateness of using rainfall inputs, especially average rainfall, as predictive features for water level forecasting.
4.2. Optimization of LSTM Water Level Forecasting Model
A default set of hyper-parameters, as presented in
Table 7, was adopted to implement the LSTM water level forecasting model at the target station. The simulated results obtained using these default hyper-parameters were compared with the observed data, as illustrated in
Figure 5. The corresponding performance metrics are also summarized in
Table 7. These baseline results serve as a reference for evaluating the effectiveness of the optimization algorithms employed to enhance the LSTM model’s predictive performance, as discussed in subsequent sections.
A total of 24,500 hyper-parameters combinations (5 × 4 × 49 × 5 × 5) were generated based on the search ranges outlined in
Table 5 for implementation in a Grid Search approach. Specifically, the search space comprised five values [10, 30, 50, 70, 90] for the number of neurons, four values [0.1, 0.2, 0.3, 0.4] for the dropout rate, forty-nine values (ranging from 0.1 to 0.001 with a step size of 0.002) for the learning rate, five values [16, 32, 48, 64, 80] for the batch size, and five values [10, 30, 50, 70, 90] for the number of epochs.
In contrast, for Random Search and Bayesian Optimization, three experimental scenarios were defined to identify optimal hyper-parameters configurations, consisting of 10, 50, and 100 iterations, respectively. That is, in the scenario with 10 iterations, 10 hyper-parameters combinations were sampled, and the optimal configuration was selected from among these. The final optimized hyper-parameters combinations are presented in
Table 8 and the optimization results are summarized in
Table 9.
It can be seen from
Table 9 that Grid Search yielded the least promising results compared to the others; generally, Grid Search performs worse than Random and Bayesian Search for several reasons, particularly in high-dimensional parameter spaces or when dealing with complex models. We all know that Grid Search evaluates every possible combination of parameters in a predefined grid. As the number of parameters (dimensions) increases, the number of combinations grows exponentially. It can be observed in
Table 9 that around 24 h searching time was required for Grid Search to identify the optimal combinations of hyper-parameters in this study. In contrast, only several minutes were required for Random and Bayesian Search to identify the optimal combinations of hyper-parameters, and their performances were far better than Grid Search. This elucidates that Grid Search was not only ineffective in terms of computational time, but also wasted computational resources in evaluating poor parameter combinations, as it explored the parameter space uniformly, regardless of whether certain regions were more promising than others. Apart from that, Grid Search also suffers from a lack of adaptation ability, where it does not adapt its search strategy based on previous results, resulting in it evaluating all points in the grids regardless of whether some regions are clearly suboptimal. This will be eventually followed by the problem of overfitting to the grid as it is limited by the granularity of the grid; if the grid is too coarse, it may miss the optimal parameter values. Inversely, if the grid is too fine, it becomes computationally prohibitive. These factors may explain why the Grid Search algorithm in this study performed poorly in identifying optimal hyper-parameter combinations for predicting and forecasting river water levels.
In Random Search, the results obtained indicate that having more iterations does not always improve the performance of optimized hyper-parameters due to several reasons. It may be a result of the random nature of this searching algorithm. Random Search randomly samples parameter combinations from a defined space; it does not guarantee better results with more iterations, as it may not explore the most promising regions of the parameter space effectively. Secondly, Random Search can quickly find optimum parameter combinations initially, but as it continues, the likelihood of finding significantly better combinations decreases, leading to diminishing returns where additional iterations provide minimal or no improvement. Apart from that, in high dimensional parameter spaces, the search spaces become vast enough that the random sampling may miss the optimal regions. Consequently, more iterations do not necessarily ensure better coverage, as Random Search lacks a mechanism to focus on the optimal regions. Lastly, unlike other advanced optimization techniques like Bayesian optimization, Random Search does not learn from previous iterations. Since it does not use past results to guide future sampling, it may repeatedly sample suboptimal regions.
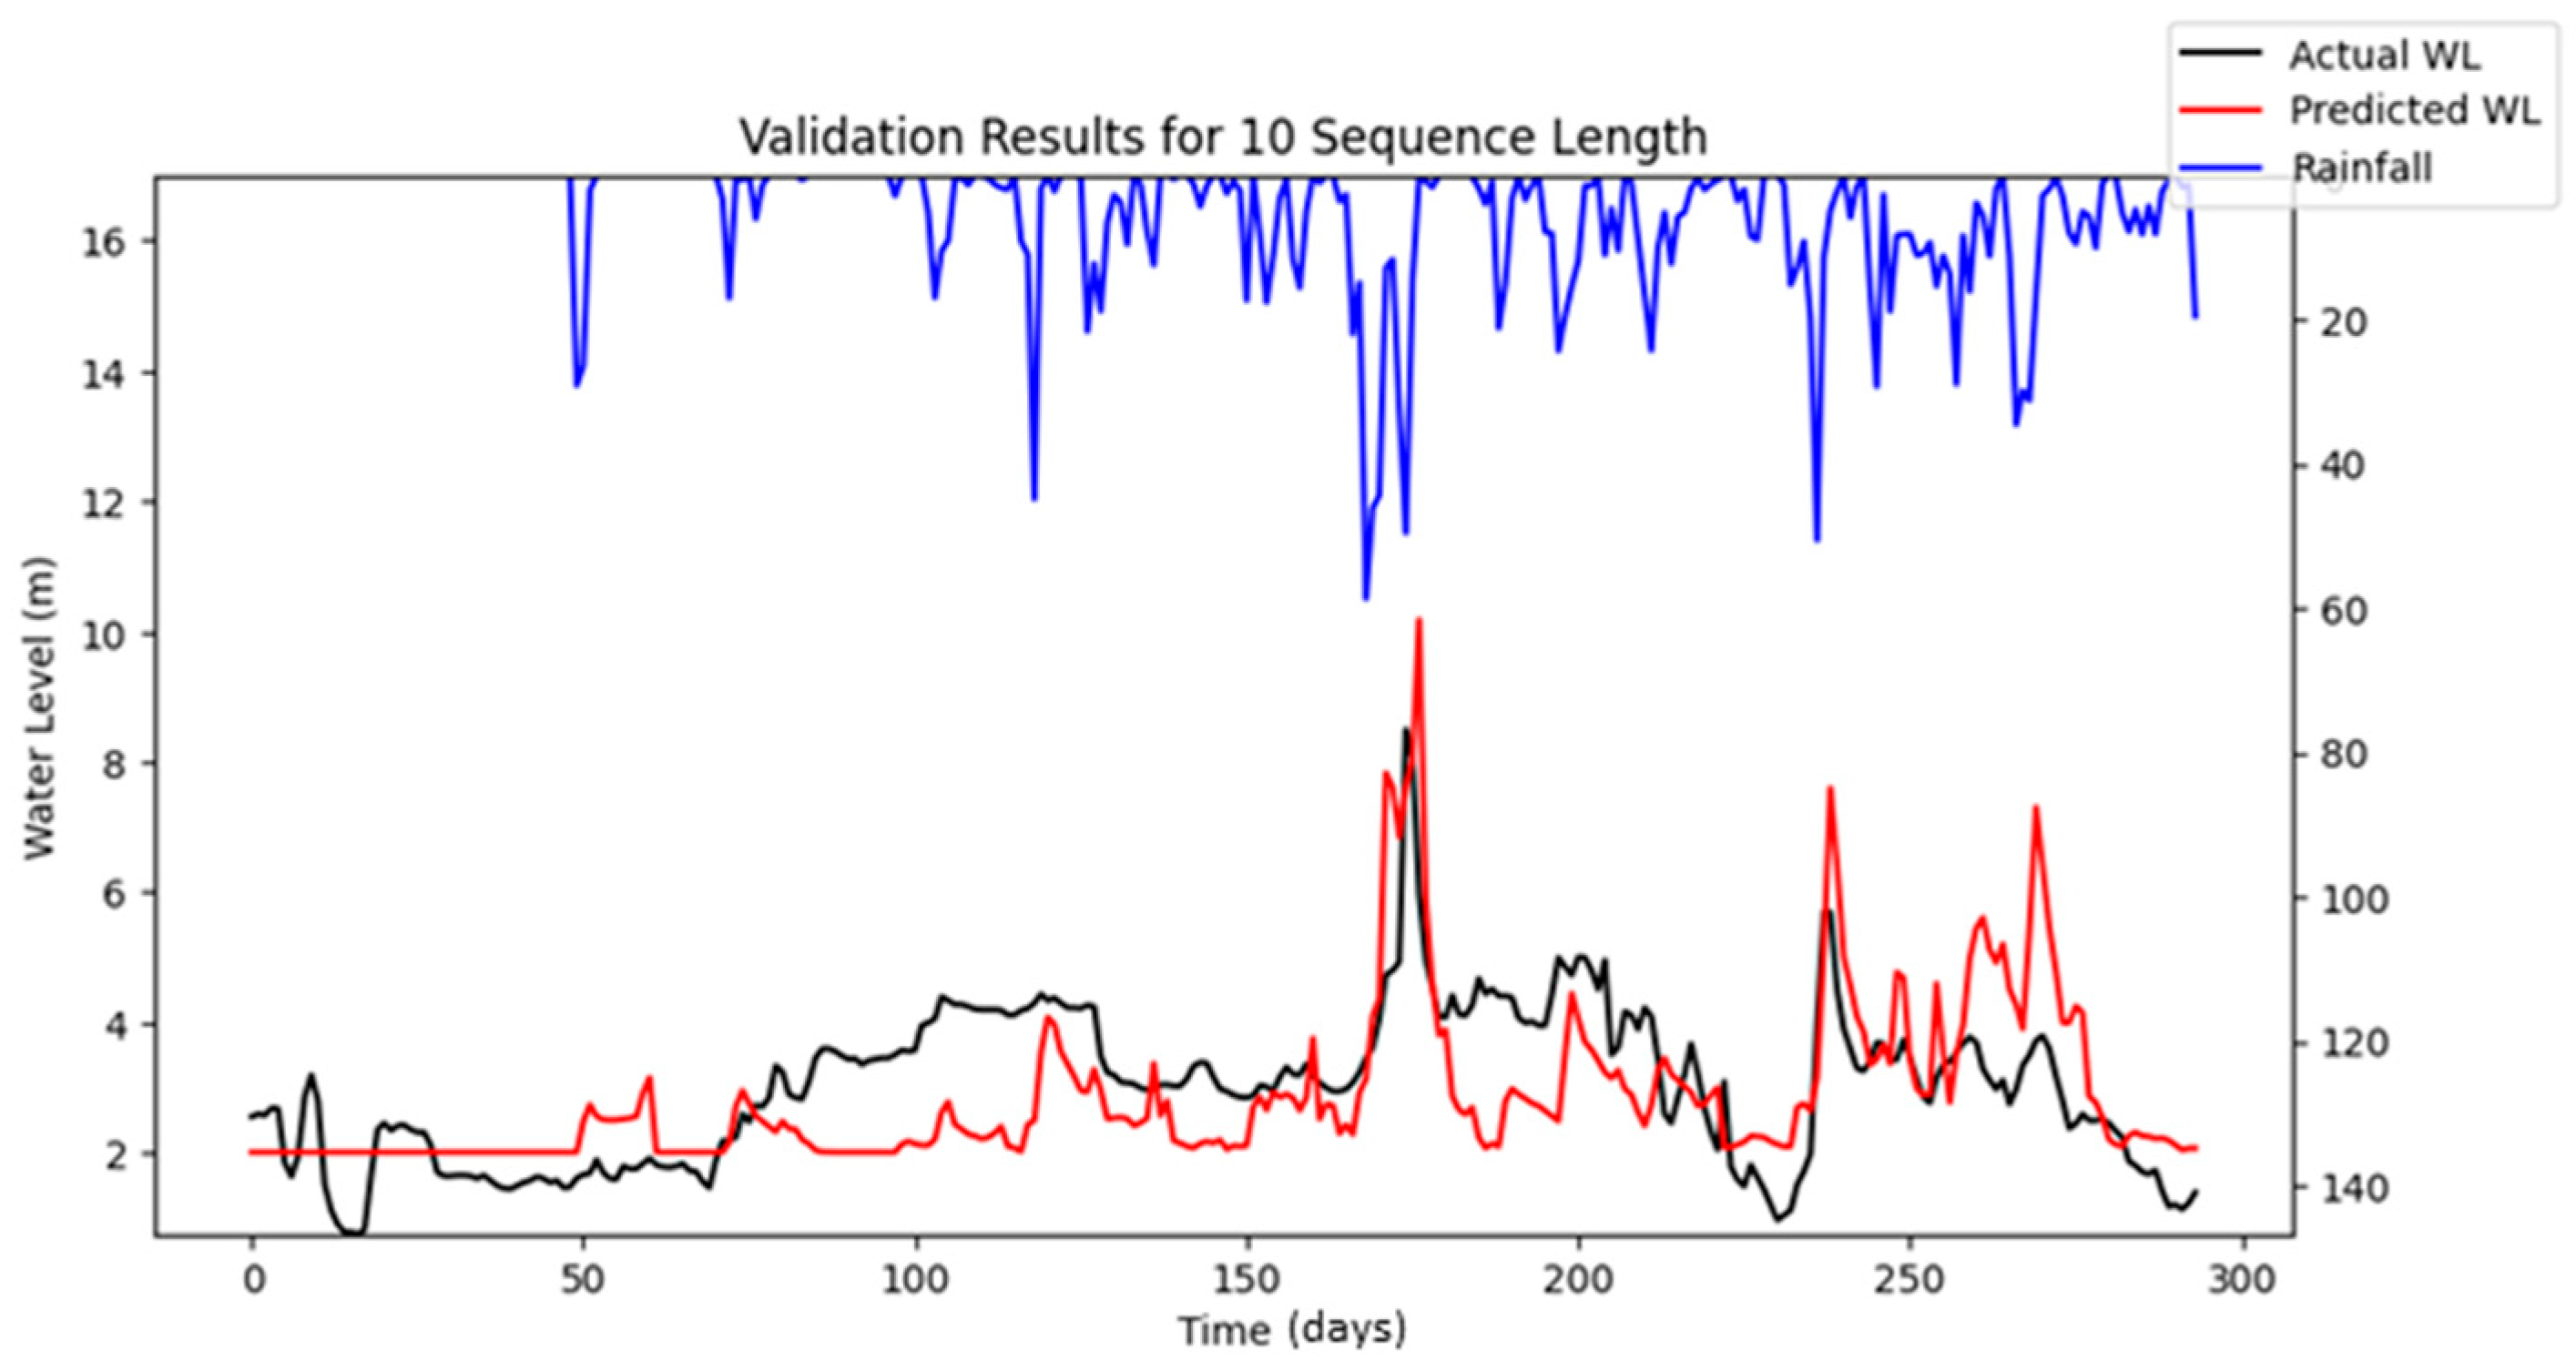
Bayesian Search uses a surrogate model (Gaussian processes) to approximate the objective function and an acquisition function to decide where to sample the future combinations. This allows it to balance exploration (searching new regions) and exploitation (focusing on promising regions). It is less affected by the curse of dimensionality, as it does not rely on fixed grid structure, allowing it to explore the parameter space more flexibly and making it highly adaptive to predict promising regions and focus the searches there. As a result, Bayesian Search often finds better solutions and outperforms Grid and Random Search. The optimization results showed that Random Search performance fluctuated across iterations, whereas Bayesian Search remained relatively stable. Furthermore, both RMSE and MAE metrics indicated that Bayesian Search achieved lower error values relative to the other optimization methods evaluated. However, similar to Random Search, the performance of Bayesian Search did not improve significantly as well with an increasing number of iterations. However, both Random Search and Bayesian Optimization led to improvements in forecasting accuracy compared to the baseline simulation. Notably, the Nash–Sutcliffe Efficiency (NSE) values achieved through these optimization methods were significantly higher, particularly during the testing period. This indicates that the optimized models demonstrated consistently strong performance across both the training and testing phases. The visualizations of simulated water level versus observed water level in training and testing periods using optimal combinations of hyper-parameters identified from respective searching algorithms are portrayed in
Figure 6,
Figure 7,
Figure 8,
Figure 9,
Figure 10,
Figure 11 and
Figure 12.
Based on the optimization results concluded from this study, the performances of respective optimization or searching algorithm can be summarized according to particular criteria depicted in
Table 10. Grid Search is time-exhaustive, has slow efficiency, and may also miss optimal solutions located in between the grid points. Apart from that, it suffers from the curse of dimensionality and requires a very high computational cost. Lastly, it has no adaptability during its searching process by learning from the previous search.
4.3. Reproducible LSTM Simulations
The optimized LSTM simulations, as discussed in previous sections, are all based on stochastic simulations where the simulated results are not reproducible, as the results will be different in each simulation due to the random nature of LSTM model. This random nature may introduce problems for flood forecasting in the real world, as different forecasting results will be obtained in each simulation even though identical inputs are fed into the trained and optimized LSTM model. To resolve this, the architecture of the LSTM model has been modified to ensure the reproducibility of the forecasted results by defining a constant random seed of 42 for any random modules adopted in the LSTM model. Apart from that, the environment variables used in Tensorflow 2.15.0 have also been enforced to follow deterministic operations, which ensures that the computations using Tensorflow 2.15.0 in the LSTM model will produce the same results every time when identical inputs are fed into the model, which is useful for reproducibility of the prediction of water level for flood forecasting.
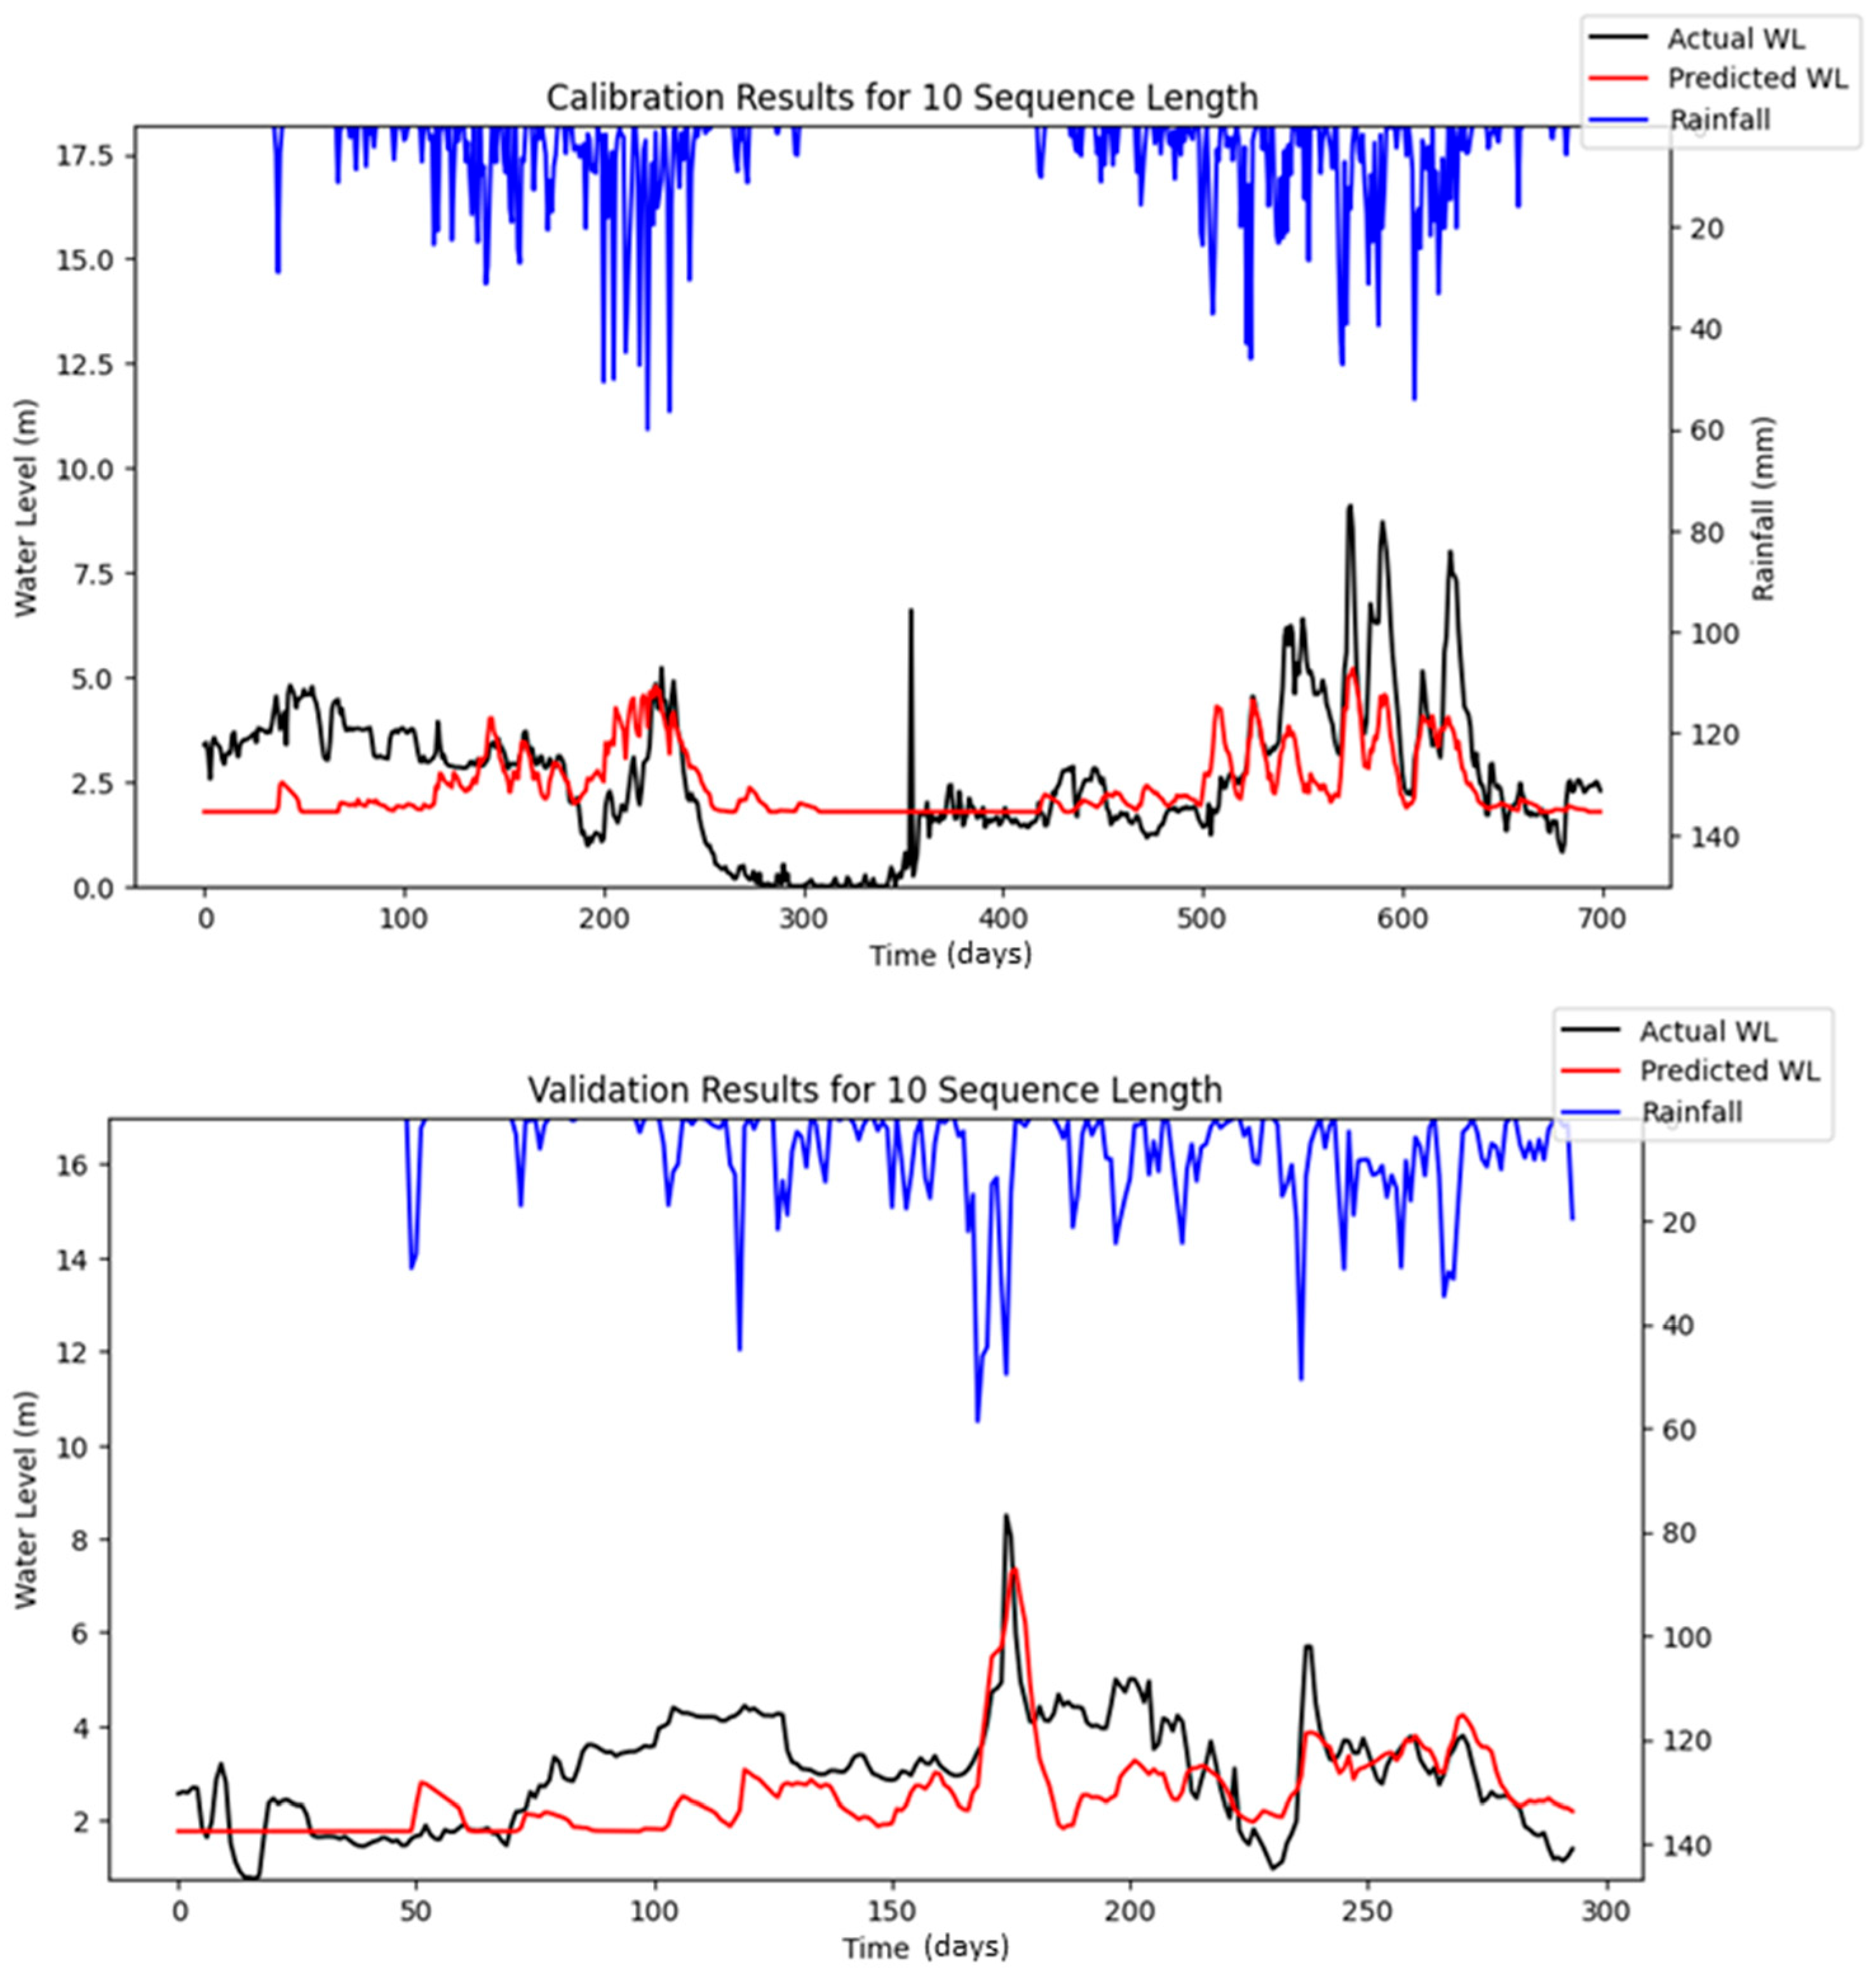
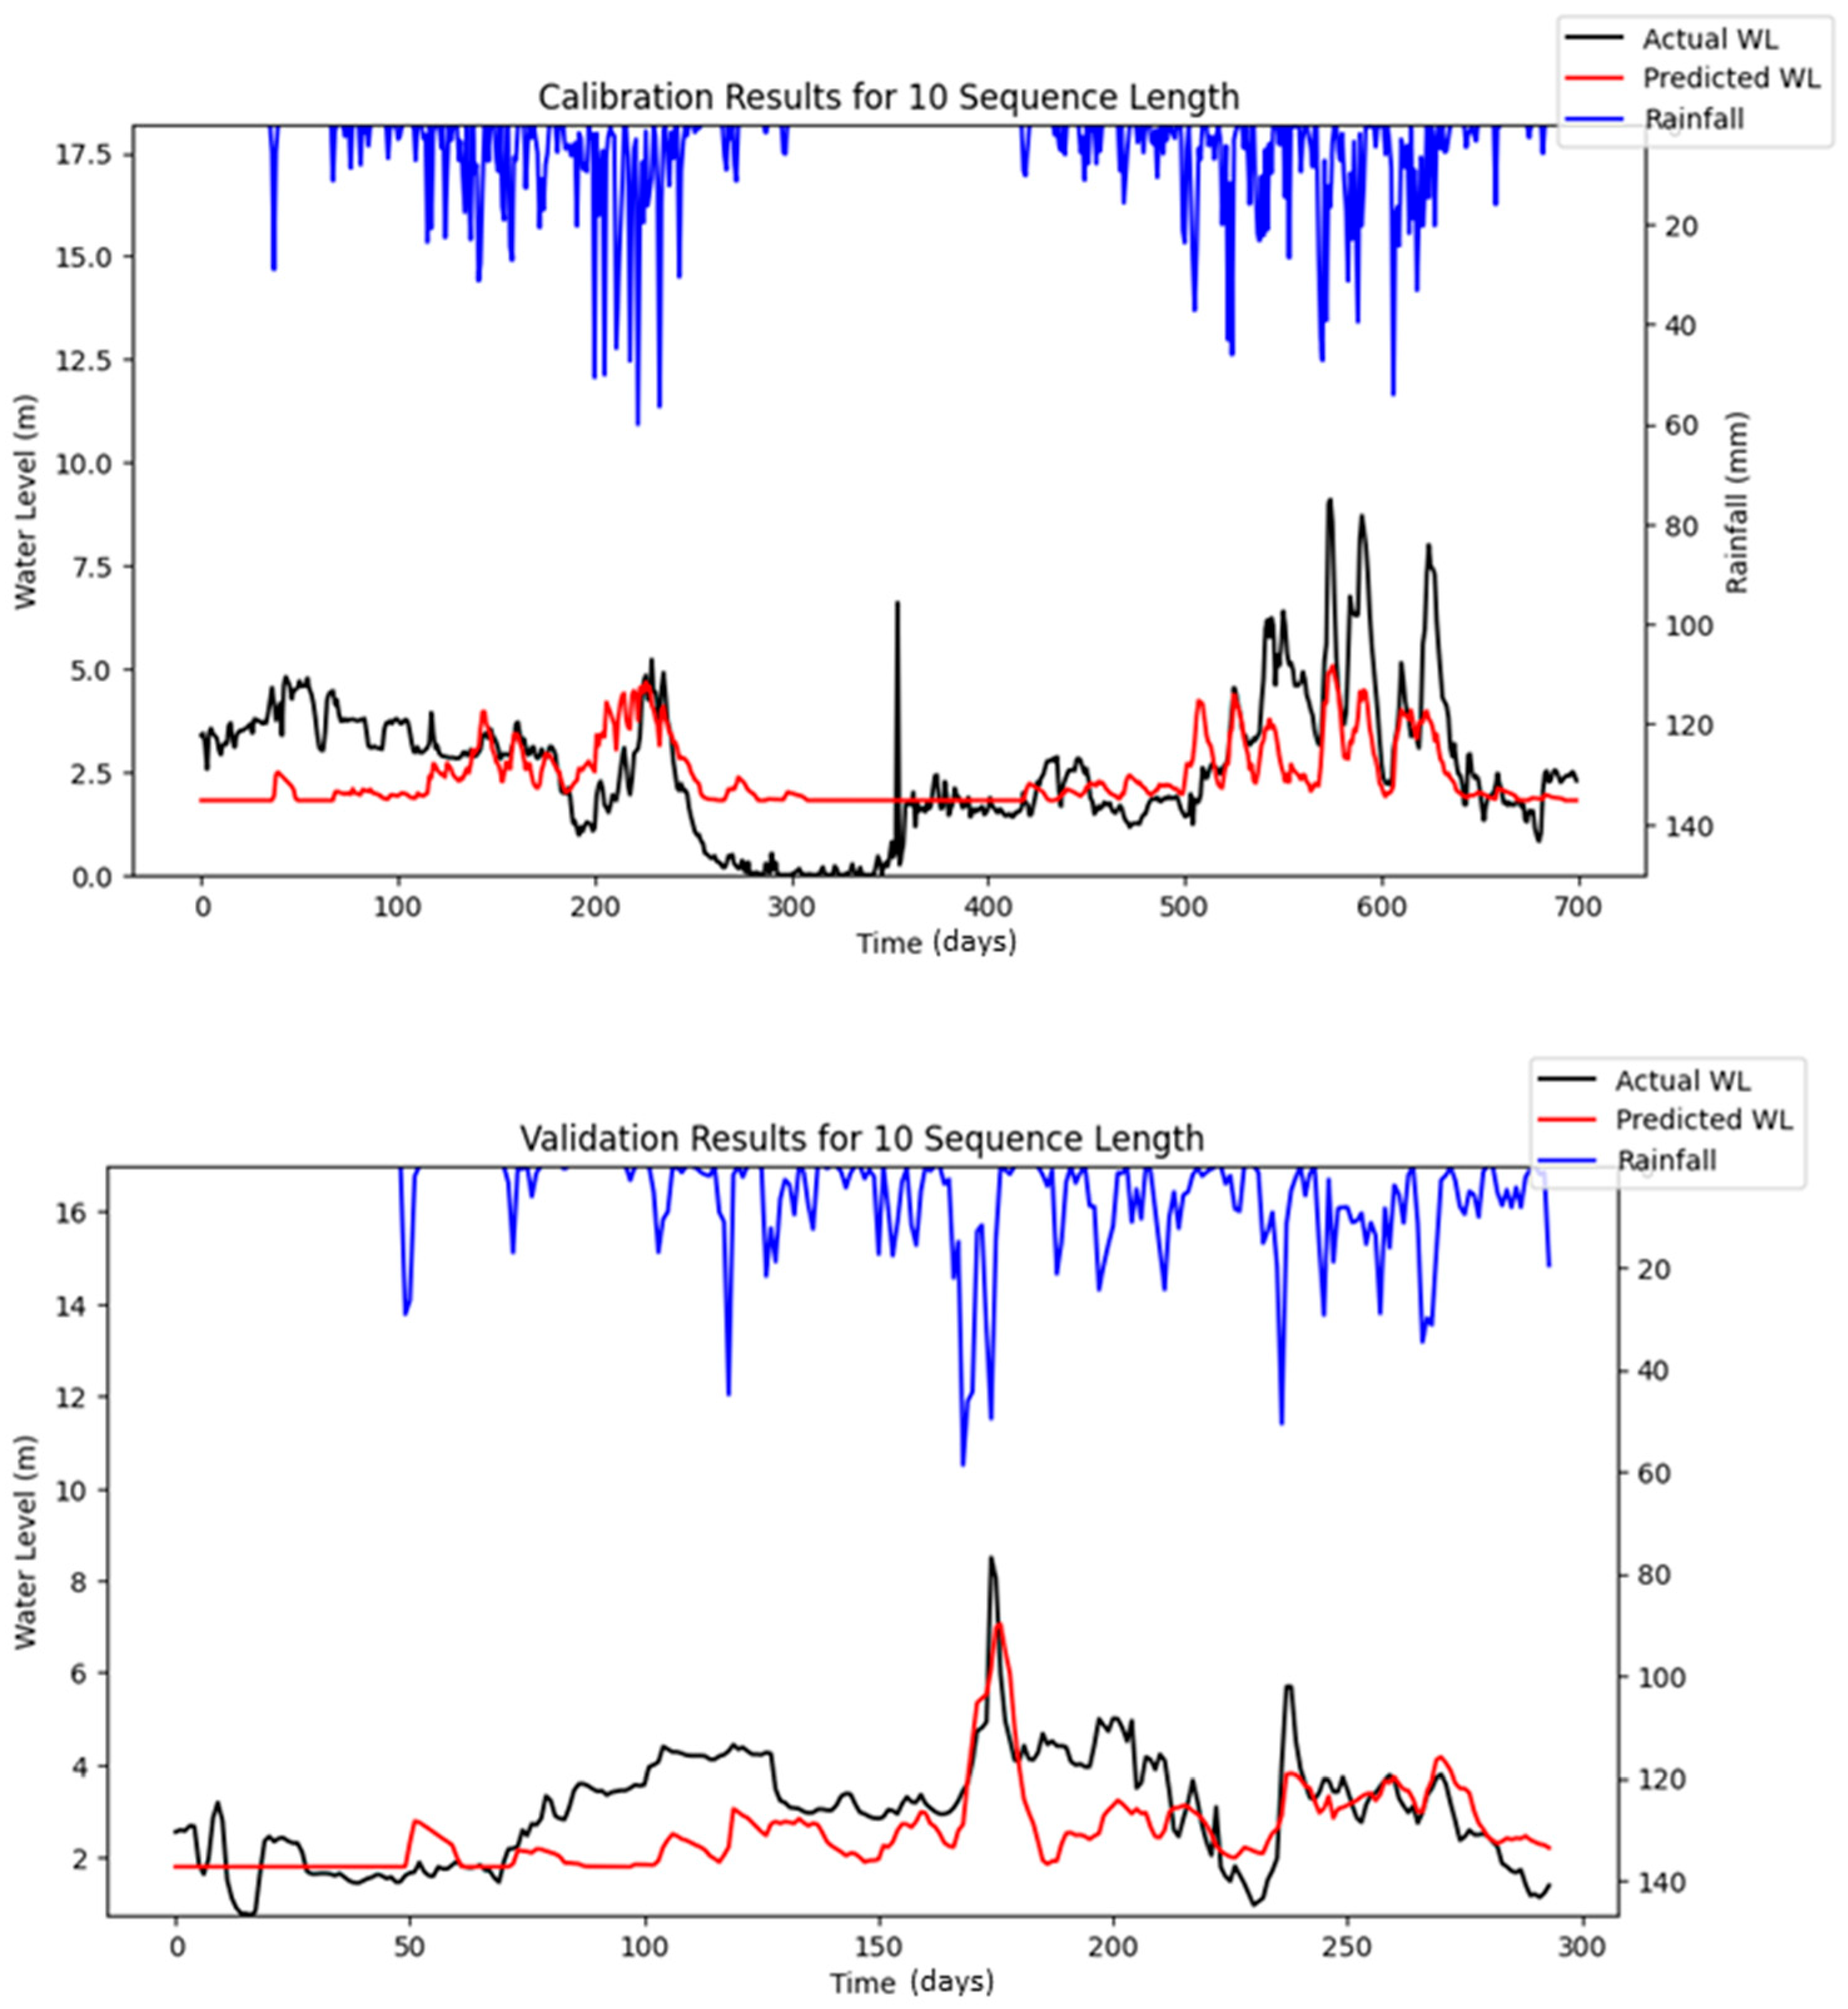
The optimization using Bayesian Search was re-conducted by using the modified LSTM model to allow for reproducible simulation; the optimized results and their performances are depicted in
Table 11 and
Table 12. The simulated results for respective iterations are portrayed in
Figure 13,
Figure 14 and
Figure 15.
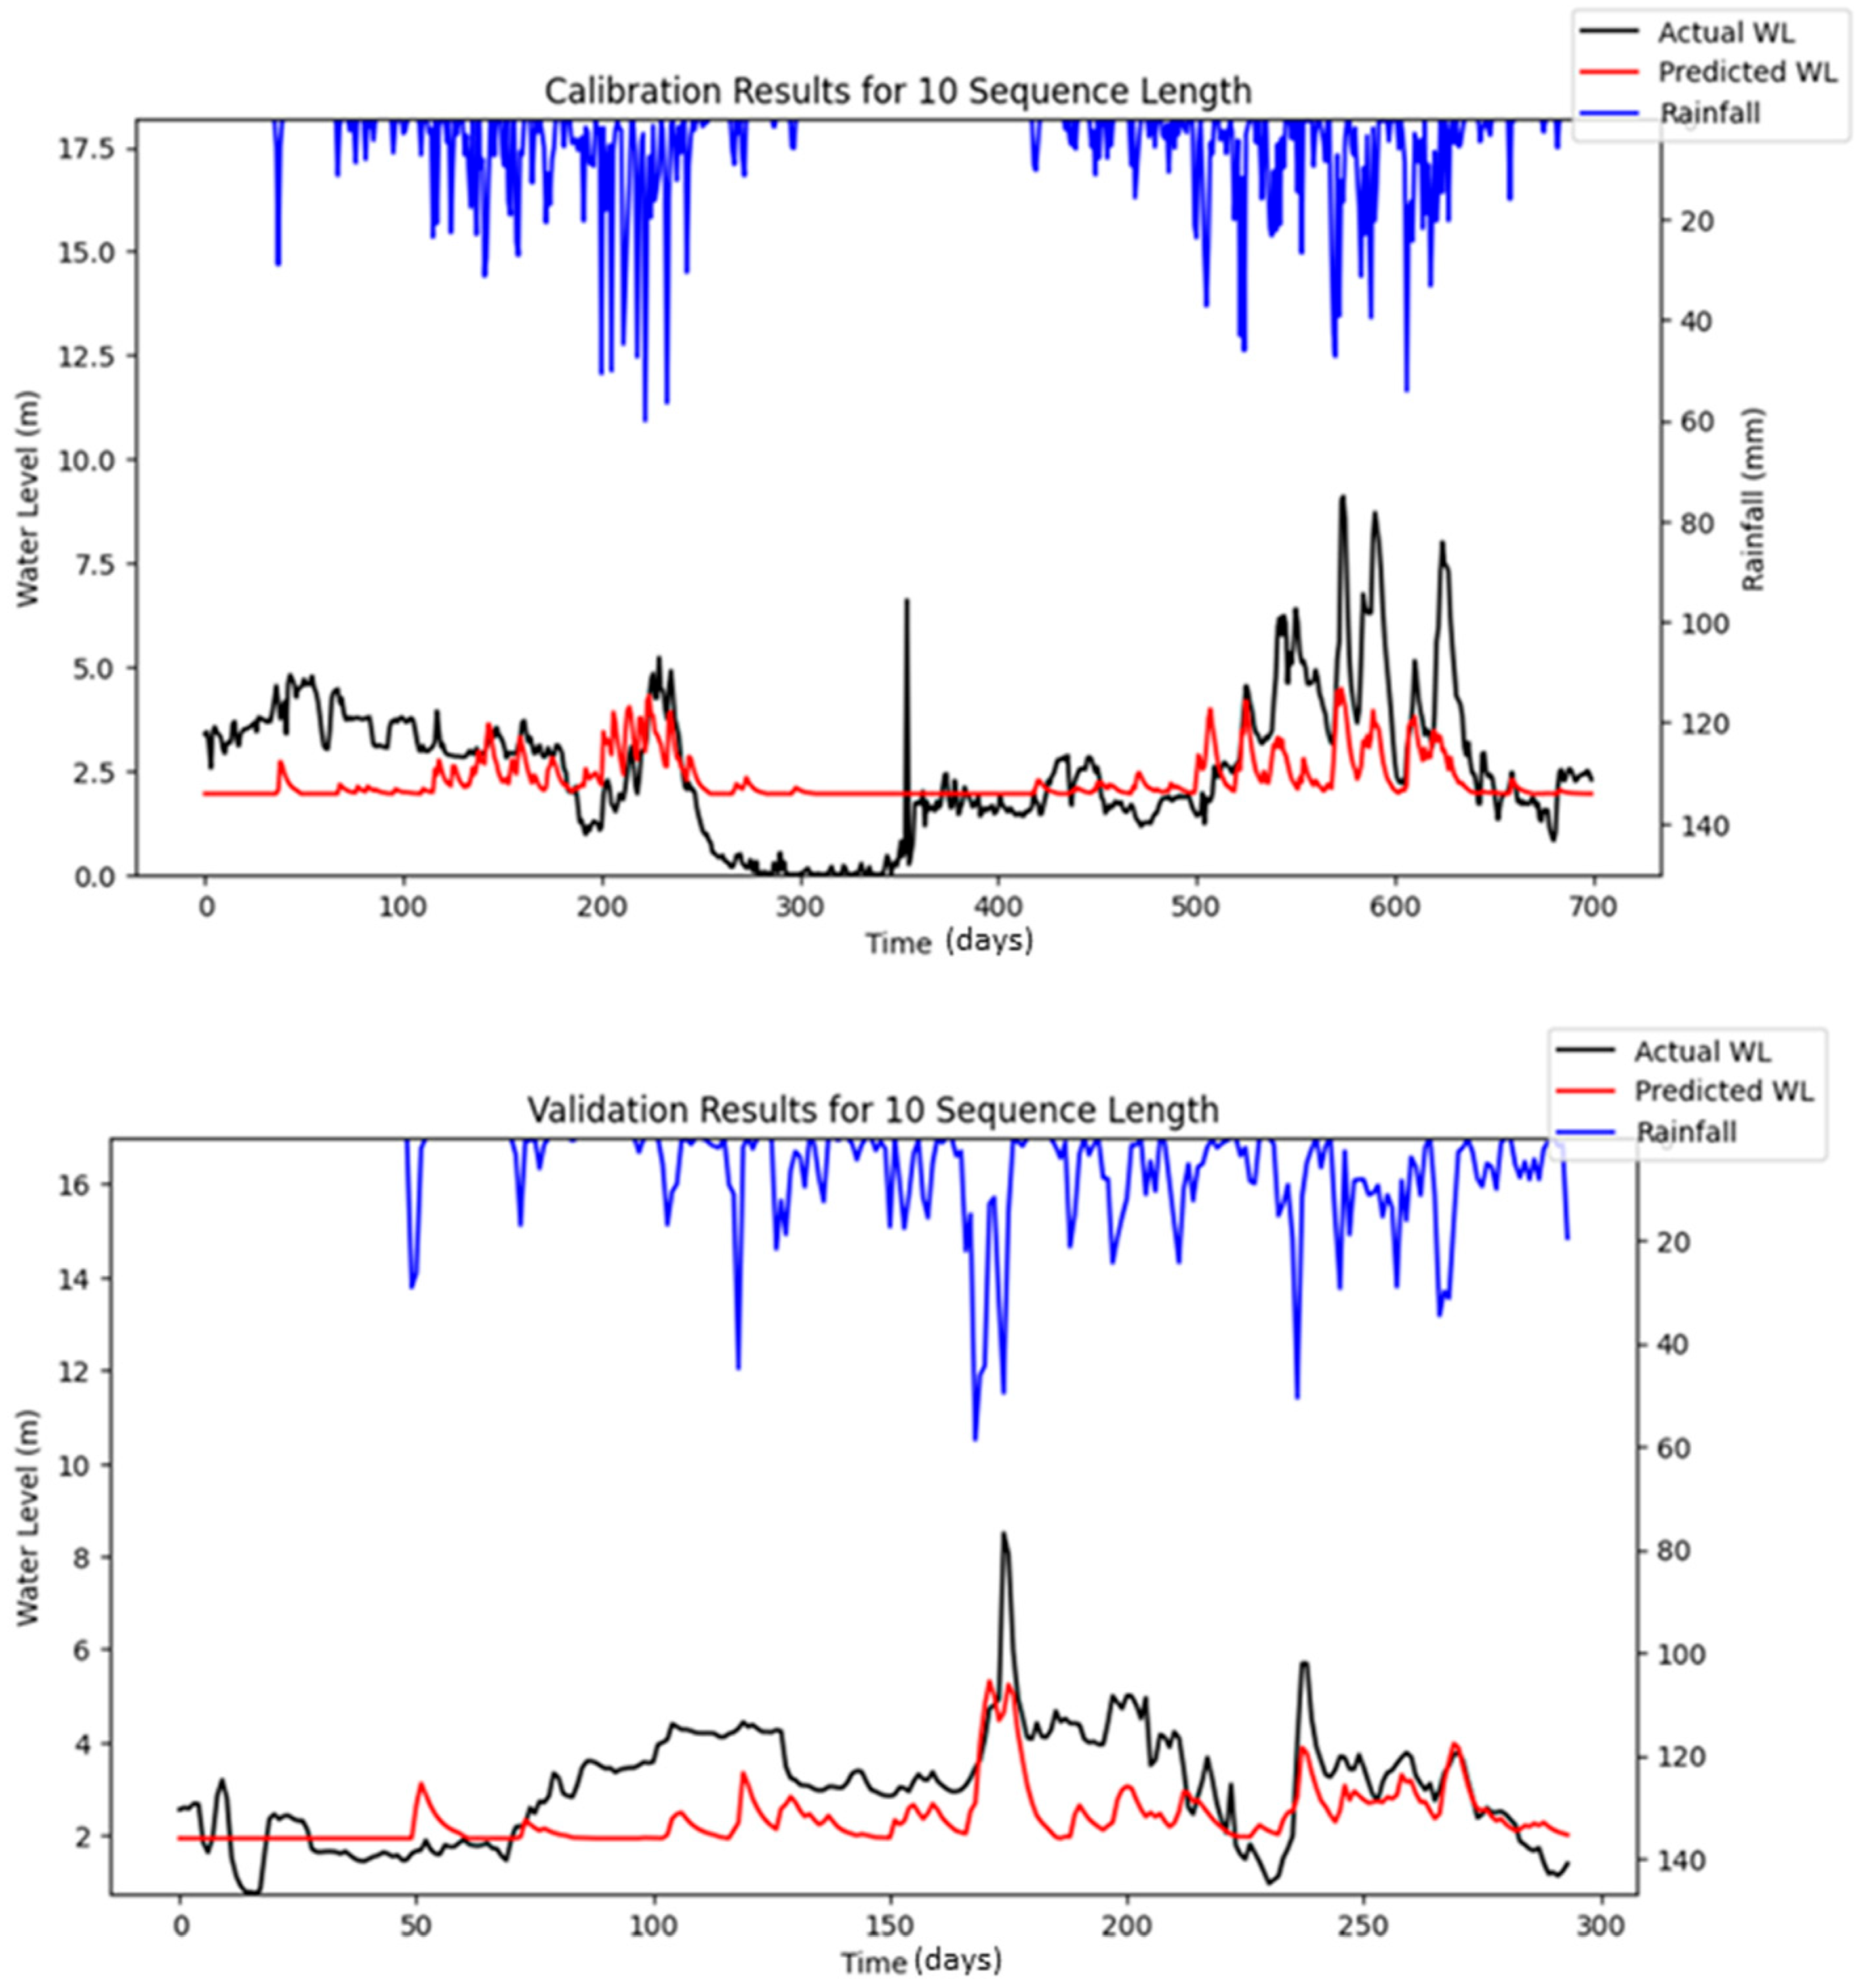
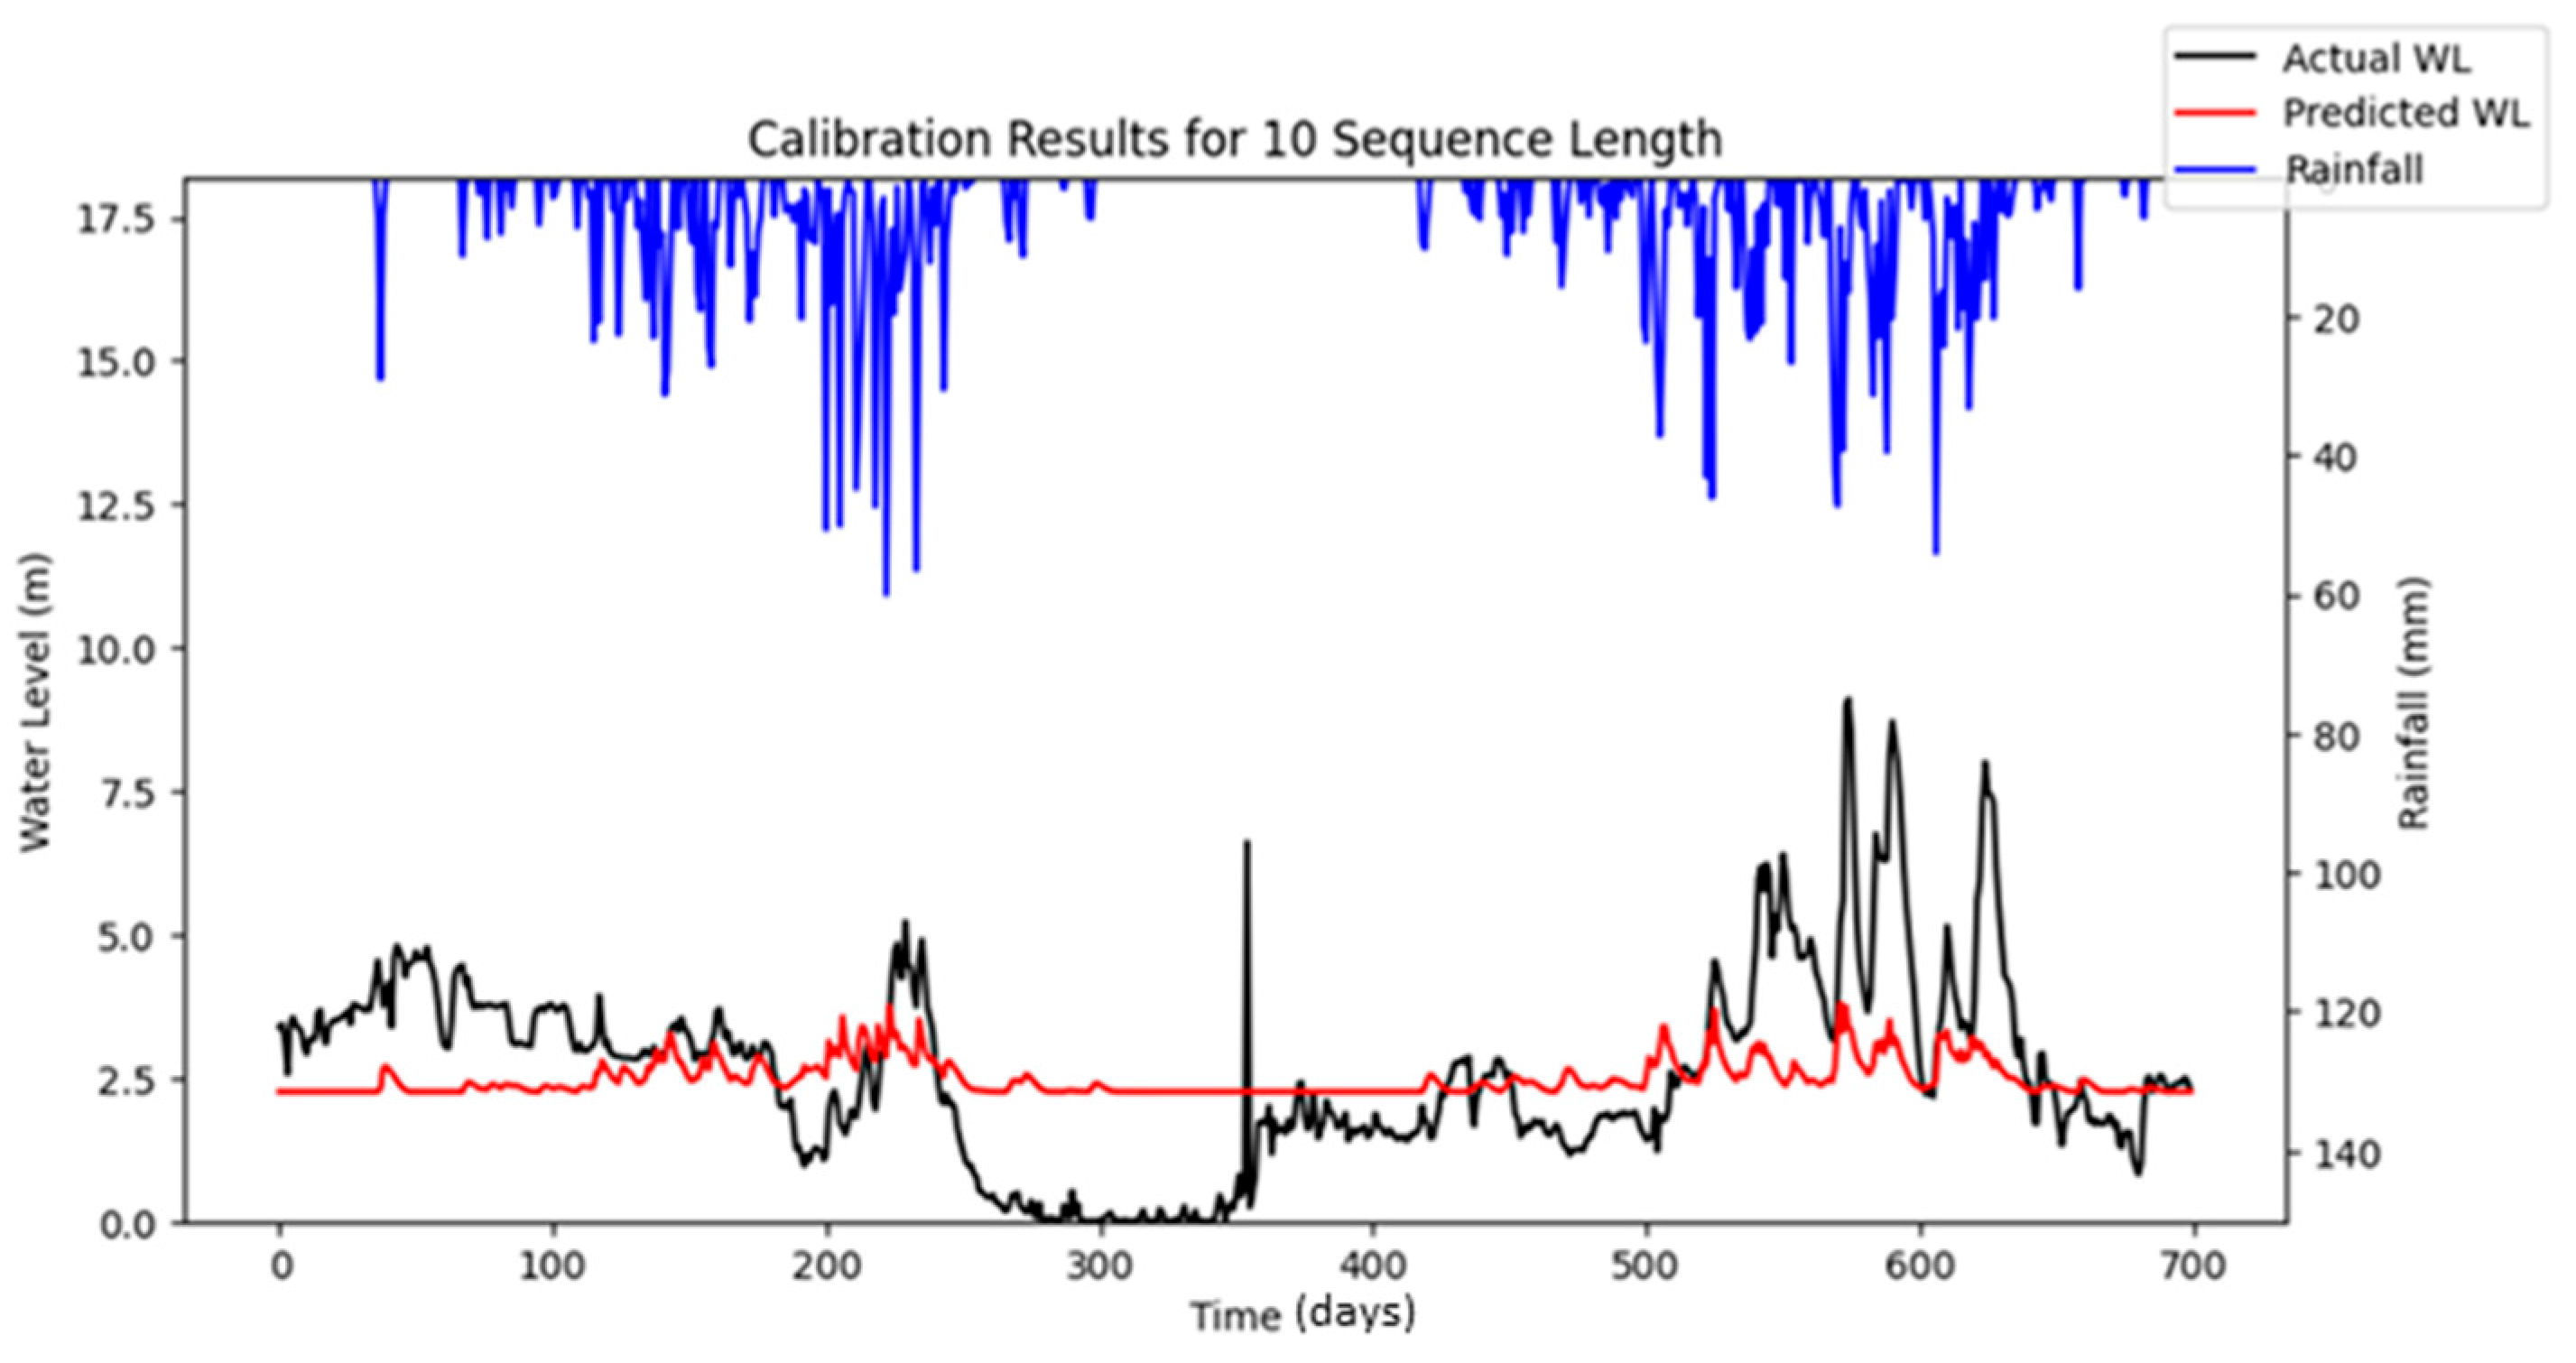
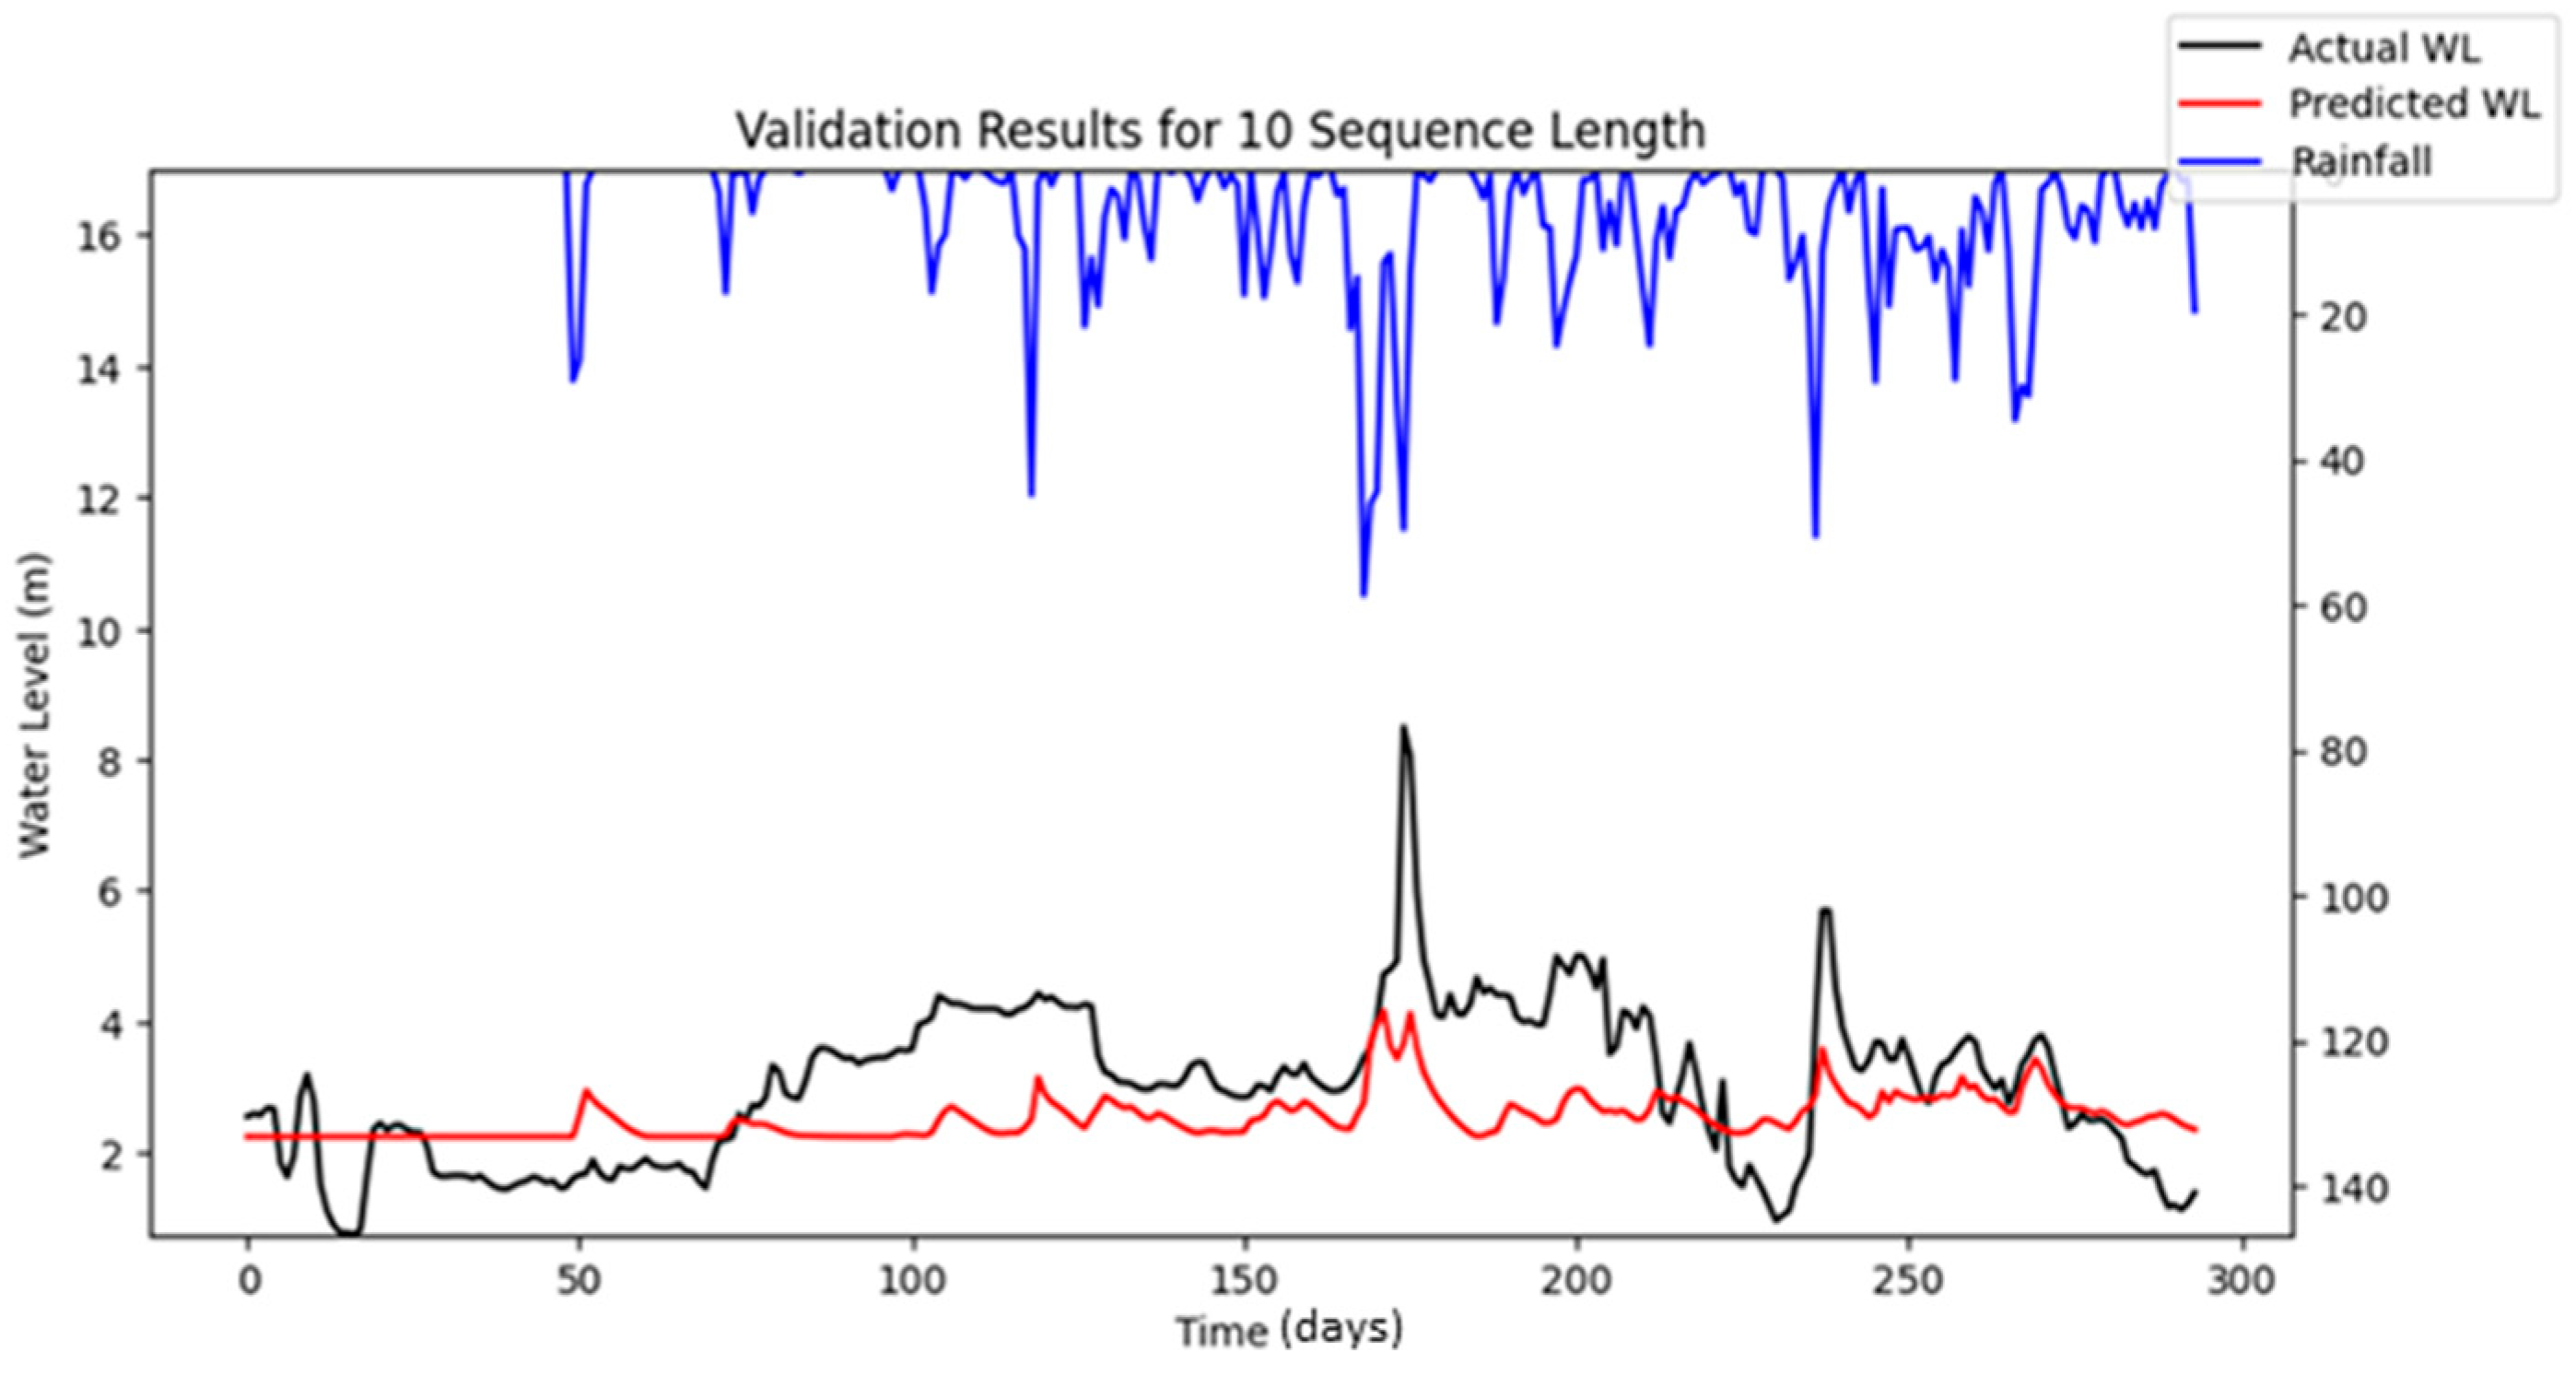
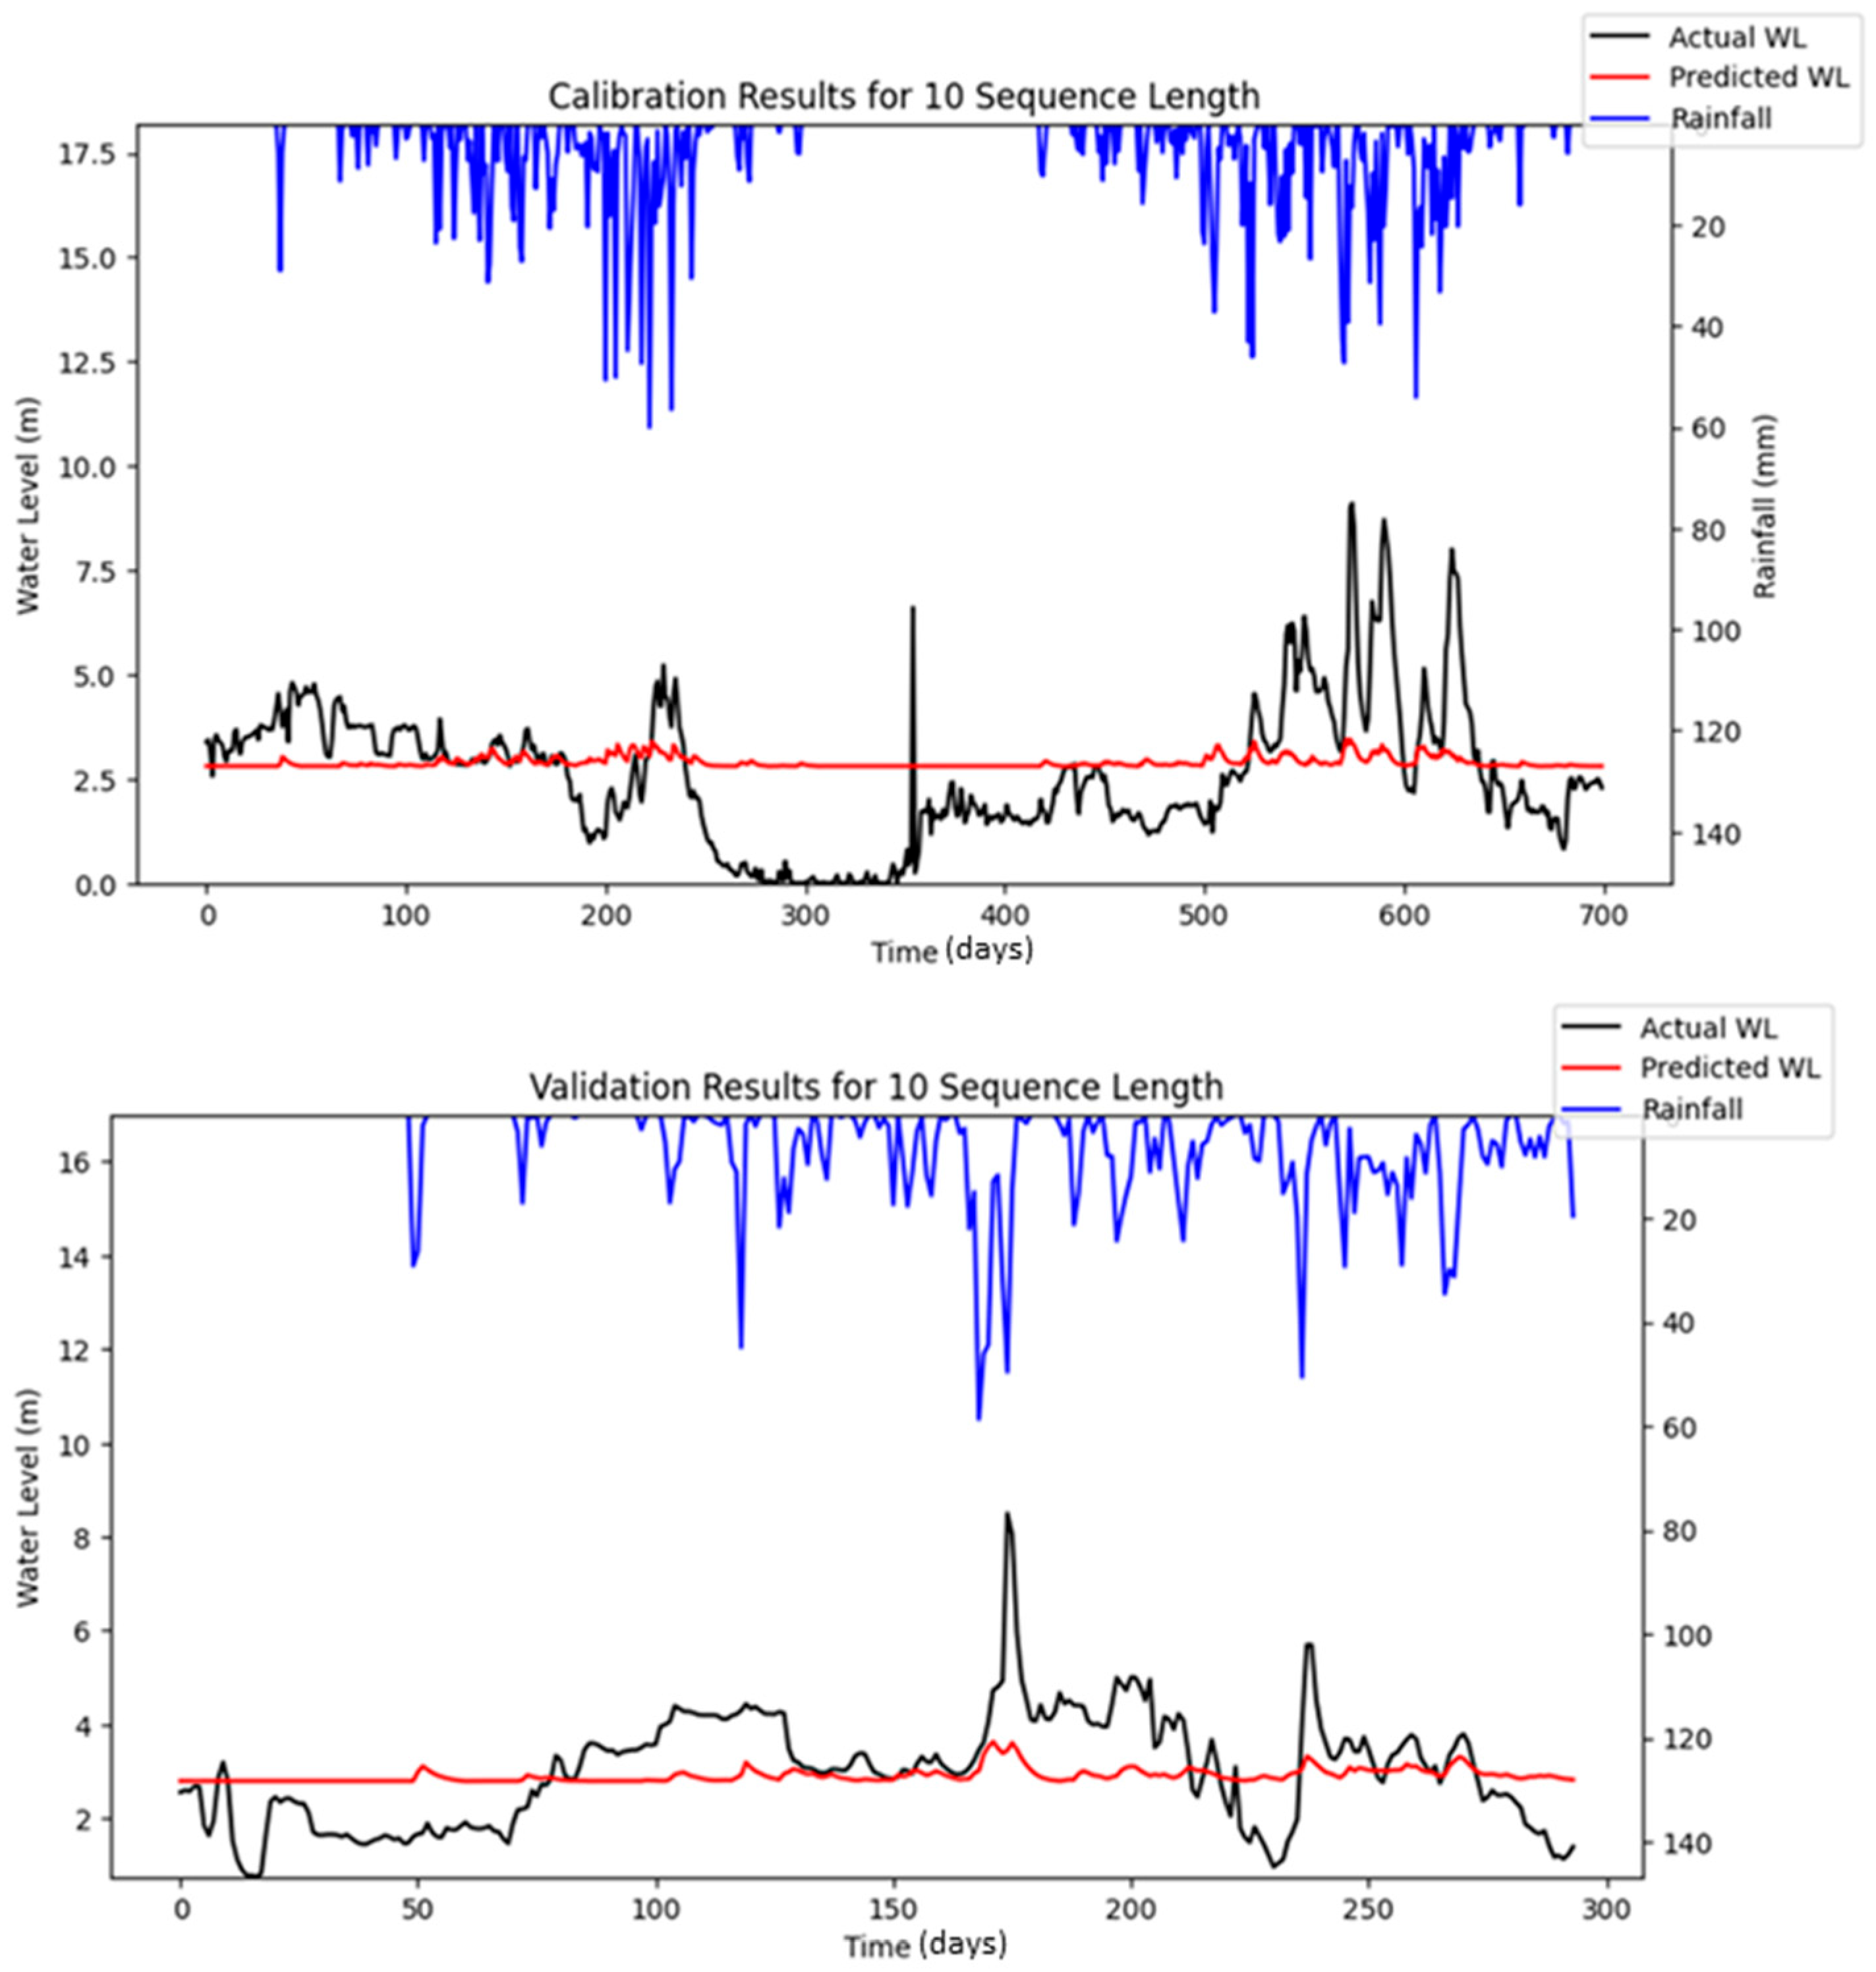
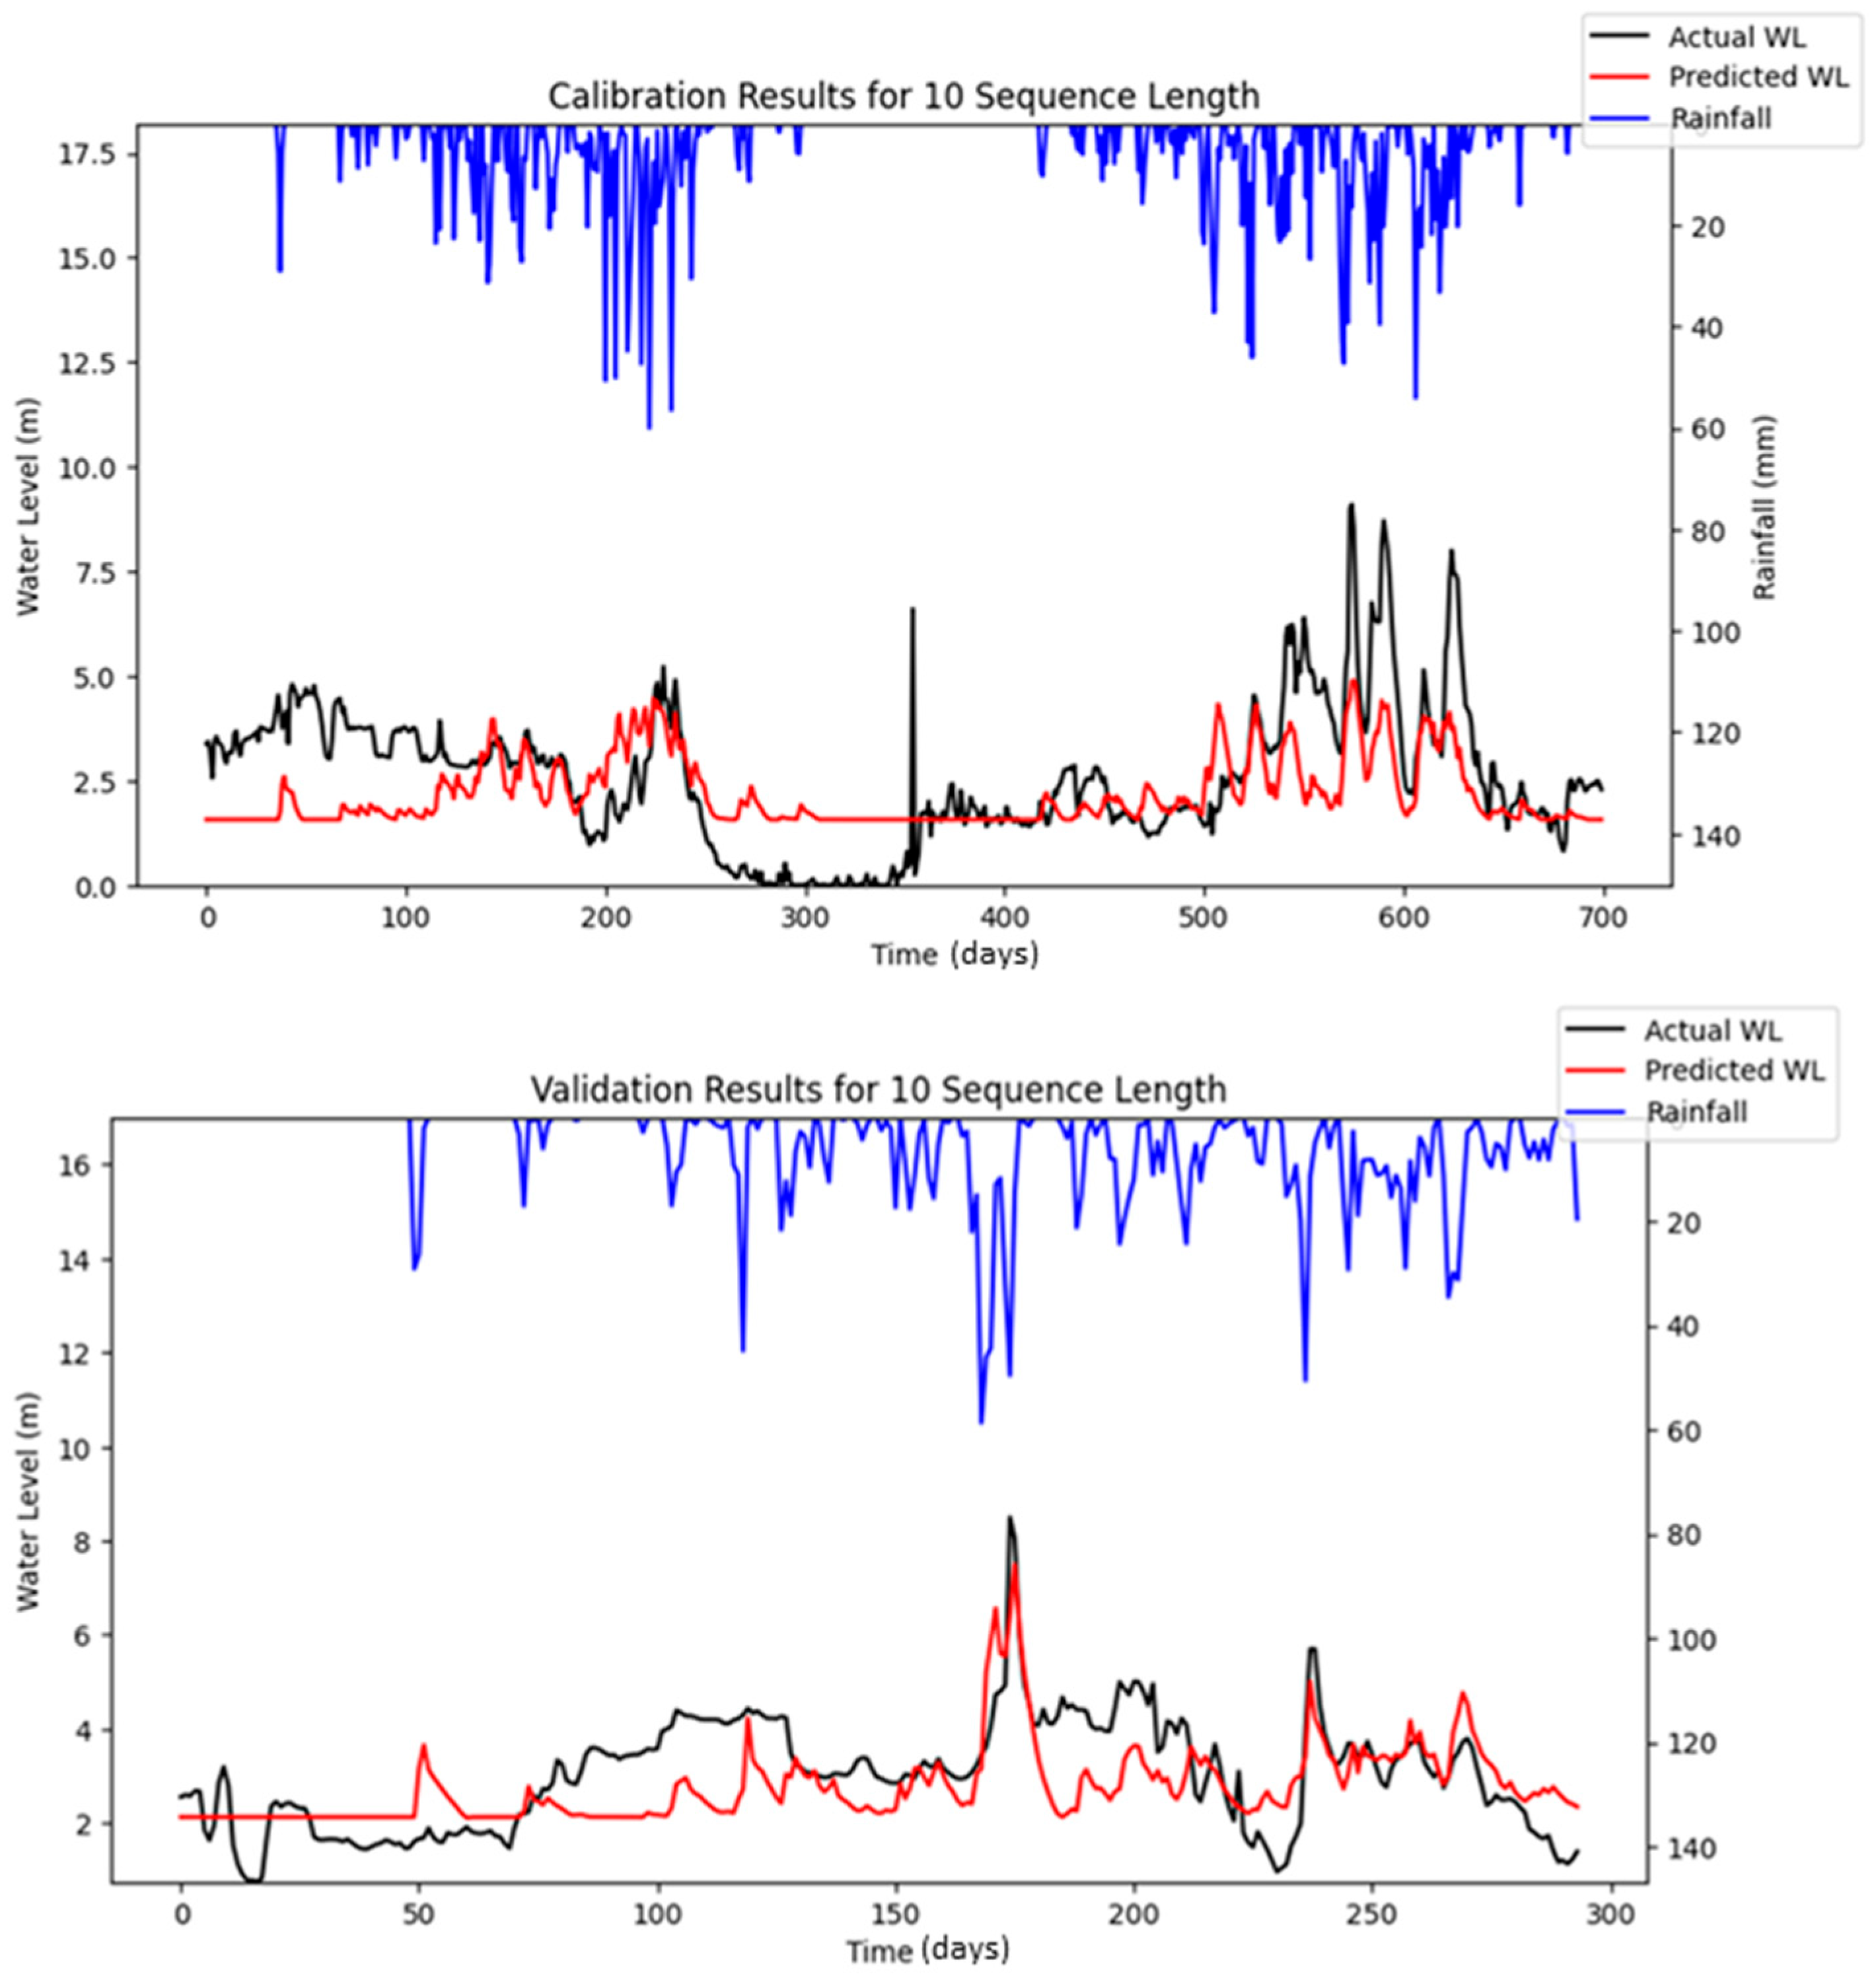
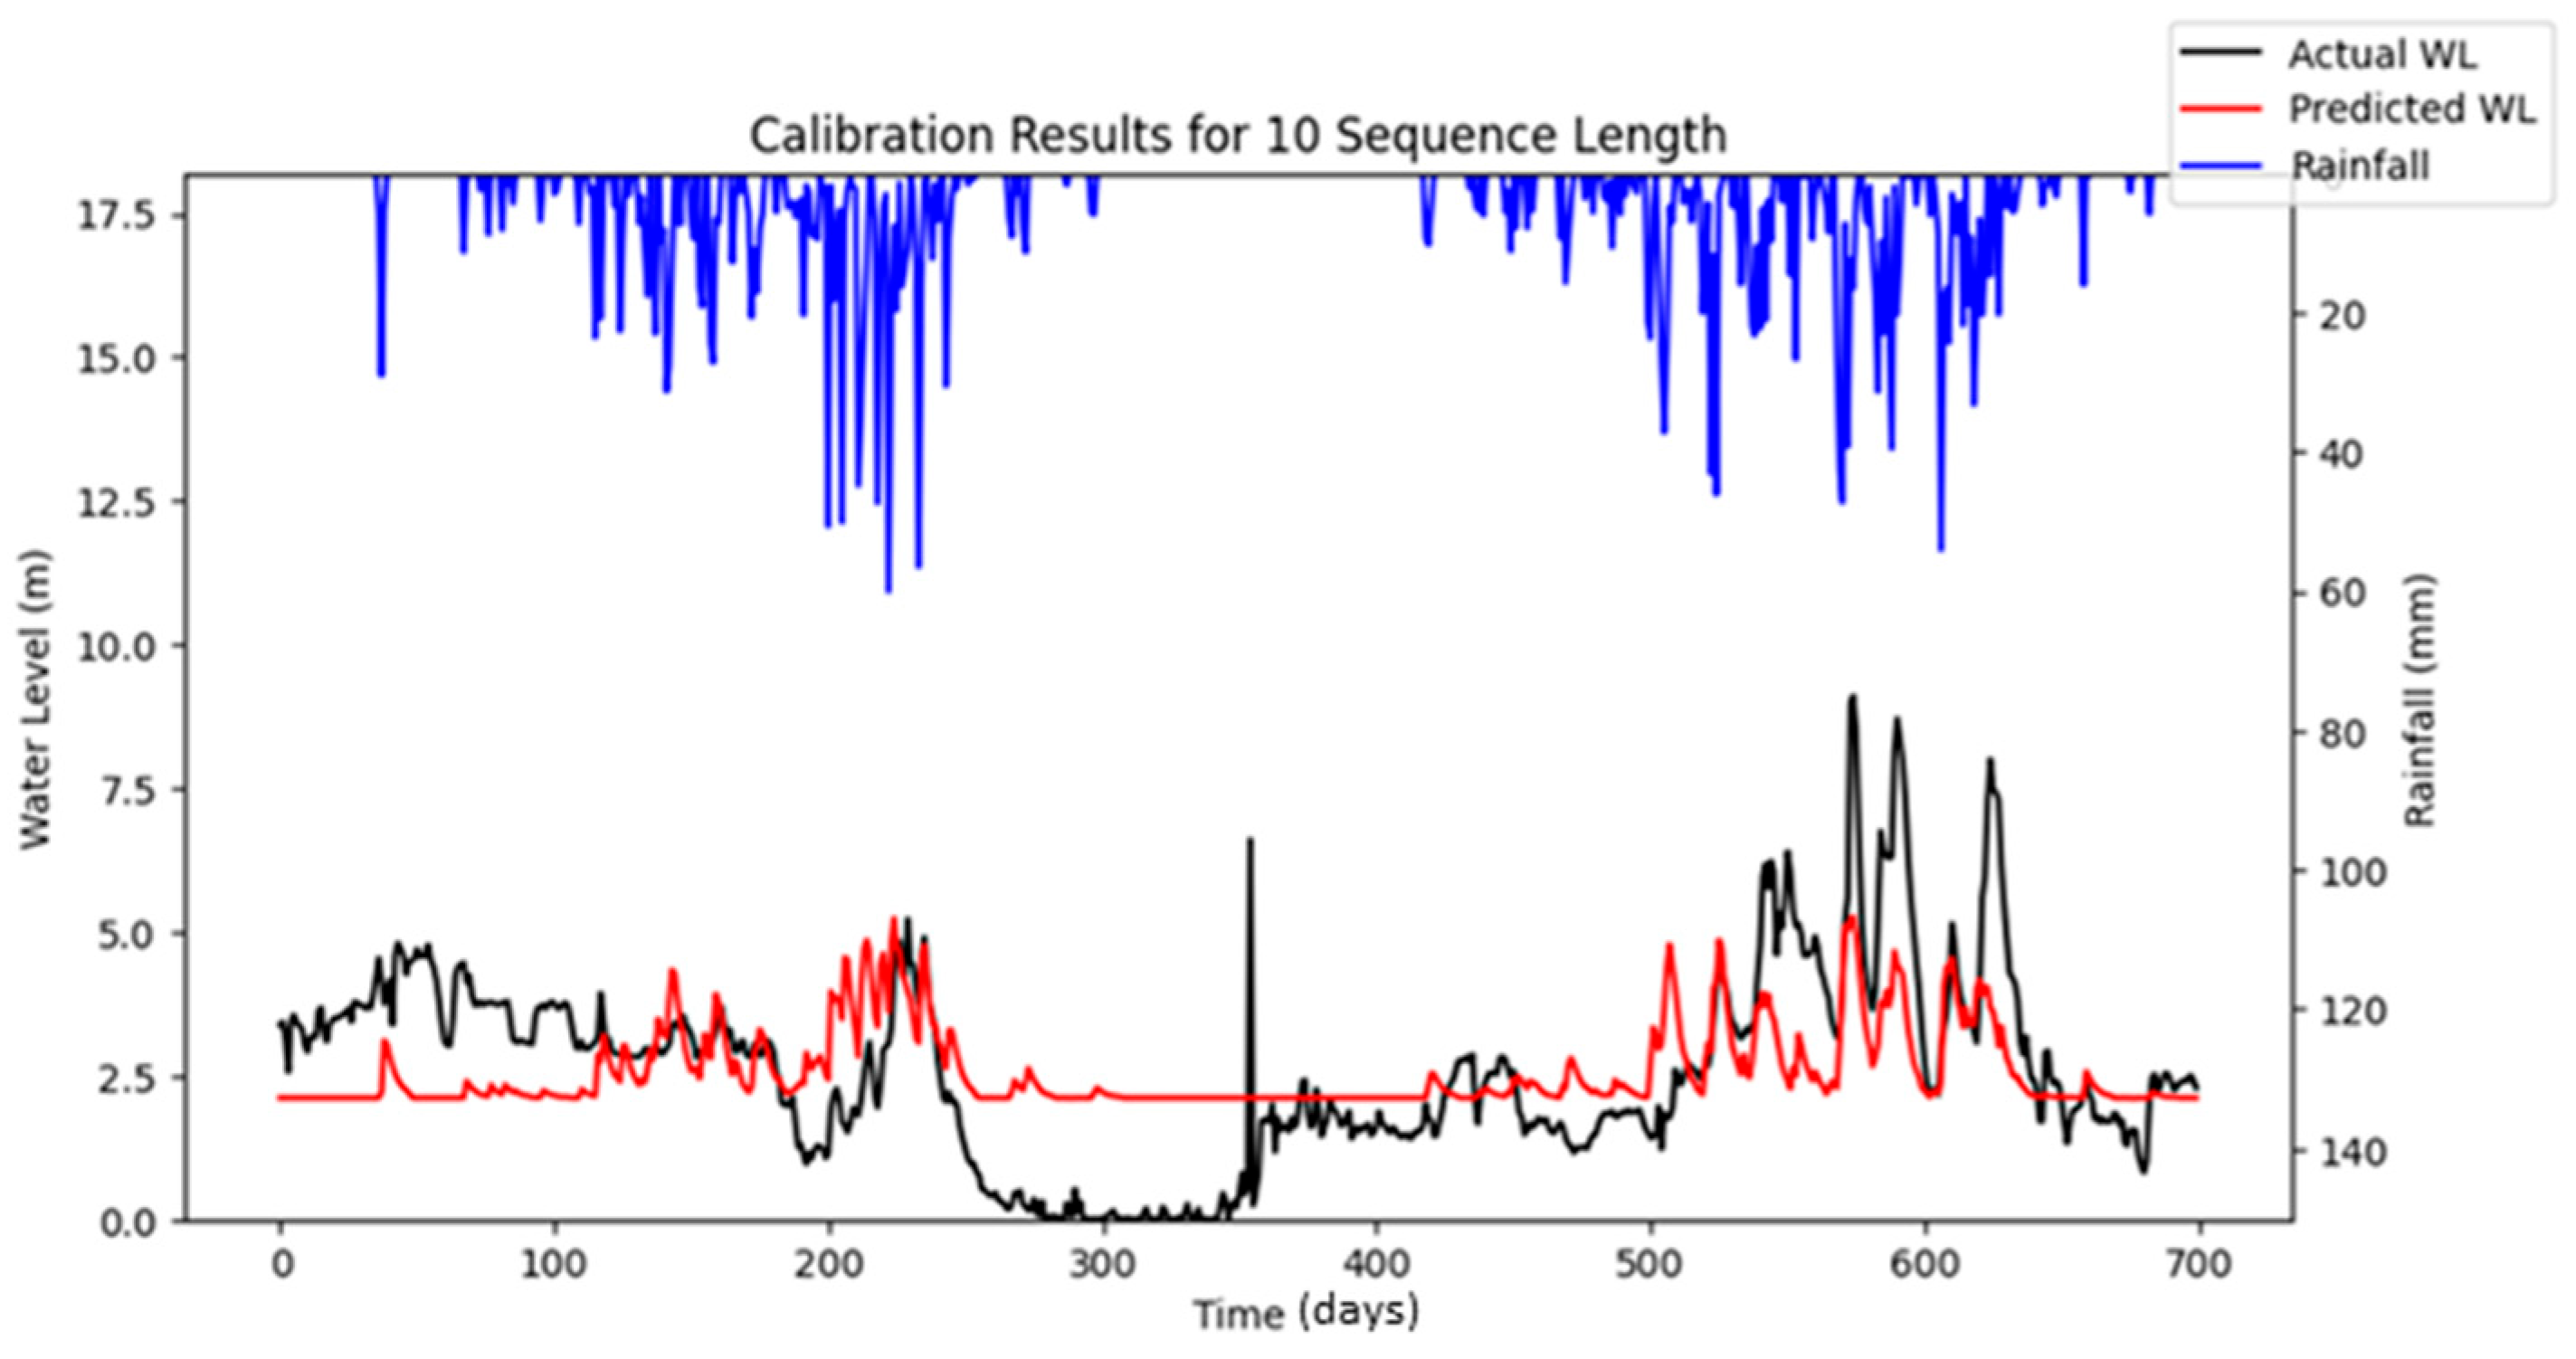
The Nash–Sutcliffe Efficiency (NSE) quantifies the degree to which model predictions correspond to observed values relative to the predictive accuracy achieved by using the mean of the observed data as a benchmark. The optimization results obtained from Bayesian Search using reproducible LSTM simulations indicate that the reproducible LSTM model performed slightly better than simply predicting the mean water level, as an average NSE of about 0.100 was obtained in the testing period during the specified iterations. The optimized models performed better in the training period than in the testing period, where an NSE as high as 0.507 was achieved during the optimization of 10 iterations. However, the results of RMSE indicated that the model’s predictions in the testing period had fewer errors than in the training period. The model’s predictions deviated from the actual water level by about 0.89 m on average (MAE = 0.089), and the typical magnitude of error was around 1.128 m (RMSE = 1.128) in the testing period. This was relatively close to the training RMSE and MAE of 1.159 and 0.916, respectively, which suggests that the model generalized similarly on both the training and test sets, but it might still indicate that the model could improve its accuracy. It is important to note that, while reproducible simulations can yield consistent results for real-world flood forecasting, they do not necessarily guarantee superior performance compared to stochastic simulation approaches.
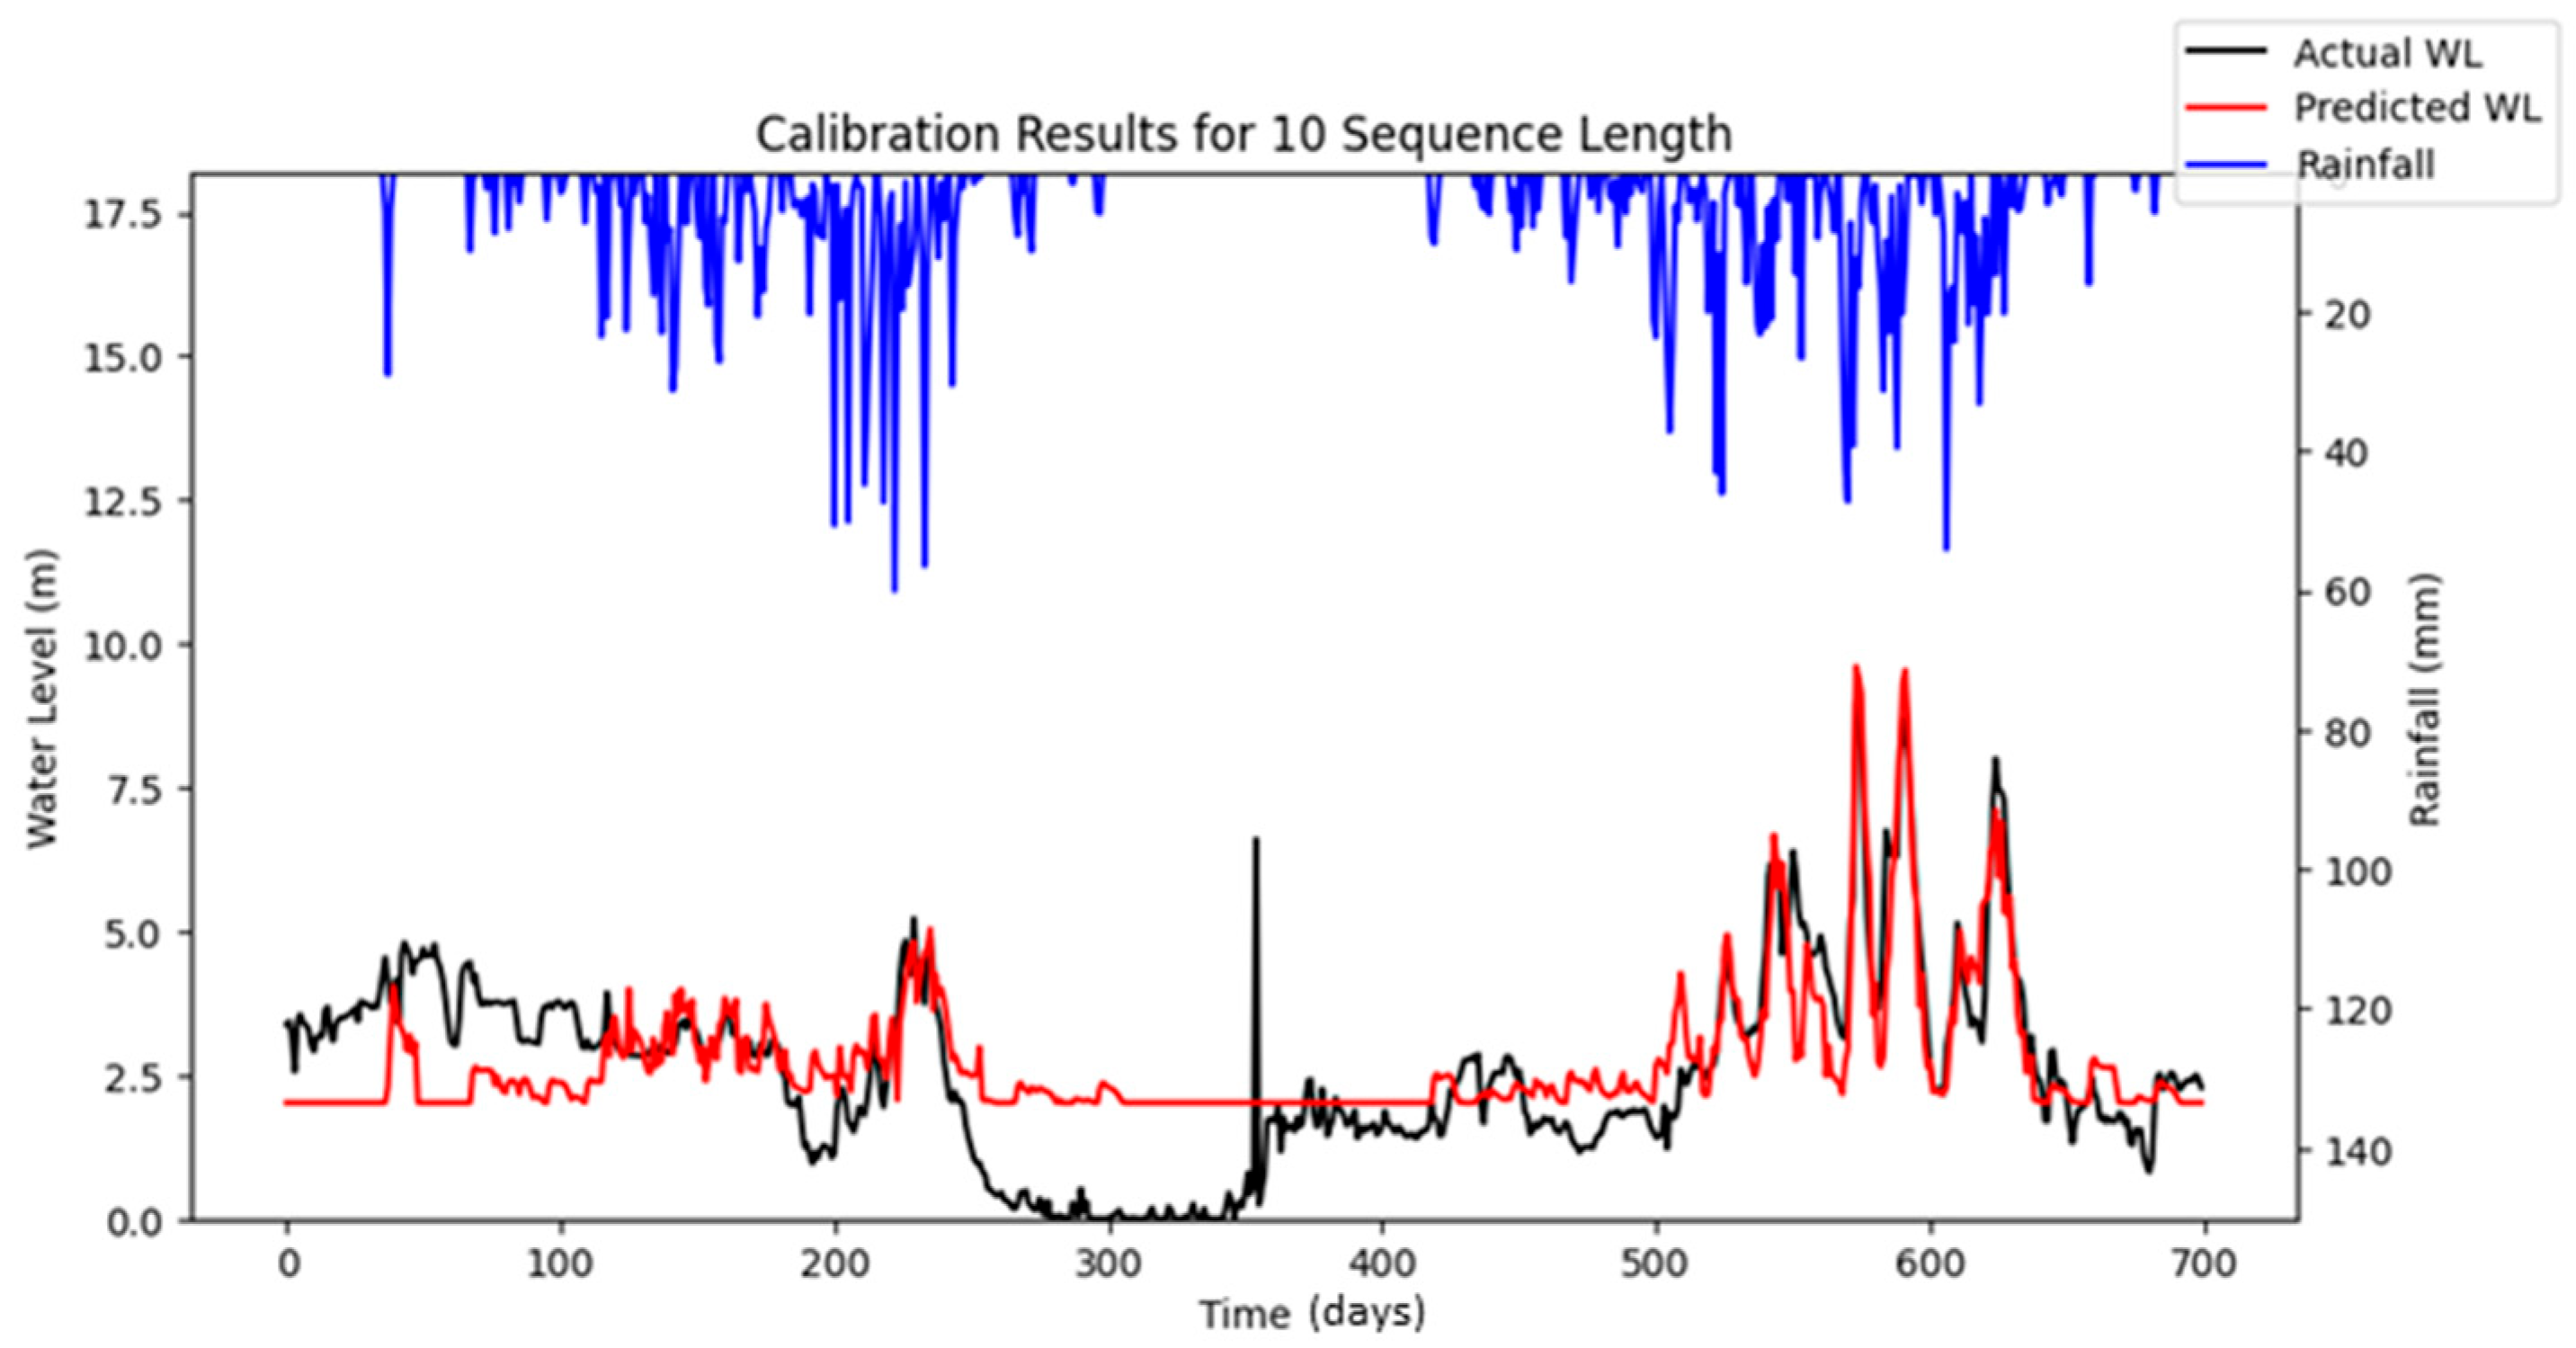
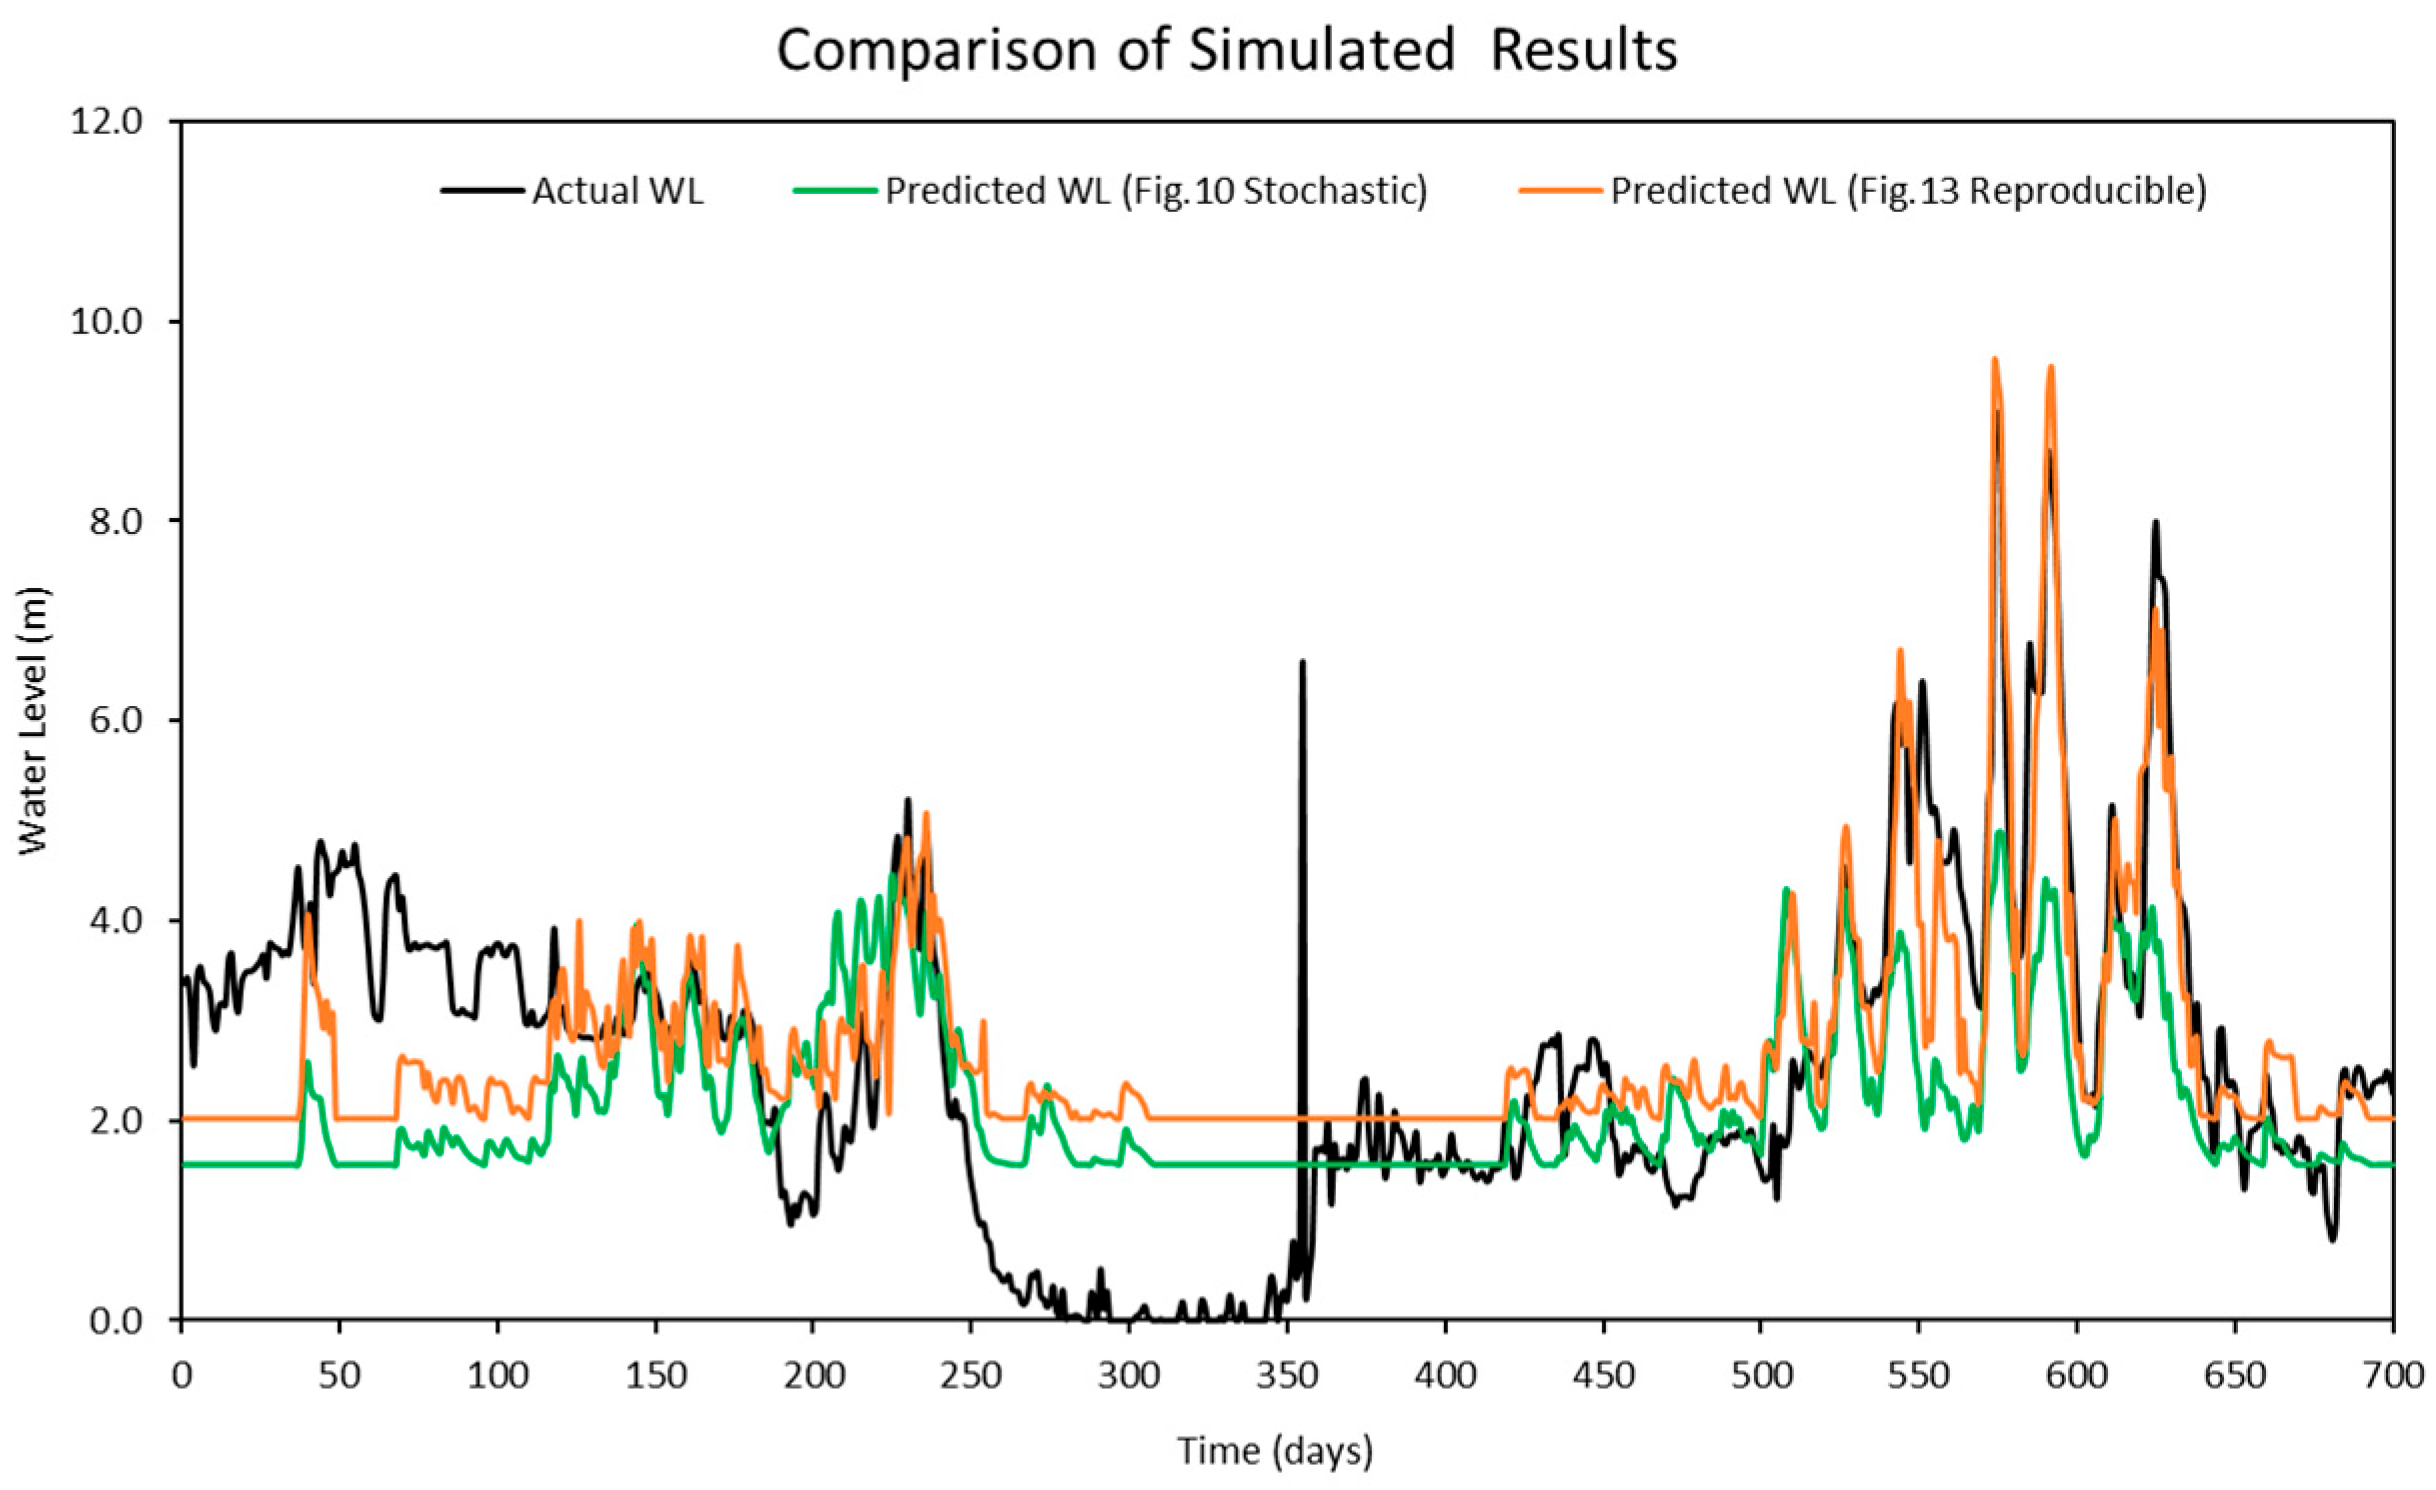
Figure 16 highlights the differences between the stochastic simulation shown in
Figure 10 and the reproducible simulation presented in
Figure 13 during the calibration period for 10 iterations. The comparison reveals that the results from the reproducible simulation (
Figure 13) demonstrated better performance than those from the stochastic simulation (
Figure 10). The improved prediction performance observed in
Figure 13 is likely due to the more suitable set of hyper-parameters being identified during the optimization process in reproducible simulation, which resulted in a better model fit compared to the predictions in
Figure 10 for the calibration.
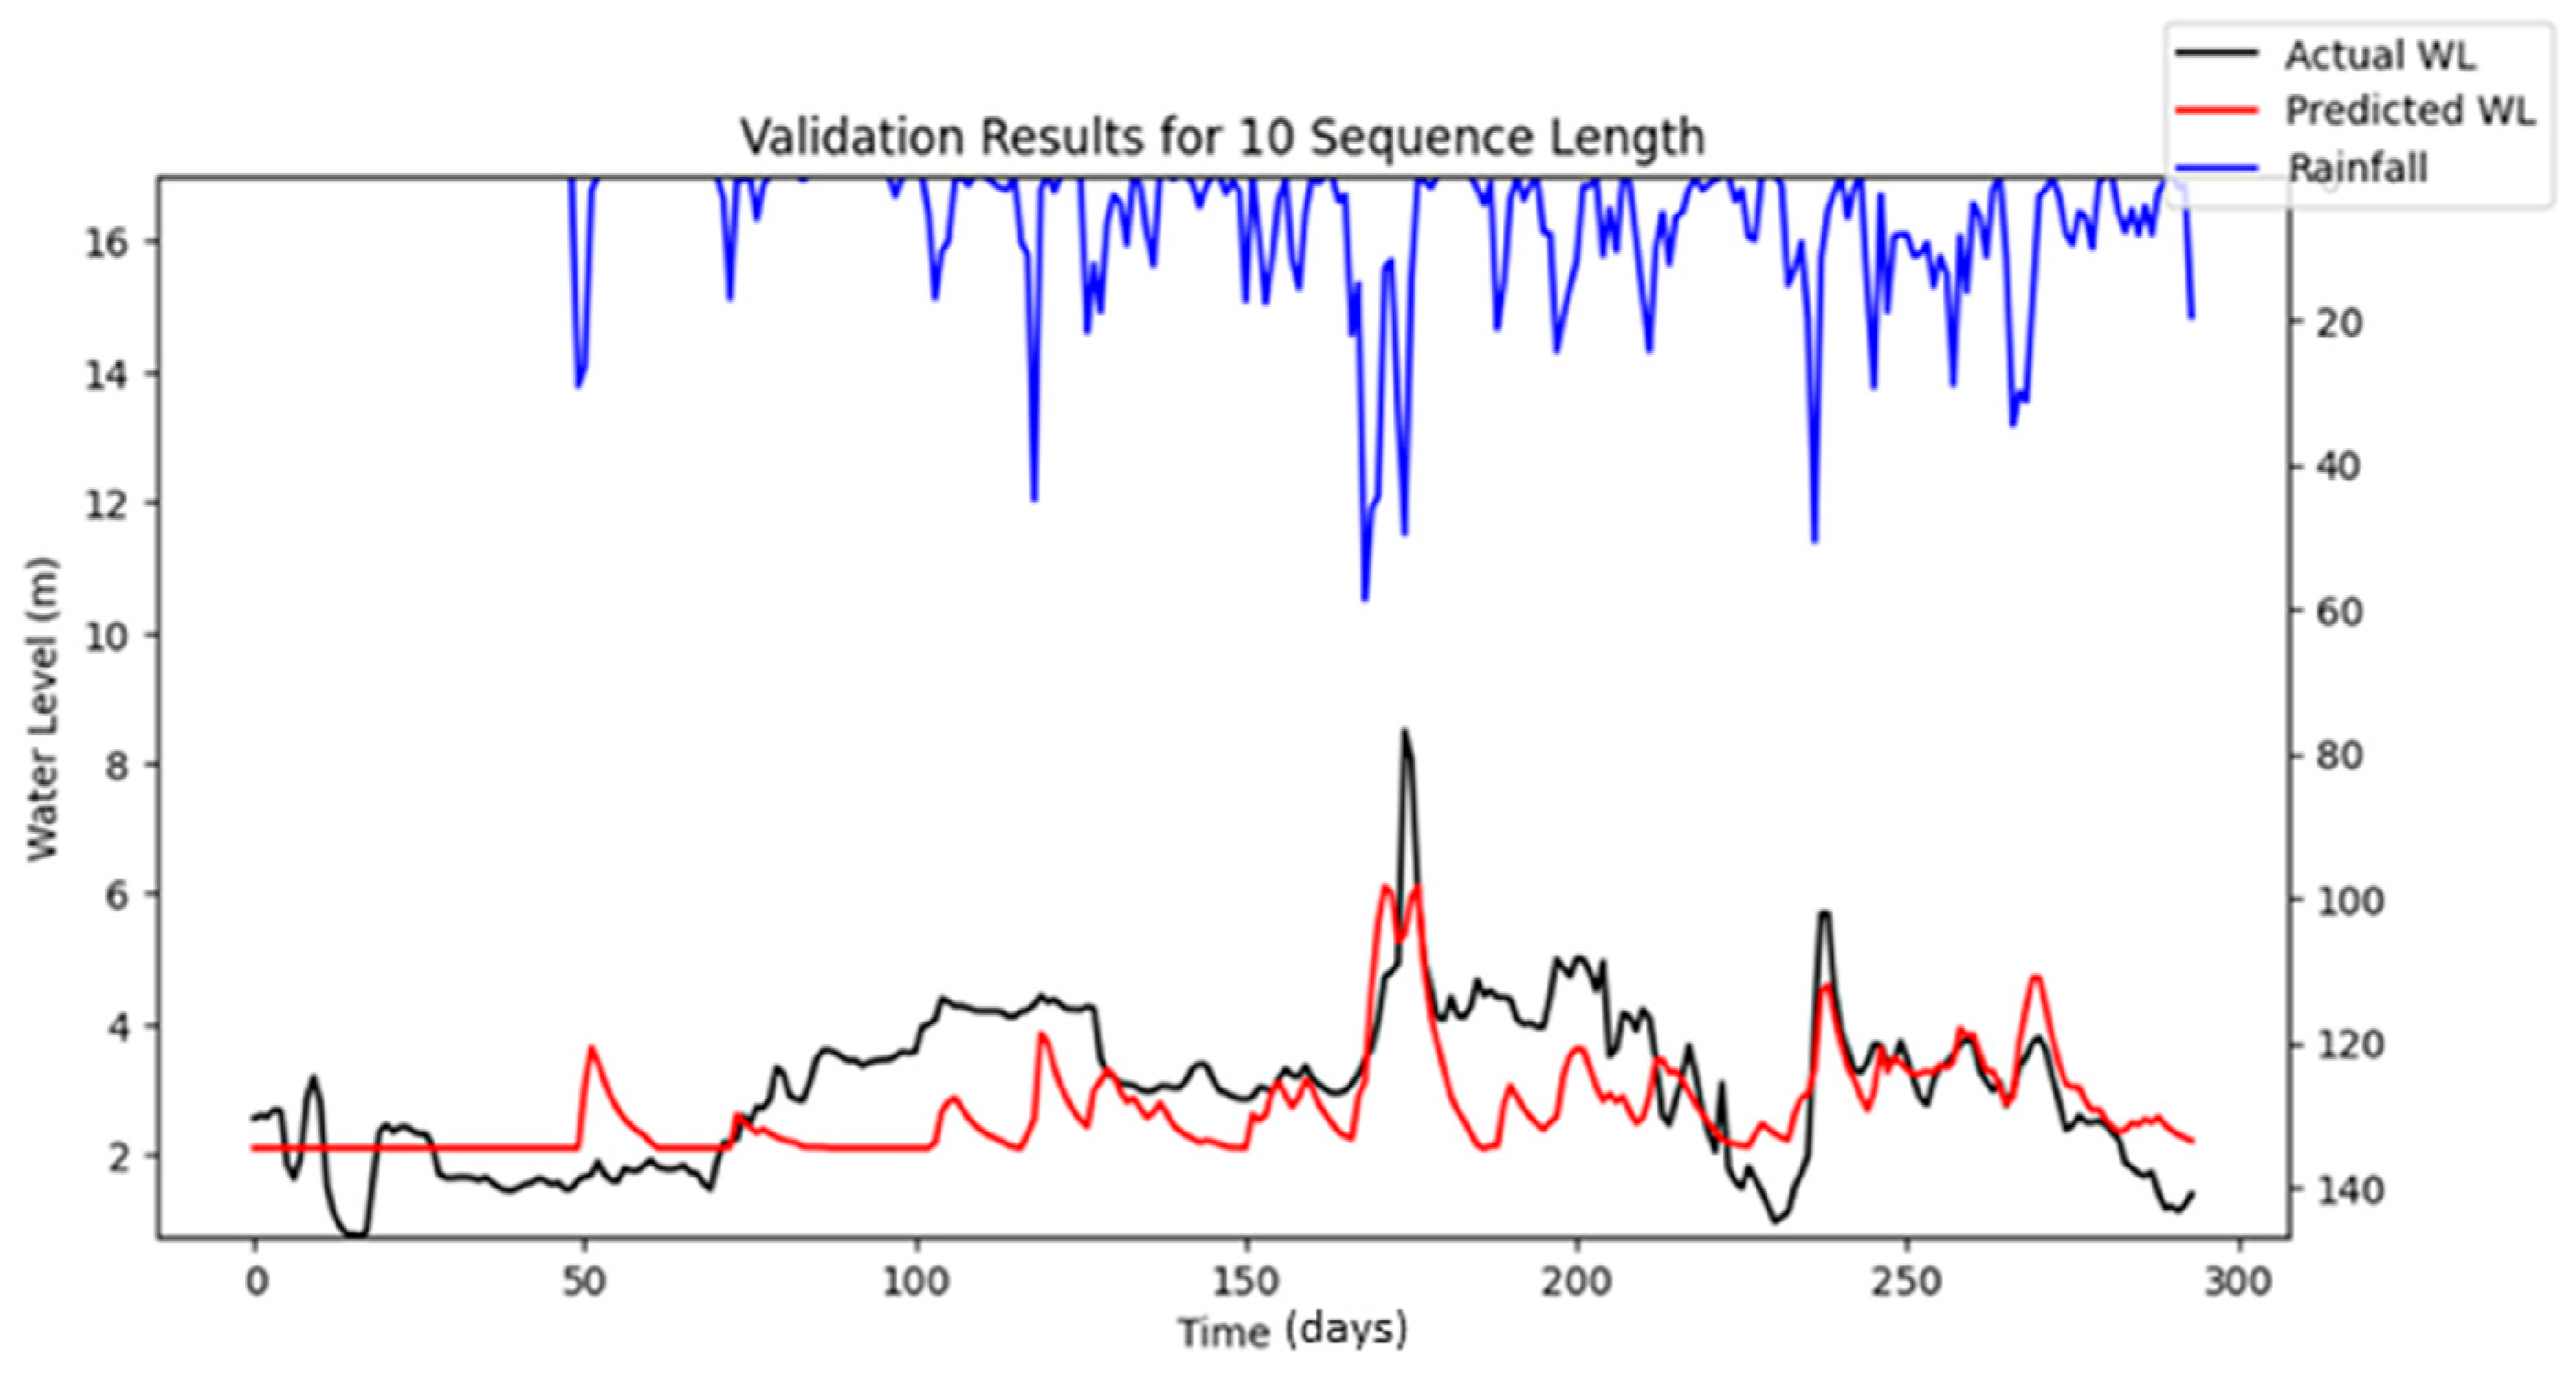
Another notable finding is that the prediction accuracy during calibration appeared to decrease over iterations, whereas no significant fluctuations were observed in the validation results. This may be attributed to differences in the data period length and the occurrence of peak events within the respective datasets. Specifically, the calibration period spanned a longer timeframe and encompassed a wider range of hydrological conditions, including more frequent or extreme peak flow events. These events are often more challenging for the model to accurately learn and predict, particularly when input features do not fully capture the factors driving such variability (e.g., dam releases or sudden rainfall bursts). In contrast, the validation period was shorter and included fewer or less intense peak events, resulting in more stable and consistent prediction performance during validation.
To improve the prediction accuracy of water levels using the LSTM model, it is necessary to increase the diversity of input features used for training. Currently, only the average daily rainfall from upstream stations was used as an input. As a result, the average daily rainfall is believed to have a direct impact only on the predicted water levels during rising limbs or peak periods. The relationship between average daily rainfall and predicted water levels during falling limbs, especially during plunges, is likely minimal. This is evident in the simulation results, where the predicted water levels closely aligned with the observed values during storm events but deviated significantly when the water levels were at their lowest.
We recognize that the issue discussed in the previous paragraph may be influenced by the presence of dams located upstream of the stations studied. The unusually low water levels recorded at the stations could be the result of restricted dam releases, which were implemented to secure additional water storage for meeting domestic and agricultural demands during drought conditions. Unfortunately, the dam release data from these upstream dams could not be obtained and were therefore not included as inputs for this study. It is believed that incorporating dam release data into the LSTM model would significantly improve the accuracy of water level predictions, particularly during periods of low water levels. We will actively seek solutions to gain access to this data and aim to address the issue in future studies as soon as possible.
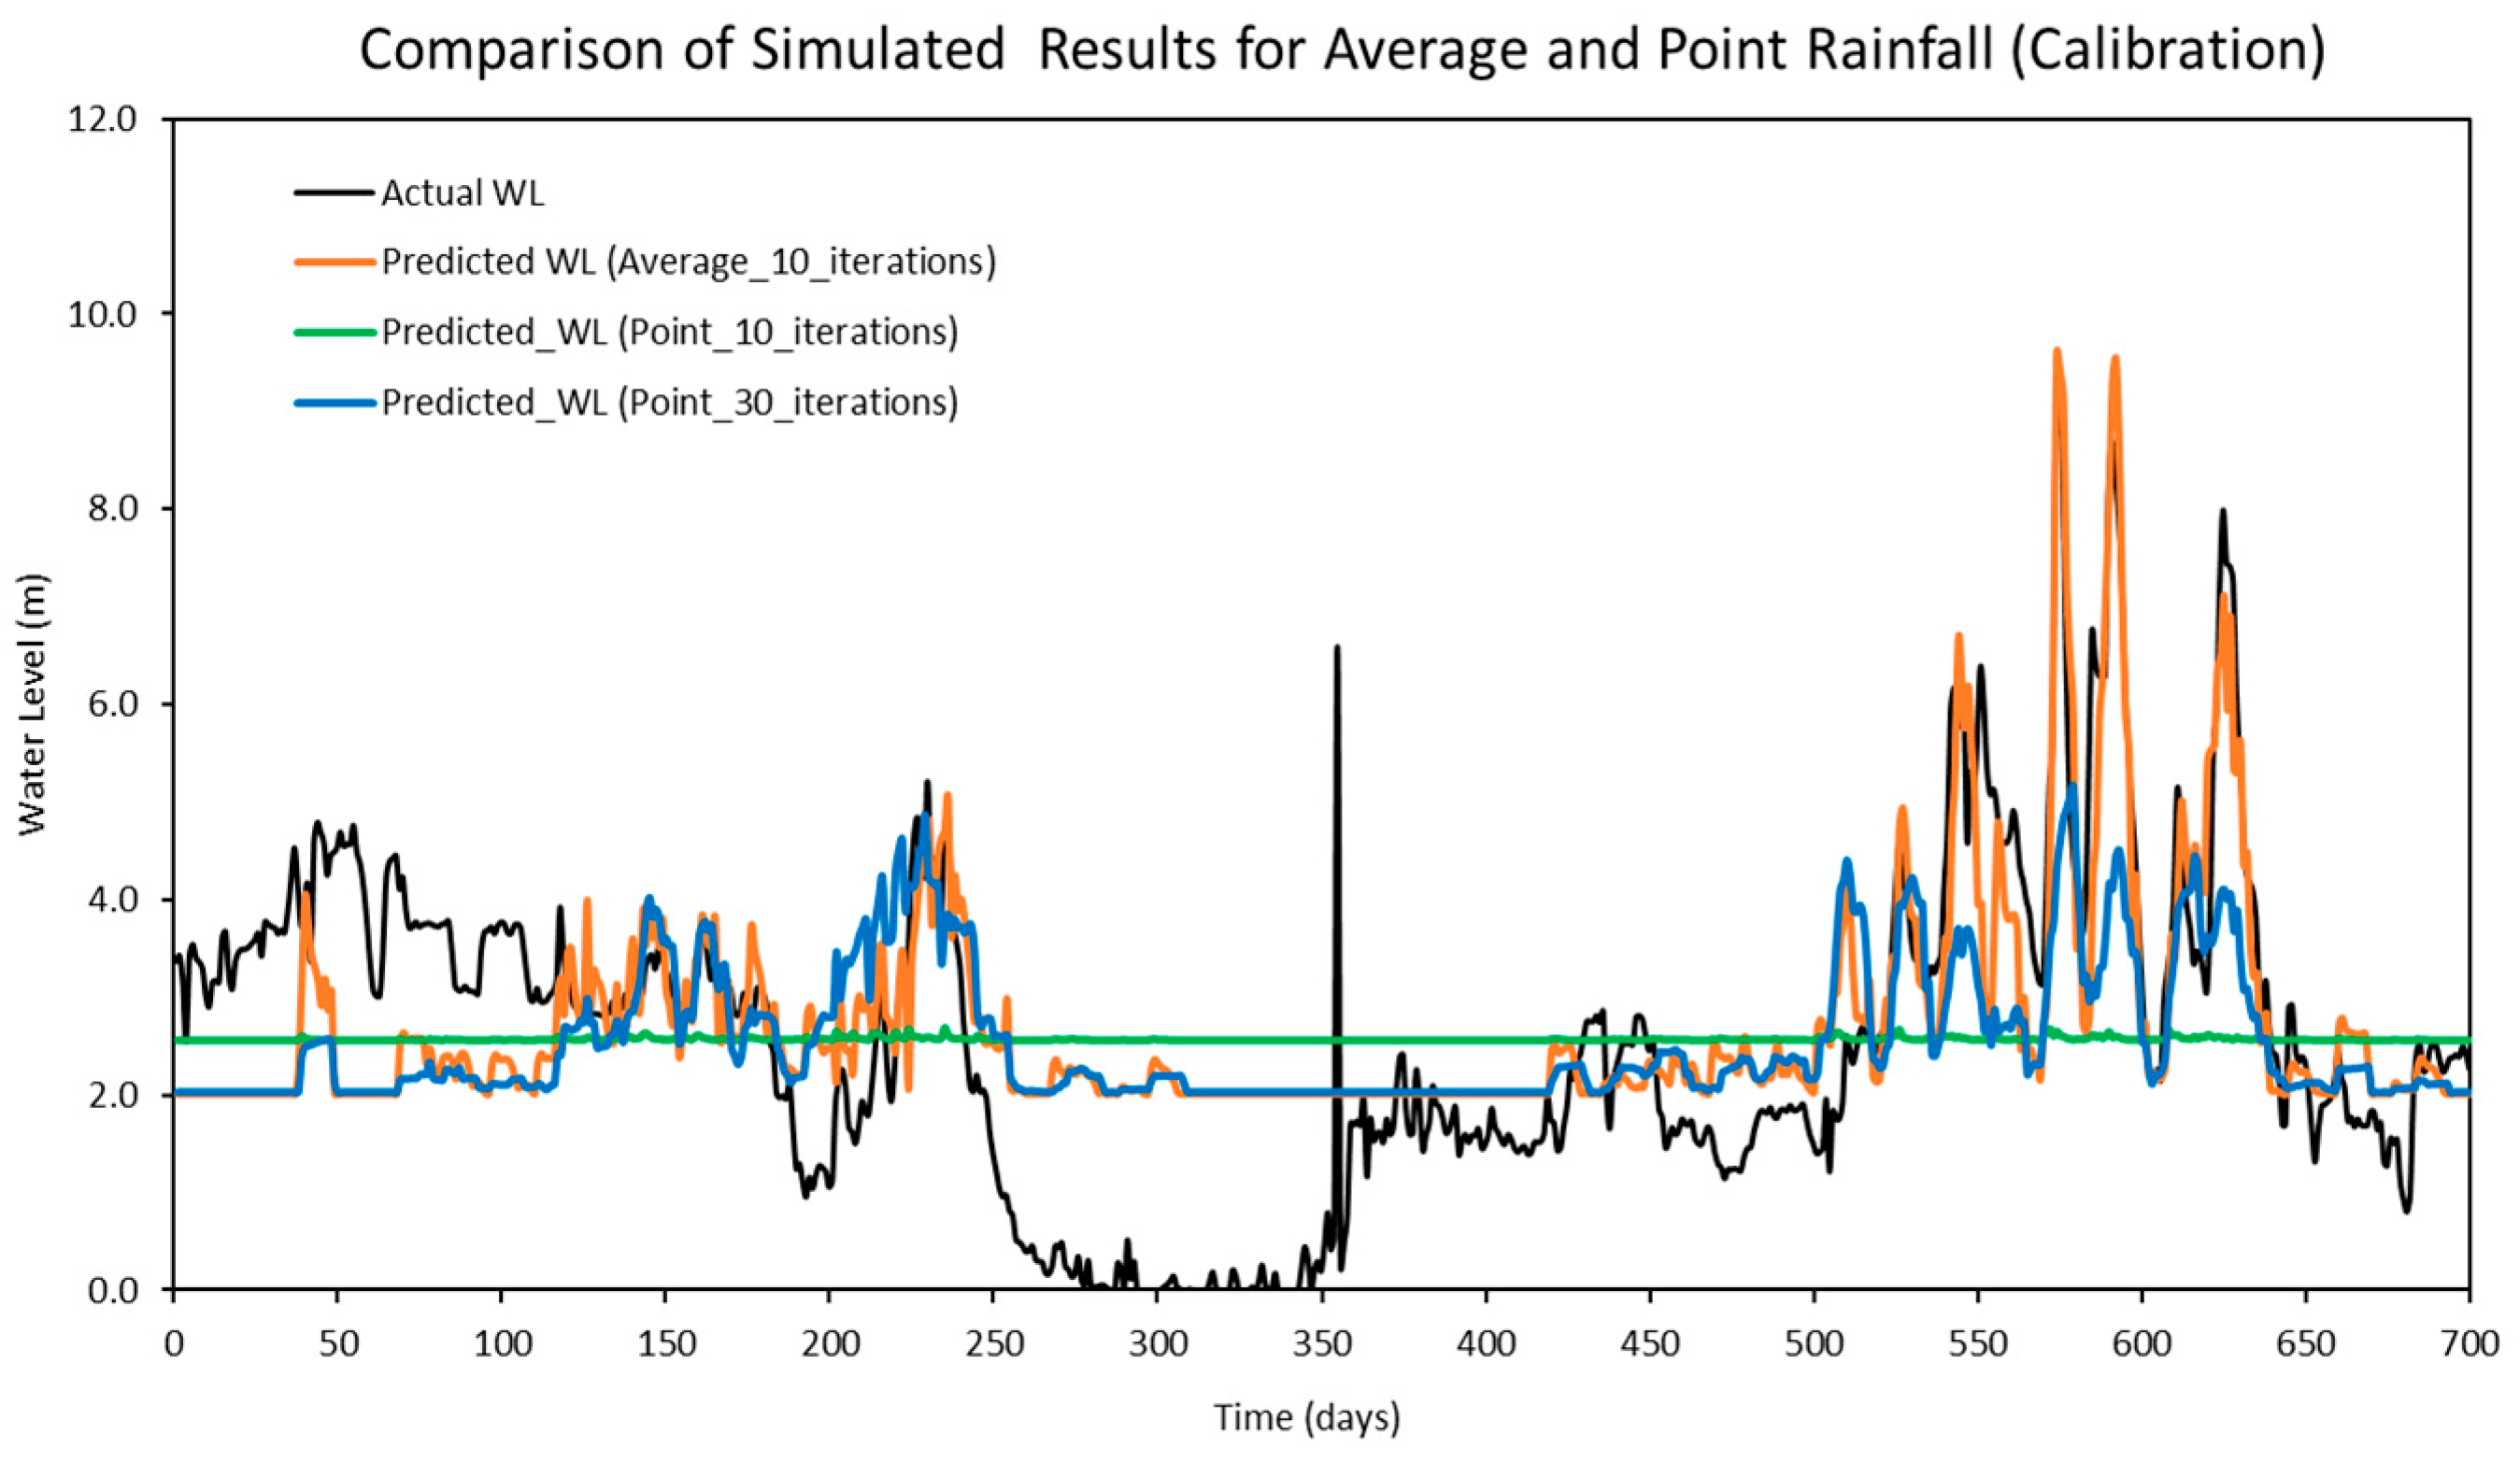
Another comparison was conducted to evaluate the model’s performance using two different input configurations in reproducible simulations: point rainfall collected from four individual stations and average rainfall.
Table 13 presents the optimized hyper-parameters derived from the point rainfall input, while the performance metrics for both configurations are summarized in
Table 14. The comparison results indicate that the LSTM model using point rainfall as an input feature required more computational time during the optimization process, as it needed a higher number of iterations to identify the optimal hyper-parameters. Specifically, the optimal configuration could not be achieved within 10 iterations, and noticeable improvements in model performance were only observed when the number of iterations was increased to 30. In contrast, the LSTM model using average rainfall as an input feature was able to reach optimal performance within just 10 iterations. Furthermore, as illustrated in
Figure 17, the predicted results based on point rainfall inputs (green and blue lines) were less effective in capturing peak water levels compared to those based on average rainfall (orange line). In particular, the predictions using point rainfall at 10 iterations (green line) exhibited inadequate responsiveness, with the predicted water levels failing to rise in alignment with the observed peaks. These findings suggest that average rainfall can be adopted as a more suitable surrogate input in real-world applications, particularly when working with large datasets or high-dimensional inputs, as it requires a shorter computational time to enhance the predictive accuracy of flood forecasting using a LSTM model.


