Article

Investigating Basin-Scale Water Dynamics During a Flood in the Upper Tenryu River Basin

Flood and River Response Monitoring Team, River Dynamics Management Group, Public Works Research Institute, 1–6 Minamihara, Tsukuba 305-8516, Ibaraki, Japan
*
Author to whom correspondence should be addressed.
Water 2025, 17(14), 2086; https://doi.org/10.3390/w17142086 (registering DOI)
Submission received: 8 June 2025 / Revised: 9 July 2025 / Accepted: 9 July 2025 / Published: 12 July 2025

Abstract

Rainfall–runoff processes and flood propagation were quantified to clarify floodwater dynamics in the upper Tenryu River basin. The basin is characterized by contrasting runoff behaviors between its left- and right-bank subbasins and large upstream river storage created by gorge topography. Radar rainfall and dam inflow data were analyzed to determine the runoff characteristics, on which the rainfall–runoff simulation was based. A higher storage capacity was observed in the left-bank subbasins, while an exceptionally large specific discharge was observed in one of the right-bank subbasins after several hours of intense rainfall. Based on these findings, the basin-scale storage was quantitatively evaluated. Water level peaks in the main channel appeared earlier at downstream locations, indicating that tributary inflows strongly affect the flood peak timing. A two-dimensional unsteady model successfully reproduced this behavior and captured the delay in the flood wave speed due to the complex morphology of the Tenryu River. The average α value, representing the ratio of flood wave speed to flow velocity, was 1.38 over the 70 km study reach. This analysis enabled quantification of river channel storage and clarified its relative relationship to basin storage, showing that river channel storage is approximately 12% of basin storage.

1. Introduction

The increasing frequency and severity of flood disasters due to climate change has revealed that effective flood risk reduction requires, in addition to the measures within the river channels, comprehensive management across the entire river basin. This integrated river basin management policy, i.e., “River Basin Disaster Resilience and Sustainability by All”, has been actively promoted [1]. The development of techniques for understanding the dynamics of water during a flood is important for advancing the policy. One such example is the evaluation of basin storage [2,3,4] and river channel storage [5,6,7], which represent approaches to quantify the capacity to mitigate floods at the basin scale. These storage functions can be quantitatively evaluated when the water dynamics are comprehensively understood, beginning with rainfall as the external force and extending through rainfall–runoff processes and flood propagation. The time derivative of basin storage during a flood can be expressed as the difference between net precipitation and runoff [8]. In addition, flood propagation and river channel storage are physically and fundamentally interconnected [9].
The observed data are essential for understanding the dynamics of water during a flood. In Japan, a nationwide network of radar–rain gauges provide near real-time rainfall distribution at a resolution of approximately 1 km. Inflow and outflow data of dams are monitored, and discharge data are obtained from float-type and noncontact-type measurements. Moreover, several “low cost, long life, localized” (3L) water level gauges [10] have been installed, particularly along Class A rivers, enabling the accumulation of extensive water level data. These rainfall, discharge, and water level datasets are important resources. However, few methods have been established for integrating these observations to achieve a comprehensive understanding of the dynamics of water during a flood at the basin scale.
Physical models serve as effective tools for integrating these valuable datasets and capturing the comprehensive dynamics of hydrological and hydraulic processes at the basin scale. Rainfall–runoff studies have typically treated river channels as one-dimensional systems, incorporating planform effects through parameters such as roughness coefficients. In contrast, studies focusing on multidimensional unsteady flow have often used inflow data that have not necessarily been validated in relation to rainfall over the basin. Recently, some studies have developed integrated models that simulate both rainfall–runoff processes and multidimensional river channel flow [11,12]. These models have been used to conduct integrated analyses of rainfall–runoff and flood flow behavior on river channel sections spanning several kilometers. However, their basin-scale applications remain limited.
Among various model-based studies, the framework proposed by Fukuoka et al. [13] is considered highly pioneering. They introduced a methodology in which observed water level data are used as a driving force, and discharge is estimated such that a multidimensional unsteady flow model successfully reproduces observed water levels. They emphasize that this approach enables the estimation of the discharge with high accuracy. Furthermore, by using the estimated discharge, they developed a “graphical representation of water storage volume distributions.” This diagram, which integrates rainfall, basin storage, river channel storage, and storage in facilities, such as dams, is a valuable tool that supports the “River Basin Disaster Resilience and Sustainability by All” concept.
This study focused on rainfall and discharge measurements as well as water level data to understand the water dynamics comprehensively. The upper Tenryu River basin, which is the target basin in this study, is characterized by a strong contrast between the runoff behaviors of the left- and right-bank subbasins, and by river sections upstream of a gorge area with a large storage capacity provided by distinctive topography.
This study is scientifically significant in that it aims to provide a basin-scale understanding of water dynamics in a catchment characterized by highly complex rainfall–runoff behavior and river channel systems. The study fully leverages observed data on rainfall, discharge, and water levels. By adopting a physical modeling approach that integrates these observations across the entire basin, it offers a novel perspective on addressing this important scientific challenge. Specifically, the following procedures were undertaken in this study.
Rainfall and dam inflow discharge observations are used to analyze rainfall–runoff relationships. Then a distributed hydrological model was employed, with its parameters calibrated using observed dam inflow data. The runoff characteristics of the 20 representative tributaries were examined, incorporating the geological structure and the detailed spatial–temporal distribution of rainfall within each tributary basin. Moreover, discharges were obtained from all the 124 tributaries flowing into the main channel.
Flood propagation in the main channel was analyzed using water level data from gauges distributed along a 70 km reach, focusing on the effect of tributary inflows. A two-dimensional unsteady flow simulation was conducted for this reach. The simulation has incorporated upstream and lateral inflows from all 124 tributaries as boundary conditions. The reproducibility of the flood propagation was evaluated by comparing the simulation results with the observations, and the effect of reducing the speed of the flood wave due to the morphological complexity of the river channel, including expansions, contractions, and meandering, was quantified. In addition, diagrams inspired by the “graphical representation of storage water volume distributions” [13] were developed to analyze the basin storage, river storage, and the relative relations among them during a flood event.

2. Target Basin and Flood Event

The study focused on the upper Tenryu River basin (basin area ≈ 1930 km2, Figure 1). The target reach of the main channel of this study extends approximately 70 km from Inatomi (Point (A) in Figure 1b) upstream to Tenryu-kyo (Point (E)) downstream and receives inflows from numerous tributaries. In this study, bathymetry data obtained from an Airborne Lidar Bathymetry (ALB) survey were employed in a two-dimensional unsteady flow simulation. Since these data cover an area up to slightly upstream of Inatomi (Point (A)), the upstream boundary of the study domain was defined at Inatomi (Point (A)). The entire basin boundary, including areas outside of the target basin, is presented in Figure 1. This is intended to highlight the important role of tributary catchments in terms of their contribution to the total catchment area, thereby supporting the discussion on the significance of inflow from tributaries.
Figure 1a shows the catchment area of 20 tributaries (catchment areas ≥ 20 km2). Figure 1b shows the dam catchments in four of these tributaries.
The study area is characterized by the following two features in terms of rainfall–runoff and river flow behavior:
(1) The tributary basins on the right and left banks originate from the Central and Southern Japan Alps, respectively, resulting in distinct geological formations on each side. Iwashita et al. [14] investigated the rainfall–runoff characteristics in the headwaters of three tributaries within the study area and reported several insights. At the Koshibu River site (0.038 km2, Mesozoic and Paleozoic Strata) on the left bank, runoff does not occur in response to every rainfall event; instead, the runoff volume strongly depends on the cumulative rainfall. In contrast, at the Yotagiri River site (0.071 km2, granite) and the Oguro River site (0.059 km2, metamorphic rocks) on the right bank, runoff occurs in response to nearly every rainfall event. These findings suggest that the Koshibu River basin exhibits a higher capacity to moderate individual rainfall hydrographs than the Yotagiri and Oguro River basins. The locations of the three sites examined by Iwashita et al. are highlighted in Figure 1b. Figure 1c shows the geological classification of the study area based on Digital National Land Information. Consolidated and partially consolidated sediments, corresponding to the Koshibu River site, are largely distributed along the left bank but only marginally distributed on the right bank. In contrast, the right bank features widespread igneous, metamorphic, and mylonitic rocks, including those found in the Yotagiri and Oguro River basins.
(2) The main channel has a steep average longitudinal slope of approximately 1/200. The channel alternates between narrow gorges and floodplains, creating a characteristic morphology in which the upstream areas of the constricted sections serve as temporary water storage areas. This flood mitigation function has been formally recognized in the Tenryu River improvement plan.
The target flood event occurred on 1 July 2020. At the Koshibu Dam, the inflow during this event was the second largest recorded inflow since the beginning of the dam’s operation 51 years ago. Figure 2 shows the spatial distribution of the cumulative rainfall obtained from radar observations over the analysis period in this study (from 6:00 on 30 June to 12:00 on 3 July). The rainfall distribution is characterized by intense precipitation concentrated on the downstream part of the target area. As discussed later, this flood event was dominated by inflows from tributaries into the main channel, rather than by inflow from the upstream areas of the main channel.

3. Materials and Methods

This section describes the observed data and the simulation models used in this study.

3.1. Observed Data

Table 1 shows the summary of the dataset used in this study.

3.1.1. Rainfall Data

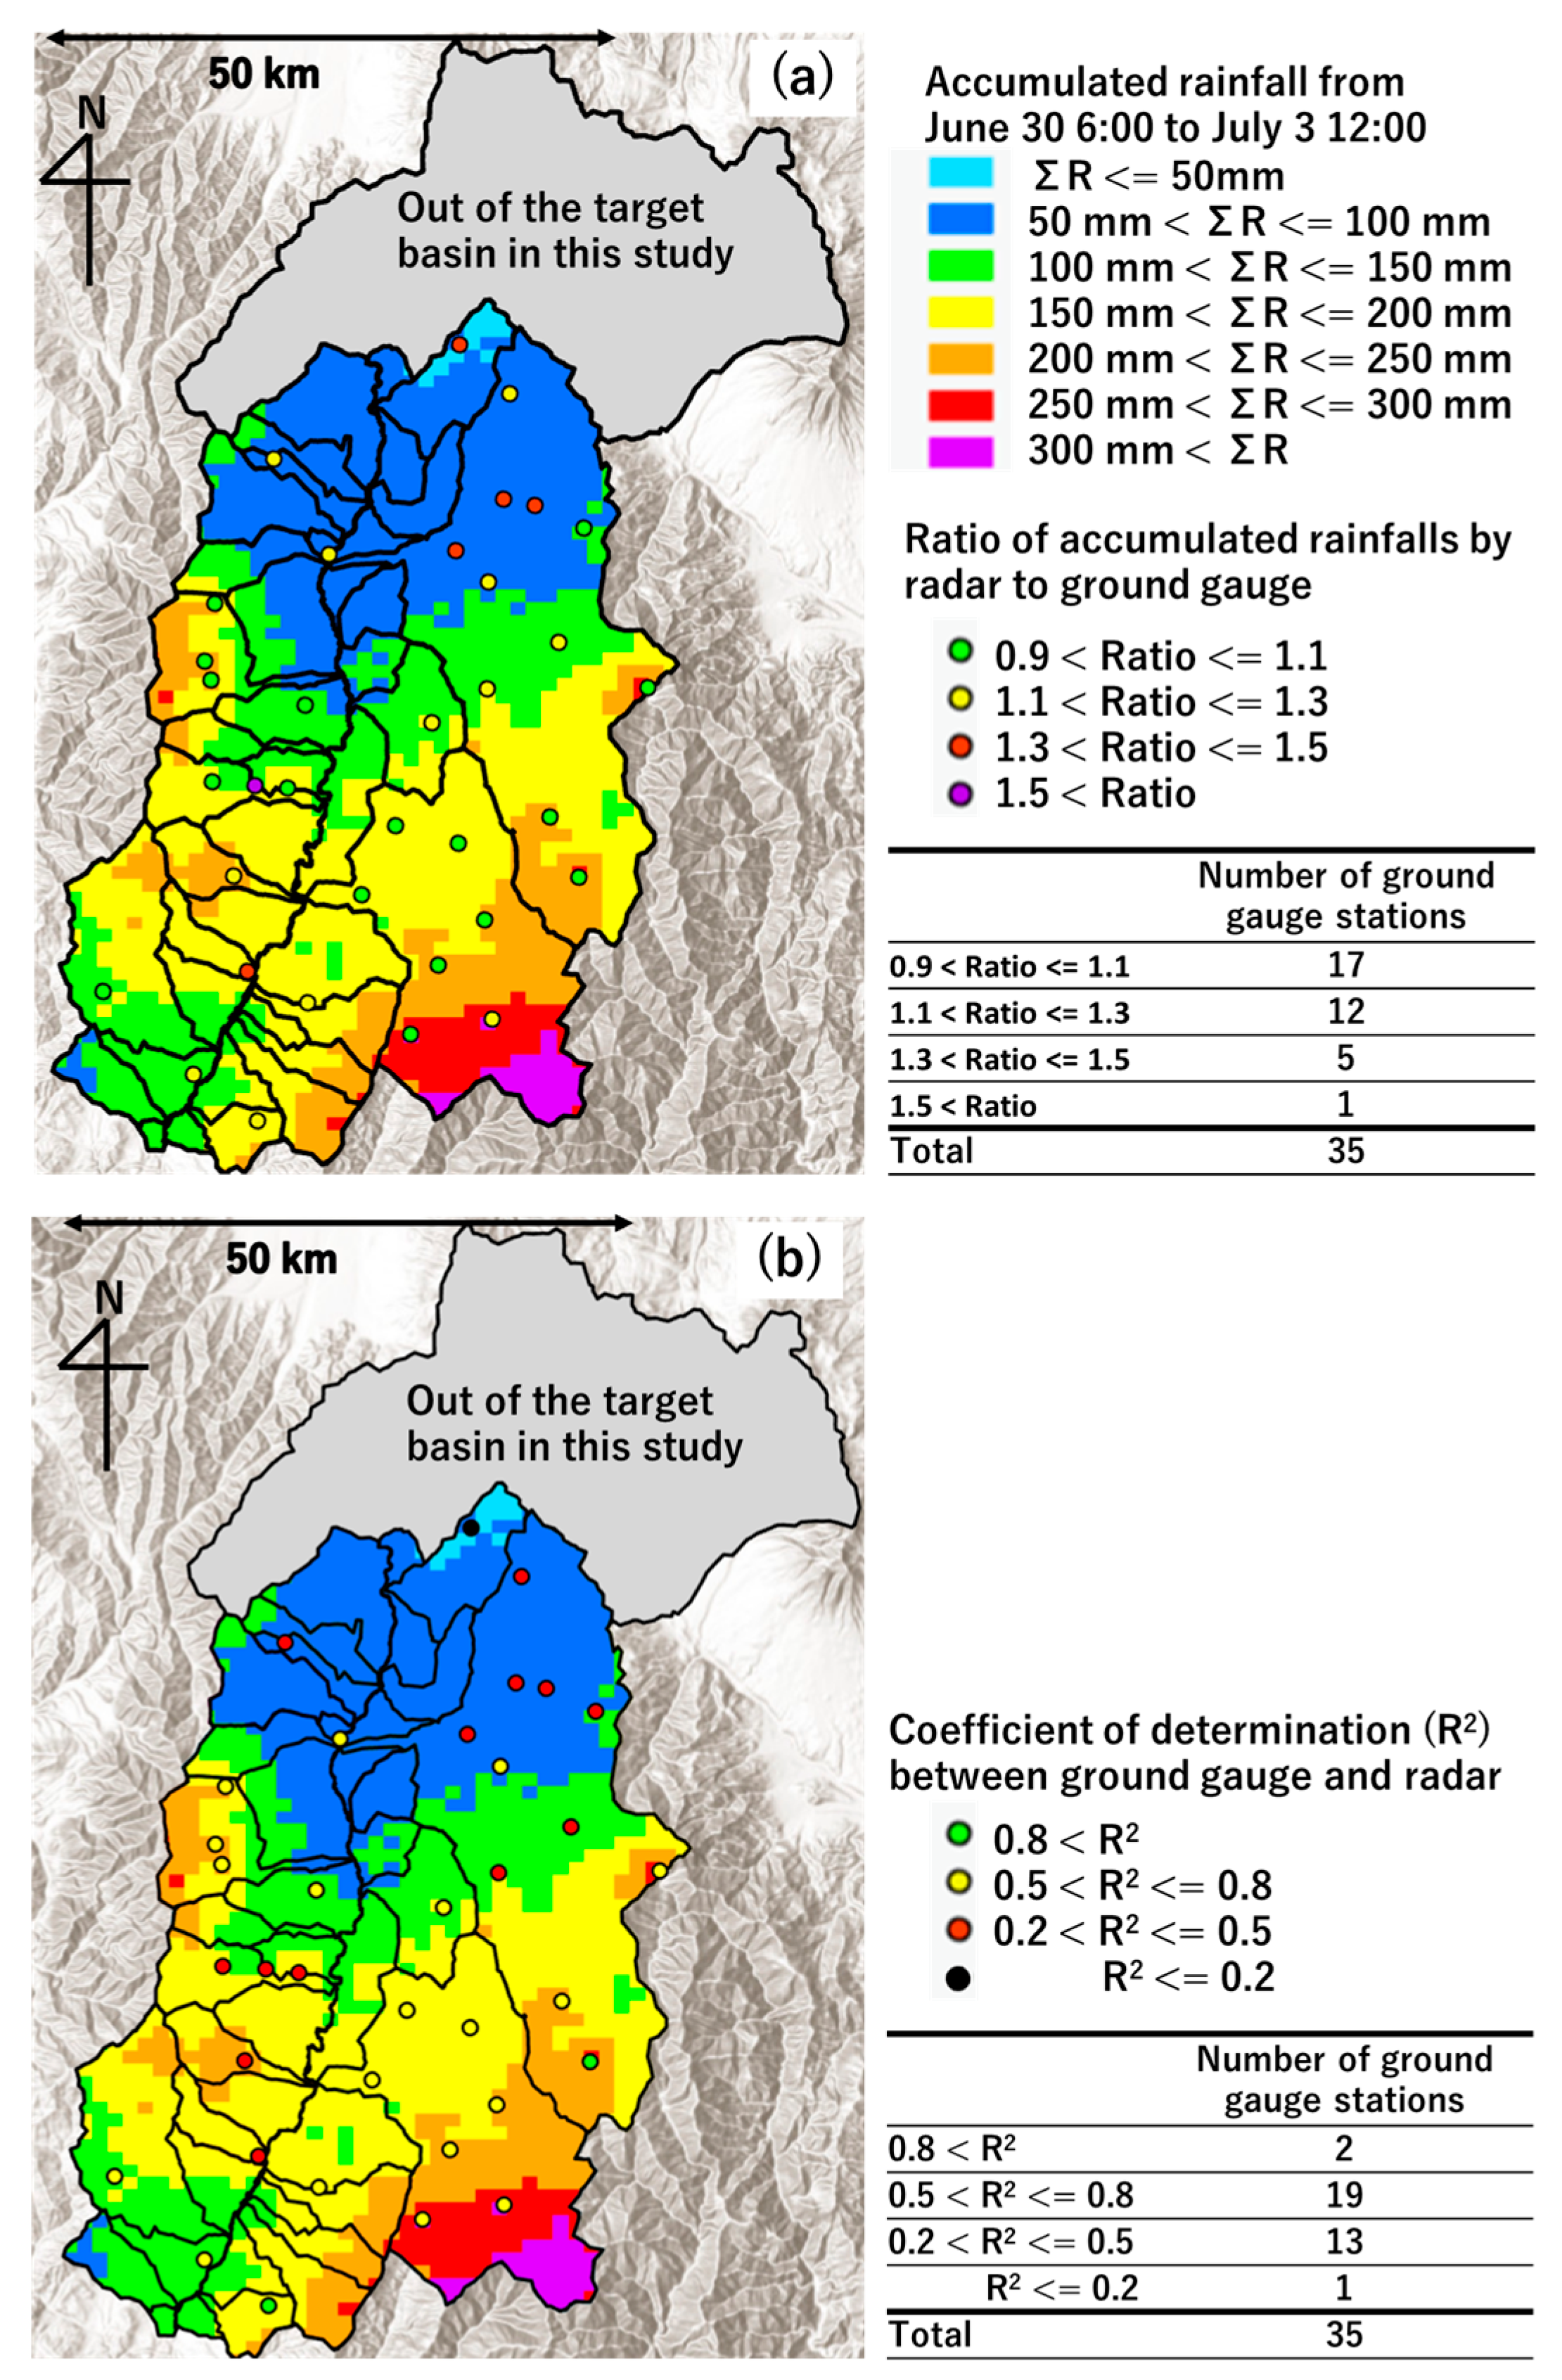
To evaluate the accuracy of the radar rainfall data used in this study, the data were compared with those obtained from ground gauges. The locations of the ground gauge stations are indicated by dots in Figure 2a,b. The color of each dot represents (a) the ratio of the radar rainfall to the ground gauge rainfall based on the cumulative precipitation within the analysis period; and (b) the coefficient of determination (R2) between rainfall measured by radar and by ground gauge at a 1 h time resolution. According to Figure 2a, approximately half of the rain gauges showed a ratio within the range of 0.9 to 1.1. On the other hand, there were also gauges where the ratio exceeded 1.1. If a uniform calibration were applied across the basin, it could degrade the accuracy in those areas where the ratio was within the range of 0.9 to 1.1. In addition, the locations with ratios outside the 0.9 to 1.1 range did not exhibit any particular spatial bias, and arbitrary calibration could potentially disrupt the physical characteristics of the spatial distribution of rainfall. Moreover, ground gauge observations in mountainous areas are generally prone to instrument failures, and it cannot necessarily be assumed that ground gauge rainfall data are more accurate. Therefore, no calibration was applied to the radar rainfall data in this study. As for the R2 value, there are several locations where it falls below 0.5. The interpretation of its impact on the simulation results will be discussed in the Discussion chapter.

3.1.2. Discharge Data

The inflow data of the four dams shown in Figure 1b were used to analyze the rainfall–runoff characteristics, while the dam outflow data were used as boundary conditions in the rainfall–runoff simulation. In addition, continuous discharge data at Inatomi (Point (A) in Figure 1b), which were obtained from a stage–discharge relationship, were used as the upstream discharge boundary condition for the two-dimensional unsteady flow simulation. Furthermore, the discharge values from the float-type measurements at three locations along the river channel (Points (B), (C), and (D) in Figure 1b) were used to evaluate the accuracy of the discharge simulated using the two-dimensional unsteady flow simulation.

3.1.3. Water Level Data

Measurements by 24 water level gauges installed along the main channel (locations described in a later section) were used to analyze the flood propagation and to validate the accuracy of the water levels simulated using the two-dimensional unsteady flow model. Moreover, the observed water level at Tenryu-kyo (Point (E) in Figure 1b) was used as the downstream water level boundary condition in the simulation.

3.2. Rainfall–Runoff Simulation Model

The rainfall–runoff–inundation (RRI) model [15,16,17] was used to simulate the runoff from tributary basins based on Equations (1)–(3).
h t + q x x + q y y = r ,
q x = k m d m ( h d m ) β H x ,             ( h d m ) , q x = k a ( h d m ) H x k m d m H x ,             ( d m < h d a ) , q x = 1 n ( h d a ) 5 3 | H x | s g n ( H x ) k a ( h d m ) H x k m d m H x ,             ( d a < h ) ,
q y = k m d m ( h d m ) β H y ,             ( h d m ) , q y = k a ( h d m ) H y k m d m H y ,             ( d m < h d a ) , q y = 1 n ( h d a ) 5 3 | H y | s g n ( H y ) k a ( h d m ) H y k m d m H y ,             ( d a < h ) ,
where h is the equivalent water stage, qx and qy are the unit width discharges in the x and y directions, r is the rainfall intensity, km is the lateral hydraulic conductivity in the unsaturated zone, dm is the equivalent water stage to the maximum water content in the capillary pore, H is the height of water from the datum, da is the soil depth times the effective porosity, ka is the lateral saturated hydraulic conductivity, β is ka/km, and n is the Manning roughness coefficient.
The RRI model is able to simulate exchanges between river channel water and slope water by including the overflow from the channel to the slope. However, no inundation occurred during the target event. Therefore, the simulation was conducted without the inclusion of water interactions.
Topographic data published by Yamazaki et al. [18] were used in this study, and the original 30 m resolution data was upscaled to 150 m resolution. Within each tributary basin, any cell with an upstream catchment area ≥ 0.6 km2 was considered to include both the slope and channel components. The channel width was defined by the following empirical formula [Equation (4)]:
W = C W A S W ,
where W is the channel width, A is the upstream catchment area, and CW and SW are parameters (CW = 4.0 and SW = 0.4) used to match the cross-sectional survey data from the four locations in the basin.
The Manning roughness coefficient was adjusted to improve the reproducibility of the simulation described later and was set to 0.07 and 0.4 m−1/3·s for the river channel and the slope, respectively. Rainfall was obtained from radar rainfall data (temporal resolution = 1 h, spatial resolution = 1 km). Evapotranspiration rate was set to 4 mm/day as an approximate value. According to Kondo et al. [19], evapotranspiration during a flood is predominantly composed of interception evaporation, and the annual interception evaporation in the vicinity of the target basin is approximately 300–400 mm. Based on data published by the Japan Meteorological Agency [20], the annual number of rainy days in the Tokai region, where the target basin is located, is around 100 days. Therefore, an average interception evaporation of 4 mm/day on rainy days was applied.
Furthermore, the dam outflows from the four dams shown in Figure 1b were applied as boundary conditions. The parameter β was set to 4.0 in this study, whereas ka, km, da, and dm in Equations (2) and (3) were assigned for each geological unit based on the classification shown in Figure 1c. The details of the parameter values are shown in Section 4.2.
Although the calculation period began at 0:00 on 27 June 2020, the period until 6:00 on 30 June 2020 was treated as a spin-up period to allow the soil moisture conditions of the basin to stabilize.

3.3. Two-Dimensional Unsteady Flow Model

A two-dimensional unsteady flow model in generalized coordinates was used to simulate the flood flow in the main channel. The simulation program compiled into the Program Collection published by the Japan Society of Civil Engineers [21] was used in this study, with modification to allow the input of inflow discharge from tributaries calculated by the RRI model, as described later. The governing equations in the Cartesian coordinate system are as follows [Equations (5)–(7)]:
h t + M x + N y = q i n ,
M t + u M x + v M y = g h z s x τ b x ρ + x ( u 2 ¯ h ) + y ( u v ¯ h ) ,
N t + u N x + v N y = g h z s y τ b y ρ + x ( u v ¯ h ) + y ( v 2 ¯ h ) ,
where h is the water depth, M and N are the discharge flaxes in the x and y directions, respectively, qin is the height of the inflow from the tributary, g is the gravitational acceleration, u and v are the depth-averaged velocity in the x and y directions, zs is the water level, τ b x and τ b y are bed shear stress in the x and y directions, respectively, and u 2 ¯ , u v ¯ , and v 2 ¯ are the depth-averaged Reynolds stress.
τ b x and τ b y are given in by Equations (8) and (9), respectively, as follows:
τ b x = ρ g n 2 u u 2 + v 2 h 1 3 ,
τ b y = ρ g n 2 v u 2 + v 2 h 1 3 ,
where n is the Manning roughness coefficient.
u 2 ¯ , u v ¯ , and v 2 ¯ are given by Equations (10)–(14), as follows:
u 2 ¯ = 2 D h ( u x ) 2 3 k ,
u v ¯ = D h ( u y + v x ) ,
v 2 ¯ = 2 D h ( v y ) 2 3 k ,
D h = α h u * ,
k = 2.07 u * 2 ,
where Dh is the eddy viscosity coefficient, k is the turbulent kinetic energy, α is a parameter, and u* is the friction velocity.
The advection terms were discretized based on the upwind difference scheme, and the Adams–Bashforth method was used for temporal integration. The computational grid was generated in generalized coordinates using the International River Interface Cooperative software V4 [22], with an average spatial resolution of approximately 10 m. Topographic data, including the riverbed geometry, were obtained using airborne laser bathymetry. n was set to 0.03 m−1/3 s and α was set to 0.2.
The discharge at the Inatomi site, which was determined based on the stage–discharge relationship, was used as the upstream boundary condition, whereas the observed water level at Tenryu-kyo was used as the downstream boundary condition.
Inflows from tributaries calculated using the RRI model were transferred into the two-dimensional unsteady flow model using the method illustrated in Figure 3, as follows:
(Step 1) The black lines in Figure 3a represent cells in the RRI model. The center coordinate of the cell indicates where the inflow from the tributary to the main channel is detected. The inflow discharge from the tributary was designated as Q_rri (m3/s).
(Step 2) In the same figure, the red cells correspond to those in the two-dimensional unsteady flow model. i and j are the cell indices in the longitudinal and cross-sectional directions, respectively. The i corresponding to the RRI inflow point, i.e., the closest one to the coordinates obtained in step 1, was identified. In the example shown in Figure 3a, i = 6.
(Step 3) At i = 6, the water-covered cells were j = 2, 3, 4, and 5, and Q_rri was transferred among these cells.
(Step 4) The inflow volume ( Q _ r r i × d t , where dt is the time step of the two-dimensional flow model) is uniformly distributed across the four cells: (i,j) = (6,2), (6,3), (6,4), and (6,5), as shown in Figure 3b. Based on the spatial resolutions (dx and dy) in the j- and i-directions, respectively, the water level increment (qin) introduced at the cross-section with i = 6 can be expressed by Equation (15).
q i n = Q _ r r i × d t ( d x × d y ) ,
where qin is the same parameter introduced in the continuity equation in Equation (5). Although the model cannot distinguish between inflows from the left and right banks and is therefore not suitable for detailed flow analysis near confluences, it is capable of sequentially incorporating tributary inflows into the main river to simulate flood propagation. This approach allows the physical processes (from external rainfall input through runoff generation to the propagation of flood waves resulting from tributary inflows) to be consistently and comprehensively represented within an integrated modeling framework.
In order to obtain the initial conditions for the simulation, a preliminary computation was performed. The inflow discharge at the calculation start time, i.e., 6:00 on 30 June 2020, was given as a constant value, and the computation was continued until the state variables reached a sufficiently stable condition. These stabilized state variables were then adopted as the initial conditions for the unsteady flow simulation.

4. Results

The relationships among the sections in Section 4 (“Results”) and Section 5 (“Discussion”) are illustrated in Figure 4. Section 4.1, Section 4.2, Section 4.3 and Section 4.4 of the results chapter focus on rainfall–runoff processes, while Section 4.5, Section 4.6, Section 4.7 and Section 4.8 address flood propagation. In the results chapter, each section is described in the following sequence: analysis of the observed data; validation of the simulation based on these observations; analysis from the simulation results; and storage volume as one of the indices representing the relative relationships across the entire basin. In the discussion chapter, we first present interpretations of the rainfall–runoff and flood propagation, followed by a discussion that integrates these perspectives in terms of storage, and finally a description of the simulation errors and limitations.

4.1. Rainfall–Runoff Relationships in Dam Basins

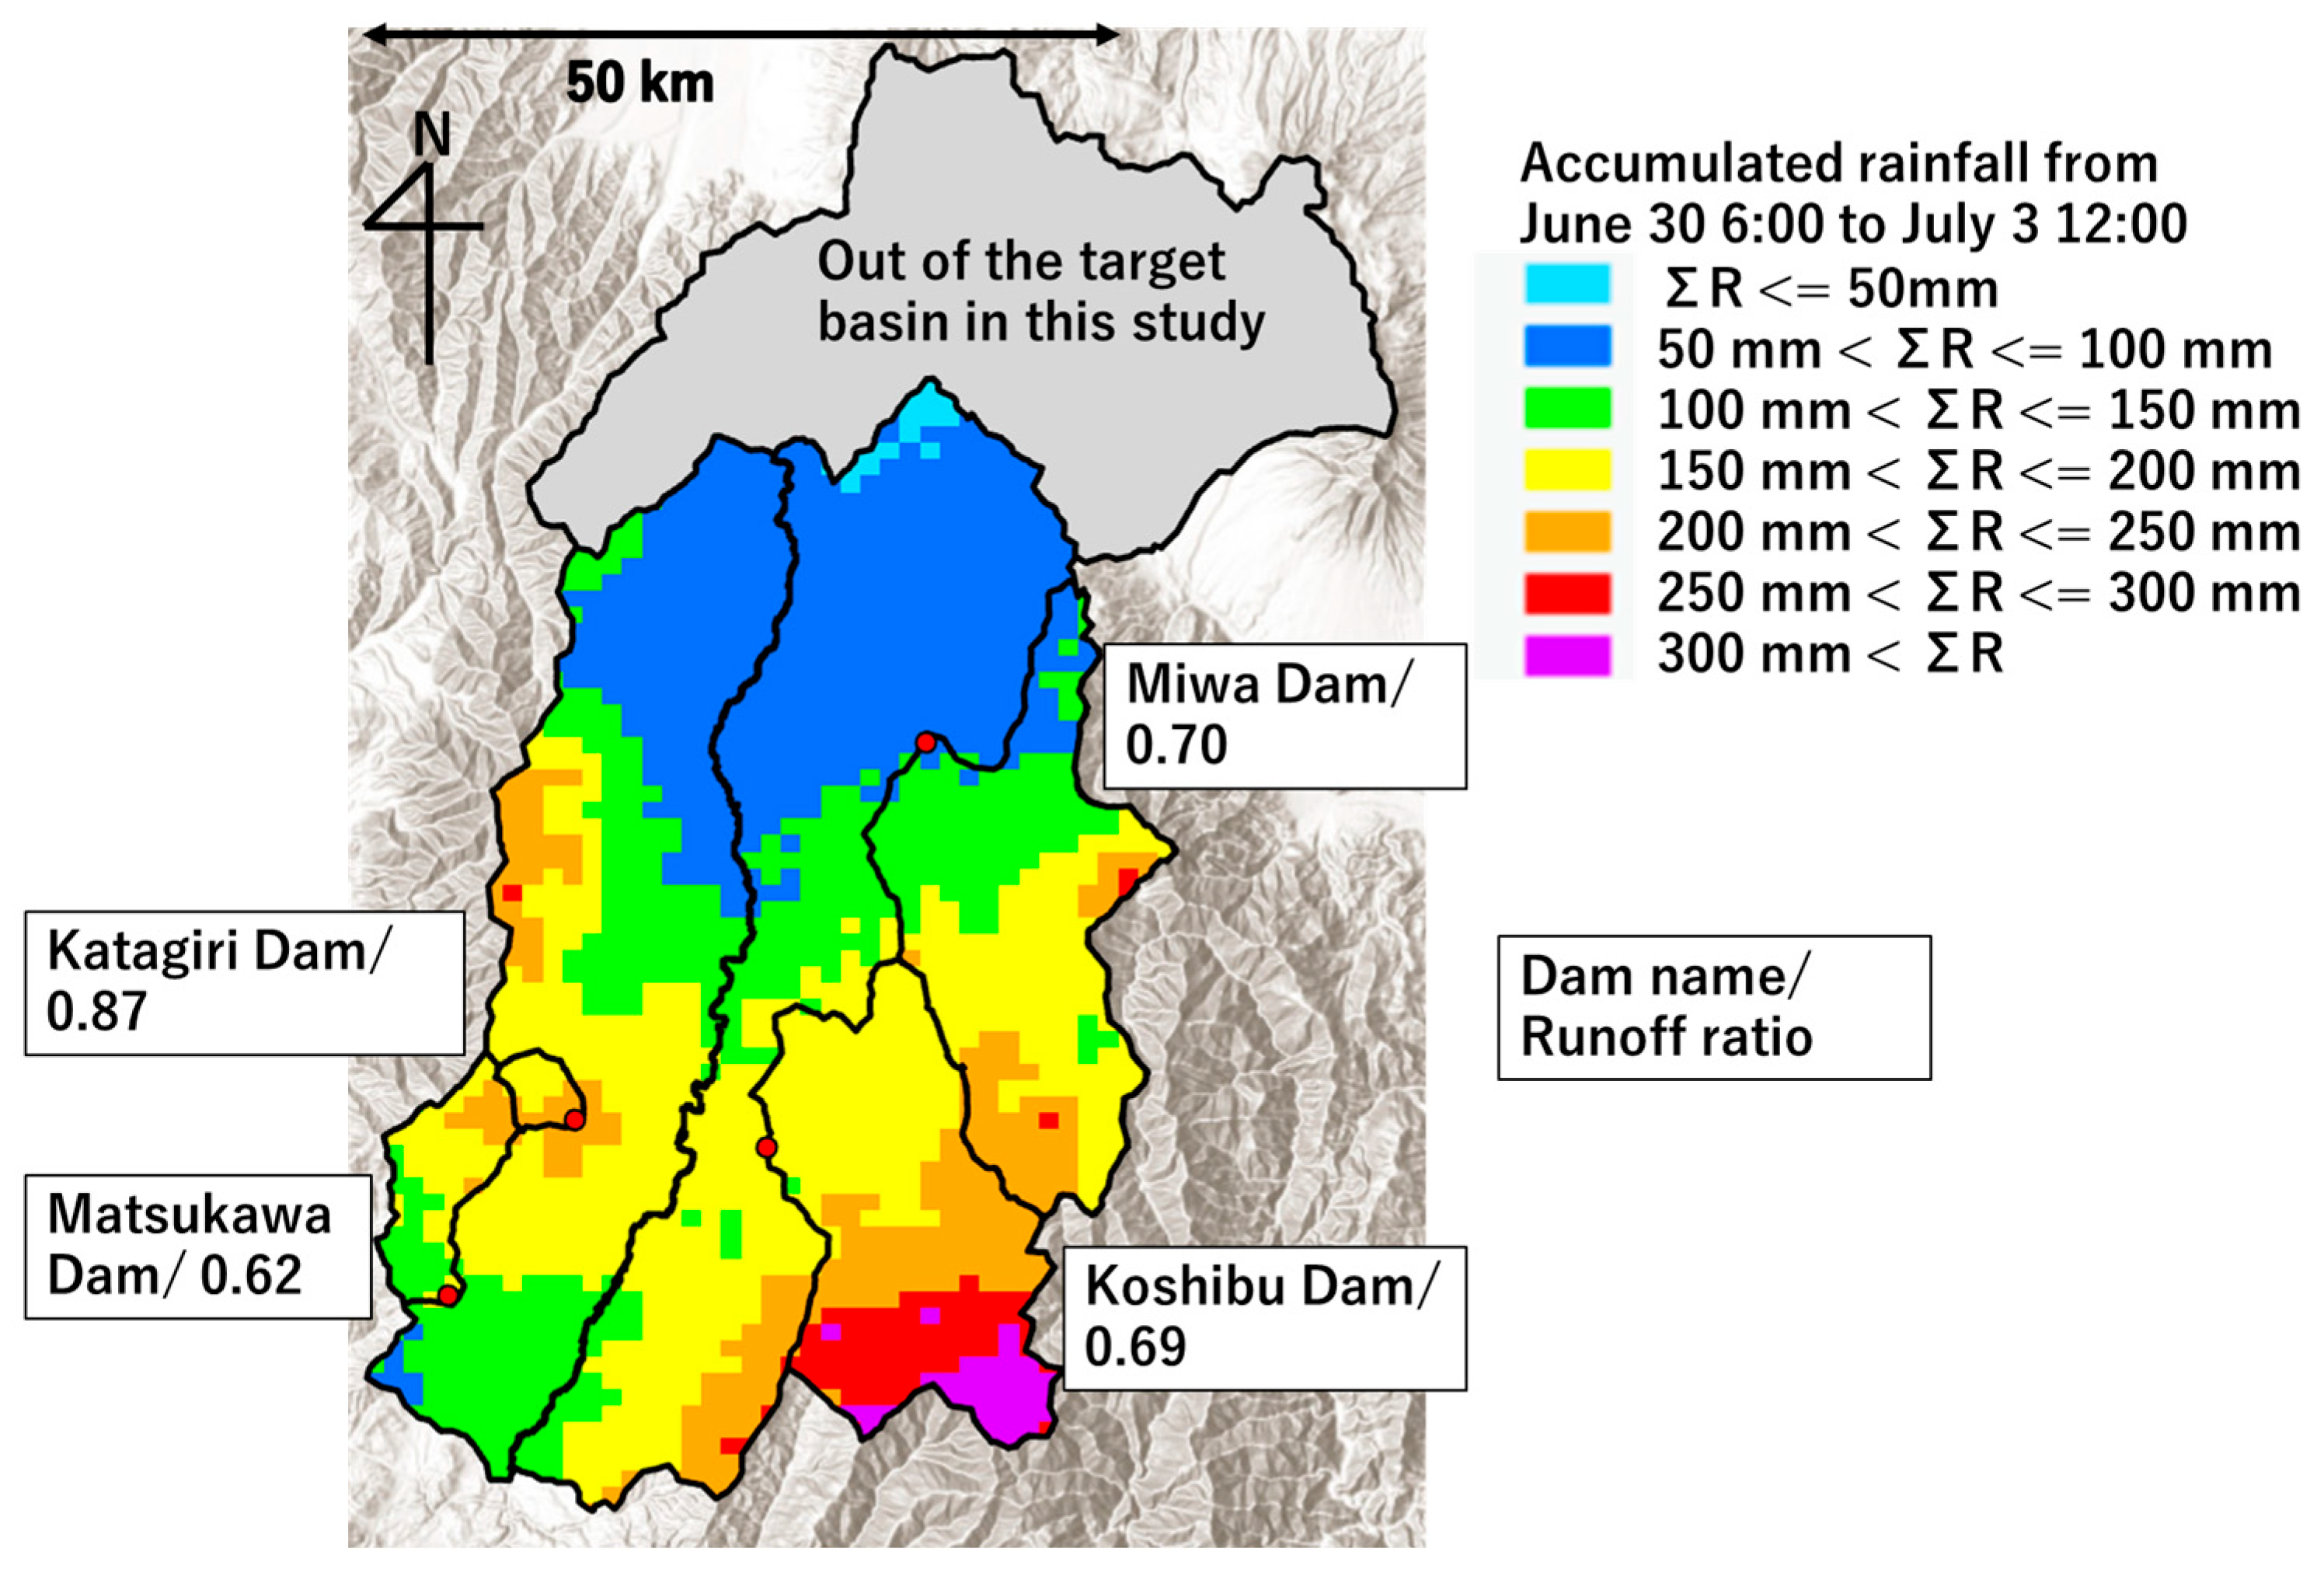
Rainfall–runoff characteristics were studied over the analysis period, using inflow data from four dams within the target basin and radar rainfall data over their respective catchment areas. Figure 5 shows the cumulative rainfall distribution, highlighting the dam catchment boundaries and runoff ratios.
As shown in Figure 5, the Katagiri Dam exhibits a significantly higher runoff ratio compared to the other dams, whereas the neighboring Matsukawa Dam shows a moderate runoff ratio (0.62). As shown in Figure 1c, igneous rocks are widely distributed in both dam catchments, and no significant geological differences are observed between them. The cumulative rainfall distribution indicates that while the entire area of the Katagiri Dam catchment received over 150 mm of rainfall, the downstream area of the Matsukawa Dam catchment received relatively lower rainfall, resulting in spatial variability within the catchment.
Furthermore, the Koshibu Dam catchment also experienced cumulative rainfall exceeding 150 mm across its entire area, its runoff ratio is not as high as that of the Katagiri Dam.

4.2. Validation of the Rainfall–Runoff Simulation

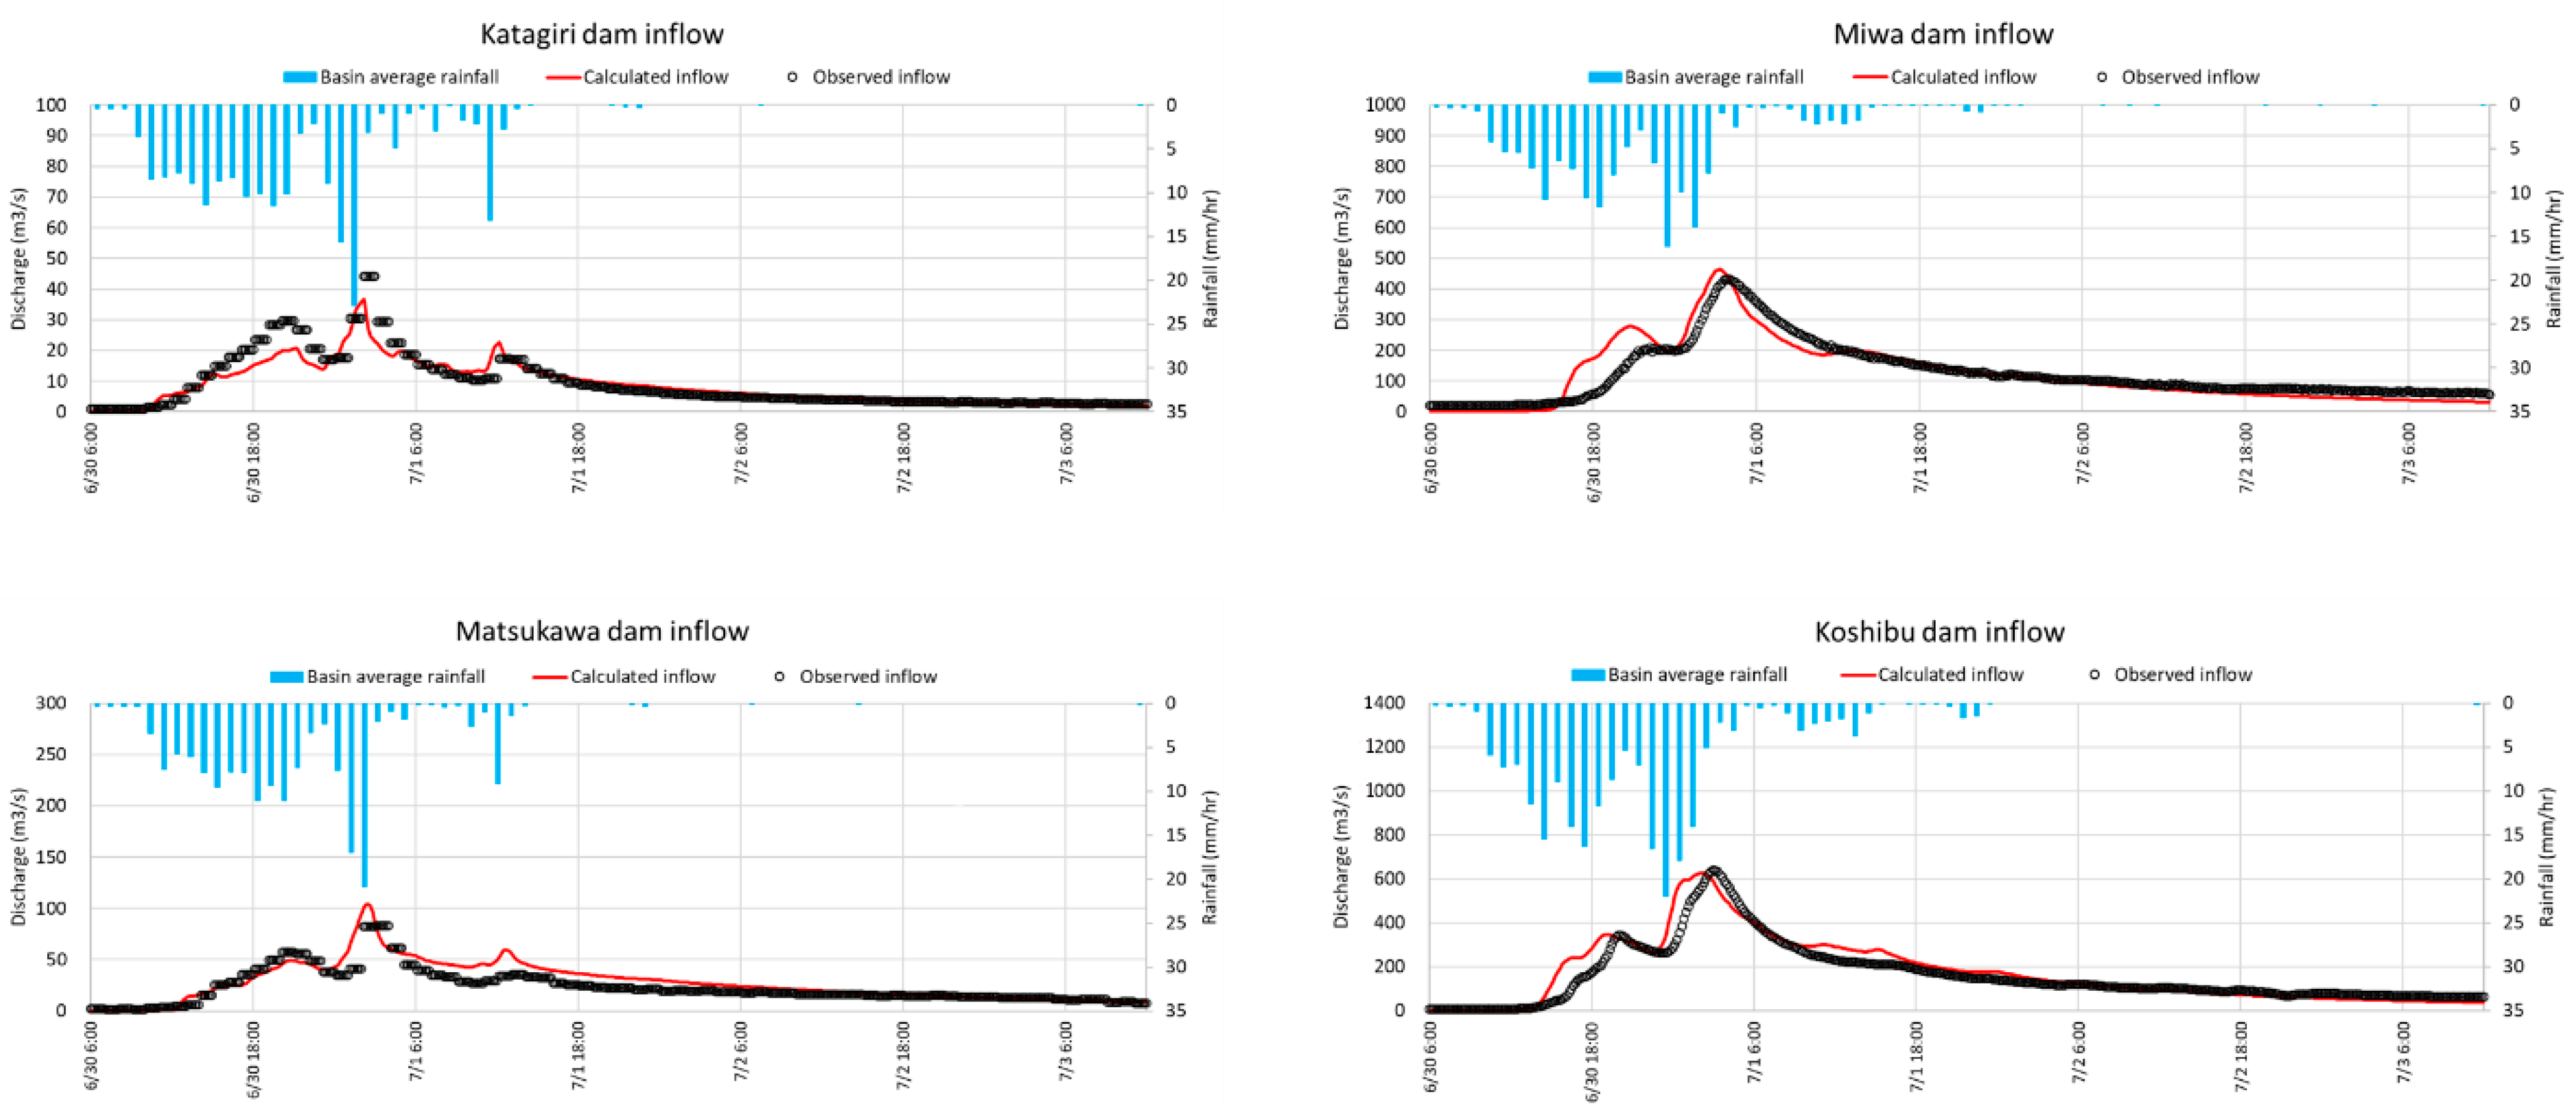
As shown in Table 2, ka, km, da, and dm of the RRI model were assigned based on the four geological classifications shown in Figure 1c. Rainfall–runoff simulations were conducted using these parameter settings. Figure 6 presents the simulated inflow discharges for the dams, while Table 3 summarizes the Nash–Sutcliffe Efficiency (NSE) coefficient values [23] and the comparison between the observed and simulated runoff ratios.
As shown in Figure 6, the inflow discharges were well reproduced for all dams. Although some discrepancies in the NSE coefficient and runoff ratio of the Matsukawa Dam were observed (Table 3), the overall reproducibility is satisfactory. In particular, the runoff ratios for the Miwa and Koshibu Dams are accurately reproduced, and the contrast between the runoff ratios between the Katagiri and Matsukawa Dams is well captured.

4.3. Runoff Characteristics of the Tributary Basins

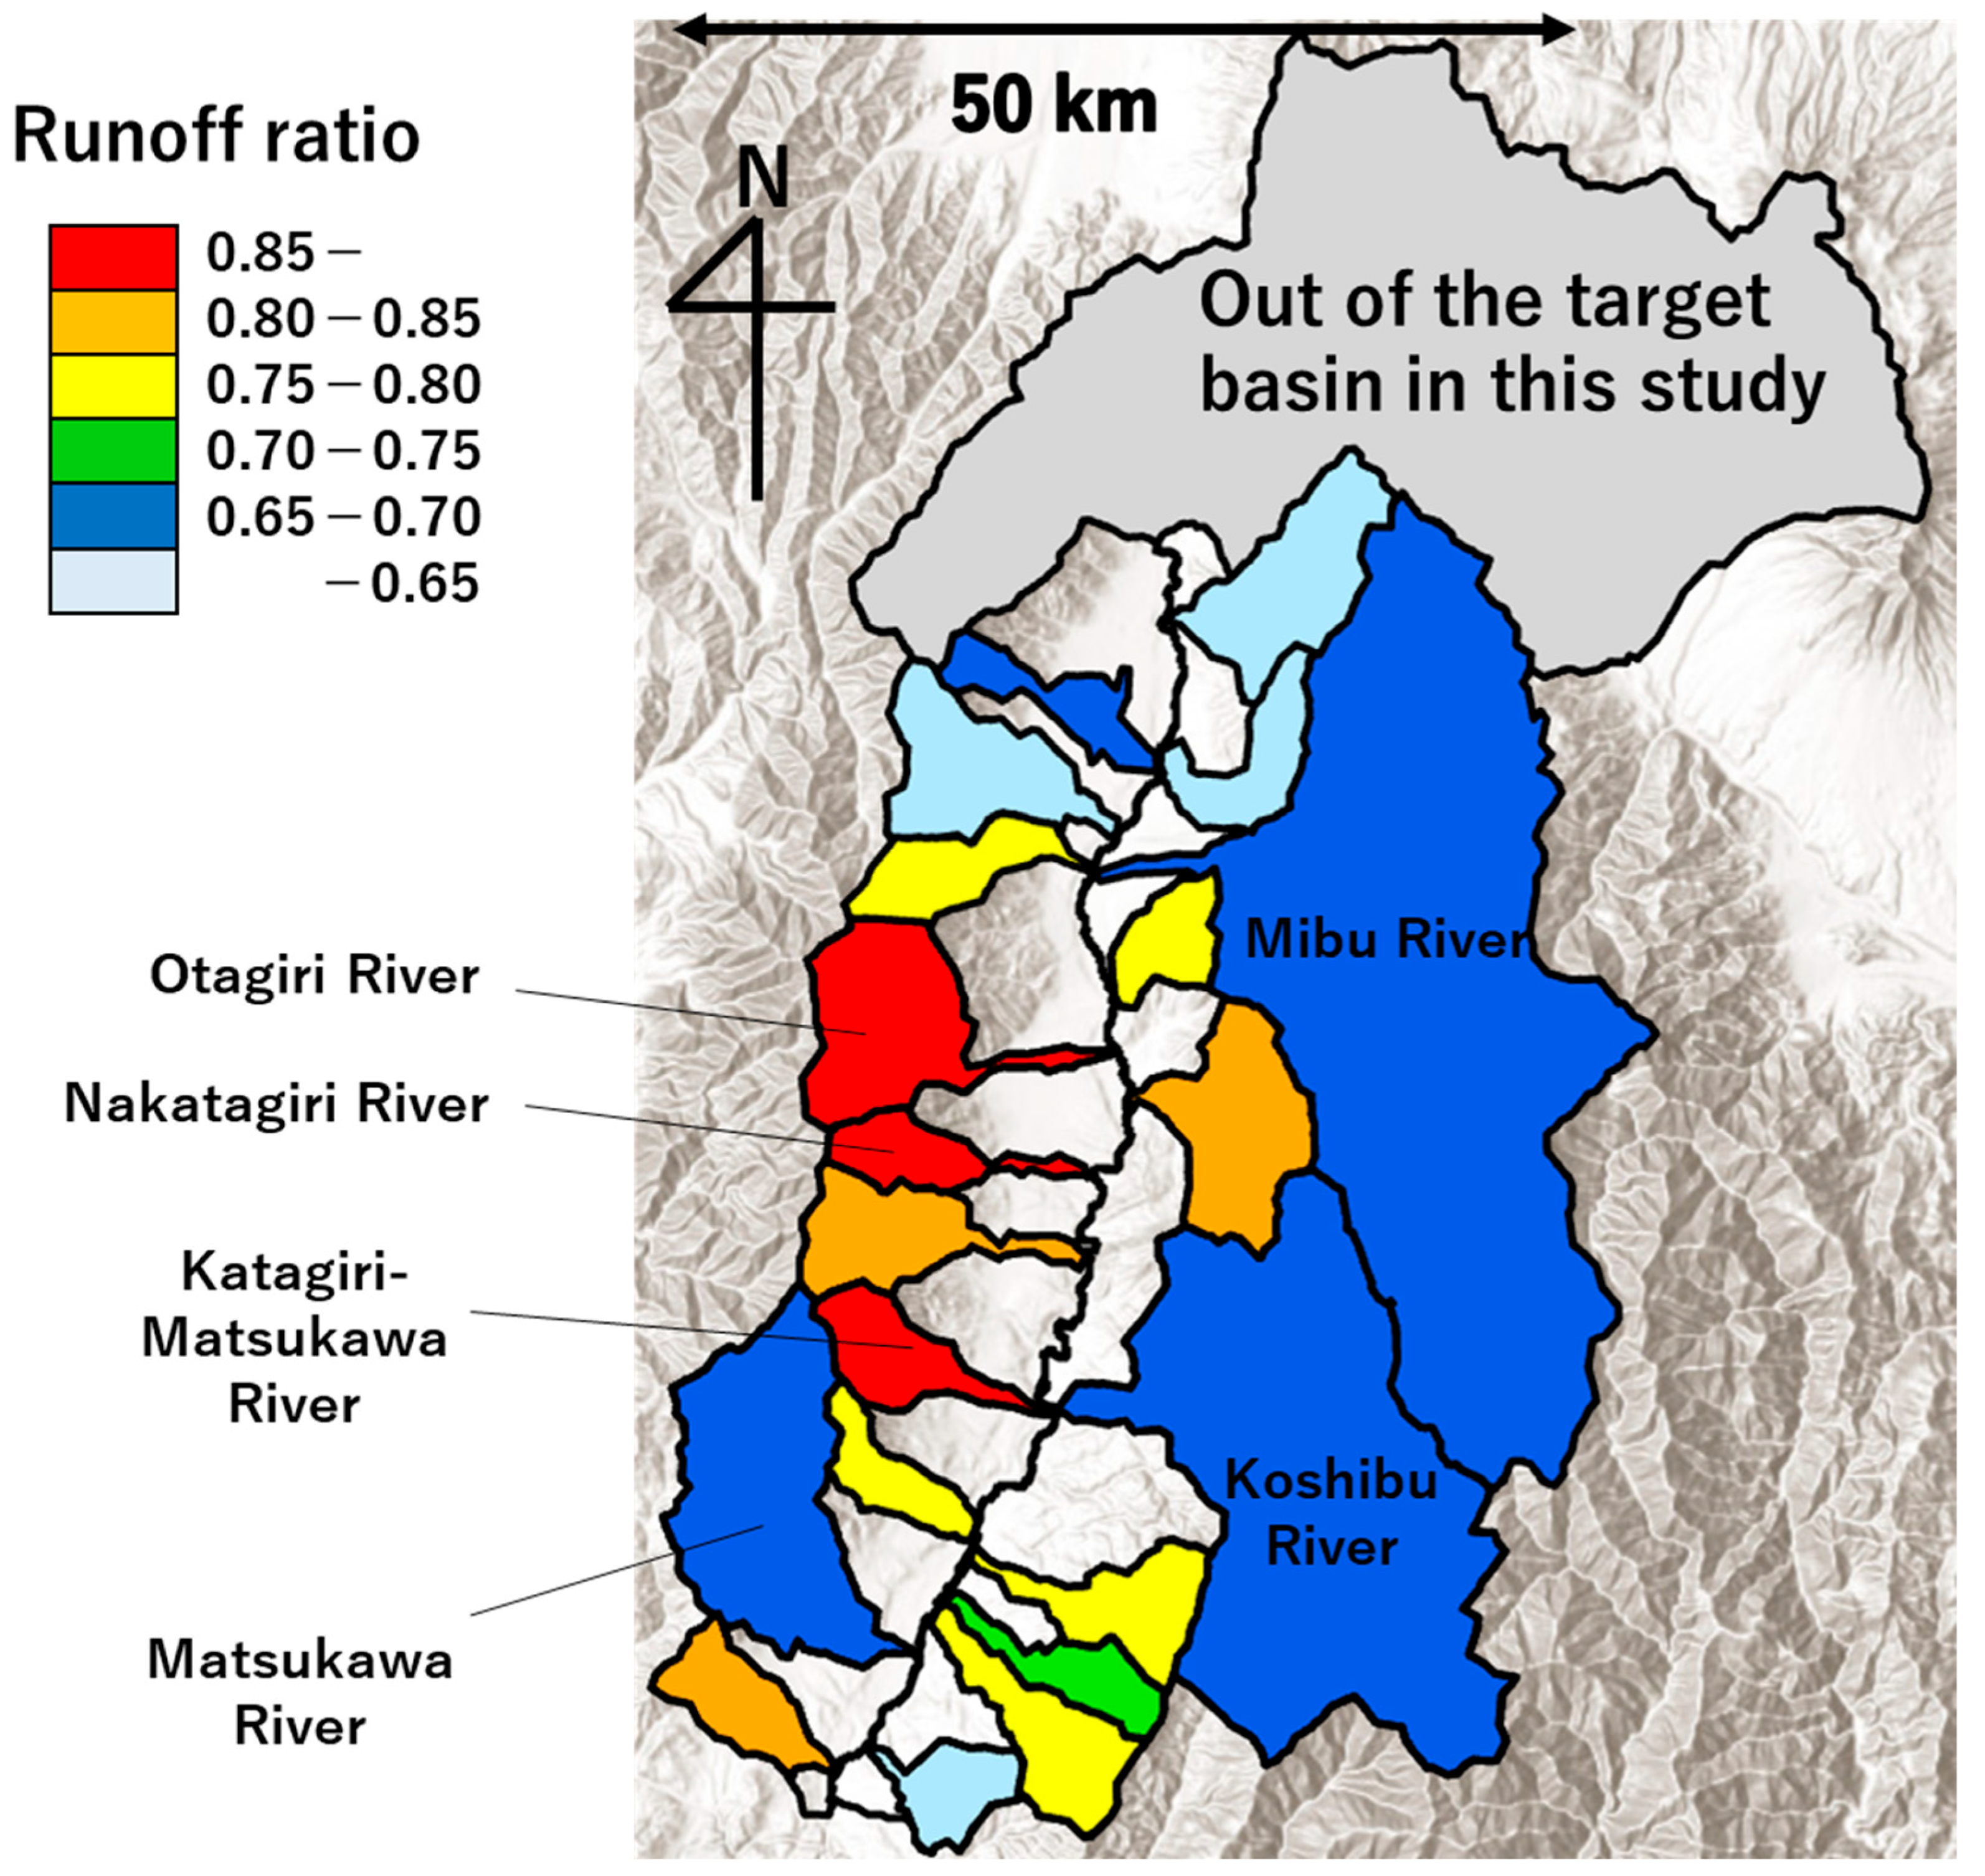
Based on the RRI model results described in Section 4.2, an investigation of the runoff from each of the 20 tributaries shown in Figure 1a was conducted. Figure 7 shows the runoff ratio for each tributary basin during the analysis period. Lower runoff ratios are distributed on the left bank, whereas higher ratios are distributed on the right bank. In particular, the low runoff ratios observed in the Koshibu River and Mibu River, where consolidated and partially consolidated sediments are widely distributed, and the clear contrast between the adjacent Katagiri-Matsukawa and Matsukawa tributaries are in good agreement with previous findings on dam basins in tributary catchments.
Moreover, Figure 7 provides new insights into the characteristics of runoff among the tributaries across the entire basin. On the right bank, three tributaries (Otagiri River, Nakatagiri River, and Katagiri-Matsukawa River) show particularly high runoff ratios. Common features of these basins are that the igneous rocks and metamorphic and mylonitic rocks are distributed in the upstream to midstream area, and the cumulative rainfall exceeds 200 mm over the area.
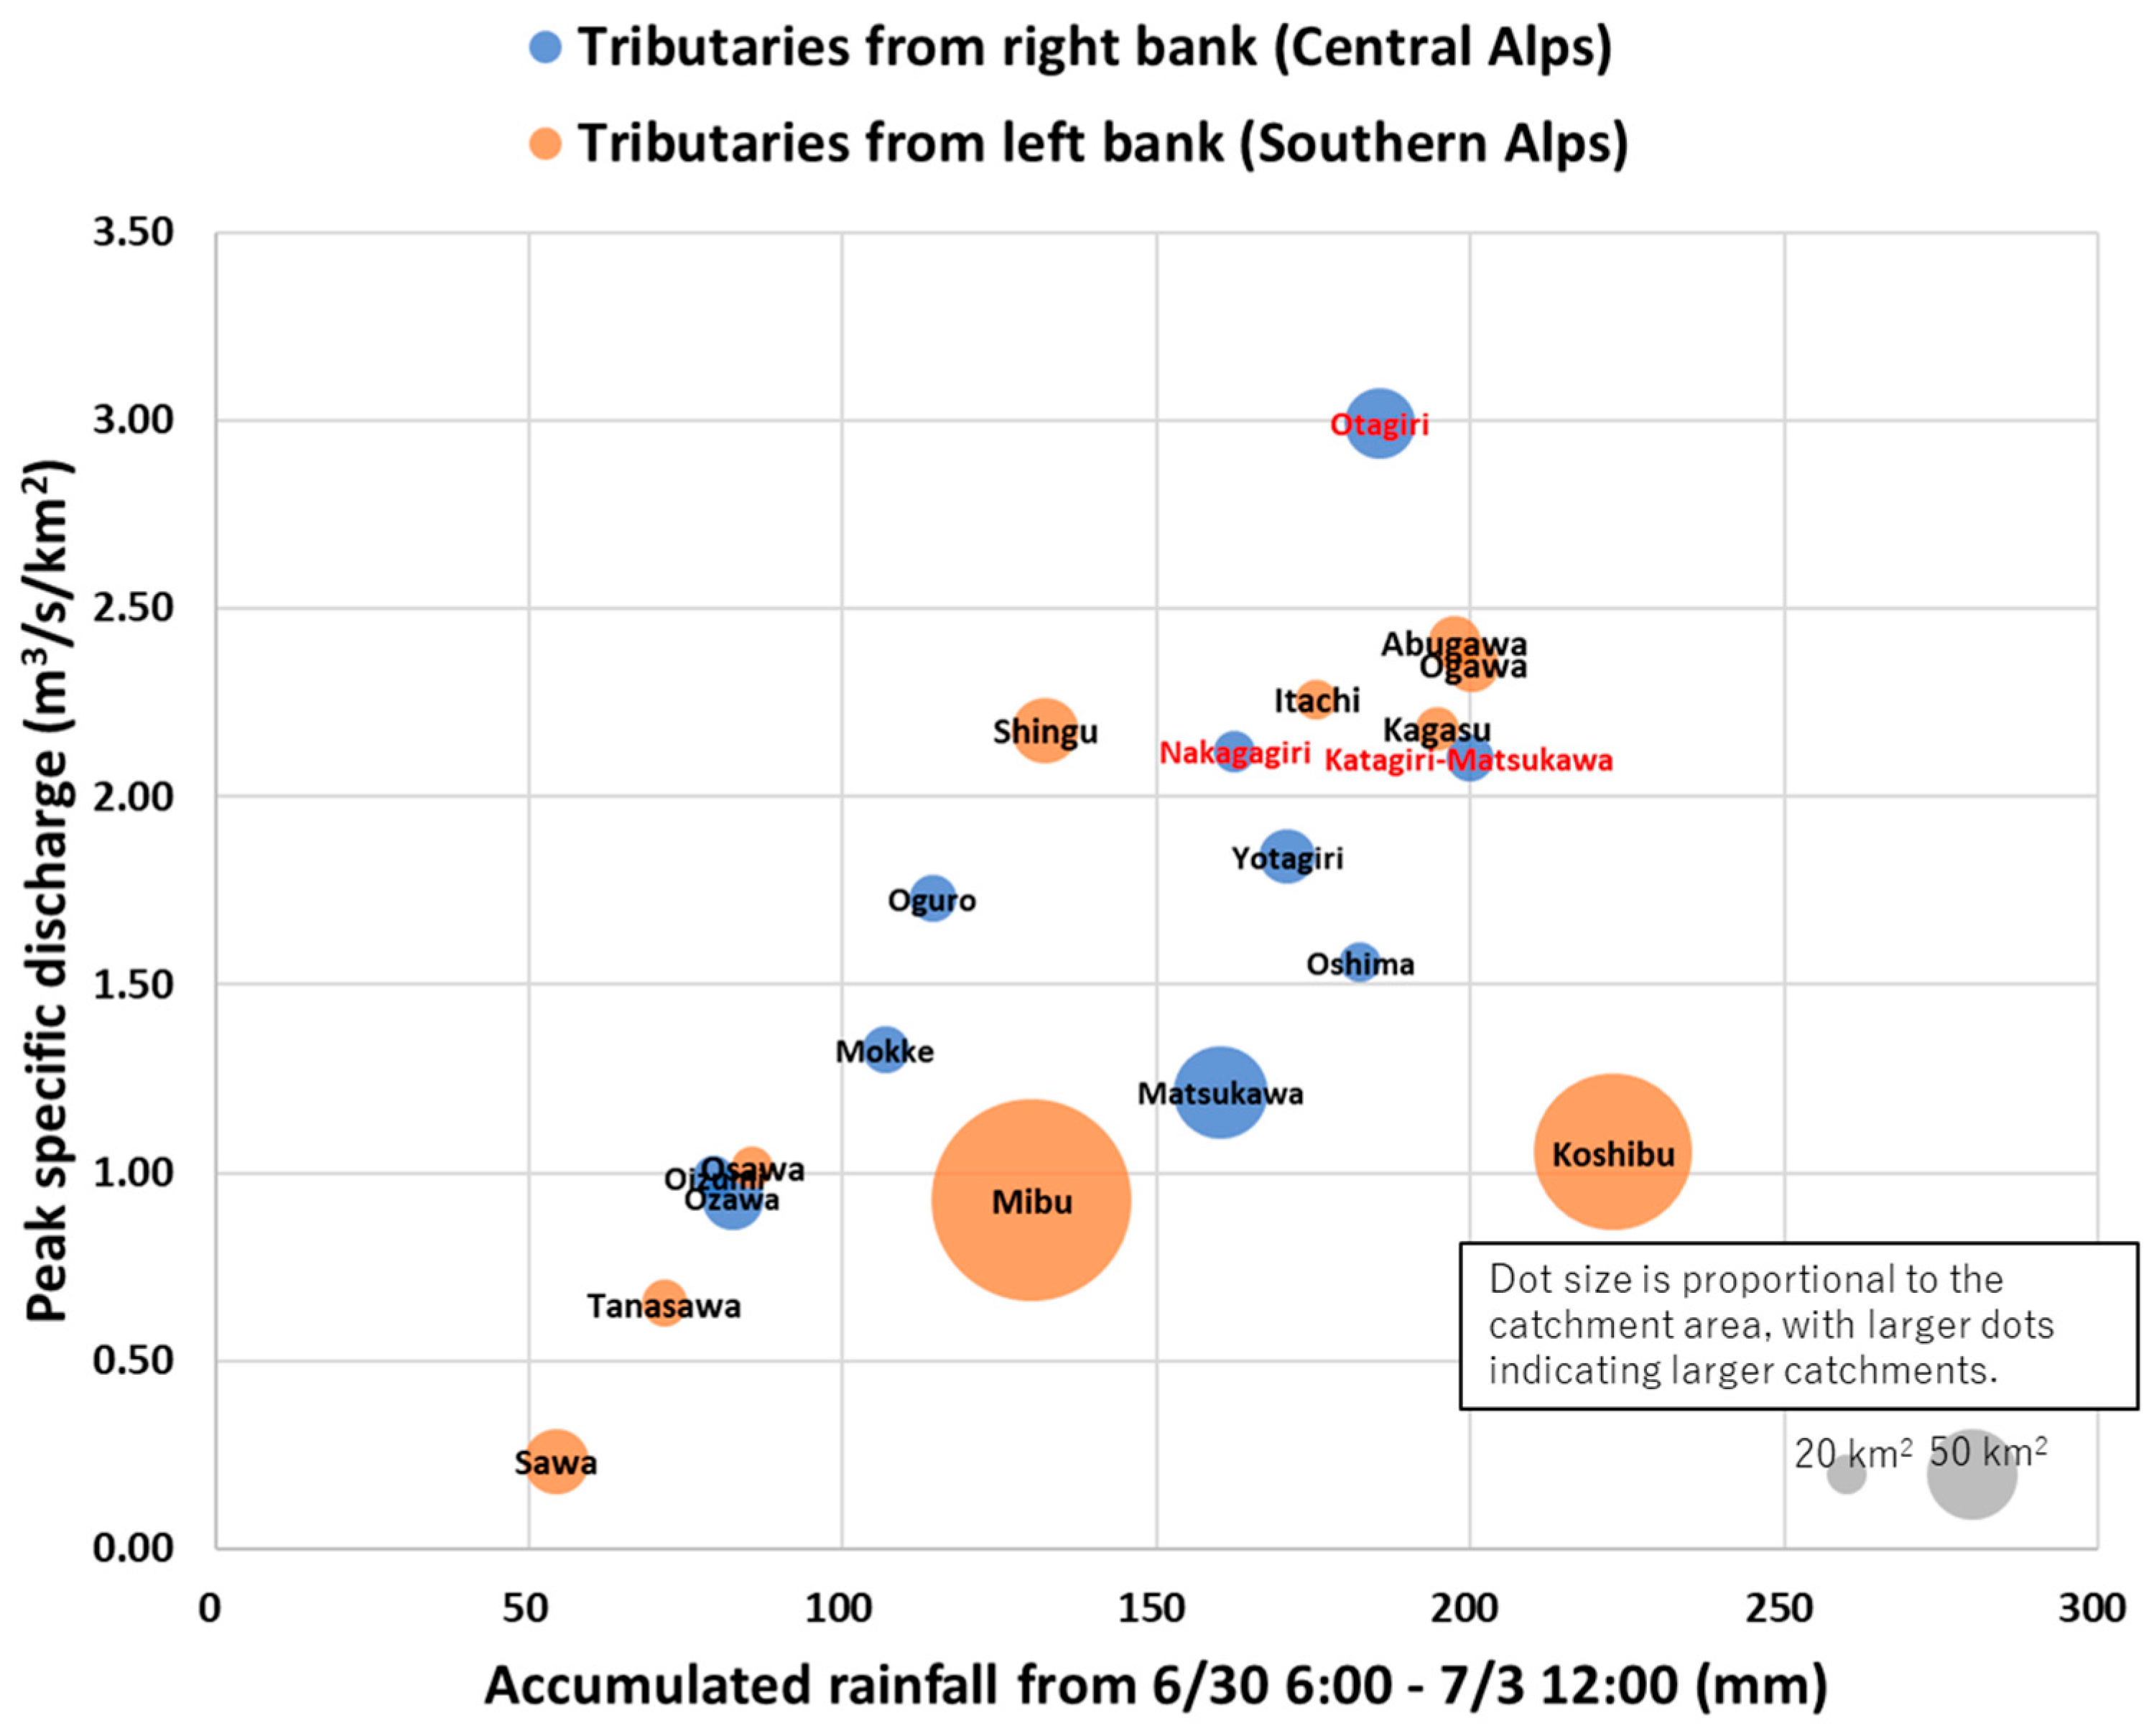
Figure 8 shows the relationship between the cumulative rainfall and the peak-specific discharge for each tributary basin over the same analysis period. The Mibu River and Koshibu River, which have particularly large drainage areas, exhibit relatively low peak-specific discharges despite high total rainfall. This is in good agreement with the commonly recognized inverse relationship between the specific discharge and the catchment area. Notably, the Otagiri River exhibits a particularly high peak-specific discharge.

4.4. Investigation of the Basin Storage

In this section, we quantitatively analyze the basin storage in response to the rainfall input. Figure 9 presents the time series of accumulated net precipitation (defined as rainfall minus evapotranspiration) and the estimated basin storage for the whole target domain. The method of graphical representation in Figure 9 was inspired by the “graphical representation of storage water volume distributions” [13].
Herein, basin storage is defined as the time-integrated difference between net precipitation and outflow discharge from tributaries into the main channel and is expressed by Equations (16) and (17), as follows:
d S d t = ( R × 1 3600 × 1 10 3 × A × 10 6 ) Q ,
S = T 0 T d S d t d t ,
where S is the basin storage (m3), R is the net precipitation (mm/h), A is the catchment area (km2), Q is the outflow discharge from the tributary into the main channel (m3/s), T is the integration time, and T0 is the initial time.
Figure 9 presents the basin storage attributed to the ten representative tributaries on the right bank and the ten tributaries on the left bank, as well as the whole target domain. The basin storage reached its peak at 3:00 on 1 July, during which the accumulated net precipitation reached 250,000,000 m3, while the basin storage in the whole target basin was approximately 180,000,000 m3, accounting for 72% of the accumulated net precipitation. Of this total basin storage volume, the right-bank tributaries (Central Alps) contributed approximately 30,000,000 m3 (17%) and the left-bank tributaries (Southern Alps) contributed approximately 120,000,000 m3 (67%), clearly indicating the storage contributions from each region.

4.5. Flood Propagation Based on Water Level Data

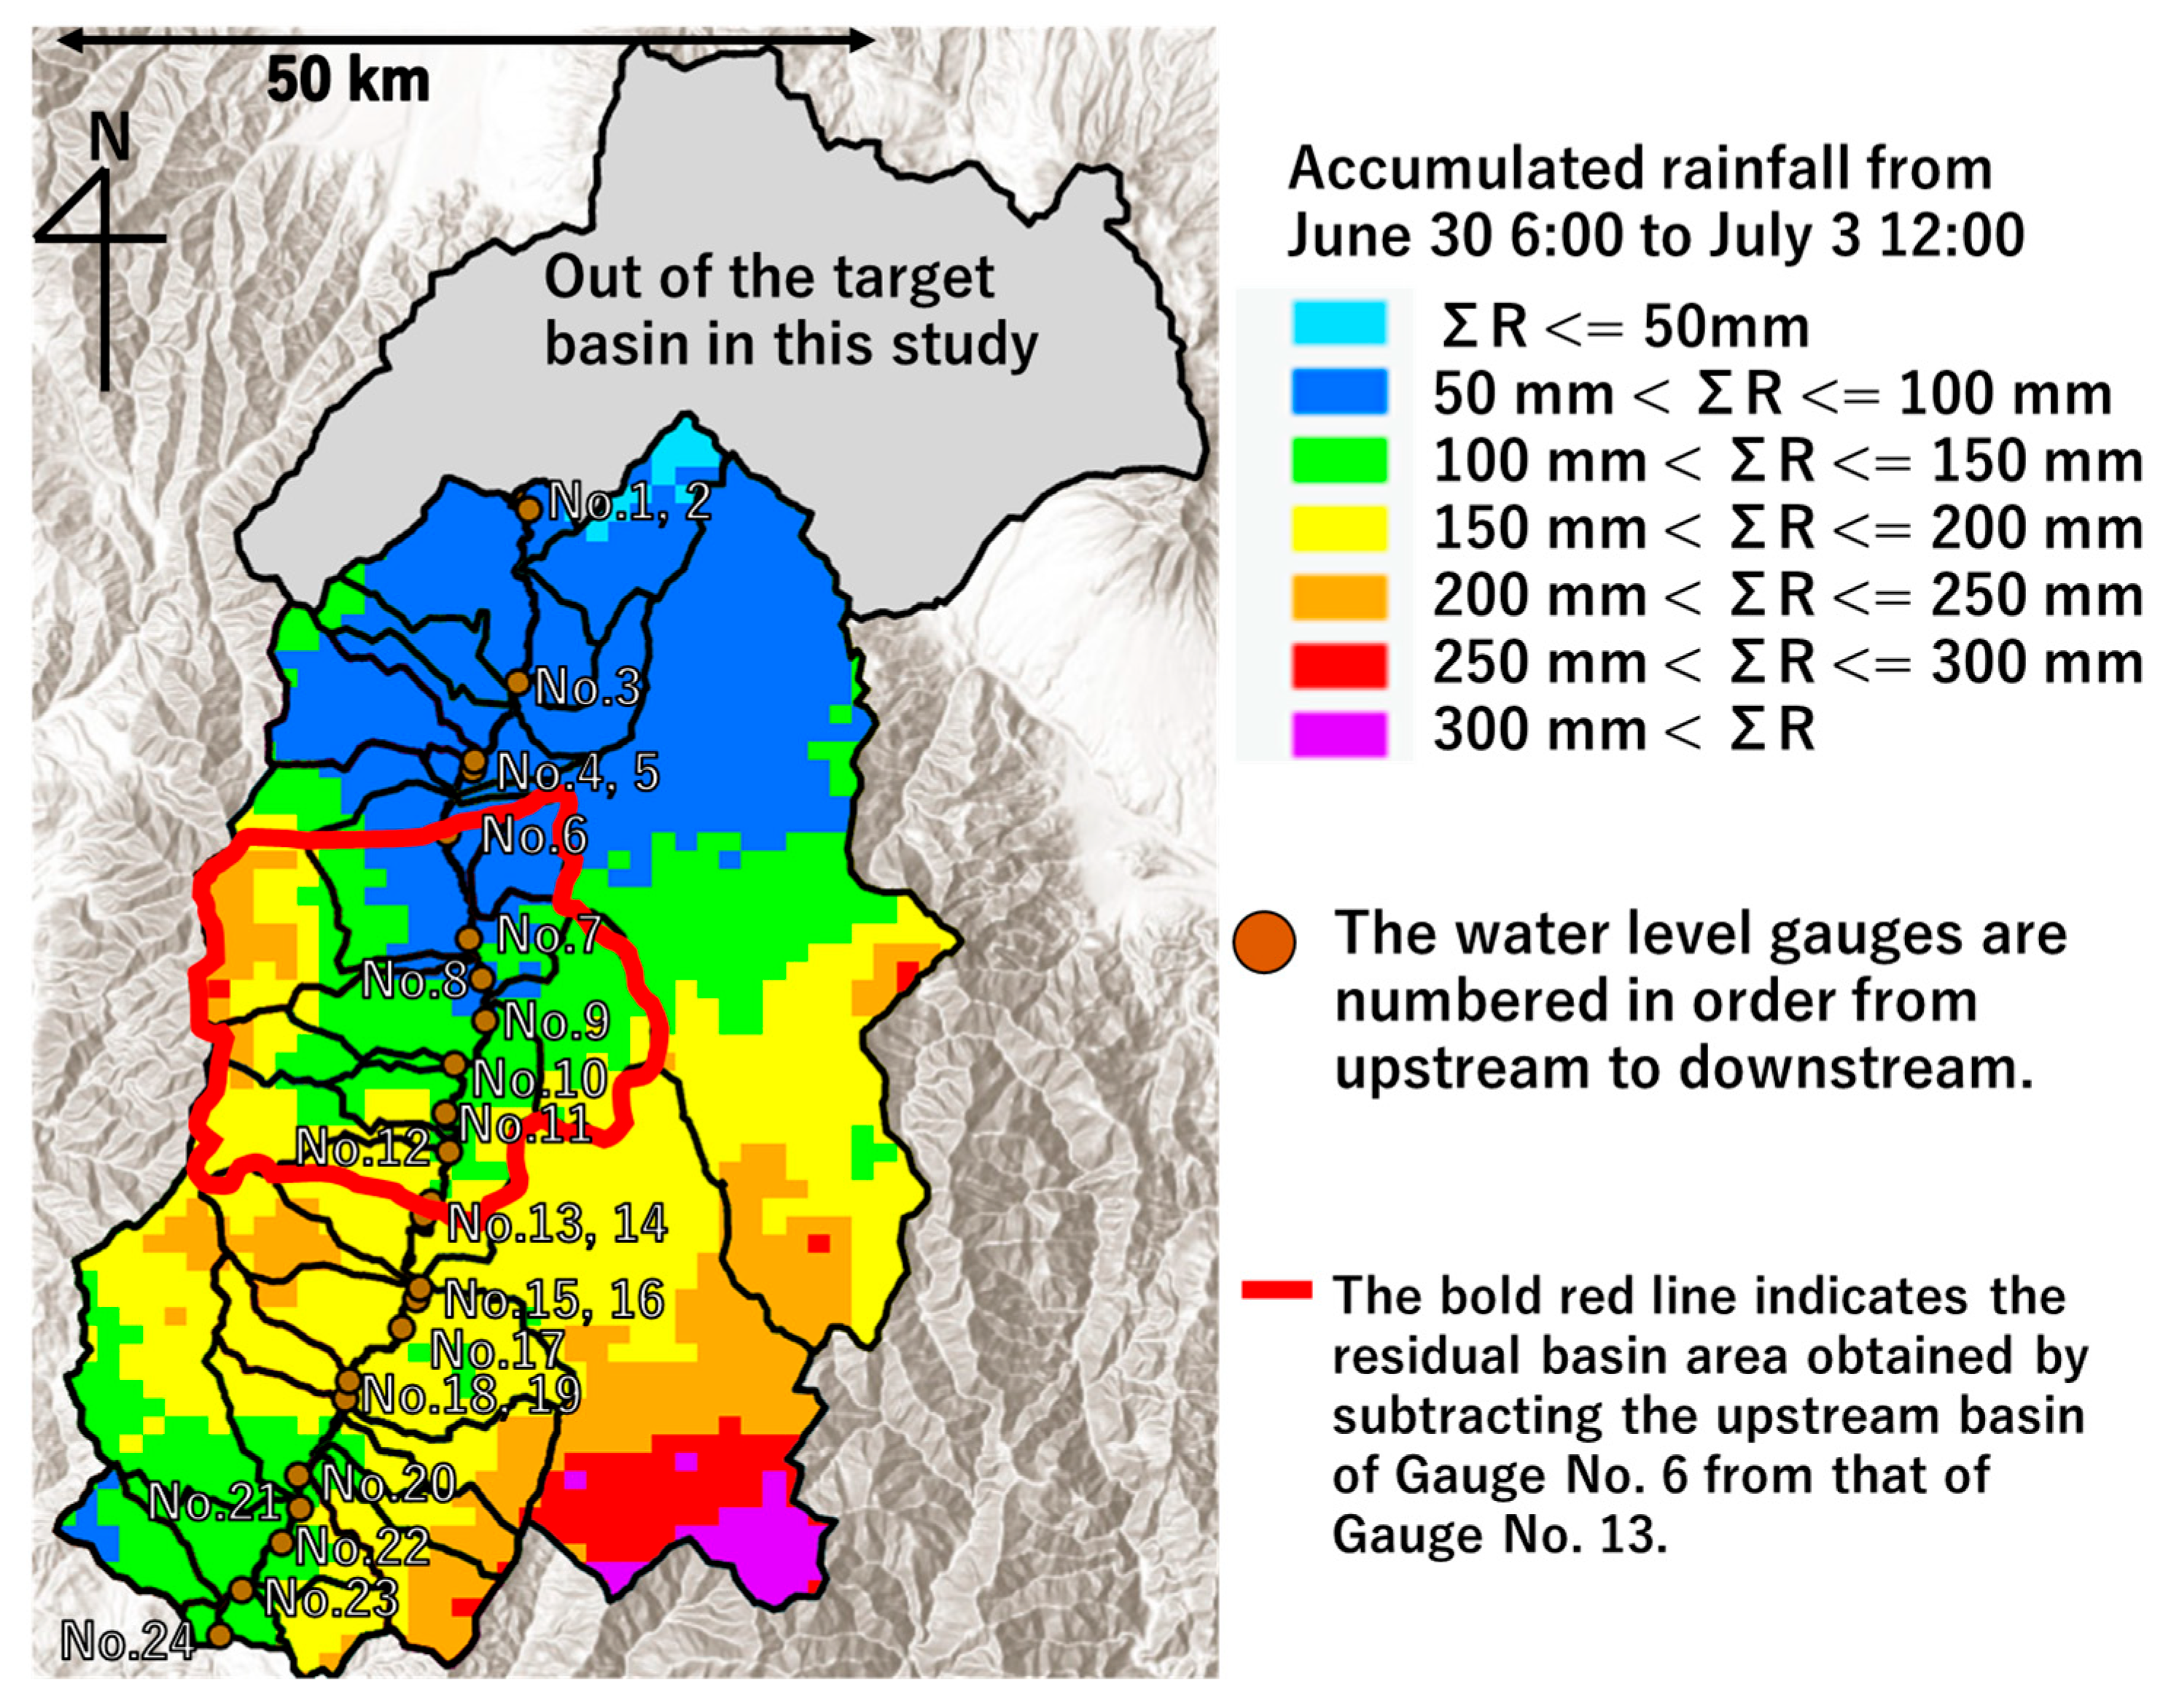
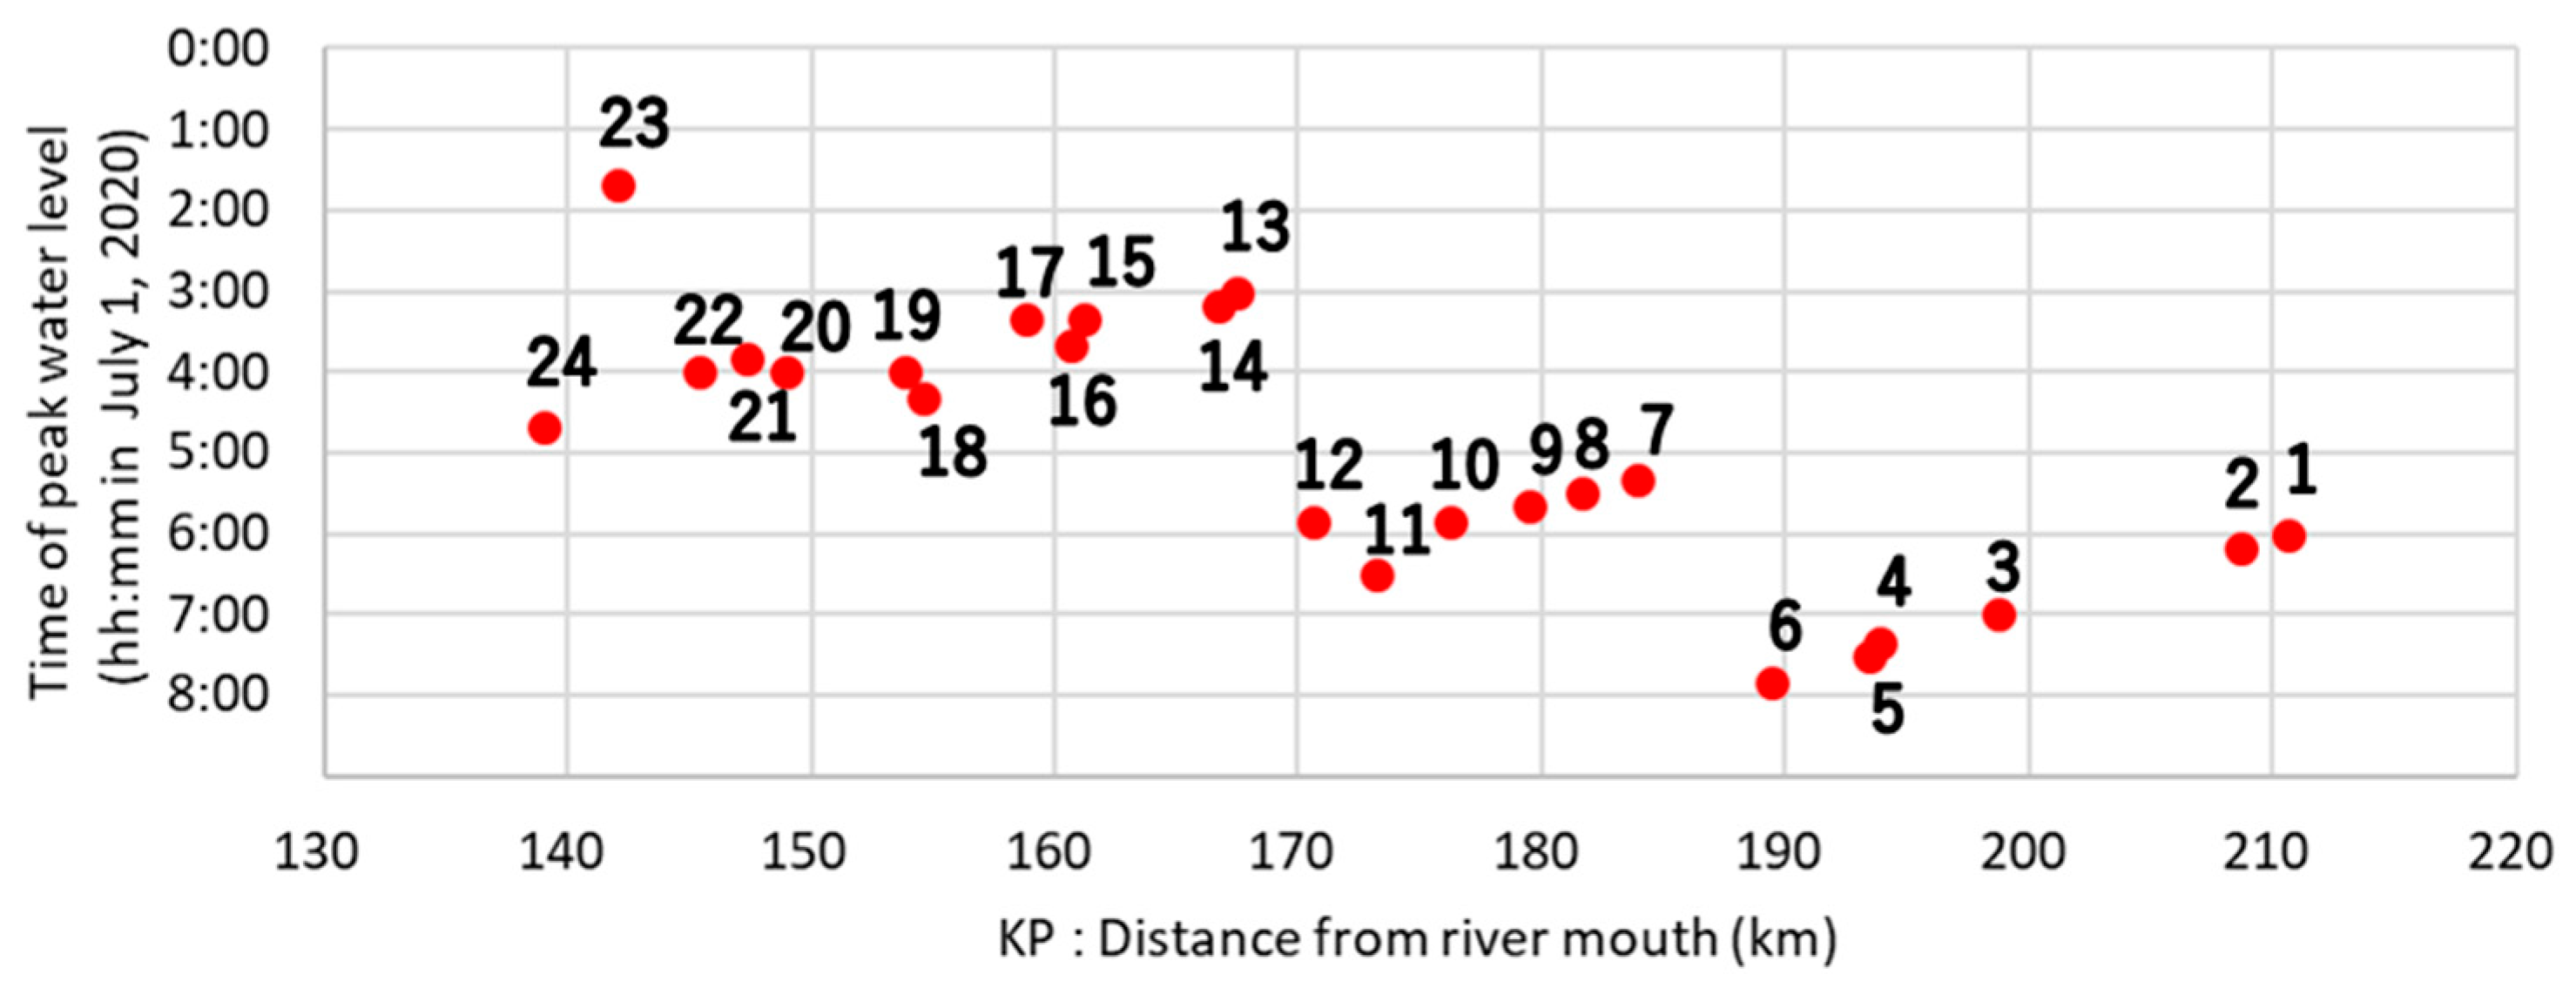
The flood propagation in the main channel is investigated using the observed water level data reported in this section. Figure 10 shows the locations of the 24 water level gauges installed along the main channel. Figure 11 shows the longitudinal positions of the gauges and the corresponding times at which the peak water levels occurred.
In general, when a single flood wave is given from the upstream, the time of the peak typically progresses downstream in sequential order. However, a notable feature in the observed data during this event are the inversions of peak timing around KP170 and KP190, where the downstream gauge recorded its peak earlier than the upstream one. Figure 12 presents the observed water level time series for this segment, indicating that another wave occurred, contributing to the early formation of the downstream peak water level.

4.6. Validation of Two-Dimensional Unsteady Flow Simulation

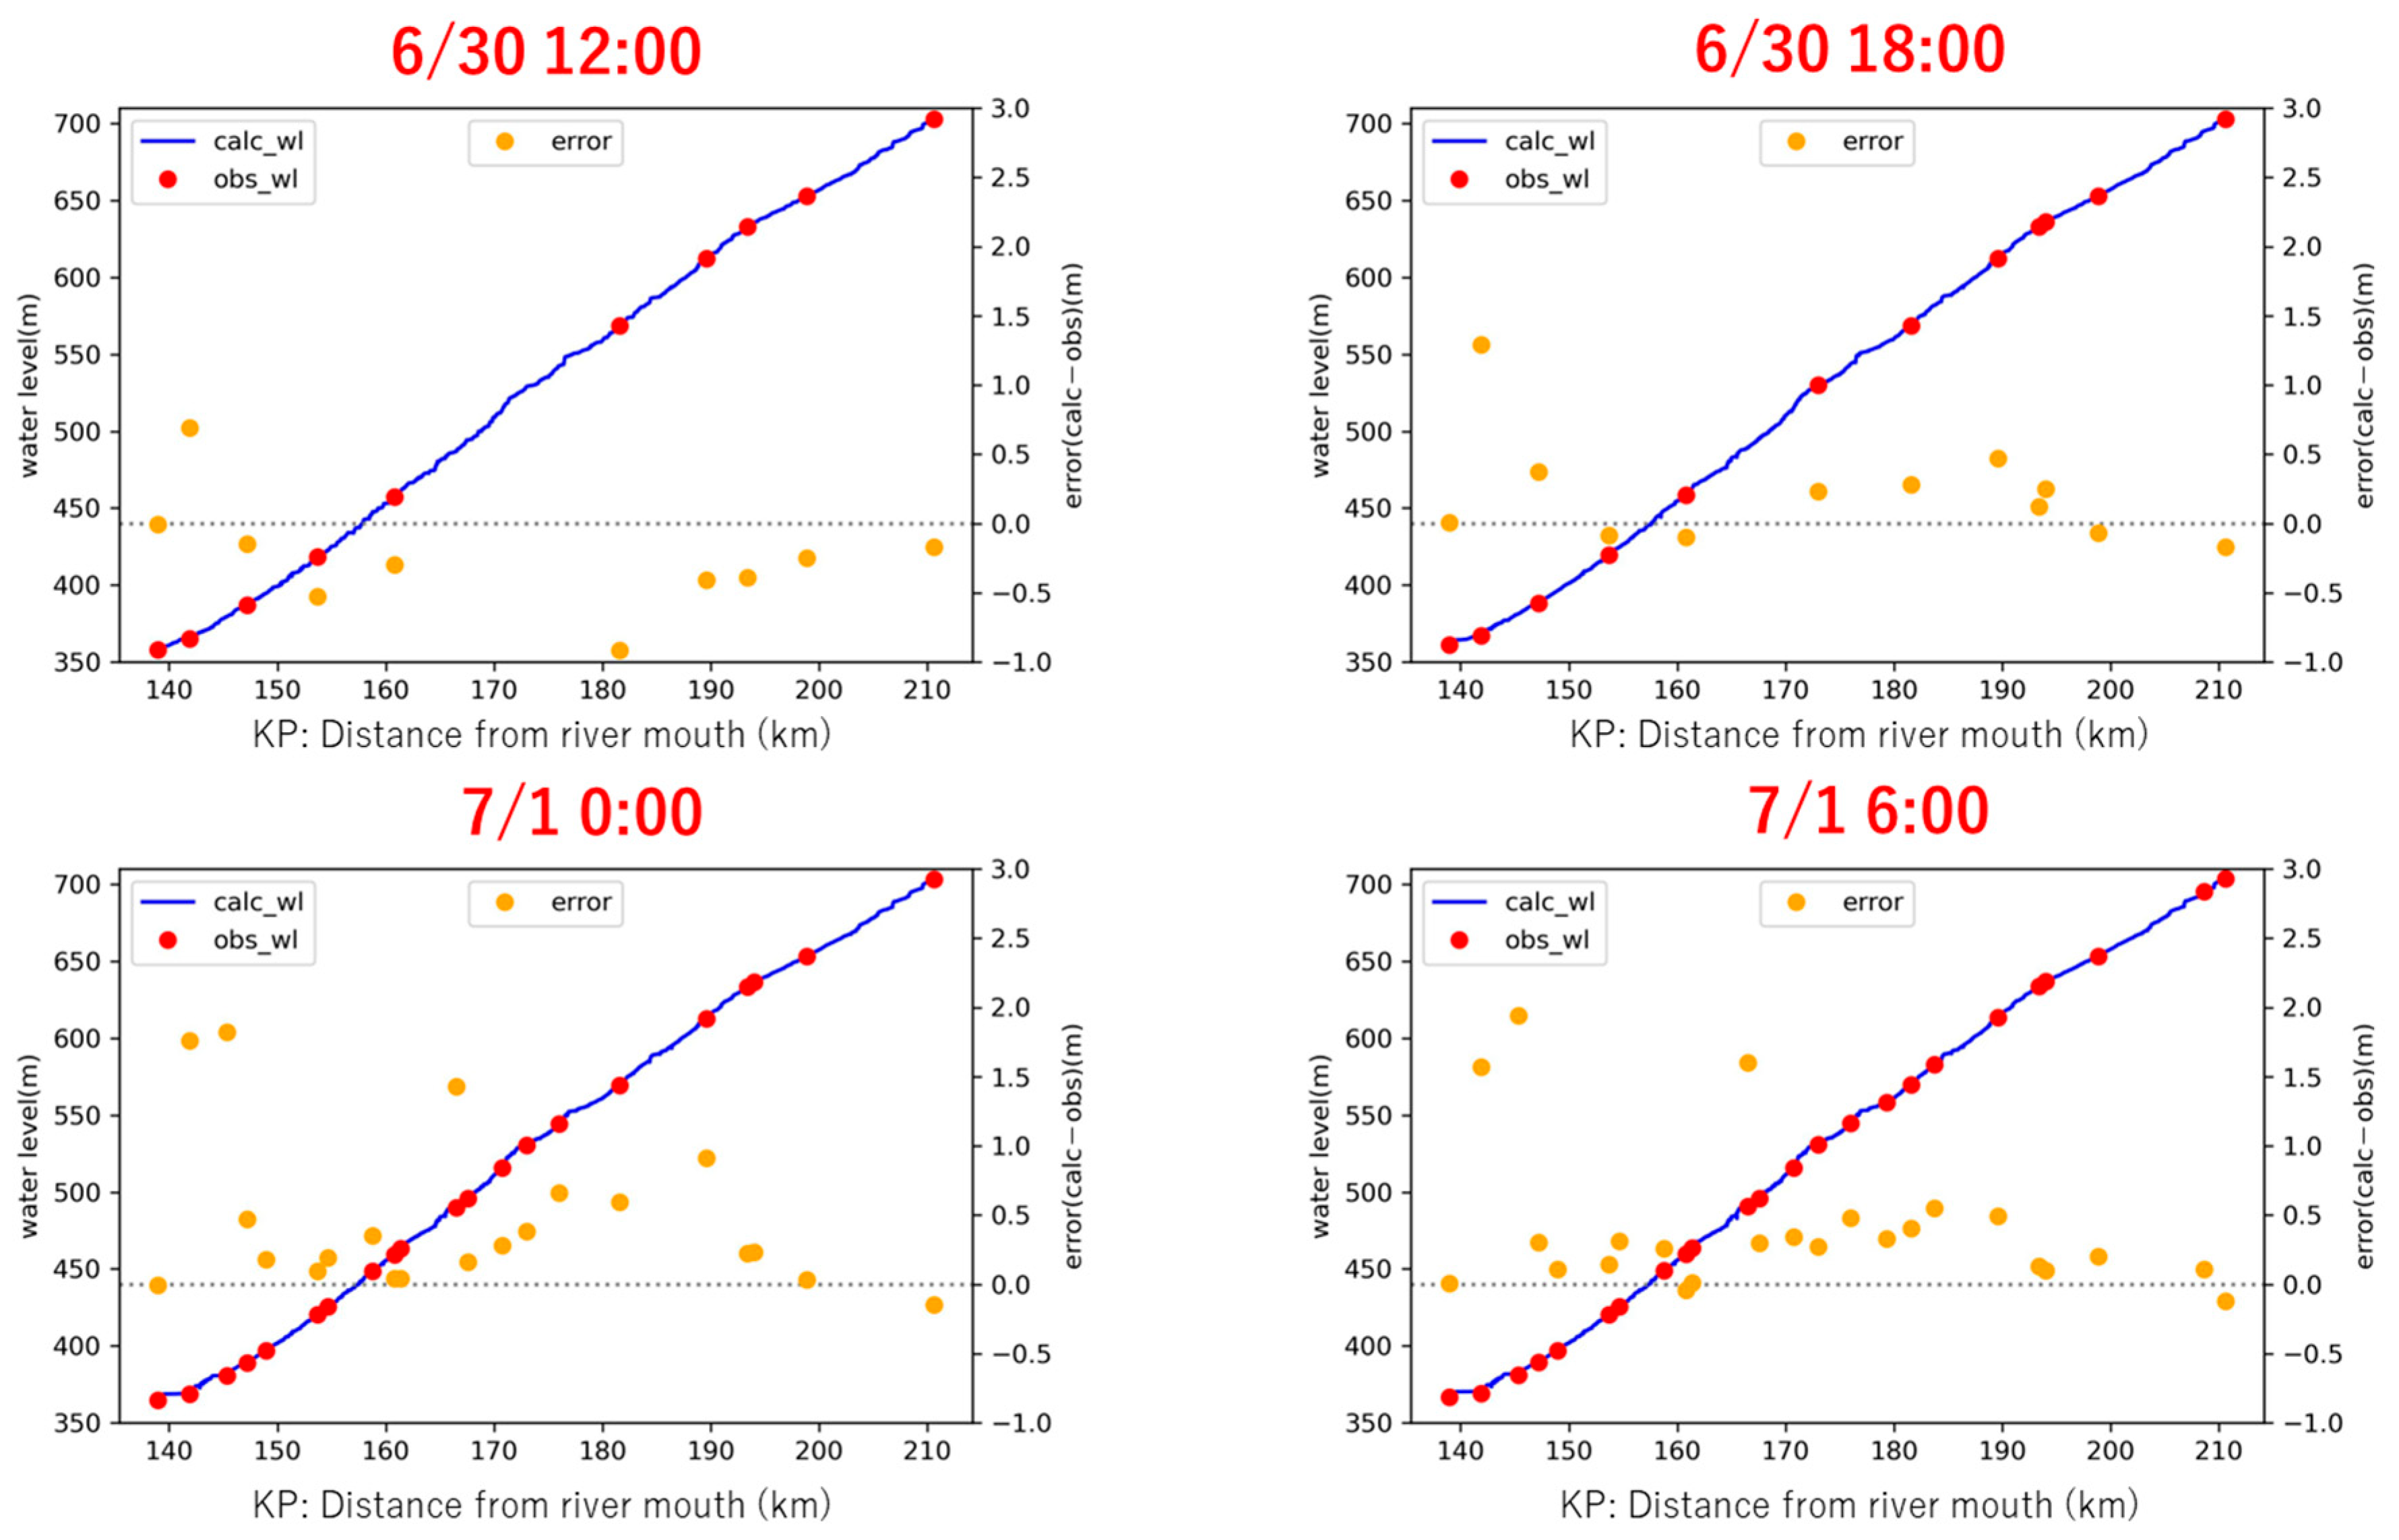
Figure 13 shows a comparison between the water levels calculated by the two-dimensional unsteady flow simulation and the observed water levels at four specific times. These time points (12:00 and 18:00 on 30 June as well as 00:00 and 6:00 on 1 July) correspond to the following stages of the flood: the period before the initial rise in the water level, the beginning of the level rising, the rising phase, and the period near the flood peak, respectively. The number of observation points used for comparison varies across time points because the 3 L water level gauges begin recording only when water levels exceed a predefined threshold specific to each gauge, resulting in fewer records available during the early stages of the flood.
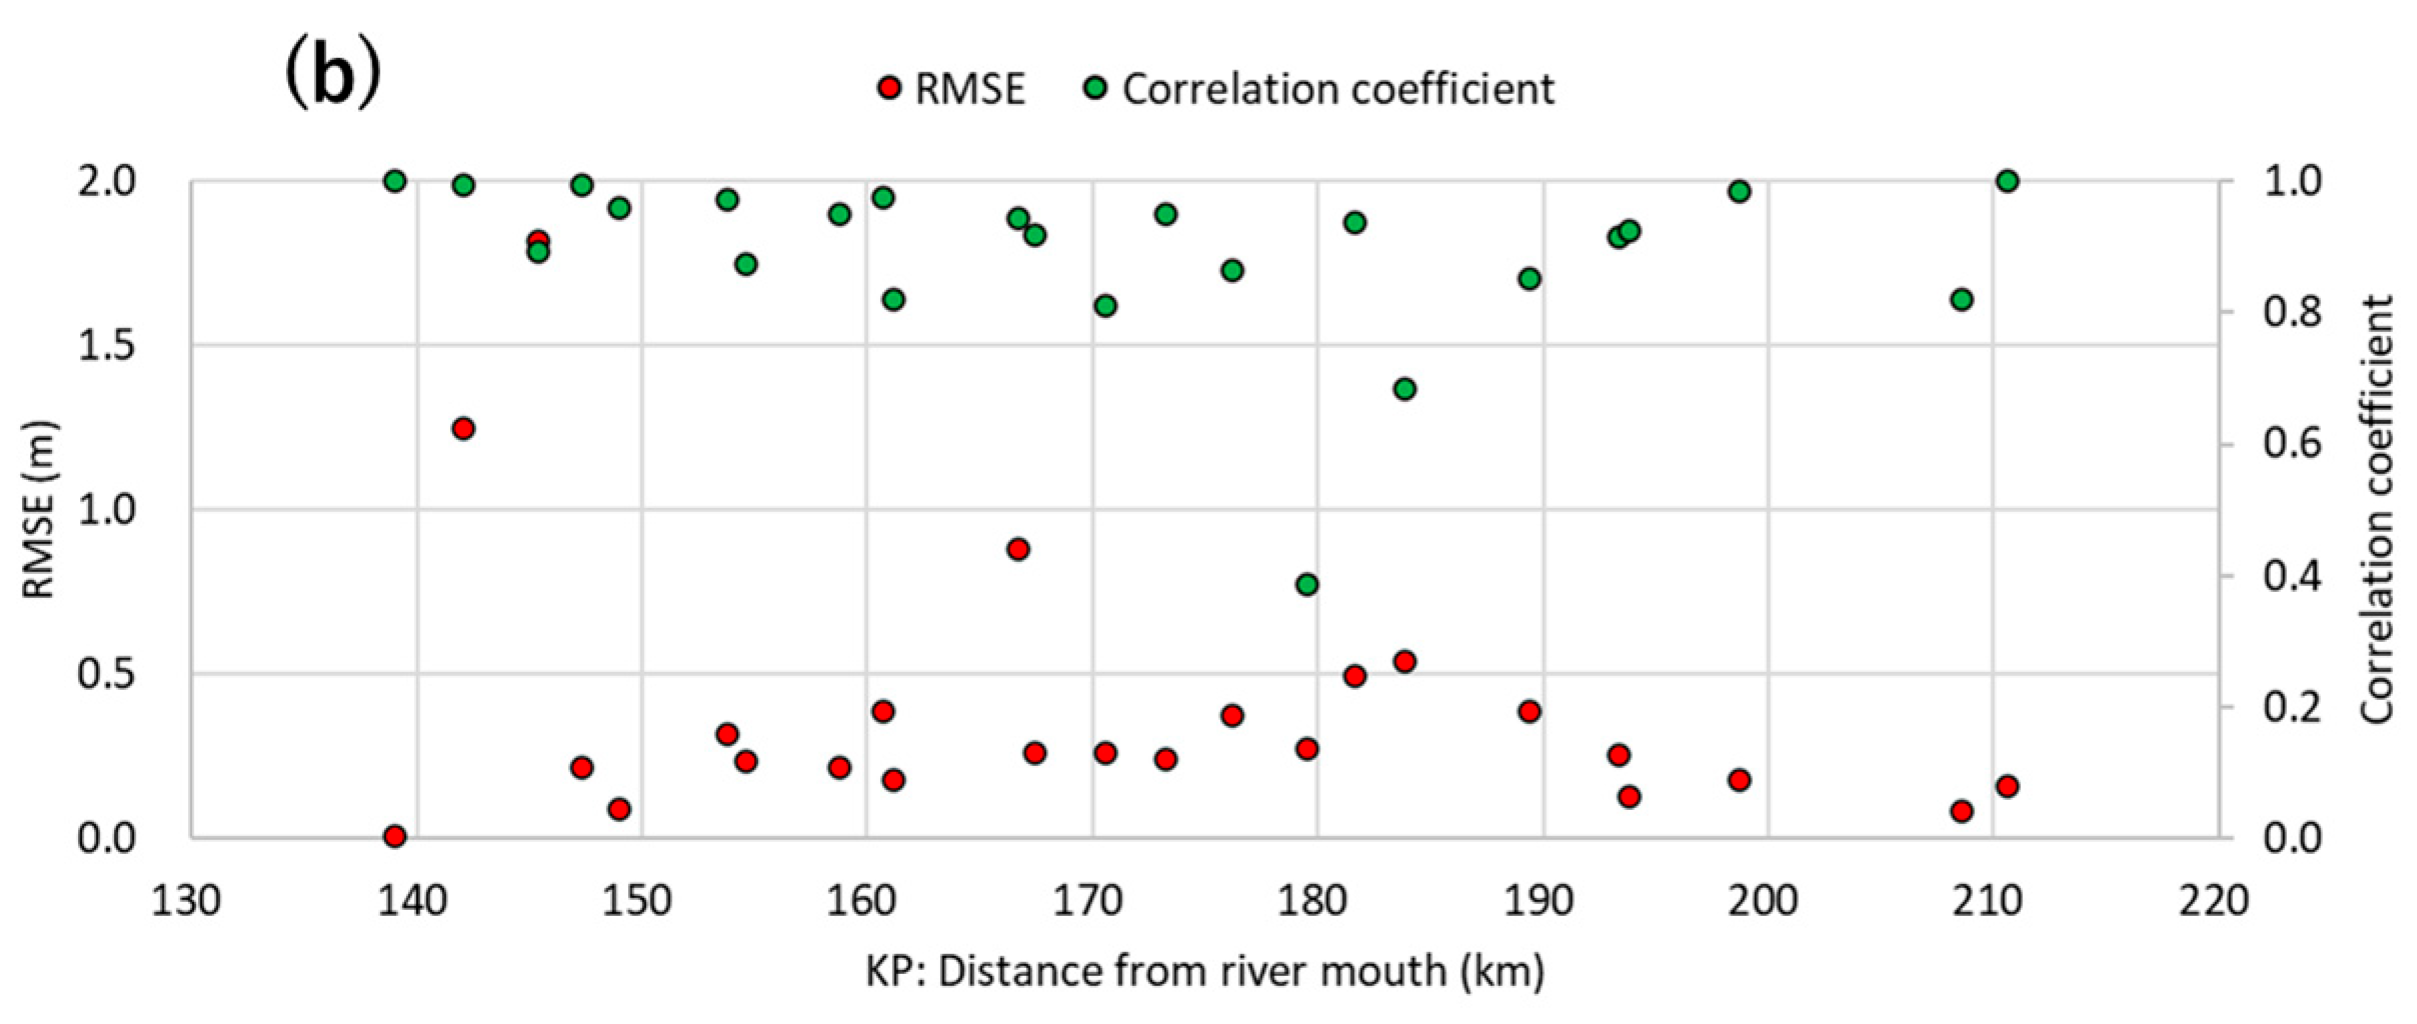
Figure 14a shows the time-averaged difference between the simulated and observed water levels as well as the range in variability represented by the 95th percentile and 5th percentile values. In addition, Figure 14b shows the RMSE and correlation coefficient to present statistical measures.
As shown in Figure 13 and Figure 14a, local errors exceeding 1.0 m occur near KP140 and KP170. Figure 14b also shows that the RMSE of the same points indicates relatively high values. Since the surrounding gauge stations show much smaller errors, these discrepancies may be due to localized river channel conditions such as bed topography changes, requiring further detailed investigation. However, the correlation coefficients at these locations remained sufficiently high. This suggests that the model successfully captured the overall trends in water level rise and recession, which are essential for a robust analysis of flood propagation.
Moreover, at 00:00 on 1 July (Figure 13), the entire section obtained from KP170 to KP190 shows consistently large errors. This suggests that the simulated inflows from tributaries during the rising stage may have been overestimated, rather than the discrepancies being caused by local river channel conditions. Nevertheless, the average error generally remains within 0.5 m, indicating that, overall, the simulation results are in reasonable agreement with the observations.
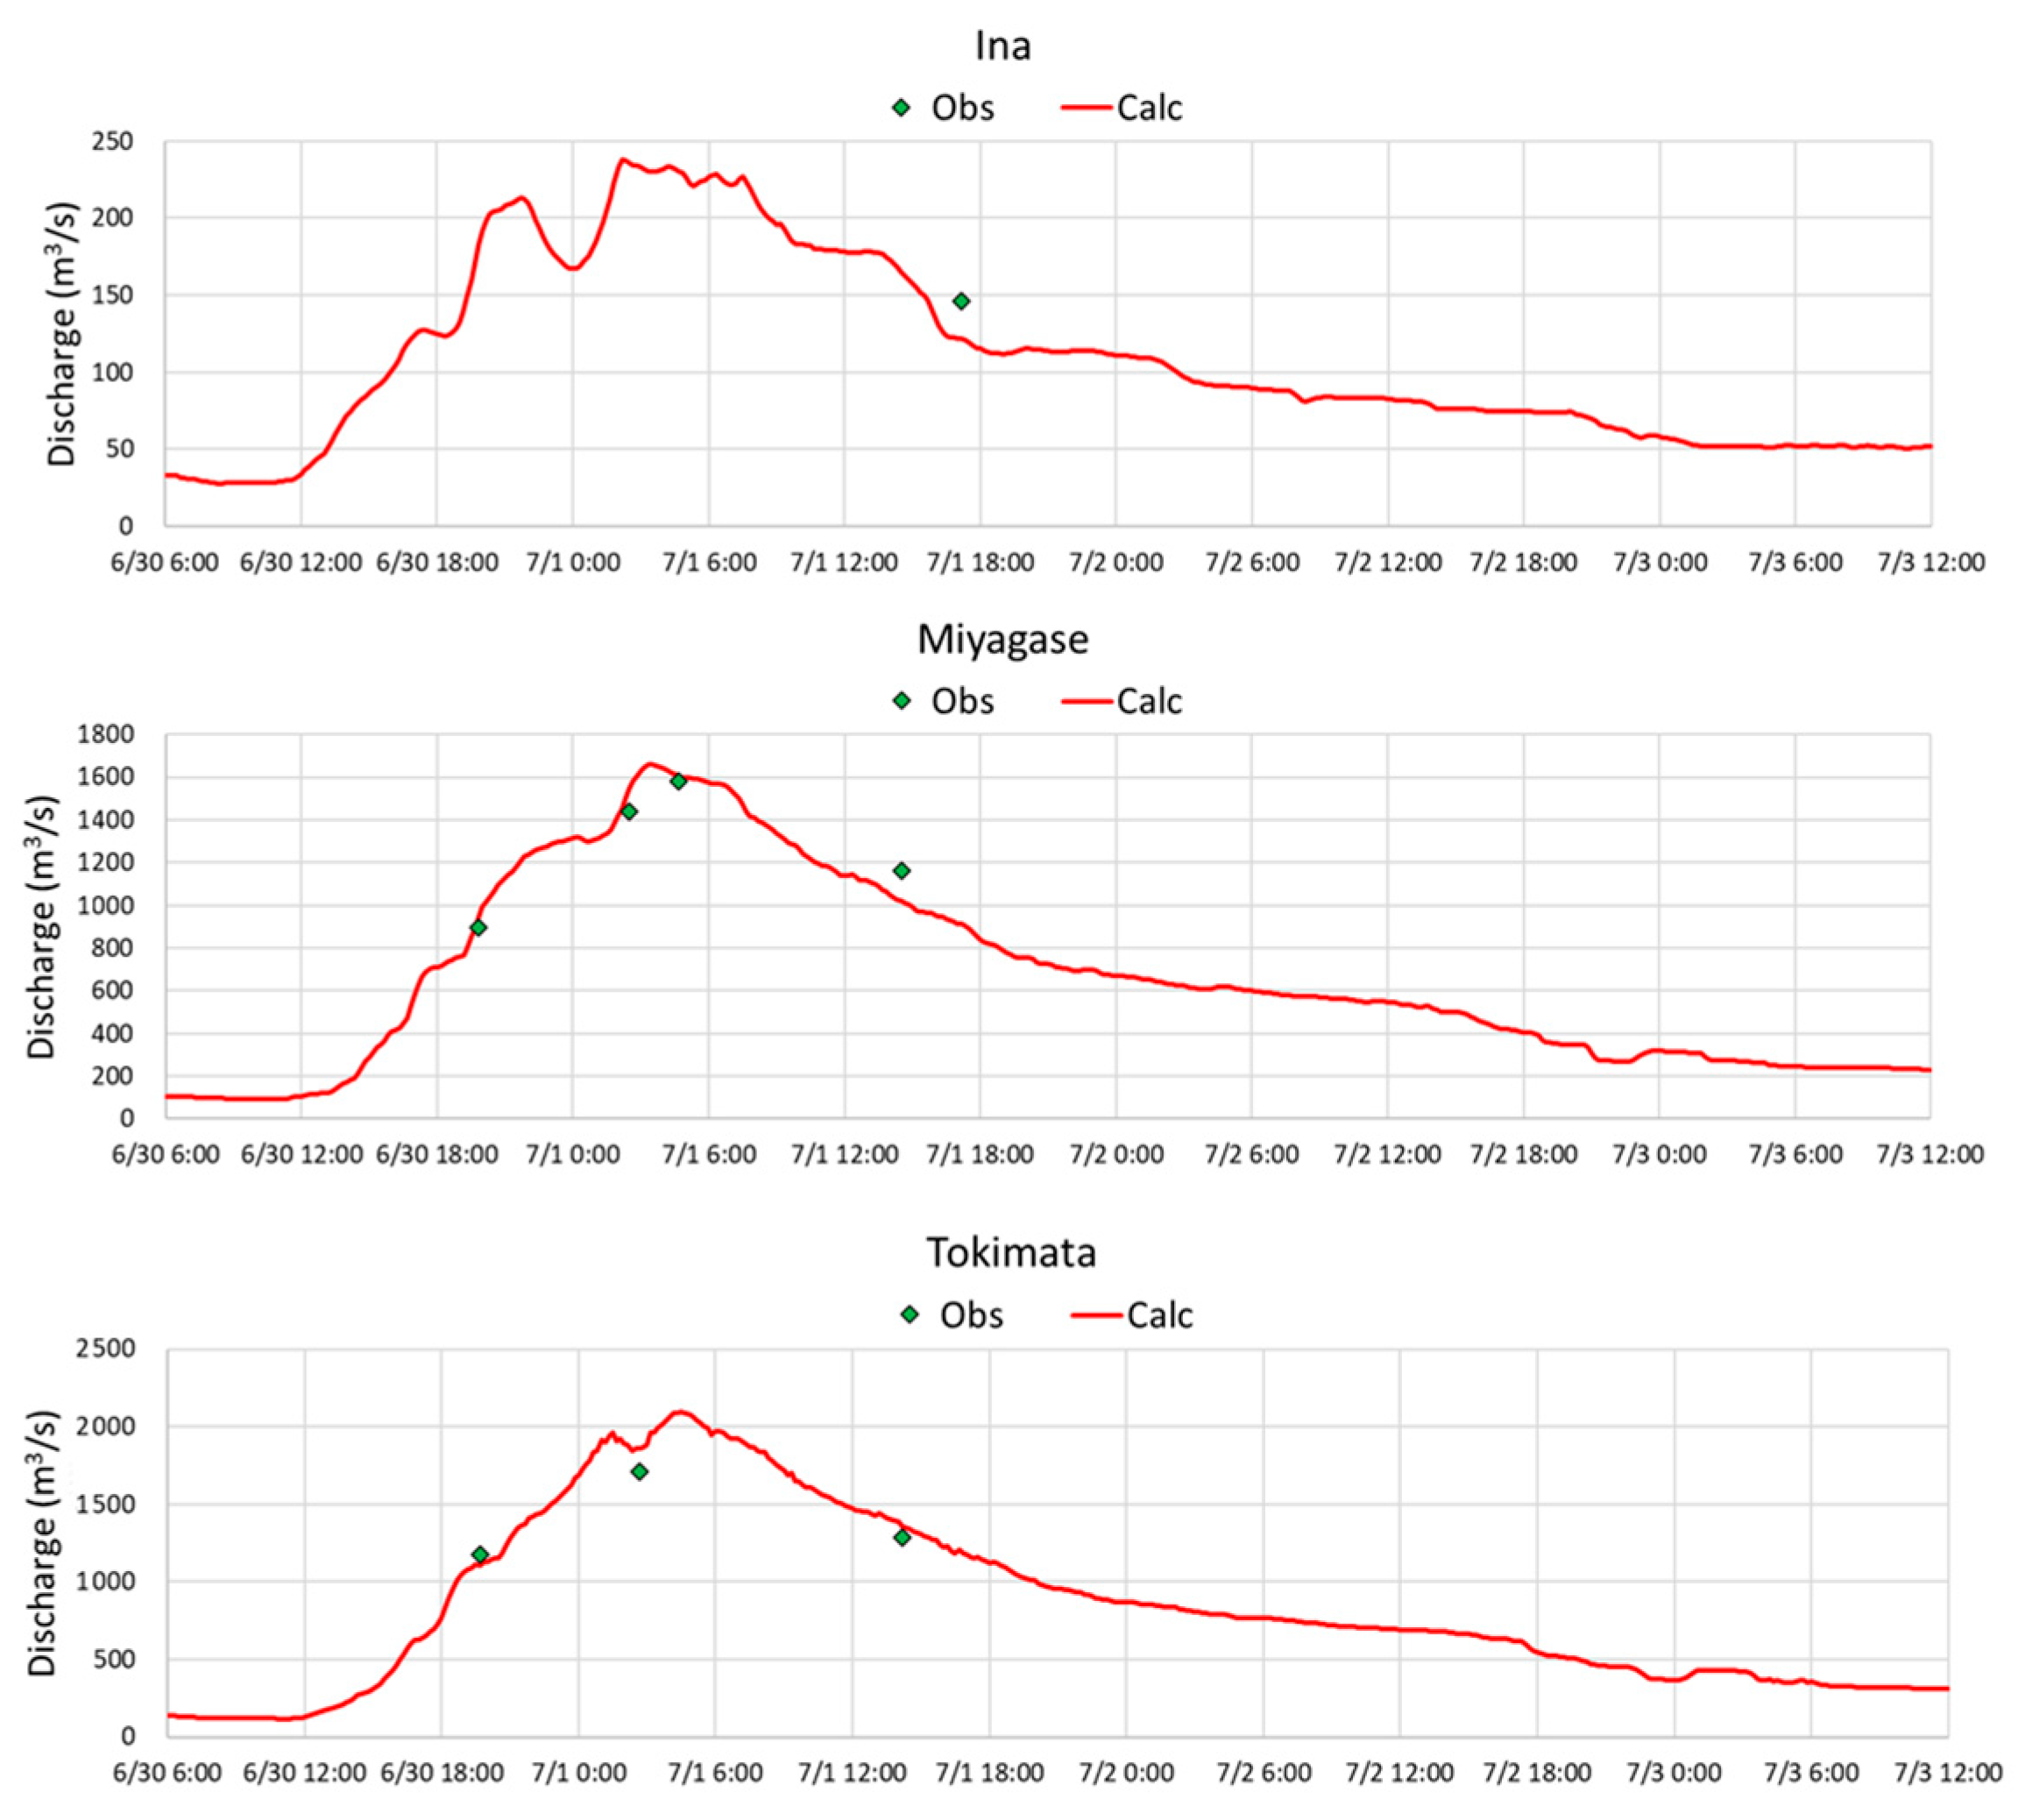
Figure 15 compares the simulated discharge at the three locations with the discharge values observed by float-type measurements during the flood. Although only one float measurement was available for the Ina station during the recession period, it shows good agreement with the simulated result. At the Miyagase and Tokimata stations, the observed and simulated discharges, including at the flood peak, are also in good agreement. On the basis of these comparisons, the simulation results are considered sufficiently accurate for subsequent discussions regarding flood propagation and river channel storage.

4.7. Flood Propagation Based on the Simulation Results

Figure 16 shows the relationship between the simulated peak water level timing and the longitudinal location as well as the observed data. The simulation successfully reproduces the characteristic reversal in the timing of the peak water levels between the upstream and downstream locations. Moreover, the timing of the peak water levels is accurately reproduced in the sections from KP190 to KP210 and from KP140 to KP170. However, in the section between KP170 and KP190, the reversal point of the peak timing appears further upstream in the simulation than in the observations.
It is not possible to estimate the flood wave speed across the entire reach using only observed data because of the complexity in peak timing. However, the numerical simulation enables the temporal–spatial distribution of the hydraulic variables, allowing the estimation and analysis of the flood wave speed throughout the domain. The wave speed at each cross-section was calculated using the following kinematic wave approximation equation [Equation (18)] [24]:
ω = d Q d A     ,
where ω is the wave speed, Q is the discharge, and A is the flow cross-sectional area.
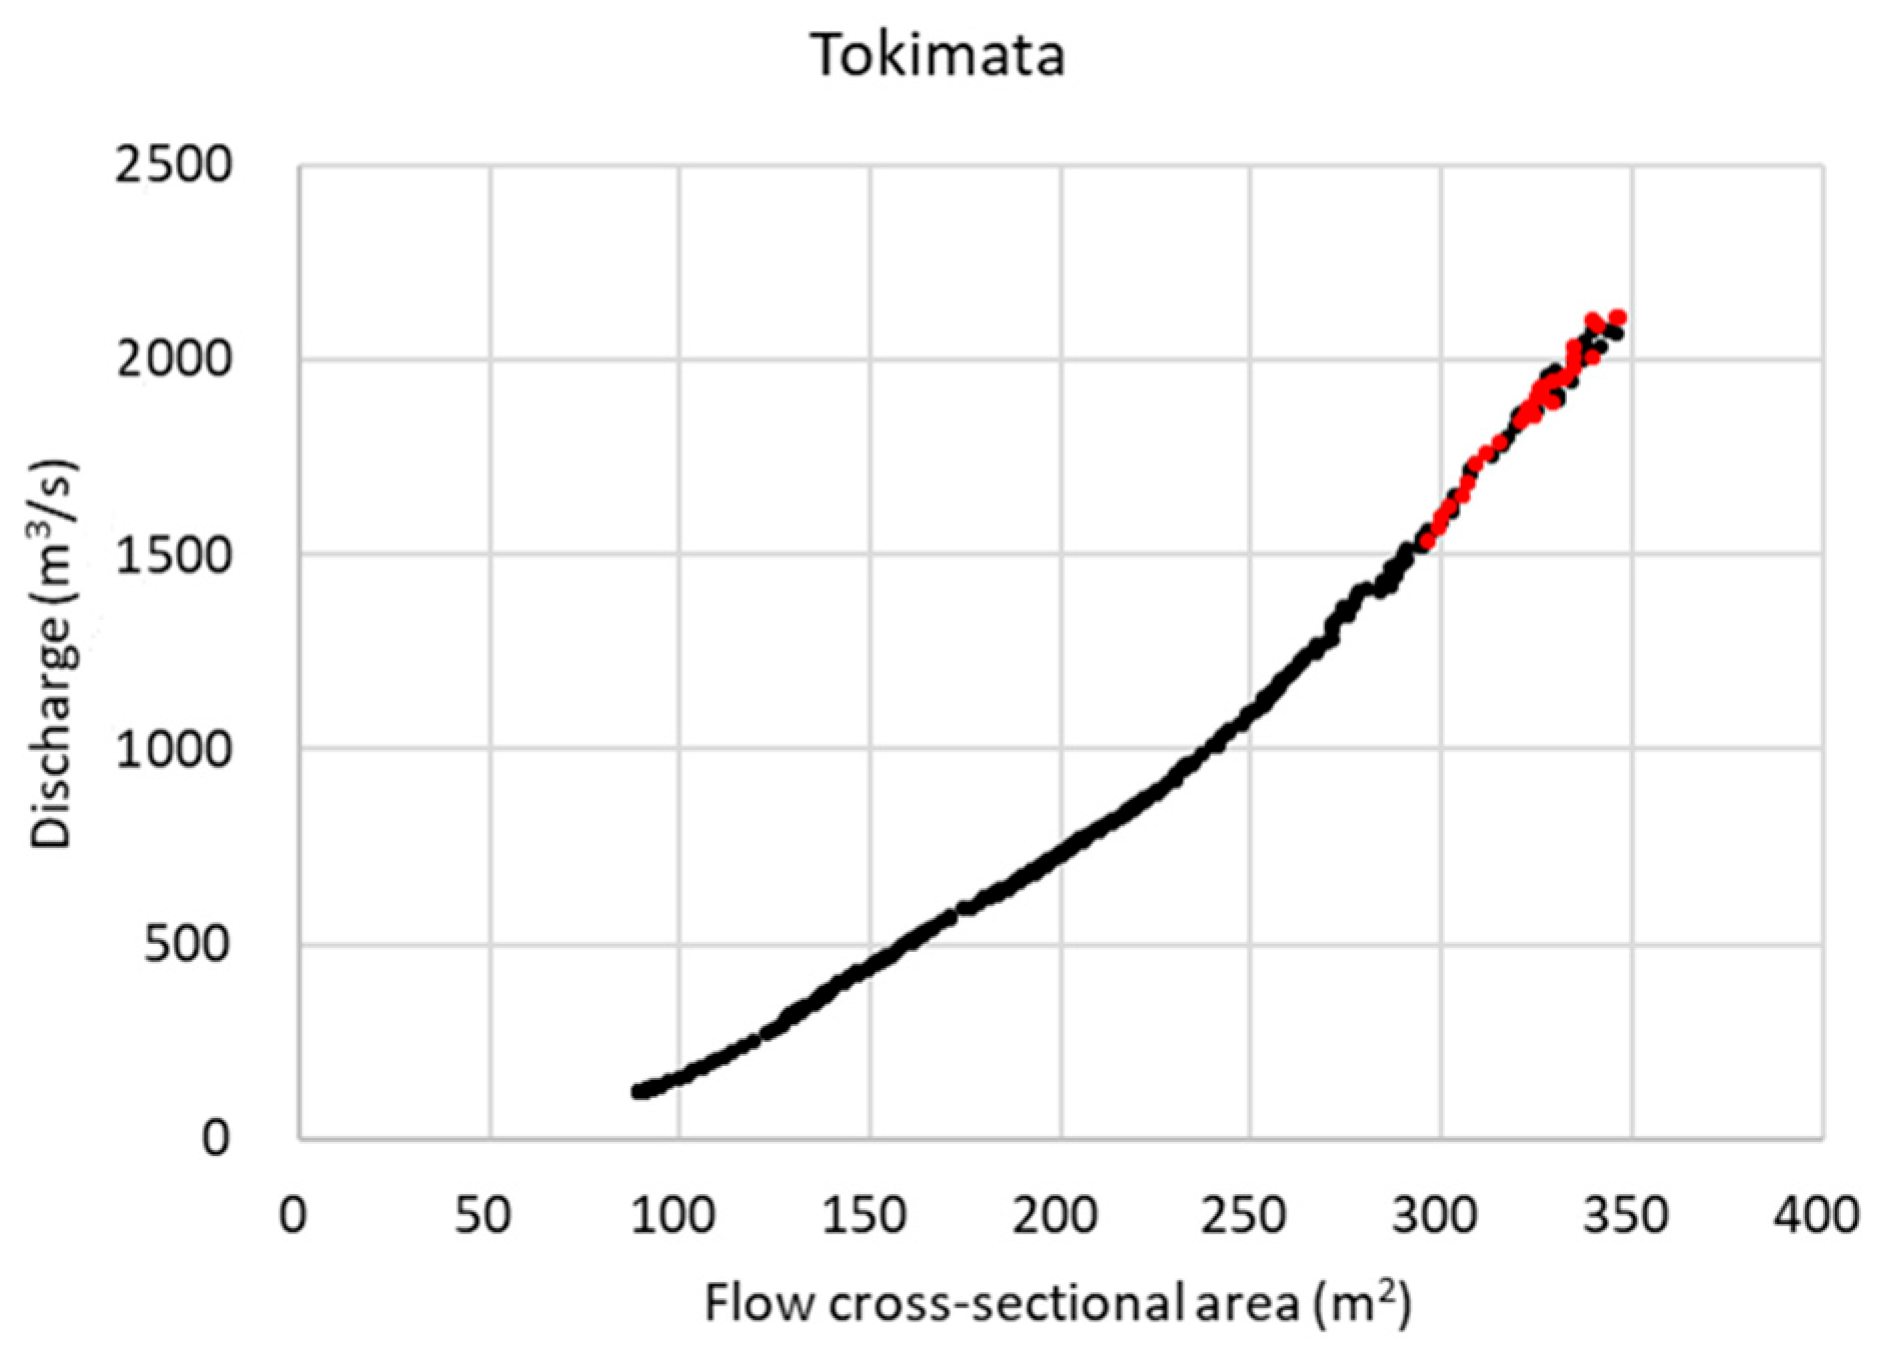
Figure 17 shows an example for the Tokimata station, highlighting the relationship between the discharge and flow cross-sectional area over the entire simulation period. Among the time steps before the flood peak, the top 25% of the discharge and the corresponding flow cross-sectional area are indicated by red dots. The slope of a linear regression fitted to these red dots was used to estimate the wave speed. This procedure was applied at each cross-section throughout the main channel.
Figure 18 shows the longitudinal distributions of the wave speed derived by the above procedure, the cross-sectional average velocity, and the wave speed to the average velocity ratio ( α ). The upper Tenryu River is characterized by a complex channel geometry with frequent meandering, contractions, and expansions, resulting in considerable variability in wave speed, average velocity, and the α along the river course.

4.8. Investigation of River Channel Storage

Figure 19 shows the inflow volume from the tributaries and the upstream boundary into the main channel and the corresponding river channel storage over the entire target reach of the main channel.
River channel storage is defined in Equations (19) and (20), as follows:
d S d t = Q i n _ i Q o u t ,
S = T o T d S d t d t ,
where S is the river channel storage (m3), Qin_i is the inflow discharge from the upstream boundary of the target reach or from the tributary (m3/s), Qout is the outflow discharge from the downstream of the target reach (m3/s), T is the integration time, and T0 is the initial time.
For comparison, Figure 19 also includes the time series of the basin storage of the entire target basin, which is identical to that shown in Figure 9. The method of graphical representation in Figure 19 was inspired by the “graphical representation of storage water volume distributions” [13].
Figure 20 shows river channel storage longitudinally distributed in 1 km segments to show their spatial variations. Although river channel storage varies over time, the values shown represent the maximum storage recorded for each segment. The results reveal two distinct locations (near KP140 and KP143) with exceptionally large river channel storage volumes.

5. Discussion

5.1. Interpretation of Rainfall–Runoff Characteristics

In Figure 5, the Katagiri Dam exhibits a particularly high runoff ratio, whereas the neighboring Matsukawa Dam shows a moderate value. This suggests that the source area [25] in the Matsukawa Dam basin does not extend across the entire catchment, particularly not into the downstream region, leading to a less pronounced runoff ratio. As an example of a study on rainfall–runoff characteristics under conditions of geological heterogeneity, with a focus on the spatial continuity of soil moisture, the following can be cited. Lehman et al. [26] modeled and analyzed flow path connectivity, demonstrating the importance of its role in hillslope outflow. The contrasting runoff ratios observed at Katagiri Dam and Matsukawa Dam in this study can also be interpreted from the perspective of the spatial continuity of soil moisture conditions.
On the other hand, the cumulative rainfall in the Koshibu Dam basin exceeded 150 mm across the entire catchment. This was similar to the rainfall observed in the Katagiri Dam basin. Nevertheless, the runoff ratio in the Koshibu Dam basin remained moderate. This result is considered to reflect differences in the geology of the two basins. As shown in Figure 1c, the Koshibu Dam catchment is predominantly underlain by consolidated and partially consolidated sediments. This geological characteristic possibly contributes to greater basin storage within the Koshibu Dam catchment. This interpretation is in good agreement with findings from previous studies conducted in the upstream reaches of the Koshibu River, which reported a strong tendency to moderate runoff in this area.
As shown in Table 2, the dm value of the RRI model is relatively large for consolidated and partially consolidated sediments, indicating a greater tendency for water storage within the basin. This is in good agreement with both previous research findings and the observed data analysis, which supports the discussion above and the simulation results.
The following discussion will address the rainfall–runoff relationships at the scale of individual tributaries.
While the runoff ratios are high in the Otagiri, Nakatagiri, and Katagiri-Matsukawa Rivers, as shown in Figure 7, a high peak-specific discharge is observed only in the Otagiri River, as shown in Figure 8. No major differences were observed among these three basins in terms of cumulative rainfall, geology, or drainage area.
The time series of the basin-averaged rainfall and discharge from each tributary were investigated (Figure 21) to further understand the differences in the runoff characteristics of the Otagiri River, Nakatagiri River, and Katagiri-Matsukawa River during the flood event. For the Nakatagiri River, a temporary pause in high-intensity rainfall was observed, and the corresponding runoff exhibits a double-peak pattern. For the Katagiri-Matsukawa River, a high-intensity rainfall concentrated within a single hour was observed. In contrast, for the Otagiri River, high-intensity rainfall that continued for four hours was observed. The effect of rainfall duration on the peak discharge has been widely discussed [27,28,29]. In the case of the Otagiri River, the approximately four hours of intense rainfall at the scale of the basin considerably contributed to its exceptionally high peak discharge.
In this study, the focus was on the scale of dam basins and tributary basins. As a result, most of these basins contain multiple geological types, making a detailed analysis according to individual geological categories difficult. Although a separate analysis for each geological type has not been conducted, the presented results provide valuable insights at a scale relevant to basin-wide flood management.

5.2. Comprehensive Understanding of Flood Propagation

At the beginning of this section, the inversions of peak timing around KP170 and KP190, as shown in Figure 11, were discussed. The red bold line in Figure 10 shows the catchment boundary inflow contributing to the section between the gauges where the timing inversion was observed.
Within this catchment, the cumulative rainfall sharply increases toward the downstream area, likely causing tributary inflows to strongly influence the flood propagation in the main channel. This suggests that the timing inversion is caused by inflows from the tributaries.
To understand flood propagation as much as possible based on the available observed water level data, attention is focused on the upstream region above KP190, where the influence of the tributary is relatively small. The wave speed estimated based on the longitudinal gradient of the peak timing was approximately 3.3 m/s.
However, downstream of KP190, it was not feasible to determine the wave speed solely from the observed water level data. Therefore, the result of the two-dimensional unsteady flow simulation was used to capture flood propagation across the entire target river reach, as shown in Figure 18. The average wave speed in the KP190–210 section was 3.3 m/s, which is the same value as estimated from the longitudinal gradient of peak timing based on the observed water levels.
Under the assumptions of a uniform rectangular cross-section, the kinematic wave approximation, and the Manning equation, α typically is 1.67, and more complex channel geometry tends to reduce α [30]. In the present analysis, although α shows considerable longitudinal variability, it remains below 1.67 in most parts of the reach. The average α value over the 70 km study reach was 1.38, quantitatively indicating the delay effect on flood propagation due to the complex morphology of the Tenryu River.

5.3. Quantitative Discussion of Basin Storage and River Channel Storage

Figure 9 enables the quantification of the contribution of each tributary basin to overall basin storage in response to external rainfall forcing, allowing the evaluation of the relative roles of individual tributaries within the broader context of basin-wide flood risk management. To discuss the interpretation regarding basin storage more deeply, Figure 22 shows the time series of the ratio of basin storage to accumulated net precipitation for the entire study basin. Immediately after the beginning of the rainfall, more than 90% of the precipitation was temporarily stored. With the decrease in rainfall intensity, basin storage reached its peak at 3:00 on 1 July, with a storage ratio of approximately 70%. Thereafter, the stored water gradually flowed into the main channel, and the storage ratio decreased accordingly. By the end of the analysis period, approximately 20% of the net precipitation remained stored in the basin. Thus, this method allows for a quantitative evaluation of basin storage throughout the different phases of the flood.
To further assess the contrasting storage characteristics of the right- and left-bank tributaries, a time series of the ratio of basin storage to accumulated net precipitation for each group of ten tributaries was obtained (Figure 23). In the right-bank tributaries, the ratio decreases sharply after its peak, while the left-bank tributaries show a more gradual decrease. For example, the duration during which the storage ratio remained above 80% was approximately 9 h and 10 min in the right-bank group, whereas it was approximately 16 h and 30 min in the left-bank group, which is approximately 1.8 times longer. These results clearly quantify the differences in the storage behavior of the two sides of the basin.
In order to clarify the relative relationship between basin storage and river channel storage, the discussion will next address river channel storage.
As shown in Figure 19, maximum river channel storage occurred at 04:10 on 1 July, with a storage volume of 21,000,000 m3, whereas basin storage at the same time was 180,000,000 m3. This indicates that the river channel storage is approximately 12% of the basin storage, quantitatively demonstrating the significance of river channel storage in terms of basin scale.
The following discussion addresses the characteristics of the locations at KP140 and KP143, where the river channel storage shown in Figure 20 is exceptionally large.
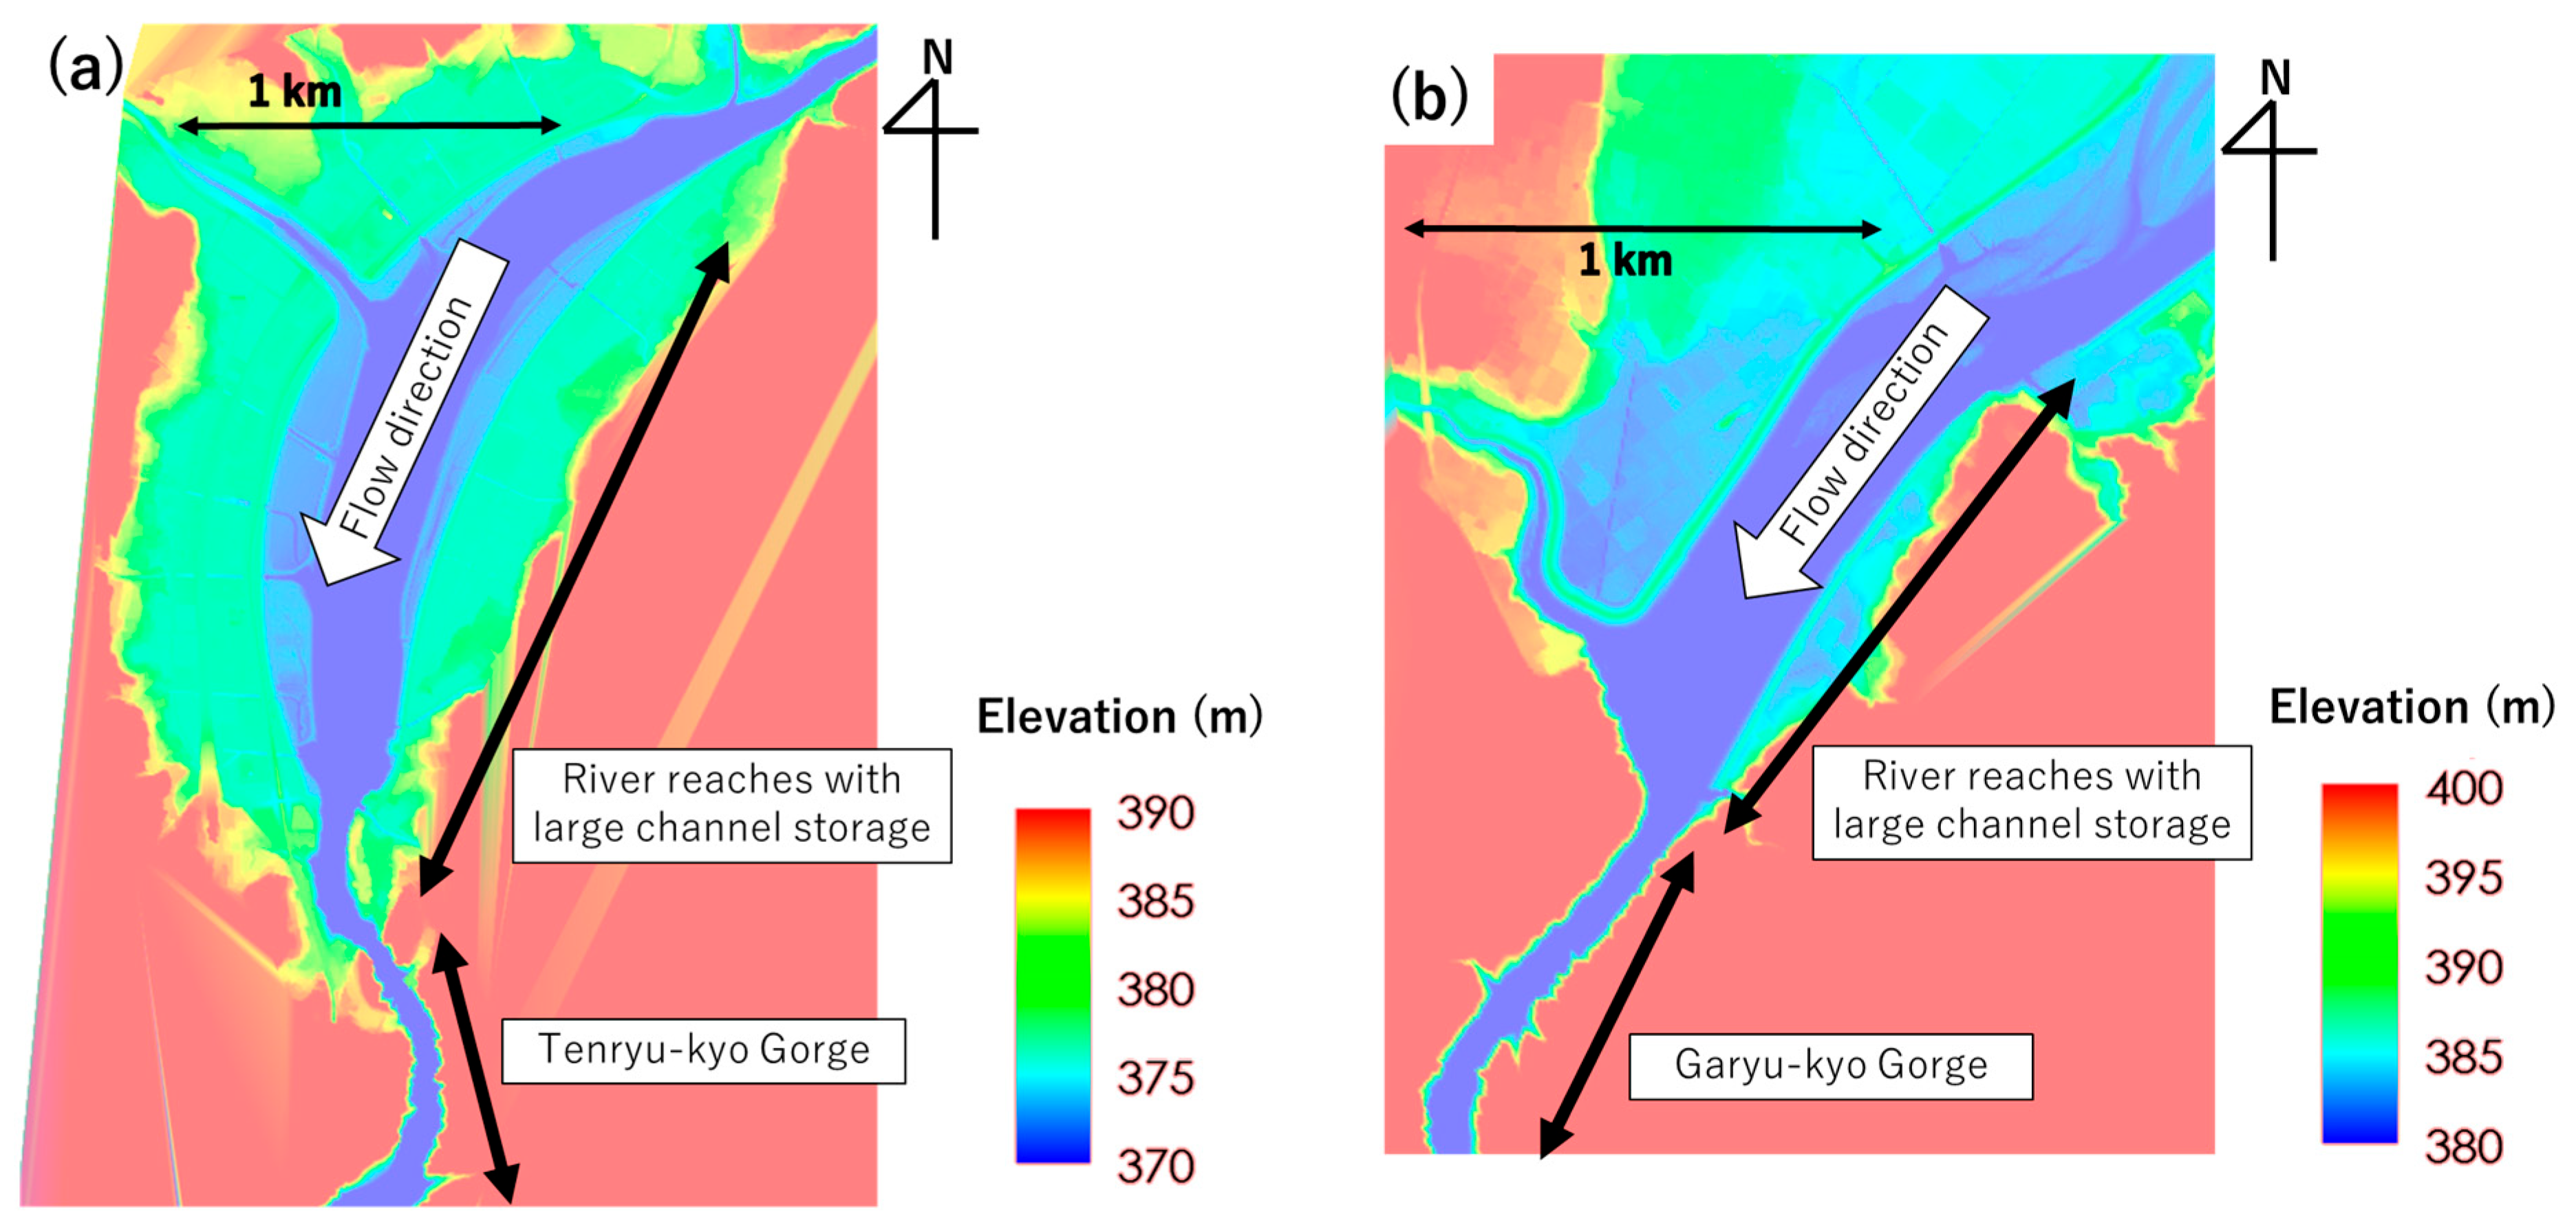
Figure 24 provides the plan views of these specific locations. The area near KP140 corresponds to the area upstream of the Tenryu-kyo Gorge, whereas KP143 is located upstream of the Garyu-kyo Gorge. Both are characterized by local channel widening upstream of the narrow gorge sections. Figure 25 shows the total river channel storage across the entire target reach, along with the respective contributions from the upstream sections of the Tenryu-kyo and Garyu-kyo Gorges. While the whole reach extends for 71,620 m and the combined length of the upstream of the gorges is 5130 m (approximately 7% of the total reach), their combined river channel storage is 5,000,000 m3, accounting for approximately 22% of the total river channel storage (21,000,000 m3). This quantitatively highlights the substantial contribution of these sections to river channel storage.
The storage volumes of these gorge sections are compared to the capacities of the artificial flood control facilities within the basin. Flood control operations were conducted at the Miwa Dam and the Koshibu Dam during the flood event, indicating maximum flood storage volumes of approximately 2,000,000 and 6,500,000 m3, respectively. Thus, the combined river channel storage (5,000,000 m3) in the upstream sections of the Tenryu-kyo and Garyu-kyo Gorges is therefore comparable to the storage capacities of these dams.
At the end of this section, the relative timing of basin storage, river channel storage, and dam storage is presented. The peak of basin storage occurred at 3:00, while the peak of river channel storage appeared at 4:10. These peaks are essentially determined by the topographic and geological characteristics of the basin and cannot be drastically controlled. On the other hand, the peak storage of the Koshibu Dam in this event occurred at 14:10, which quantitatively indicates that storage was maintained for an extended period through artificial operation.

5.4. Discussion Regarding Simulation Errors and Limitations

At the beginning of this section, a discussion is provided on water level simulation errors in the two-dimensional unsteady flow model from the perspectives of rainfall and runoff. As previously mentioned in Section 4.6, the water level from KP170 to KP190 shows consistently large errors. This discrepancy is likely due to an overestimation of the inflows from the tributaries in this reach.
When examining the ratio of cumulative radar rainfall to ground gauge rainfall shown in Figure 2, the catchment between KP170 and KP190 mostly shows a ratio within the range of 0.9 to 1.1, which is not unreasonable in terms of cumulative rainfall. On the other hand, an evaluation of the R2 values reveals that locations with 0.2 < R2 ≤ 0.5 are concentrated, suggesting that further investigation of the time-series rainfall data may be warranted.
Furthermore, in the basin between KP170 and KP190, metamorphic and mylonitic rocks are more widely distributed than igneous rock. As shown in Table 2, metamorphic and mylonitic rocks have lower dm values and higher ka and km values compared to igneous rock, indicating parameter settings that result in greater runoff. In this study, the parameters were set according to four geological classifications. However, if there is a recognized need for further improvement in reproducibility, it will be necessary to subdivide these classifications. Additionally, numerical parameter identification methods such as the SCE–UA [31] method should be considered.
Since this analysis integrates rainfall with unsteady flow in the main channel, it is important to emphasize that the errors in the main channel water levels can be considered in terms of rainfall and runoff. This is a feature of this approach.
In addition, in the present modeling, it was assumed that the inflow from the tributaries to the main channel was uniformly distributed across the cross section, and local flow dynamics at the confluences were not treated. The study by Fukuoka et al. [13] does not make such assumptions at the confluences, and therefore discusses even backwater effects in a gently inclined basin.
In the present study area, numerous tributaries flow into the main channel with a very steep gradient and high flow velocity, so it is sufficient to treat the one-way influence from the tributaries to the main channel. In addition, because the primary focus of this study is flood propagation in the main channel itself, it is reasonable to simplify the very localized and complex flows at the confluences with the tributaries. In this context, by carefully analyzing the unsteady flow over the approximately 70 km section of the main channel, this study was able to perform the presented analysis.
Furthermore, one of the limitations is that the wave speed in this section was estimated based on the kinematic wave approximation. It has been pointed out that in river channel systems with pronounced expansion, contraction, and meandering, wave speed can differ locally from that estimated by the kinematic wave approximation [32]. Therefore, in this study, local wave speed at sections with expansion, contraction, and meandering was not addressed, and instead an overview was provided based on average flood propagation across the entire section.

6. Conclusions

The observed data and simulation results with respect to rainfall, dam inflow discharges, main channel discharges, and water levels were comprehensively validated and integrated into water dynamics during a flood using hydrological and hydraulic models. The conclusions of this study are summarized below:
(1) The analysis of the relationship between rainfall and dam inflow discharges revealed the exceptionally high runoff ratio of the Katagiri Dam, which was due to a uniformly high-intensity rainfall across its catchment. In contrast, the runoff ratio of the Koshibu Dam basin was comparatively low despite the basin experiencing greater rainfall, which is attributed to the high storage capacity of the geology of the basin. The rainfall–runoff simulation was conducted based on the above insights. The simulation results successfully reproduced both the inflow discharge into each dam and the runoff characteristics of each dam basin, validating the simulation results and their similarity to the observed data.
(2) The analysis based on outflow discharges from the tributaries showed that the runoff ratios were generally lower on the left bank and higher on the right bank. Among the three right-bank tributaries with particularly high runoff ratios, the Otagiri River exhibited the highest peak-specific discharge, which was attributed to a continuous period (4 h) of highly intense rainfall. Furthermore, the relationship between accumulated net precipitation and basin storage was visualized and quantitatively analyzed.
(3) The analysis of the water level data in the main channel revealed a section where the timing of the peak water levels was reversed between upstream and downstream, indicating the important role of tributary inflows in controlling the timing of the flood peak in the main channel. The two-dimensional flow model, incorporating all tributary inflows estimated via the RRI model, successfully reproduced the inversion in peak timing. The simulation also enabled the estimation of the flood propagation of the entire main channel. In addition, river channel storage was quantitatively analyzed, identifying sections with particularly large storage volumes and evaluating their relative contributions in comparison to basin storage and dam storage.

Author Contributions

Conceptualization, S.K., A.Y. and K.Y.; methodology, S.K. and A.Y.; software, S.K.; validation, S.K. and A.Y.; formal analysis, S.K.; investigation, S.K.; resources, K.Y.; data curation, S.K.; writing—original draft preparation, S.K.; writing—review and editing, S.K., A.Y. and K.Y.; visualization, S.K.; supervision, K.Y.; project administration, K.Y. All authors have read and agreed to the published version of the manuscript.

Funding

This research received no external funding.

Data Availability Statement

Restrictions apply to the availability of these data. Observed data were obtained from the Tenryu River Upstream River Office, Ministry of Land, Infrastructure, Transport and Tourism, and are not open to the public. Calculation results are available upon request of the first author.

Acknowledgments

The ground gauge rainfall data, dam inflow and outflow data, float-type discharge measurement data, water level data, and ALB data for the two-dimensional unsteady flow simulation were provided by the Tenryu River Upstream River Office, Ministry of Land, Infrastructure, Transport and Tourism. We would like to express our gratitude here.

Conflicts of Interest

The authors declare no conflicts of interest.

References

  1. River Basin Disaster Resilience and Sustainability by All. Available online: https://www.mlit.go.jp/river/kokusai/pdf/pdf21.pdf (accessed on 8 June 2025).
  2. Black, P.E. Watershed functions. J. Am. Water Resour. Assoc. 1997, 33, 1–11. [Google Scholar] [CrossRef]
  3. Sayama, T.; McDonnell, J.J.; Dhakal, A.; Sullivan, K. How much water can a watershed store? Hydrol. Process. 2011, 25, 3899–3908. [Google Scholar] [CrossRef]
  4. Reager, J.T.; Famiglietti, J.S. Characteristic mega-basin water storage behavior using GRACE. Water Resour. Res. 2013, 49, 3314–3329. [Google Scholar] [CrossRef] [PubMed]
  5. Tabata, K.; Fukuoka, S.; Deguchi, K. Analysis of Discharge Capacity and Flood Storage Rate during 2015 Large Flood in the Kinu River. In Proceedings of the 12th International Conference on Hydroscience & Engineering, Tainan, Taiwan, 6–10 November 2016. [Google Scholar]
  6. Hoshino, T.; Koseki, H.; Okabe, Y.; Yasuda, H. Study on the hydraulic interaction in the channel network on low-lying area of Shinano River basin. Adv. River Eng. 2013, 19, 289–294. [Google Scholar]
  7. Coss, S.; Durand, M.T.; Shum, C.K.; Yi, Y.; Yang, X.; Pavelsky, T.; Getirana, A.; Yamazaki, D. Channel water storage anomaly: A new remotely sensed quantity for global river analysis. Geophys. Res. Lett. 2023, 50, e2022GL100185. [Google Scholar] [CrossRef]
  8. Spencer, S.A.; Silins, U.; Anderson, A.E. Precipitation–runoff and storage dynamics in watersheds underlain by till and permeable bedrock in Alberta’s Rocky Mountains. Water Resour. Res. 2019, 55, 10690–10706. [Google Scholar] [CrossRef]
  9. Takemura, Y.; Fukuoka, S. Effects of channel shape on propagation characteristics of flood flows through a valley. J. Flood Risk Manag. 2014, 7, 152–158. [Google Scholar] [CrossRef]
  10. 3L Water Level Gauge. Available online: https://www.mlit.go.jp/river/kokusai/pdf/pdf03.pdf (accessed on 8 June 2025).
  11. Shige-eda, M.; Akiyama, J.; Okubo, K.; Nakashima, H. Numerical simulations of rainfall-runoff and flood inundation flows based on radar rainfall in the Kagetsu River Basin on Kyushu-Hokubu heavy rain in 2017. Adv. River Eng. 2018, 24, 451–456. [Google Scholar]
  12. Mitsui, N.; Omi, Y.; Kashiwada, J.; Kubota, R.; Ito, T.; Tanaka, M.; Nihei, Y. Development and application of a coupled model (RRI-RF2D) of rainfall-runoff analysis and planar two-dimensional analysis for river and flood flows. J. Jpn. Soc. Civ. Eng. 2025, 81, 24–16020. [Google Scholar] [CrossRef]
  13. Fukuoka, S.; Ishii, Y. Temporal and spatial distributions of flood water storage volume of the main river and tributaries in the Ishikari River basin. Proc. IAHS 2024, 386, 47–53. [Google Scholar] [CrossRef]
  14. Iwashita, H.; Onda, Y.; Ichiyanagi, K. Storm-runoff characteristics of the three small steep watersheds, upstream of the Tenryu River. Bull. Nagoya Univ. For. 1994, 13, 85–108. [Google Scholar]
  15. Sayama, T.; Ozawa, G.; Kawakami, T.; Nabesaka, S.; Fukami, K. Rainfall–runoff–inundation analysis of the 2010 Pakistan flood in the Kabul River basin. Hydrol. Sci. J. 2012, 57, 298–312. [Google Scholar] [CrossRef]
  16. Sayama, T.; Tatebe, Y.; Tanaka, S. An emergency response-type rainfall–runoff–inundation simulation for 2011 Thailand floods. J. Flood Risk Manag. 2015, 10, 65–78. [Google Scholar] [CrossRef]
  17. Sayama, T.; Tatebe, Y.; Iwami, Y.; Tanaka, S. Hydrologic sensitivity of flood runoff and inundation: 2011 Thailand floods in the Chao Phraya River basin. Nat. Hazards Earth Syst. Sci. 2015, 15, 1617–1630. [Google Scholar] [CrossRef]
  18. Yamazaki, D.; Togashi, S.; Takeshima, A.; Sayama, T. High-resolution flow direction map of Japan. J. JSCE 2018, 8, 234–240. [Google Scholar] [CrossRef]
  19. Kondo, J.; Nakazono, M.; Watanabe, T. Hydrological climate in Japan (2). J. Jpn. Soc. Hydrol. Water Resour. 1992, 5, 29–36. [Google Scholar] [CrossRef]
  20. Japan Meteorological Agency. Available online: https://www.data.jma.go.jp/cpd/longfcst/kaisetsu/tenkinissuu/tenkinissuu.html (accessed on 2 July 2025).
  21. Nagata, N. General-coordinate-based river flow computation. In Hydraulics Formulae: Hydraulics Worked Examples with CD-ROM; Japan Society of Civil Engineers, Ed.; Maruzen: Tokyo, Japan, 2002. [Google Scholar]
  22. iRIC Sofrware. Available online: https://i-ric.org/en/about/ (accessed on 8 June 2025).
  23. Nash, J.E.; Sutcliffe, J.V. River flow forecasting through conceptual models: Part I—A discussion of principles. J. Hydrol. 1970, 10, 282–290. [Google Scholar] [CrossRef]
  24. Hayashi, T. Mathematical theory and experiment of flood waves. Trans. Jpn. Soc. Civ. Eng. 1953, 1953, 13–26. [Google Scholar] [CrossRef]
  25. Hewlett, J.D.; Hibbert, A.R. Factors affecting the response of small watersheds to precipitation in humid areas. In Proceedings of the International Symposium on Forest Hydrology, University Park, PA, USA, 29 August–10 September 1965. [Google Scholar]
  26. Lehman, P.; Hinz, C.; McGrath, G.; Tromp-van Meerveld, H.J.; McDonnell, J.J. Rainfall threshold for hillslope outflow: An emergent property of flow pathway connectivity. Hydrol. Earth Syst. Sci. 2007, 11, 1047–1063. [Google Scholar] [CrossRef]
  27. Hromadka, T.V., II; Whitley, R.J. The rational method for peak flow rate estimation. J. Am. Water Resour. Assoc. 1994, 30, 1001–1009. [Google Scholar] [CrossRef]
  28. Kang, M.S.; Goo, J.H.; Song, I.; Chun, J.A.; Her, Y.G.; Hwang, S.W.; Park, S.W. Estimating design floods based on the critical storm duration for small watersheds. J. Hydro-Environ. Res. 2013, 7, 209–218. [Google Scholar] [CrossRef]
  29. Lapides, D.A.; Sytsma, A.; Crompton, O.; Thompson, S. Rational method time of concentration can underestimate peak discharge for hillslopes. J. Hydraul. Eng. 2021, 147, 06021014. [Google Scholar] [CrossRef]
  30. Jain, S.C. Open Channel Flow; John Wiley & Sons, Inc.: Hoboken, NJ, USA, 2001; p. 241. [Google Scholar]
  31. Duan, Q.; Sorooshian, S.; Gupta, V.K. Effective and efficient global optimization for conceptual rainfall-runoff models. Water Resour. Res. 1992, 28, 1015–1031. [Google Scholar] [CrossRef]
  32. Takemura, Y.; Fukuoka, S. Effects of river morphology on propagation and transformation of discharge and water level hydrographs of flood flows through river valley. J. Jpn. Soc. Civ. Eng. Ser. B1 (Hydraul. Eng.) 2012, 68, 35–54. [Google Scholar] [CrossRef]
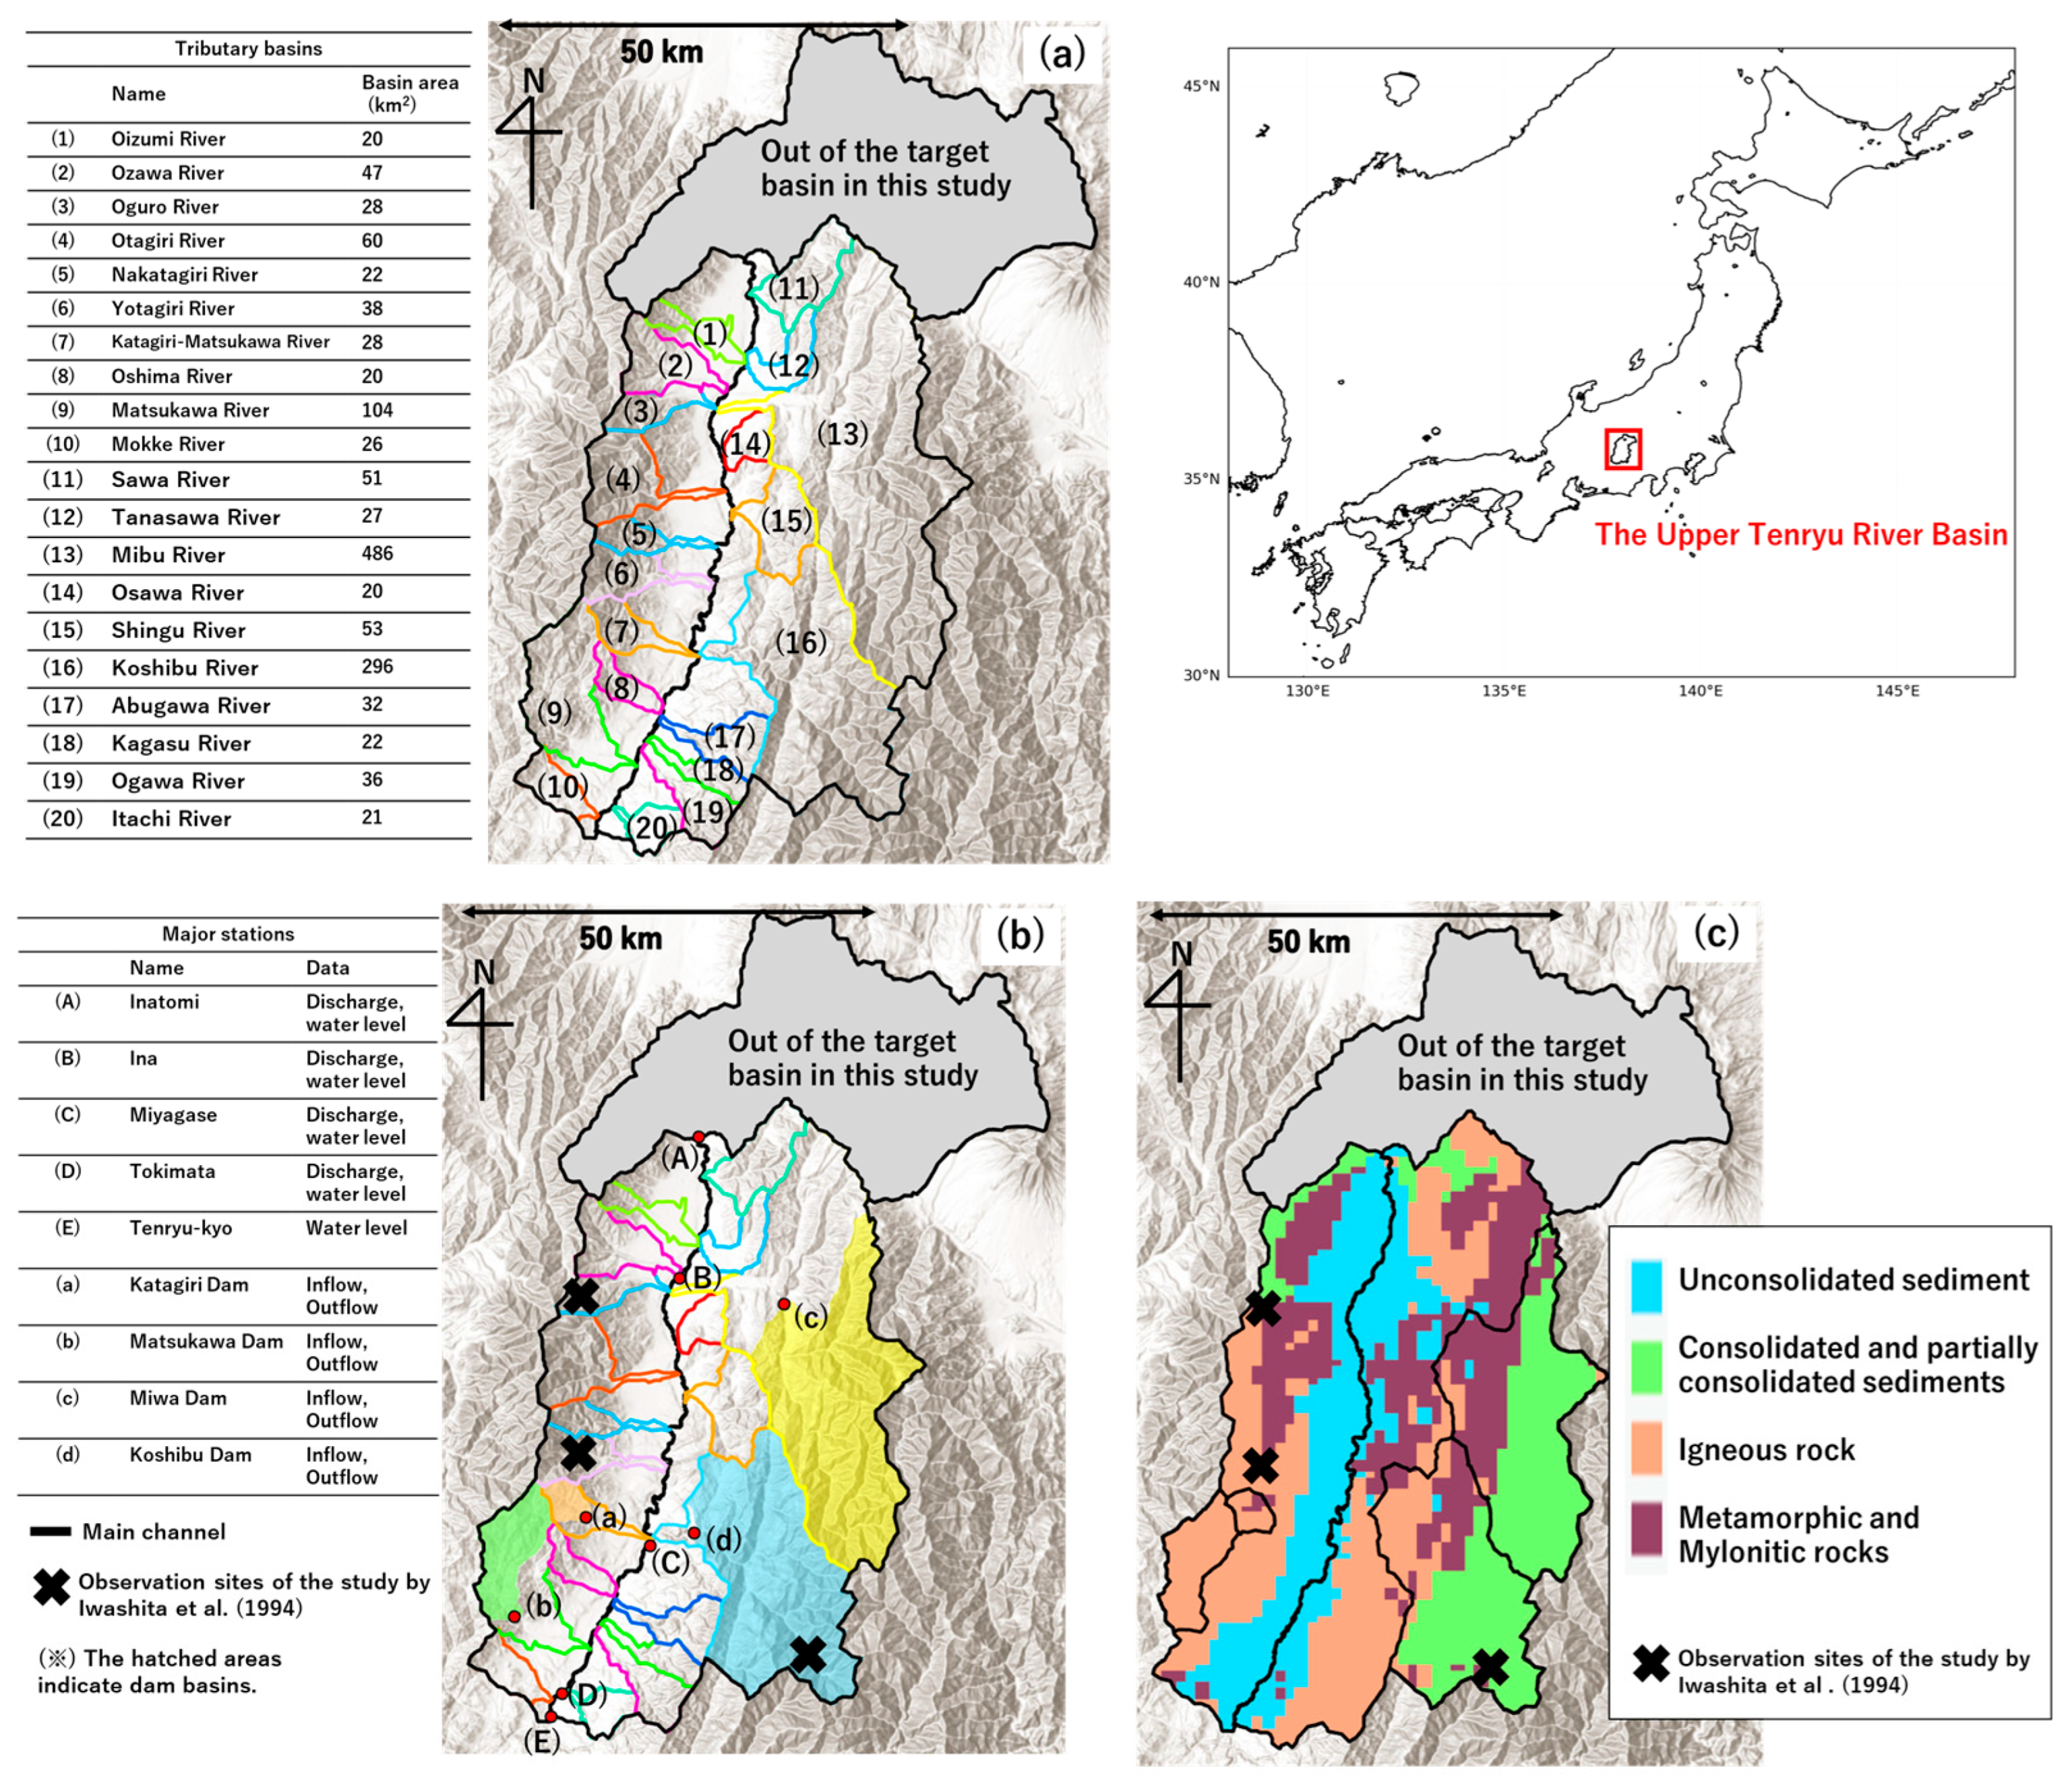
Figure 1. Target basin. (a) Tributary basins; (b) dam basins and major stations; (c) geology classification. (Observation sites of the study by Iwashita et al. [14] are shown in Figure (b,c)).
Water 17 02086 g001
Figure 2. Spatial distribution of accumulated rainfall obtained using radar and its comparison with ground gauge data. (a) Ratio of accumulated rainfall by radar to ground gauge; (b) coefficient of determination (R2) between rainfall measured by radar and by ground gauge at a 1 h time resolution.
Water 17 02086 g002
Figure 3. Method for transferring tributary outflows from the RRI model to the 2D unsteady flow simulation.
Water 17 02086 g003
Figure 4. The relationships among sections in Section 4 (“Results”) and Section 5 (“Discussion”).
Water 17 02086 g004
Figure 5. Runoff ratios for each dam basin.
Water 17 02086 g005
Figure 6. Simulated and observed inflow discharges for each dam.
Water 17 02086 g006
Figure 7. Runoff ratios for each tributary basin.
Water 17 02086 g007
Figure 8. Relationship between accumulated rainfall and peak-specific discharge.
Water 17 02086 g008
Figure 9. Net precipitation and basin storage, including contributions from ten right-bank tributaries and ten left-bank tributaries.
Water 17 02086 g009
Figure 10. Locations of water level gauges and spatial distribution of cumulative rainfall.
Water 17 02086 g010
Figure 11. Relationship between the occurrence time of peak water level and the longitudinal positions of water level gauges.
Water 17 02086 g011
Figure 12. Observed water level results showing the reversal in the occurrence time of the peak water levels.
Water 17 02086 g012
Figure 13. Longitudinal comparison between simulated and observed water levels.
Water 17 02086 g013
Figure 14. Error between the simulated and observed water levels. (a) Time-averaged difference and ranges (95%ile and 5%ile); (b) RMSE and correlation coefficient.
Water 17 02086 g014aWater 17 02086 g014b
Figure 15. Comparison between simulated and measured discharges.
Water 17 02086 g015
Figure 16. Comparison between the simulated and observed occurrence times of peak water levels.
Water 17 02086 g016
Figure 17. Relationship between the discharge and flow cross-sectional area at the Tokimata station based on simulation results (red dots represent the top 25% of discharge and cross-sectional area data before the peak timing).
Water 17 02086 g017
Figure 18. Longitudinal distributions of wave speed, flow velocity, and the wave speed to flow velocity ratio α (wave speed divided by flow velocity).
Water 17 02086 g018
Figure 19. Time series of inflows from the tributary into the main channel, river channel storage, and basin storage.
Water 17 02086 g019
Figure 20. River channel storage per 1 km segment.
Water 17 02086 g020
Figure 21. Time series of basin-averaged rainfall and outflow discharge from each tributary.
Water 17 02086 g021
Figure 22. Time series of the ratio of basin storage to net precipitation.
Water 17 02086 g022
Figure 23. Difference in the ratio of basin storage to net precipitation between the right-bank and left-bank tributaries.
Water 17 02086 g023
Figure 24. Plan view of the river sections with high channel storage: (a) upstream of Tenryu-Kyo gorge; (b) upstream of Garyu-Kyo gorge. (Elevation data is obtained by an ALB observation. The figures were created by iRIC software V4 [22]).
Water 17 02086 g024
Figure 25. River channel storage in the entire section and upstream sections of Tenryu-kyo and Garyu-kyo Gorges.
Water 17 02086 g025
Table 1. Summary of the spatial/temporal resolution of the observed data used in this study.
DataObservation MethodNumber of Stations
(Spatial Resolution)
Temporal Resolution
RainfallRadar(1 km)1 h
Ground gauge35 stations
(55 km2/station)
10 min
DischargeDam inflow/outflow4 dams10 min
Observation station along river channel4 stations
(18 km/station)
10 min *
Water levelObservation station along river channel24 stations
(3 km/station)
10 min
Note: * Converted by H–Q relation.
Table 2. RRI model parameters assigned for each geological classification.
ParameterUnconsolidated SedimentConsolidated and
Partially Consolidated Sediments
Igneous RockMetamorphic and Mylonitic Rocks
ka (m/s)0.15000.125000.025000.10000
km (m/s)0.03750.031250.006250.02500
da (m)1.501.501.501.50
dm (m)0.150.900.450.15
Table 3. Nash–Sutcliffe coefficient values and outflow ratio for each dam catchment.
Nash–Sutcliffe CoefficientRunoff Ratio
Obs *Calc *
Katagiri dam0.830.870.82
Matsukawa dam0.680.620.73
Miwa dam0.820.700.69
Koshibu dam0.870.690.75
Note: * The terms Obs and Calc mean observation and calculation, respectively.
Disclaimer/Publisher’s Note: The statements, opinions and data contained in all publications are solely those of the individual author(s) and contributor(s) and not of MDPI and/or the editor(s). MDPI and/or the editor(s) disclaim responsibility for any injury to people or property resulting from any ideas, methods, instructions or products referred to in the content.