Article

Attribution Analysis on Runoff Reduction in the Upper Han River Basin Based on Hydro-Meteorologic and Land Use/Cover Change Data Series

1
State Key Laboratory of Water Resources Engineering and Management, Wuhan University, Wuhan 430072, China
2
Hanjiang Water Conservancy and Hydropower Group Limited Company, Wuhan 430010, China
*
Author to whom correspondence should be addressed.
Water 2025, 17(14), 2067; https://doi.org/10.3390/w17142067
Submission received: 4 June 2025 / Revised: 7 July 2025 / Accepted: 9 July 2025 / Published: 10 July 2025

Abstract

Anthropogenic activities and climate change have significantly altered runoff generation in the upper Han River basin, posing a challenge to the water supply sustainability for the Middle Route of the South-to-North Water Diversion Project. Land use/cover changes (LUCCs) affect hydrological processes by modifying evapotranspiration, infiltration and soil moisture content. Based on hydro-meteorological data from 1961 to 2023 and LUCC data series from 1985 to 2023, this study aimed to identify the temporal trend in hydro-meteorological variables, to quantify the impacts of underlying land surface and climate factors at different time scales and to clarify the effects of LUCCs and basin greening on the runoff generation process. The results showed that (1) inflow runoff declined at a rate of −1.71 mm/year from 1961 to 2023, with a marked shift around 1985, while potential evapotranspiration increased at a rate of 2.06 mm/year within the same time frame. (2) Annual climate factors accounted for 61.01% of the runoff reduction, while underlying land surface contributed 38.99%. Effective precipitation was the dominant climatic factor during the flood season, whereas potential evapotranspiration had a greater influence during the dry season. (3) From 1985 to 2023, the LUCC changed significantly, mainly manifested by the increasing forest area and decreasing crop land area. The NDVI also showed an upward trend over the years; the actual evapotranspiration increased by 1.163 billion m3 due to the LUCC. This study addresses the climate-driven and human-induced hydrological changes in the Danjiangkou Reservoir and provides an important reference for water resource management.

1. Introduction

Continuous climate changes and intensifying human activities have profoundly influenced the hydrology process. Climate change, characterized by an increasing atmosphere carbon dioxide concentration and the northward shift of rainfall lines, has significantly modified rainfall processes and global water resource distribution [1,2]. It has also been reported that global warming is projected to induce complex and uncertain changes in regional surface hydroclimatic patterns, potentially leading to either increased or decreased runoff in river basins [3]. Gu et al. (2025) found a significant decline in soil moisture in low-seasonality regions during their dry seasons due to climate warming, resulting in low surface water availability [4]. Concurrently, human activities, including urbanization, agricultural irrigation and hydraulic engineering projects, have substantially altered runoff generation and distribution [5,6]. Plant cover is regarded to be a decisive factor in runoff generation as areas with a dense canopy cover showed a lower soil water content and higher soil suction [7]. Nadal-Romero et al. (2025) demonstrated that hydrological responses to wet and dry periods in Mediterranean mountain catchments are strongly modulated by vegetation cover, with forested landscapes exhibiting heightened sensitivity to drought history and increased runoff during wet phases [8]. Sankarrao and Rathinasamy (2025) assessed the influence of agricultural land use intensification on the hydrological process in the Nagavali River basin and revealed that the intensification of agricultural land use increased surface runoff and groundwater recharge, whereas it may have reduced evapotranspiration [9]. Runoff is the core of the hydrology cycle, as well as an important factor in maintaining ecological stability and promoting economic and social development [10]. Investigating runoff evolution patterns under changing environmental conditions and identifying the role of human activities and climatic variables are crucial for advancing our understanding of hydrological processes, formulating effective water resource management policies and achieving sustainable water supply goals.
A substantial amount of research has been devoted to exploring the role of anthropogenic and climatic factors in runoff changes. Xie et al. (2023) classified the precipitation scenarios in the Yellow River basin into five patterns, from extremely dry to extremely abundant, and the ratio of precipitation converted to stream runoff was decreased after the mutation points under all precipitation scenarios [11]. Bai (2023) employed linear regression to separate land surface change and climate impacts on runoff in China, demonstrating that climatic factors were the dominant contributor [12]. Sun et al. (2024) utilized the GSWP3-W5E5 climate dataset from ISIMIP3a to drive hydrological simulations for quantifying the contribution of climate change to both the mean and extreme runoff across China [13]. Their results indicate that climate change is the primary driver of annual discharge in western China and intensifies the annual maximum daily runoff in the upper Yellow and upper Yangtze River basins. Senbeta and Romanowicz (2021) constructed a SWAT model in the Kamienna basin and found that human interventions contributed 60% of runoff variation [14]. Álamos et al. (2024) showed that in central Chile, runoff decline was mainly driven by reduced precipitation, with human water use worsening drought conditions [15]. Despite the valuable insights these studies provide into runoff variability, they primarily focus on quantitative trends and attribution, while largely overlooking the underlying mechanisms of hydrological change, especially in evaluating the effects of LUCC. Most studies assessed the influence of LUCC through relatively simplified data analyses or scenario-based simulations, failing to fully account for the associated physical processes. From the perspective of long-term water balance, the impact of land surface changes on runoff can be interpreted as a secondary effect mediated through alterations in evapotranspiration [16,17]. Birylo et al. (2025) further highlighted the strong influence of evapotranspiration on water availability, especially in areas with complex topography [18]. By integrating land surface dynamics with evapotranspiration variability, a process-based framework can provide a physically consistent assessment of basin-scale water balance, thereby improving the robustness and credibility of attribution analyses. Such an approach not only strengthens watershed management strategies but also aids in developing targeted adaptation measures to address both climate variability and anthropogenic pressures.
Runoff attribution relative methods can be roughly categorized into three types: i.e., statistical method, hydrologic model and conceptual method. The statistical method includes parametric and non-parametric approaches, such as regression analyses and neural networks, which establish empirical relationships between runoff and its influencing factors [19,20]. The hydrologic model allows one to set up several scenarios and compare the corresponding simulations; it can thus separate the individual impacts of different factors [21,22,23]. However, the construction of a hydrologic model is usually data-demanding, parameter-heavy and time-consuming. The conceptual method is well-defined physical meanings and suitable input data. A representative one is the Budyko Equation, which considers the water and energy balance at the same time [24]. Within this framework, various Budyko formulas have been developed, with their parameters (commonly referred to as basin parameters) reflecting underlying land surface characteristics [25,26,27,28]. Two primary methods are widely used under the Budyko framework: the elasticity coefficient method and the decomposition method [29,30,31]. The elasticity coefficient method assumes that each factor influences runoff independently and the amount of influenced runoff is determined by both runoff sensitivity and factor variation magnitude. Under this framework, Zhou et al. (2016) proposed the Budyko complementary relationship, ensuring consistency between estimated and observed runoff variations [32]. Alternatively, the decomposition method, introduced by Wang and Hejazi (2011), separates the effects of climate variability and the underlying surface on runoff [33]. Given its theoretical robustness, solid empirical foundation and low data requirements (precipitation, runoff and potential evapotranspiration), the Budyko framework has gained widespread popularity for runoff attribution analyses in recent years.
The Danjiangkou Reservoir, located in the mainstream of the Han River, plays a pivotal role in flood control, hydropower and navigation, and serves as the primary water source for the Middle Route of the South-to-North Water Diversion Project (SNWDP), annually delivering approximately 13 billion m3 of water to northern China [34,35]. Recent studies have documented substantial hydrological changes in the middle and lower Han River basin. Yin et al. (2020) assessed the change in natural flow using indicators of hydrologic alteration (IHAs) and found that streamflow decreased with the completion of the cascade reservoirs and the SNWDP [36]. Similarly, Wang et al. (2024) utilized IHAs and Range of Variability Approaches (RVAs), revealing moderate hydrological changes across the basin [37]. Additionally, LULC transformations have also been observed [38,39], further affecting runoff dynamics. To explore the driving forces behind these changes, Shah et al. (2022) a employed a climate elasticity method on three major tributaries, attributing runoff variation mainly to climate factors [40]. Wang et al. (2023a) emphasized the role of surface conditions by comparing simulated runoff under historical and extreme land use scenarios [41].
Located in the Asian Monsoon zone, the Han River basin exhibits pronounced seasonal hydro-meteorological variability, particularly between the flood season (from June to September) and the dry season (from October to May of the following year) [42,43]. Notably, approximately 70~80% of the annual precipitation and runoff occurs during the flood season [44]. This period is also associated with high-frequency extreme hydrological events, such as short-duration heavy rainfall and flash floods, which contribute disproportionately to annual runoff and pose significant flood risks [45]. In contrast, the dry season is characterized by low precipitation, reduced streamflow and decreased extreme rainfall events. In addition to natural variability, human interventions also vary seasonally. For example, seasonal agricultural practices, such as irrigation during the dry season and rainfed cropping during the flood season, contribute to strong intra-annual variability in water use and land–atmosphere interactions. Furthermore, the Danjiangkou Reservoir is a major hydraulic project in the basin and plays a critical role in flood regulation. It stores excess water in the post-flood season and releases it during the dry season to meet water demands [46]. The seasonal disparities of hydro-meteorological elements and human regulation highlight the importance of conducting a runoff attribution analysis at the seasonal scale. Nevertheless, existing studies lack a systematic runoff attribution analysis across the flood and dry seasons.
This study focuses on understanding the mechanisms of inflow runoff reduction in the Danjiangkou Reservoir at both annual and seasonal time scales. Using long-term hydroclimatic data from 1961 to 2023 for the upper Han River basin (UHRB), we aim to answer the following specific research questions: (1) How have inflow runoff and key climatic variables (precipitation and potential evapotranspiration) evolved over the past six decades? (2) What are the relative contributions of climate variability and the underlying land surface to the observed runoff reduction, particularly during the flood and dry seasons? (3) To what extent do LUCC and Normalized Difference Vegetation Index (NDVI) dynamics explain the human-induced component of runoff reduction?
Figure 1 shows the schematic structure diagram of this study. This paper is organized as follows: Section 2 describes the study area and data sources; Section 3 details the methodological framework; Section 4 presents the temporal analysis, ABCD model simulation and runoff reduction attribution analysis results; Section 5 further discusses the data reliability and the reasonableness of the results; and Section 6 summarizes the key findings and conclusions.

2. Study Area and Data
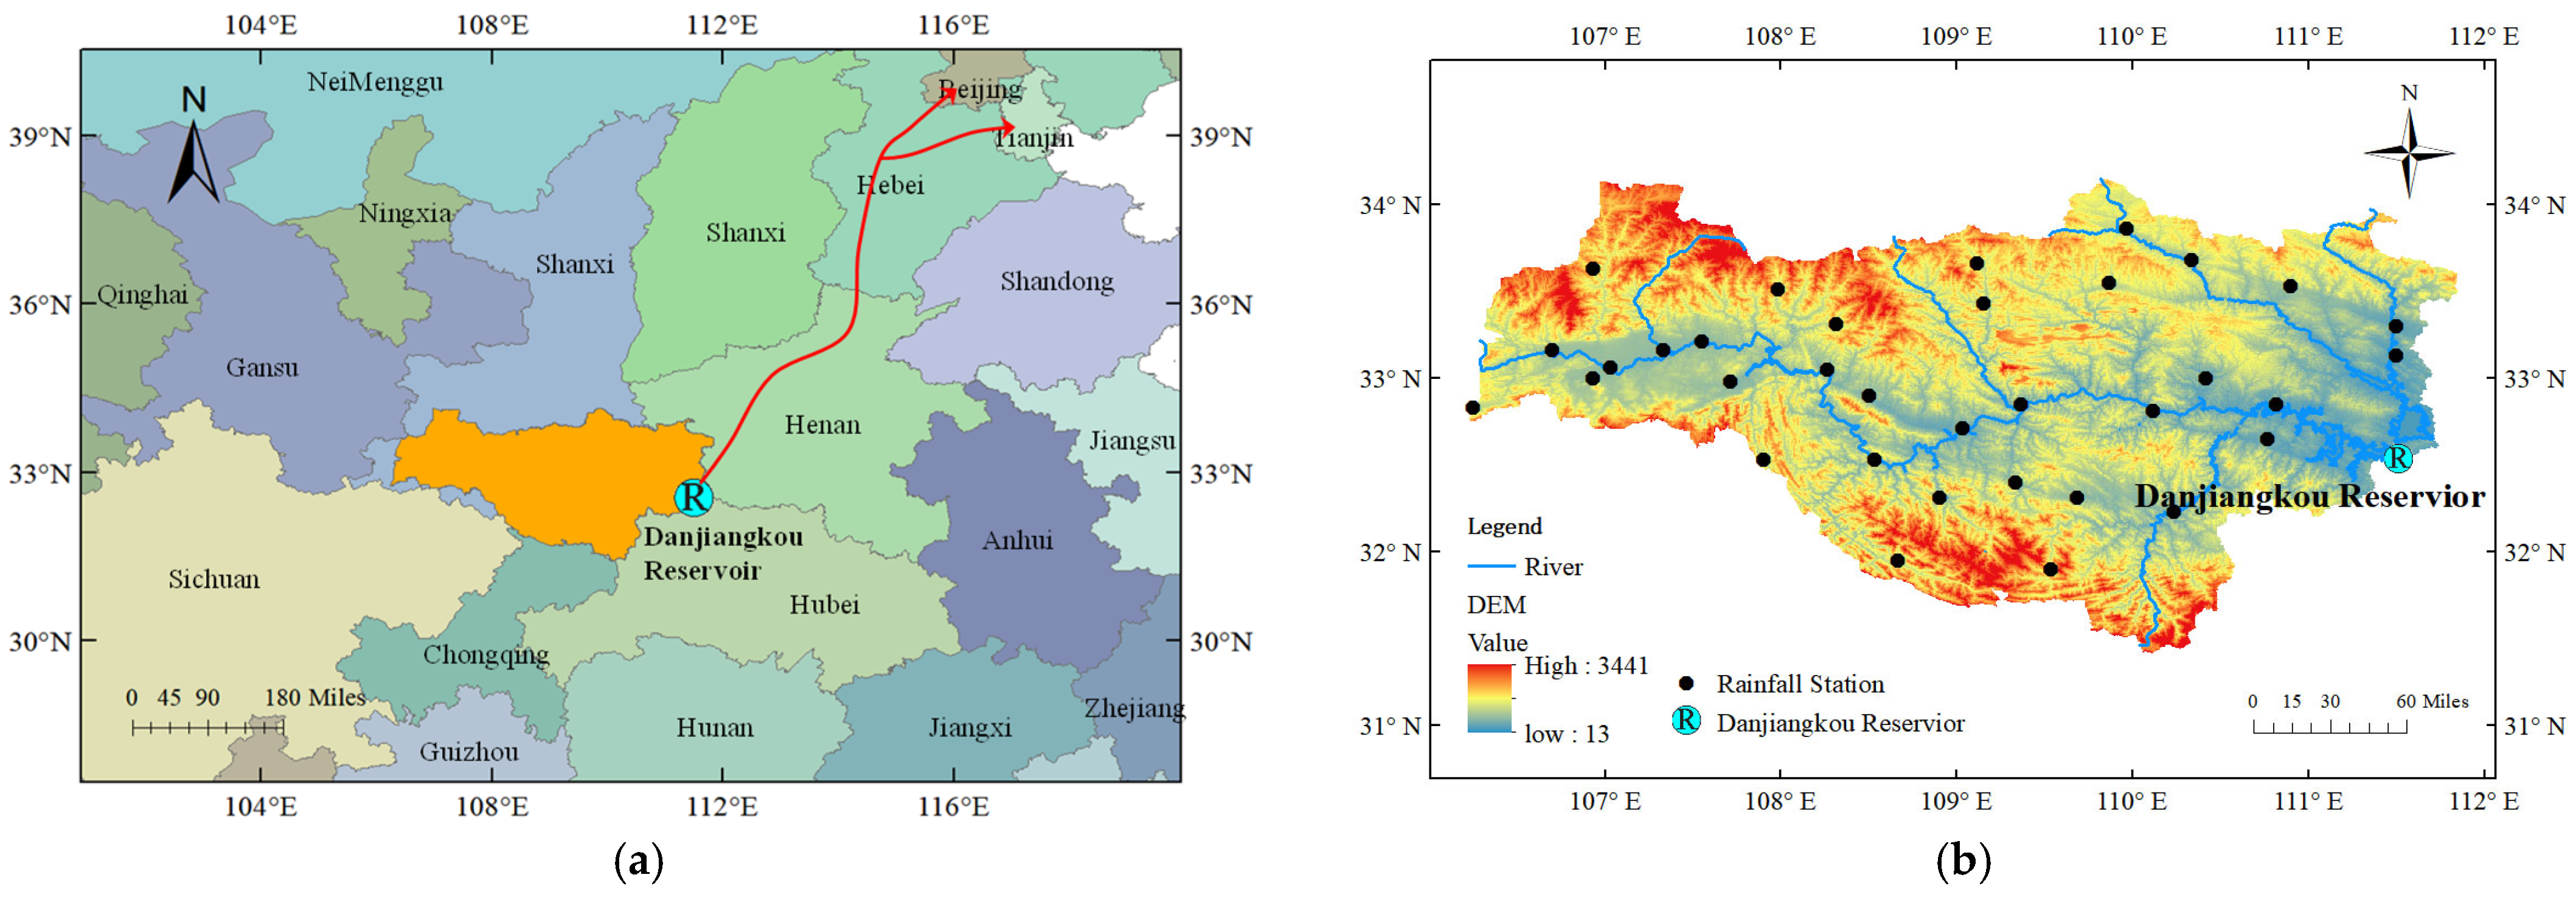
2.1. Study Area

The Danjiangkou Reservoir lies 800 m downstream from where the Han River joins its tributary, the Danjiang River. The upstream control area of the reservoir is mostly mountainous, located in the Qinling fold belt, with prominent fault structures, covering a catchment area of 92,500 km2. Runoff in this basin is strongly influenced by human activities and climatic factors, which further impacts the ecosystem. Figure 2 shows an overview of the South-to-North Water Diversion Project and the upper Han River basin.

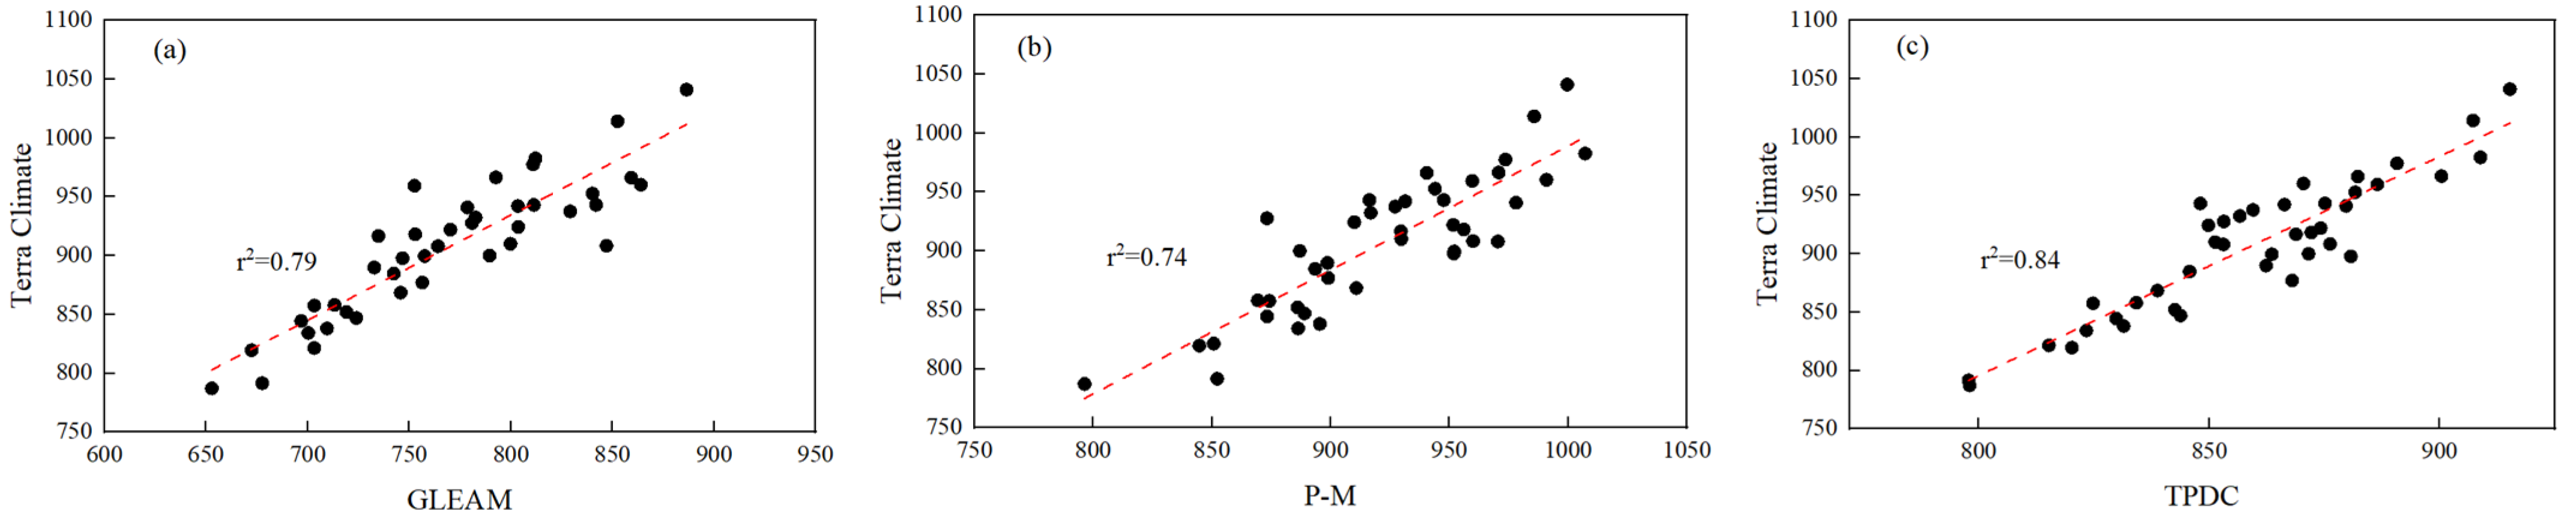
2.2. Data Collection
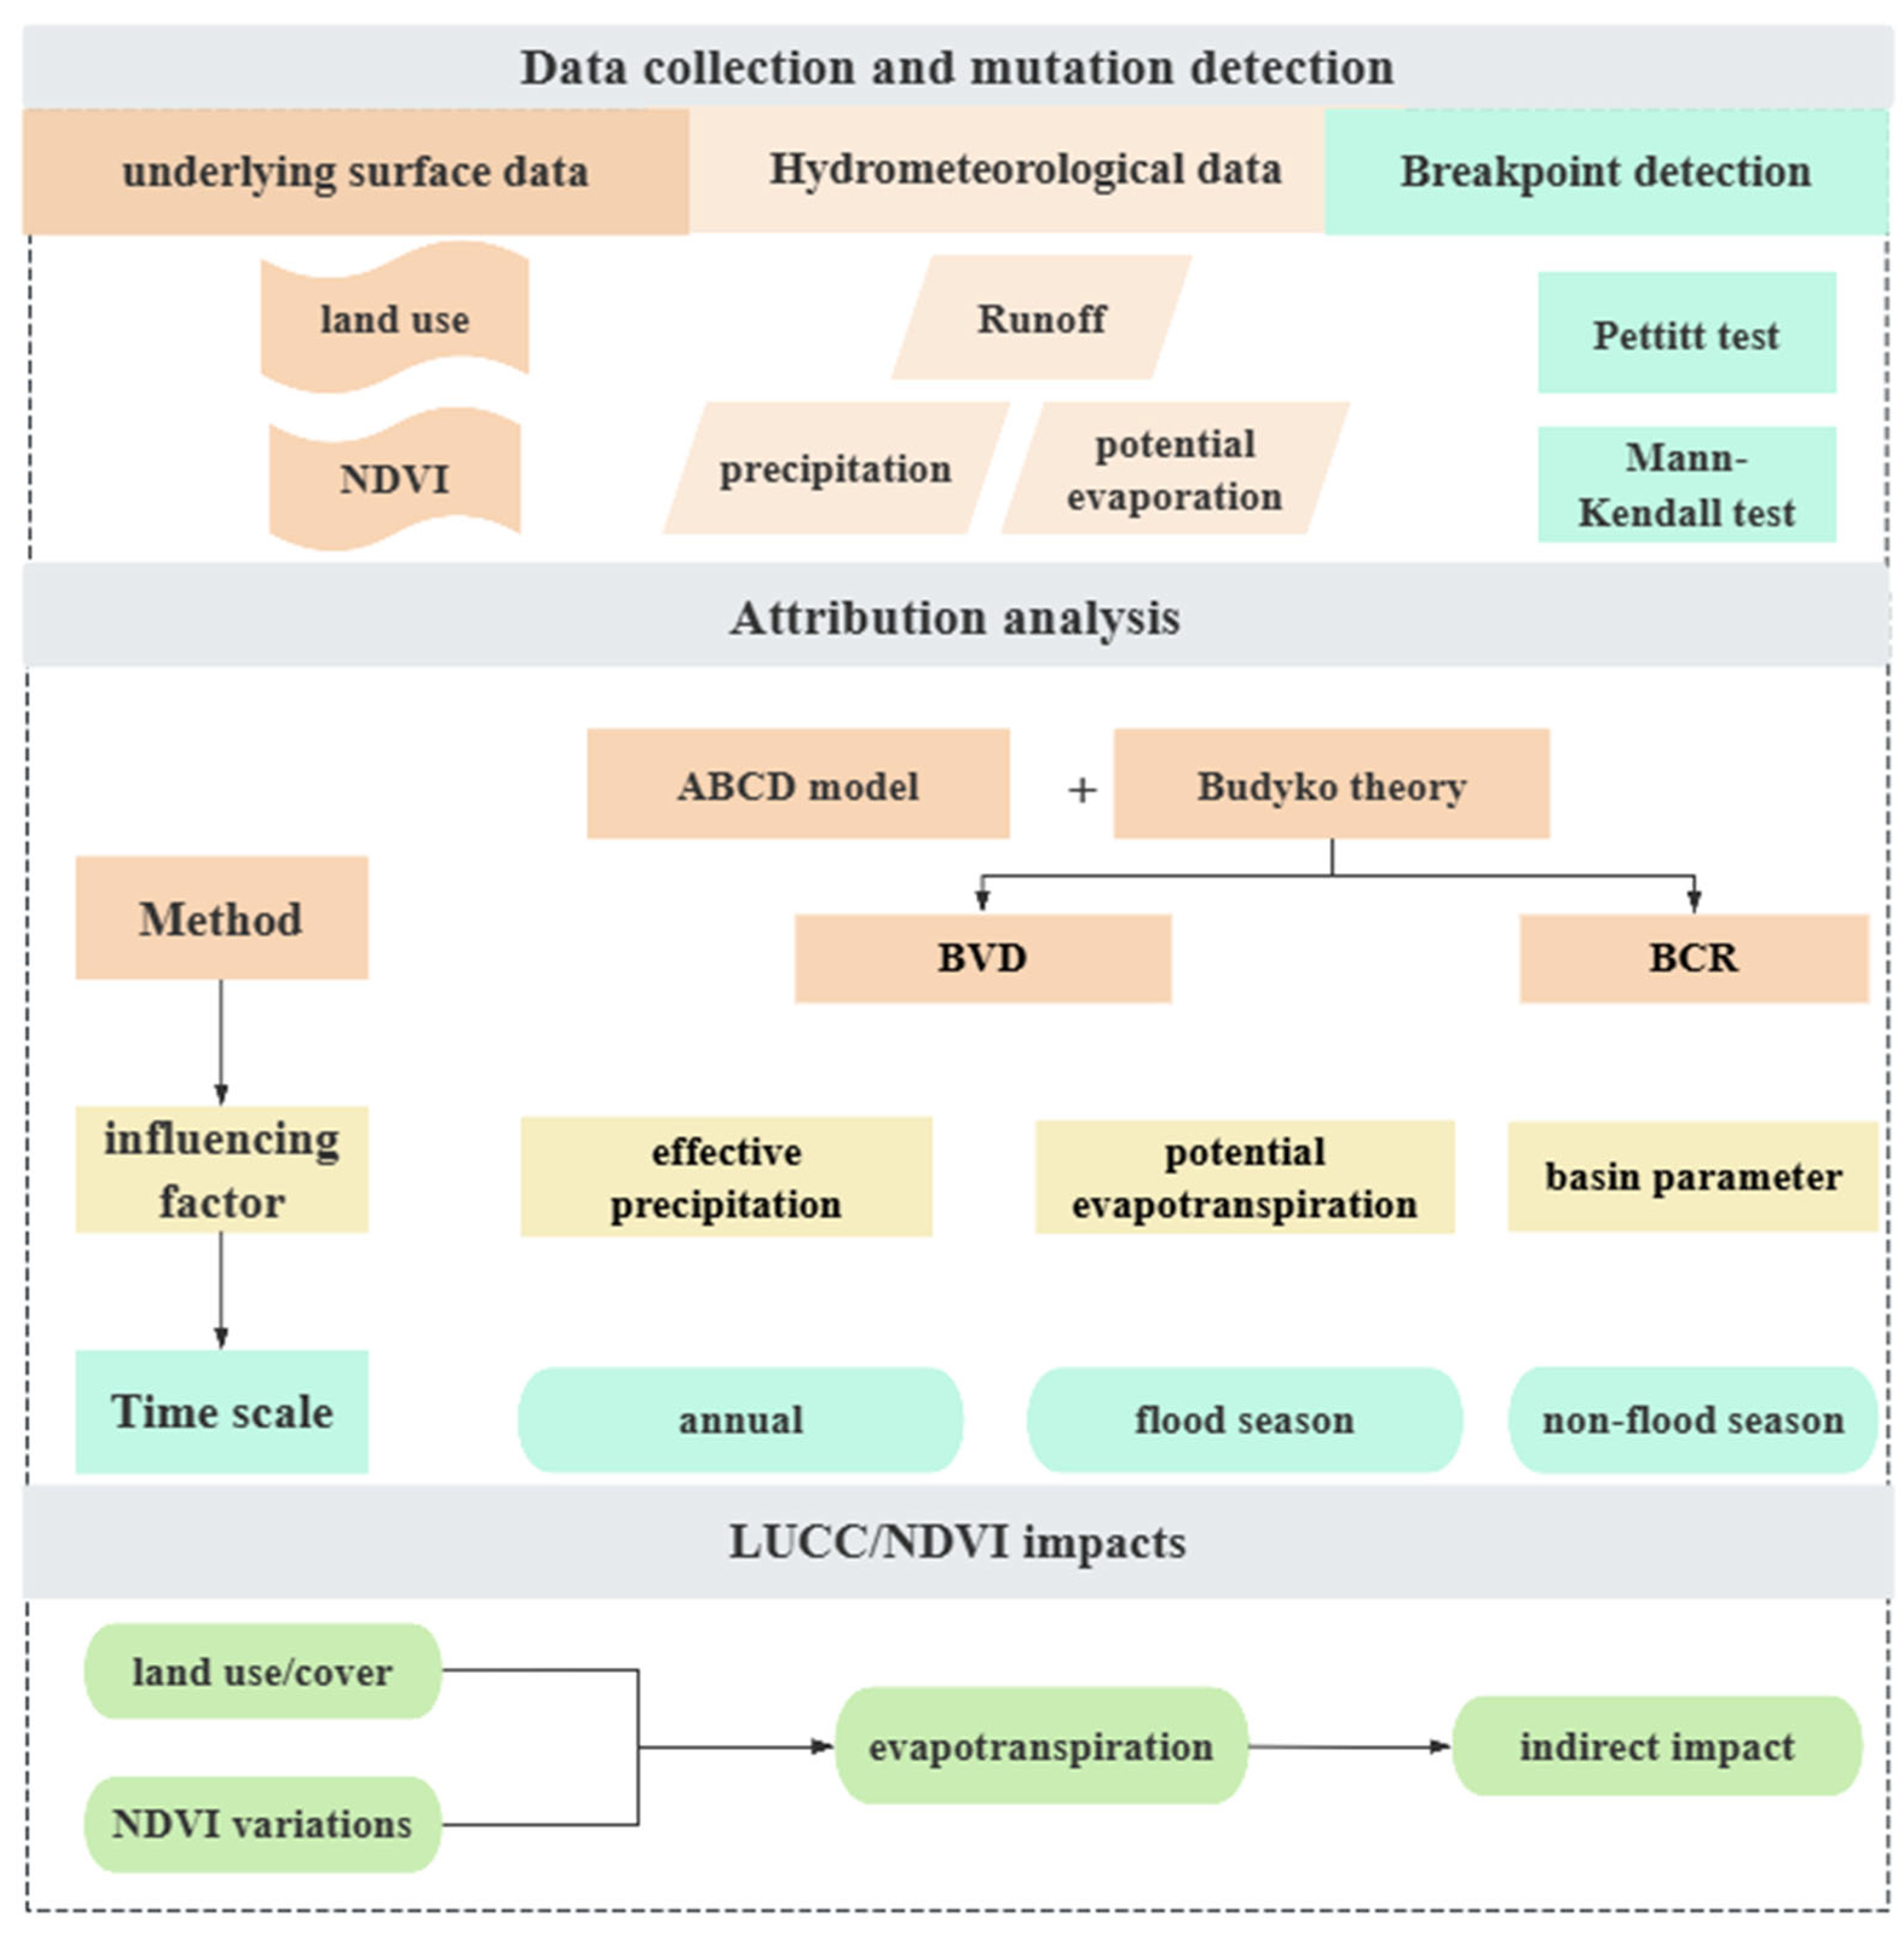
Monthly precipitation data for the UHRB from 1961 to 2023 were sourced from the China Meteorological Data Center, while monthly potential evapotranspiration data were obtained from the TerraClimate dataset (https://www.climatologylab.org/terraclimate.html, accessed on 25 May 2025), which provides high-resolution (~4 km) monthly surface water balance variables [47]. This dataset spans from 1961 to 2023, providing both sufficient temporal coverage and data quality to support the objectives of this study. Elevation data with a 90 m resolution were obtained from the Geospatial Data Cloud (https://www.gscloud.cn). The annual LUCC data from 1985 to 2023 were from Wuhan University’s [48] annual land cover datasets of China with a 30 m resolution. Daily observed inflow (R) data from 1961 to 2023 at the Huangjiagang hydrologic station were compiled firstly, followed by the inflow of the Danjiangkou Reservoir, restored to its natural condition by consideration of reservoir regulation and water division based on water balance principles.

3. Methodology

3.1. Mutation Analysis

The Mann–Kendall test and Pettitt test are widely used methods in detecting mutation points in hydrology and are used for runoff mutation detection. Here is a brief overview of the principles of these two methods.
(1) Mann–Kendall test
For independent time series x1, x2, …, xn (n is the time series length), the Sk statistic is defined as follows [49]:
S k = i = 1 k j = 1 i α i j ( k = 1 , 2 , 3 , , n )
α i j = 1 x i > x j 0 x i < x j
The mean and variance of Sk are calculated by the following:
E ( S k ) = k ( k 1 ) 4
V a r ( S k ) = k ( k 1 ) ( 2 k + 5 ) 72 1 k n
The statistic UFk is calculated by the following:
U F k = S k E ( S k ) V a r ( S k )
Applying the above steps to the inverse sequence of the time series, we obtain the statistic UFk’. Then, UBk is calculated using the following equations:
U B k = U F k k = n + 1 k k = 1 , 2 , n
A positive UFk reports an upward trend, while a negative UFk reports a downward trend in the time series. An absolute value of UFk exceeding Uα, the statistic at a given significance level a, denotes that there is a significant trend. If the curves of UFk and UFk intersect at the significance level interval, the intersection point marks the start of the mutation [43].
(2) Pettitt test
The Ut,n statistic is defined as follows:
U t , n = i = 1 t j = t + 1 n sgn ( x j x i ) 1 t n
where xi and xj are the variables to be tested, and n is the sample length [50] for moment t, which satisfies the following equation:
K τ = U τ , n = max U t , n
Then, t is regarded as the time when the mutation occurs. The p statistic can be calculated by the following:
p = 2 exp 6 K τ 2 T 2 + T 3
If p is less than 0.05, it means that the detected mutation point is significant.

3.2. Runoff Sensitivity

The Budyko equation is a functional relationship describing the water and energy balance analysis, and is expressed as follows [51]:
E P = f ( E 0 P )
where E is the actual evapotranspiration, E0 is the potential evapotranspiration, P is the precipitation and E0/P is the dryness index (DI). The widely used Fu formula is expressed as follows:
E P = 1 + E 0 P [ 1 + ( E 0 P ) ω ] 1 / ω
where ω is a dimensionless parameter related to vegetation types, soil properties, terrain and climatic factors [52]. Hence, it is called the basin parameter in this paper. Attribution analyses under the Budyko framework are typically conducted at annual or multiannual time scales to satisfy the water balance equation. The concept of “effective precipitation” (Pe), defined as the precipitation minus the temporal variation in total water storage (Pe = P − ΔS) [53], has been introduced and widely adopted in extended Budyko formulas, and accounts for the effects of water storage variation while maintaining the integrity of the theoretical framework. Building upon this foundation, the extended Fu formula can be expressed as follows:
E P e = 1 + E 0 P e [ 1 + ( E 0 P e ) ω ] 1 / ω
Under this framework, the actual dryness index is defined as DIe = E0/Pe. The sensitivity of runoff, which is defined as the ratio of annual runoff variation caused by a 1% change in a factor to the multi-year mean annual runoff, can be measured using the elasticity coefficient method, as follows:
ε x i = δ   R δ   x i × x i R
where ε x i represents the elasticity coefficient of runoff with respect to a specific factor. If ε x i > 0, the runoff varies in the same direction as the influencing factor, whereas if ε x i < 0, the runoff varies in the opposite direction as the influencing factor.

3.3. Attribution Analysis of Runoff Change

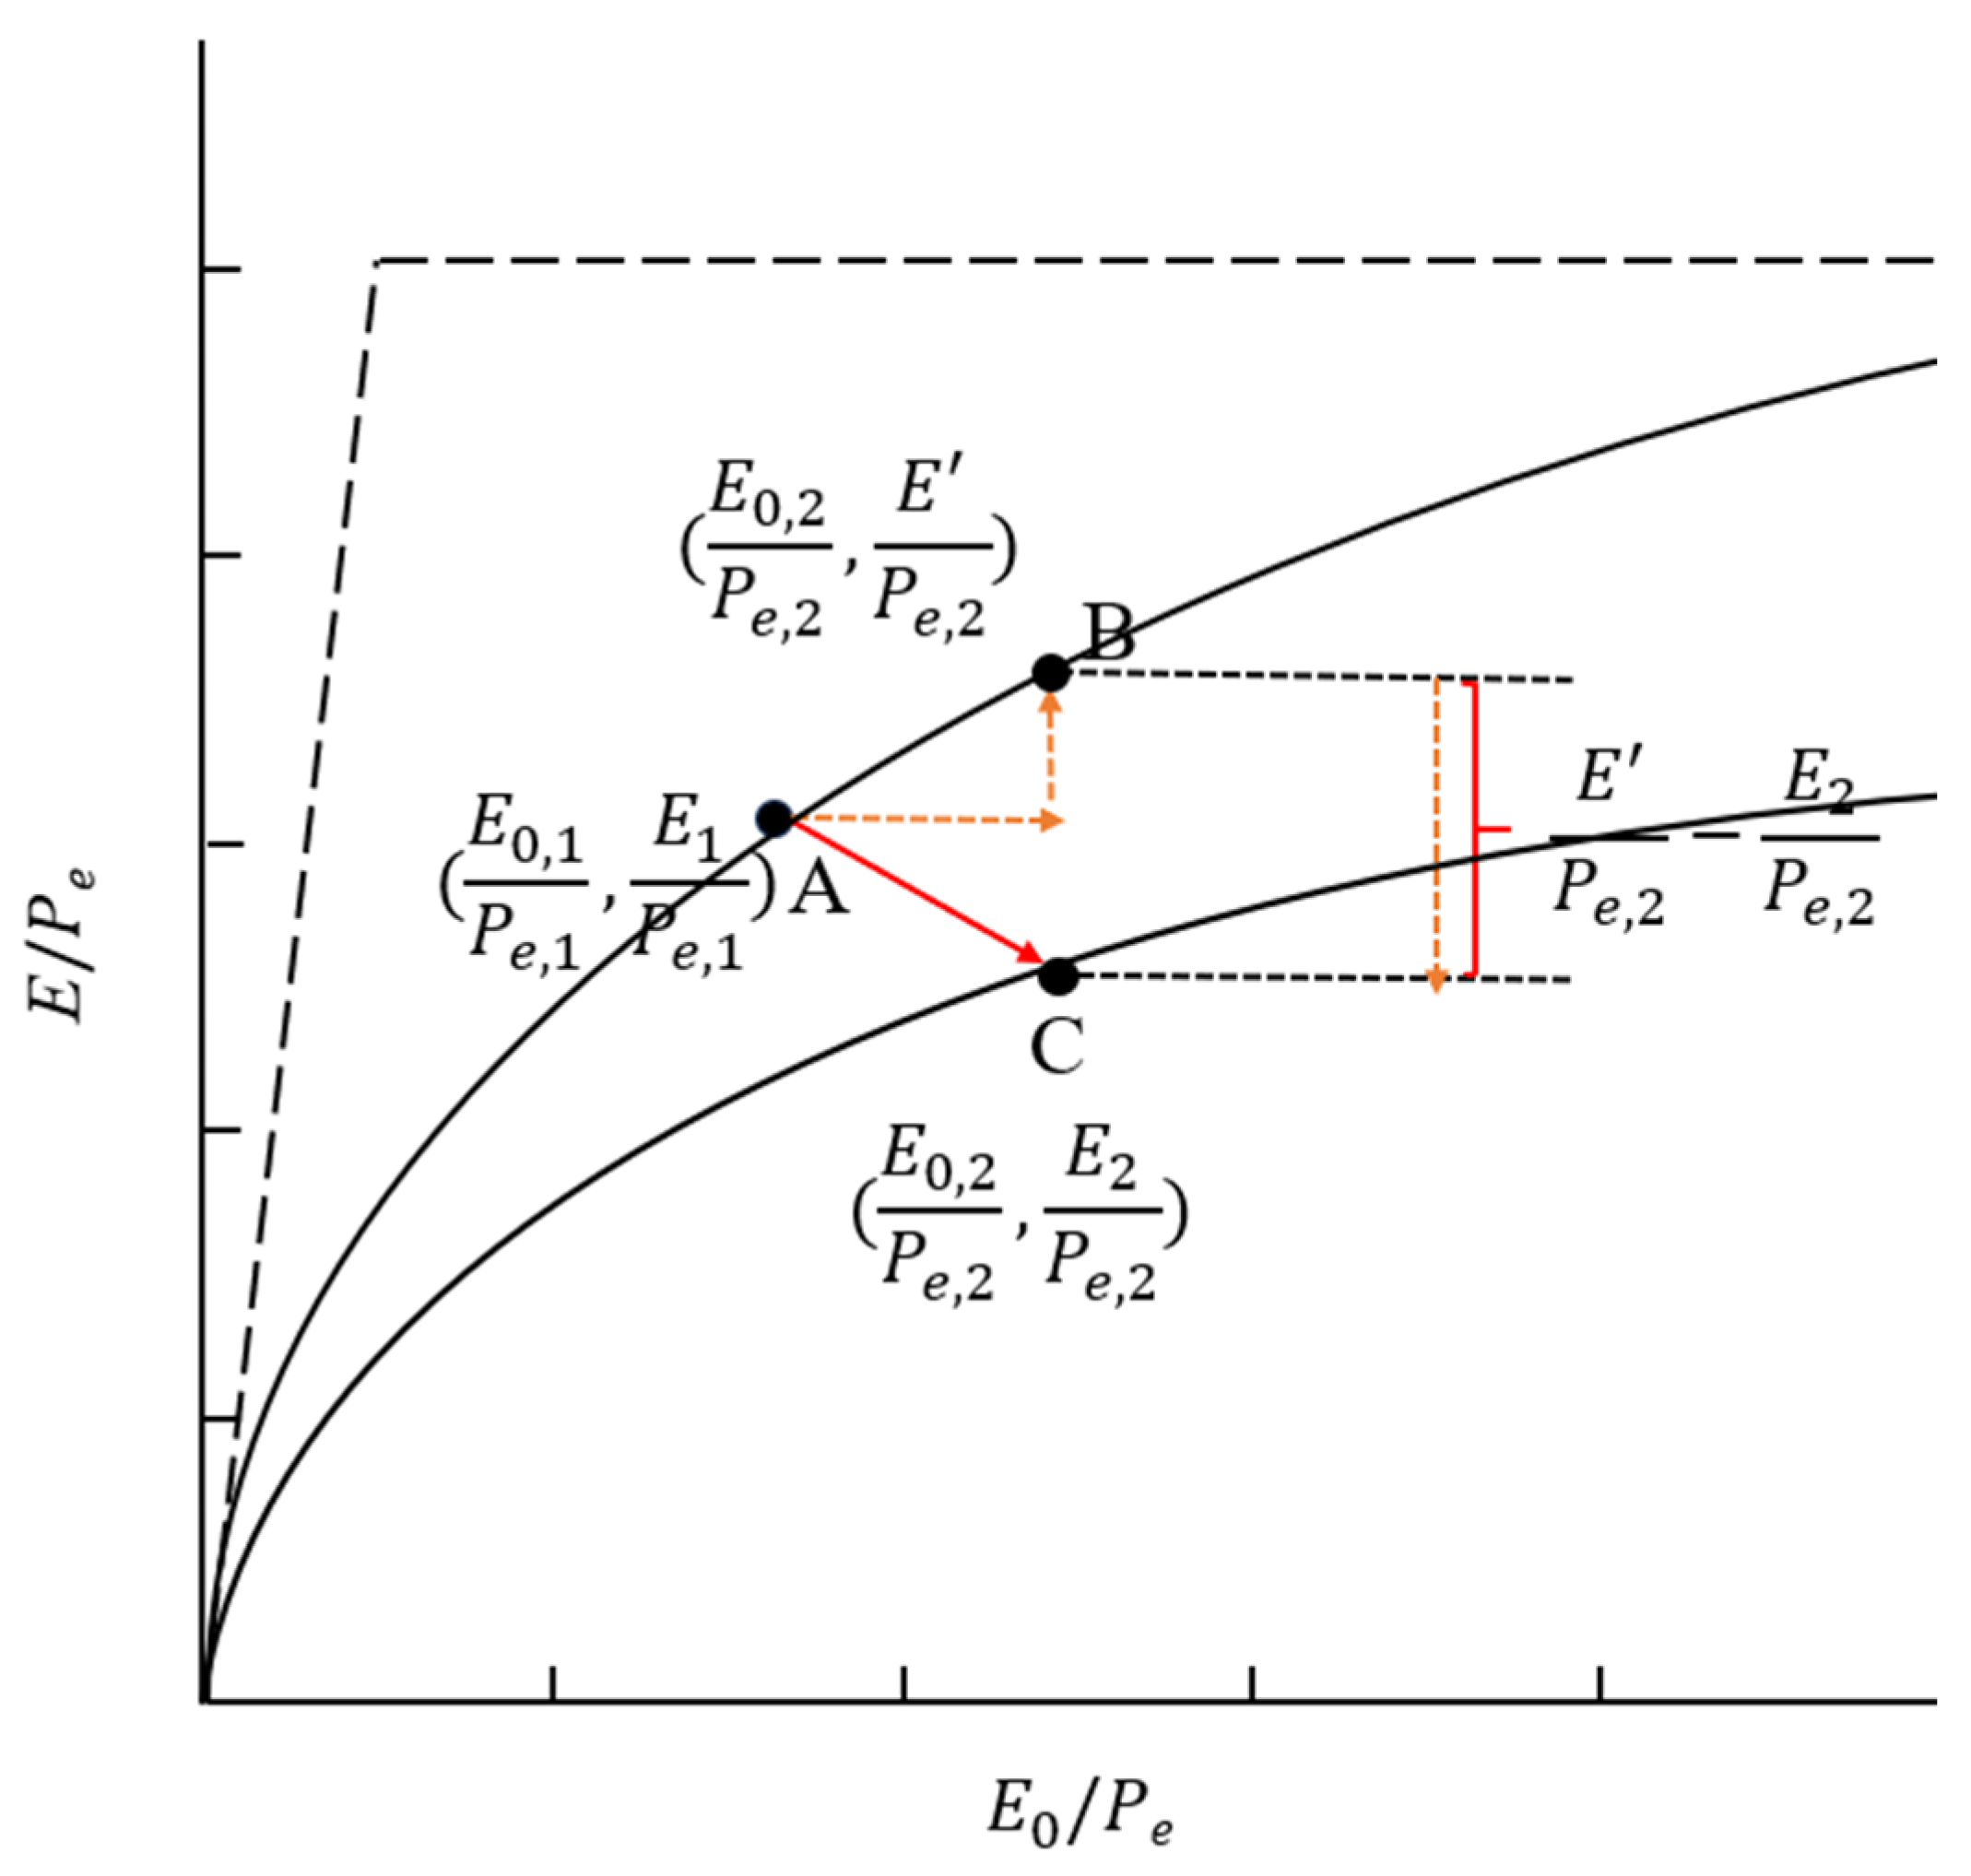
3.3.1. Budyko Vertical Decomposition with Total Differential Method

Figure 3 illustrates the potential trajectories for the evolution of the E/Pe versus E0/Pe relationship from the pre-change state (point A) to a post-change state (point C). Assume that there exists a process point B, which is on the same water–heat balance curve as point A and has the same meteorological conditions as Point C. Suppose that the basin parameter n remains constant, i.e., no change in the underlying surface and the water–heat balance curve remains constant, then the change in runoff from point A to point B can be attributed exclusively to variations in the E0/Pe ratio (representing the climate). Then, the underlying surface changes and the runoff changes from Point B to Point C. The vertical displacement along the trajectory represents changes solely attributable to variations in the basin parameter (representing the underlying surface). Therefore, the amount of runoff change due to the climate and underlying land surface changes can be expressed as follows, respectively [33,54]:
Δ R h = P e , 2 ( E 2 P e , 2 E 2 P e , 2 )
Δ R c = Δ R Δ R h
The vertical decomposition method can only divide the runoff change into two components, namely climate-induced and underlying land surface-induced, without further distinguishing the individual impacts of effective precipitation and potential evapotranspiration. Here, we propose a differential equation to quantify the contributions of effective precipitation and potential evapotranspiration to changes in the actual dryness index DIe, thereby deriving their respective contribution rates to runoff.
The total differential of DIe can be expressed as follows:
d D I e = 1 P e d E 0 E 0 P e 2 d P e
Equation (16) is approximated numerically by applying the central difference form:
Δ D I e 1 P e ¯ Δ E 0 E 0 ¯ P e ¯ 2 Δ P e
P e ¯ = P e , 1 + P e , 2 2 , E 0 ¯ = E 0 , 1 + E 0 , 2 2
Therefore, effective precipitation- and potential evapotranspiration-induced runoff variations can be expressed as follows:
Δ R p e = Δ R c * ( E 0 ¯ P e ¯ 2 Δ P e ) / Δ D I e
Δ R E 0 = Δ R c * ( 1 P e ¯ Δ E 0 ) / Δ D I e

3.3.2. Budyko Complementary Relationship Method

Under the assumption that Pe and E0 are mutually independent, the following complementary relationship exists between the coefficients of bias elasticity of R with respect to Pe and E0 [32]:
R / R P e / P e + R / R E 0 / E 0 = 1
Based on this complementary relationship, Δ R and Δ R h are calculated using the following equations:
Δ R = ( δ R δ P e ) Δ P e + ( δ R δ E 0 ) Δ E 0 + P e Δ ( δ R δ P e ) + E 0 Δ ( δ R δ E 0 )
Δ R h = P e Δ ( δ R δ P e ) + E 0 Δ ( δ R δ E 0 )
Here, the runoff reduced by Pe and E0 is calculated by combing the partial derivatives of runoff to each influencing factor and the change magnitude in the influencing factor.

3.4. Water Storage Simulation

The ABCD model is applied to simulate basin water storage variations. Driven only by potential evapotranspiration and precipitation data, the ABCD model can simulate runoff R, actual evapotranspiration E, groundwater storage G and soil water storage S [55]. Two variables, water availability W and evapotranspiration opportunity Y, are defined and assumed to be nonlinear functions:
Y i = E i + S i
W i = P i + S i 1
Y i ( W i ) = W i + b 2 a [ ( W i + b 2 a ) 2 W i b a ]
where Ei and Pi are the actual evapotranspiration and precipitation during the time period, and Si and Si-1 are the soil water storage at the i and i-1 time period, respectively. a denotes the tendency of runoff to occur before the soil is saturated, with a value in the range of (0, 1), where runoff does not occur when a is 1. b indicates the upper limit of the sum of the actual evapotranspiration and the soil water storage (mm). The water availability minus evapotranspiration can be categorized as direct runoff Di and groundwater recharge R i :
D i = ( 1 - c ) ( W i - Y i )
R i = c ( W i Y i )
The parameter c is the groundwater recharge coefficient. The following model uses the linear reservoir model to simulate the baseflow:
F i = d G i
where Gi is the groundwater storage, mm; Fi is the base flow, mm; and d is the groundwater storage and release coefficient. Total runoff is obtained by adding the direct runoff Di and base flow Fi. Total water storage is the sum of groundwater storage and soil water storage.
The Nash–Sutcliffe efficiency coefficient (NSE) and Kling–Gupta efficiency coefficient (KGE) are selected as the evaluation indexes, which are expressed as follows [56].
N S E = 1 i = 1 n ( R o b s R s i m ) 2 i = 1 n ( R o b s R o b s ¯ ) 2
K E G = 1 ( C C 1 ) 2 + ( B R 1 ) 2 + ( R V 1 ) 2
where
C C = cov ( R s i m , R o b s ) σ R s i m σ R o b s       B R = R s i m ¯ R o b s ¯       R V = ( σ R s i m / R s i m ¯ ) / ( σ R o b s / R o b s ¯ )
where R s i m is the simulated runoff and R o b s is the observed runoff, CC is the Pearson correlation coefficient, BR is the bias ratio and RV is the relative rate of change.
The ABCD model was calibrated by a genetic algorithm (GA), and the four parameters a, b, c and d were obtained with the largest NSE and KEG values.

3.5. Land Use/Cover Changes (LUCC)

3.5.1. LUCC Transfer Matrix

The LUCC transfer matrix shows the conditions at the start and end of a period and enables a quantitative analysis of the transfer directions and amounts of different LUCC types [57]. The expression of the LUCC transfer matrix is as follows:
S i , j = S 11 S 1 n S n 1 S n n
where i and j represent the LUCC types at the start and end of the period, respectively, while n refers to the number of LUCC types that have undergone conversion and Si,j represents the LUCC status from the start to the end of the period [58].

3.5.2. LUCC Dynamic Degree

The single LUCC dynamic degree describes the intensity of a specific LUCC’s variation over time, and is calculated by the following formula:
K i = U i , 2 U i , 1 U i , 1 × 1 T × 100 %
where Ki denotes the dynamic degree of LUCC type i; Ui,1 and Ui,2 are the area of LUCC type i at the beginning and end of the time period, respectively (km2); and T is the length of the time period [59].
The comprehensive LUCC dynamic degree describes the intensity of the overall LUCC and is calculated by the following formula:
L C = i = 1 n Δ U i j 2 i = 1 n U i , 1 × 1 T × 100 %
where LC denotes the comprehensive LUCC dynamic degree for a certain time period; Ui,1 is the area of LUCC type i at the beginning of the period; ΔUi-j is the absolute value of the area of the conversion from LUCC type i at the beginning of the period to LUCC type j (ij) at the end of the period; and T is the length of the study period.

4. Results

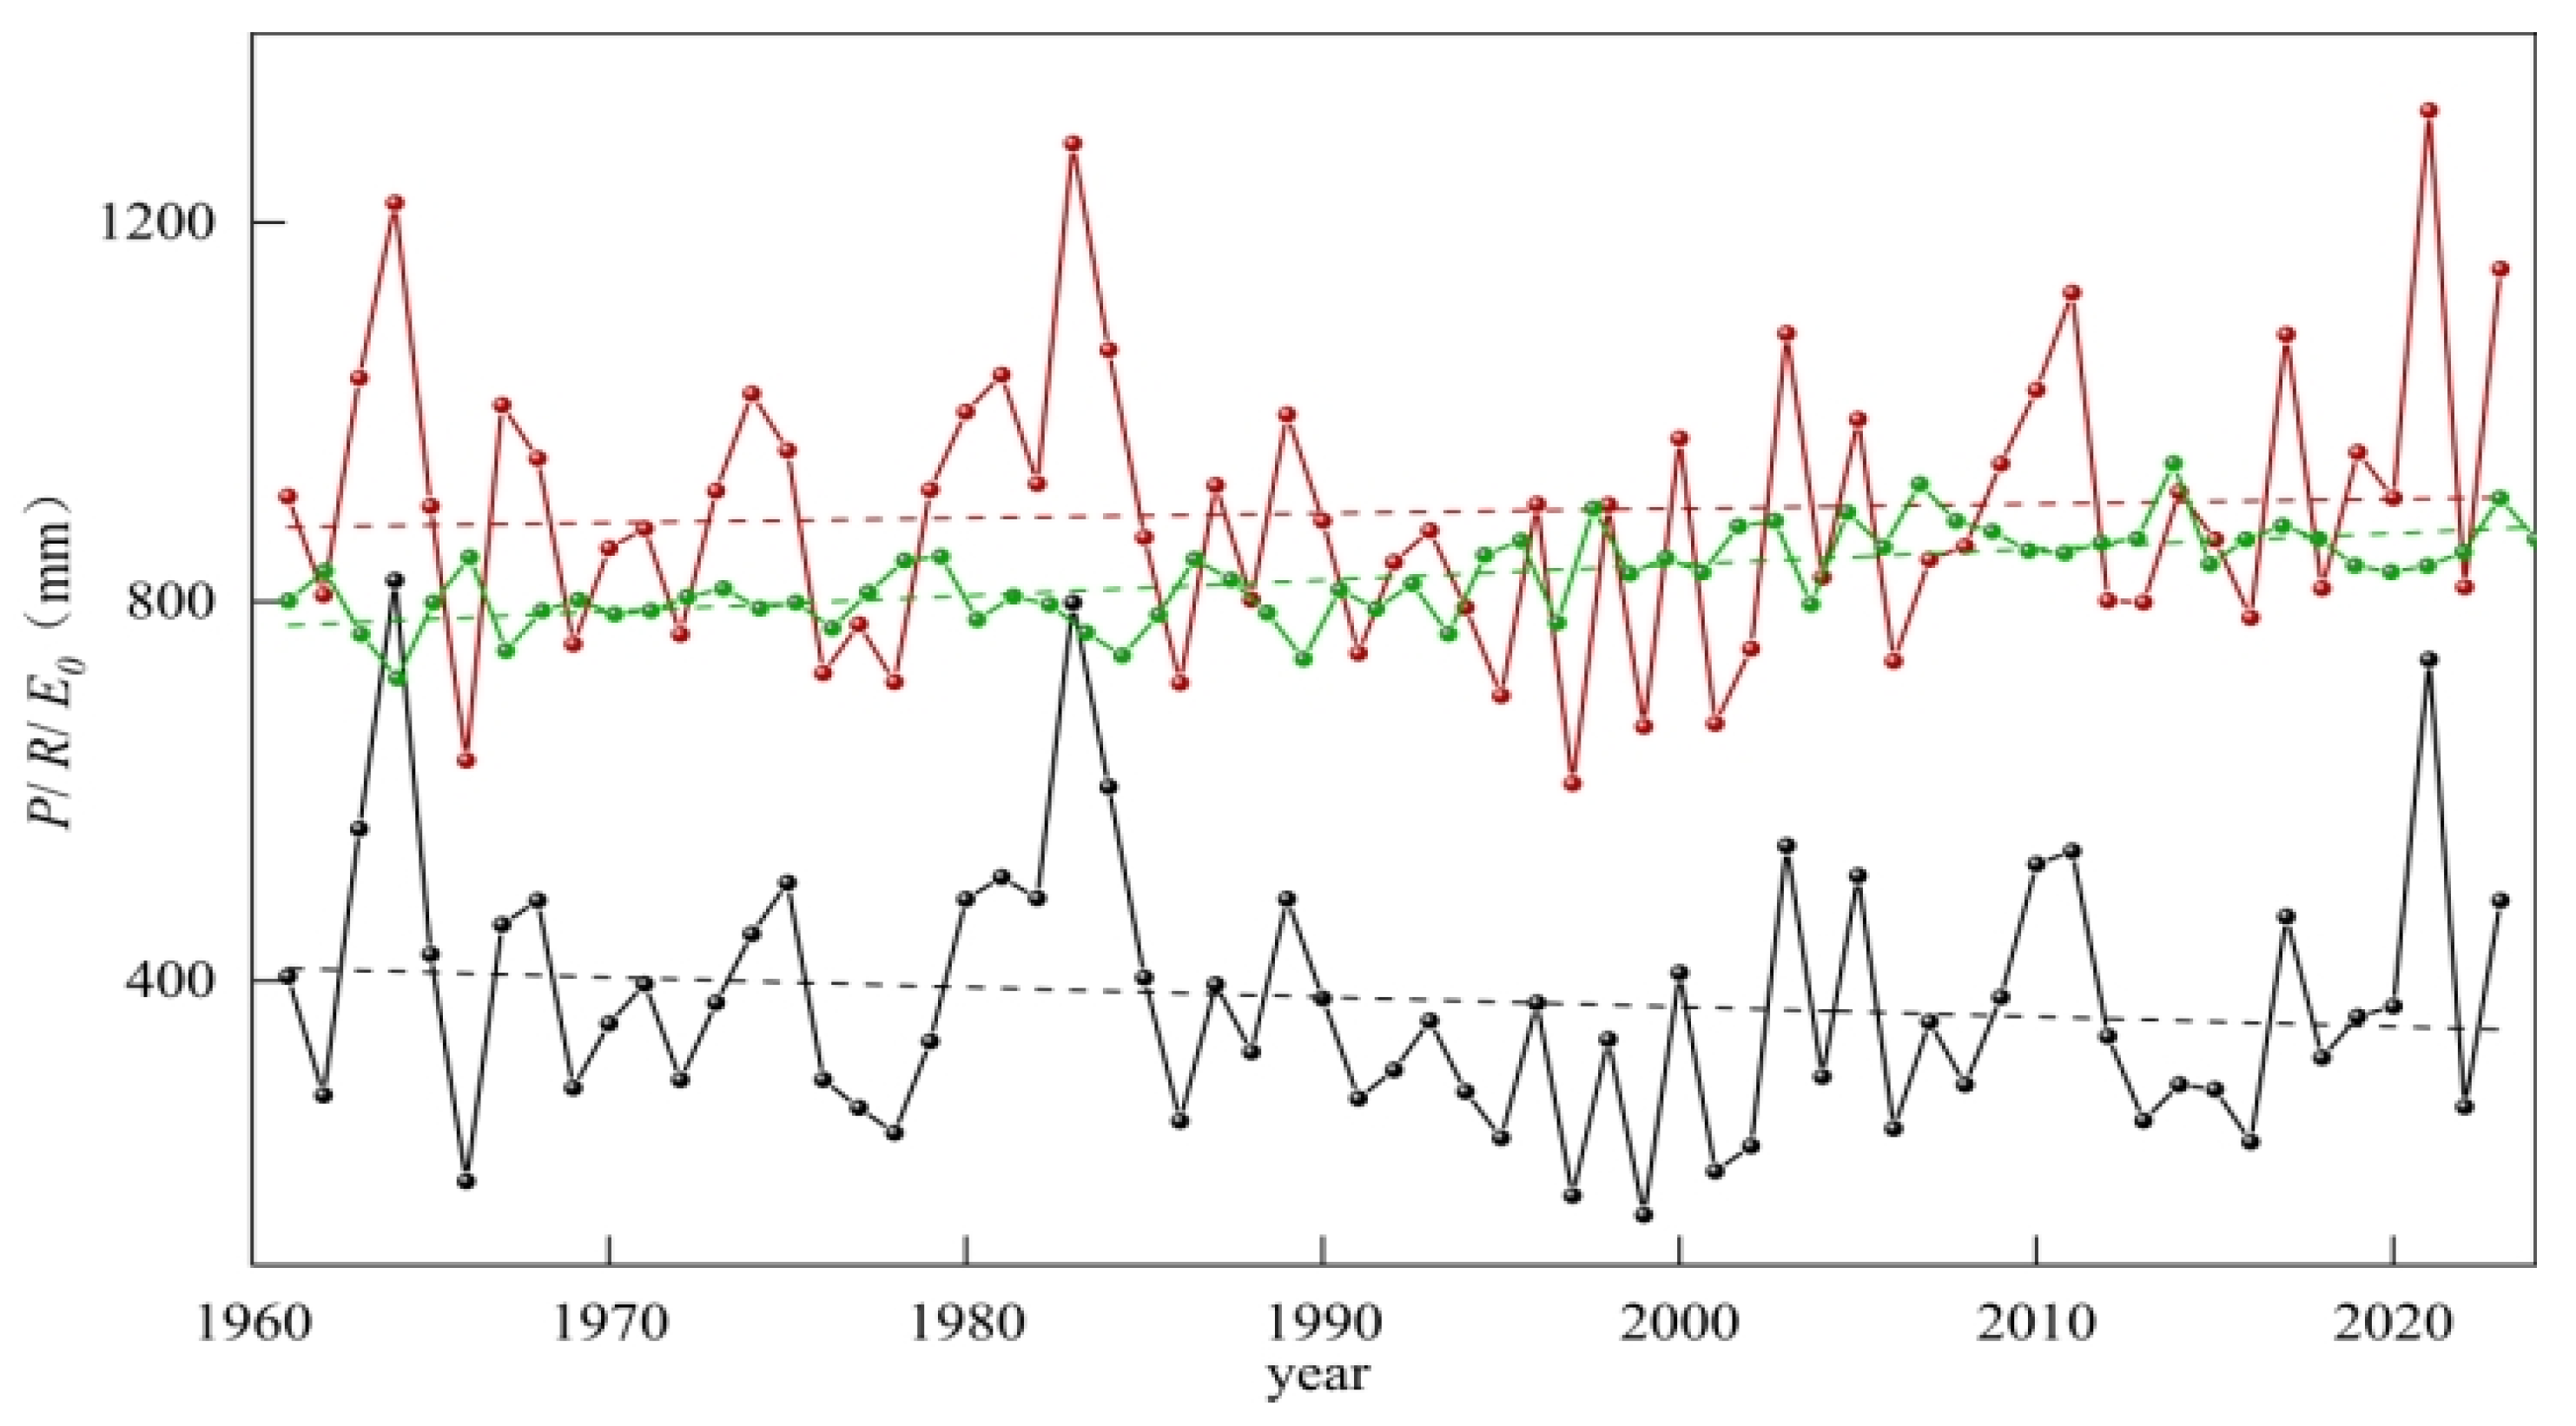
4.1. Trend in Runoff and Its Influencing Factors

4.1.1. Interannual Variability

A comparison of annual precipitation (P), potential evapotranspiration (E0) and runoff depth (R) is shown in Figure 4.
From 1961 to 2023, precipitation increased at a rate of 0.5 mm/year, potential evapotranspiration increased at a rate of 2.06 mm/year and runoff decreased at a rate of -1.71 mm/year. The change curves of annual precipitation and runoff are similar in shape. The maximum annual runoff depth of 822.53 mm occurred in 1964, when the corresponding precipitation and potential evapotranspiration of the same year was the third highest and the minimum, respectively, in the 63-year period. The minimum annual runoff depth was 152.86 mm and occurred in 1999, when the precipitation of the same year ranked 61st in the 63-year period, and potential evapotranspiration ranked 24th. Precipitation is the primary source of runoff, yet runoff decreased as precipitation increased slightly, indicating that the enhancement of the basin’s evapotranspiration capacity is the leading factor influencing reduced inflow runoff in the Danjiangkou Reservoir.

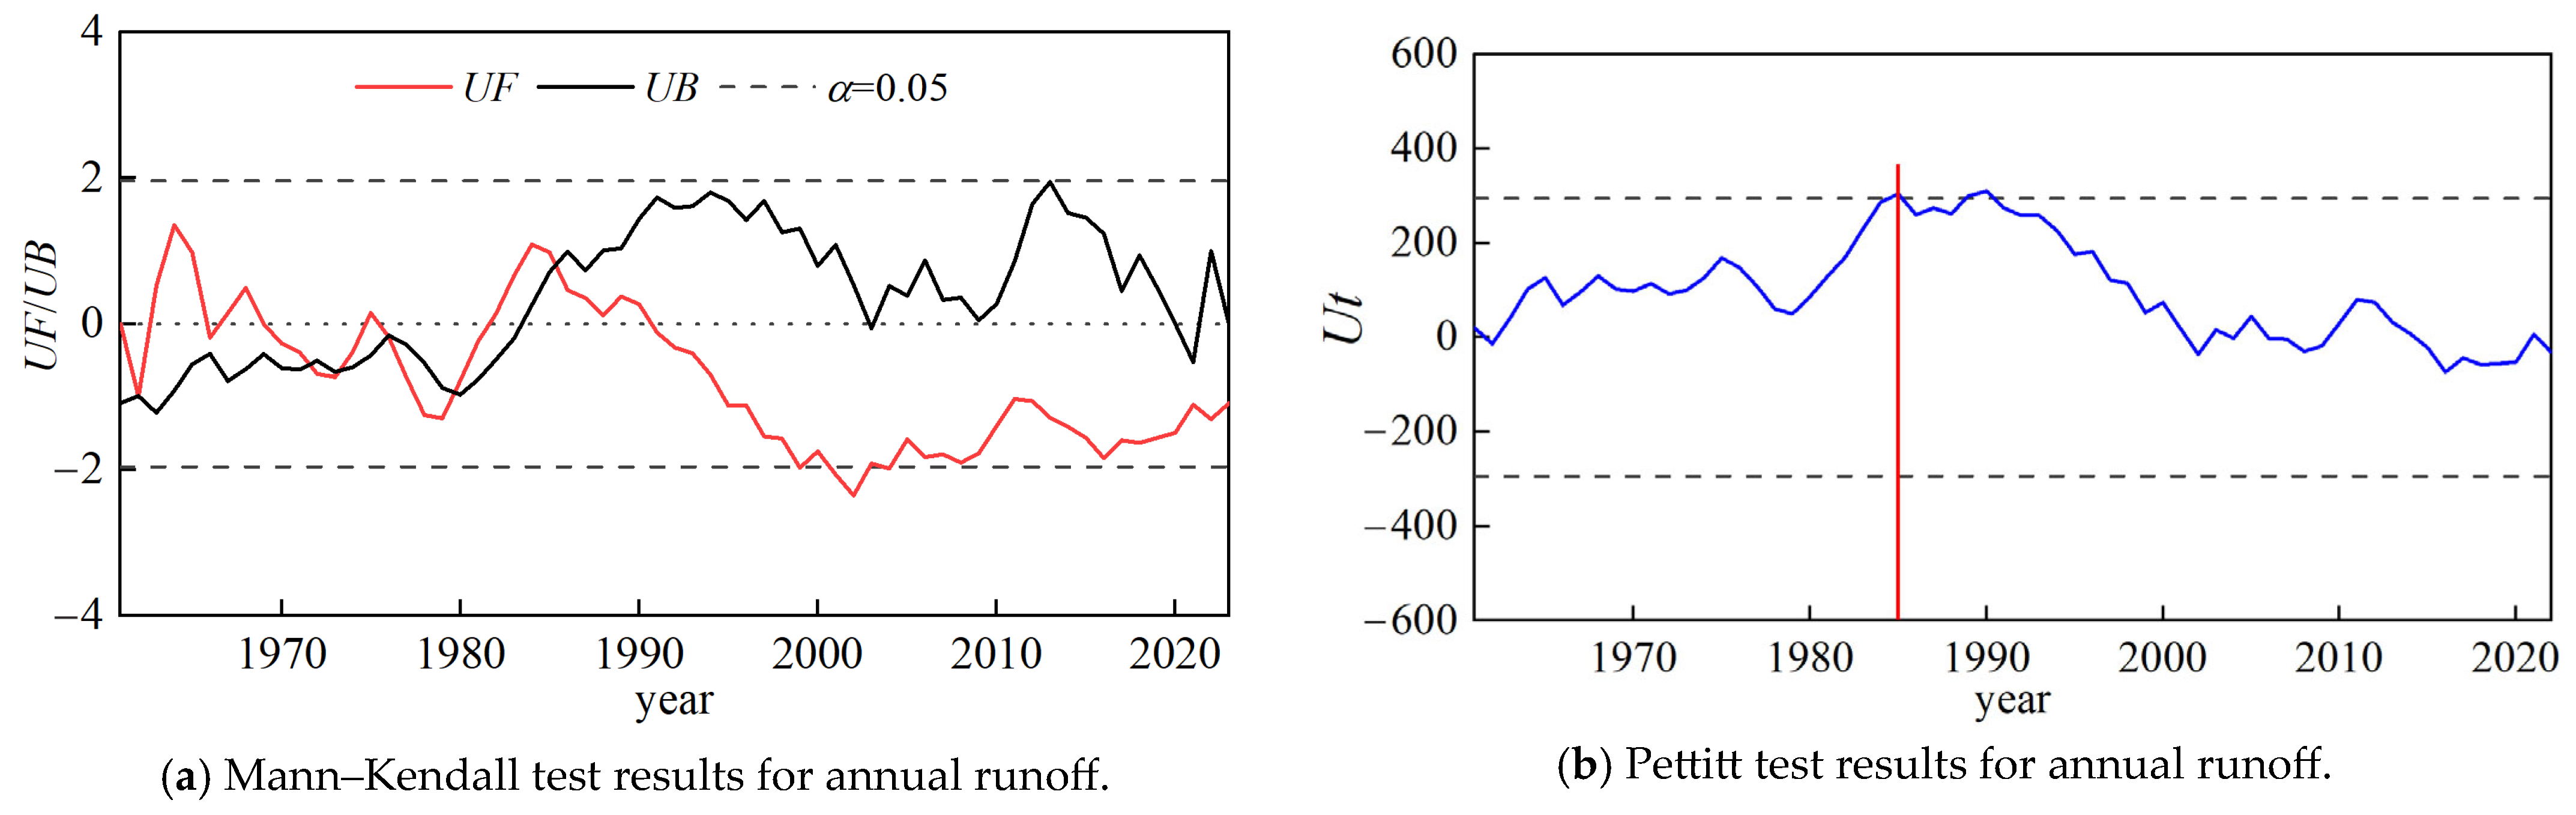
4.1.2. Runoff Mutation Point Detection

Identifying the mutation point and dividing the study period into a reference period and change period was the foundation for the runoff attribution analysis. The Mann–Kendall test showed that runoff mutated in1985 (Figure 5a). The Pettitt test showed that the annual runoff changed abruptly in 1985 at the 0.05 significance level (Figure 5b). Therefore, the study period was divided into two phases: the reference period (1961–1985) and the change period (1986–2023).

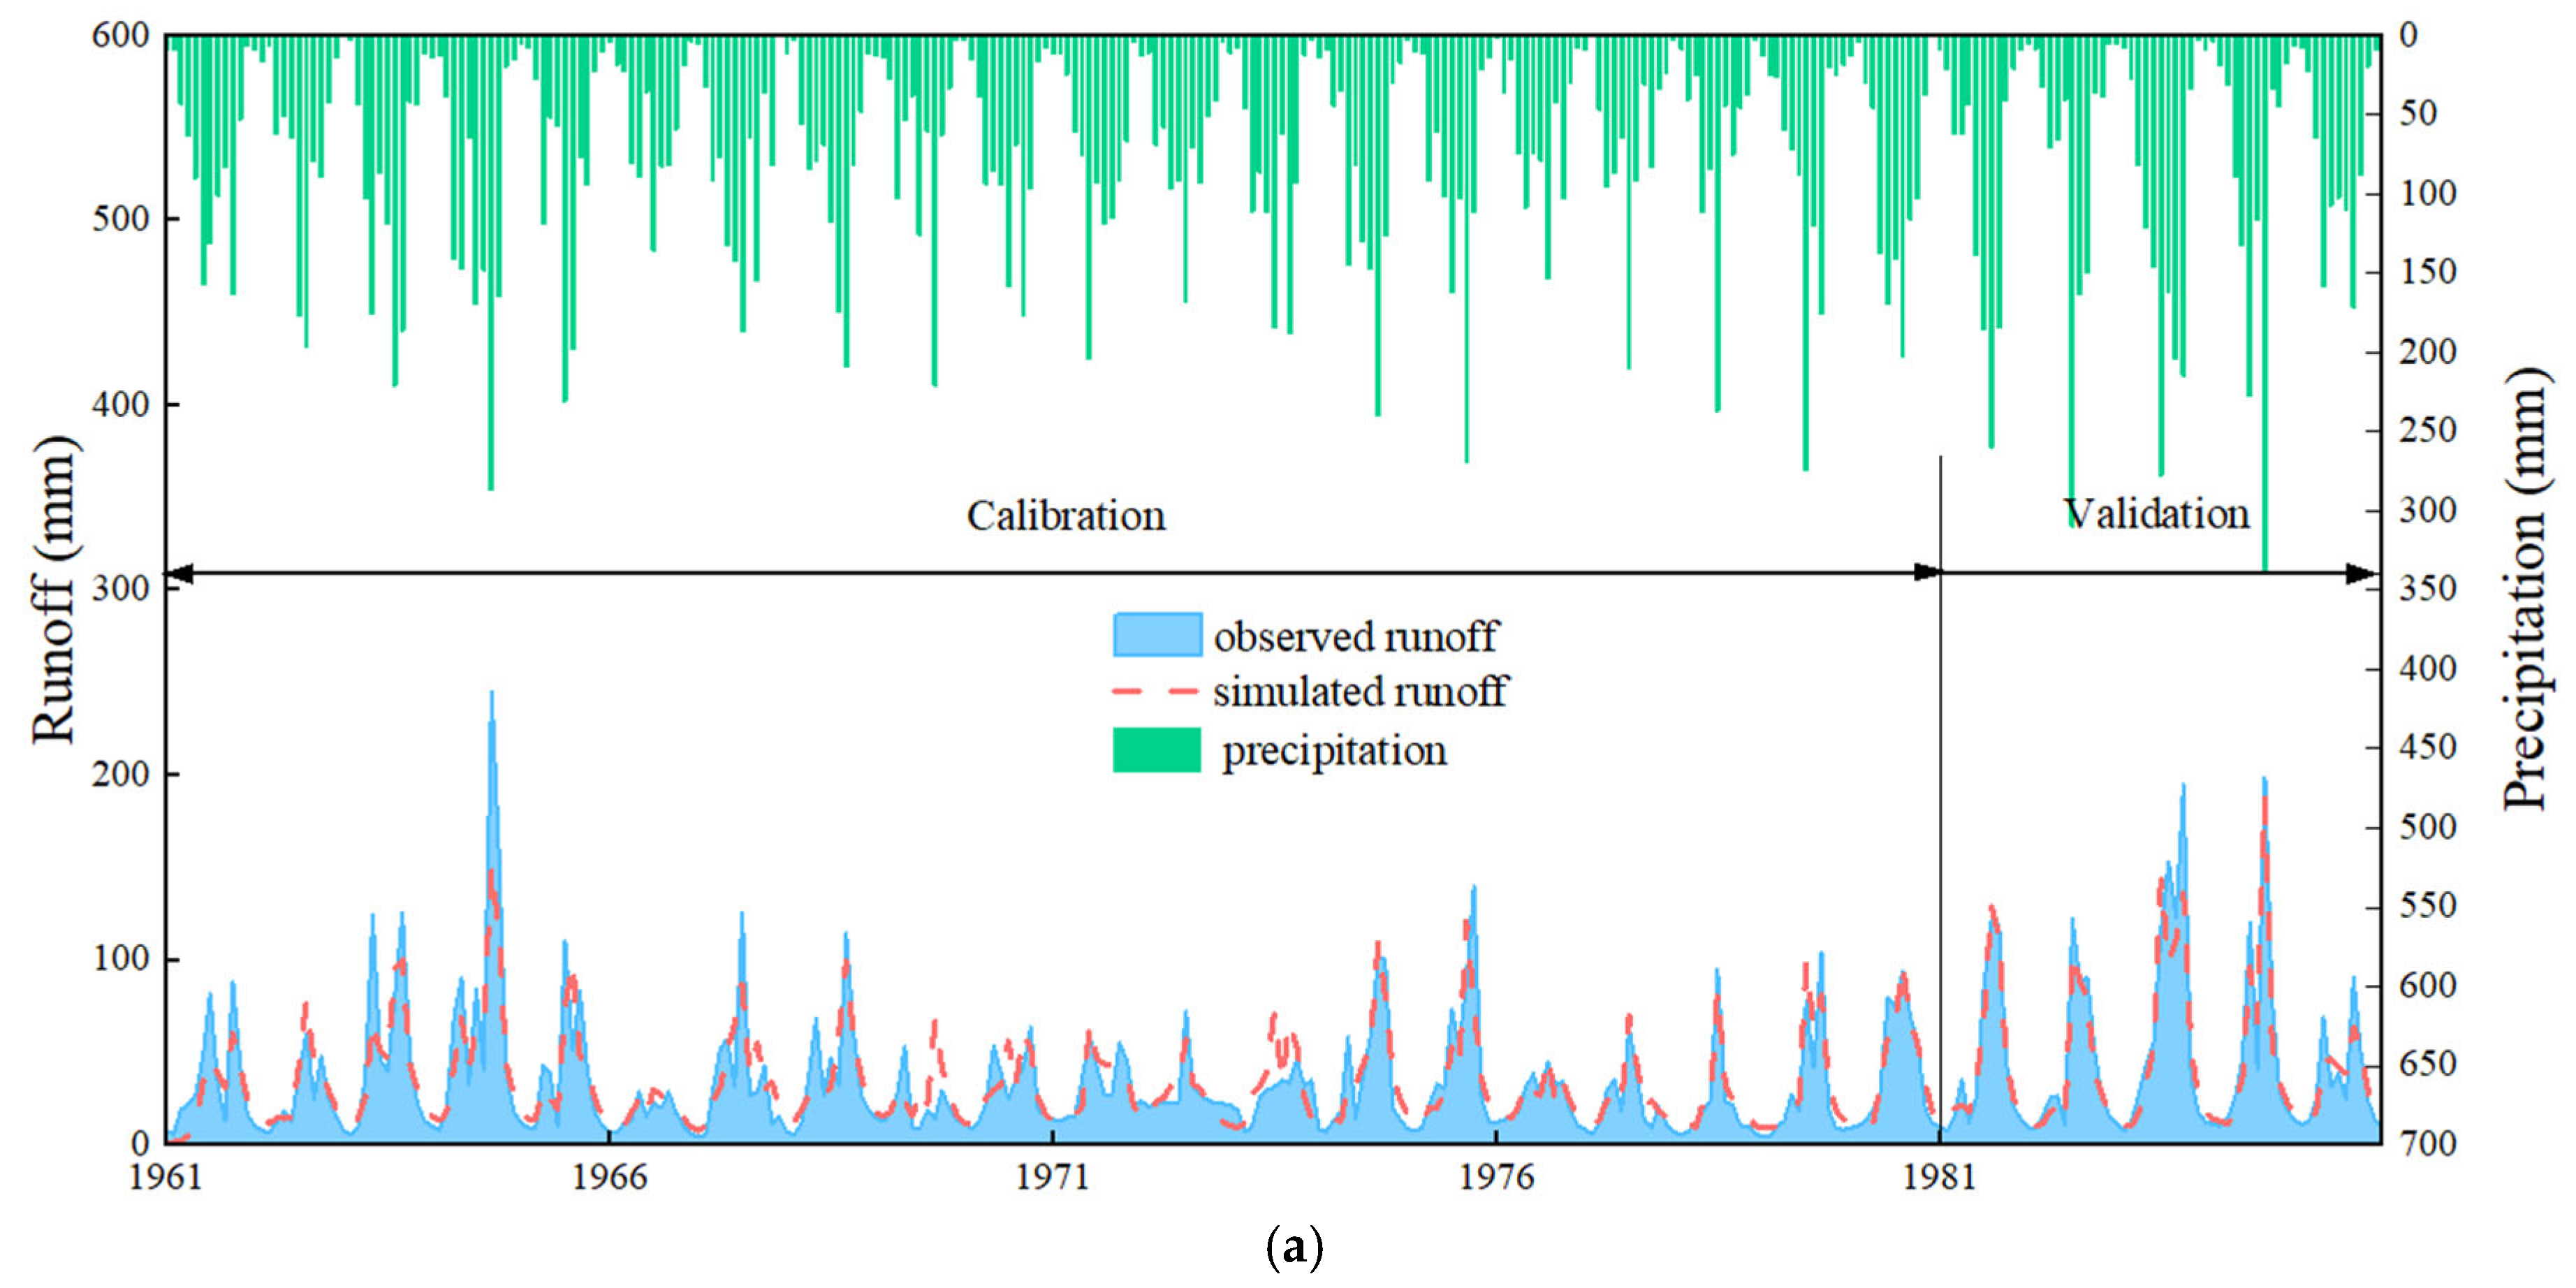
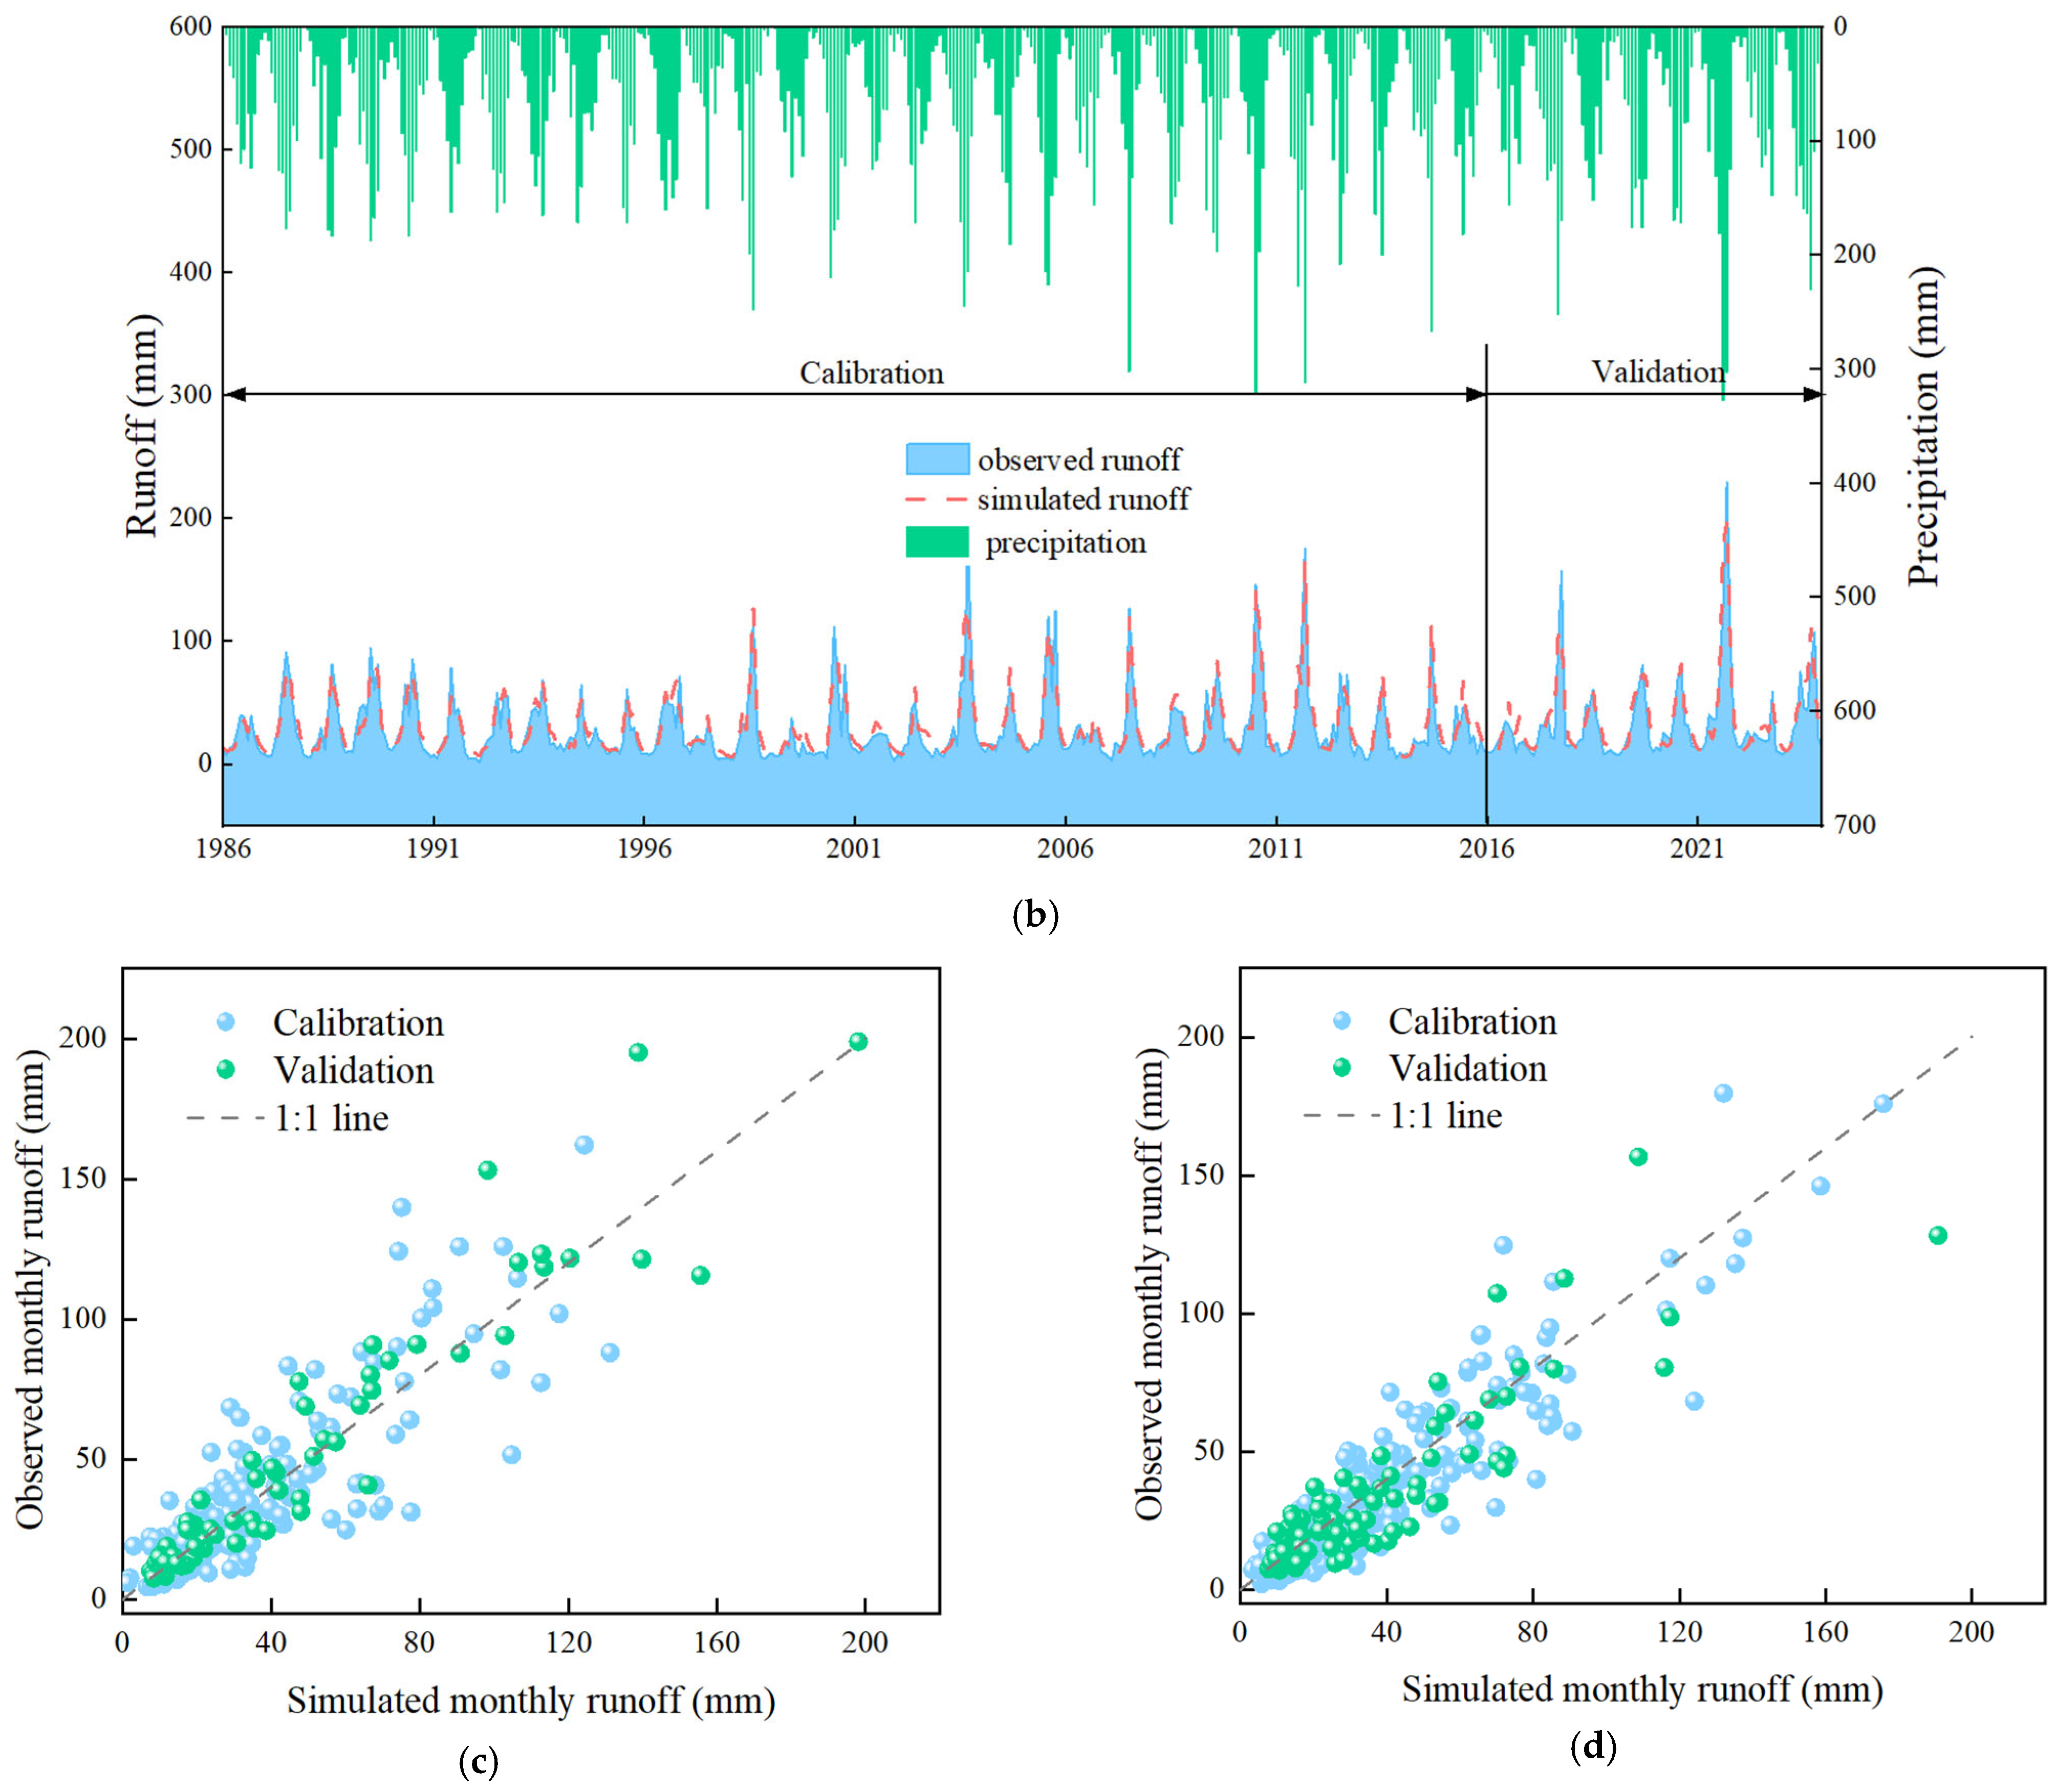
4.2. Calibration and Validation of ABCD Model

The reference period (1961~1985) and change period (1986~2023) were both divided into calibration and validation periods following the principle “80% for calibration and 20% for validation”. The period of 1961~1980 was for calibration and 1981~1985 for validation in the reference period, and 1986~2015 was for calibration and 2016~2023 for validation in the change period. Table 1 shows the calibrated parameters and evaluation metrics of the ABCD model. The model performed well, with NSE values of 0.80 (calibration) and 0.90 (validation) during the reference period. In the change period, the NSE values were 0.85 and 0.84, and the KGE values were 0.90 and 0.89 during the calibration and validation periods, respectively. Comparisons of the monthly observed and simulated runoff are shown in Figure 6, which illustrates that the ABCD model can fit low flows well in scatter plots.

4.3. Runoff Attribution Results

4.3.1. Sensitivity Analysis of Runoff Changes

Table 2 presents the sensitivity analysis of runoff change to effective precipitation, potential evapotranspiration and the basin parameter ω over different time scales. At the annual scale, the sensitivity coefficients of runoff to effective precipitation, potential evapotranspiration and ω were 1.67, –0.67 and –1.19, respectively. This indicates that a 1% increase in effective precipitation resulted in a 1.67% increase in runoff, while a 1% increase in potential evapotranspiration or ω led to a 0.67% and 1.19% decrease in runoff, respectively.
Flood and dry season comparisons indicate that runoff shows greater sensitivity to effective precipitation and potential evapotranspiration during the flood season, whereas it is more sensitive to changes in the watershed parameter during the dry season. In terms of runoff variations, annual runoff depth decreased by 79.81mm (−18.60%), with flood-season runoff declining by 29.06 mm (−12.81%) and dry-season runoff decreasing by 50.75mm (−25.09%). As for meteorological factor changes, effective precipitation declined by 35.94 mm annually, 14.62 mm during the flood season and 21.32 mm during the dry season, while potential evapotranspiration increased by 67.35 mm, by 21.44 mm and 45.91 mm, respectively. The basin parameter increased at both the annual and seasonal time scales. Based on runoff sensitivity and the influencing factor analysis, all factors consistently contributed to a reduction in runoff depth.

4.3.2. Attribution Analysis Results at Annual and Seasonal Time Scales

Table 3 presents the runoff reduction attribution results derived from the Budyko Complementary Relationship (BCR) method and the Budyko Vertical Decomposition with Total Differential (BVD-TD) method. The results indicate that meteorological factors are the dominant drivers of runoff reduction in the UHRB, both at the annual and seasonal time scales. A comparison of the BCR and BVD-TD methods reveals that the BCR method attributes more to the basin parameter. When partitioning the contributions of effective precipitation and potential evapotranspiration, the BVD-TD method tends to overestimate the effect of potential evapotranspiration. This may be attributed to a limitation of the analytical framework: while the Budyko curve accounts for water and energy balance constraints, the runoff sensitivity to potential evapotranspiration will decrease under high dryness conditions. However, the total differential method assumes a fixed linear slope, leading to an overestimation of the contribution of potential evapotranspiration. The mean value of the two methods is adopted in the final results. At the annual scale, the effective precipitation, potential evapotranspiration and basin parameter ω contribute 28.17%, 32.84% and 38.99% of the runoff reduction, respectively. At the seasonal scale, the basin parameter plays a dominant role in runoff reduction during the dry season, with a contribution rate of 49.80%, while effective precipitation is the primary driver of runoff reduction during the flood season, contributing 33.79%.

4.4. LUCC and NDVI Variations

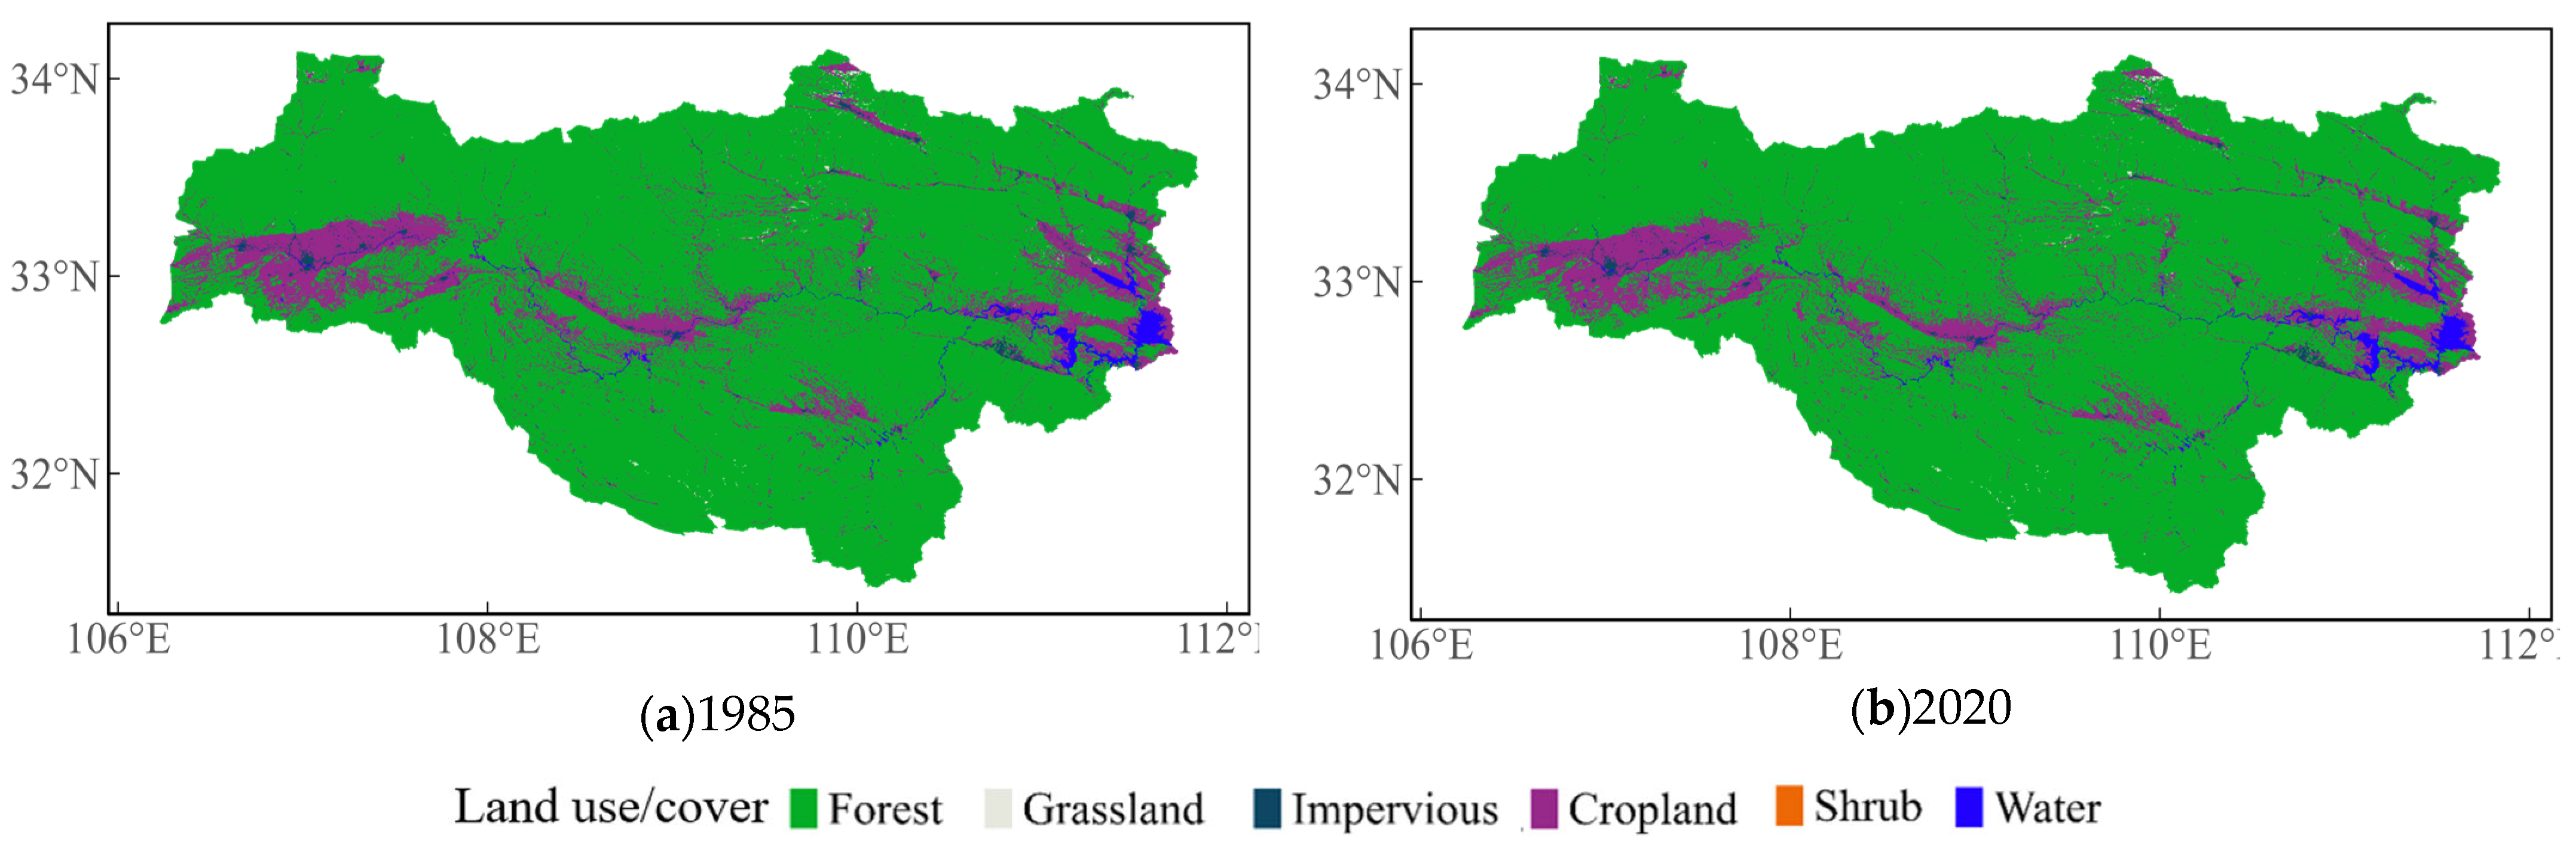
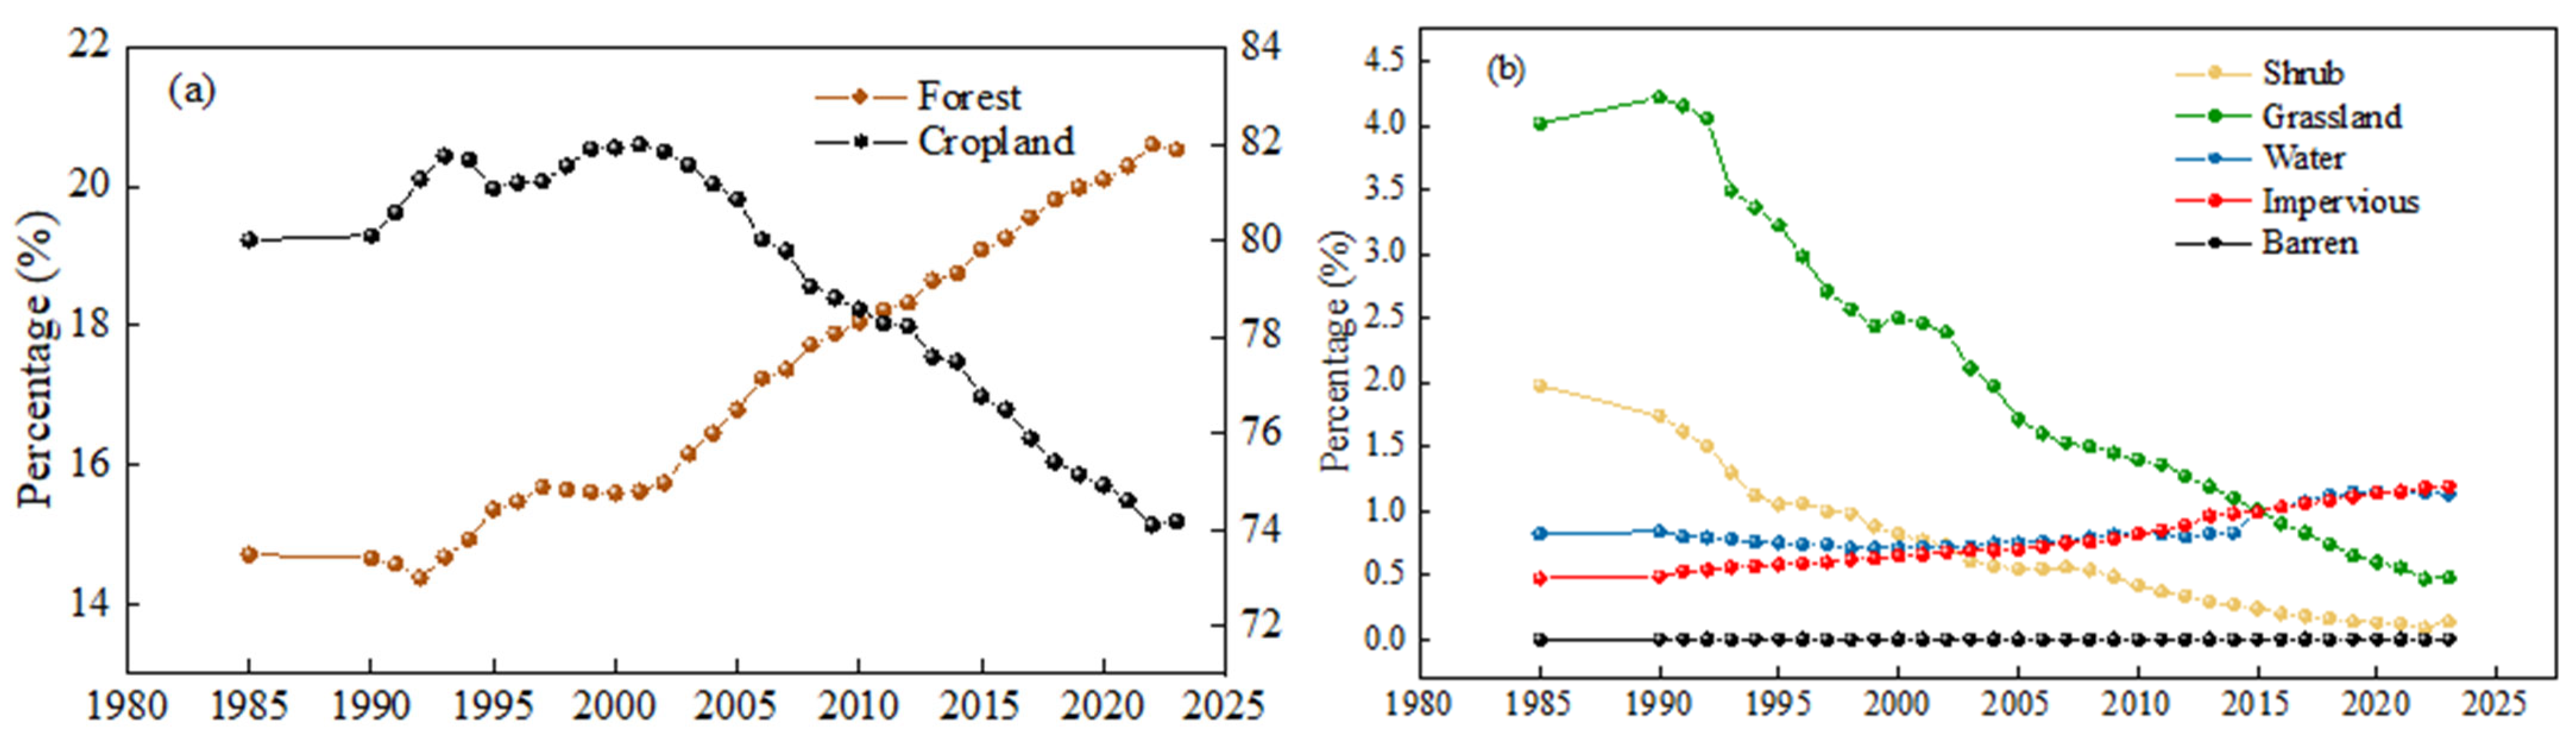
4.4.1. LUCC Variations

Changes in the LUCC in the UHRB are shown in Figure 7. Areas of different LUCCs are obtained, and the interannual trends are shown in Figure 8. The main LUCC types of the basin are cropland and forest, which account for 15.14~20.06% and 73.01~81.99% of the total basin area, respectively.
From 1985 to 2023, the most significant shift was the continuous increase in forest area (Figure 8a), attributed to the “Grain-for-Green” policy implemented since the late 1990s [60]. Forest expansion typically enhances precipitation retention and canopy interception, while also increasing root-zone water uptake and evapotranspiration. Consequently, forest growth can significantly reduce surface runoff, particularly during periods of moderate rainfall, by promoting infiltration and delaying overland flow generation. The cropland area showed an upward and then a downward trend, reaching its maximum value in 2001 and then proceeding to decline. As cropland generally has lower evapotranspiration rates compared to forests, its reduction and replacement by forests further reinforced the upward trend in evapotranspiration. Additionally, the decrease in grassland and brushland, both of which typically have moderate water retention capacities, may have had a marginal effect on evapotranspiration dynamics but contributed less to large-scale runoff change. The expansion of impervious surfaces, although limited in their total area (<5%), may have led to localized increases in surface runoff and reduced infiltration, especially in urbanized zones. Conversely, the fluctuation in water bodies, with a decline before 2000 and recovery thereafter, may reflect reservoir expansion or land reclamation activities, but their overall hydrological impact remains secondary due to the relatively small proportion of their total area. The afforestation trend played a key role in enhancing actual evapotranspiration and reducing annual and seasonal runoff in the basin, amplifying the effects of climatic factors under a changing environment.
The LUCC dynamic degrees in the UHRB from 1985 to 2023 are shown in Table 4. The single dynamic degrees of the cropland area from 1985 to 2000 (every 5a) are all positive, and the largest value of 0.71% appears in the period from 1990 to 1995. From 2000 to 2023, the dynamic degree of cropland is negative, and its value is small in the period from 2005 to 2010, with the absolute value reaching 1.6%. For the forest, except for the period of 1985–1990, the dynamic degrees of the forest during the rest of the period are positive, and the value in the period of 2005–2010 reaches its maximum, which is 0.48%. The dynamic degree of shrubland and grassland fluctuated greatly, ranging from −9.17% to 2.56% and −8.12% to 1%, respectively. The dynamic degrees of the water area are negative in 1990~2000 and 2020~2023, and positive in the rest of the period. The water area shows the greatest change in 2010~2015, with a 4.15% dynamic degree. The comprehensive land dynamic results show that from 1985 to 2005, the LUCCs are minor. The maximum comprehensive LUCC dynamic degree of the UHRB is 4%, occurring in 2005~2010, when changes in the forest and cropland areas were the main influencing factors. From 1990 to 1995, 2000 to 2005, 2010 to 2015 and 2015 to 2020, the comprehensive LUCC dynamic degree ranges from 3.6% to 3.7%, while the comprehensive LUCC dynamic degree is less than 1% between 1985 and 1990, indicating the smallest variation.
The LUCC transfer matrices in the UHRB from 1985 to 2023 are shown in Table 5. The total area of cropland transferred in was 13,961.35 km2 and the area transferred out was 17,676.57 km2, and the total area of cropland decreased by 3715.22 km2, having been mainly transformed into forests, imperviousness and water. During the same period, the forest land transferred in was 75,274.27 km2 out of an area of 67,559.54 km2, with an increase in the total area, which was mainly converted from cropland, grassland and shrubland. As for the other LUCC types, shrub and grassland areas decreased by 1690.67 km2 and 3254.27 km2, respectively, while the water and imperviousness areas grew by about 285.40 km2 and 660.64 km2, respectively.
In summary, from 1985 to 2023, the cropland was partially converted to forest land. The area of grassland and shrubland decreased, and the area of water and impervious areas increased. This increased forest area implies higher plant interception as well as evapotranspiration. In addition, the increase in water surface area also results in an increase in evaporation, leading to runoff reduction.

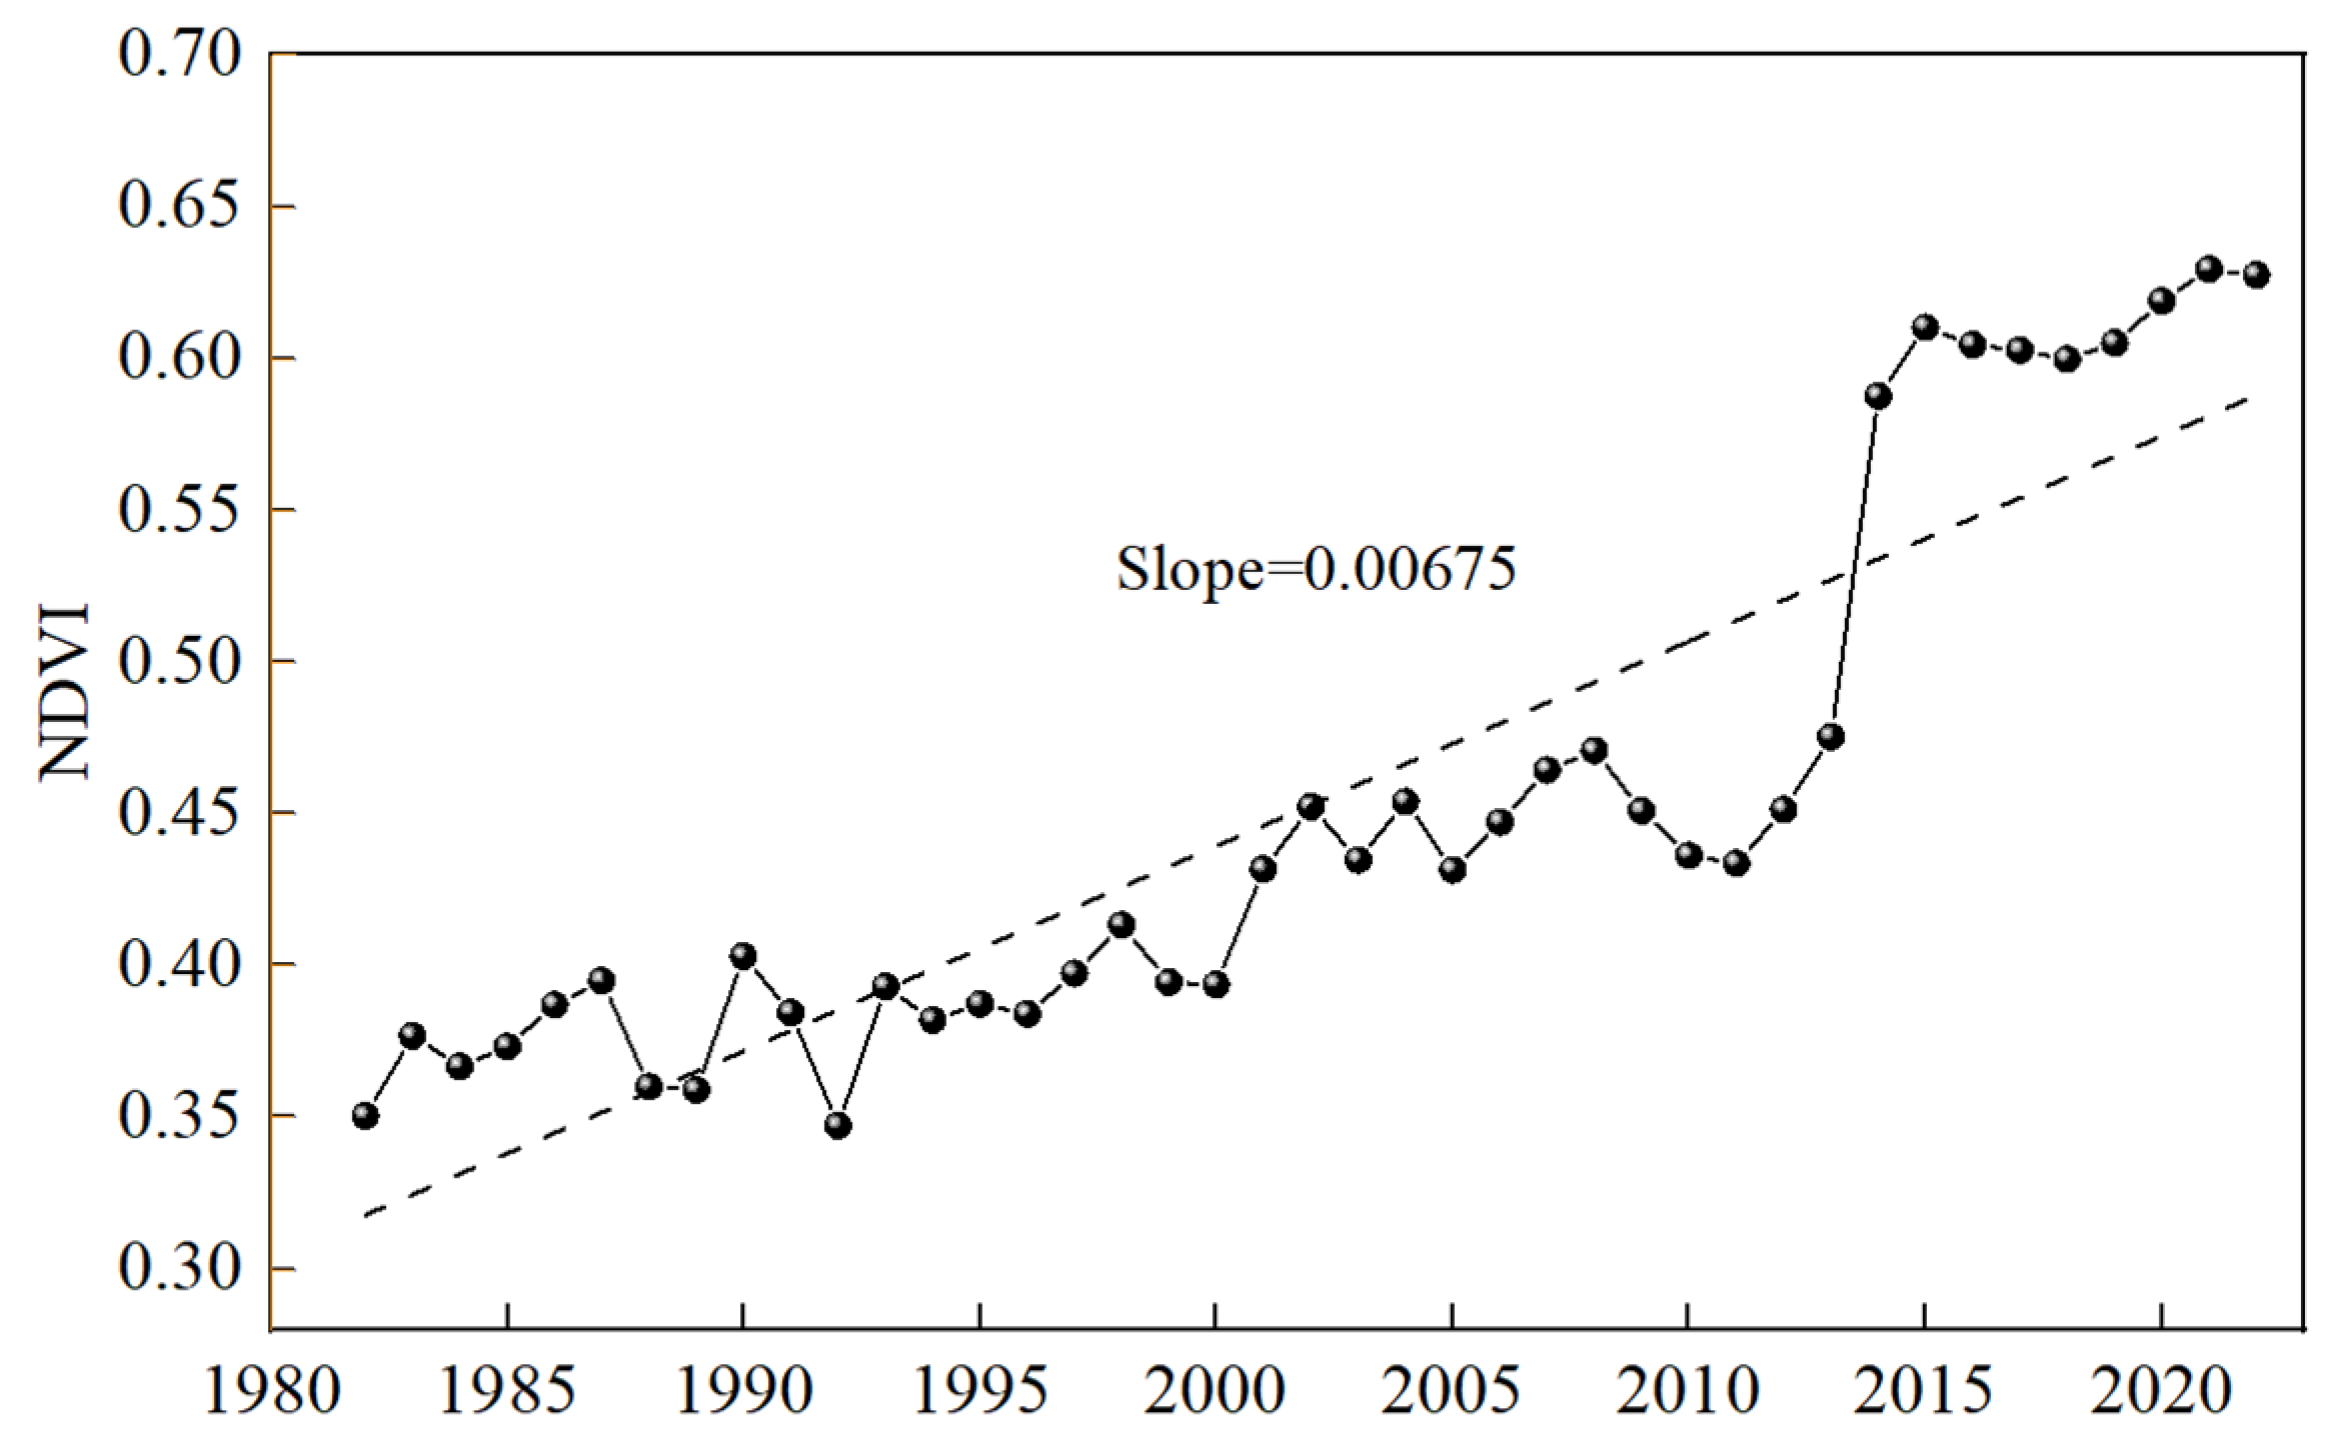
4.4.2. NDVI Variations

Figure 9 demonstrates the temporal variation in the annual basin-averaged NDVI in the upper Han River basin. From 1982 to 2022, the NDVI exhibited a fluctuating upward trend, ranging from 0.35 to 0.63, with maximum and minimum values occurring in 2021 and 1992, respectively. Before 2015, the basin-averaged NDVI was below 0.5, but after 2015, it jumped above 0.5. This phenomenon could be explained by two aspects: One is the reservoir constructions, which increased the water surface area and altered the temperature and humidity around the reservoir area, improving soil moisture and promoting vegetation growth. The other is climate change and the northward shift of the rainfall belt in China. The annual rainfall in the UHRB slightly increased, which benefited photosynthesis and metabolism, thus promoting vegetation growth. The linear rate of change of the annual average NDVI was 0.0675/10a, indicating a greening trend in the basin. Vegetation thus grew luxuriantly, on the one hand increasing the shading area and consequently reducing the water exchange between the soil and the atmosphere. On the other hand, vegetation interception and transpiration were enhanced, which in turn led to an increase in evapotranspiration [61,62].

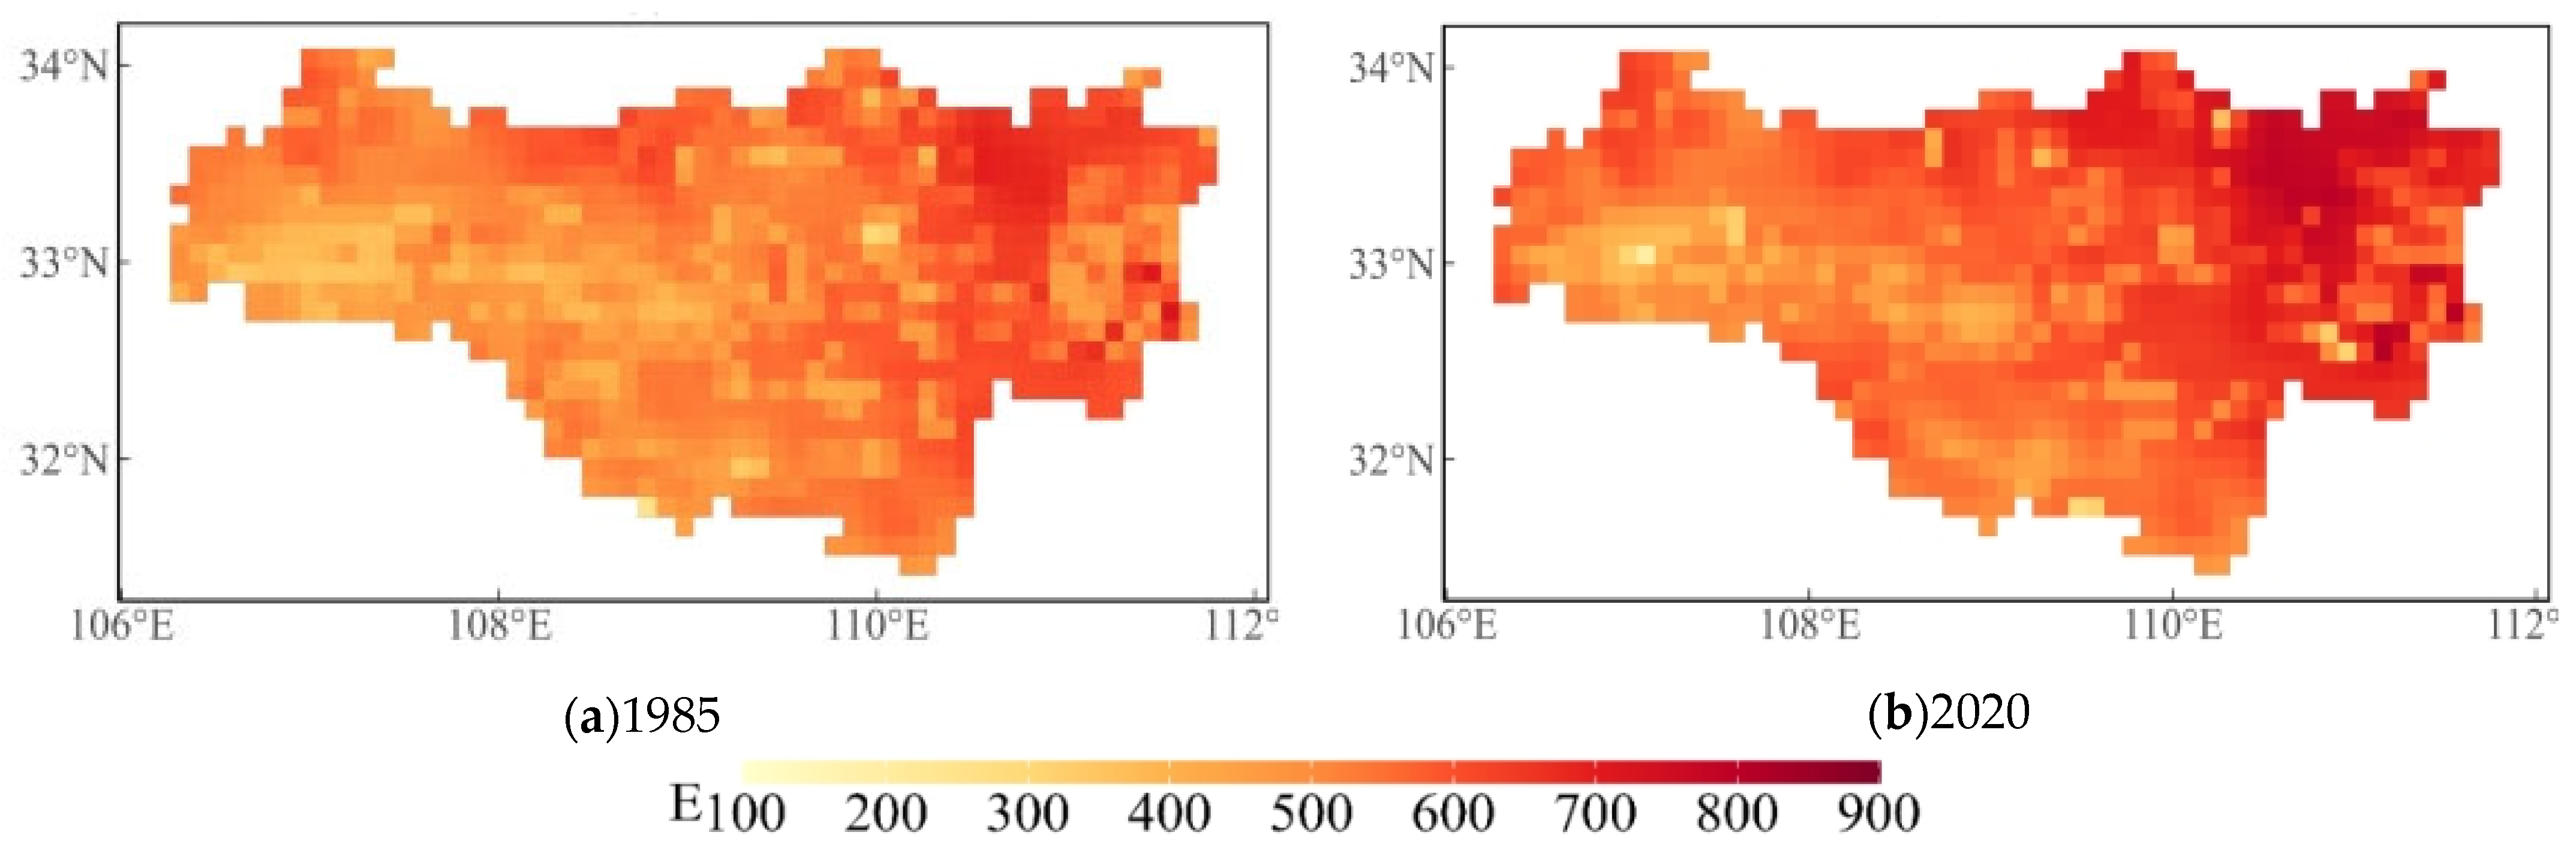
4.5. Estimated Evapotranspiration Variations

LULC data were resampled to the same resolution as the potential evapotranspiration data, i.e., 4km, and multi-year average potential evapotranspiration for each type was obtained based on grid correspondence. Barren areas, comprising less than 1%, were excluded from the analysis. The potential evapotranspiration of different LULC types in descending order is water (819.33 mm) > impervious (807.05 mm) > forest (792.98 mm) > cropland (776.57 mm) > grassland (774.90 mm) > shrub (771.27 mm). The ratio of actual evapotranspiration to potential evapotranspiration is known as the evapotranspiration capacity conversion factor, generally expressed as Kc, and varies by LULC type. The Kc of cropland, forest, shrub, grassland, water and impervious area is taken as 0.6, 0.8, 0.4, 0.7, 1.0 and 0.1, respectively. The estimated annual actual evapotranspiration in the UHRB in different years is shown in Figure 10.
The areas of high estimated annual actual evapotranspiration values are mainly located in the central and eastern parts of the study area, and the distribution of estimated actual evapotranspiration was relatively uniform and changed smoothly before 1990. From 1990 to 2005, the intensity of the estimated actual evapotranspiration increased significantly, especially in the east–central region, and the dark-red areas of high values expanded markedly, reflecting the significant impact of the LUCC. After 2005, the areas of high values of estimated actual evapotranspiration expanded further to the southeast.
The area and corresponding estimated evapotranspiration of different LUCCs in 1985 and 2023 are shown in Table 6. Forest land experienced a notable increase of 7714.73 km2, leading to an additional evapotranspiration of approximately 4894 million m3, representing an 11.42% increase compared to 1985. Stomata, which control gas and water exchange between plants and the environment, vary in distribution across different vegetation types [63]. Forest plants generally have more stomata, which remain active during the growing season, facilitating efficient gas exchange and higher evapotranspiration rates. Furthermore, the dense vegetation cover and robust water cycling in forests result in higher stomatal conductance, contributing to their elevated evapotranspiration. In contrast, the cropland area decreased by 3715.22 km2, resulting in a significant evapotranspiration reduction of about 1731 million m3. The water area also expanded by 285.40 km2, contributing an additional evapotranspiration of approximately 234 million m3. With a Kc value of 1.0, water areas consistently support high evapotranspiration rates due to direct surface evaporation. Other LUCC types, such as shrubland and grassland, experienced reductions in both area and evapotranspiration, highlighting their declining role in the regional water balance. Shrubland area decreased by 1690.67 km2, leading to an evapotranspiration reduction of 522 million m3, while grassland area shrank by 3254.27 km2, reducing evapotranspiration by 1765 million m3. Impervious surfaces expanded by 660.64 km2, with a minor evapotranspiration increase of 53 million m3. The LUCCs led to a significant transition from land types with fewer stomata and lower stomatal conductance, such as cropland, grassland and shrubland, to forests, which have more stomata and higher stomatal conductance. This shift has ultimately resulted in an overall increase in evapotranspiration across the basin. Consequently, this process has contributed to an estimated annual evapotranspiration increase of approximately 1.163 billion m3 from 1985 to 2023.

5. Discussion

Based on multi-source data, including hydrological, meteorological and LUCC information, this study evaluates the long-term variations in hydro-meteorological factors in the upper Han River basin. By combining the ABCD hydrological model and Budyko theory, it investigates the sensitivity of runoff to effective precipitation, potential evapotranspiration and basin parameters both at annual and seasonal time scales, and quantifies the contributions of these three factors to runoff reduction. The Danjiangkou Reservoir, as a critical water source for the South-to-North Water Diversion Project, plays a central role in regional water security. Therefore, understanding the characteristics and drivers of runoff changes in its upstream catchment is essential for adaptive water resource management under future climate change. A key finding of this study is that the increase in evapotranspiration is the primary driver of runoff decline in the upper Han River basin. A trend analysis of interannual hydro-meteorological variables indicates that precipitation increased from 1961 to 2023. Moreover, studies have revealed that this upward trend in precipitation will likely continue, accompanied by more frequent extreme rainfall events, posing growing challenges for flood risk management in the basin [64]. Nevertheless, despite increasing precipitation, the observed inflow to the Danjiangkou Reservoir has decreased, highlighting a growing mismatch between water availability and supply potential in the region. Li et al. (2024) analyzed the dynamics of blue water (runoff) and green water (evapotranspiration and soil moisture) in the UHRB under different Shared Socioeconomic Pathways (SSPs) and found that green water is projected to continue increasing [57]. Niu et al. (2024) used the InVEST model to assess the soil and water conservation capacity of different land use types in the UHRB [65]. Their findings suggest that forests reduce surface runoff by intercepting precipitation through the canopy and enhancing infiltration into the soil via root systems. From 1990 to 2020, the forest area in the UHRB increased continuously, improving the water conservation capacity of this region, which is consistent with the results of this study. By further integrating LUCC data with evapotranspiration datasets, this study estimates that surface condition changes contributed to an increase in evapotranspiration of approximately 1.163 billion m3 in the UHRB.
Another key finding of this study is the quantification of the contributions of different factors to runoff reduction at both annual and seasonal time scales. The results indicate that climatic factors are the dominant drivers of runoff decline, regardless of the time scale (dry season, flood season or annual). Notably, the relative importance of different climatic variables varies seasonally. During the flood season, high precipitation intensity and frequency, along with near-saturated soil conditions, result in a direct and substantial impact of rainfall on runoff generation, making effective precipitation the primary driver. In contrast, in the dry season, when rainfall is limited and soil moisture is generally low, potential evapotranspiration plays a more significant role in governing water partitioning processes and exerts a greater influence on runoff variability through atmospheric water demand and soil water depletion. Furthermore, this study introduces the BVD-TD method and compares it with the traditional BCR approach. Both methods identify meteorological factors as the main cause of reduced inflow to the Danjiangkou Reservoir. The BVD-TD method assumes the initial basin parameter is constant, attributing runoff changes caused by variations in the dryness index solely to meteorological factors and the residual runoff changes to underlying land surface variations. However, the basin parameter is not only related to the underlying land surface but also closely related to meteorological factors [66,67]. By separating meteorological effects into effective precipitation and potential evapotranspiration, the BVD-TD method improves the attribution analysis’s accuracy. The attribution analysis results align with the BCR method but slightly overestimate the role of potential evapotranspiration.
To meet the temporal requirements of this study, the potential evapotranspiration data was sourced from the TerraClimate dataset. To assess the reliability of this dataset, annual PET data from GLEAM and the National Tibetan Plateau Data Center (TPDC) and calculated using the Penman-Monteith (P-M) method for the UHRB were collected. A common period from 1980 to 2020 was selected for comparative analysis. As shown in Figure 11, the TerraClimate potential evapotranspiration data exhibit similar interannual variation to those from the P-M method and GLEAM. Although the estimates from the TPDC are generally lower, they display a consistent trend. Further scatterplot analysis reveals that the data from TerraClimate are closely correlated with the GLEAM, TPDC and P-M data, with correlation coefficients of 0.79, 0.84 and 0.74, respectively (Figure 12). These results provide preliminary evidence supporting the reliability of the Terra Climate dataset.

6. Conclusions

This study conducts an attribution analysis of the inflow runoff to the Danjiangkou Reservoir within a coupled framework of the Budyko equation and the ABCD hydrological model at both annual and seasonal time scales. The proposed BVD-TD and BCR methods are applied to separate the individual impacts of the basin parameter, effective precipitation and potential evapotranspiration on runoff reduction, and their results are compared. The effect of LUCC and NDVI variations are also investigated. The main findings are as follows:
(1)
The annual runoff of the Danjiangkou Reservoir showed a decreasing trend of 1.71 mm/year from 1961 to 2023 and changed abruptly in 1985. Compared to the reference period, runoff and precipitation decreased while potential evapotranspiration increased during the change period at both the annual and seasonal time scales. Additionally, it is suggested that the dry season accounted for most of the annual runoff reduction.
(2)
The proposed BVD-TD and BCR methods yielded consistent results but differed in magnitude, with the BVD-TD method generally overestimating the influence of potential evapotranspiration. Averaging the results of both methods, the annual runoff reduction was attributed mainly to the basin parameter (38.99%), followed by potential evapotranspiration (32.84%), and finally effective precipitation (28.17%).
(3)
Meteorological factors were the primary contributors to runoff reduction in the Danjiangkou Reservoir at both the annual and seasonal scales. Effective precipitation exerted a stronger influence during the flood season while potential evapotranspiration played a more significant role in the dry season.
(4)
LULC showed that the area of cropland decreased, while the area of forest increased, and the whole basin showed a greening trend as the NDVI increased. Due to land use/cover changes in the upper Han River basin, the annual average actual evapotranspiration increased by 1.163 billion m3 from 1985 to 2023.
This study provides a novel integration of the Budyko equation with the ABCD model to assess the impacts of underlying land surface and climate factors on runoff change at different temporal scales. Furthermore, the proposed BVD-TD method offers a more detailed and accurate insight into the drivers of runoff change. In addition, by estimating induced evapotranspiration, this study clarifies how land surface changes affect runoff generation processes. These findings highlight the need for seasonally adaptive water management strategies under climate change. In particular, the pronounced role of evapotranspiration during the dry season suggests that reservoir operation rules should be optimized to balance ecological water demands and supply needs. Additionally, land use planning should carefully consider the hydrological impacts of large-scale afforestation, especially in monsoon-driven basins. Considering the pivotal role of the Danjiangkou Reservoir, future water governance should strengthen cross-sector coordination and adjust reservoir operations to maintain regional water security under evolving environmental conditions.

Author Contributions

X.W.: Writing—original draft, software, investigation, formal analysis, conceptualization, visualization, resources and methodology; S.G.: writing—review and editing, validation, project administration, investigation, funding acquisition and supervision; M.W.: writing—review and editing, investigation and data curation; X.H.: writing—review and editing and investigation; W.W.: writing—review and editing. All authors have read and agreed to the published version of the manuscript.

Funding

This work was supported by the National Natural Science Foundation of China Yangtze River Joint Fund [grant number U2340205] and Hanjiang River Water Conservancy and Hydropower Group Limited Liability Company Scientific Research Project [grant number HJJS2024009].

Data Availability Statement

Data will be made available on request.

Conflicts of Interest

Authors Xiaodong He and Wei Wang were employed by the Hanjiang Water Conservancy and Hydropower Group Limited Company. The remaining authors declare that the research was conducted in the absence of any commercial or financial relationships that could be construed as a potential conflict of interest.

References

  1. Wigley, T.M.L.; Jones, P.D. Influences of Precipitation Changes and Direct CO2 Effects on Streamflow. Nature 1985, 314, 149–152. [Google Scholar] [CrossRef]
  2. Zhan, C.S.; Jiang, S.S.; Sun, F.B.; Jia, Y.W.; Niu, C.W.; Yue, W.F. Quantitative Contribution of Climate Change and Human Activities to Runoff Changes in the Wei River Basin, China. Hydrol. Earth Syst. Sci. 2014, 18, 3069–3077. [Google Scholar] [CrossRef]
  3. Milly, P.C.D.; Dunne, K.A.; Vecchia, A.V. Global Pattern of Trends in Streamflow and Water Availability in a Changing Climate. Nature 2005, 438, 347–350. [Google Scholar] [CrossRef]
  4. Gu, B.; Zhou, S.; Yu, B.; Findell, K.L.; Lintner, B.R. Multifaceted Changes in Water Availability with a Warmer Climate. npj Clim. Atmos. Sci. 2025, 8, 31. [Google Scholar] [CrossRef]
  5. Xu, X.; Yang, D.; Yang, H.; Lei, H. Attribution Analysis Based on the Budyko Hypothesis for Detecting the Dominant Cause of Runoff Decline in Haihe Basin. J. Hydrol. 2014, 510, 530–540. [Google Scholar] [CrossRef]
  6. Lv, X.; Zuo, Z.; Ni, Y.; Sun, J.; Wang, H. The Effects of Climate and Catchment Characteristic Change on Streamflow in a Typical Tributary of the Yellow River. Sci. Rep. 2019, 9, 14535. [Google Scholar] [CrossRef] [PubMed]
  7. Kumar, M.; Paramaputra, K.; Mousa, A.; Kong, S.Y.; Garg, A.; Anggraini, V. Field Based Analysis of Vegetation and Climate Impacts on the Hydrological Properties of Urban Vegetated Slope. Sci. Rep. 2025, 15, 7702. [Google Scholar] [CrossRef]
  8. Nadal-Romero, E.; Vicente-Serrano, S.; Lana-Renault, N.; López-Moreno, J.I.; Regües, D.; Lasanta, T.; García-Ruiz, J.M. Plant Cover Determines Runoff Generation in Response to Dry and Wet Conditions. J. Hydrol. 2025, 660, 133495. [Google Scholar] [CrossRef]
  9. Sankarrao, L.; Rathinasamy, M. Impacts of Agricultural Intensification on the Hydrologic Components for a Coastal River Basin Using Coupled Hydrological Model. Groundw. Sustain. Dev. 2025, 29, 101440. [Google Scholar] [CrossRef]
  10. Wu, L.; Wang, L.; Li, C.; Zhang, Y.; Wei, J.; Xie, X.; Lv, J. Separating the Contributions of Climate Change and Human Activities to Regional AET Variability by Using a Developed Analytical Framework. Stoch. Environ. Res. Risk Assess. 2020, 34, 1831–1845. [Google Scholar] [CrossRef]
  11. Xie, M.; Ren, Z.; Li, Z.; Zhang, X.; Ma, X.; Li, P.; Shen, Z. Evolution of the Precipitation–Stream Runoff Relationship in Different Precipitation Scenarios in the Yellow River Basin. Urban Clim. 2023, 51, 101609. [Google Scholar] [CrossRef]
  12. Bai, X.; Zhao, W. Impacts of Climate Change and Anthropogenic Stressors on Runoff Variations in Major River Basins in China since 1950. Sci. Total Environ. 2023, 898, 165349. [Google Scholar] [CrossRef] [PubMed]
  13. Sun, H.; Krysanova, V.; Gong, Y.; Gao, M.; Treu, S.; Chen, Z.; Jiang, T. The Recent Trends of Runoff in China Attributable to Climate Change. Clim. Change 2024, 177, 159. [Google Scholar] [CrossRef]
  14. Senbeta, T.B.; Romanowicz, R.J. The Role of Climate Change and Human Interventions in Affecting Watershed Runoff Responses. Hydrol. Process. 2021, 35, e14448. [Google Scholar] [CrossRef]
  15. Álamos, N.; Alvarez-Garreton, C.; Muñoz, A.; González-Reyes, Á. The Influence of Human Activities on Streamflow Reductions during the Megadrought in Central Chile. Hydrol. Earth Syst. Sci. 2024, 28, 2483–2503. [Google Scholar] [CrossRef]
  16. Bai, H.; Zhong, Y.; Ma, N.; Kong, D.; Mao, Y.; Feng, W.; Wu, Y.; Zhong, M. Changes and Drivers of Long-Term Land Evapotranspiration in the Yangtze River Basin: A Water Balance Perspective. J. Hydrol. 2025, 653, 132763. [Google Scholar] [CrossRef]
  17. Wiebe, A.J.; Rudolph, D.L.; Craig, J.R. Quantifying Uncertainty in Groundwater Recharge Due to Spatiotemporal Rainfall and Temporal Evapotranspiration Variability. J. Hydrol. 2025, 657, 133089. [Google Scholar] [CrossRef]
  18. Birylo, M.; Błaszczak-Bąk, W.; Suchocki, C. Application of GLDAS Models and ALS Point Clouds in Assessing the Impact of Modified Evapotranspiration on the Water Budget. Water Res. 2025, 283, 123746. [Google Scholar] [CrossRef]
  19. Li, J.; Ai, P.; Xiong, C.; Song, Y. Leveraging Multi-Source Data and Teleconnection Indices for Enhanced Runoff Prediction Using Coupled Deep Learning Models. Sci. Rep. 2025, 15, 14732. [Google Scholar] [CrossRef]
  20. Wang, D.; Shu, L.; Jin, J.; Chen, J.M. Spatiotemporal Variations and Drivers of Runoff in China Based on a High-Quality Continuous Runoff Dataset. J. Hydrol. Reg. Stud. 2025, 59, 102398. [Google Scholar] [CrossRef]
  21. Wang, Y.; Ye, A.; Zhang, Y.; Yang, F. The Quantitative Attribution of Climate Change to Runoff Increase over the Qinghai-Tibetan Plateau. Sci. Total Environ. 2023, 897, 165326. [Google Scholar] [CrossRef]
  22. Liu, J.; Zhang, X.; Wu, X.; Yang, Y.; Zheng, Y. Impacts of LULC Changes on Runoff from Rivers through a Coupled SWAT and BiLSTM Model: A Case Study in Zhanghe River Basin, China. Ecol. Inform. 2024, 84, 102866. [Google Scholar] [CrossRef]
  23. Mei, J.; Yong, B.; Lyu, Y.; Qi, W.; Wen, Y.; Wang, G.; Zhang, J. Runoff Evolution Responses to Climate Change: A Case Study in the Headwater Area of Yellow River, China. J. Environ. Manag. 2025, 384, 125512. [Google Scholar] [CrossRef] [PubMed]
  24. Jaramillo, F.; Cory, N.; Arheimer, B.; Laudon, H.; van der Velde, Y.; Hasper, T.B.; Teutschbein, C.; Uddling, J. Dominant Effect of Increasing Forest Biomass on Evapotranspiration: Interpretations of Movement in Budyko Space. Hydrol. Earth Syst. Sci. 2018, 22, 567–580. [Google Scholar] [CrossRef]
  25. Choudhury, B.J. Evaluation of an Empirical Equation for Annual Evaporation Using Field Observations and Results from a Biophysical Model. J. Hydrol. 1999, 216, 99–110. [Google Scholar] [CrossRef]
  26. Zhang, L.; Dawes, W.R.; Walker, G.R. Response of Mean Annual Evapotranspiration to Vegetation Changes at Catchment Scale. Water Resour. Res. 2001, 37, 701–708. [Google Scholar] [CrossRef]
  27. Wang, D.; Tang, Y. A One-Parameter Budyko Model for Water Balance Captures Emergent Behavior in Darwinian Hydrologic Models. Geophys. Res. Lett. 2014, 41, 4569–4577. [Google Scholar] [CrossRef]
  28. Huang, T.; Liu, Y.; Jia, Z.; Zou, J.; Xiao, P. Applicability of Attribution Methods for Identifying Runoff Changes in Changing Environments. Sci. Rep. 2024, 14, 26100. [Google Scholar] [CrossRef]
  29. Tsao, J.; Lee, C.-H.; Yeh, H.-F. Attribution of Streamflow Variations in Southern Taiwan. Water 2020, 12, 2465. [Google Scholar] [CrossRef]
  30. Melo, P.A.; Alvarenga, L.A.; Tomasella, J.; de Mello, C.R.; Martins, M.A.; Coelho, G. Analysis of Hydrological Impacts Caused by Climatic and Anthropogenic Changes in Upper Grande River Basin, Brazil. Environ. Earth Sci. 2022, 81, 504. [Google Scholar] [CrossRef]
  31. Guan, X.; Zhang, J.; Yang, Q.; Wang, G. Quantifying the Effects of Climate and Watershed Structure Changes on Runoff Variations in the Tao River Basin by Using Three Different Methods under the Budyko Framework. Theor. Appl. Climatol. 2023, 151, 953–966. [Google Scholar] [CrossRef]
  32. Zhou, S.; Yu, B.; Zhang, L.; Huang, Y.; Pan, M.; Wang, G. A New Method to Partition Climate and Catchment Effect on the Mean Annual Runoff Based on the Budyko Complementary Relationship. Water Resour. Res. 2016, 52, 7163–7177. [Google Scholar] [CrossRef]
  33. Wang, D.; Hejazi, M. Quantifying the Relative Contribution of the Climate and Direct Human Impacts on Mean Annual Streamflow in the Contiguous United States. Water Resour. Res. 2011, 47, W00J12. [Google Scholar] [CrossRef]
  34. Liu, X.; Liu, C.; Luo, Y.; Zhang, M.; Xia, J. Dramatic Decrease in Streamflow from the Headwater Source in the Central Route of China’s Water Diversion Project: Climatic Variation or Human Influence? J. Geophys. Res. Atmos. 2012, 117, D06113. [Google Scholar] [CrossRef]
  35. Zhang, B.; Zheng, L.; Wang, Y.; Li, N.; Li, J.; Yang, H.; Bi, Y. Multiscale Ecosystem Service Synergies/Trade-Offs and Their Driving Mechanisms in the Han River Basin, China: Implications for Watershed Management. Environ. Sci. Pollut. Res. 2023, 30, 43440–43454. [Google Scholar] [CrossRef] [PubMed]
  36. Yin, X.; Zhang, J.; Chen, J. The Impact of Multi-Projects on the Alteration of the Flow Regime in the Middle and Lower Course of the Hanjiang River, China. Water 2020, 12, 2301. [Google Scholar] [CrossRef]
  37. Wang, H.; Yuan, W.; Yang, H.; Hong, F.; Yang, K.; Guo, W. The Ecological–Hydrological Regime of the Han River Basin under Changing Conditions: The Coupled Influence of Human Activities and Climate Change. Ecohydrology 2024, 17, e2632. [Google Scholar] [CrossRef]
  38. Wang, H.; Yuan, W.; Ma, Y.; Bai, X.; Huang, L.; Cheng, S.; Yang, H.; Guo, W. Spatiotemporal Dislocation of Ecosystem Supply and Demand Services from Habitat Quality under Different Development Scenarios. Ecol. Indic. 2023, 157, 111230. [Google Scholar] [CrossRef]
  39. Han, P.; Yang, G.; Wang, Z.; Liu, Y.; Chen, X.; Zhang, W.; Zhang, Z.; Wen, Z.; Shi, H.; Lin, Z.; et al. Driving Factors and Trade-Offs/Synergies Analysis of the Spatiotemporal Changes of Multiple Ecosystem Services in the Han River Basin, China. Remote Sens. 2024, 16, 2115. [Google Scholar] [CrossRef]
  40. Shah, S.A.; Jehanzaib, M.; Yoo, J.; Hong, S.; Kim, T.-W. Investigation of the Effects of Climate Variability, Anthropogenic Activities, and Climate Change on Streamflow Using Multi-Model Ensembles. Water 2022, 14, 512. [Google Scholar] [CrossRef]
  41. Wang, H.; Yuan, W.; Chen, W.; Hong, F.; Bai, X.; Guo, W. Response of Hydrological Regimes to Land Use Change: A Case Study of the Han River Basin. J. Water Clim. Change 2023, 14, 4708–4728. [Google Scholar] [CrossRef]
  42. Cui, G.; Li, X.; Li, Q.; Huang, J.; Tao, Y.; Li, S.; Zhang, J. Damming Effects on Dissolved Inorganic Carbon in Different Kinds of Reservoirs in Jialing River, Southwest China. Acta Geochim. 2017, 36, 581–597. [Google Scholar] [CrossRef]
  43. Wang, X.; Guo, S.; Zhong, S.; Wang, M.; Xiang, X. Flood Season Division Using Statistical Analysis Methods and Verifying by Regional Rainy Characteristics. Water 2024, 16, 3677. [Google Scholar] [CrossRef]
  44. Liu, Y.; Zeng, Z.; Lai, C.; He, S.; Jiang, J.; Wang, Z. Attribution and Scarcity Analysis of Blue and Green Water Resources in a River Basin under Climate and Environmental Change. Ecol. Indic. 2025, 175, 113574. [Google Scholar] [CrossRef]
  45. Qin, Z.; Peng, T.; Singh, V.P.; Chen, M. Spatio-Temporal Variations of Precipitation Extremes in Hanjiang River Basin, China, during 1960–2015. Theor. Appl. Climatol. 2019, 138, 1767–1783. [Google Scholar] [CrossRef]
  46. Guo, Z.; Wang, N.; Li, Y.; Liu, Z. Impact of Large-Scale Water Transfer Projects on the Ecological Flow and Its Value of Rivers in the Water-Receiving Area: Case Study of the Han River-to-Wei River Water Transfer Project. Nat. Resour. Res. 2025, 34, 271–298. [Google Scholar] [CrossRef]
  47. Abatzoglou, J.T.; Dobrowski, S.Z.; Parks, S.A.; Hegewisch, K.C. TerraClimate, a High-Resolution Global Dataset of Monthly Climate and Climatic Water Balance from 1958–2015. Sci. Data 2018, 5, 170191. [Google Scholar] [CrossRef]
  48. Yang, J.; Huang, X. The 30m Annual Land Cover Dataset and Its Dynamics in China from 1990 to 2019. Earth Syst. Sci. Data 2021, 13, 3907–3925. [Google Scholar] [CrossRef]
  49. Dong, S.; Huang, W.; Li, X.; Tao, S. Study on Temporal and Spatial Characteristics of Cold Waves in Shandong Province of China. Nat. Hazards 2017, 88, 191–219. [Google Scholar] [CrossRef]
  50. Pettitt, A.N. A Non-Parametric Approach to the Change-Point Problem. J. R. Stat. Society. Ser. C (Appl. Stat.) 1979, 28, 126–135. [Google Scholar] [CrossRef]
  51. Arora, V.K. The Use of the Aridity Index to Assess Climate Change Effect on Annual Runoff. J. Hydrol. 2002, 265, 164–177. [Google Scholar] [CrossRef]
  52. Lv, X.; Liu, S.; Li, S.; Ni, Y.; Qin, T.; Zhang, Q. Quantitative Estimation on Contribution of Climate Changes and Watershed Characteristic Changes to Decreasing Streamflow in a Typical Basin of Yellow River. Front. Earth Sci. 2021, 9, 752425. [Google Scholar] [CrossRef]
  53. Chen, X.; Alimohammadi, N.; Wang, D. Modeling Interannual Variability of Seasonal Evaporation and Storage Change Based on the Extended Budyko Framework. Water Resour. Res. 2013, 49, 6067–6078. [Google Scholar] [CrossRef]
  54. Xin, Z.; Li, Y.; Zhang, L.; Ding, W.; Ye, L.; Wu, J.; Zhang, C. Quantifying the Relative Contribution of Climate and Human Impacts on Seasonal Streamflow. J. Hydrol. 2019, 574, 936–945. [Google Scholar] [CrossRef]
  55. Yan, B.; Gu, Y.; Li, E.; Xu, Y.; Ni, L. Runoff Prediction of Tunxi Basin under Projected Climate Changes Based on Lumped Hydrological Models with Various Model Parameter Optimization Strategies. Sustainability 2024, 16, 6897. [Google Scholar] [CrossRef]
  56. Aragão, L.; Mentaschi, L.; Pinardi, N.; Verri, G.; Senatore, A.; Di Sabatino, S. The Freshwater Discharge into the Adriatic Sea Revisited. Front. Clim. 2024, 6, 1368456. [Google Scholar] [CrossRef]
  57. Wu, Y.; Qin, F.; Dong, X.; Li, L. Investigating the Spatio-Temporal Evolution of Land Cover and Ecosystem Service Value in the Kuye River Basin. Water 2024, 16, 2456. [Google Scholar] [CrossRef]
  58. Wang, Y.; Hu, Y.; Niu, X.; Yan, H.; Zhen, L. Land Use/Cover Change and Its Driving Mechanism in Thailand from 2000 to 2020. Land 2022, 11, 2253. [Google Scholar] [CrossRef]
  59. Zhao, L.; Fan, X. Effects of Land Use Changes on Ecosystem ServiceValues: A Case Study in Guilin, China. Pol. J. Environ. Stud. 2020, 29, 1483–1492. [Google Scholar] [CrossRef]
  60. Li, Y.; Cai, Y.; Fu, Q.; Zhang, X.; Wan, H.; Yang, Z. Dynamics of Land Use/Land Cover Considering Ecosystem Services for a Dense-Population Watershed Based on a Hybrid Dual-Subject Agent and Cellular Automaton Modeling Approach. Engineering 2024, 37, 182–195. [Google Scholar] [CrossRef]
  61. Guo, W.; Hong, F.; Yang, H.; Huang, L.; Ma, Y.; Zhou, H.; Wang, H. Quantitative Evaluation of Runoff Variation and Its Driving Forces Based on Multi-Scale Separation Framework. J. Hydrol. Reg. Stud. 2022, 43, 101183. [Google Scholar] [CrossRef]
  62. Zhu, Y.; Zheng, Z.; Zhao, G.; Zhu, J.; Zhao, B.; Sun, Y.; Gao, J.; Zhang, Y. Evapotranspiration Increase Is More Sensitive to Vegetation Greening than to Vegetation Type Conversion in Arid and Semi-Arid Regions of China. Glob. Planet. Change 2025, 244, 104634. [Google Scholar] [CrossRef]
  63. Liang, X.; Wang, D.; Ye, Q.; Zhang, J.; Liu, M.; Liu, H.; Yu, K.; Wang, Y.; Hou, E.; Zhong, B.; et al. Stomatal Responses of Terrestrial Plants to Global Change. Nat. Commun. 2023, 14, 2188. [Google Scholar] [CrossRef] [PubMed]
  64. Wang, D.; Shao, W.; Liu, J.; Su, H.; Zhang, G.; Fu, X. Exploring Spatio-Temporal Dynamics of Future Extreme Precipitation, Runoff, and Flood Risk in the Hanjiang River Basin, China. Remote Sens. 2024, 16, 3980. [Google Scholar] [CrossRef]
  65. Niu, P.; Wang, Z.; Wang, J.; Cao, Y.; Peng, P. Estimation and Prediction of Water Conservation in the Upper Reaches of the Hanjiang River Basin Based on InVEST-PLUS Model. PeerJ 2024, 12, e18441. [Google Scholar] [CrossRef] [PubMed]
  66. Xu, X.; Liu, W.; Scanlon, B.R.; Zhang, L.; Pan, M. Local and Global Factors Controlling Water-Energy Balances within the Budyko Framework. Geophys. Res. Lett. 2013, 40, 6123–6129. [Google Scholar] [CrossRef]
  67. Cheng, C.; Liu, W.; Mu, Z.; Zhou, H.; Ning, T. Lumped Variable Representing the Integrative Effects of Climate and Underlying Surface System: Interpreting Budyko Model Parameter from Earth System Science Perspective. J. Hydrol. 2023, 620, 129379. [Google Scholar] [CrossRef]
Figure 1. Schematic structure diagram of this study.
Water 17 02067 g001
Figure 2. Diagram of (a) the South-to-North Water Diversion Project and (b) the upper Han River basin.
Water 17 02067 g002
Figure 3. Schematic diagram of the Budyko Vertical Decomposition method.
Water 17 02067 g003
Figure 4. Temporal trend in annual P (red line), R (black line) and E0 (green line). The dotted lines are the corresponding trend lines.
Water 17 02067 g004
Figure 5. Mutation point detection analysis.
Water 17 02067 g005
Figure 6. Comparison of observed and simulated monthly flow hydrographs in (a) reference period and (b) change period, and (c) scatter plots of monthly flow in reference period and (d) scatter plots of monthly flow in change period.
Water 17 02067 g006aWater 17 02067 g006b
Figure 7. Land use/cover changes in UHRB.
Water 17 02067 g007
Figure 8. Annual percentage of (a) main LULC: forest and cropland and (b) remaining LULC: shrub, grassland, water, impervious and barren in upper Han River basin.
Water 17 02067 g008
Figure 9. Temporal trend in NDVI in upper Han River basin.
Water 17 02067 g009
Figure 10. Estimated annual actual evapotranspiration in upper Han River basin.
Water 17 02067 g010
Figure 11. Comparison of data from TerraClimate, GLEAM, TPDC and P-M.
Water 17 02067 g011
Figure 12. Scatterplots between TerraClimate data and (a) GLEAM, (b) TPDC and (c) P-M.
Water 17 02067 g012
Table 1. Optimized parameter and evaluation metric results of ABCD model.
PeriodModel ParametersEvaluation Metrics
abcdCalibrationValidation
NSEKEGNSEKEG
Reference period0.90344.430.130.480.800.850.900.89
Change period0.92356.200.210.620.850.900.840.89
Table 2. Sensitivity analysis of runoff changes at annual and seasonal time scales.
Time ScalePeriodRPeE0ω ε P e ε E 0 ε ω
Annual1961~2023380.89890.80894.531.941.67−0.67−1.19
1961~1985429.02912.48853.911.86
1985~2023349.22876.54921.262.01
Change/Δ−79.81−35.9467.350.15
Change rate/%−18.60−3.947.897.88
Flood
season
1961~2023209.25503.73453.042.141.76−0.76−1.02
1961~1985226.77512.54440.102.08
1985~2023197.71497.93461.552.19
Change/Δ−29.06−14.6221.440.11
Change rate/%−12.81−2.854.875.17
Dry
season
1961~2023171.64387.07441.491.781.58−0.58−1.38
1961~1985202.25399.93413.811.67
1985~2023151.50378.61459.711.86
Change/Δ−50.75−21.3245.910.19
Change rate/%−25.09−5.3311.0911.14
Table 3. Runoff reduction attribution results derived from the Budyko Complementary Relationship (BCR) method and the Budyko Vertical Decomposition with Total Differential (BVD-TD) method.
MethodContributions/%PeE0ω
BCRAnnual24.0541.5934.36
Flood season30.5639.1530.29
Dry season17.7634.0748.17
BVD-TDAnnual43.6332.2924.08
Flood season36.8837.0226.10
Dry season49.9929.6220.38
Mean valueAnnual28.1732.8438.99
Flood season33.7932.6333.59
Dry season23.6927.2349.08
Table 4. LUCC dynamic degrees per 5 years in UHRB.
LULCLUCC Dynamic Degree
1985–19901990–19951995–20002000–20052005–20102010–20152015–20202020–2023
Cropland0.060.710.58−0.72−1.60−1.37−1.50−1.10
Forest−0.020.280.090.460.480.380.370.25
Shrub−2.34−7.93−4.38−6.59−4.73−8.57−9.172.56
Grassland1.00−4.74−4.47−6.32−3.63−5.57−8.12−6.67
Water0.49−2.14−1.071.131.874.153.23−0.58
Impervious0.853.672.411.543.434.153.031.46
Comprehensive0.060.360.200.360.400.370.360.22
Table 5. Transfer matrices of LUCC from 1985 to 2023 (km2).
YearLULC2023
CroplandForestShrubGrasslandWaterBarrenImperviousTotal
1985Cropland10,575.376118.986.40113.10232.870.19629.6717,676.57
Forest2632.2964,751.1953.8732.2320.960.0568.9467,559.54
Shrub85.561655.4042.2732.020.030.020.151815.45
Grassland631.392740.5822.24260.0816.750.0821.923693.03
Water26.817.880.011.23700.370.0119.52755.82
Barren0.220.000.000.030.210.000.500.97
Impervious9.720.250.000.0770.020.00354.70434.76
Total13,961.3575,274.27124.79438.771041.220.351095.4091,936.14
Table 6. Estimated actual evapotranspiration with different LUCC types in 1985 and 2023.
LULCCroplandForestShrubGrasslandWaterImpervious
E0/mm776.57792.98771.27774.90819.33807.05
Kc0.60.80.40.71.00.1
1985area/(km2)17,676.5767,559.541815.453693.03755.82434.76
E/(×108 m3)82.36428.595.6020.036.190.35
2023area/(km2)13,961.3575,274.27124.79438.771041.221095.40
E/(×108 m3)65.05477.530.382.388.530.88
1985–2023Δarea/(km2)−3715.227714.73−1690.67−3254.27285.40660.64
ΔE/(×108 m3)−17.3148.94−5.22−17.652.340.53
Disclaimer/Publisher’s Note: The statements, opinions and data contained in all publications are solely those of the individual author(s) and contributor(s) and not of MDPI and/or the editor(s). MDPI and/or the editor(s) disclaim responsibility for any injury to people or property resulting from any ideas, methods, instructions or products referred to in the content.

