Article

Characterization of Water Quality and the Relationship Between WQI and Benthic Macroinvertebrate Communities as Ecological Indicators in the Ghris Watershed, Southeast Morocco

1
Bio-Resources, Environment and Health, Faculty of Science and Technology of Errachidia, Moulay Ismail University of Meknes, Marjane 2, BP 298, Meknes 50050, Morocco
2
Ethnopharmacology and Pharmacognosy, Faculty of Sciences and Techniques Errachidia, Moulay Ismail University of Meknes, BP 509, Boutalamine, Errachidia 52000, Morocco
3
Laboratory of Functional Ecology and Environmental Engineering, Department of Biology, Faculty of Sciences and Technologies Fez, University Sidi Mohamed Ben Abdellah, Fez 30080, Morocco
4
University of Rennes, CNRS, ECOBIO–UMR 6553, 35000 Rennes, France
*
Author to whom correspondence should be addressed.
Water 2025, 17(14), 2055; https://doi.org/10.3390/w17142055
Submission received: 15 April 2025 / Revised: 18 June 2025 / Accepted: 26 June 2025 / Published: 9 July 2025
(This article belongs to the Section Biodiversity and Functionality of Aquatic Ecosystems)

Abstract

The Ghris watershed in southern Morocco is a significant ecological and agricultural area. However, due to the current impacts of climate change, farming activities, and pollution, data on its quality and biological importance need to be updated. Therefore, this study aimed to evaluate the physico-chemical and biological quality of surface water in the Ghris River. The Water Quality Index (WQI) and the Iberian Biological Monitoring Working Group (IBMWP) index were used to assess water quality along four sampling sites in 2024. The collected data were analyzed with descriptive and multivariate statistics. In total, 424 benthic macroinvertebrates belonging to seven orders were identified in the surface waters of the Ghris basin. These microfauna were significantly variable among the studied sites (p < 0.05). Station S4 is significantly rich in species, including seven orders and nine families of macroinvertebrates, followed by Station S2, with seven orders and eight families. Stations S3 and S1 showed less species diversity, with three orders and one family, respectively. The Insecta comprised 95.9% of the abundance, while the Crustacea constituted just 4.1%. The physico-chemical parameters significantly surpassed (p < 0.05) the specified norms of surface water in Morocco. This indicates a decline in the water quality of the studied sites. The findings of the principal component analysis (PCA) demonstrate that the top two axes explain 87% of the cumulative variation in the data. Stations 2 and 3 are closely associated with high concentrations of pollutants, notably Cl, SO42−, NO3, and K+ ions. Dissolved oxygen (DO) showed a slight correlation with S2 and S3, while S4 was characterized by high COD and PO4 concentrations, low levels of mineral components (except Cl), and average temperature conditions. Bioindication scores for macroinvertebrate groups ranging from 1 to 10 enabled the assessment of pollution’s influence on aquatic biodiversity. The IBMWP biotic index indicated discrepancies in water quality across the sites. This study gives the first insight and updated data on the biological and chemical quality of surface water in the Ghris River and the entire aquatic ecosystem in southeast Morocco. These data are proposed as a reference for North African and Southern European rivers. However, more investigations are needed to evaluate the impacts of farming, mining, and urbanization on the surface and ground waters in the study zone. Similarly, it is vital to carry out additional research in arid and semi-arid zones since there is a paucity of understanding regarding taxonomic and functional diversity, as well as the physico-chemical factors impacting water quality.

1. Introduction

Access to quality freshwater is increasingly limited, particularly in semi-arid regions, despite the vital role it plays in maintaining ecosystems and human activities. Although approximately 97% of the Earth’s water is found in oceans and around 2% is trapped in glaciers and polar ice caps, only a small fraction, about 0.001%, is readily accessible in the atmosphere and surface freshwater sources. Moreover, saline water is unsuitable for most domestic, agricultural, and industrial uses without prior treatment. In addition to scarcity, water quality remains a critical concern, particularly in semi-arid regions where limited freshwater resources are often exposed to pollution from anthropogenic activities. Ensuring not only the availability but also the ecological and chemical quality of water is, therefore, essential for sustaining ecosystems and human needs [1,2].
Conserving water is essential through the responsible management of water resources and the judicious use of existing water. Individuals must consider sustainable water use without depleting existing water supplies [3]. Water is a significant component in environmental and water-related activities in all nations, such as marine commerce, embankments, seaports, dams, and inland rivers. The major source of supply in most emerging economies is surface and groundwater from shallow wells [4,5,6].
Morocco, as a Mediterranean area with a semi-arid climate, has scant and erratic rainfall and is one of the most susceptible countries to the effects of climate change [7,8]. Surface water and groundwater are vital for both human and animal life, as well as the proper functioning of many economic sectors [9]. Aquatic resources are among the most studied ecosystems due to their ecological and economic significance [10]. The species that flourish in wetland habitats rely on the availability of clean water for their existence [11]. Human-induced disturbances to water quality adversely harm species that are suited to certain ecosystems [12]. Alterations in water quality may provide cumulative impacts; for instance, shifts in macroinvertebrate and microvertebrate populations may signify a significant change in wetland water quality [11,13]. Alterations in water quality may indirectly influence wetland species by altering food availability, predator–prey dynamics, and habitat development. Overall, the impacts of water quality on wetland fauna are diverse and may harm a whole ecosystem or eliminate particular species. Therefore, investigations into the implications of these changes on the community structure of wetland ecosystems are needed. Interference competition also has an impact on the community structure of aquatic habitats [14]. Additionally, managing water quality is essential for the protection and sustainable use of our aquatic ecosystems [15].
Assessing the quality of water intended for human consumption is an assumption [16,17]. Pollution of surface water generally stems from industrial development, the excessive application of fertilizers, and natural events, such as the erosion of rocks by water [18]. For such an evaluation, the Water Quality Index (WQI) model may be implemented, as it is mainly based on physico-chemical properties to control and guarantee water quality [19,20]. Inductively coupled plasma (ICP) spectroscopy was used to analyze physico-chemical parameters. This technique enables the precise and sensitive detection of metal ions and other chemical elements in groundwater samples. The ICP method was employed to analyze the concentrations of elements, such as calcium (Ca2+), magnesium (Mg2+), sodium (Na+), potassium (K+), and trace metals, providing accurate and reliable data on the hydrochemical characteristics of the study area. The results obtained using this method were then compared with the established standards, such as the 2017 WHO guidelines, to assess water quality. A biological axis has to be assessed in addition to those mentioned above. Some studies developed biomonitoring systems in rivers and surface waters based primarily on indices that measure the pollution tolerance of aquatic macroinvertebrates [21]. Abundant species of macroinvertebrates and a large number of taxa characterize the rivers and streams with very good water quality. The most commonly used indices for this analysis are the Biological Monitoring Working Group (BMWP). While the BMWP index is based solely on the presence or absence of specific macroinvertebrate taxa, without considering their abundance, the FBI index accounts for the relative number of individuals in each taxon, providing a more quantitative measure of organic pollution in freshwater systems [22,23,24]. The IBMWP index is an important method for assessing the biological quality of freshwater habitats. In applying this index, a family is considered when more than one member from that family is recorded.
Indeed, several local studies have been published [25,26], but previous research in the Guir–Ghris basin has not focused on in-depth hydrobiological assessments of either groundwater or surface water. Thus far, there have been no wide-scale studies performed that have assessed water quality and its effects on wildlife and the aquatic environment using both hydrochemical and biological metrics. The aim of this assessment, based on the correlation between these two aspects, is to provide relevant information to stakeholders, government institutions, and decision-makers involved in the sustainable management of groundwater resources in southeast Morocco and the Drâa-Tafilalet region as a whole. This study presents updated data on rivers in the arid area of Morocco and offers a reference for other North African and South European Rivers characterized by similar climate contexts. Similarly, the study parameters, such as macroinvertebrates, are proposed to clarify the geographical distribution of these groups in the arid area of North Africa.

2. Materials and Methods

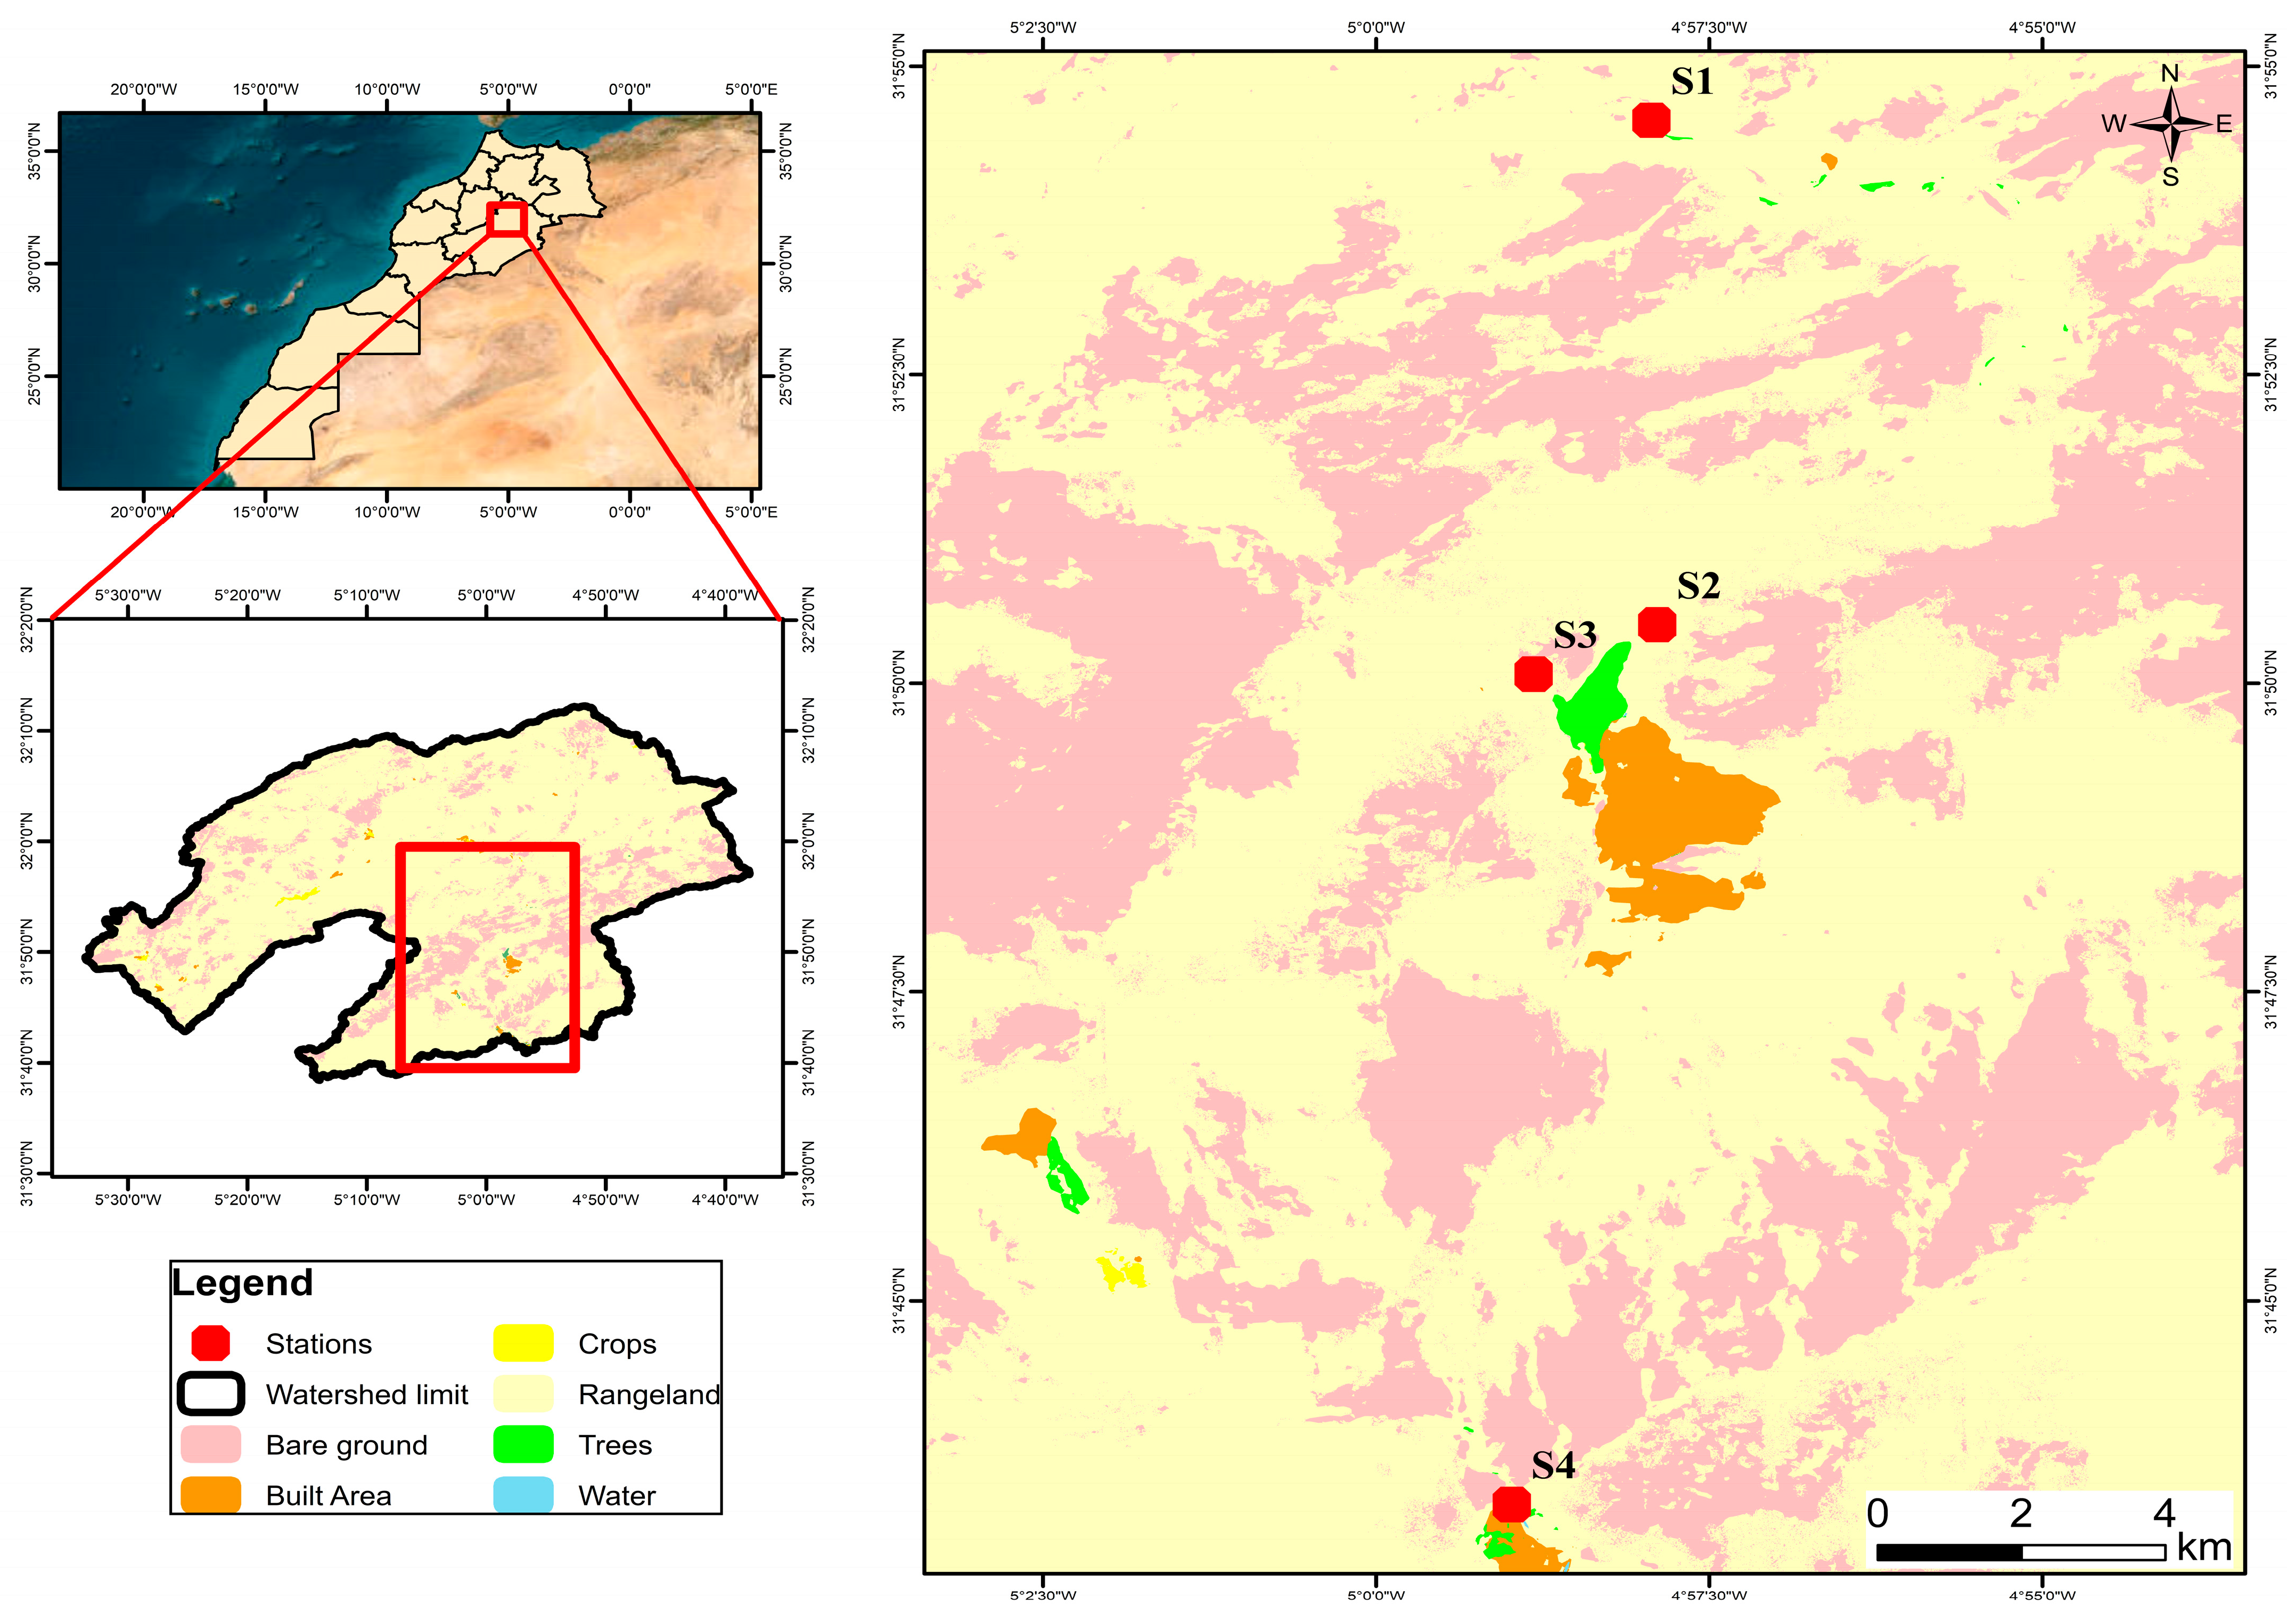
2.1. Study Area Setting

The study area is located in the Drâa-Tafilalet region (the province of Errachidia, Erachidia city, Morocco), which is known for its arid to semi-arid climate [27], as confirmed by Köppen’s climate classification. The province is the area in which people mostly depend on water supplies, and the dynamic of life is highly related to climatic conditions since the economy of the region is largely agricultural [28]. This is the case for the majority of oases on the globe. As noted by Mainguet et al. [29], the general situation of oases is significant, where 150 million people living in oases around the world face livelihood problems because of environmental degradation trends. The strategy used for this research consists of three fundamental stages: sampling water and fauna according to a well-defined procedure, laboratory analysis to determine physico-chemical parameters as well, and identification of species. Afterwards, the data were analyzed in the context of a water quality assessment, and the results were validated.
The basin is delineated to the north and east by the Oued Ziz watershed, to the northwest by the Oum Er Rbia watershed, to the west by the Draa watershed, and to the south by the Maider watershed. Groundwater and surface water resources play a crucial role in the Ghris basin, serving as key components for sustaining regional water supply, particularly during periods of surface water scarcity [30,31]. It includes large and heterogeneous aquifers forming a hydrological system that crosses geologic units ranging from the Paleozoic series of the Anti-Atlas to the Jurassic aquifers of the High Atlas and the Cretaceous aquifers of the Errachidia–Boudnib basin, and Quaternary shallow aquifers.
In the lower section of the basin, evaporation rates are elevated owing to increased temperatures. Summer maximum temperatures may reach 42 °C; however, winter temperatures may fall to around −0.5 °C from December to January. The predominant portion of the area receives under 100 mm of precipitation each year. Winds above velocities of 57.6 km/h are often seen in May, June, July, and August. These climatic conditions result in an arid and desiccated environment in the region [28,32] (Figure 1).

2.2. Data Collection and Processing

2.2.1. Surface Water Sampling

A total of four surface water samples were gathered and chosen according to the degree of contamination in the Ghris basin study region. The sampling was performed on 10 June, between 9 a.m. and 3 p.m. The locations of the sample sites are displayed in Figure 2 and described in Table 1.
Water sampling was carried out in line with known procedures [33]. Samples were obtained using 50 mL polyethylene bottles, each container being tagged for identification purposes. The remaining samples were filtered with a 0.45 µm acetate cellulose syringe filter. To reduce exposure to air, the samples were packaged and kept in ice-filled freezers to maintain a temperature of roughly 4 °C. They were then transported to the water analysis laboratory. They were subsequently transferred to the water analysis laboratory (AFRILAB).
Twenty parameters were measured to analyze the hydrochemical characteristics of the surface water, including pH, electrical conductivity (EC), total hardness (TH), as well as concentrations of calcium (Ca2+), magnesium (Mg2+), sodium (Na+), potassium (K+), bicarbonate (HCO3), chloride (Cl), sulfate (SO42−), and nitrogen compounds (NO3), and NO2), phosphate (PO43−), and iron (Fe2+), nickel (Ni2+), and zinc (Zn2+). Analysis of these parameters was carried out using ICP (Inductively Coupled Plasma) techniques, and the results were compared with 2017 WHO (World Health Organization) standards for water quality.

2.2.2. Water Quality Index WQI

Water Quality Indices are useful in making reliable assessments of the quality of surface waters and to modify practices when required [34]. Water Quality Index (WQI) is a method of categorizing water sources into different classes based on a comparison of quality parameters with the international [35] or national standards. The WQI was first adapted by Horton [36]. Horton selected the 10 most commonly used parameters and included them in a mathematical equation to predict the quality of drinking water. Now, this principle is widely used to assess water quality. The metadata of the parameters mentioned has led to several adaptations of the method by rehabilitating scientists around the world, including precise weighting of each parameter [34].
Many scientists and professionals have debated the relevance of the Water Quality Index (WQI), as it provides an overall assessment of water quality. This is accomplished by reducing all quality metrics to a single metric that is intuitive and easy to understand and interpret [37]. Herein, the Water Quality Index (WQI) approach was conventionally used to quantify the influence of various natural and anthropogenic drivers on water quality through 15 main surface water chemical indicators in the Ghris basin. These parameters, including pH, electrical conductivity (EC), 5-day biological oxygen demand (BOD5), total hardness (TH), and ions such as Cl, PO43−, TDS, SO42−, Ca2+, Mg2+, NH4+, NO3, and NO2, are summarized in Table 2. A classification according to the impact of the characteristic on water quality was assigned to each characteristic as low (1) to high (5); this is based on the classification given in the WHO (World Health Organization) guidelines published in 2017 [35].
Parameters with a weighing of 5, the highest, found with negative effects on health are NO3 and TDS. On the other hand, properties like pH, electrical conductivity (EC), and SO42− and total hardness (TH) received a weight of 4. The ions Mg2+, Ca2+, NH4+, NO2, and Cl, however, were assigned a lower weighting, ranging from 2 to 3, owing to their minimal or indirect influence on surface water quality [38]. The relative weight (Wi) of each parameter was computed according to Equation (1) published by Masoud et al. [39]:
W i = w i k = 0 n w i
where Wi is the weight assigned to parameter ‘i’, and ‘n’ is the total number of parameters being evaluated. Then, the water quality score was computed by dividing the value of each variable by the standard given by the WHO [35], and multiplying it by 100, and following Equation (2) given by Kulisz et al. [40].
Q i = C i × 100 S i
Qi is a quality index, ‘Si’ is the standard norm, and ‘Ci’ is the concentration of the sample provided in mg/L, because the PO4 criteria is 3–5 (the evaluation scale based on Equation (3)).
Q i = C p o 4 5 3 5
The following equation is used to derive the SI sub-index for individual parameters
SI = Wi × Qi
“Qi” denotes how much that parameter is worth, and “Wi” represents the weight given to that parameter. The Water Quality Index (WQI) score of each water sample was calculated for the sum of all the sub-indices derived from each variable as follows.
W Q I = k = 1 n W i × Q i
The Water Quality Index (WQI) values for all surface water samples were then assigned to one of the five water quality classes described by Kachroud et al. [41], as displayed in Table 3.

2.2.3. Systematic Identification of Taxa

Macroinvertebrate sampling was carried out using a Surber sampler with a 25 × 25 cm frame and 500 µm mesh. Samples were taken from benthic substrates by disturbing the area upstream of the sampler to dislodge organisms in the net. In the field, macroinvertebrates were manually separated from substrate materials such as rocks, leaves, and debris, then preserved in 70% ethanol.
In the laboratory, samples were sorted under a binocular loupe (BS-3015B) and a stereomicroscope (Olympus CX23). Organisms were identified to the lowest possible taxonomic level—mainly family or genus—using the freshwater macroinvertebrate identification keys provided by Tachet [42]. The analysis focused on key groups, including benthic crustaceans (e.g., copepods and cladocerans), molluscs (Gastropoda: Pulmonata and Basommatophora), and insects (Diptera and Coleoptera). The number of individuals was counted according to the method described by Hecq [42].
Each taxon (larval or adult form) was preserved in a labeled vial corresponding to the site and date of collection. This standardized protocol ensured reproducible and reliable taxonomic identification at all sampling stations.

2.3. IBMWP (Iberian Biological Monitoring Working Group) Calculation

The IBMWP index, a widely used method for assessing the biological quality of freshwater habitats, was applied in this study. A family was considered valid when more than one individual was recorded. A sensitivity score was then assigned to each identified family, and the total IBMWP score for a sampling site was calculated by summing the scores for all families present. The number of individuals per family does not influence the score, but the presence or absence of a family (singular or plural) is decisive. Sampling was carried out by our hydrobiology and environmental assessment team. Identification was carried out at the family level using standardized taxonomic keys referenced in the article and a database maintained by the Laboratory of Life Sciences and Environment [42].
Although identification at the family level offers lower taxonomic resolution, it remains a reliable and commonly used approach in ecological assessments, particularly when resources are limited. The IBMWP index was chosen for its robustness and suitability for regional applications (Figure 3).

2.4. Statistical Analyses

Statistical analysis was carried out to examine the physical and chemical characteristics of the water. Procedures used included averaging, principal component analysis (PCA), and the construction of a correlation matrix. Averaging reveals the fundamental value of the data collected. PCA was used to study the relationships between the 16 physico-chemical characteristics recorded in four locations, as well as a redundancy analysis (RDA) between invertebrates and environmental factors. It also displays correlation factors between these measurements, providing a summary of interactions within the data [43]. This multivariate statistical study was carried out using Origin 2024 software.

3. Results

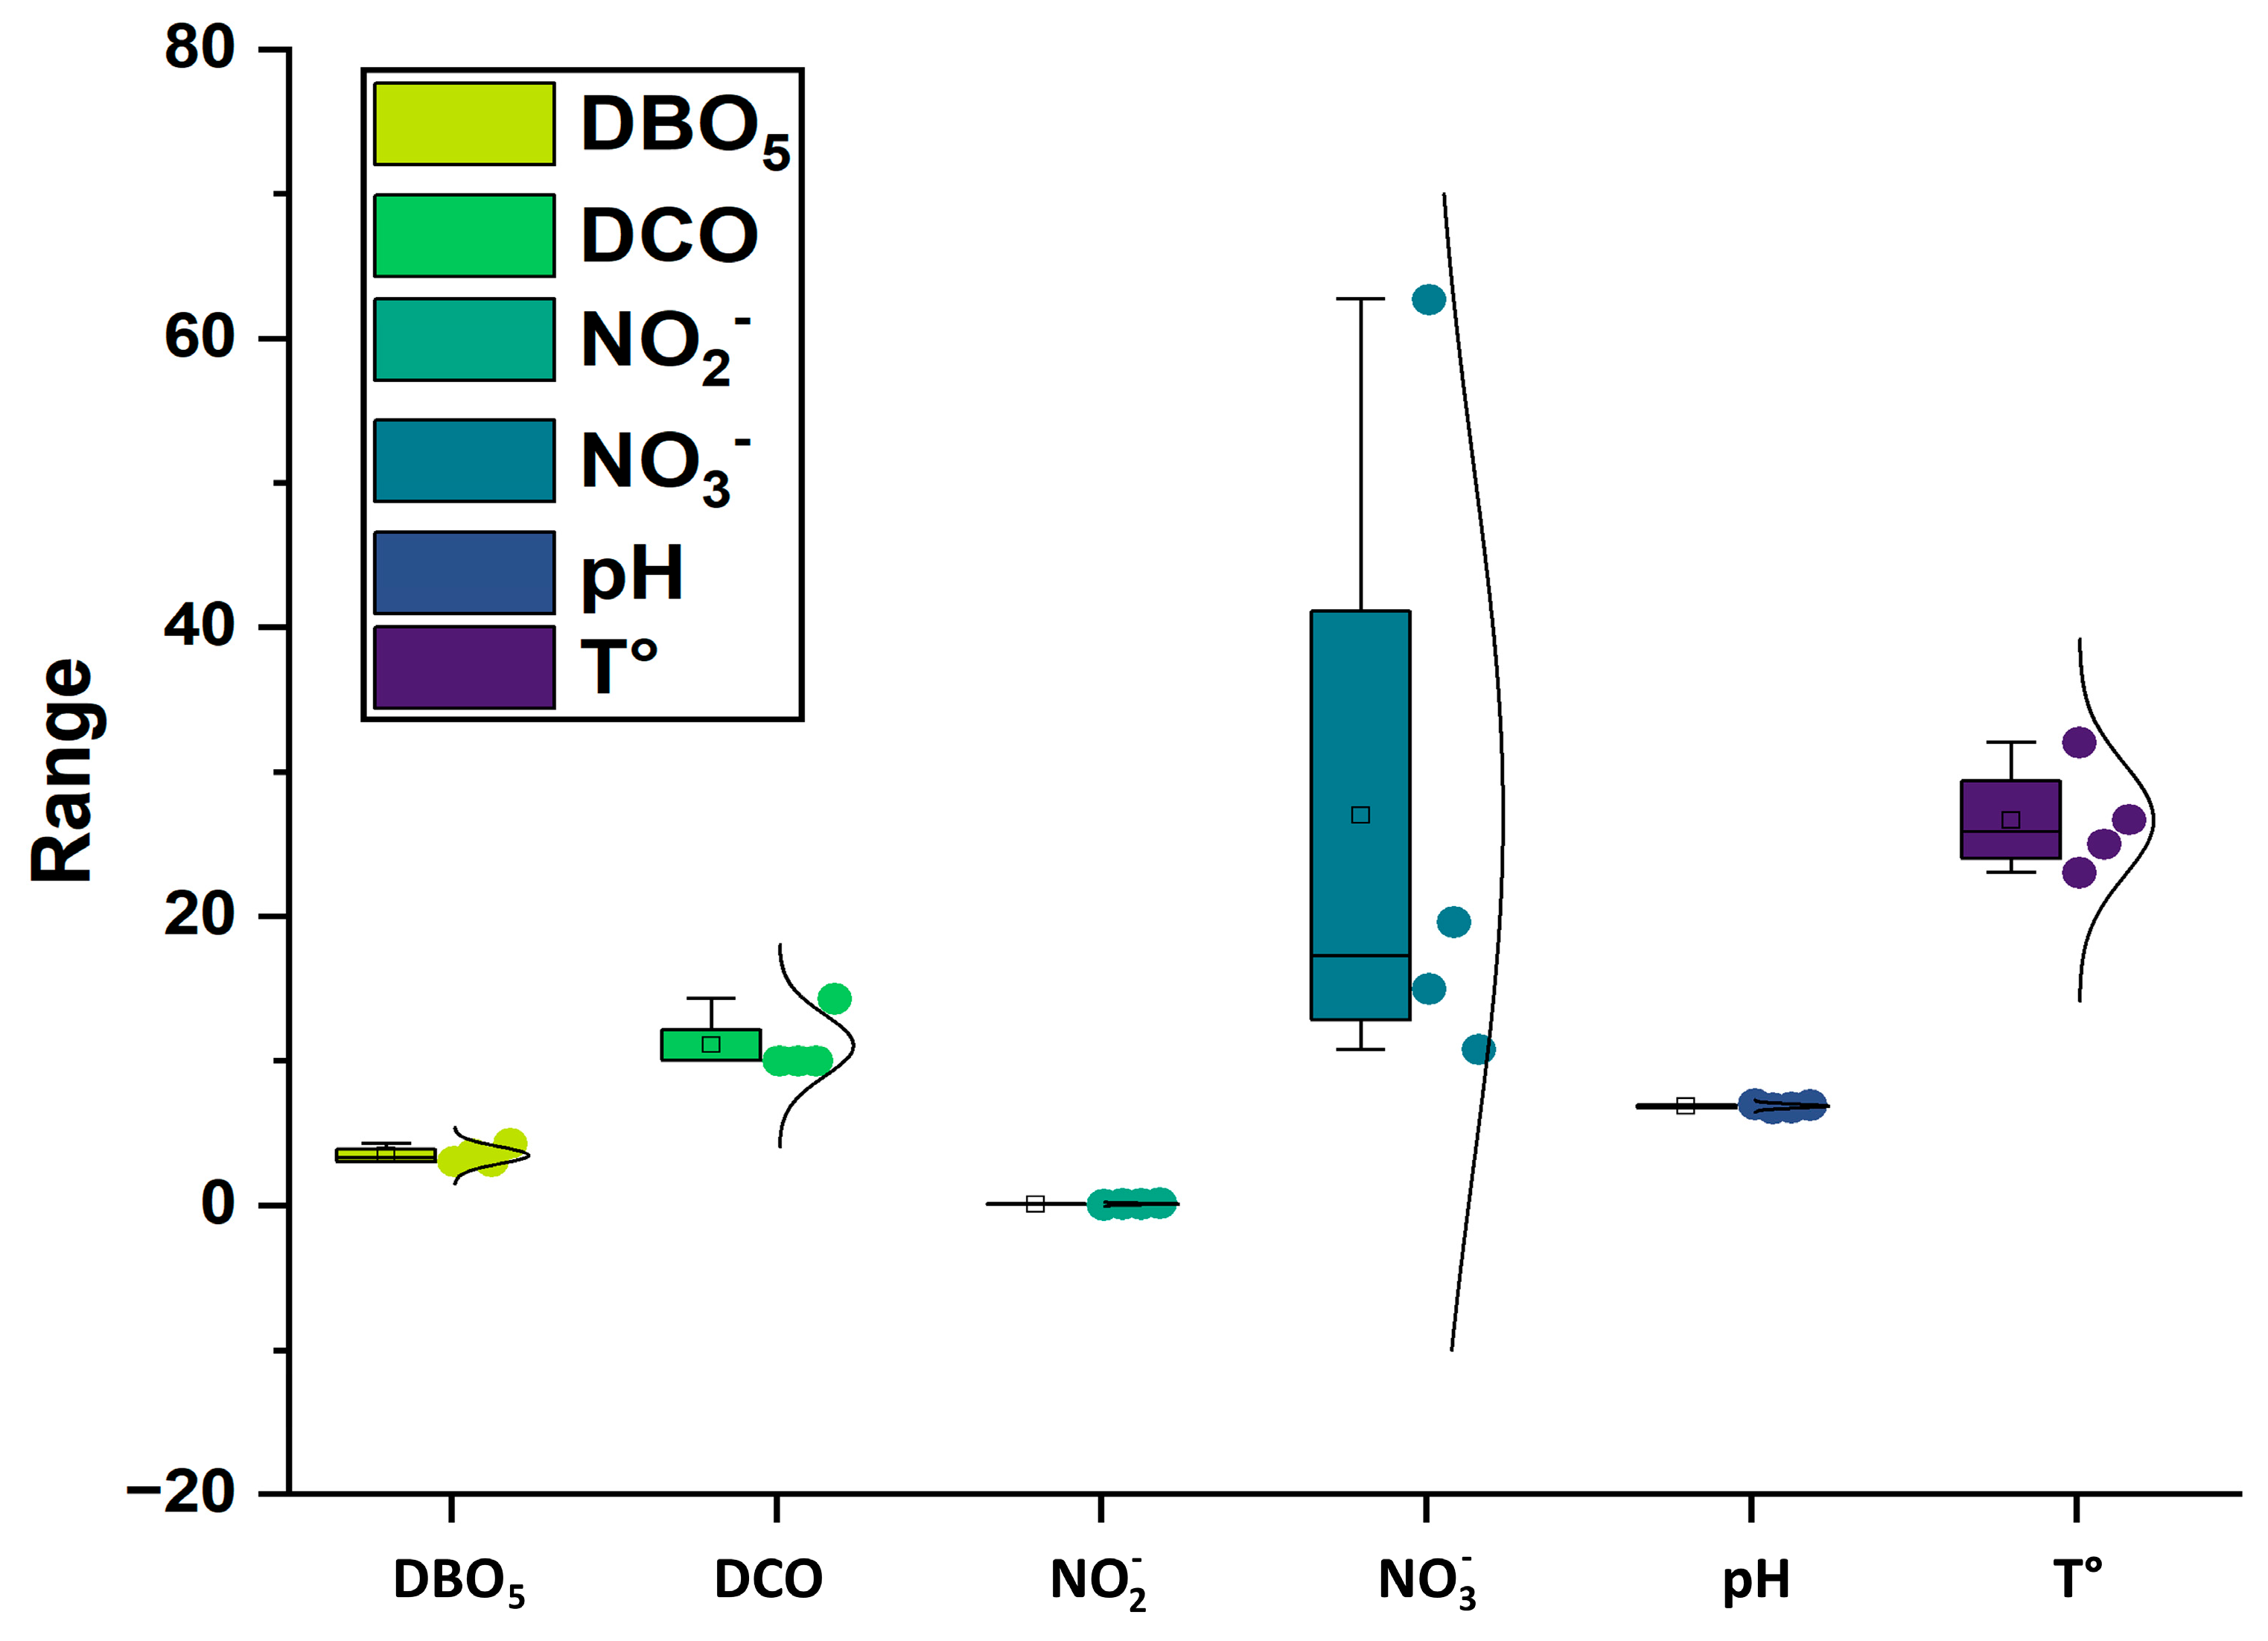
3.1. Physico-Chemical Analysis of Water

Twenty water quality parameters were chosen to measure water quality in the research region. High values for these measures, surpassing specified norms, indicate a decline in water quality. Table 4 illustrates the values of the different parameters evaluated for surface water, compared with the World Health Organization criteria. The table also provides the average, as well as the greatest and lowest values observed.
The quality of water is a critical factor in its use. The quality characteristics of surface water were analyzed, with the descriptive results shown in Table 4 and Figure 4 and Figure 5. The results for these parameters were compared with the World Health Organization [35] guidelines to assess the suitability of the tested waters for human consumption and other uses. This comparison identifies departures from established standards, offering a comprehensive assessment of water quality.
The summarized statistical assessments of the physico-chemical characteristics of the examined surface water samples indicate significant diversity in the different parameters, as seen in Table 4. Surface water temperatures varied between 25 and 30 °C, with a mean temperature of 27.17 °C (refer to Figure 4). The majority of samples from the research region exhibited near-neutral characteristics, with pH values ranging from 6.8 to 7.08, which is below the maximum limit suggested by the WHO [35]. The elevated pH values were mostly due to the inherent presence of carbonates and bicarbonates. Electrical conductivity (EC) ranged from 2288 to 3721 µS/cm, with a mean value of 2677.7 µS/cm, above the WHO limit of 1000 µS/cm (Figure 4). The quantity of total dissolved solids (TDSs) varied from 42.1 to 1030 ppm (Table 4), with the majority of samples staying below the maximum level suggested by the WHO [35]. All samples indicate values above the WHO-suggested threshold for dissolved oxygen (DO), set at 2 mg/L, suggesting a high degree of oxygenation of the surface waters, with DO concentrations ranging from 7.07 to 7.29 mg/L (Table 4). The levels of 5-day biochemical oxygen demand (BOD5) were equal to or larger than the WHO norm of 3 mg/L, ranging from 3 to 4.29 mg/L, while chemical oxygen demand (COD) concentrations were above the WHO guidelines of 3 mg/L, ranging from 10 to 14.3 mg/L.
At the locations tested, concentrations of types of nitrogen, such as NO2 and NH4+, were substantially low, with mean values of 0.08 mg/L and 0.9 mg/L, respectively. These values are significantly below the WHO’s recommended standards for drinking water, which are 3 mg/L for NO2 and 35 mg/L for NH4+ [35]. NO3 may originate from home wastewater, agricultural effluents, notably fertilizers, as well as soil erosion [43]. Of the samples analyzed, only sample S2 exhibited a significant concentration of 62.69 mg/L (Figure 5), which is above the limit of 50 mg/L imposed by the WHO [35].
The Ca2+ and Mg2+ contents varied from 17.08 to 252.81 mg/L and from 8.71 to 86.33 mg/L, respectively, with the highest values found in samples S2 and S3 (Figure 5). All samples, except S4, exceeded the standards specified for drinking water, which are 75 mg/L for Ca2+ and 50 mg/L for Mg2+ according to the WHO [35]. High water hardness exceeding 300 mg/L has been related to many health concerns, including Alzheimer’s disease, diabetes, and cardiovascular disease [44]. Calcium and magnesium are predominantly obtained via the dissolution of carbonate minerals and ferromagnesian minerals found in igneous and metamorphic rocks, as well as magnesium carbonate (dolomite) in sedimentary rocks [45].
TAC represents water’s buffering capacity, i.e., its ability to neutralize acids. It is mainly linked to the concentration of bicarbonates, carbonates, and hydroxides and plays an important role in water pH stability (Table 4). In our study, the TAC values ranged from 28.53 mg/L (minimum value) to 47.28 mg/L (maximum value), with a mean of 38.41 mg/L and a standard deviation of 7.60 mg/L. These values remained well below the WHO recommendation (200 mg/L), indicating good buffer system stability in the water at the sampled stations.
Concerning sodium (Na+) and potassium (K+), the majority of the samples indicated amounts below the maximum permitted range suggested by the WHO [35]. The concentrations of Na+ and K+ varied from 28 to 209.46 mg/L and from 0.54 to 42.54 mg/L, respectively, with the highest values reported at stations S2 and S3 (Figure 5). The weathering of silicate minerals is the predominant source of Na+ and K+ in these samples [46]. Although these ions are not dangerous at normal levels, concentrations beyond permissible limits may have significant health consequences, including hypertension, heart disease, and renal difficulties.
In samples S1, S2, S3, and S4, the chloride concentrations varied from 412.4 to 728.3 mg/L, all above the drinking water restriction of 250 mg/L. Phosphate, while an important ingredient for plant development, was discovered at low levels in all surface water tests, not reaching the 5 mg/L criterion for PO43−.
Similarly, the concentrations of zinc (Zn) and iron (Fe) tested at all the sites were below the norms, with mean values of 0.01 mg/L for Fe and 0.06 mg/L for Zn, correspondingly. These values are deemed low and below the acceptable criteria for water quality (Table 4).

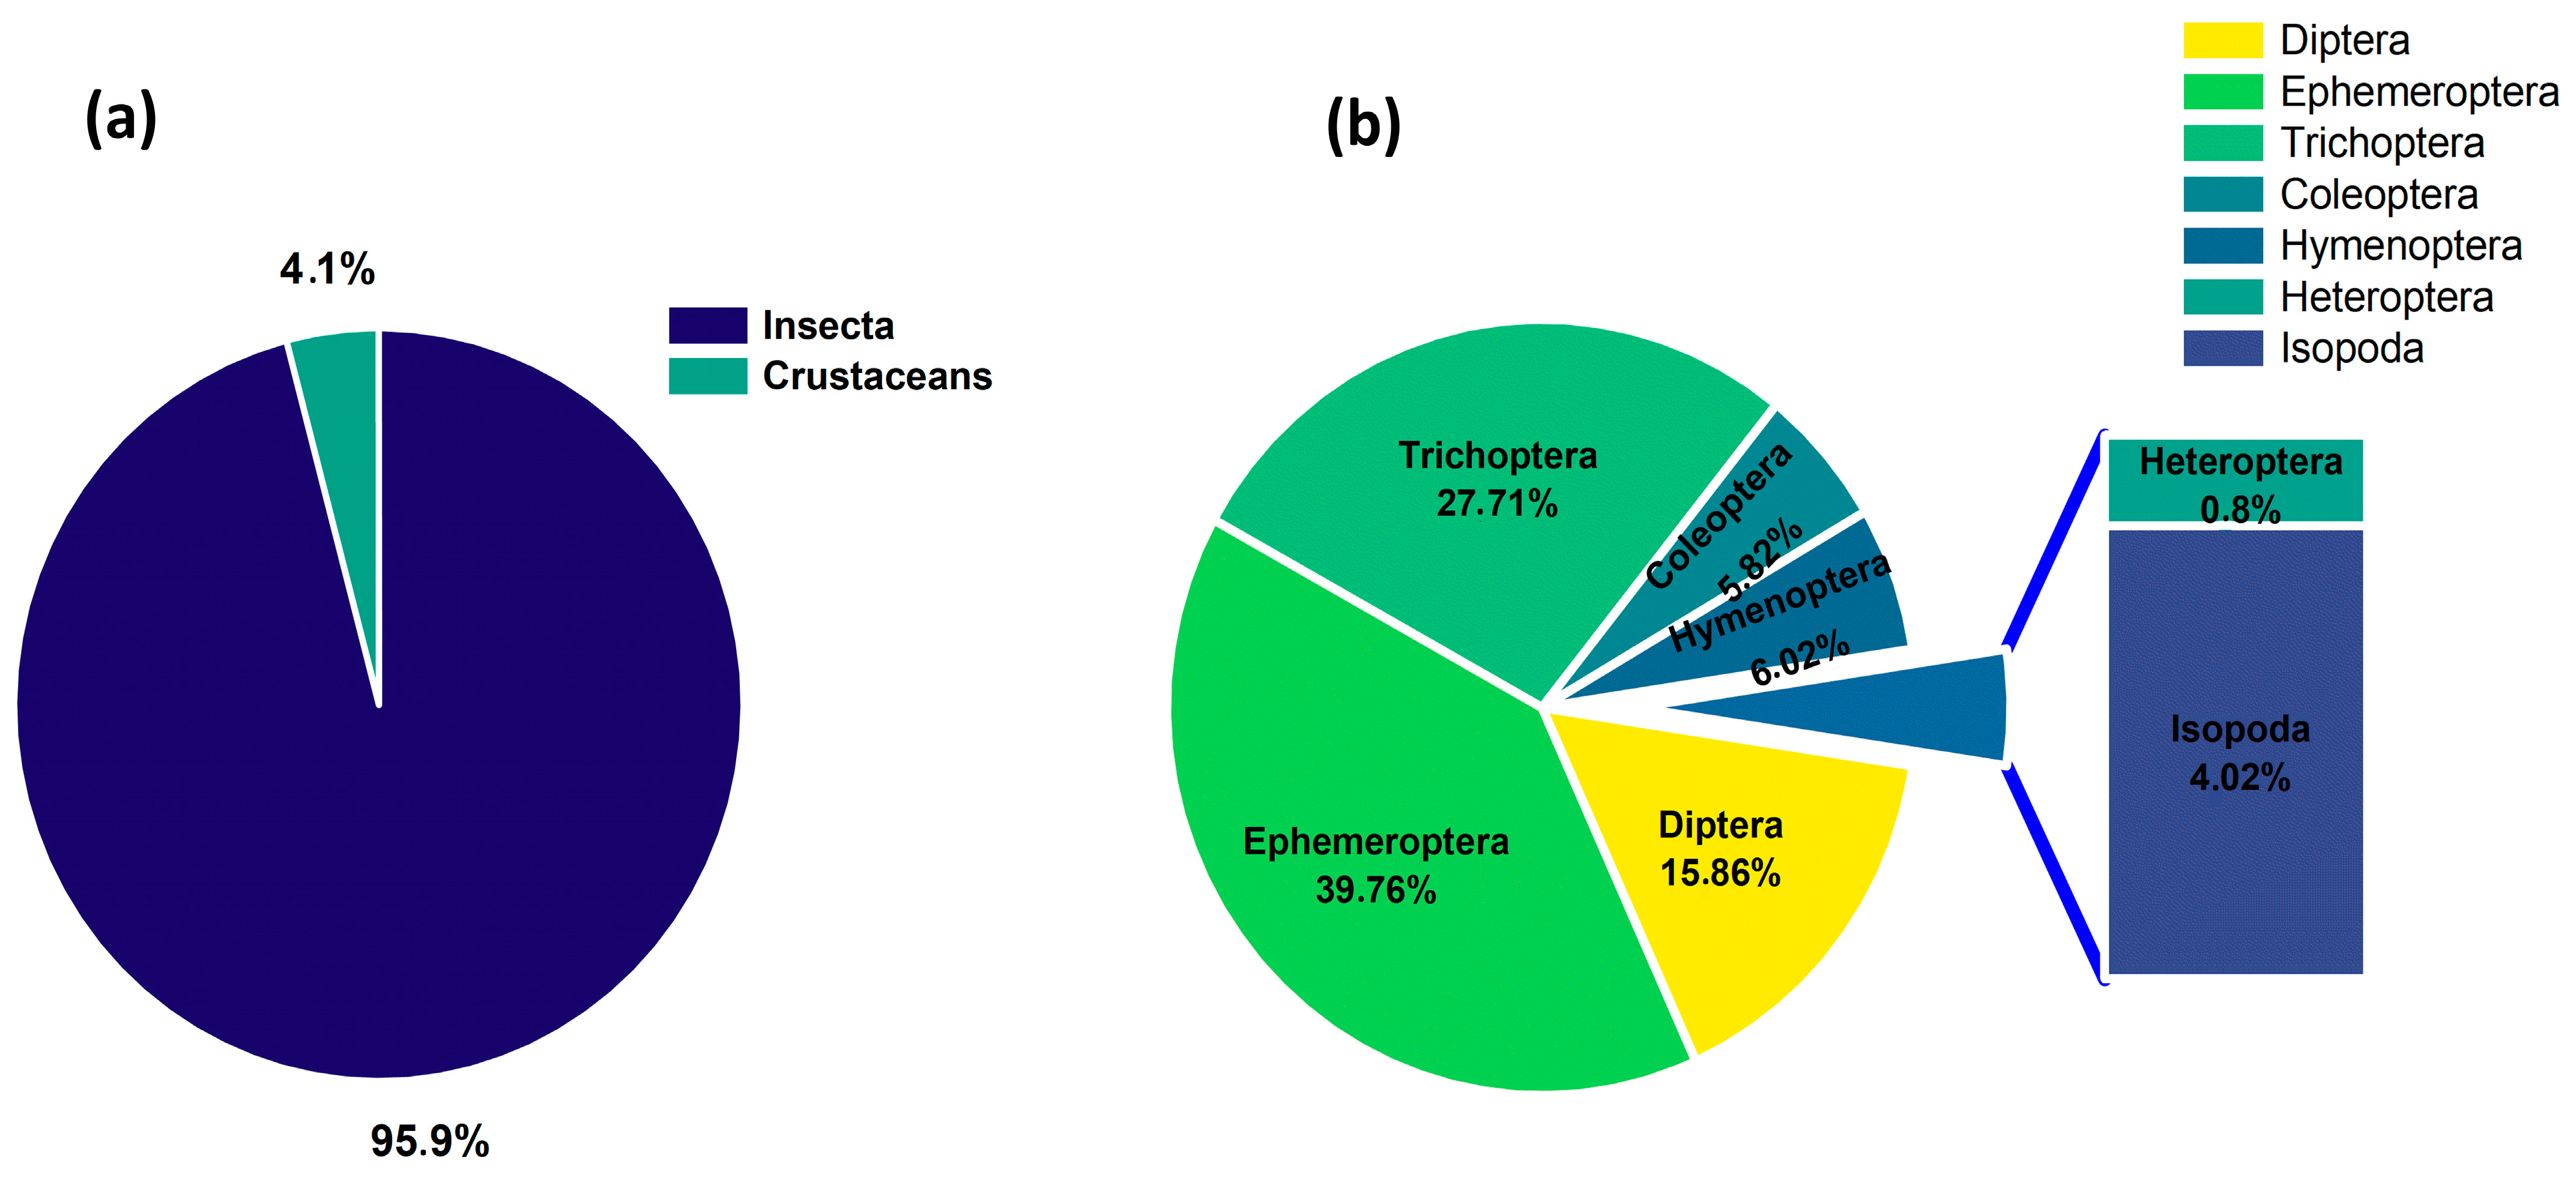
3.2. Benthic Macroinvertebrate Community Structure

This hydroecological investigation of the Gheris basin’s surface waters discovered 424 individuals of benthic macroinvertebrates, all classified under the phylum Arthropoda. These organisms were categorized into two primary groups, Insecta and Crustacea, which are further subdivided into eight orders and 12 families. The Insecta class is distinguished by its extensive taxonomic variety, including seven orders and 11 families, while the Crustacea class has just one order and 1 family. The order Diptera is the most represented taxonomically, with three families, whereas the orders Ephemeroptera and Coleoptera each consist of two families. The orders Heteroptera, Trichoptera, Pulmonata, Isopoda, and Hymenoptera are each represented by a single family.
Station S4 is notable for its species richness, including seven orders and nine families of macroinvertebrates. Subsequently, Station S2 comprises seven orders and eight families. Stations S3 and S1 have less variety, including three orders and one family, respectively.
Shading (Figure 6), based on the abundance of macrofaunal families found at each station, shows increases in the Hydropsychidae and Baetidae at Station 4 compared with the other stations.
The Insecta comprised 95.9% of the overall abundance in the sample, while the Crustacea constituted just 4.1% (Figure 7). Among the orders, Ephemeroptera were the most common, with a share of 39.76%, followed by Trichoptera (27.71%) and Diptera (15.86%). The least common orders were Hymenoptera (6.02%), Coleoptera (5.82%), and Heteroptera, Isopoda, and Odonata, which each accounted for no more than 5.2%. The families discovered with the highest numbers of individuals were Baetidae (122 individuals), Hydropsychidae (129 individuals), and Simuliidae (30 individuals). These data demonstrate a substantial dominance of Insecta orders and families, with a much smaller presence of crustaceans and other taxonomic groupings (Table 5).

3.3. Biological Monitoring of Water Quality and Water Quality Index

In the research conducted on the Ghris watershed, bioindication scores for macroinvertebrate groups were assessed, indicating their tolerance to organic contamination (Table 6). This scoring system, ranging from 1 to 10, enables the assessment of the influence of pollution on aquatic biodiversity by assigning sensitivity values to different macroinvertebrate families based on their tolerance levels. The investigation indicated that macroinvertebrate diversity and families serve as reliable markers of both pollution prevalence and severity in this region. The research conducted in the dry season revealed 12 macroinvertebrate groups across eight orders from samples collected at four river locations. Stations 2 and 4 were notable for their significant variety, including eight and nine families, respectively, but Station 1 exhibited just a single family (Formicidae) over the evaluation period. The IBMWP biotic index indicated discrepancies in water quality across sites. The field survey conducted during the dry season revealed a total of 12 macroinvertebrate families belonging to eight different orders across four sampling sites along the river. Stations 2 and 4 exhibited the highest diversity, with eight and nine families, respectively, whereas Station 1 recorded only a single family (Formicidae), highlighting a strong spatial disparity. The IBMWP biotic index results confirm varying levels of water quality among the stations. The relatively low overall taxonomic richness is likely attributed to environmental stressors, particularly the prolonged drought conditions before the winter season, which reduce water availability and habitat complexity. These findings are consistent with patterns observed in other Mediterranean and semi-arid ecosystems, where seasonal fluctuations in precipitation and stream flow significantly affect aquatic biodiversity. In such systems, not only does the total flow volume tend to decrease, but evaporation rates are also higher, further intensifying ecological stress during dry periods [47,48]. Climate change can give rise to large-scale floods or prolonged droughts, resulting in drying events in perennial aquatic systems. This environmental instability is particularly harmful to macroinvertebrate development and evolution, as they require stable conditions for optimal growth. Generally, the benthic ecosystems in many Mediterranean and tropical rivers are dominated by insects, and their abundance is stable and consistent throughout the year in the surface waters [49,50].
Simultaneously, the quality of surface water resources was assessed through the Water Quality Index (WQI), a method that integrates several multiple criteria into a unitless single index, which allows for comparison of the quality of water for various uses, including human consumption, irrigation, and household purposes. Intrinsic water quality, represented by the Water Quality Index (WQI), was computed by combining 15 chemical and biological factors based on their effects on water quality in comparison to recommended standards set by global organizations [35]. The WQI was used to divide the water bodies into four contamination categories, as illustrated in Figure 8. The results acquired indicate WQI values ranging from 43.57 to 72.24, putting water quality in the “good” category and demonstrating generally excellent water quality in the rivers studied from a physico-chemical point of view. These findings are comparable to those of earlier research that has used the WQI to quantify surface water quality. For example, Sudhakaran et al. [51] recorded WQI values for the Netravati River ranging from 33.21 to 298.66, reflecting swings in water quality from “very good” to “very poor”. Similarly, Hou et al. [52] observed WQI values ranging from 17.8 to 77.8 in five reservoirs, grading water quality from “good” to “very poor”.

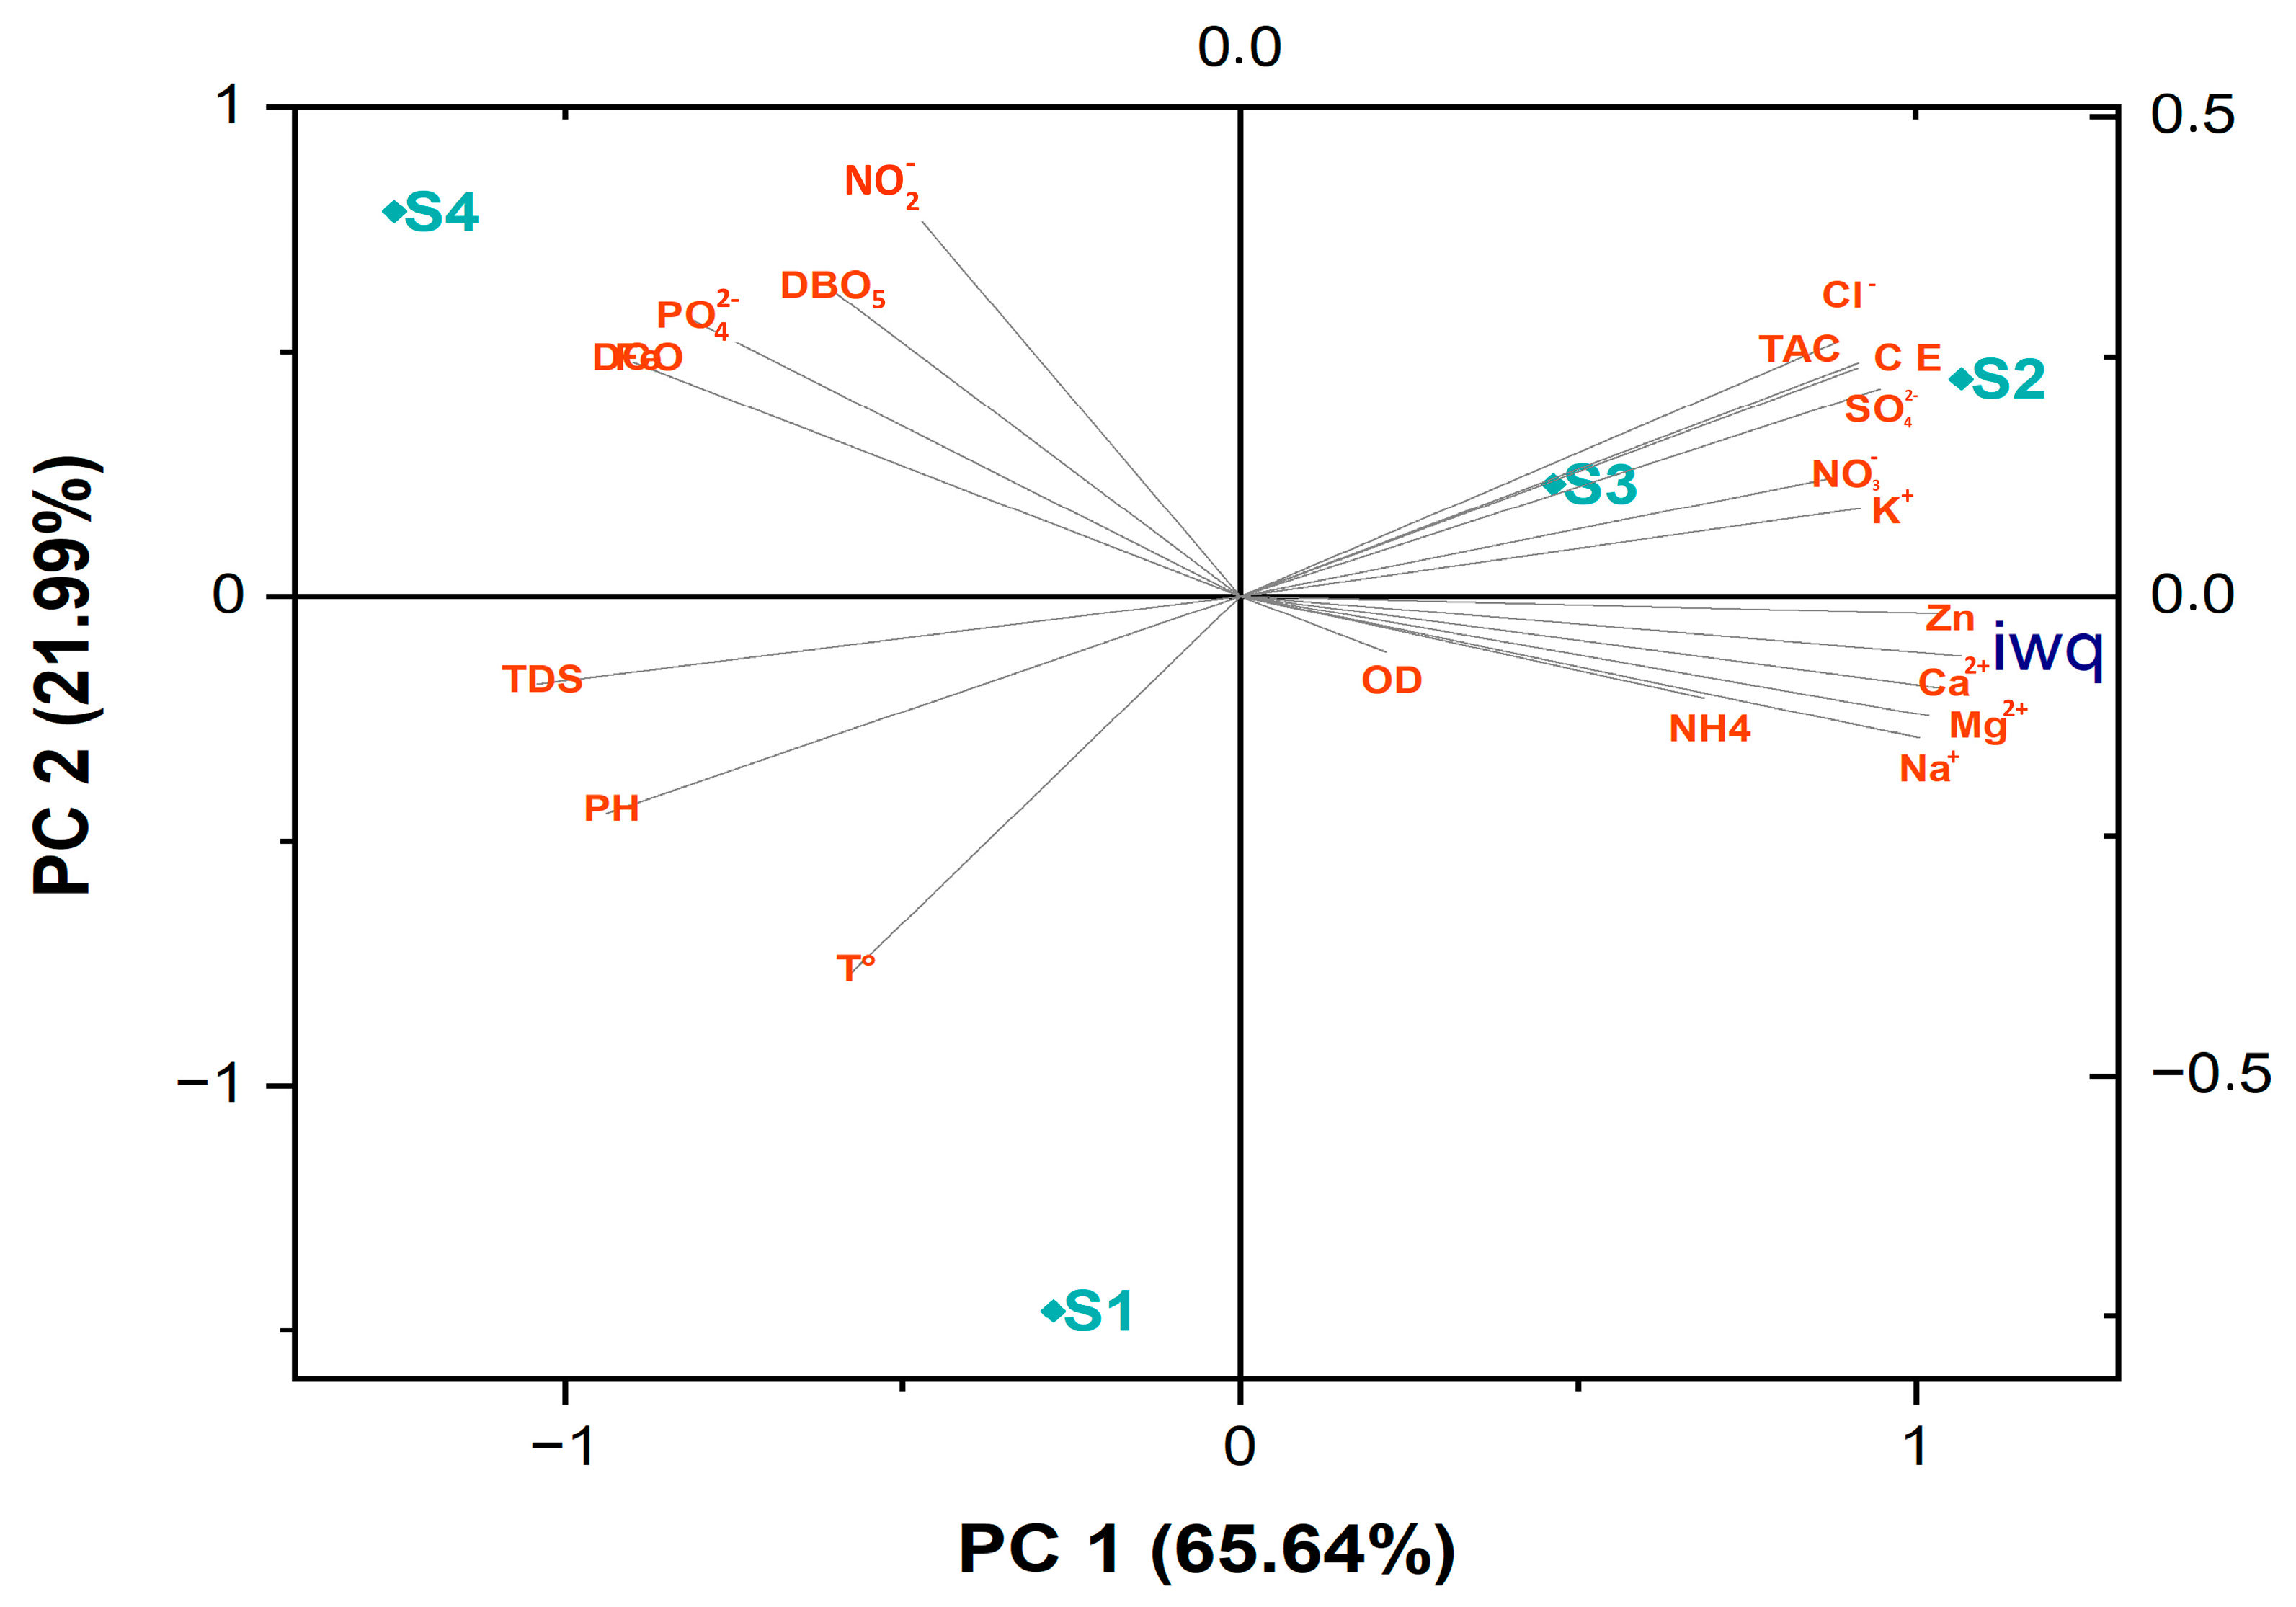
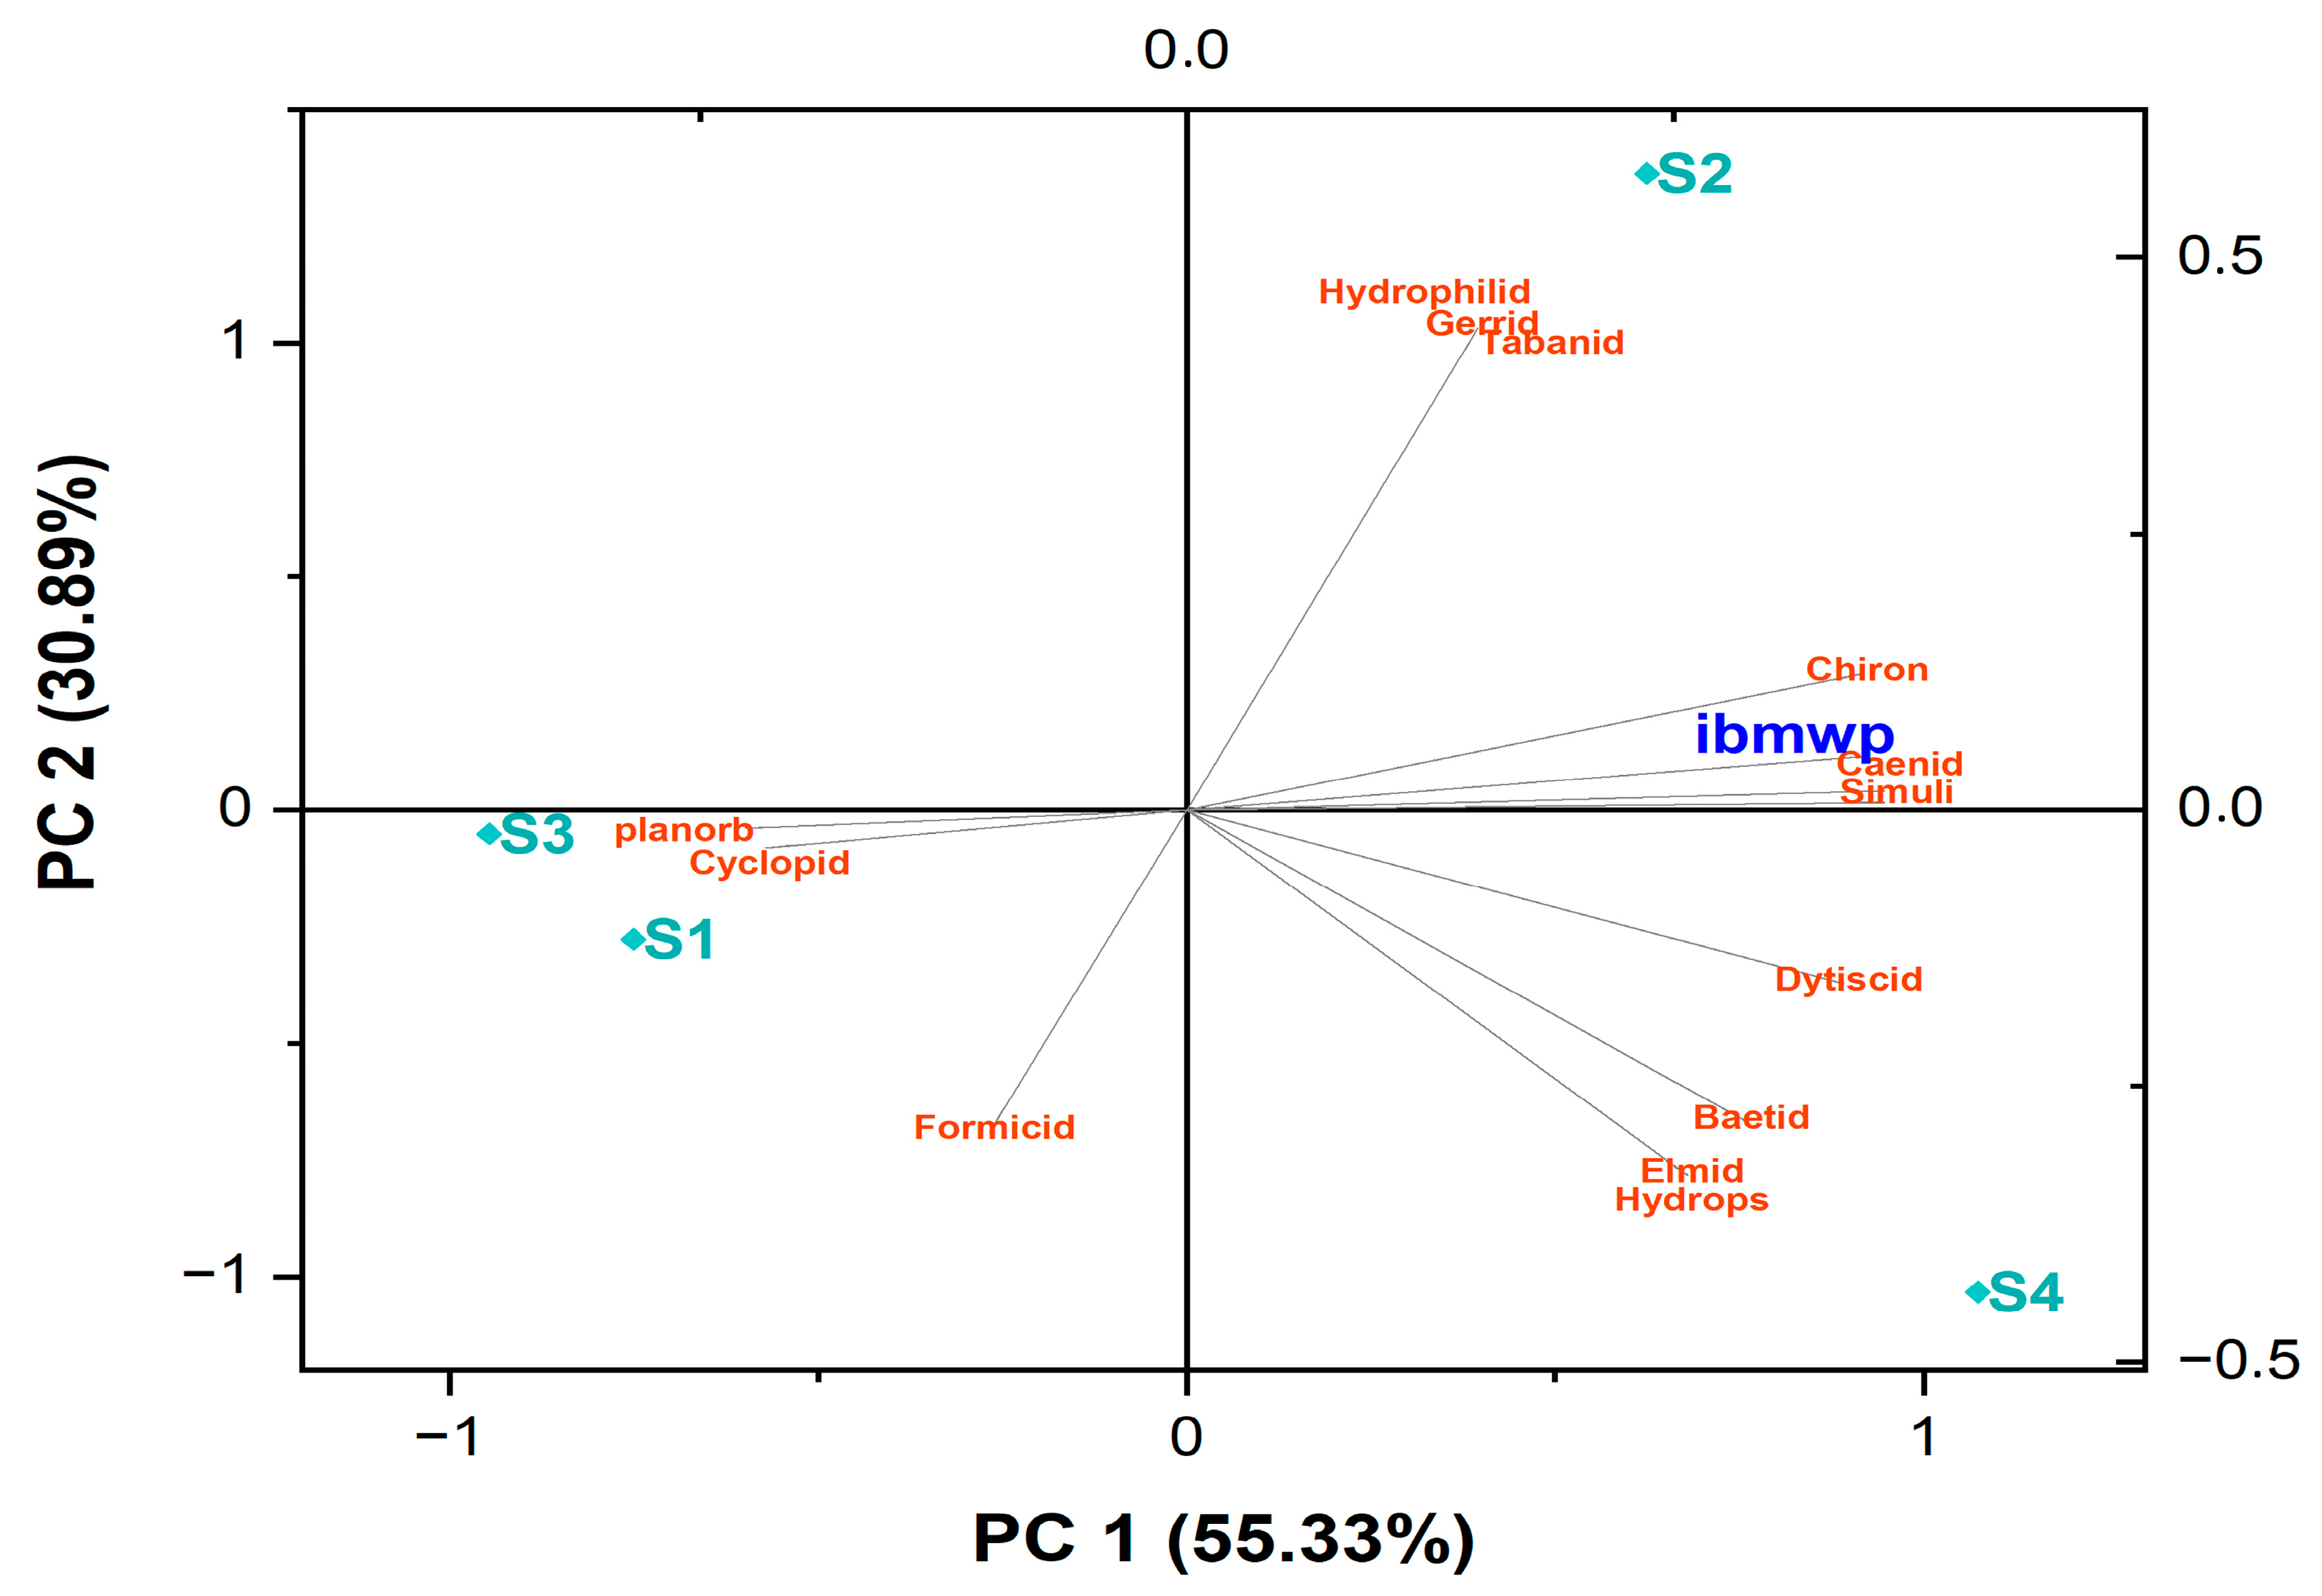
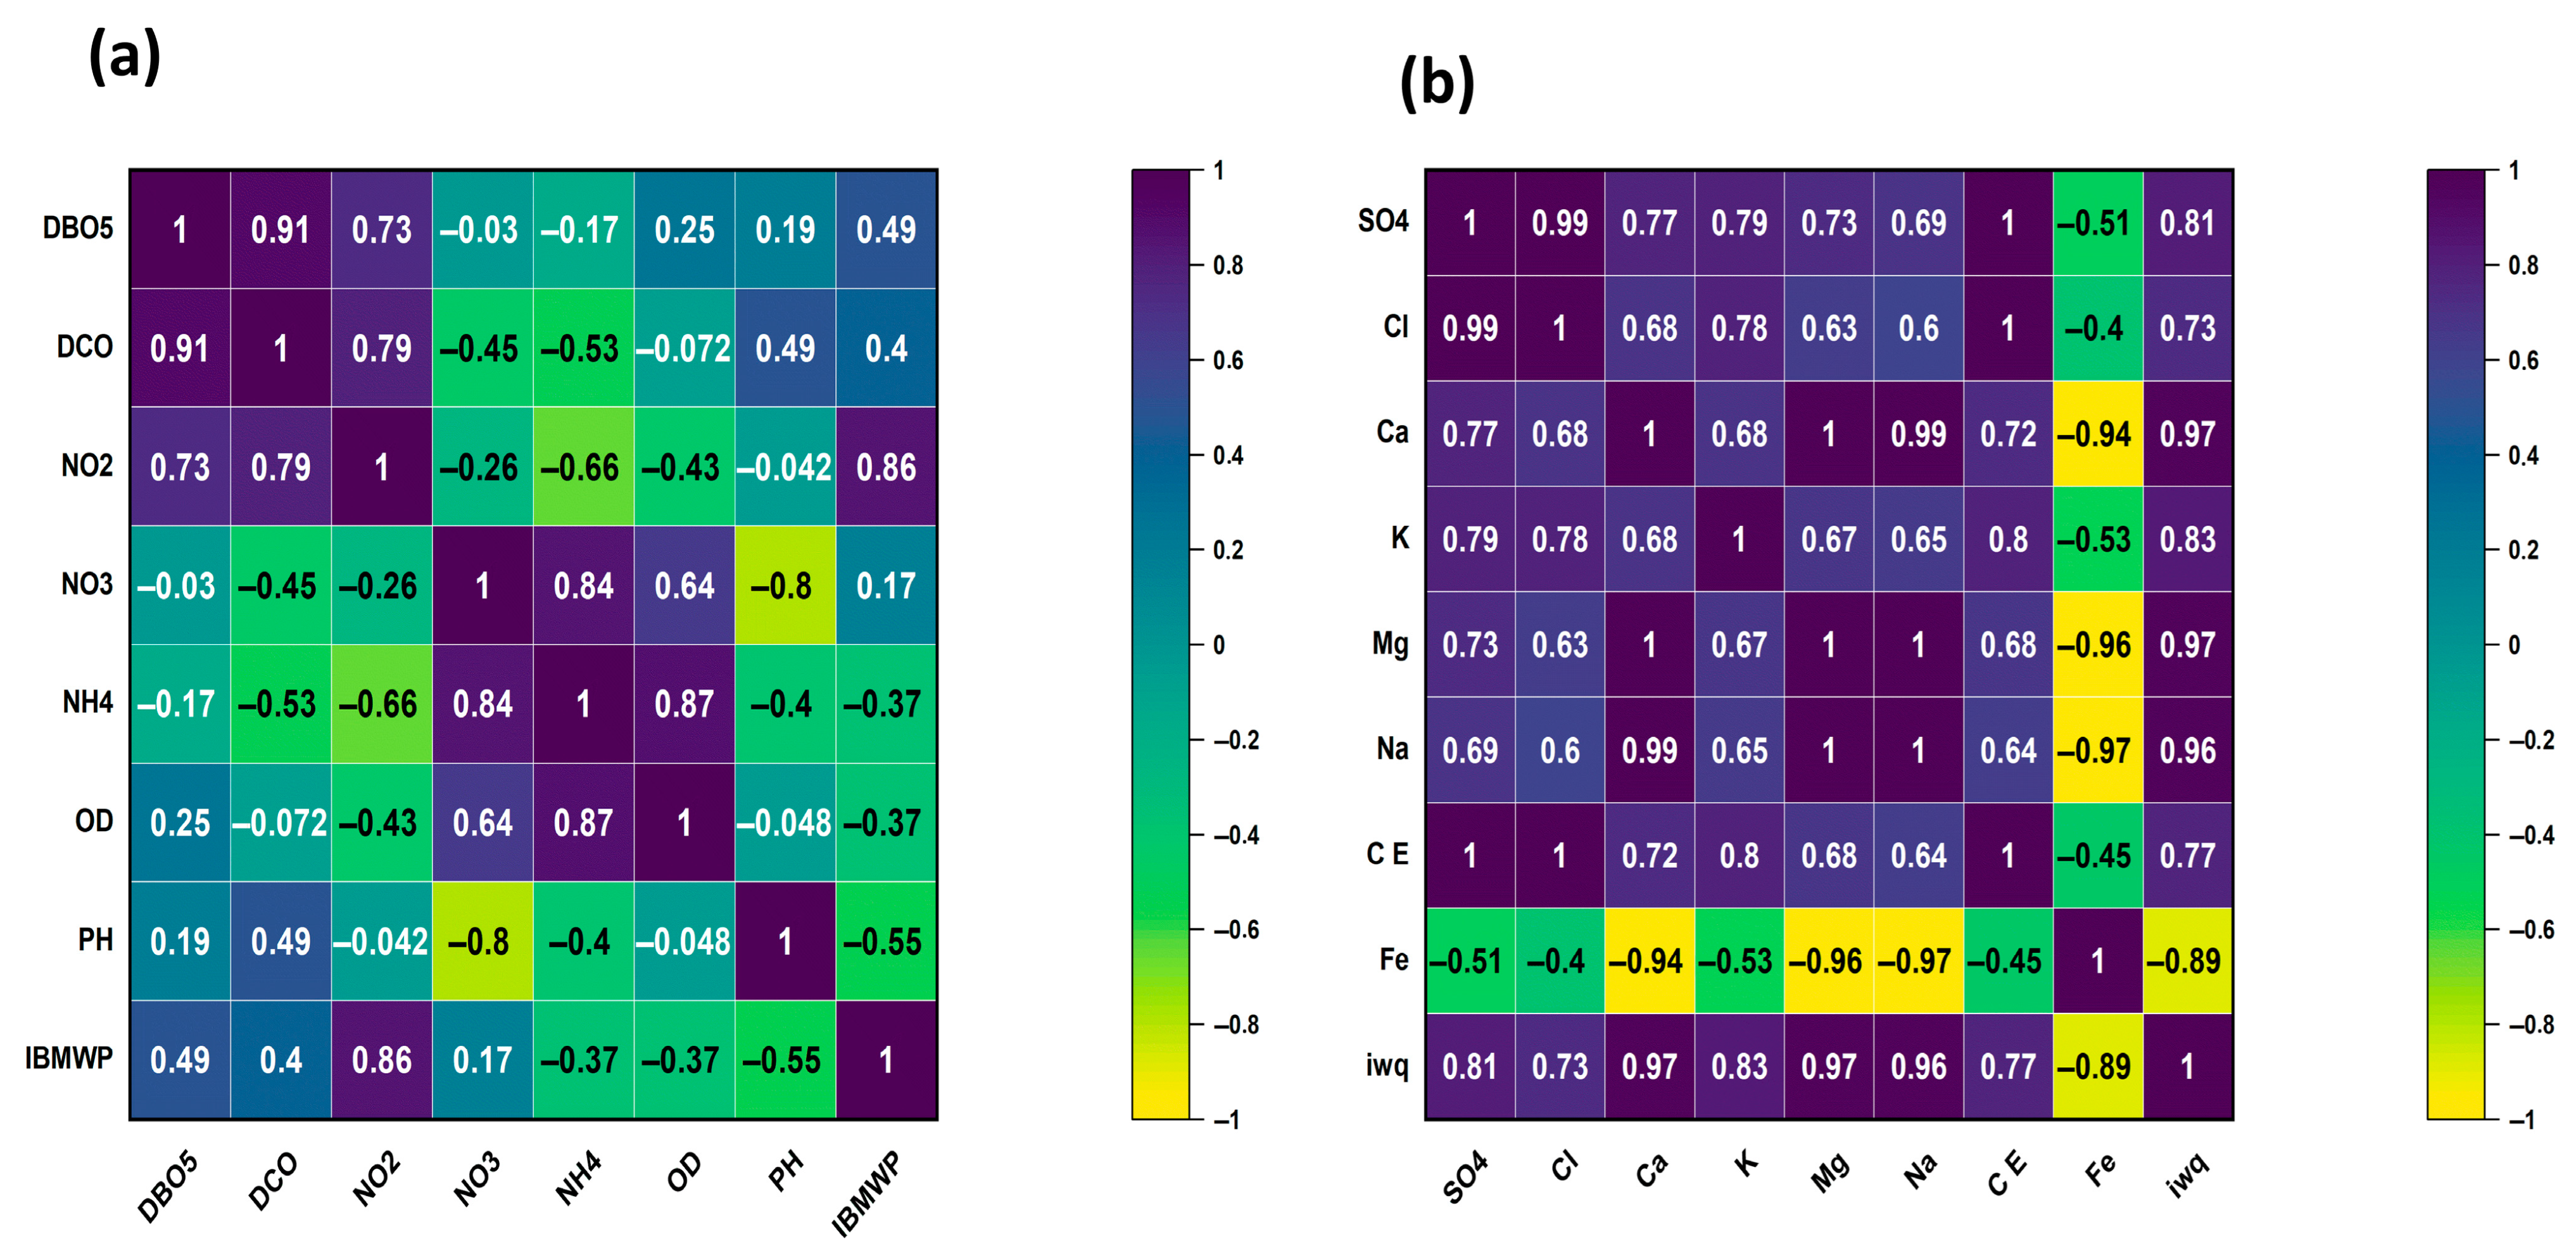
3.4. Statistical Analyses

The findings of the principal component analysis (PCA) (Figure 9) demonstrate that the top two axes explain 87% of the cumulative variation in the data. This research illustrates the correlations between 20 physico-chemical characteristics and the four sites evaluated throughout the watershed. It demonstrates a steady degradation in chemical water quality, notably along the first axis. Stations 2 and 3 are closely associated with high quantities of pollutants, notably Cl SO42−, NO3, and K+ ions, showing rising pollution in these locations. Although dissolved oxygen (DO) shows a slight correlation with Stations 2 and 3, its proximity to the origin on the PCA plot indicates a limited contribution to the variance explained by the principal components, suggesting that it is not a major discriminating factor in water quality differences among the stations. PCA discovered three separate groups of stations according to their physico-chemical properties. Group 1, corresponding to Station 4, is positioned on the negative side of the first principal component (PC1) and the positive side of the second principal component (PC2). This group is characterized by high COD and PO4 concentrations, low levels of mineral components (except Cl), and average temperature conditions.
Group 2, which includes Stations 2 and 3, is located on the positive side of PC1 and PC2. This group is associated with high levels of electrical conductivity (EC) and mineral pollutants such as Cl, SO42−, Mg2+, and K+. It also features moderate temperatures, in line with WHO standards, and relatively low total dissolved solids (TDS).
Finally, Group 3, which represents Station 1, lies on the negative side of PC1 and PC2. It is characterized by low concentrations of mineral pollutants and higher temperatures than the other stations while remaining within acceptable limits for drinking water.
Principal component analysis (PCA) showed that the first two components accounted for 86.22% of the total variance in the data set (Figure 10), with PC1 representing the largest proportion. This analysis highlights the relationships among 13 macroinvertebrate families, the IBMWP index, and the watershed’s four sampling stations.
Three distinct groups of stations emerge from the PCA biplot, based on their positioning along the two principal components:
Group 1, comprising Stations S1 and S3, is located in the negative quadrant of components PC1 and PC2. These stations are strongly associated with the Planorbidae, Cyclopidae, and Formicidae families, suggesting specific biological conditions that may indicate moderate to impaired water quality.
Group 2, represented by Station S2, appears in the positive quadrant of PC1 and PC2. This group is positively correlated with families such as Hydropsychidae, Gerridae, Tabanidae, Chironomidae, and Caenidae, as well as with higher IBMWP scores, reflecting better biological quality.
Group 3, corresponding to Station 4, is in the positive part of PC1 but in the negative part of PC2. It features strong associations with the Dytiscidae, Baetidae, and Elmidae families, as well as a favorable IBMWP index, indicating ecologically stable conditions.
The redundancy analysis (RDA) (Figure 11) presented in this graph illustrates the relationships between different physico-chemical water parameters and aquatic macroinvertebrate communities. The main axis (PC1), which explains 53.34% of the variance, mainly distinguishes gradients of chemical pollution. To the right of this axis, there is a strong positive correlation with parameters such as sodium (Na+), calcium (Ca2+), magnesium (Mg2+), nitrates (NO3), sulfates (SO42−), chlorine (Cl), potassium (K+), and electrical conductivity (EC), indicating water enriched in dissolved salts and nutrients, which is often linked to pollution of urban or agricultural origin. These conditions are associated with the presence of taxa, such as Cyclopidae, Tabanidae, Hydrophilidae, and Gerridae, renowned for their tolerance of degraded environments. In contrast, on the left of the PC1 axis, parameters such as biological oxygen demand (BOD5), nitrite (NO2), and iron (Fe) are linked to organic pollution, which explains the presence of invertebrates, such as Baetidae, Dytiscidae, Simuliidae, Chironomidae, and Caenidae, often found in environments impacted by domestic discharges or increased organic decomposition. On the secondary axis (PC2, 35.49%), pH appears as an isolated factor influencing mainly Formicidae, suggesting that these insects may be associated with particular pH conditions, possibly acidic. In summary, this analysis reveals a clear structuring of macroinvertebrate communities according to gradients of chemical and organic pollution, as well as specific physico-chemical factors, such as pH.
In addition to identifying the origins of the hydrochemical formation process and measuring the degree of importance between the different parameters, correlation analysis was utilized to highlight the complex interactions between the physico-chemical and biological parameters measured in the research region. The correlation matrix of hydrochemical, mineral, and organic data, as well as the WQI and IBMWP indices, was generated for each station and is displayed in Figure 10 of this section. This matrix was built using Pearson correlation analysis.
Figure 12 shows that the Fe2+ parameter is negatively related to the IWQ (r = −0.89), suggesting that these ions may not have a significant impact on surface water quality in the region studied. However, this relationship is less evident with the WQI, where the correlation may be weaker. Sodium (Na+) correlates favorably with calcium (Ca2+), magnesium (Mg2+), and potassium (K+), but negatively with iron (Fe2+). In addition, a strong positive association between calcium (Ca2+) and magnesium (Mg2+) shows that they probably come from similar sources. These correlations can be explained by the dissolution of minerals contained in rocks and ionic exchanges, which lead to the precipitation of specific chemical products. In addition, the figure highlights considerable positive associations between the parameters BOD5, COD, and NO2 and the IBMWP index, demonstrating that these hydrochemical parameters have a significant impact on the biological quality of aquatic ecosystems. This association could be linked to the influence of human activities, such as the use of chemical fertilizers, which contribute to the contamination of surface watercourses through runoff and leaching from agricultural land.

4. Discussion

In North Africa, the aquatic ecosystems are very important due to the lack of water resources and the demand for agriculture. In this study, we assessed the hydrobiological qualities of the Ghris watershed in southern Morocco. The recorded results clarify the physico-chemical status of surface water and the biological diversity of the studied river. In Morocco, these data update the information on hydrobiological aspects and provide relevant information to stakeholders, government institutions, and decision-makers involved in the sustainable management of groundwater resources in southeast Morocco and the Drâa-Tafilalet region. Similarly, this study presents updated data on rivers in the arid area of Morocco and offers a reference for other North African and South European Rivers characterized by similar climate contexts. Similarly, the study parameters, such as macroinvertebrates, are suggested to clarify the geographical distribution of these groups in the arid area of North Africa.

4.1. Spatial Variation in Surface Water Quality

The spatial characterization of surface water quality was conducted through a biological analysis utilizing macroinvertebrates and a physico-chemical analysis encompassing 17 variables, categorized into four sampling stations (pH, EC, Ca2+, O2, COD, Mg2+, NO2, NO3, NH4+, Na+, K+, Cl, SO42−, PO42−, Fe2+, WQI, and IBMWP). The physico-chemical data indicate a geographical range in pH, with values ranging from 6.72 to 6.98 at all analyzed locations, indicating a near-neutral hydrogen potential for surface waters. Previous data indicate that local geology affects pH levels [53]; nevertheless, in our research region in June 2024, pH levels remained almost neutral. This discovery may be associated with reduced flow and elevated temperature, resulting in ion concentration and, subsequently, a decline in pH. Related research revealed a similar rationale [54]. The observed increase in conductivity throughout the research is primarily linked to the reduction in flow and the heightened evaporation of water resulting from the temperature elevation [55]. All examined stations exhibited elevated and consistent oxygen values. The stability of dissolved oxygen in water is intricately linked to temperature and land gradient [56]. Pollutants (Mg2+, Cl, K+, NH4+, NO3, PO42−), higher temperatures, reduced flow rates, and greater pollution sources result in heightened contaminant concentrations in water, a phenomenon previously shown in the research [55,57]. This is notably true for all the stations assessed. The concentrations of nitrates, nitrites, and phosphates in surface waters appeared to be predominantly impacted by human activities, such as waste disposal, sanitary landfills, excessive fertilizer application, and inappropriate manure management [58]. This was notable at Station 2, where circumstances are much less advantageous than at the other stations in the monitoring network. In the studied region, the highest Ca2+ concentration was observed at 252.81 mg/L, while the lowest value was 17.08 mg/L. This reveals that just one sample (S4) had a Ca2+ content below the WHO recommended limit of 75 mg/L. Regarding Mg2+ concentrations, the greatest value found was 86.33 mg/L, and the lowest value was 8.71 mg/L. This also implies that only the water at Station 4 is below the WHO standard of 30 mg/L. The abundance of Ca2+ and Mg2+ in the waters of the Ghris catchment is linked to the weathering, erosion, and dissolution of carbonate and silicate minerals in stream water.
Regarding chlorides, according to WHO drinking water quality regulations, their content should not exceed 250 mg/L. In this investigation, the highest chloride content was 728.3 mg/L, whereas the lowest was 412.4 mg/L. It has been shown that chloride concentration grows gradually in regions of heavy anthropogenic activity. This indicates that human causes, such as the use of synthetic inorganic fertilizers, leaching from landfills, and industrial effluents discharged into watercourses, contribute considerably to the rise in chloride concentration [59].
The Water Quality Index (WQI) gives a rapid and easy-to-understand evaluation and classification of water quality. For the computation of the WQI in this research, the reference values of the parameters according to WHO guidelines were employed. The water samples were obtained throughout the summer season, and the WQI findings are displayed in the graph in Figure 7. The average WQI value in the Ghris region is 59,80. The sample results varied between 43.57 and 72.24, putting the quality of the water under the “Good water” category and indicating that it is “Suitable for human consumption”.
In terms of water quality, most of the locations tested in Ghris had low WQI scores, indicating good water quality. Consequently, the WQI is a vital water quality monitoring tool and plays a key role in water resource management, especially for authorized uses. Nevertheless, the WQI values for S1, S2, S3, and S4 did not reach the 100 mark, which may be ascribed to the lack of any major actual influence by runoff from agricultural land and household wastewater in these sites, resulting in high water quality and low and medium WQI values.

4.2. Relationship Between WQI and IBMWP

The findings obtained from the Water Quality Indices (WQIs) and the IBMWP demonstrate a substantial positive association at 50% of the stations, indicating a generally excellent state of the aquatic environment in the research region. Although both indices examine water quality from distinct viewpoints, with the WQI based on physico-chemical characteristics and the IBMWP on biological ecosystem indicators, their findings align and indicate generally comparable patterns at 50% of stations throughout the sample locations. The WQI ratings, ranging from 43.57 to 72.24, indicate high water quality adequate for human consumption, whereas the IBMWP scores, moderate to low, attest to a partial loss of benthic macroinvertebrate biodiversity at specific stations. This relationship between the two indices highlights the joint impact of human and climatic factors, such as increased temperatures, reduced flow, and nutrient accumulation, on the biological characteristics of the aquatic ecosystem, with a greater intensity than on physico-chemical properties in this case. The IBMWP, being more sensitive to biological changes, verifies the patterns identified with the WQI and emphasizes noteworthy variances, notably at stations S1 and S3. Indeed, the decline in biodiversity at these locations, along with human contaminants (fertilizers, industrial, and residential waste), alludes to a major degradation in the overall aquatic ecosystem. Integrating the two indices enables a more thorough evaluation of the combined impact of human and climate forces on water quality. While the WQI gives an evaluation of physico-chemical conditions, the IBMWP reflects the ecological resilience of aquatic systems by identifying particular biodiversity-related changes. In conclusion, the combined use of these two indices is vital for the sustainable management of water resources, providing an integrated investigation into the chemical and biological elements of the aquatic environment. This comprehensive approach is vital for developing effective management plans to preserve and control water quality in the face of escalating environmental concerns.

4.3. Relationship Between Substrate and Benthic Macroinvertebrate Distribution

Analysis of the benthic community structure revealed notable variations among the sampled sites. Site S4 was dominated by the families Baetidae and Hydropsychidae, known for their sensitivity to pollution and their preference for well-oxygenated habitats with coarse substrates, suggesting relatively good ecological conditions. In contrast, sites S2 and S3 showed a higher abundance of Chironomidae and Simuliidae, families generally more tolerant of degraded conditions, which may be linked to the presence of finer substrates rich in organic matter. These observations indicate that sediment type plays a decisive role in the structuring of benthic communities. Sandy or gravelly substrates benefit specialized taxa, such as Elmidae and Baetidae, while muddy or silty environments tend to host more opportunistic taxa. These results underline the importance of incorporating substrate characteristics when assessing the ecological quality of aquatic environments.

5. Conclusions

This study assessed the ecological quality of water in the main stream of the Ghris watershed, located in an arid and semi-arid region of southeastern Morocco, by combining physico-chemical (WQI) and biological (IBMWP) parameters at four representative sites. The results indicate that the two indices show a degree of consistency in their diagnosis, particularly at 50% of the stations. However, discrepancies were observed: the WQI suggests overall “acceptable” water quality for human use (values ranging from 43.57 to 72.24), while the IBMWP highlights marked biological degradation at certain sites, in particular S1 and S3, where benthic biodiversity is most impacted by anthropogenic activities.
This difference underlines the fact that macroinvertebrates, as biological indicators, respond more sensitively to environmental pressures such as nutrient enrichment, diffuse agricultural pollution, and elevated temperatures, compared to chemical parameters alone. Thus, the WQI-IBMWP crossover approach is a robust tool for integrated water quality assessment.
Although limited by a single sampling conducted during the dry season (10 June 2024), this study provides the first integrated assessment of water quality and benthic communities in the Ghris watershed. Despite this temporal constraint, the results obtained through the combined use of physico-chemical (WQI) and biological (IBMWP) indicators represent an original and valuable contribution. This methodology proves relevant and applicable to other watersheds in arid and semi-arid regions facing similar pressures from anthropogenic activities and climate change. While extended temporal monitoring is desirable to better understand seasonal and interannual dynamics, this study provides a solid foundation to guide sustainable water resource management both locally and in comparable ecological contexts internationally.

Author Contributions

Conceptualization, A.E.M., S.A.B., W.S., A.N. and C.P.; Data curation, A.N. and E.M.B.; Formal analysis, I.M. and W.S.; Investigation, S.A.B.; Methodology, A.E.M., S.A.B., I.M., A.A. and A.A.B.; Resources, C.P.; Software, M.A.; Supervision, A.A.B.; Validation, A.E.M., I.M., A.A., M.A. and E.M.B.; Visualization, A.A.B.; Writing—original draft, A.E.M., S.A.B., A.A., W.S., A.N., E.M.B. and C.P.; Writing—review and editing, I.M., M.A. and A.A.B. All authors have read and agreed to the published version of the manuscript.

Funding

This research received no external funding.

Data Availability Statement

The datasets used and analyzed during the current study are within the article.

Acknowledgments

This work was carried out with the support of the National Center for Scientific and Technical Research CNRST.

Conflicts of Interest

The authors declare no conflicts of interest.

References

  1. Gleick, P.H. (Ed.) An Introduction to Global Fresh Water Issues. In Water in Crisis; Oxford University Press: New York, NY, USA, 1993; pp. 3–12. [Google Scholar]
  2. Botkin, D.B.; Keller, E.A. Environmental Science: Earth as a Living Planet; Wiley: New York, NY, USA, 1995; ISBN 978-0-471-54548-4. [Google Scholar]
  3. Noutcha, M.; Damiete, O.; Johnny, M.; Ngozi, O.; Ezera, C.; Okiwelu, S. Quantity and Quality of Water Condensate from Air Conditioners and Its Potential Uses at the University of Port Harcourt, Nigeria. Adv. Appl. Sci. Res. 2016, 7, 45–48. [Google Scholar]
  4. Ganiyu, S.A.; Mabunmi, A.A.; Olurin, O.T.; Adeyemi, A.A.; Jegede, O.A.; Okeh, A. Assessment of Microbial and Heavy Metal Contamination in Shallow Hand-Dug Wells Bordering Ona River, Southwest Nigeria. Environ. Monit. Assess. 2021, 193, 126. [Google Scholar] [CrossRef] [PubMed]
  5. Kawo, N.S.; Karuppannan, S. Groundwater Quality Assessment Using Water Quality Index and GIS Technique in Modjo River Basin, Central Ethiopia. J. Afr. Earth Sci. 2018, 147, 300–311. [Google Scholar] [CrossRef]
  6. Rivett, M.O.; Miller, A.V.M.; MacAllister, D.J.; Fallas, A.; Wanangwa, G.J.; Mleta, P.; Phiri, P.; Mannix, N.; Monjerezi, M.; Kalin, R.M. A Conceptual Model Based Framework for Pragmatic Groundwater-Quality Monitoring Network Design in the Developing World: Application to the Chikwawa District, Malawi. Groundw. Sustain. Dev. 2018, 6, 213–226. [Google Scholar] [CrossRef]
  7. Ouhamdouch, S.; Bahir, M.; Souhel, A.; Paula, C. Vulnerability and Impact of Climate Change Processes on Water Resource in Semi-Arid Areas: In Essaouira Basin (Morocco). In Energy, Transportation and Global Warming; Grammelis, P., Ed.; Springer International Publishing: Cham, Switzerland, 2016; pp. 719–736. ISBN 978-3-319-30127-3. [Google Scholar]
  8. Dahan, S.; Johan, G.; Anouar, K.; Bekhechi, M.; Jalil, M.; Abdulnour, R. Gestion de La Rarete de l’Eau En Milieu Urbain Au Maroc; Banque mondiale: Washington, DC, USA, 2017. [Google Scholar]
  9. Julien, F. Maîtrise de l’eau et développement durable en Afrique de l’ouest: De la nécessité d’une coopération régionale autour des systèmes hydrologiques transfrontaliers. VertigO Rev. Electronique Sci. L’environnement 2006, 7–2. [Google Scholar] [CrossRef]
  10. Brierley, G.J. The Socio-Ecological River: Socio-Economic, Cultural and Environmental Relations to River Systems. In Finding the Voice of the River: Beyond Restoration and Management; Brierley, G.J., Ed.; Springer International Publishing: Cham, Switzerland, 2020; pp. 29–60. ISBN 978-3-030-27068-1. [Google Scholar]
  11. Fretwell, J.D. National Water Summary on Wetland Resources; U.S. Government Printing Office: Washington, DC, USA, 1996; ISBN 978-0-607-85696-5. [Google Scholar]
  12. Lougheed, V.L.; Crosbie, B.; Chow-Fraser, P. Predictions on the Effect of Common Carp (Cyprinus carpio) Exclusion on Water Quality, Zooplankton, and Submergent Macrophytes in a Great Lakes Wetland. Can. J. Fish. Aquat. Sci. 1998, 55, 1189–1197. [Google Scholar] [CrossRef]
  13. Riens, J.R.; Schwarz, M.S.; Mustafa, F.; Hoback, W.W. Aquatic Macroinvertebrate Communities and Water Quality at Buffered and Non-Buffered Wetland Sites on Federal Waterfowl Production Areas in the Rainwater Basin, Nebraska. Wetlands 2013, 33, 1025–1036. [Google Scholar] [CrossRef]
  14. Dunson, W.A.; Travis, J. The Role of Abiotic Factors in Community Organization. Am. Nat. 1991, 138, 1067–1091. [Google Scholar] [CrossRef]
  15. Kingsford, R.T.; Biggs, H.C.; Pollard, S.R. Strategic Adaptive Management in Freshwater Protected Areas and Their Rivers. Biol. Conserv. 2011, 144, 1194–1203. [Google Scholar] [CrossRef]
  16. Tahraoui, H.; Belhadj, A.E.; Moula, N.; Bouranene, S.; Amrane, A. Optimisation and Prediction of the Coagulant Dose for the Elimination of Organic Micropollutants Based on Turbidity. Kem. Ind. 2021, 70, 675–691. [Google Scholar] [CrossRef]
  17. Tahraoui, H.; Belhadj, A.-E.; Triki, Z.; Boudellal, N.R.; Seder, S.; Amrane, A.; Zhang, J.; Moula, N.; Tifoura, A.; Ferhat, R.; et al. Mixed Coagulant-Flocculant Optimization for Pharmaceutical Effluent Pretreatment Using Response Surface Methodology and Gaussian Process Regression. Process Saf. Environ. Prot. 2023, 169, 909–927. [Google Scholar] [CrossRef]
  18. Smith, V.H. Effects of Eutrophication on Maximum Algal Biomass in Lake and River Ecosystems. Inland. Waters 2016, 6, 147–154. [Google Scholar] [CrossRef]
  19. Adimalla, N.; Li, P.; Venkatayogi, S. Hydrogeochemical Evaluation of Groundwater Quality for Drinking and Irrigation Purposes and Integrated Interpretation with Water Quality Index Studies. Environ. Process. 2018, 5, 363–383. [Google Scholar] [CrossRef]
  20. Maghrebi, M.; Noori, R.; Bhattarai, R.; Mundher Yaseen, Z.; Tang, Q.; Al-Ansari, N.; Danandeh Mehr, A.; Karbassi, A.; Omidvar, J.; Farnoush, H.; et al. Iran’s Agriculture in the Anthropocene. Earth’s Future 2020, 8, e2020EF001547. [Google Scholar] [CrossRef]
  21. Bouriqi, A.; Ouazzani, N.; Benaissa, H.; Benaddi, R.; Deliège, J.-F. Typology and Classification of Water Quality in an Intermittent River in a Semi-Arid Mediterranean Climate. Environ. Monit. Assess. 2024, 196, 381. [Google Scholar] [CrossRef]
  22. Ramírez Ulate, L.A. Evaluación de La Calidad Ecológica de Los Ríos En Puerto Rico: Principales Amenazas y Herramientas de Evaluación; Evaluación de La Calidad Ecológica de Los Ríos En Puerto Rico: Principales Amenazas y Herramientas de Evaluación; Ecological Evaluation of Streams in Puerto Rico: Major Threats and Evaluation Tools. Hidrobiologica 2016, 26, 433–441. [Google Scholar]
  23. Gutiérrez-Fonseca, P.E.; Lorion, C.M. Application of the BMWP-Costa Rica biotic index in aquatic biomonitoring: Sensitivity to collection method and sampling intensity. Rev. Biol. Trop. 2014, 62, 275–289. [Google Scholar] [CrossRef]
  24. Ruiz-Picos, R.A.; Sedeño-Díaz, J.E.; López-López, E.; Ruiz-Picos, R.A.; Sedeño-Díaz, J.E.; López-López, E. Calibrating and Validating the Biomonitoring Working Party (BMWP) Index for the Bioassessment of Water Quality in Neotropical Streams. In Water Quality; IntechOpen: London, UK, 2017; ISBN 978-953-51-2882-3. [Google Scholar]
  25. Amina, W.; Ensaf, E.-C.; Salhddine, D.; Zakaria, O. Hydrogeological and Hydrochemical Study of Mellaha Village, Oued Guir, Er-Rachidia, Morcco. J. Water Sci. Environ. Technol. 2019, 4, 411–427. [Google Scholar]
  26. Rachid, L. Evaluation of the groundwater quality in the Ghallil quaternary basin (Todgha downstream, South—Eastern Morocco). Environ. Water Sci. Public Health Territ. Intell. J. 2020, 4, 289–299. [Google Scholar] [CrossRef]
  27. El Hafyani, M.; Essahlaoui, A.; El Baghdadi, M.; Teodoro, A.C.; Mohajane, M.; El Hmaidi, A.; El Ouali, A. Modeling and Mapping of Soil Salinity in Tafilalet Plain (Morocco). Arab. J. Geosci. 2019, 12, 35. [Google Scholar] [CrossRef]
  28. Mariouh, A.; Bouaouinate, A. La conception d’une vision de développement territorial pour le Tafilalet: L’apport de la réflexion prospective. Espace Géographique Société Marocaine 2022, 1, 169–189. [Google Scholar] [CrossRef]
  29. Mainguet, M.; Dumay, F.; Kabiri, L.; Rémini, B. Prodromes of Desertification in the Oasis of Tafilalet (Morocco) and Specific Local Solutions. In Coping with Global Environmental Change, Disasters and Security: Threats, Challenges, Vulnerabilities and Risks; Brauch, H.G., Oswald Spring, Ú., Mesjasz, C., Grin, J., Kameri-Mbote, P., Chourou, B., Dunay, P., Birkmann, J., Eds.; Springer: Berlin/Heidelberg, Germany, 2011; pp. 901–919. ISBN 978-3-642-17776-7. [Google Scholar]
  30. Baki, S.; Hilali, M.; Kacimi, I.; Mahboub, A. Caractérisation Hydrogéologique et Cartographie Des Ressources En Eau Dans Le Bassin Versant de l’oued Rhéris (Sud-Est Du Maroc). Bull. l’Institut Sci. Rabat 2016, 38, 29–43. [Google Scholar]
  31. Ait Lahssaine, I.; Kabiri, L.; Messaoudi, B.; Saadi, Y.; Essahlaoui, A.; Essafraoui, B.; Ouali, L.; Kadiri, A. Integrated Assessment of Groundwater Pollution Vulnerability in Goulmima: A Comparative Analysis of DRASTIC and GOD Methods. Euro-Mediterr. J. Environ. Integr. 2024, 9, 2109–2122. [Google Scholar] [CrossRef]
  32. Alaoui, K.S.; Daoud, M.; Bouaouinate, A. Les Ksour Du Tafilalet Au Cøeur Du Développement Du Pays Présaharien. Espace Géographique Société Marocaine 2022, 1, 151–164. [Google Scholar]
  33. APHA; AWWA; WEF. Standard Methods for Examination of Water and Wastewater, 22nd ed.; American Public Health Association: Washington, DC, USA, 2012; ISBN 978-0-87553-013-0. [Google Scholar]
  34. Jehan, S.; Ullah, I.; Khan, S.; Muhammad, S.; Khattak, S.A.; Khan, T. Evaluation of the Swat River, Northern Pakistan, Water Quality Using Multivariate Statistical Techniques and Water Quality Index (WQI) Model. Environ. Sci. Pollut. Res. 2020, 27, 38545–38558. [Google Scholar] [CrossRef]
  35. WHO—World Health Organization. Fact Sheet. 15 November 2017. Available online: https://www.who.int/news-room/fact-sheets/detail/diabetes (accessed on 22 December 2024).
  36. Horton, R.K. An Index Number System for Rating Water Quality. J. Water Pollut. Control Fed. 1965, 37, 300–306. [Google Scholar]
  37. Azzirgue, E.M.; Cherif, E.K.; Tchakoucht, T.A.; Azhari, H.E.; Salmoun, F. Testing Groundwater Quality in Jouamaa Hakama Region (North of Morocco) Using Water Quality Indices (WQIs) and Fuzzy Logic Method: An Exploratory Study. Water 2022, 14, 3028. [Google Scholar] [CrossRef]
  38. Rupias, O.J.B.; Pereira, S.Y.; de Abreu, A.E.S. Hydrogeochemistry and Groundwater Quality Assessment Using the Water Quality Index and Heavy-Metal Pollution Index in the Alluvial Plain of Atibaia River- Campinas/SP, Brazil. Groundw. Sustain. Dev. 2021, 15, 100661. [Google Scholar] [CrossRef]
  39. Masoud, M.; El Osta, M.; Alqarawy, A.; Elsayed, S.; Gad, M. Evaluation of Groundwater Quality for Agricultural under Different Conditions Using Water Quality Indices, Partial Least Squares Regression Models, and GIS Approaches. Appl. Water Sci. 2022, 12, 244. [Google Scholar] [CrossRef]
  40. Kulisz, M.; Kujawska, J.; Przysucha, B.; Cel, W. Forecasting Water Quality Index in Groundwater Using Artificial Neural Network. Energies 2021, 14, 5875. [Google Scholar] [CrossRef]
  41. Kachroud, M.; Trolard, F.; Kefi, M.; Jebari, S.; Bourrié, G. Water Quality Indices: Challenges and Application Limits in the Literature. Water 2019, 11, 361. [Google Scholar] [CrossRef]
  42. Hecq, J.H. Cycle Annuel Du Zooplancton A Boulogne-Sur-Mer (Pas-de-Calais) 1970-1971. II. L’holoplancton. Bull. Société R. Sci. Liège 1976, 9, 443–457. [Google Scholar]
  43. Marghade, D.; Malpe, D.B.; Subba Rao, N. Applications of Geochemical and Multivariate Statistical Approaches for the Evaluation of Groundwater Quality and Human Health Risks in a Semi-Arid Region of Eastern Maharashtra, India. Environ. Geochem. Health 2021, 43, 683–703. [Google Scholar] [CrossRef]
  44. Sengupta, P. Potential Health Impacts of Hard Water. Int. J. Prev. Med. 2013, 4, 866–875. [Google Scholar] [PubMed]
  45. Listyani, T.; Prabowo, I.A. Groundwater in Bener Area, Its Quality and Contribution for Agriculture. IOP Conf. Ser. Earth Environ. Sci. 2022, 985, 012028. [Google Scholar]
  46. Dimri, D.; Daverey, A.; Kumar, A.; Sharma, A. Monitoring Water Quality of River Ganga Using Multivariate Techniques and WQI (Water Quality Index) in Western Himalayan Region of Uttarakhand, India. Environ. Nanotechnol. Monit. Manag. 2021, 15, 100375. [Google Scholar] [CrossRef]
  47. Abessolo, J.-R.Z.; Khebiza, M.Y.; Messouli, M. Réponse des macroinvertébrés benthiques (éphéméroptères, plécoptères, trichoptères) aux pressions anthropiques dans un contexte de changement climatique sur le bassin versant de l’Ourika (Haut-Atlas du Maroc). Hydroécol. Appl. 2021, 21, 115–155. [Google Scholar] [CrossRef]
  48. Cid, N.; Bonada, N.; Carlson, S.M.; Grantham, T.E.; Gasith, A.; Resh, V.H. High Variability Is a Defining Component of Mediterranean-Climate Rivers and Their Biota. Water 2017, 9, 52. [Google Scholar] [CrossRef]
  49. Guellaf, A.; Kettani, K. Assessing the Ecological Status Using Physico-Chemical, Bacteriological Parameters and Biotic Indices of the Oued Martil River Basin in Northwestern Morocco. Biologia 2021, 76, 585–598. [Google Scholar] [CrossRef]
  50. Saal, I.; Bouchelouche, D.; Hamache, C.; Arab, A. Evaluation of the Surface Water Quality in the Kebir-Rhumel Catchment Area (Northeast Algeria) Using Biotic Indices and Physico-Chemical Analyses. Environ. Sci. Pollut. Res. 2021, 28, 46565–46579. [Google Scholar] [CrossRef]
  51. Sudhakaran, S.; Mahadevan, H.; Arun, V.; Krishnakumar, A.P.; Krishnan, K.A. A Multivariate Statistical Approach in Assessing the Quality of Potable and Irrigation Water Environs of the Netravati River Basin (India). Groundw. Sustain. Dev. 2020, 11, 100462. [Google Scholar] [CrossRef]
  52. Hou, W.; Sun, S.; Wang, M.; Li, X.; Zhang, N.; Xin, X.; Sun, L.; Li, W.; Jia, R. Assessing Water Quality of Five Typical Reservoirs in Lower Reaches of Yellow River, China: Using a Water Quality Index Method. Ecol. Indic. 2016, 61, 309–316. [Google Scholar] [CrossRef]
  53. Young, R.G.; Quarterman, A.J.; Eyles, R.F.; Smith, R.A.; Bowden, W.B. Water Quality and Thermal Regime of the Motueka River: Influences of Land Cover, Geology and Position in the Catchment. N. Z. J. Mar. Freshw. Res. 2005, 39, 803–825. [Google Scholar] [CrossRef]
  54. Prathumratana, L.; Sthiannopkao, S.; Kim, K.W. The Relationship of Climatic and Hydrological Parameters to Surface Water Quality in the Lower Mekong River. Environ. Int. 2008, 34, 860–866. [Google Scholar] [CrossRef]
  55. Bellos, D.; Sawidis, T. Chemical Pollution Monitoring of the River Pinios (Thessalia—Greece). J. Environ. Manag. 2005, 76, 282–292. [Google Scholar] [CrossRef]
  56. Rajwa-Kuligiewicz, A.; Bialik, R.J.; Rowiński, P.M. Dissolved Oxygen and Water Temperature Dynamics in Lowland Rivers over Various Timescales. J. Hydrol. Hydromech. 2015, 63, 353–363. [Google Scholar] [CrossRef]
  57. Sidabutar, N.V.; Namara, I.; Hartono, D.M.; Soesilo, T.E.B. The Effect of Anthropogenic Activities to the Decrease of Water Quality. IOP Conf. Ser. Earth Environ. Sci. 2017, 67, 012034. [Google Scholar] [CrossRef]
  58. Nieder, R.; Benbi, D.K.; Reichl, F.X. Reactive Water-Soluble Forms of Nitrogen and Phosphorus and Their Impacts on Environment and Human Health. In Soil Components and Human Health; Nieder, R., Benbi, D.K., Reichl, F.X., Eds.; Springe: Dordrecht, The Netherlands, 2018; pp. 223–255. ISBN 978-94-024-1222-2. [Google Scholar]
  59. Omar, A.A.-K.; Hani, M.A.; Ahmad, M.A.J.; Ala’a, H.A.-M. Monitoring and Assessing of Spring Water Quality in Southwestern Basin of Jordan. Open J. Mod. Hydrol. 2017, 7, 331–349. [Google Scholar]
Figure 1. Location of surface water sampling sites and LUCL (Land Use and Land Cover) types in the Ghris basin.
Water 17 02055 g001
Figure 2. Location of surface water sample sites, hydrological order, and elevation model in the Ghris basin using ArcGIS Version 10.8.
Water 17 02055 g002
Figure 3. Methodological framework used in the current study.
Water 17 02055 g003
Figure 4. Spatial variation in temperature, Temperature, pH, NO3, NO2, DBO5, and DCO in the study area.
Water 17 02055 g004
Figure 5. Spatial variations in SO42−, Ca2+, Mg2+, Na+, TAC, and Cl in the water of the study area.
Water 17 02055 g005
Figure 6. Shaded graphs of macroinvertebrate composition recorded at each sampling station. Colors indicate taxon abundance.
Water 17 02055 g006
Figure 7. Relative abundance of organisms collected: classes (a) and orders (b).
Water 17 02055 g007
Figure 8. Comparability and spatial variation in indices apply to the different stations (a), IQW values (b), and IBMWP values (c) in the study area.
Water 17 02055 g008
Figure 9. Principal component analysis (PCA) of 20 Water Quality Indices and IWQ in June 2024.
Water 17 02055 g009
Figure 10. Principal component analysis (PCA) of fauna-identifying water quality indicators and the IBMWP index in June 2024. (Formicid: Formicidae, Cyclopid: Cyclopidae, Planorb: Planorbidae, Hydrophilid: Hydrophilidae, Gerrid: Gerridae, Tabanid: Tabanidae, Chiron: Chironomidae, Caenid: Caenidae, Simuli: Simuliidae, Dystiscid: Dytiscidae, Baetid: Baetidae, Elmid: Elmidae, Hydrops: Hydropsychidae).
Water 17 02055 g010
Figure 11. Redundancy analysis (RDA) among invertebrates and environmental factors.
Water 17 02055 g011
Figure 12. Correlation analysis between hydrochemical and biological parameters, with IBMWP (a) and WQI (b) for each station (p-value < 0.01).
Water 17 02055 g012
Table 1. Sampling locations and station types.
Site CodeX (m)Y (m)Location and Type of StationMeasured Temperature (°C)Köppen Classification Altitude (m)
S131.543368−4.575596Tihereint Nigrane, Source30BWh 1140
S231.502852−4.575302Ogoug, Source25BWh988
S331.50452−4.584902Mouy, Source27BWh1422
S431.432090−4.585830Tifounasin, a stream26.7BWh1085
Note: BWh (B: Arid climate, W: Desert, h: Average annual temperature >18 °C).
Table 2. Relative weight attributed to physico-chemical characteristics.
Water Quality ParametersUnitWHO 2017Weight (Wi)Wr
ECµS/cm100040.072
pH-6.5–8.540.072
THmg/L50030.053
Clmg/L25030.043
PO4mg/L3–530.043
NO2mg/L330.053
NO3mg/L5050.089
NH4+mg/L3530.053
Ca2+mg/L7520.035
Mg2+mg/L5020.035
DOmg/L550.089
SO42−mg/L25040.072
TDSmg/L100050.089
Fe2+mg/L0.330.100
Na+mg/L20020.067
Total 511
Note: All concentrations are in mg/L except pH.
Table 3. Classification of water quality.
RankingWQI ValueExplanation
<50Excellent waterGood for human health
50–100Good waterSuitable for human consumption
100–200Poor waterWater in poor condition
200–300Very poor waterNeeds special attention before use
>300Unsuitable for drinkingRequires too much attention
Table 4. The surface water physico-chemical values.
VariableUnitMinimumMaximumMeanStandard DeviationWHO 2017
T°C253027.171.0225–35
pH-6.87.086.860.116.5–8.5
ECµS/cm228837212677.7628.451000
DOmg/L7.077.297.190.122
TDSppm42.11030618.75121.951000
SO42−mg/L162.5385.2295.8057.66250
DBO5mg/L34.293.460.593
CODmg/L1014.311.832.24-
NO2mg/L0.020.130.080.063
NO3mg/L10.7662.6927.7526.1650
NH4+mg/L0.020.190.090.0835
Clmg/L412.4728.3645.85102.9450
TACmg/L28.5347.2838.417.60200
PO42−mg/L0.020.090.050.023–5
Ca2+mg/L17.08252.81171.64106.7775
K+mg/L0.5442.5415.3216.3812
Mg2+mg/L8.7186.3380.3042.5350
Na+mg/L28209.46166.75100.32200
Femg/L0.010.020.010.010.3
Znmg/L0.050.070.060.013
Table 5. List of abundance of macroinvertebrate families sampled.
FamilyS1S2S3S4
Simuliidae 624
Chironomidae 1210
Tabanidae 2
Caenidae 224
Baetidae2151790
Hydropsychidae3 129
Gerridae 662
Elmidae 1
Dytiscidae 10 6
Planorbidae 42
Cyclopidae 2
Note: Abundances are expressed as individuals per square meter (ind./m2).
Table 6. Calibrated bioindication values for aquatic invertebrates in the Ghris watershed area.
Class Order Family Tolerance Value IBMWP
Insecta DiptèresSimuliidae6
Chironomidae4
Tabanidae5
EphemeropteraCaenidae4
Baetidae3
TrichopteraHydropsychidae6
HeteropteraGerridae5
ColeopteraElmidae5
Dytiscidae5
HymenopteraFormicidae3
GastropodaPulmonataPlanorbidae4
CrustaceansIsopodeCyclopidae5
Disclaimer/Publisher’s Note: The statements, opinions and data contained in all publications are solely those of the individual author(s) and contributor(s) and not of MDPI and/or the editor(s). MDPI and/or the editor(s) disclaim responsibility for any injury to people or property resulting from any ideas, methods, instructions or products referred to in the content.

