Article

GIS-Based Assessment of Stormwater Harvesting Potentials: A Sustainable Approach to Alleviate Water Scarcity in Rwanda’s Eastern Savanna Agroecological Zone

by
Herve Christian Tuyishime
1,2 and
Kyung Sook Choi
1,2,*
1
Department of Food Security and Agricultural Development, Kyungpook National University, Daegu 41566, Republic of Korea
2
Department of Agricultural Civil Engineering, Kyungpook National University, Daegu 41566, Republic of Korea
*
Author to whom correspondence should be addressed.
Water 2025, 17(14), 2045; https://doi.org/10.3390/w17142045
Submission received: 9 May 2025 / Revised: 29 June 2025 / Accepted: 1 July 2025 / Published: 8 July 2025

Abstract

Water scarcity remains critical in Rwanda’s Eastern Savanna Agroecological Zone due to erratic rainfall, prolonged dry seasons, and rising water demands. This challenge threatens agricultural productivity, food security, and livelihoods. Stormwater harvesting presents a sustainable solution that increases water availability and mitigates the impacts of climate variability. This study utilizes Geographic Information System (GIS) tools and SCS-CN to assess stormwater harvesting potential in the region. The methodology includes analyzing land use, soil type, rainfall data (30 years, from 1994 to 2023), and topography. Key research steps involve delineating catchment areas, estimating runoff volumes, and selecting optimal storage sites using multi-criteria decision analysis. Findings include eight main water reservoirs, each with a unique code (W_R1 to W_R8), geographic coordinates (X and Y), and 10 million cubic meters storage volumes. W_R1 has the smallest volume at 0.242 × 10⁶ m3, while W_R2 has the largest volume at 8.51 × 10⁶ m3. W_R3, W_R5, and W_R7 are additional noteworthy reservoirs with sizable capacities. The findings contribute to policy formulation and Sustainable Development Goals (SDGs) related to clean water, food security, and climate action. This research provides a replicable framework for addressing water scarcity and enhancing long-term resilience in water-stressed regions.

1. Introduction

Stormwater harvesting has emerged as a critical strategy for mitigating the hydrological impacts of urbanization, particularly in regions with extensive impervious surfaces. It addresses the rising demand for freshwater and the adverse effects of increased surface runoff, including flooding and water pollution. As noted by [1], Stormwater collection can be crucial in restoring pre-development flow regimes in urban catchments, stabilizing hydrological cycles and improving water availability [1]. In tandem, studies such as that of [2] emphasize the institutional and governance dimensions of sustainable urban water management, advocating for integrated approaches that include stormwater reuse [2].
GIS has increasingly been employed to optimize stormwater harvesting, with [3] offering a spatially explicit model for selecting optimal sites based on runoff availability and local water demand [3]. This is echoed by [4], who underscore the significance of integrating terrain, land use, and soil data to maximize harvesting potential and system performance [4].
The integration of Geographic Information Systems (GIS) with the Soil Conservation Service Curve Number (SCS-CN) method has become a widely accepted approach for estimating spatial runoff, particularly in data-scarce and hydrologically diverse regions [5,6]. The SCS-CN model estimates direct runoff from rainfall using a Curve Number (CN) derived from land use/land cover (LULC), hydrologic soil groups (HSGs), and antecedent moisture conditions [7,8]. GIS facilitates the integration of LULC and soil data to derive spatially distributed CN values used in hydrological modeling [9].
Digital Elevation Models (DEMs) support watershed delineation and stream network extraction [10,11], while classified satellite imagery provides LULC data [12,13]. Soil maps from sources like FAO and Soil Grids offer HSG classifications for CN estimation [14]. Numerous studies demonstrate the effectiveness of this method in diverse environments: ref. [15] in Palestine, in India, in Kenya, and ref. [16] in Rwanda. Its application supports land and water resource planning, stormwater harvesting, and climate adaptation strategies by evaluating how land use changes influence runoff generation [17,18].
Overall, the GIS–SCS-CN method provides a cost-effective and scalable tool for hydrological modeling in regions with limited hydrometric data, enhancing spatial decision-making in watershed and stormwater management [13,14].
In Rwanda, a country grappling with water scarcity and a reliance on rainfed agriculture, stormwater harvesting offers a transformative opportunity. According to the [19]. Decentralized water management is now a national priority, particularly in semi-arid and agriculturally productive zones such as the Eastern Savanna Agroecological Zone [9]. Here, the dominance of cropland necessitates a dual-focus approach that balances the enhancement of water availability with the preservation of agricultural productivity. Ref. [20] advocate for Low-Impact Development (LID) strategies to restore natural hydrologic balance, particularly in peri-urban agricultural zones [10].
Climate variability further complicates water security in this region. Ref. [21] argue that managing water in rainfed agriculture requires a paradigm shift toward integrated strategies that link soil–water conservation, green water use, and resilient cropping systems [11]. In this context, stormwater harvesting offers both immediate and long-term benefits by capturing episodic rainfall events and storing water for future use, thereby enhancing community resilience against erratic rainfall patterns and seasonal droughts [22].
The socioeconomic benefits of stormwater harvesting are particularly relevant in Rwanda, where agriculture is the cornerstone of rural livelihoods, as highlighted by [23]. Interventions that improve water access in agroecological zones enhance productivity, reduce vulnerability to climate shocks, and contribute to national food security [15]. Additionally, studies by [24,25] support the integration of stormwater management into broader water resource governance frameworks to ensure sustainable development outcomes [16,17].
The Eastern Savanna Agroecological Zone presents both challenges and opportunities. Urban expansion in this region is leading to increased impervious surfaces and higher runoff rates, which exacerbate flooding, soil erosion, and water contamination [18,19,26]. Implementing well-designed stormwater harvesting systems can help counter these negative impacts by diverting runoff into storage systems for later use in agriculture or domestic applications. Moreover, successful implementation depends on stakeholder engagement, capacity-building, and policy alignment, areas emphasized in the work of [20] on sustainable urban water governance [20].
This study significantly advances the field of hydrological modeling and sustainable water resource management by integrating GIS-based spatial analysis with the Soil Conservation Service Curve Number (SCS-CN) method and digital elevation model (DEM)-derived topographic indices to generate detailed runoff and stormwater harvesting potential maps tailored to semi-arid savanna agroecological zones. Such a comprehensive geospatial approach addresses critical data scarcity challenges commonly faced in developing regions [27].
By quantifying volumetric storage capacities of eight strategically selected retention zones, the research provides a robust, context-specific foundation for decentralized stormwater harvesting interventions—an approach increasingly recognized for enhancing water security, groundwater recharge, and flood mitigation in climate-vulnerable landscapes [27]. The study’s alignment with Integrated Water Resources Management (IWRM) frameworks and its emphasis on distributed water harvesting are consistent with global strategies promoting resilience under hydrological variability and land degradation neutrality [28].
Furthermore, this work contributes to the growing body of literature demonstrating the effectiveness of coupling hydrological modeling with GIS to inform sustainable watershed management, offering a replicable and scalable methodology for similar semi-arid regions confronting seasonal water scarcity and ecosystem degradation [29,30]. The insights generated thus support evidence-based policy and investment decisions aimed at meeting Sustainable Development Goals related to clean water access and climate action [31].
The study can help Rwanda in achieving some crucial SDGs: SDG 6, Clean Water and Sanitation, SDG 2, Zero Hunger, and SDG 13, Climate Action. Looking at all the smaller sub-watersheds in future research could give an even clearer picture of how water moves through the landscape, which would be a big help for local communities managing their water more effectively [32,33].

2. Materials and Methods

2.1. Study Area Description

Located in the eastern part of Rwanda, the Eastern Savanna Agroecological Zone of Rwanda (Figure 1) borders Tanzania and Uganda. It includes regions such as the Nyagatare, Gatsibo, Kayonza, and Kirehe Districts. The zone is characterized by distinct climatic, soil, and vegetation conditions that significantly influence agricultural practices and productivity. This zone experiences a relatively dry climate compared to other regions in Rwanda, with marked wet and dry seasons, which are crucial for determining the types of crops that can be cultivated effectively [34]. The average rainfall in this area is lower than in the volcanic highlands, leading to unique challenges for farmers, particularly concerning soil moisture retention and fertility [34,35]. Soil characteristics in Eastern Savanna are generally less fertile, with deficiencies in essential nutrients such as nitrogen, phosphorus, and potassium [34]. This nutrient limitation poses a significant constraint on agricultural productivity, necessitating the adoption of sustainable farming practices to enhance soil health and crop yields. For instance, the introduction of crops like yam beans has been suggested as a potential strategy to improve soil fertility and overall agricultural sustainability in this zone [34].
Furthermore, the agroecological conditions, including soil type and topography, are relatively homogeneous, which allows for specific agricultural practices tailored to local conditions [34]. The vegetation in the Eastern Savanna is predominantly composed of grasslands interspersed with scattered trees, which can influence local microclimates and soil moisture levels [36]. Despite the lower tree adoption rates in this zone compared to others, there is a recognized potential for agroforestry practices that could enhance soil fertility and moisture retention, thereby supporting more sustainable agricultural systems [36]. The perception of trees’ benefits, such as improving soil moisture and fertility, is notably positive among local farmers, indicating a willingness to adopt tree-based ecosystem approaches [36].
Rwanda’s Eastern Savanna agroecological zone presents different chances and problems for agricultural development. Understanding how socioeconomic elements, soil quality, and climatic factors interact to create efficient agrarian methods that increase output while supporting sustainability is crucial. Adopting creative farming techniques and exploring agroforestry prospects could significantly help local farmers overcome their agricultural challenges.
This study focused on estimating harvestable water volumes in the main watersheds of the region to support sustainable water resource management. It prioritized identifying natural water sources that could be captured and used efficiently, emphasizing watershed-scale planning to generate practical, decision-supporting data [37]. Key factors in evaluating harvesting potential included topography, rainfall patterns, land use, and drainage characteristics [38]. Minor catchments and artificial reservoirs were deliberately excluded to maintain focus and ensure regional planning relevance [39]. Data collection relied on remote sensing and hydrological modeling, tools proven effective for watershed-scale assessments [40,41]. The study highlights the value of GIS-based, watershed-oriented approaches in addressing water scarcity and improving resilience, particularly for the agriculture and rural development sectors [21,42]. Although limited in scope, the findings offer a strong basis for broader studies and enhance the understanding of the spatial and seasonal dynamics of natural water availability [43].
Although the SCS-CN method provides a practical approach for estimating runoff in data-scarce regions, this study lacked ground-based validation due to limited gauging station data in the Eastern Savanna zone. This may affect the accuracy of runoff and storage estimates [7]. Additionally, the use of 90 m resolution datasets (e.g., DEM and LULC) introduces spatial uncertainty, particularly in heterogeneous landscapes [44]. The SCS-CN method also assumes uniform hydrologic conditions, which may oversimplify real-world variability [9]. Despite these limitations, the methodology remains robust for regional-scale assessment and can be refined with field data and higher-resolution inputs in future research.

2.2. Data Sources

The datasets used in this study vary in resolution and accuracy. The Digital Elevation Model (DEM) is a high-resolution 10 m product with a vertical Root Mean Square Error (RMSE) of approximately 5–10 m and horizontal accuracy within 10–15 m [45]. The land use/land cover (LULC) data at 90 m resolution typically shows an overall classification accuracy between 70% and 85% [46,47].

2.3. Methods

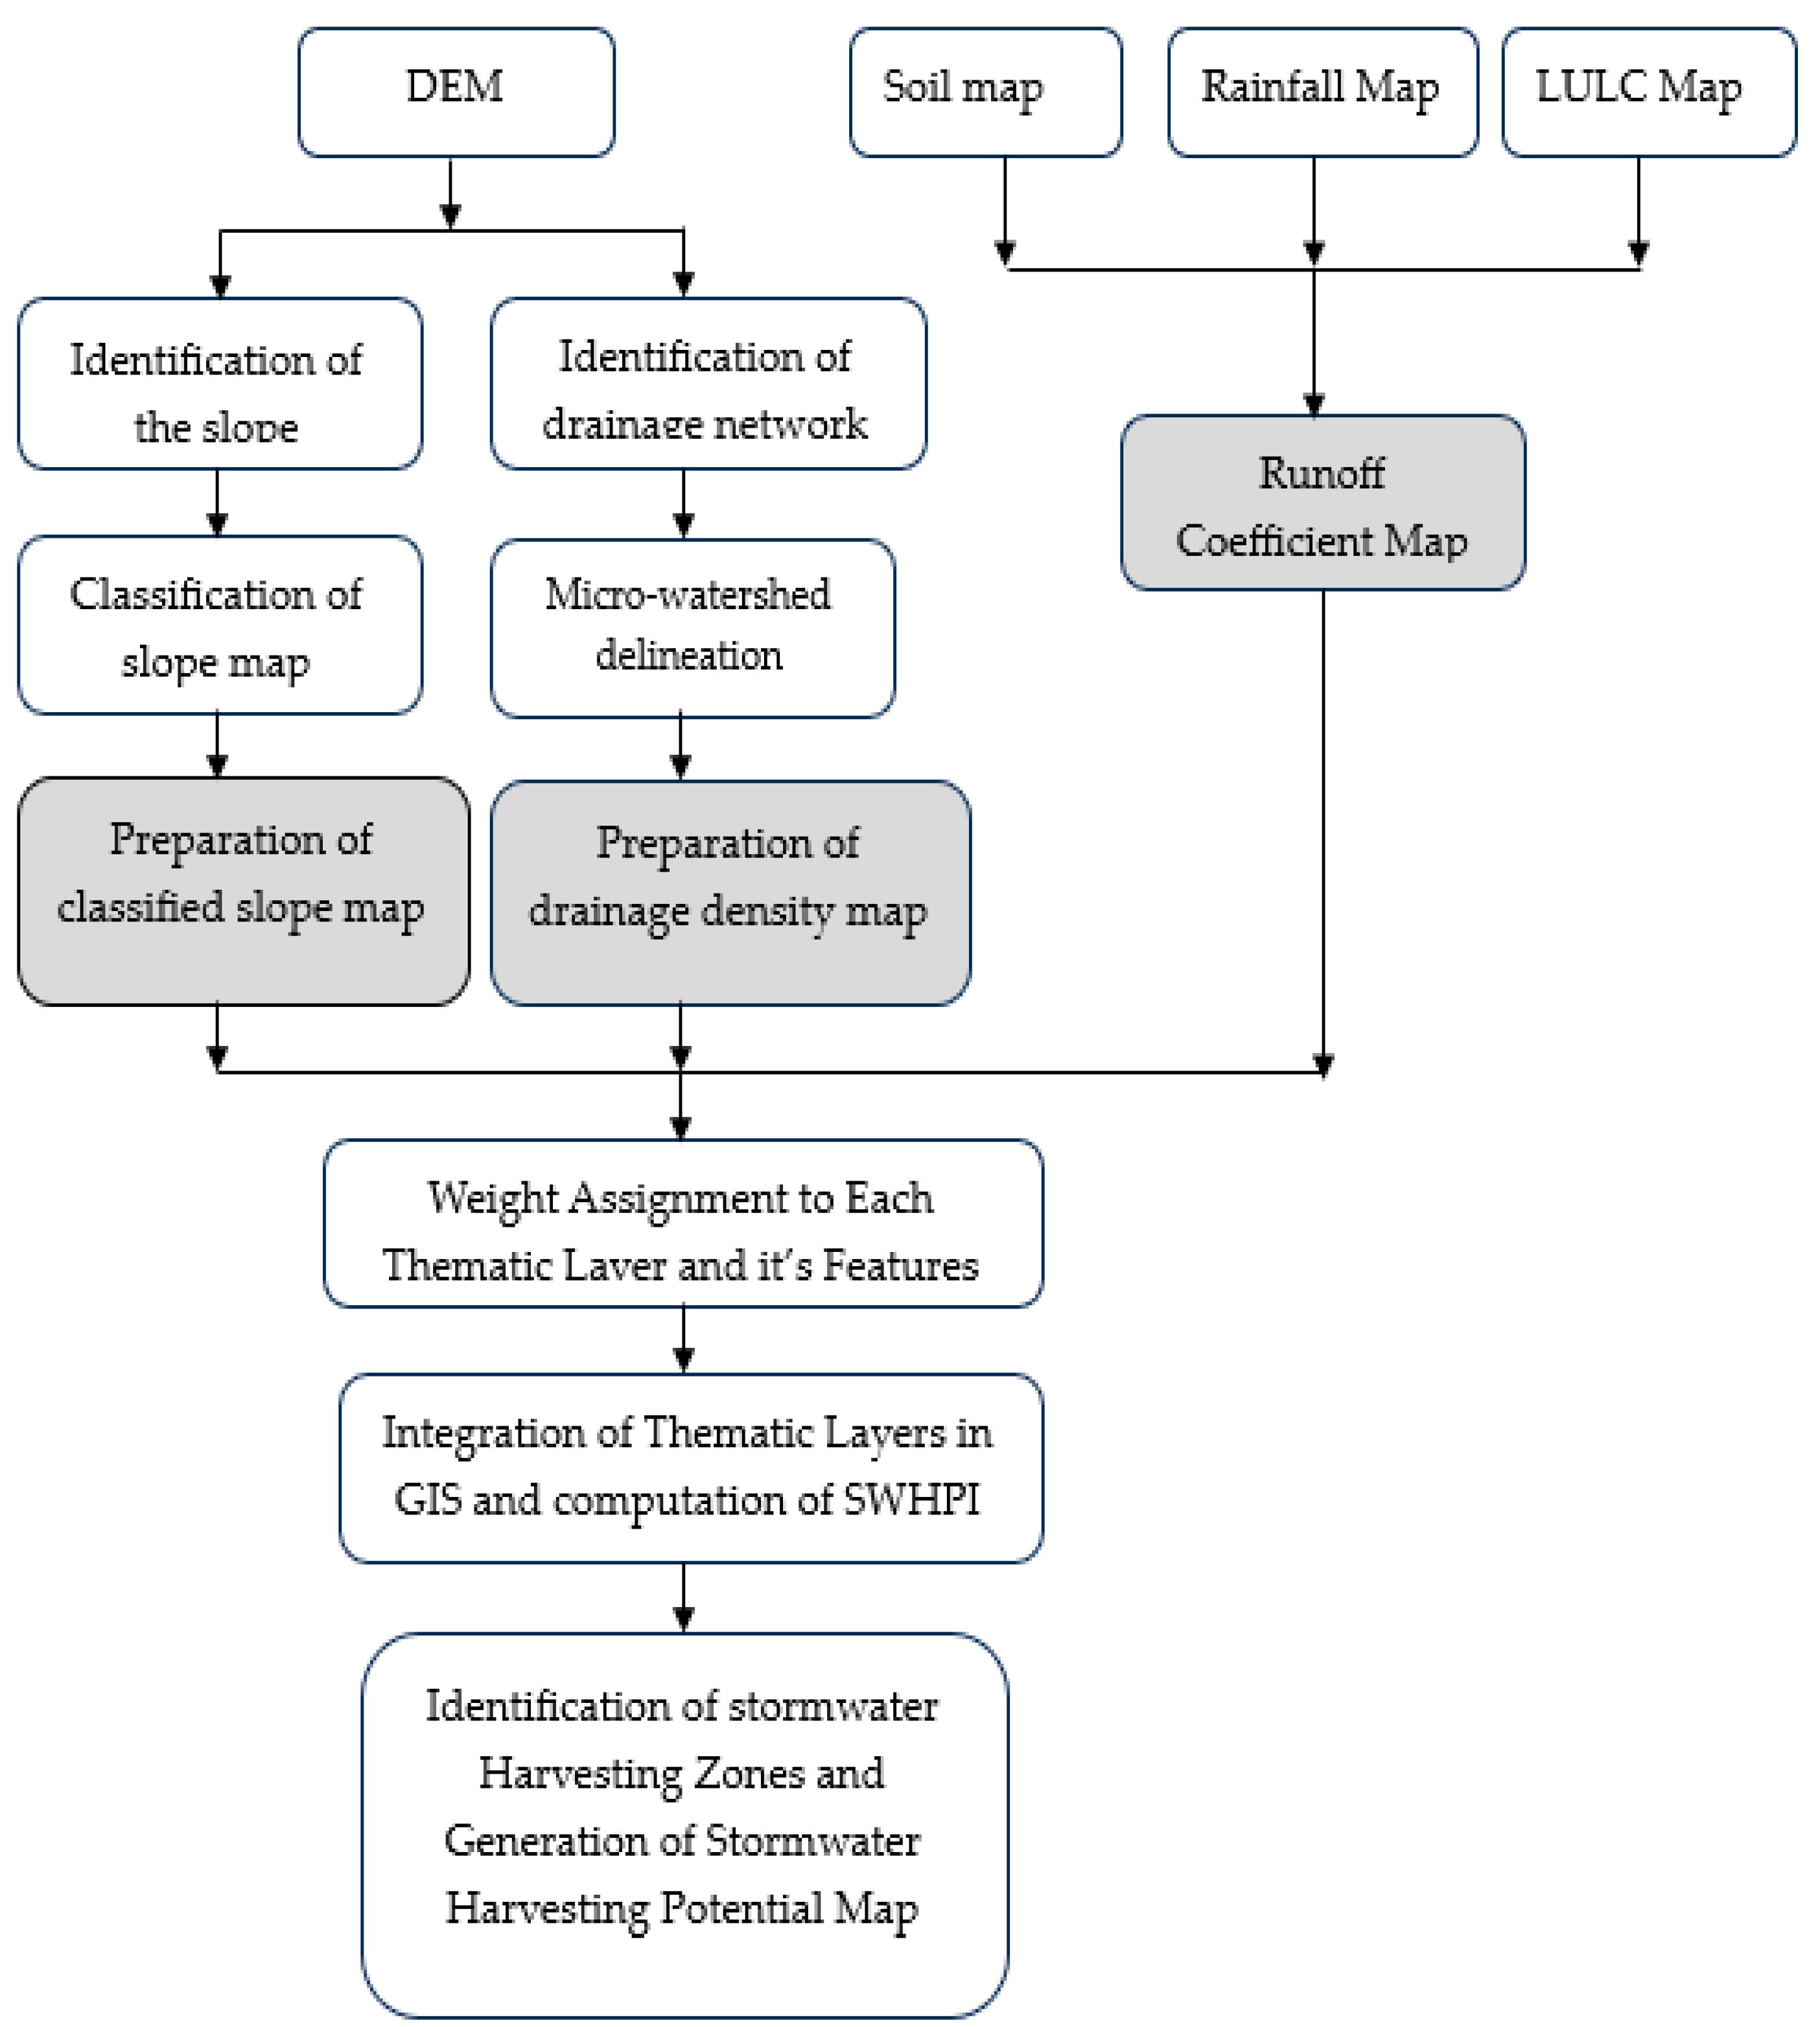
The Soil Conservation Service Curve Number (SCS-CN) method (Figure 2), when integrated with a Geographic Information System (GIS), typically consists of several key components that work cohesively to achieve accurate runoff predictions. This approach has gained recognition in hydrological studies due to its simplicity and applicability across diverse landscapes, as noted in various studies [48,49,50].

2.4. Data Collection and Preparation

The initial phase entails gathering necessary datasets, including rainfall (30 years from 1994 to 2023) (Figure 3), land use/land cover (LULC), soil characteristics, and antecedent moisture conditions (AMC). Rainfall data is typically procured from the Rwanda Meteorological Agency, LULC from the Rwanda Land Management Authority, and soil data can be extracted from DSRM (Table 1). The quality and resolution of these datasets significantly influence the runoff estimations.

2.5. GIS Mapping and Analysis

The watershed was delineated using GIS, and various thematic maps were created. This includes preparing maps that depict soil hydrological groups and land use classifications [51]. The GIS platform enables spatial analysis, allowing for a comprehensive understanding of how physical features interact with runoff generation processes [5]. The SCS-CN values, which vary depending on land use and soil type, are assigned based on these maps [8].

2.6. Calculation of Curve Numbers

The SCS-CN method necessitates calculating the Curve Number (CN) for each land use type within the watershed. The CN reflects the potential runoff from a given precipitation event and is influenced by soil type, land use, and moisture conditions before the rainfall [52]. Moreover, methodologies have evolved, integrating slope adjustments and spatial variability of curve numbers to enhance accuracy in estimating runoff [53,54].
The Curve Number (CN) method, developed by the USDA Soil Conservation Service (SCS) in the 1950s, is one of the most widely used hydrological models for estimating direct surface runoff from rainfall events, particularly in ungauged or data-scarce watersheds. It relies on an empirical relationship among rainfall, land use, soil type, and antecedent moisture conditions [55]. The method computes runoff using the equation Q = (P − Ia)2/(P − Ia + S), where Q is the direct runoff, P is the rainfall depth, Ia is the initial abstraction (typically set as 20% of S), and S is the potential maximum retention after runoff begins. The value of S is related to CN by S = 25400/CN − 254 (in mm), where CN is a dimensionless parameter ranging between 30 and 100. Curve Numbers are selected from standard tables based on land use/land cover, hydrologic soil group (HSG), and hydrologic condition, with adjustments for antecedent moisture condition (AMC I, II, or III) to account for varying soil wetness [5]. Though empirical, the method has been validated in diverse climatic and physiographic regions, and remains a cornerstone in hydrologic modeling, watershed management, and flood forecasting [7,49]. However, its limitations, such as sensitivity to CN values and assumptions regarding initial abstraction, have also led to ongoing research and modifications to improve accuracy [56].

2.7. Runoff Estimation

With the calculated CN values for different land use types and the known rainfall data, runoff can be estimated using the following SCS equation:
Q = ( P I a ) 2 P + 0.8 S
where (Q) is the runoff, (P) is the precipitation, and (S) is the potential maximum retention, which can also be derived from the CN value [48,49,57].
Ia = ƛ × S
The abstraction ratio (ƛ), typically 0.2, is central to the SCS-CN method.
Q = ( P 0.2 S ) 2 P + 0.8 S
Equations (1) and (2) establish the groundwork, with initial abstraction considering interception, surface runoff, and infiltration before the onset of runoff. The potential maximum retention (S), determined using Equation (3), considers CN values associated with LULC and HSG, which reflect the area’s runoff potential [58].
S = 25400 C N 254
Studies have highlighted that integrating remote sensing techniques with GIS helps dynamically capture these parameters, improving the robustness of runoff predictions [59].

2.8. Weighted Overlay Analysis and Stormwater Storage Classification

Surface water harvesting and groundwater recharge systems are both essential components of water conservation strategies. The Water Conservation Potential Index (WCPI) was created using a map that details slope and runoff coefficients. Various features were assigned different weights and ranks (as shown in Table 2), with a scale from 1 to 10, where 10 represents the highest influence and 1 the lowest. Similarly, the most critical feature received a rank of 10, while the least important was given a rank of 1 [60]. The identification of areas with potential for water conservation was achieved through the integration of numerous thematic layers along with their corresponding scores. The calculation of the overall score for different polygons was conducted using the weighted sum overlay technique.

2.9. Optimal Site Selection for Stormwater Harvesting Structures

Optimal locations for stormwater harvesting structures were identified by overlaying thematic layers like slope, land use/land cover (LULC), soil types, and stream networks, adhering to FAO soil and water conservation guidelines. This thorough process employs specific suitability criteria for each layer (see Table 3) to locate regions suited for structures such as check dams, farm ponds, and gully plugs. Through this analysis, we systematically assessed potential locations for structures within the study area. We assigned suitability classes from [62] by integrating maps of runoff depths, slopes, stream order, LULC, soil texture, and hydrologic soil groups (HSG). We applied weights and ranks to each criterion based on sites with similar traits. Structure codes were then assigned to polygons that fulfilled the requirements, ensuring that each identified site was optimized for the most effective stormwater harvesting structure to enhance efficiency and promote water conservation [62].

3. Results

3.1. DEM and Land Slope

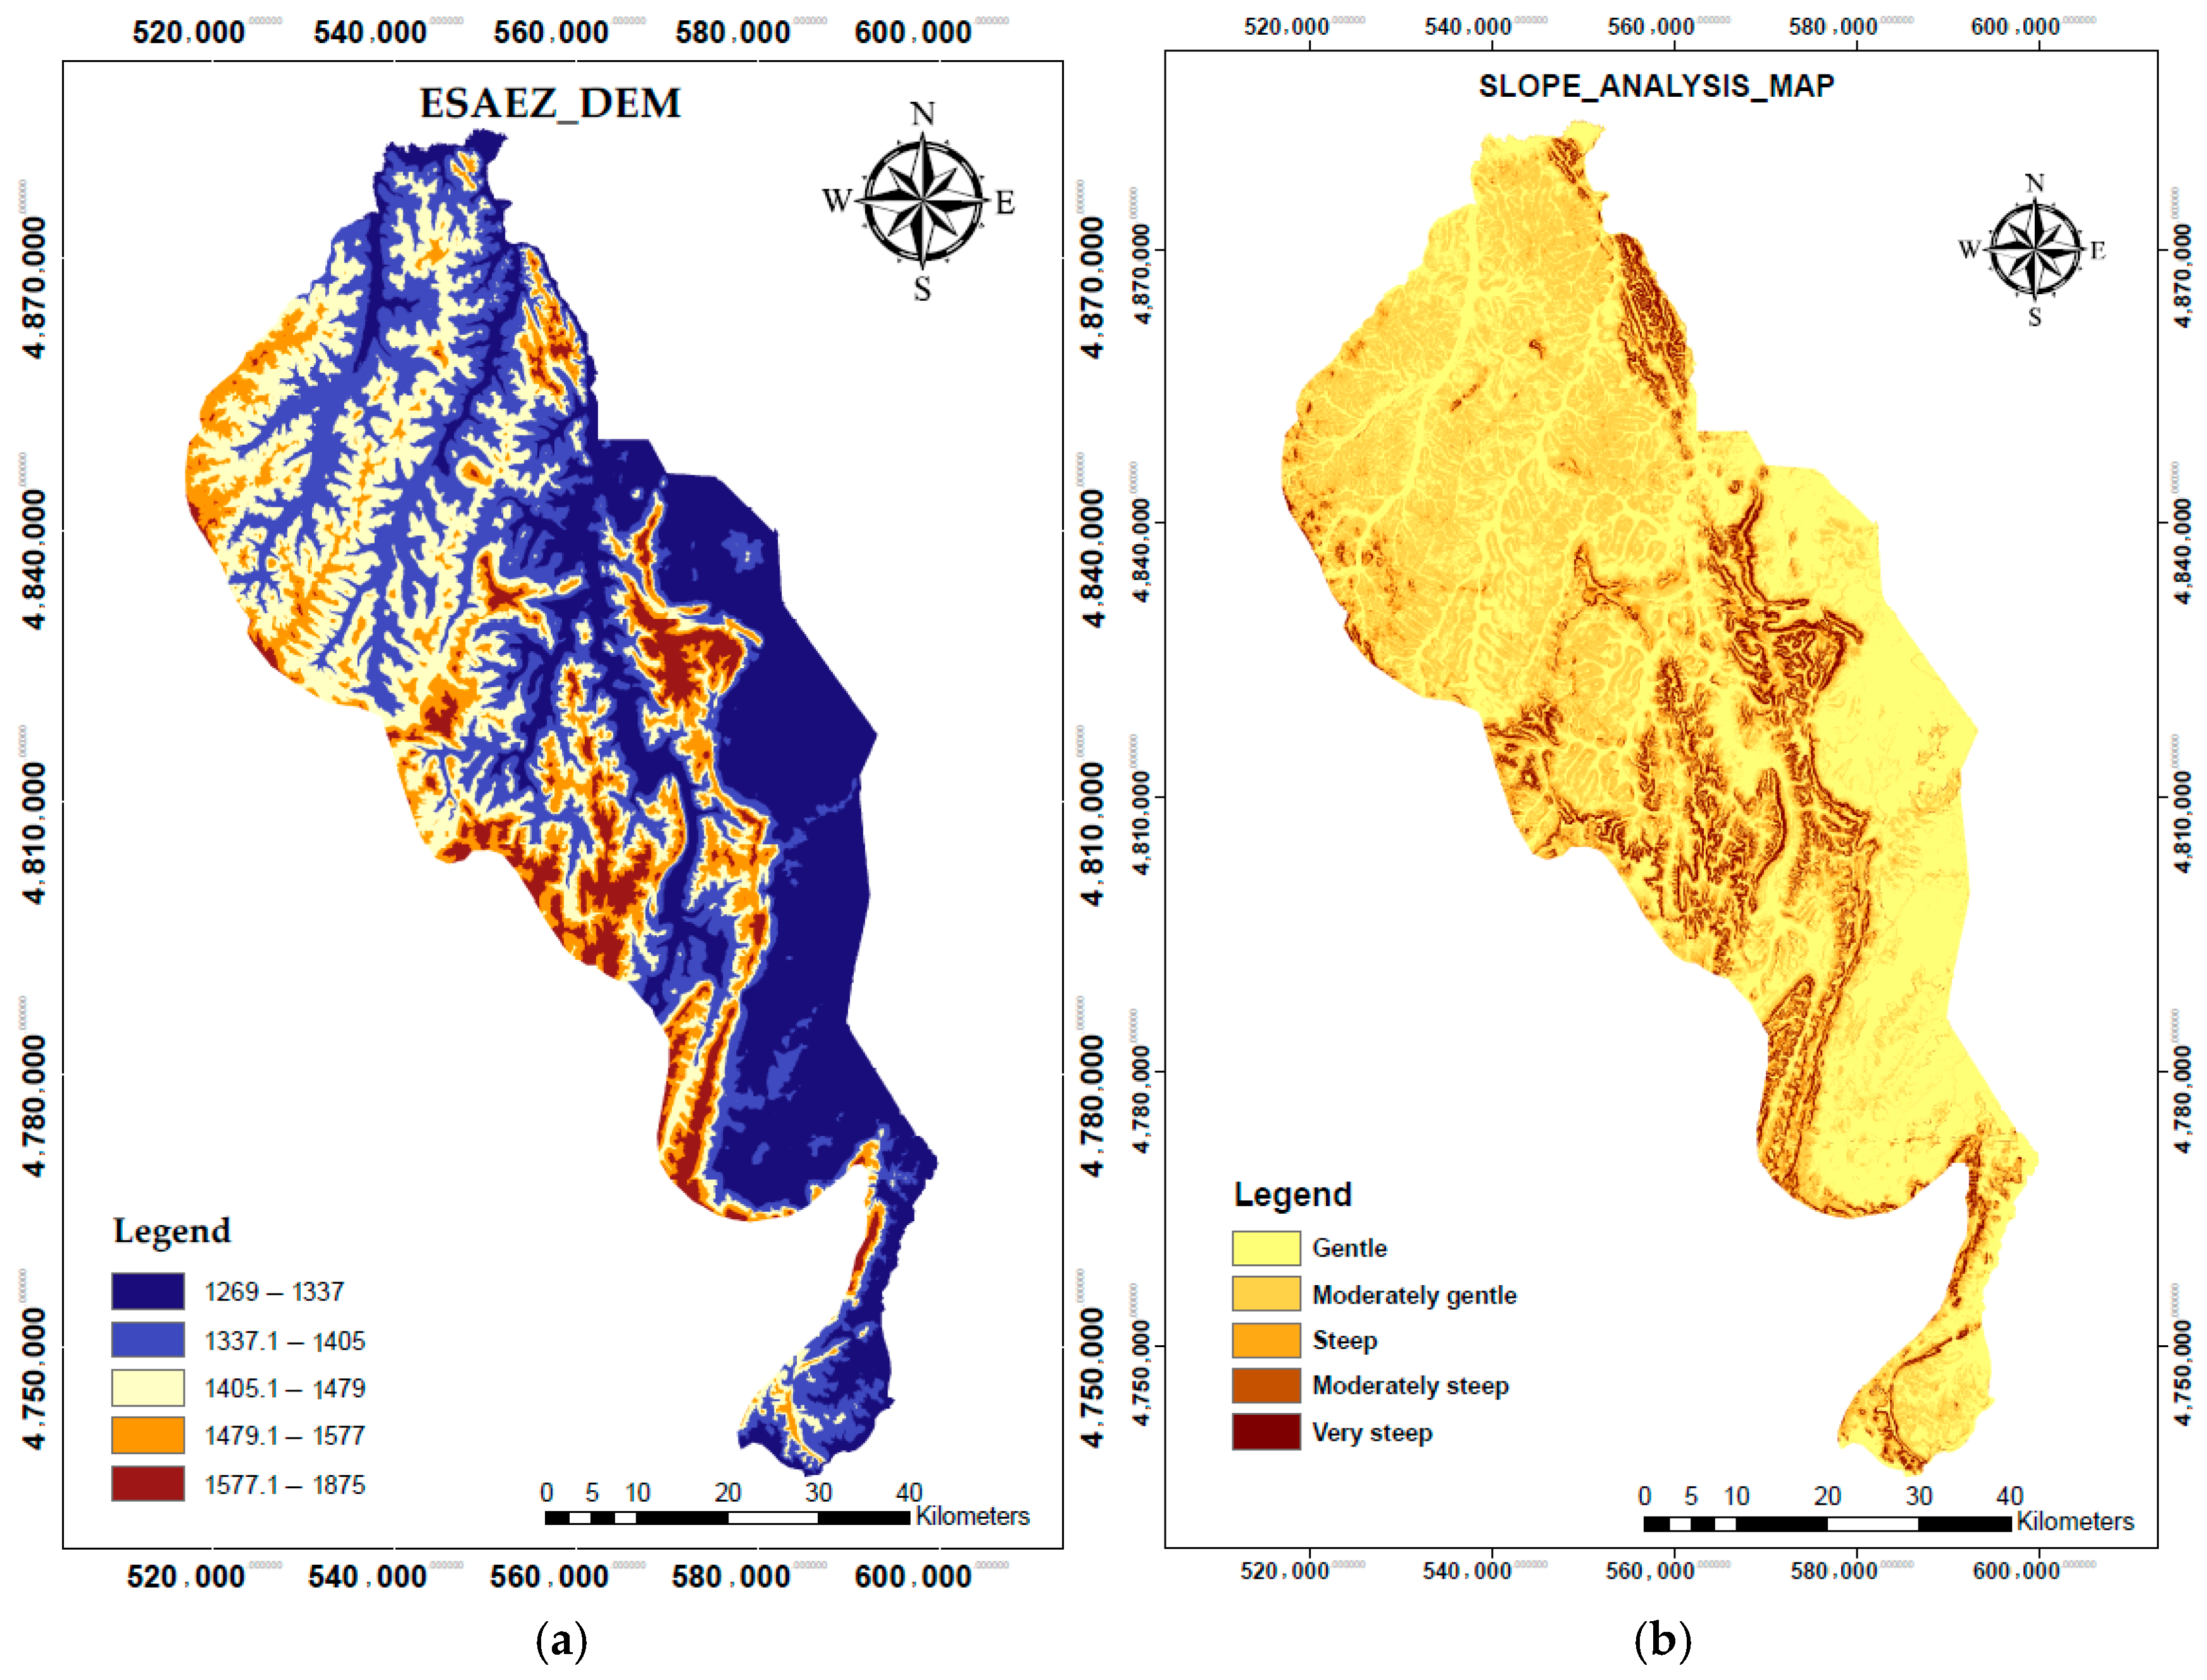
The terrain of the study area, Figure 4b, was classified into five slope categories based on hydrologically significant gradients, which are essential for understanding runoff generation, erosion risks, and land-use planning. Slope, derived from DEM in Figure 4a, is a major determinant of overland flow velocity and infiltration potential [63]. Areas with slopes of 0–5% are considered nearly flat and are generally suitable for agriculture, settlements, and infrastructure. However, such areas may experience poor drainage and are prone to waterlogging, especially in regions with heavy rainfall and clayey soils [64,65]. Slopes of 5.01–10% are categorized as gently sloping, supporting moderate surface drainage and remaining favorable for agriculture with minimal soil conservation needs. Nevertheless, rainfall events may trigger minor surface runoff if the land is not vegetatively covered [66]. Slopes of 10.01–15% represent moderately steep terrain where runoff intensity increases, making these areas more vulnerable to rill and inter-rill erosion; this necessitates interventions such as strip cropping, cover crops, or mulching [32]. In the 15.01–20% range, slopes are considered steep with high runoff coefficients and elevated risk of sheet and gully erosion; farming in such regions is often unsustainable without structural soil conservation measures like terracing [67]. Finally, areas with slopes exceeding 20% (up to 77.49%) are very steep and represent the highest risk for soil erosion and slope failure. These are typically unsuitable for agriculture or development and are best preserved under forest or grassland cover to maintain ecological stability [65]. This classification aids in identifying priority zones for soil and water conservation and sustainable land-use management.

3.2. Rainfall and Land Use/Land Cover

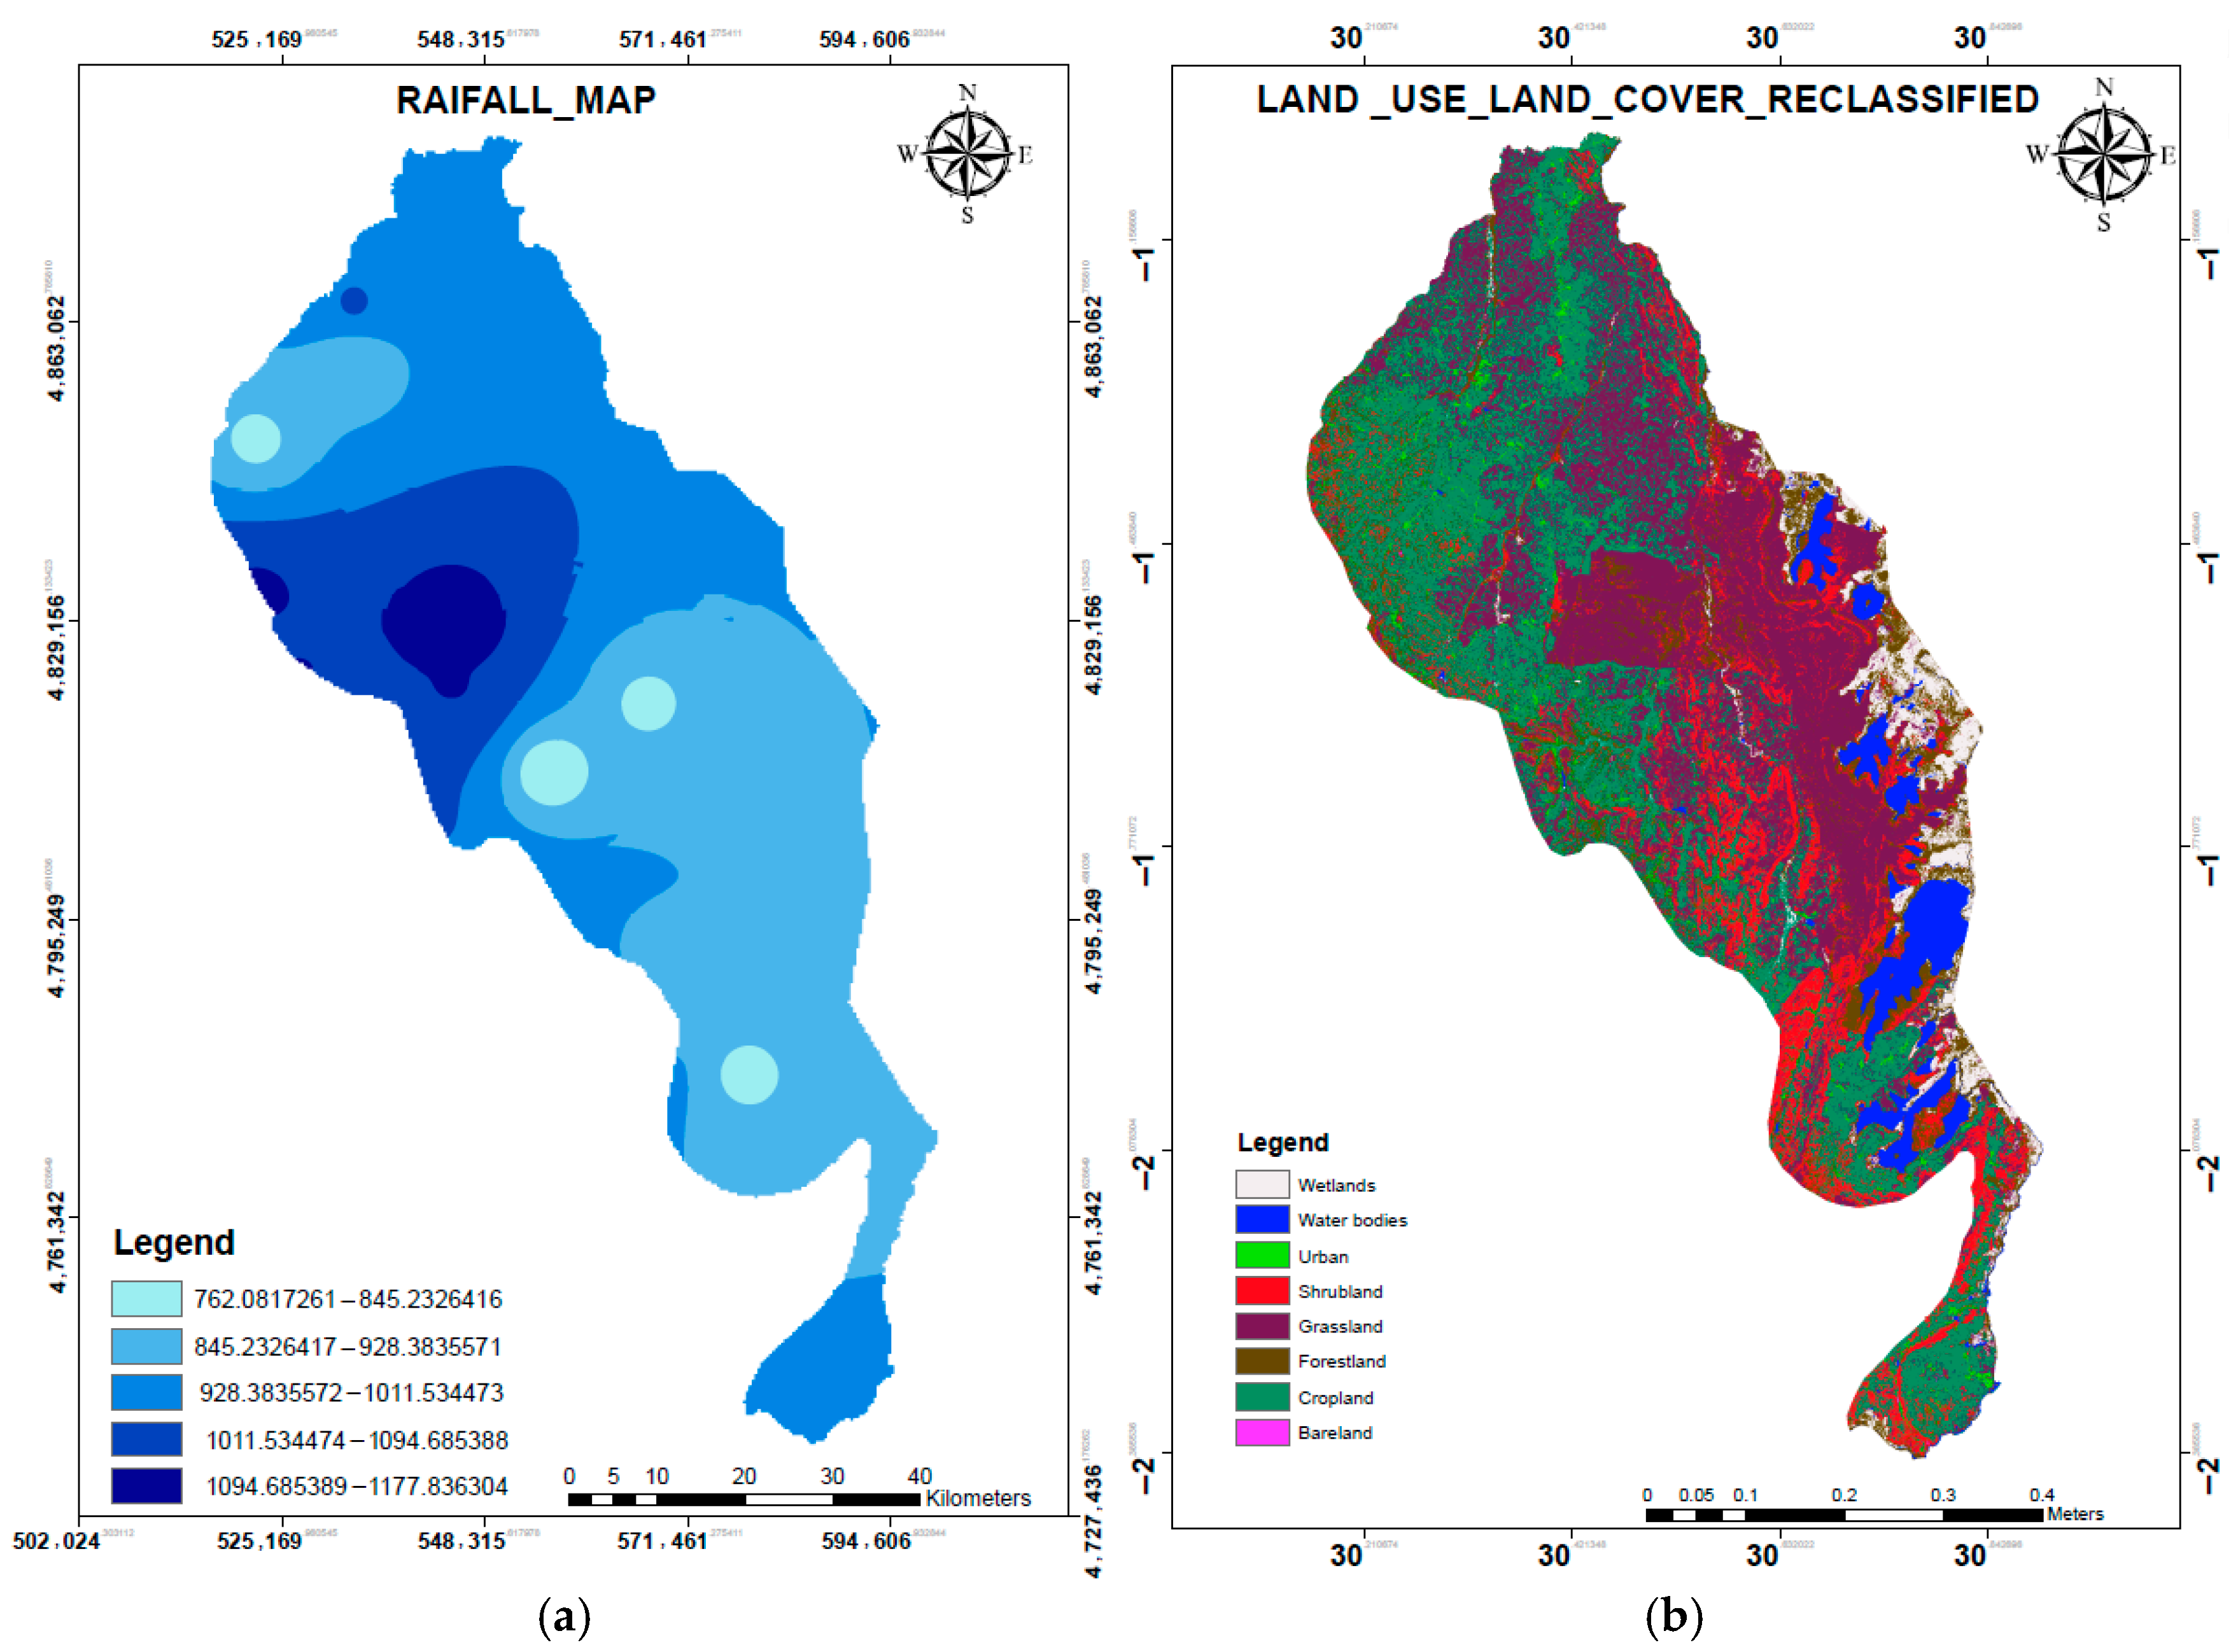
The average annual rainfall distribution across the region (Figure 5a) ranges from 762 mm to 1250 mm. Lighter shades indicate lower rainfall levels, while darker shades represent higher rainfall. Rainfall is unevenly distributed, with dark blue areas, particularly in the central-western part, receiving the highest rainfall (1150–1250 mm). In contrast, lighter blue regions, such as the northern and southeastern parts, receive lower rainfall (762–816 mm). Both spatial and temporal distribution of rainfall play a critical role in determining runoff generation and hydrological responses. Temporal distribution, especially rainfall intensity and duration, influences runoff characteristics. High-intensity, short-duration rainfall often leads to increased runoff, as soil infiltration capacity is quickly exceeded. Spatial variability in rainfall further affects runoff generation and hydrological modeling, introducing uncertainties in predictions. The location of storm cells and associated rainfall also impacts runoff mechanisms [68].
The land cover map (Figure 5b), derived from the Rwanda Land Management Authority Soil map, categorizes the area into nine classes, each represented by a specific color, as shown in the legend. Wetlands cover 194.76 km2, accounting for 4% of the total area, while water bodies span 240.96 km2 or 5%. Urban areas cover 93.80 km2, making up 2%, and shrubland extends over 529.88 sq. km, 11%. Grassland dominates the landscape, covering 1739.05 km2 or 36%, followed by cropland with 1557.16 km2 or 32%. Forestland occupies 488.74 km2, representing 10%, and bare land covers a minimal 1.74 km2, accounting for 0%. The total mapped area is 4846.09 km2.

3.3. Soil Type and Hydrological Soil Groups

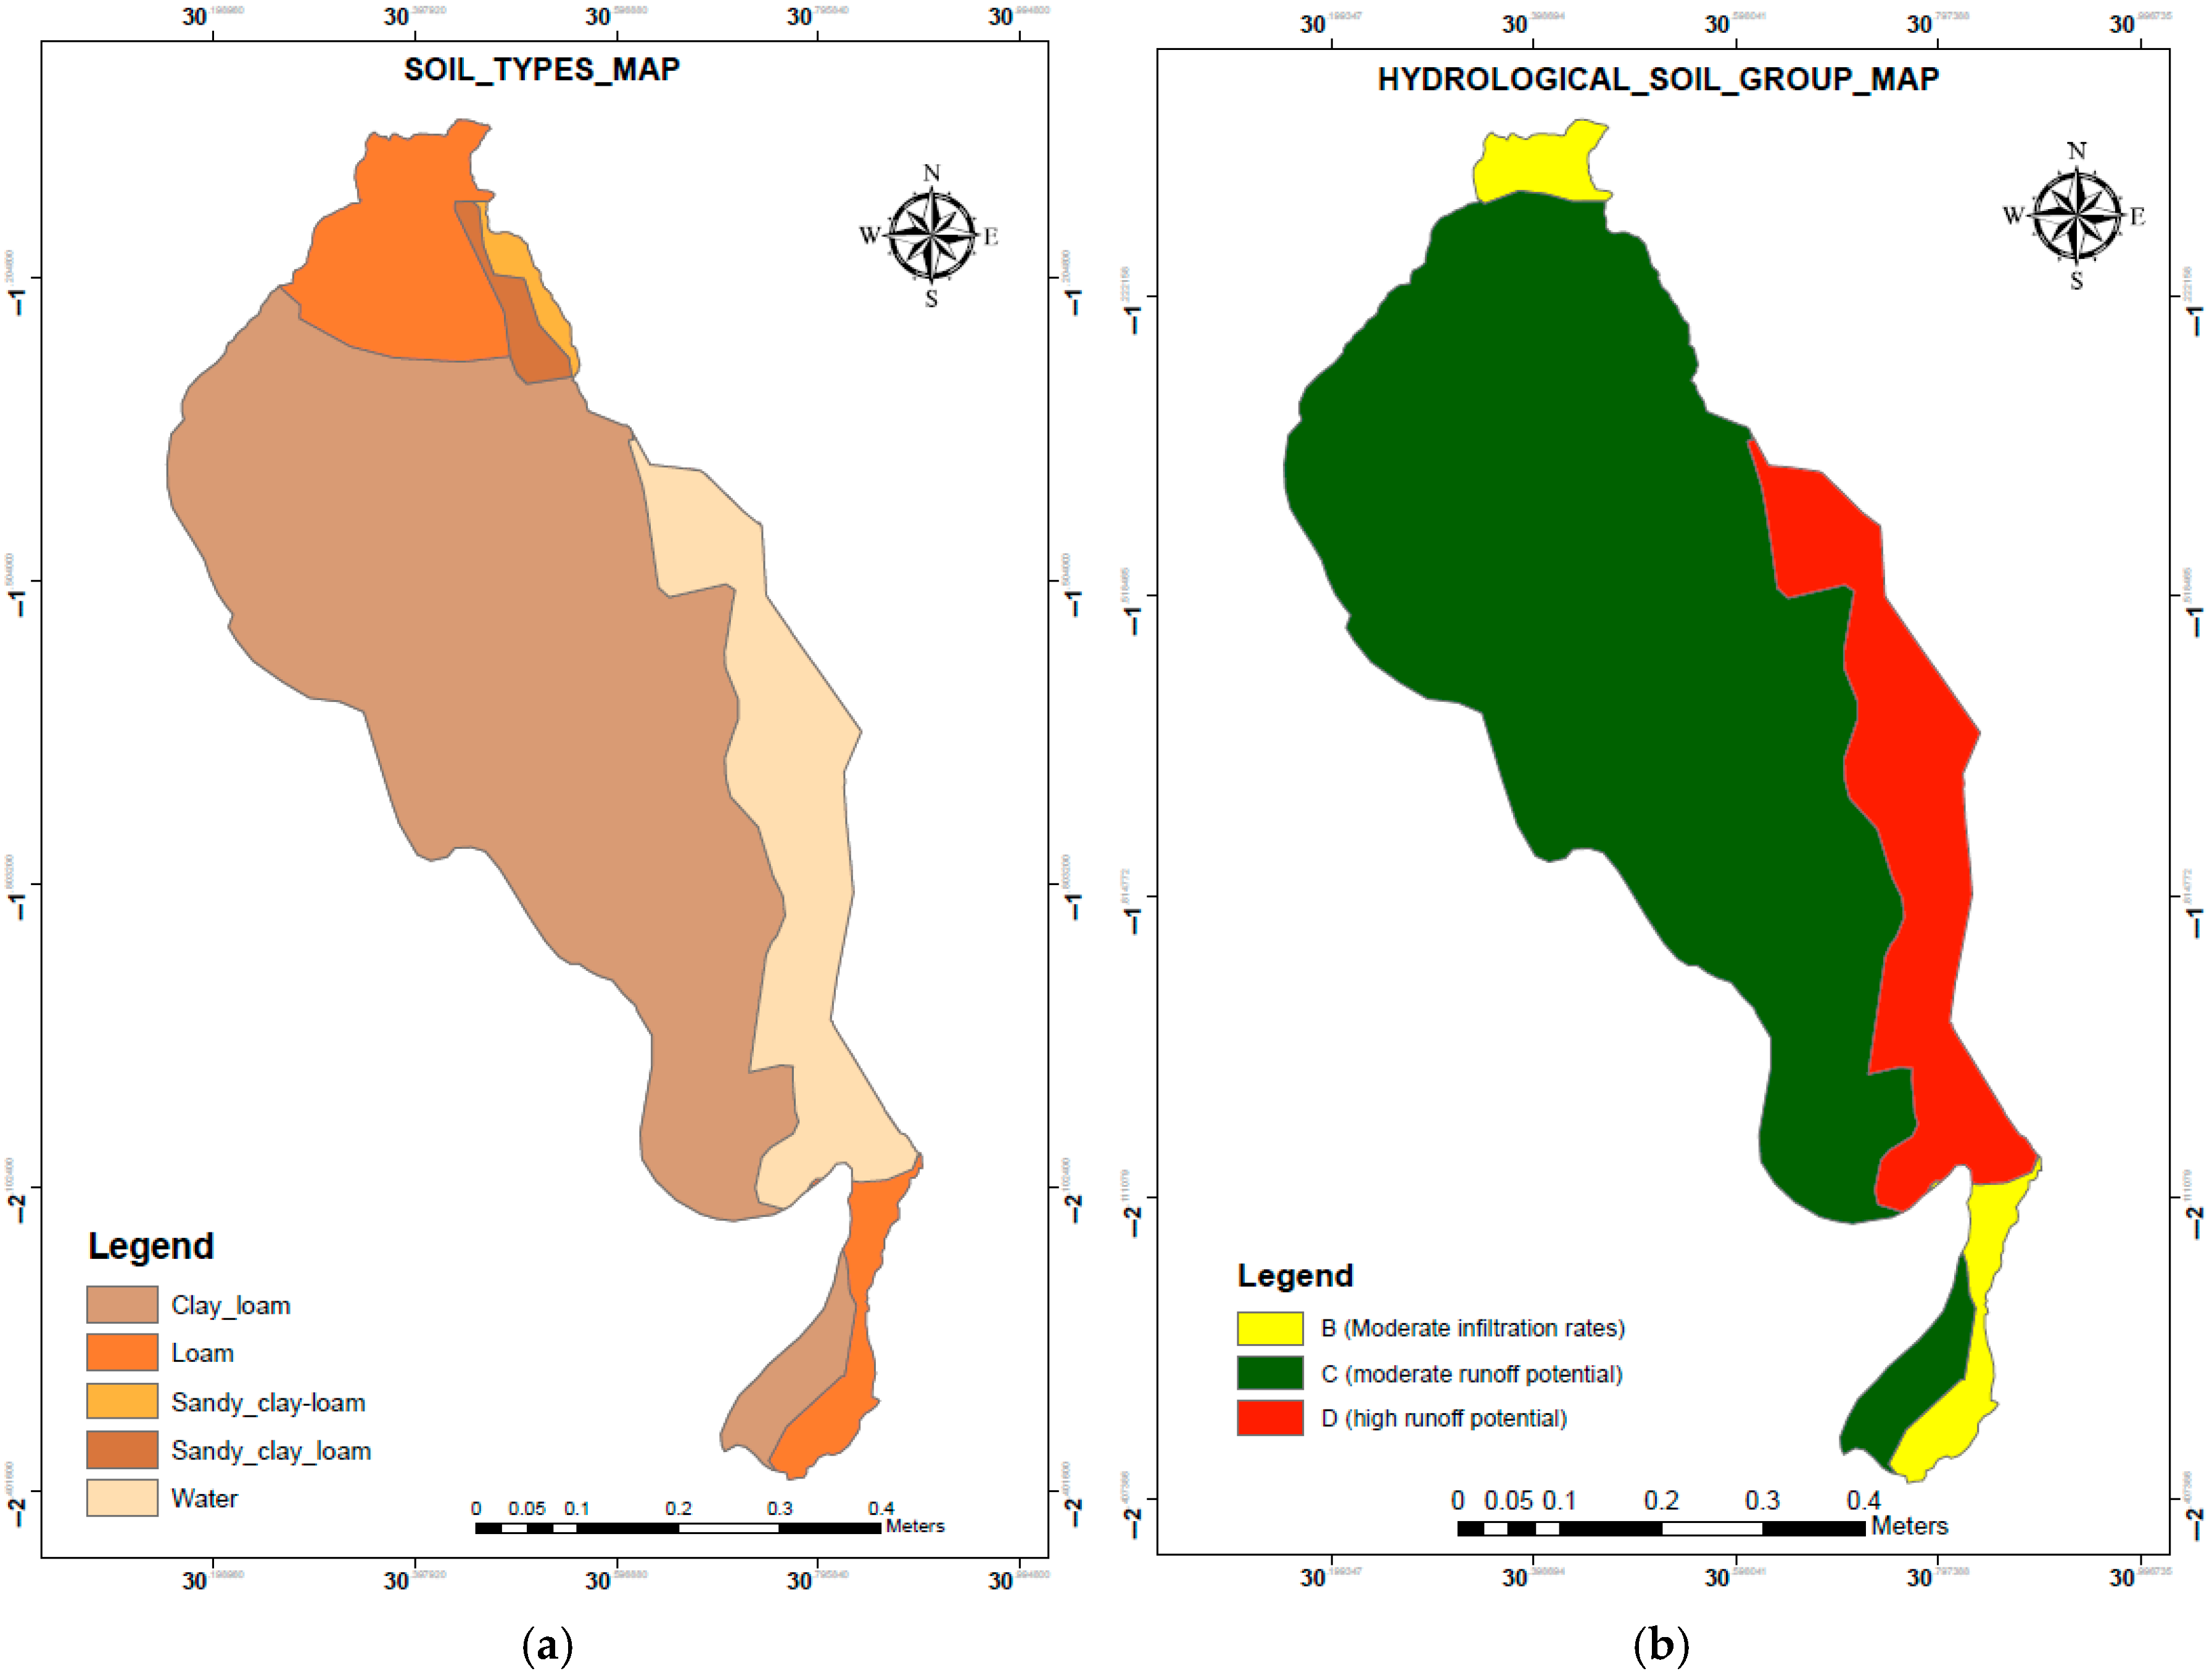
The soil classification map (Figure 6a) provides essential insights into soil permeability and its implications for agriculture, hydrology, and land management. Red areas exhibit moderate permeability, with 20–35% clay content, making them ideal for percolation tanks and rainwater infiltration systems. Conversely, blue areas, with over 35% clay content, are less permeable, resulting in slower infiltration and higher surface runoff, which can be effectively managed through stormwater harvesting systems. Soil texture has a significant influence on runoff potential by affecting infiltration rates and water retention. Research indicates that soils with higher sand content exhibit greater infiltration capacity, reducing runoff [36,69]. Conversely, finer-textured soils, such as clay loam and silt loam, retain more water, which can either enhance or minimize runoff depending on environmental conditions [70,71].
Most of the soil in the study area can be classified as HSG C, (Figure 6b), indicating that the dominant soil type can absorb water, leading to moderate runoff potential. The HSG C is concentrated along the central and eastern parts, meaning these areas have lower infiltration rates and are more likely to contribute to surface runoff. Meanwhile, HSG B is found in small patches, mainly at the northern and southern edges, indicating poor infiltration and high runoff potential. Hydrological soil groups (HSGs) play a critical role in runoff generation and watershed management by categorizing soils based on infiltration rates [72]. They are classified into four groups, A (high infiltration) to D (very low infiltration)). HSGs influence the Soil Conservation Service Curve Number (SCS-CN) method, a widely used approach for estimating runoff. Studies show that areas dominated by HSGs C and D have higher runoff potential due to lower infiltration capacities [72].

3.4. SCS-CN for the Combination of LULC and the HGS of the Study Area

The presented (Table 4) outlines the Land Use Land Cover (LULC) classification and corresponding Curve Numbers (CN) for a total area of approximately 4846.094 km2. It categorizes the landscape into five major LULC types: cropland, grassland, forests/shrubland, built-up land/bareland, and open water/wetlands. Grassland is the dominant land cover, comprising 36% of the total area, followed by cropland (32%) and forests/shrubland (21%). Built-up land and open water/wetlands occupy smaller portions, accounting for 2% and 9% of the area, respectively. This classification is critical for hydrological assessments as it influences surface runoff potential and water infiltration rates [73].
Hydrologic Soil Groups (HSGs) are used in conjunction with LULC to estimate potential runoff using the Curve Number method. The CN values, developed by the U.S. Soil Conservation Service (now NRCS), provide a standardized approach to predict direct runoff from rainfall events based on land cover and soil characteristics [74]. In the table, CN values are provided for HSGs B, C, and D, representing increasing levels of runoff potential due to decreasing soil permeability. Notably, HSG A is excluded, possibly indicating its absence in the study area or its negligible coverage.
The data show that open water/wetland areas have the highest CN values (99) across all soil groups, reflecting their minimal infiltration and maximum runoff potential. Conversely, forests/shrubland exhibit the lowest CN values (55–77), indicating their capacity to reduce runoff through vegetation cover and higher infiltration. Cropland and grassland show intermediate CN values, reflecting their variable vegetation cover and potential for moderate runoff. Built-up or bareland areas have consistently high CN values, especially under soil groups C and D, due to impervious surfaces and compacted soils, which significantly limit infiltration [75].
This information is fundamental for hydrological modeling, especially in the application of the SCS-CN method for runoff estimation, flood prediction, and stormwater management. Understanding the interaction between land use and soil type allows for more accurate simulation of watershed behavior and supports informed land and water resource planning.
Table 4. SCS-CN for the combination of LULC and the HGS of the study area [76].
No.LULCArea km2Percentage (%)HSG
ABCD
1Cropland1557.15832-788589
2Grassland1739.04736-697984
3Forests/shrubland1018.62321-557077
4Build-up land/bareland95.5442-808286
5Open water/wetland435.7229-999999
Total4846.094100

3.5. Curve Number and Potential Maximum Retention

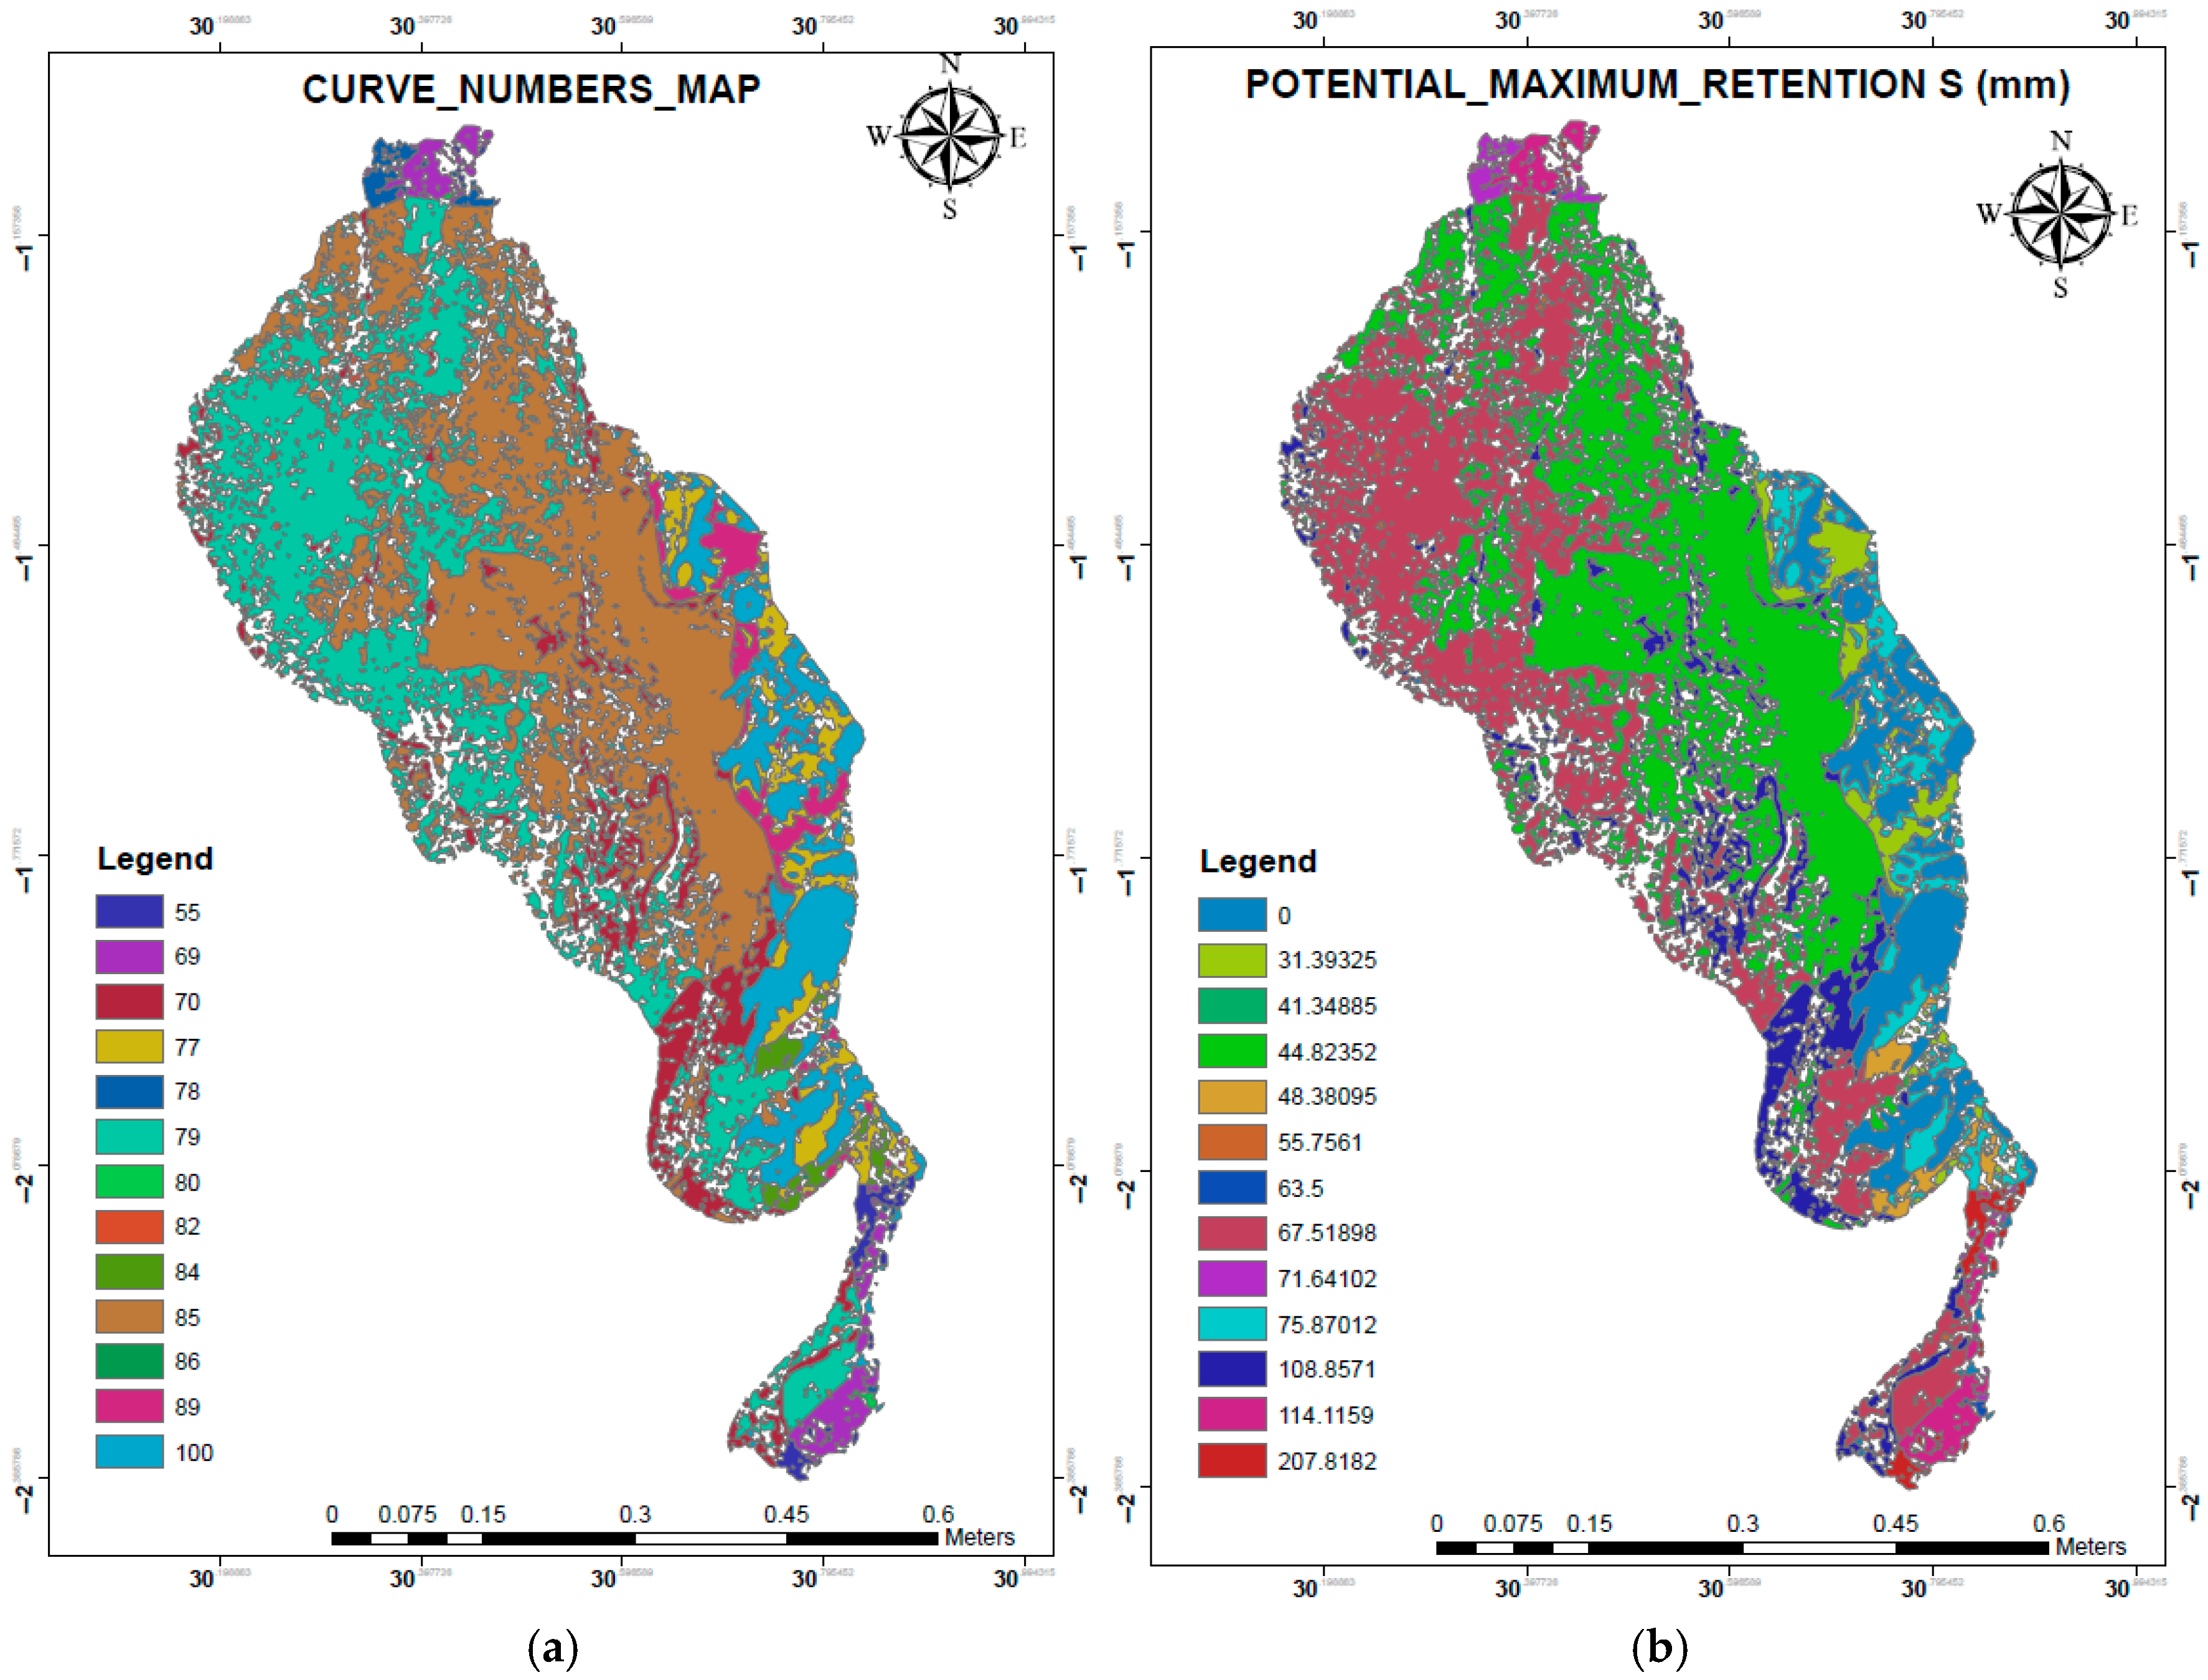
The map titled “CURVE_NUMBERS_MAP” (Figure 7a) displays the spatial distribution of Curve Numbers (CN) across the Rwandan eastern agroecological zone. Curve Numbers are used in hydrology to estimate direct runoff or infiltration from rainfall, and they are key components of the SCS-CN (Soil Conservation Service-Curve Number) method. Curve Numbers typically range between 30 and 100. Lower CN values (e.g., 55–70) indicate more infiltration and less runoff, and are generally associated with forest land, sandy soils, or good vegetative cover, whereas higher CN values (e.g., 85–100) indicate less infiltration and more runoff, and are typically associated with urban areas, compacted soils, or impervious surfaces. The northwest region (top of map) typically has a CN of 70–79 Mixture, indicating mixed agricultural/grassland and some CN 55 for forested areas. Central area: Dominated by CN 77 and CN 79, suggesting moderately high runoff potential for cultivated fields with moderate slope. The eastern strip appears to have a mix of CN 78, 84, and 85, making it more urbanized with clayey soils with higher runoff potential. The southern tip includes CN 89 and 100, suggesting urban zones with paved roads with high runoff potential.
The Eastern Savanna Agroecological Zone’s northern and some central regions have higher S values, meaning they retain more water and produce less runoff. The southern and some central-eastern regions exhibit lower S values, making them prone to more runoff and potentially higher flood risks. Northern region: Dominated by ~63–85 mm retention, indicating moderate to high water-holding capacity, likely agricultural or forested land. Central area: A Mixture of moderate retention (e.g., S = 55.76 to 75.87 mm) suggests varied land use, like cropland with decent infiltration. The eastern side (S = 31.39 mm to 0) indicates poor retention, likely urban areas, bare soil, or compacted land. The southern tip has heterogeneous runoff potential, possibly due to mixed land use and topography.

3.6. Drainage Density

The Drainage Density Map (Figure 8b) provides a spatial representation of the concentration of streams and rivers within the watershed, a key indicator of hydrological behavior and landscape development. Drainage density, defined as the total length of streams per unit area, is a widely used metric to assess runoff potential and infiltration characteristics. In this study, drainage density is categorized into four classes, as shown in the legend. Areas with high drainage density (green, 178–303 m/km2) exhibit a well-developed stream network typically associated with steep topography, low soil permeability, or regions experiencing high rainfall intensity [77]. These zones are prone to rapid surface runoff and reduced infiltration, contributing to flash flooding and soil erosion. The moderate-high (yellow, 113–177 m/km2) and moderate (orange, 58.4–112 m/km2) classes represent transitional landscapes with intermediate drainage characteristics, often corresponding to mixed landforms and moderate slopes. In contrast, low drainage density areas (red, 0–58.3 m/km2) are typically located in flat terrains with permeable soils, dense vegetation, or low precipitation, which facilitate infiltration and reduce surface runoff.
The drainage network shown in Figure 8a forms the basis for this analysis. It was extracted from the Digital Elevation Model (DEM) using standard flow direction and accumulation techniques in a GIS environment. The calculated drainage density values reflect the hydrological response of the watershed and are critical for identifying erosion-prone zones and suitable areas for stormwater harvesting or conservation practices. According to the tabular summary, high-density areas account for approximately 165,933 units of stream length, moderate areas for 223,136 units, low-density areas for 670,004 units, and very low-density zones for the largest share—1,308,250 units. This spatial variability highlights the diverse runoff generation potential across the watershed and underscores the need for site-specific land management interventions.

3.7. Estimated Volumes and Their Locations

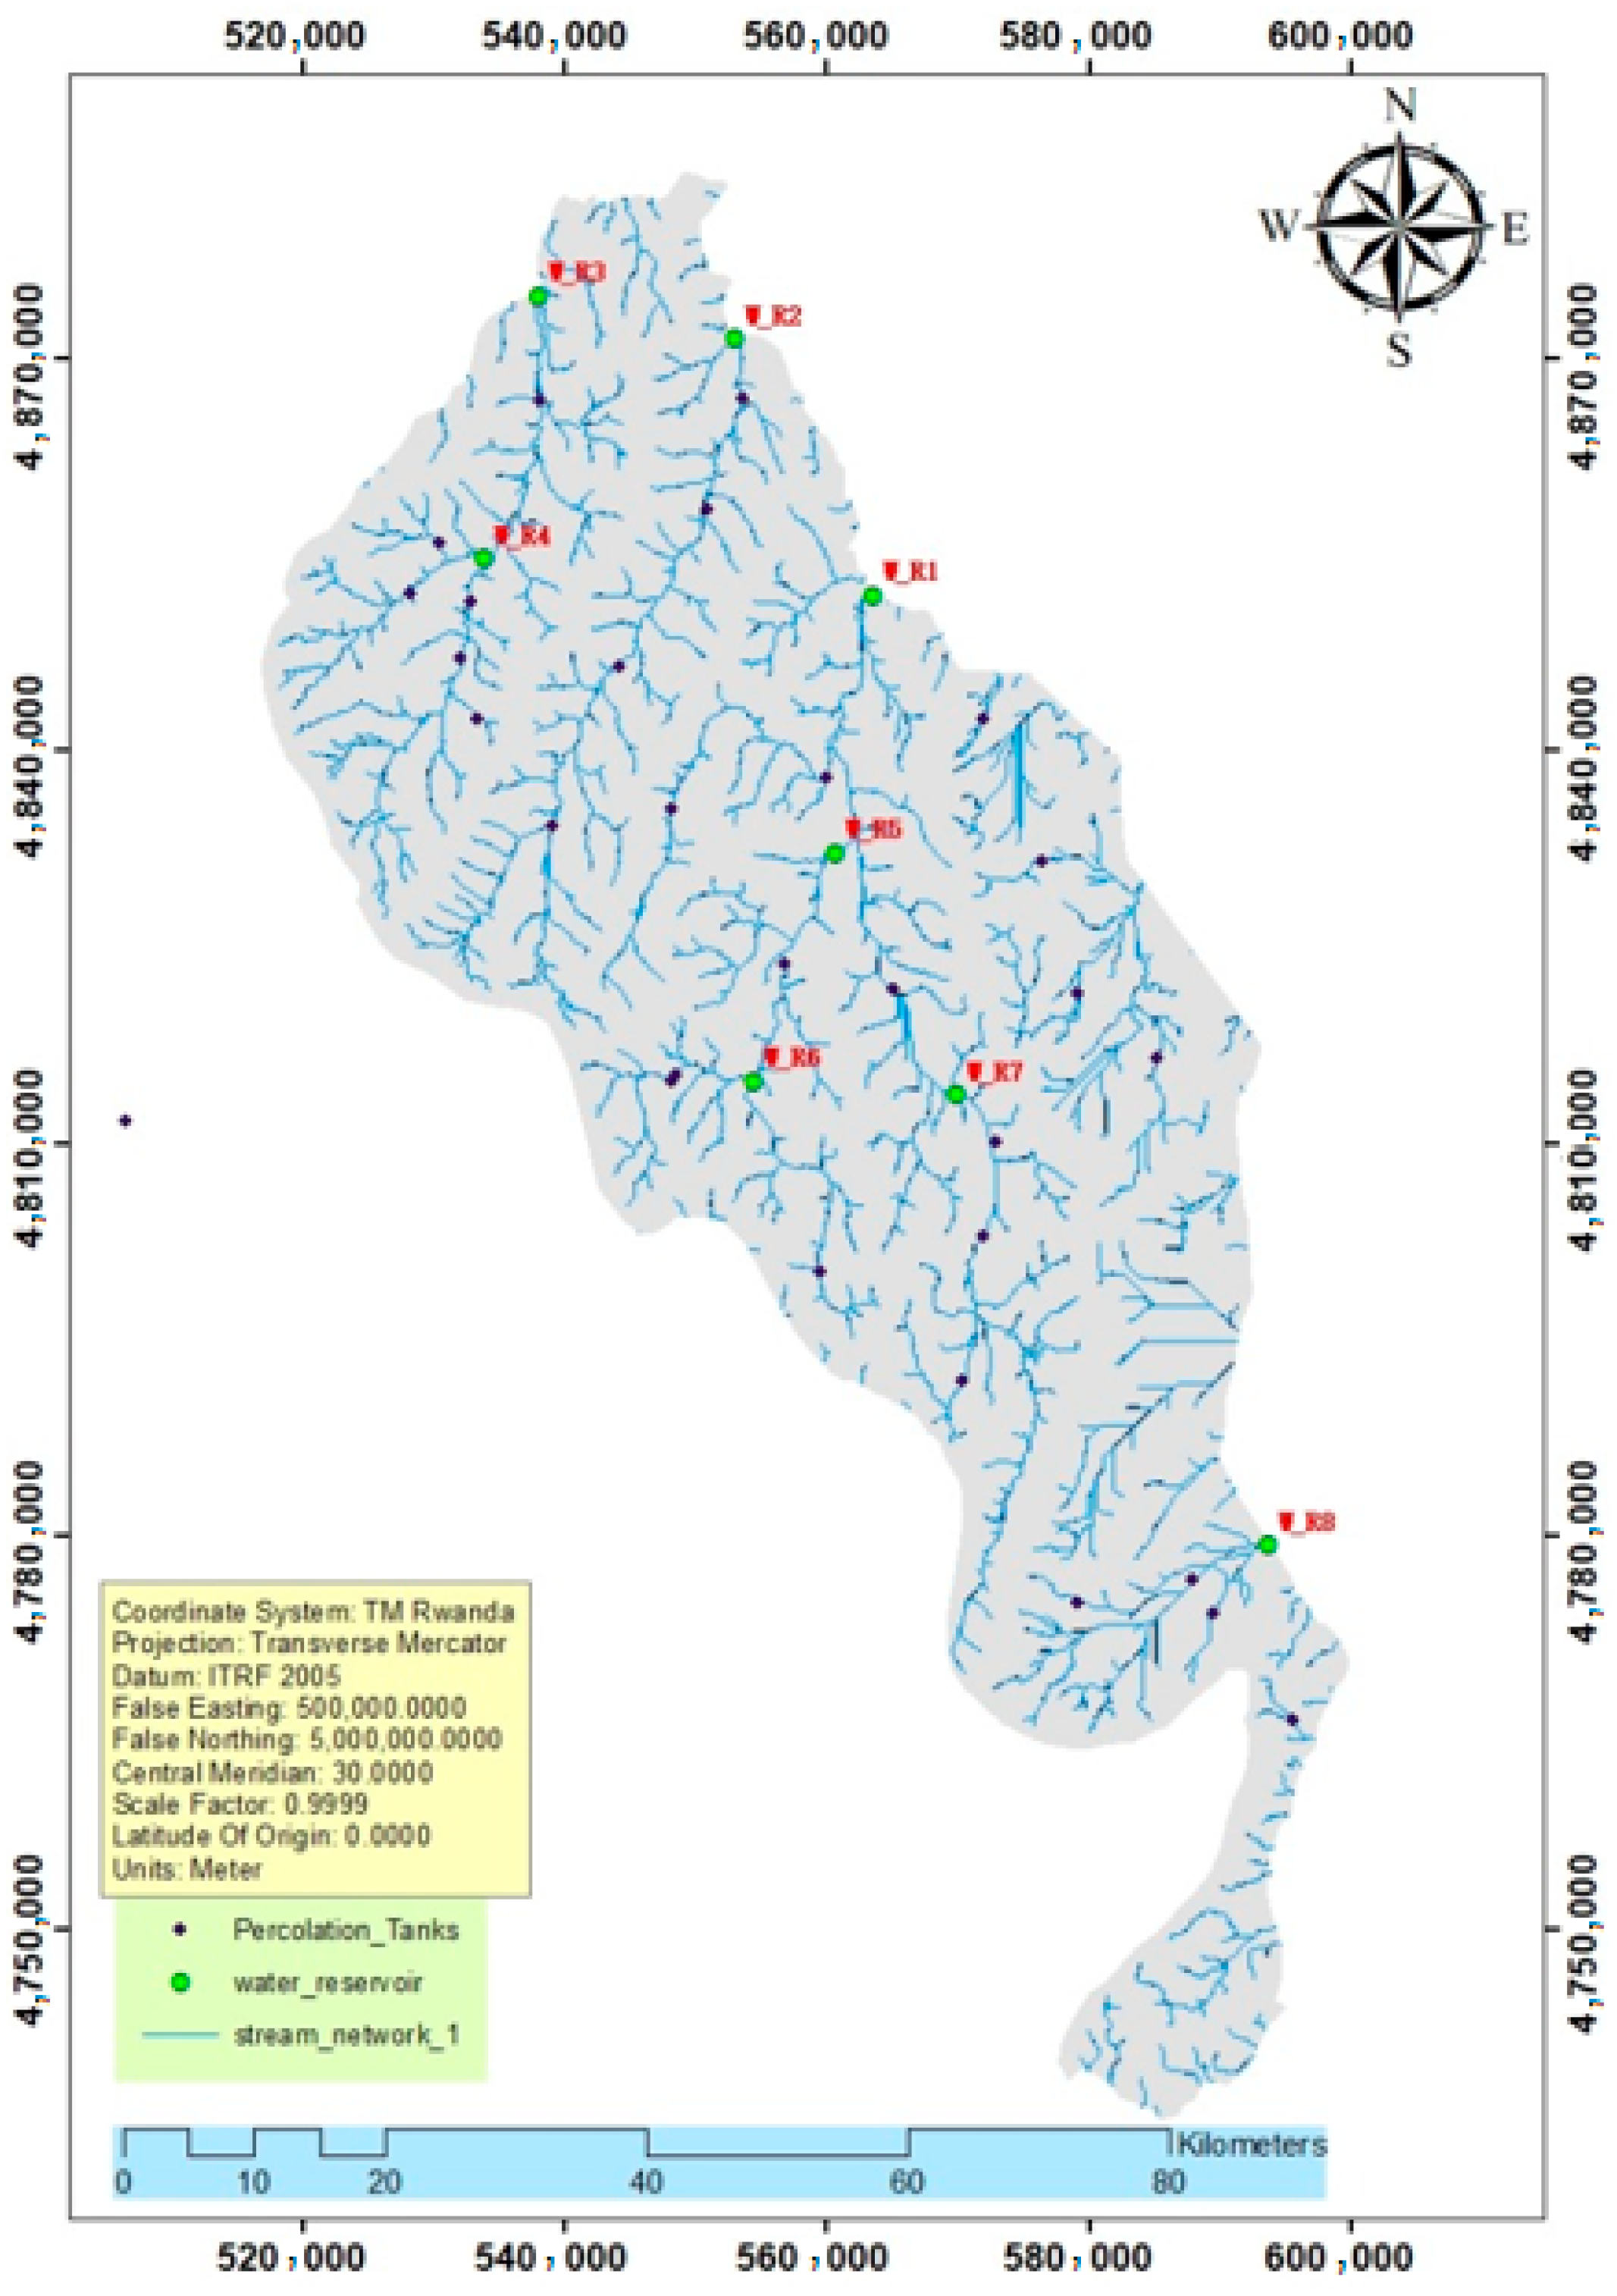
Eight water reservoirs are listed in Table 5, each with a unique code (W_R1 to W_R8), geographic coordinates (X and Y), and storage volumes in 10 million cubic meters. W_R1 has the smallest volume at 0.242 × 10⁶ m3, while W_R2 has the largest volume at 8.51 × 10⁶ m3. W_R3, W_R5, and W_R7 are additional noteworthy reservoirs with sizable capacities. For mapping or spatial planning, the coordinates imply a general southwestward distribution of the reservoirs. This information helps assess resource management, infrastructure planning, and water storage distribution throughout the surveyed region.
Table 5 displays key spatial and volumetric data for eight proposed water retention sites, labeled W_R1 through W_R8. Each site is described by its X and Y coordinates, and by its estimated water storage volume in units of 10 million cubic meters. This type of assessment is crucial for stormwater harvesting planning, particularly in semi-arid and savanna agroecological zones where rainfall is highly seasonal and water scarcity is a persistent challenge.
The volumes vary significantly across the eight sites. W_R2 (8.51 million m3), W_R3 (7.38 million m3), and W_R5 (7.94 million m3) show the highest potential for large-scale water storage, making them particularly valuable for regional water supply, agriculture, and climate resilience projects. In contrast, W_R1 stores only 0.242 million m3, and W_R8 and W_R6 have volumes below 2 million m3, suggesting they may be better suited for localized or community-level water use.
Geospatially, the distribution of these retention structures (Figure 9) could support distributed water harvesting, which improves overall watershed efficiency by reducing surface runoff, enhancing groundwater recharge, and mitigating downstream flooding risks. Such approaches align with integrated water resources management (IWRM) principles, promoting decentralized solutions that are adapted to local hydrological and socio-economic contexts [78].

4. Discussions

4.1. Terrain Slope Classification and Implications

The slope classification derived from the Digital Elevation Model (DEM) (Figure 5a) and shown in Figure 5b provides essential insights into the spatial variability of runoff generation potential, erosion vulnerability, and land-use suitability throughout the study area. Slope gradient is widely acknowledged as a primary topographic factor that influences key hydrological and geomorphic processes, including surface runoff speed, infiltration rate, soil detachment, and sediment transport [79,80]. These processes, in turn, directly affect agricultural productivity, infrastructure development, and landscape resilience.
Flat areas (0–5%) often support agricultural mechanization and infrastructure development but are increasingly known to be vulnerable to water stagnation and poor drainage, especially when linked with fine-textured or compacted soils. Conversely, steep and very steep slopes (>15%) are susceptible to faster overland flow, gully formation, and land degradation, particularly deforestation or improper land use. Recent research highlights that without proper soil and water conservation measures, such as terracing, stone bunds, and vegetation stabilization; these slopes show significantly higher erosion rates and runoff levels [81].
This slope-based (Table 6) classification framework is consistent with emerging principles of Land Degradation Neutrality (LDN) and serves as a spatially explicit foundation for integrated watershed management. It facilitates the prioritization of conservation measures based on terrain sensitivity and hydrological vulnerability. Moreover, in the context of climate change, which is projected to intensify rainfall extremes and increase the frequency of high-energy storm events, slope-informed land-use planning becomes even more critical. Such planning contributes to long-term ecosystem stability, agricultural sustainability, and disaster risk reduction in vulnerable upland regions [28,82].

4.2. Rainfall Distribution and Land Cover Characteristics

Recent studies show that rainfall variability, particularly in terms of intensity and temporal clustering, significantly affects infiltration-excess runoff in East African agroecosystems [65,85]. Similarly, spatial rainfall heterogeneity introduces uncertainty in hydrological modeling, particularly in headwater regions [87]. Land cover types such as cropland and shrubland have been linked to increased runoff coefficients and sediment yield, especially under poor soil conservation practices [13,88]. In contrast, forested and wetland areas provide essential buffering and water retention services [82,89].

4.3. Soil Classification and Hydrological Implications

The soil classification map (Figure 6a) reveals significant spatial variation in soil texture and permeability, which are key determinants of infiltration, runoff generation, and water retention. Areas with moderate clay content (20–35%), shown in red, exhibit moderate permeability, making them favorable for recharge-enhancing interventions such as percolation tanks and infiltration trenches. In contrast, areas with >35% clay content, indicated in blue, have low permeability and contribute to increased surface runoff, necessitating stormwater management practices like retention ponds or surface basins [90].
Soil texture significantly influences hydrological behavior by regulating the rate and depth of water infiltration. Sandy soil typically has higher infiltration rates and lower runoff potential, whereas fine-textured soils such as clay loam and silt loam exhibit slower infiltration but greater water-holding capacity. However, the runoff response of these soil varies with land cover, slope, and rainfall intensity [30,83,91].
The Hydrological Soil Group (HSG) map (Figure 6b) categorizes most of the region under HSG C, characterized by moderate infiltration and moderately high runoff potential. These soils dominate the central and eastern portions of the study area and are more prone to surface runoff during high-intensity rainfall events [92]. Smaller pockets of HSG B, located in the north and south, indicate relatively higher permeability and thus reduced runoff.
HSGs, classified from A (high infiltration) to D (very low infiltration), play a crucial role in runoff estimation using the Soil Conservation Service Curve Number (SCS-CN) method [92]. Research confirms that areas dominated by HSG C and D generate more runoff due to reduced infiltration capacity, particularly when exposed to deforestation or agricultural encroachment [84]. These findings underscore the need to incorporate soil group classification into watershed planning to optimize rainwater harvesting potential and minimize soil degradation risks.

4.4. Discussion of LULC and HSG Distribution

The land use/land cover (LULC) table highlights that grassland (36%), cropland (32%), and forest/shrubland (21%) dominate the study area. Grasslands and croplands exhibit moderate curve numbers (CNs), indicating moderate runoff potential, especially on less permeable soils (HSG C and D). Forests, with lower CNs (55–77), enhance infiltration and reduce runoff due to dense vegetation and minimal disturbance [9]. Built-up/bare lands, although covering only 2%, show high CNs (80–86), suggesting high runoff risk due to impervious surfaces. Wetlands/open water (9%) are assigned CN = 99, indicating no infiltration.
The absence of HSG A data implies limited highly permeable soils. Overall, this LULC-HSG pattern supports hydrological modeling for flood control and water harvesting planning in semi-arid regions [93,94].

4.5. Curve Number Distribution and Runoff Potential Analysis

The spatial distribution of Curve Numbers (CN), as shown in Figure 7a, provides a crucial understanding of runoff behavior in the Eastern Savanna Agroecological Zone of Rwanda. The CN, a central parameter in the SCS-CN method, reflects the combined effects of land use, soil hydrologic group (HSG), and antecedent moisture, and typically ranges from 30 (high infiltration) to 100 (high runoff) [9,92].
Lower CN values (55–69) in the northwest and forested areas suggest greater infiltration and reduced runoff, aligning with the presence of vegetative cover and permeable soils [90,95]. Moderate CN values (77–79) in the central zone correspond to cultivated lands with moderate slopes and runoff potential [30]. In contrast, higher CN values (83–99) in the eastern and southern zones indicate urbanized or compacted surfaces, where infiltration is minimal and runoff peaks are elevated [13].
The retention potential (S) further supports this interpretation. Higher S values (6–85 mm) in the north and center denote greater water-holding capacity, while lower S values (≤35 mm) in the eastern and southern zones reflect imperviousness and high flood risk [96].
These spatial patterns emphasize the importance of CN and S in hydrological modeling and conservation planning, particularly under climate change-induced rainfall variability. The CN map thus serves as a key input for targeting soil and water conservation interventions and supporting land degradation neutrality (LDN) strategies [28,82].

4.6. Drainage Density and Hydrological Implications

The Drainage Density Map (Figure 8b) offers a critical spatial overview of stream concentration within the watershed, serving as a key hydrological indicator of runoff response, infiltration dynamics, and landscape evolution. Drainage density (Dd), defined as the total length of streams per unit area (m/km2), is widely used to characterize surface hydrological behavior, with [30] high values generally reflecting reduced infiltration and elevated runoff potential [97,98].
In this study, drainage density is categorized into four classes. High-density zones (178–303 m/km2), highlighted in green, correspond to areas with steep topography, low-permeability soils, or intense precipitation. These regions exhibit rapid hydrological response, often associated with flash flooding, gully formation, and accelerated erosion [99,100]. Moderate-high (113–177 m/km2) and moderate (58.4–112 m/km2) classes represent transitional hydrological regimes, commonly found in areas with mixed landforms and land cover. These zones may support moderate infiltration but remain sensitive to high-intensity rainfall events [98,101].
In contrast, low drainage density areas (0–58.3 m/km2), depicted in red, are typically found in flat or gently sloping terrain with permeable soils and dense vegetation, which facilitate infiltration and groundwater recharge while limiting surface runoff [99,100]. These regions are generally suitable for stormwater harvesting and soil moisture conservation practices.
The drainage network illustrated in Figure 8a was derived from a Digital Elevation Model (DEM) using standard flow direction and accumulation algorithms in a GIS environment. Quantitatively, very-low-density zones dominate the watershed, accounting for 1,308,250 stream length units, followed by low-density (670,004 units), moderate (223,136 units), and high-density zones (165,933 units). This spatial heterogeneity reflects diverse runoff generation capacities across the landscape and supports the need for site-specific watershed management strategies [28,30].
Overall, drainage density analysis is integral for delineating hydrologically sensitive areas, guiding erosion control, and optimizing land-use planning in climate-vulnerable agroecological zones [94].

4.7. Evaluation of Proposed Water Retention Sites

Table 5 presents the geospatial and volumetric characteristics of eight proposed water retention sites (W_R1 to W_R8), each identified by its X and Y coordinates and associated with an estimated storage volume (in units of 106 m3). This spatially explicit assessment is fundamental for stormwater harvesting and retention planning, particularly in semi-arid and savanna agroecological zones, where rainfall variability, seasonal water deficits, and increasing climatic extremes exacerbate water insecurity [102,103].
The analysis reveals considerable variation in storage potential among the sites. W_R2 (8.51 million m3), W_R5 (7.94 million m3), and W_R3 (7.38 million m3) emerge as high-capacity retention zones, well-suited for multi-purpose use, including agricultural irrigation, livestock water supply, and climate-resilient regional water management. These sites offer the potential for integration into larger-scale interventions targeting hydrological buffering, flood mitigation, and dry-season water availability [29].
In contrast, sites such as W_R1 (0.242 million m3), W_R6 (1.84 million m3), and W_R8 (1.15 million m3) exhibit lower storage volumes, indicating their suitability for localized or community-based interventions, such as micro-dams, village water points, or supplemental irrigation for household gardens. Despite their smaller capacities, these structures play a critical role in distributed water harvesting systems, which enhance groundwater recharge, reduce surface runoff, and contribute to landscape-scale resilience when implemented in clusters [31,104].
The geographical dispersion of the proposed sites supports the adoption of a decentralized stormwater management strategy, consistent with Integrated Water Resources Management (IWRM) principles. By leveraging topographic suitability and runoff concentration zones, these interventions can maximize hydrological efficiency while aligning with local socio-economic realities and climate adaptation frameworks [28,83].

5. Conclusions

This study employed a GIS-based approach integrated with the Soil Conservation Service Curve Number (SCS-CN) method to evaluate the potential for stormwater harvesting within Rwanda’s Eastern Savanna Agroecological Zone. Through analysis of spatial datasets encompassing land use, soil hydrologic groups, slope, and rainfall, eight principal zones were identified as suitable for the development of large-scale water storage infrastructure. Estimated annual runoff volumes varied substantially, ranging from approximately 0.2 × 10¹⁰ cubic meters in smaller watersheds to 8.51 × 10¹⁰ cubic meters in larger catchments, reflecting marked spatial variability in hydrological conditions.
Rainfall distribution across the region is notably heterogeneous, with the central-western sector receiving the highest annual precipitation (1150–1250 mm), whereas northern and southeastern areas experience considerably lower rainfall (approximately 760–820 mm). This variability significantly influences runoff generation and consequently the feasibility and design of stormwater harvesting interventions, underscoring the necessity for location-specific water management strategies.
The study further highlights the critical influence of soil texture and hydrologic soil groups (HSG) on infiltration and runoff processes. Soils characterized by moderate clay content and loamy textures exhibit enhanced permeability, rendering them suitable for infiltration-focused structures such as percolation tanks. In contrast, finer-textured soils with higher clay content present reduced permeability, contributing to elevated runoff and necessitating alternative stormwater management approaches. Predominantly, soils within the study area are classified as HSG C, indicative of moderate runoff potential, while localized occurrences of HSG B correspond to zones with increased runoff risk. The spatial distribution of these soil properties is integral to the effective planning and design of stormwater harvesting systems aimed at optimizing water resource sustainability.
Additionally, the spatial variability of Curve Numbers (CN) corroborates these findings, with lower CN values associated with forested and agricultural lands indicating higher infiltration and reduced runoff, and higher CN values correlating with urbanized and compacted areas reflecting increased runoff potential. Retention values similarly vary, with greater retention observed in northern and central areas compared to lower retention and heightened flood risk in southern and eastern sectors. These hydrological insights are pivotal for informing the targeted design and implementation of stormwater harvesting infrastructure.
While this investigation focuses on Rwanda’s Eastern Savanna, the methodology and findings possess broader applicability to other regions with comparable data availability and agroecological contexts. The framework established herein offers a replicable approach for identifying optimal sites for stormwater harvesting and estimating runoff volumes to support sustainable water resource management. Future research should prioritize empirical validation, incorporate socio-economic considerations, and monitor land use dynamics to enhance the robustness and applicability of stormwater management strategies, thereby contributing to increased climate resilience at the local and regional levels.

Author Contributions

Conceptualization, K.S.C. and H.C.T.; methodology, K.S.C. and H.C.T.; software, H.C.T.; supervision, K.S.C. All authors have read and agreed to the published version of the manuscript.

Funding

This research received no external funding.

Data Availability Statement

The raw data used in this study can be accessed from the different data platforms cited in the article and can be shared anytime needed.

Acknowledgments

The authors sincerely thank Kyungpook National University for its academic support and guidance throughout this research project. Furthermore, the authors express their gratitude to the Korea International Cooperation Agency (KOICA) and the Government of the Republic of Korea for their essential support, which enabled them to pursue their studies at Kyungpook National University. The collaboration and assistance from these institutions played a key role in completing this research.

Conflicts of Interest

The authors declare no conflict of interest.

Abbreviations

The following abbreviations are used in this manuscript:
RLMARwanda Land Management Authority
RMARwanda Meteorological Agency
DEMDigital Elevation Model
LULCLand Use/Land Cover
DSRMDynamic Soil Resource Mapping
RESAEZRwanda Eastern Savanna Agroecological Zone

References

  1. Jiang, S.C.; Lim, K.; Huang, X.; McCarthy, D.; Hamilton, A.J. Human and environmental health risks and benefits associated with use of urban stormwater. Wiley Interdiscip. Rev. Water 2015, 2, 683–699. [Google Scholar] [CrossRef]
  2. Brown, R.R.; Farrelly, M.A. Delivering sustainable urban water management: A review of the hurdles we face. Water Sci. Technol. 2009, 59, 839–846. [Google Scholar] [CrossRef]
  3. Inamdar, P.; Cook, S.; Sharma, A.; Corby, N.; O’Connor, J.; Perera, B. A GIS based screening tool for locating and ranking of suitable stormwater harvesting sites in urban areas. J. Environ. Manag. 2013, 128, 363–370. [Google Scholar] [CrossRef]
  4. Jha, A.K.; Malla, R.; Sharma, M.; Panthi, J.; Lakhankar, T.; Krakauer, N.Y.; Pradhanang, S.M.; Dahal, P.; Shrestha, M.L. Impact of irrigation method on water use efficiency and productivity of fodder crops in nepal. Climate 2016, 4, 4. [Google Scholar] [CrossRef]
  5. Rawat, K.S.; Mishra, A.K.; Ahmad, N. Surface runoff estimation over heterogeneous foothills of Aravalli mountain using medium resolution remote sensing rainfall data with soil conservation system-curve number method: A case of semi-arid ungauged Manesar Nala watershed. Water Environ. J. 2017, 31, 262–276. [Google Scholar] [CrossRef]
  6. Curve Number Hydrology in Water Quality Modeling. Available online: https://www.nrcs.usda.gov/sites/default/files/2023-03/CURVE%20NUMBER%20HYDROLOGY%20IN%20WATER%20QUALITY%20MODELING.pdf (accessed on 29 April 2025).
  7. Ponce, V.M.; Richard, H.H. Runoff Curve Number: Has is it reached matyrity? J. Hydrol. Eng. 1996, 14–16. Available online: https://www.uvm.edu/~bwemple/HydroModel/ponce1996.pdf (accessed on 8 May 2025). [CrossRef]
  8. Shi, Z.-H.; Chen, L.-D.; Fang, N.-F.; Qin, D.-F.; Cai, C.-F. Research on the SCS-CN initial abstraction ratio using rainfall-runoff event analysis in the Three Gorges Area, China. Catena 2009, 77, 1–7. [Google Scholar] [CrossRef]
  9. Mishra, S.K.; Singh, V.P. Soil Conservation Service Curve Number (SCS-CN) Methodology. In Water Science and Technology Library; Springer: Dordrecht, The Netherlands, 2003; Volume 42. [Google Scholar] [CrossRef]
  10. Melesse, A.M.; Abtew, W.; Setegn, S.G.; Dessalegne, T. Hydrological Variability and Climate of the Upper Blue Nile River Basin. In Nile River Basin; Springer: Dordrecht, The Netherlands, 2011; pp. 3–37. [Google Scholar] [CrossRef]
  11. Tarboton, D.G. A new method for the determination of flow directions and upslope areas in grid digital elevation models. Water Resour. Res. 1997, 33, 309–319. [Google Scholar] [CrossRef]
  12. Fohrer, N.; Haverkamp, S.; Eckhardt, K.; Frede, H.-G. Hydrologic Response to land use changes on the catchment scale. Phys. Chem. Earth Part B Hydrol. Oceans Atmos. 2001, 26, 577–582. [Google Scholar] [CrossRef]
  13. Gashaw, T.; Tulu, T.; Argaw, M.; Worqlul, A.W.; Tolessa, T.; Kindu, M. Estimating the impacts of land use/land cover changes on Ecosystem Service Values: The case of the Andassa watershed in the Upper Blue Nile basin of Ethiopia. Ecosyst. Serv. 2018, 31, 219–228. [Google Scholar] [CrossRef]
  14. Fenta, A.A.; Tsunekawa, A.; Haregeweyn, N.; Tsubo, M.; Yasuda, H.; Kawai, T.; Ebabu, K.; Berihun, M.L.; Belay, A.S.; Sultan, D. Agroecology-based soil erosion assessment for better conservation planning in Ethiopian river basins. Environ. Res. 2021, 195, 110786. [Google Scholar] [CrossRef] [PubMed]
  15. Shadeed, S.; Almasri, M. Application of GIS-based SCS-CN method in West Bank catchments, Palestine. Water Sci. Eng. 2010, 3, 1–13. [Google Scholar] [CrossRef]
  16. Nizeyimana, J.C.; Lin, S.; Ndayisenga, F.; Twagirayezu, G.; Khan, J.; Marnn, P.; Kaku, D.U.; Musaed, B.; Al-Shaibah, A.; Hussein, A.R.; et al. Establishment of Rainfall Intensity-Duration-Frequency Equations and Curves Used to Design an Appropriate and Sustainable Hydraulic Structure for Controlling Flood in Nyabugogo Catchment-Rwanda. Available online: https://www.preprints.org/manuscript/202106.0025/v1 (accessed on 1 June 2021).
  17. Meshram, S.G.; Sharma, S.K. Prioritization of watershed through morphometric parameters: A PCA-based approach. Appl. Water Sci. 2017, 7, 1505–1519. [Google Scholar] [CrossRef]
  18. Amatya, D.; Walega, A.; Callahan, T.; Morrison, A.; Vulava, V.; Hitchcock, D.; Williams, T.; Epps, T. Storm event analysis of four forested catchments on the Atlantic coastal plain using a modified SCS-CN rainfall-runoff model. J. Hydrol. 2022, 608, 127772. [Google Scholar] [CrossRef]
  19. Water Users and Uses Assessment in Rwanda. Available online: https://waterportal.rwb.rw/sites/default/files/2022-07/03-12-2020_Final%20Report_Water_Users_Assessment.pdf (accessed on 8 May 2025).
  20. Askarizadeh, A.; Rippy, M.A.; Fletcher, T.D.; Feldman, D.L.; Peng, J.; Bowler, P.; Mehring, A.S.; Winfrey, B.K.; Vrugt, J.A.; AghaKouchak, A.; et al. From Rain Tanks to Catchments: Use of Low-Impact Development To Address Hydrologic Symptoms of the Urban Stream Syndrome. Environ. Sci. Technol. 2015, 49, 11264–11280. [Google Scholar] [CrossRef]
  21. Rockström, J.; Karlberg, L.; Wani, S.P.; Barron, J.; Hatibu, N.; Oweis, T.; Bruggeman, A.; Farahani, J.; Qiang, Z. Managing water in rainfed agriculture—The need for a paradigm shift. Agric. Water Manag. 2010, 97, 543–550. [Google Scholar] [CrossRef]
  22. Mitchell, V.G.; Mein, R.G.; Mcmahon, T.A. Modelling the Urban Water Cycle Year First Available: 2000 Hardware Required: PC 486, 32 MB of RAM, CD-ROM Software Required: Windows 95 or Greater Program Language: Visual Basic 6.0 Program Size: 1.4 MB Availability and Cost: Contact CRC for Catchment Hydrology (Nominal Charge). 2001. Available online: https://www.sciencedirect.com/science/article/abs/pii/S1364815201000299 (accessed on 17 March 2025).
  23. Ndirangu, M.D.; Chira, R.M.; Wang’ondu, V.; Kairo, J.G. Analysis of wave energy reduction and sediment stabilization by mangroves in Gazi Bay, Kenya. Bonorowo Wetl. 2017, 7, 83–94. [Google Scholar] [CrossRef]
  24. United Nations Educational, Scientific and Cultural Organization. Nature-Based Solutions for Water World Water Assessment Programme; United Nations Educational, Scientific and Cultural Organization: London, UK, 2018. [Google Scholar]
  25. FAO. FAO Statistical Programme of Work 2016–2017. 2016. Available online: https://www.fao.org/publications/en (accessed on 8 May 2025).
  26. Pandey, U.J.; Pandey, S.; Gunn, R.; Lim, K.J.; Engel, B.; Harbor, J. Developing a Web-Enabled Tool to Assess Long-Term Hydrologic Impact of Land Use Change: Information Technologies Issues and a Case Study Developing a Web-Enabled Tool to Assess Long-Term Hydro-Logic Impacts of Land-Use Change: Information Technology Issues and a Case Study. 2000. Available online: https://www.researchgate.net/publication/241608160 (accessed on 8 May 2025).
  27. Ndhlovu, G.; Woyessa, Y. Use of gridded climate data for hydrological modelling in the Zambezi River Basin, Southern Africa. J. Hydrol. 2021, 602, 126749. [Google Scholar] [CrossRef]
  28. Calvin, K.; Dasgupta, D.; Krinner, G.; Mukherji, A.; Thorne, P.W.; Trisos, C.; Romero, J.; Aldunce, P.; Barret, K.; Blanco, G.; et al. IPCC, 2023: Climate Change 2023: Synthesis Report, Summary for Policymakers. Contribution of Working Groups I, II and III to the Sixth Assessment Report of the Intergovernmental Panel on Climate Change; Core Writing Team, Lee, H., Romero, J., Eds.; IPCC: Geneva, Switzerland, 2023. [Google Scholar] [CrossRef]
  29. Tadese, S.; Soromessa, T.; Bekele, T.; Abbas, S. Analysis of the Current and Future Prediction of Land Use/Land Cover Change Using Remote Sensing and the CA-Markov Model in Majang Forest Biosphere Reserves of Gambella, Southwestern Ethiopia. Sci. World J. 2021, 2021, 1–18. [Google Scholar] [CrossRef]
  30. Tiruneh, G.A.; Meshesha, D.T.; Adgo, E.; Tsunekawa, A.; Haregeweyn, N.; Fenta, A.A.; Alemayehu, T.Y.; Ayana, G.; Reichert, J.M.; Tilahun, K. Geospatial modeling and mapping of soil organic carbon and texture from spectroradiometric data in Nile basin. Remote Sens. Appl. Soc. Environ. 2023, 29, 100879. [Google Scholar] [CrossRef]
  31. Mccartney, M.; Rex, W.; Bank, W.; Bank, W.H.Y.W.; Uhlenbrook, S. Change in Global Freshwater Storage. International Water Management Institute. Available online: https://www.iwmi.org/ (accessed on 20 March 2025).
  32. Guyassa, E.; Frankl, A.; Zenebe, A.; Poesen, J.; Nyssen, J. Effects of check dams on runoff characteristics along gully reaches, the case of Northern Ethiopia. J. Hydrol. 2017, 545, 299–309. [Google Scholar] [CrossRef]
  33. Mugiraneza, T.; Nascetti, A.; Ban, Y. Continuous monitoring of urban land cover change trajectories with landsat time series and landtrendr-google earth engine cloud computing. Remote Sens. 2020, 12, 2883. [Google Scholar] [CrossRef]
  34. Jean, N.; Patrick, R.; Phenihas, T.; Rolland, A.; Placide, R.; Robert, M.O.M.; Silver, T.; Vestine, K.; Evrard, K.; Grüneberg, W.J. Evaluation of Performance of Introduced Yam Bean (Pachyrhizus spp.) in Three Agro-Ecological Zones of Rwanda. Trop. Plant Biol. 2017, 10, 97–109. [Google Scholar] [CrossRef]
  35. Nsengimana, V.; Mukangango, M.; Habiyaremye, J.d.D.; Uwiduhaye, F.; Iradukunda, C.S.; Bigengimana, Y.; Nsanganwimana, F.; Cocozza, C. Status of Soil Physicochemical Properties in Forests and Savannas Restored Using the Ecosystem-Based Adaptation Approach in Eastern Rwanda. Appl. Environ. Soil Sci. 2024, 2024, 6504201. [Google Scholar] [CrossRef]
  36. Iiyama, M.; Mukuralinda, A.; Ndayambaje, J.D.; Musana, B.; Ndoli, A.; Mowo, J.G.; Garrity, D.; Ling, S.; Ruganzu, V. Tree-Based Ecosystem Approaches (TBEAs) as multi-functional land management strategies—Evidence from rwanda. Sustainability 2018, 10, 1360. [Google Scholar] [CrossRef]
  37. Molden, D.J.; Barker, R. Charlotte de Fraiture IHE Delft Institute for Water Education. 2007. Available online: https://www.researchgate.net/publication/284491758 (accessed on 25 March 2025).
  38. Mbilinyi, B.; Tumbo, S.; Mahoo, H.; Mkiramwinyi, F. GIS-based decision support system for identifying potential sites for rainwater harvesting. Phys. Chem. Earth 2007, 32, 1074–1081. [Google Scholar] [CrossRef]
  39. United Nations Environment Programme (UNEP). United Nations Environmental Programme Annual Report 2012; United Nations Environment Programme (UNEP), 2013; Available online: https://wedocs.unep.org/bitstream/handle/20.500.11822/8607/-UNEP%202013%20Annual%20Report2014UNEP%20AR%202013.nLR.pdf?sequence=8&amp%3BisAllowed=y%2C%20Chinese%7C%7Chttps%3A//wedocs.unep.org/bitstream/handle/20.500.11822/8607/-UNEP%202013%20Annual%20Report2014UNEP-AR-CHinese-low%20re (accessed on 8 May 2025).
  40. Shuler, C.K.; Amato, D.W.; Gibson, V.; Baker, L.; Olguin, A.N.; Dulai, H.; Smith, C.M.; Alegado, R.A. Assessment of terrigenous nutrient loading to coastal ecosystems along a human land-use gradient, Tutuila, American Samoa. Hydrology 2019, 6, 18. [Google Scholar] [CrossRef]
  41. Singh, V.P.; Asce, F.; Woolhiser, D.A.; Asce, M. Mathematical Modeling of Watershed Hydrology. J. Hydrol. Eng. 2002, 7, 270–292. [Google Scholar] [CrossRef]
  42. Kahinda, J.M.; Taigbenu, A.; Boroto, R. Domestic rainwater harvesting as an adaptation measure to climate change in South Africa. Phys. Chem. Earth 2010, 35, 742–751. [Google Scholar] [CrossRef]
  43. ANNUAL REPORT. UN-Water Annual Report 2013. pp. 18–22. Available online: https://www.unwater.org/sites/default/files/app/uploads/2017/05/UN_Water_Annual_Report_2013.pdf (accessed on 8 May 2025).
  44. Navarro, A.; Tauler, R.; Lacorte, S.; Barceló, D. Occurrence and transport of pesticides and alkylphenols in water samples along the Ebro River Basin. J. Hydrol. 2010, 383, 18–29. [Google Scholar] [CrossRef]
  45. Tadono, T.; Ishida, H.; Oda, F.; Naito, S.; Minakawa, K.; Iwamoto, H. Precise Global DEM Generation by ALOS PRISM. ISPRS Ann. Photogramm. Remote Sens. Spat. Inf. Sci. 2014, II-4, 71–76. [Google Scholar] [CrossRef]
  46. Chen, J.; Chen, J.; Liao, A.; Cao, X.; Chen, L.; Chen, X.; He, C.; Han, G.; Peng, S.; Lu, M.; et al. Global land cover mapping at 30 m resolution: A POK-based operational approach. ISPRS J. Photogramm. Remote Sens. 2015, 103, 7–27. [Google Scholar] [CrossRef]
  47. Gong, P.; Wang, J.; Yu, L.; Zhao, Y.; Zhao, Y.; Liang, L.; Niu, Z.; Huang, X.; Fu, H.; Liu, S.; et al. Finer resolution observation and monitoring of global land cover: First mapping results with Landsat TM and ETM+ data. Int. J. Remote Sens. 2013, 34, 2607–2654. [Google Scholar] [CrossRef]
  48. Kavitha; Polisgowdar, B. Rainfall-runoff estimation by SCS-CN method: A case study. Int. J. Res. Agron. 2024, 7, 5–8. [Google Scholar] [CrossRef]
  49. Alataway, A. SCS-CN and GIS-Based Approach for Estimating Runoff in Western Region of Saudi Arabia. J. Geosci. Environ. Prot. 2023, 11, 30–43. [Google Scholar] [CrossRef]
  50. Ssekyanzi, G.; Ahmad, M.J.; Choi, K.-S. Geospatial Assessment of Stormwater Harvesting Potential in Uganda’s Cattle Corridor. Water 2025, 17, 349. [Google Scholar] [CrossRef]
  51. Malekani, L.; Khaleghi, S.; Mahmoodi, M. Application of GIS in modeling Zilberchai basin runoff. Int. Arch. Photogramm. Remote Sens. Spat. Inf. Sci. 2014, 40, 181–186. [Google Scholar] [CrossRef]
  52. Kumar, P.A.; Gk, V. Estimation of Runoff by using SCS Curve Number Method Integrated with GIS. Int. Adv. Res. J. Sci. Eng. Technol. 2017, 4, 34–38. [Google Scholar] [CrossRef]
  53. Ling, L.; Yusop, Z.; Yap, W.-S.; Tan, W.L.; Chow, M.F.; Ling, J.L. A calibrated, watershed-specific SCS-CN Method: Application to Wangjiaqiao watershed in the three Gorges Area, China. Water 2020, 12, 60. [Google Scholar] [CrossRef]
  54. Molden, D.; Frenken, K.; de Fraiture, C.; Barker, R.; Svendsen, M.; Sadoff, C.; Finlayson, C. Publication—Trends in Water and Agricultural Development; Earthscan: London, UK, 2007; pp. 57–89, No. January; Available online: https://www.taylorfrancis.com/chapters/edit/10.4324/9781849773799-5/trends-water-agricultural-development-david-molden-karen-frenken-randolph-barker-charlotte-de-fraiture-bancy-mati-mark-svendsen-claudia-sadoff-max-finlayson-sithara-attapatu-mark-giordano-arlene-inocencio-mats-lannerstad-nadia-manning-fran%C3%A7ois-molle-bert-smedema-domitille-vall%C3%A9e (accessed on 26 March 2025).
  55. Pizarro-Tapia, R.; Valdés-Pineda, R.; Olivares, C.; González, P.A. Development of Upstream Data-Input Models to Estimate Downstream Peak Flow in Two Mediterranean River Basins of Chile. Open J. Mod. Hydrol. 2014, 4, 132–143. [Google Scholar] [CrossRef]
  56. Changwony, C.; Sichangi, A.W.; Ngigi, M.M. Using GIS and Remote Sensing in Assessment of Water Scarcity in Nakuru County, Kenya. Adv. Remote Sens. 2017, 06, 88–102. [Google Scholar] [CrossRef]
  57. Al-Weshah, R.A.; Sakarnah, Z.A. Flash Floods Assessment Urban Area: A Case Study Wadi Abdoun Basin, Jordan. Dirasat Hum. Soc. Sci. 2024, 51, 228. [Google Scholar] [CrossRef]
  58. Farooq, U.; Liu, H.; Zhang, Q.; Ma, Y.; Wang, J.; Shen, L. Spatial variability of global lake evaporation regulated by vertical vapor pressure difference. Environ. Res. Lett. 2022, 17, 054006. [Google Scholar] [CrossRef]
  59. Somashekar, R.K.; Ravikumar, P.; Sowmya, S.V.; Dar, M.A.; Ravikumar, A.S. Runoff Estimation and Morphometric Analysis for Hesaraghatta Watershed Using IRS–1D LISS III FCC Satellite Data. J. Indian Soc. Remote Sens. 2011, 39, 95–106. [Google Scholar] [CrossRef]
  60. Goli, Y.S.; Ye, J.; Ye, Y.; Kalgora, B. Impact of Ecological Related Innovations Enhancing the Efficiency of Corporate Environmental Responsibility. Am. J. Ind. Bus. Manag. 2020, 10, 191–217. [Google Scholar] [CrossRef]
  61. Kolekar, S.S.; Mishra, A.; Choudhari, P.; Choudhari, N.R. Identification of specific areas for water conservation measures using Geoinformatics approach. Arab. J. Geosci. 2021, 14, 1–13. [Google Scholar] [CrossRef]
  62. Aklan, M.; Al-Komaim, M.; de Fraiture, C. Site suitability analysis of indigenous rainwater harvesting systems in arid and data-poor environments: A case study of Sana’a Basin, Yemen. Environ. Dev. Sustain. 2023, 25, 8319–8342. [Google Scholar] [CrossRef]
  63. Hillel, D.; Hatfield, J.L. Encyclopedia of Soils in the Environment; Elsevier: Amsterdam, The Netherlands; Academic Press: Cambridge, MA, USA, 2005. [Google Scholar]
  64. Bewket, W.; Stroosnijder, L. Effects of Agroecological Land Use Succession On Soil Properties in Chemoga Watershed, Blue Nile Basin, Ethiopia. Geoderma 2003, 111, 85–98. [Google Scholar] [CrossRef]
  65. Hurni, K.; Zeleke, G.; Kassie, M.; Tegegne, B.; Kassawmar, T.; Teferi, E.; Amdihun, A.; Mekuriaw, A.; Debele, B.; Deichert, G.; et al. Suggested Citation. Available online: https://www.eld-initiative.org/fileadmin/pdf/ELD-ethiopia_i_06_72dpi-D.pdf (accessed on 7 April 2025).
  66. Tebebu, T.Y.; Abiy, A.Z.; Zegeye, A.D.; Dahlke, H.E.; Easton, Z.M.; Tilahun, S.A.; Collick, A.S.; Kidnau, S.; Moges, S.; Dadgari, F.; et al. Surface and subsurface flow effect on permanent gully formation and upland erosion near Lake Tana in the northern highlands of Ethiopia. Hydrol. Earth Syst. Sci. 2010, 14, 2207–2217. [Google Scholar] [CrossRef]
  67. Soleimanpour, S.M.; Soufi, M.; Zolfaghari, M.; Ahmadi, H. Investigation of topographic threshold relations of gully creation in various land use in fars province, Ir Iran. Indian J. Sci. Res. 2014, 3, 362–371. [Google Scholar]
  68. Tetzlaff, D.; Uhlenbrook, S. Hydrology and Earth System Sciences Significance of Spatial Variability in Precipitation for Process-oriented Modelling: Results from Two Nested Catchments Using Radar and Ground Station Data. 2005. Available online: https://www.researchgate.net/publication/296859919_Significance_of_spatial_variability_in_precipitation_for_process-oriented_modelling_results_from_two_nested_catchments_using_radar_and_ground_station_data (accessed on 25 April 2025).
  69. Kabelka, D.; Kincl, D.; Vopravil, J.; Krofta, K.; Kintl, A. Determination of C-factor for conventional cultivation and soil conservation technique used in hop gardens. Open Agric. 2024, 9, 20220301. [Google Scholar] [CrossRef]
  70. Gebremedhn, H.; Gebrewahid, Y.; Hadgu, G.; de Graaf, D.C. Projecting the impacts of climate change on habitat distribution of Varroa destructor in Ethiopia using MaxEnt ecological modeling. Sci. Total Environ. 2025, 968, 178904. [Google Scholar] [CrossRef] [PubMed]
  71. Solgi, A.; Najafi, A.; Ezzati, S.; Ferencik, M. Assessment of ground-based skidding impacts on the horizontally rate and extent of soil disturbance along the margin of the skid trail. Ann. For. Sci. 2016, 73, 513–522. [Google Scholar] [CrossRef]
  72. Shirazi, S.A.; Kazmi, J.H. Analysis of socio-environmental impacts of the loss of urban trees and vegetation in Lahore, Pakistan: A review of public perception. Ecol. Process. 2016, 5, 5. [Google Scholar] [CrossRef]
  73. Mitasova, H.; Barton, M.; Ullah, I.; Hofierka, J.; Harmon, R.S. GIS-Based Soil Erosion Modeling. In Treatise on Geomorphology: Volume 1–14; Elsevier: Amsterdam, The Netherlands, 2013; pp. 228–258. [Google Scholar] [CrossRef]
  74. Leipard, A.R.; Kevern, J.T.; Richardson, J.R. Hydraulic characterization and design of permeable interlocking concrete pavement. In World Environmental and Water Resources Congress 2015: Floods, Droughts, and Ecosystems—Proceedings of the 2015 World Environmental and Water Resources Congress; American Society of Civil Engineers (ASCE): Reston, VA, USA, 2015; pp. 292–301. [Google Scholar] [CrossRef]
  75. Gundalia, M.; Dholakia, M. Impact of Monthly Curve Number on Daily Runoff Estimation for Ozat Catchment in India. Open J. Mod. Hydrol. 2014, 4, 144–155. [Google Scholar] [CrossRef]
  76. Historic, Archive Document: Do Not Assume Content Reflects Current Scientific Knowledge, Policies, or Practices. In The Yearbook of Agriculture; U.S. Government Printing Office, 1972; o-441-067. Available online: https://www.nal.usda.gov/exhibits/speccoll/files/original/59322c0b7c00bdf977b1f91978384f9d.pdf (accessed on 8 May 2025).
  77. Montgomery, D.R.; Dietrich, W.E. Source areas, drainage density, and channel initiation. Water Resour. Res. 1989, 25, 1907–1918. [Google Scholar] [CrossRef]
  78. UN-Water Annual Report. 2008. Available online: https://www.unwater.org/sites/default/files/app/uploads/2017/05/UN-Water_Annual_Report_2008.pdf (accessed on 8 May 2025).
  79. Yimer, E.A.; Yadollahi, S.; Riakhi, F.-E.; Alitane, A.; Weerasinghe, I.; Wirion, C.; Nossent, J.; van Griensven, A. A groundwater level-based filtering to improve the accuracy of locating agricultural tile drain and ditch networks. Int. J. Appl. Earth Obs. Geoinf. 2023, 122, 103423. [Google Scholar] [CrossRef]
  80. Gebrechorkos, S.H.; Taye, M.T.; Birhanu, B.; Solomon, D.; Demissie, T. Future Changes in Climate and Hydroclimate Extremes in East Africa. Earth’s Future 2023, 11, e2022EF003011. [Google Scholar] [CrossRef]
  81. Hassan, H.E.H.; Charbel, L.; Blond, N. L’impact du Terrassement des Versants sur L’érosion Dans le Pourtour Occidental du Plateau du Jord Tannourine-Aaqoura (Liban). Rev. Int. Geomat. 2023, 32, 53–78. [Google Scholar] [CrossRef]
  82. FAO Strategy Climate Change. Available online: http://www.wipo.int/amc/en/mediation/rules (accessed on 26 April 2025).
  83. Salman, Q.M.K.; Hamdan, A.N.A. Runoff Estimation for the Central Region of the Lesser Zab River Watershed Using the SCS-Curve Number Method and GIS. J. Ecol. Eng. 2023, 24, 232–245. [Google Scholar] [CrossRef]
  84. Kebede, A.S.; Nicholls, R.J.; Clarke, D.; Savin, C.; Harrison, P.A. Integrated assessment of the food-water-land-ecosystems nexus in Europe: Implications for sustainability. Sci. Total Environ. 2021, 768, 144461. [Google Scholar] [CrossRef] [PubMed]
  85. Tamene, L.; Adimassu, Z.; Aynekulu, E.; Yaekob, T. Estimating landscape susceptibility to soil erosion using a GIS-based approach in Northern Ethiopia. Int. Soil Water Conserv. Res. 2017, 5, 221–230. [Google Scholar] [CrossRef]
  86. Zhang, Q.; Tao, S.; Walsh, S.J.; Chen, X.; Bilsborrow, R.E.; An, L.; Song, C. Agent-based modeling of the effects of conservation policies on social-ecological feedbacks between cropland abandonment and labor migration. Landsc. Ecol. 2023, 38, 4247–4263. [Google Scholar] [CrossRef]
  87. Dinku, T.; Funk, C.; Peterson, P.; Maidment, R.; Tadesse, T.; Gadain, H.; Ceccato, P. Validation of the CHIRPS satellite rainfall estimates over eastern Africa. Q. J. R. Meteorol. Soc. 2018, 144, 292–312. [Google Scholar] [CrossRef]
  88. GBetrie, G.D.; Mohamed, Y.A.; van Griensven, A.; Srinivasan, R. Sediment management modelling in the Blue Nile Basin using SWAT model. Hydrol. Earth Syst. Sci. 2011, 15, 807–818. [Google Scholar] [CrossRef]
  89. Sharma, B.; Molden, D.; Cook, S.; Graphics, V.; Overview, A.; Waters, M.; Tobergte, D.; Curtis, S.; Tumbo, S.; Mutabazi, K. Measurements and Modelling of Evapotranspiration to Assess Agricultural Water Productivity in Basins with Changing Land Use Patterns: A Case Study in the Sao Francisco River Basin, Brasil; Teixeira, A.H.d.C., Ed.; 2008; Volume 23, Available online: http://www.cpatsa.embrapa.br/public_eletronica/downloads/OPB2046.pdf (accessed on 8 May 2025).
  90. Belayneh, M.; Yirgu, T.; Tsegaye, D. Runoff and soil loss responses of cultivated land managed with graded soil bunds of different ages in the Upper Blue Nile basin, Ethiopia. Ecol. Process. 2020, 9, 66. [Google Scholar] [CrossRef]
  91. Du, X.; Tariq, A.; Islam, F.; Aziz, S.; Waseem, L.A.; Ahmad, M.N.; Amin, M.; Amin, N.U.; Ali, S.; Aslam, M.; et al. Integrated study of GIS and Remote Sensing to identify potential sites for rainwater harvesting structures. Phys. Chem. Earth 2024, 134, 103574. [Google Scholar] [CrossRef]
  92. Euliss, N.H.; Gleason, R.A.; Laubhan, M.; Finocchiaro, R.; Browne, B.A.; Olness, A. Impact of U.S. Department of Interior and U.S. Department of Agriculture Programs on Ecological Services Derived from Restored Prairie Wetlands and Adjacent Grasslands; U.S. Geological Survey Northern Prairie Wildlife Research Center: Jamestown, ND, USA, 2004; p. 18.
  93. Meles, M.B.; Younger, S.E.; Jackson, C.R.; Du, E.; Drover, D. Wetness index based on landscape position and topography (WILT): Modifying TWI to reflect landscape position. J. Environ. Manag. 2020, 255, 109863. [Google Scholar] [CrossRef]
  94. Teshome, D.S.; Tolessa, T.; Gemeda, D.O.; Taddese, H.; You, S. Impact of land use/land cover (LU/LC) changes on ecosystem service values in Muger Sub-basin, Upper Blue Nile Basin, Ethiopia. Environ. Chall. 2024, 17, 101041. [Google Scholar] [CrossRef]
  95. Chisanga, C.B.; Mubanga, K.H.; Sichigabula, H.; Banda, K.; Muchanga, M.; Ncube, L.; van Niekerk, H.J.; Zhao, B.; Mkonde, A.A.; Rasmeni, S.K. Modelling climatic trends for the Zambezi and Orange River Basins: Implications on water security. J. Water Clim. Chang. 2022, 13, 1275–1296. [Google Scholar] [CrossRef]
  96. Ahmed, F.; Neelin, J.D.; Hill, S.A.; Schiro, K.A.; Su, H. A Process Model for ITCZ Narrowing under Warming Highlights Clear-Sky Water Vapor Feedbacks and Gross Moist Stability Changes in AMIP Models. J. Clim. 2023, 36, 4913–4931. [Google Scholar] [CrossRef]
  97. Barbosa, S.A.; Pulla, S.T.; Williams, G.P.; Jones, N.L.; Mamane, B.; Sanchez, J.L. Correction: Evaluating Groundwater Storage Change and Recharge Using GRACE Data: A Case Study of Aquifers in Niger, West Africa. Remote Sens. 2022, 14, 1532. [Google Scholar] [CrossRef]
  98. Azeze, A.W.; Wubalem, A. Landslide Factor Optimization for Landslide Susceptibility Modeling. Available online: https://www.researchgate.net/publication/387218658 (accessed on 8 May 2025).
  99. Tufa, A.H.; Kanyamuka, J.S.; Alene, A.; Ngoma, H.; Marenya, P.P.; Thierfelder, C.; Banda, H.; Chikoye, D. Analysis of adoption of conservation agriculture practices in southern Africa: Mixed-methods approach. Front. Sustain. Food Syst. 2023, 7, 1151876. [Google Scholar] [CrossRef]
  100. Mekonnen, A.; Tessema, A.; Ganewo, Z.; Haile, A. Climate change impacts on household food security and farmers adaptation strategies. J. Agric. Food Res. 2021, 6, 100197. [Google Scholar] [CrossRef]
  101. Ali, A.; Teku, D.; Sisay, T.; Mihret, B. Geospatial modeling of landslide susceptibility in Debek, South Wollo, Ethiopia: Comparative analysis of frequency ratio and analytical hierarchy process models for geohazards management. Front. Earth Sci. 2025, 13, 1557860. [Google Scholar] [CrossRef]
  102. Dile, Y.T.; Berndtsson, R.; Setegn, S.G.; Añel, J.A. Hydrological Response to Climate Change for Gilgel Abay River, in the Lake Tana Basin—Upper Blue Nile Basin of Ethiopia. PLoS ONE 2013, 8, e79296. [Google Scholar] [CrossRef]
  103. Gowing, J.; Payton, R.W. Integrating Indigenous and Scientific Knowledge on Soils: Recent Experiences in Uganda and Tanzania and Their Relevance to Participatory Land Use Planning Moses Tenywa Agricultural Innovation Systems Brokerage Association AGINSBA. 2004. Available online: https://www.researchgate.net/publication/267703517 (accessed on 25 March 2025).
  104. Twinomucunguzi, F.R.B.; Silvestri, G.; Kinobe, J.; Mugabi, A.; Isoke, J.; Nyenje, P.M.; Foppen, J.W.; Kulabako, R.N.; Kansiime, F. Socio-institutional drivers of groundwater contamination hazards: The case of on-site sanitation in the bwaise informal settlement, Kampala, Uganda. Water 2021, 13, 2153. [Google Scholar] [CrossRef]
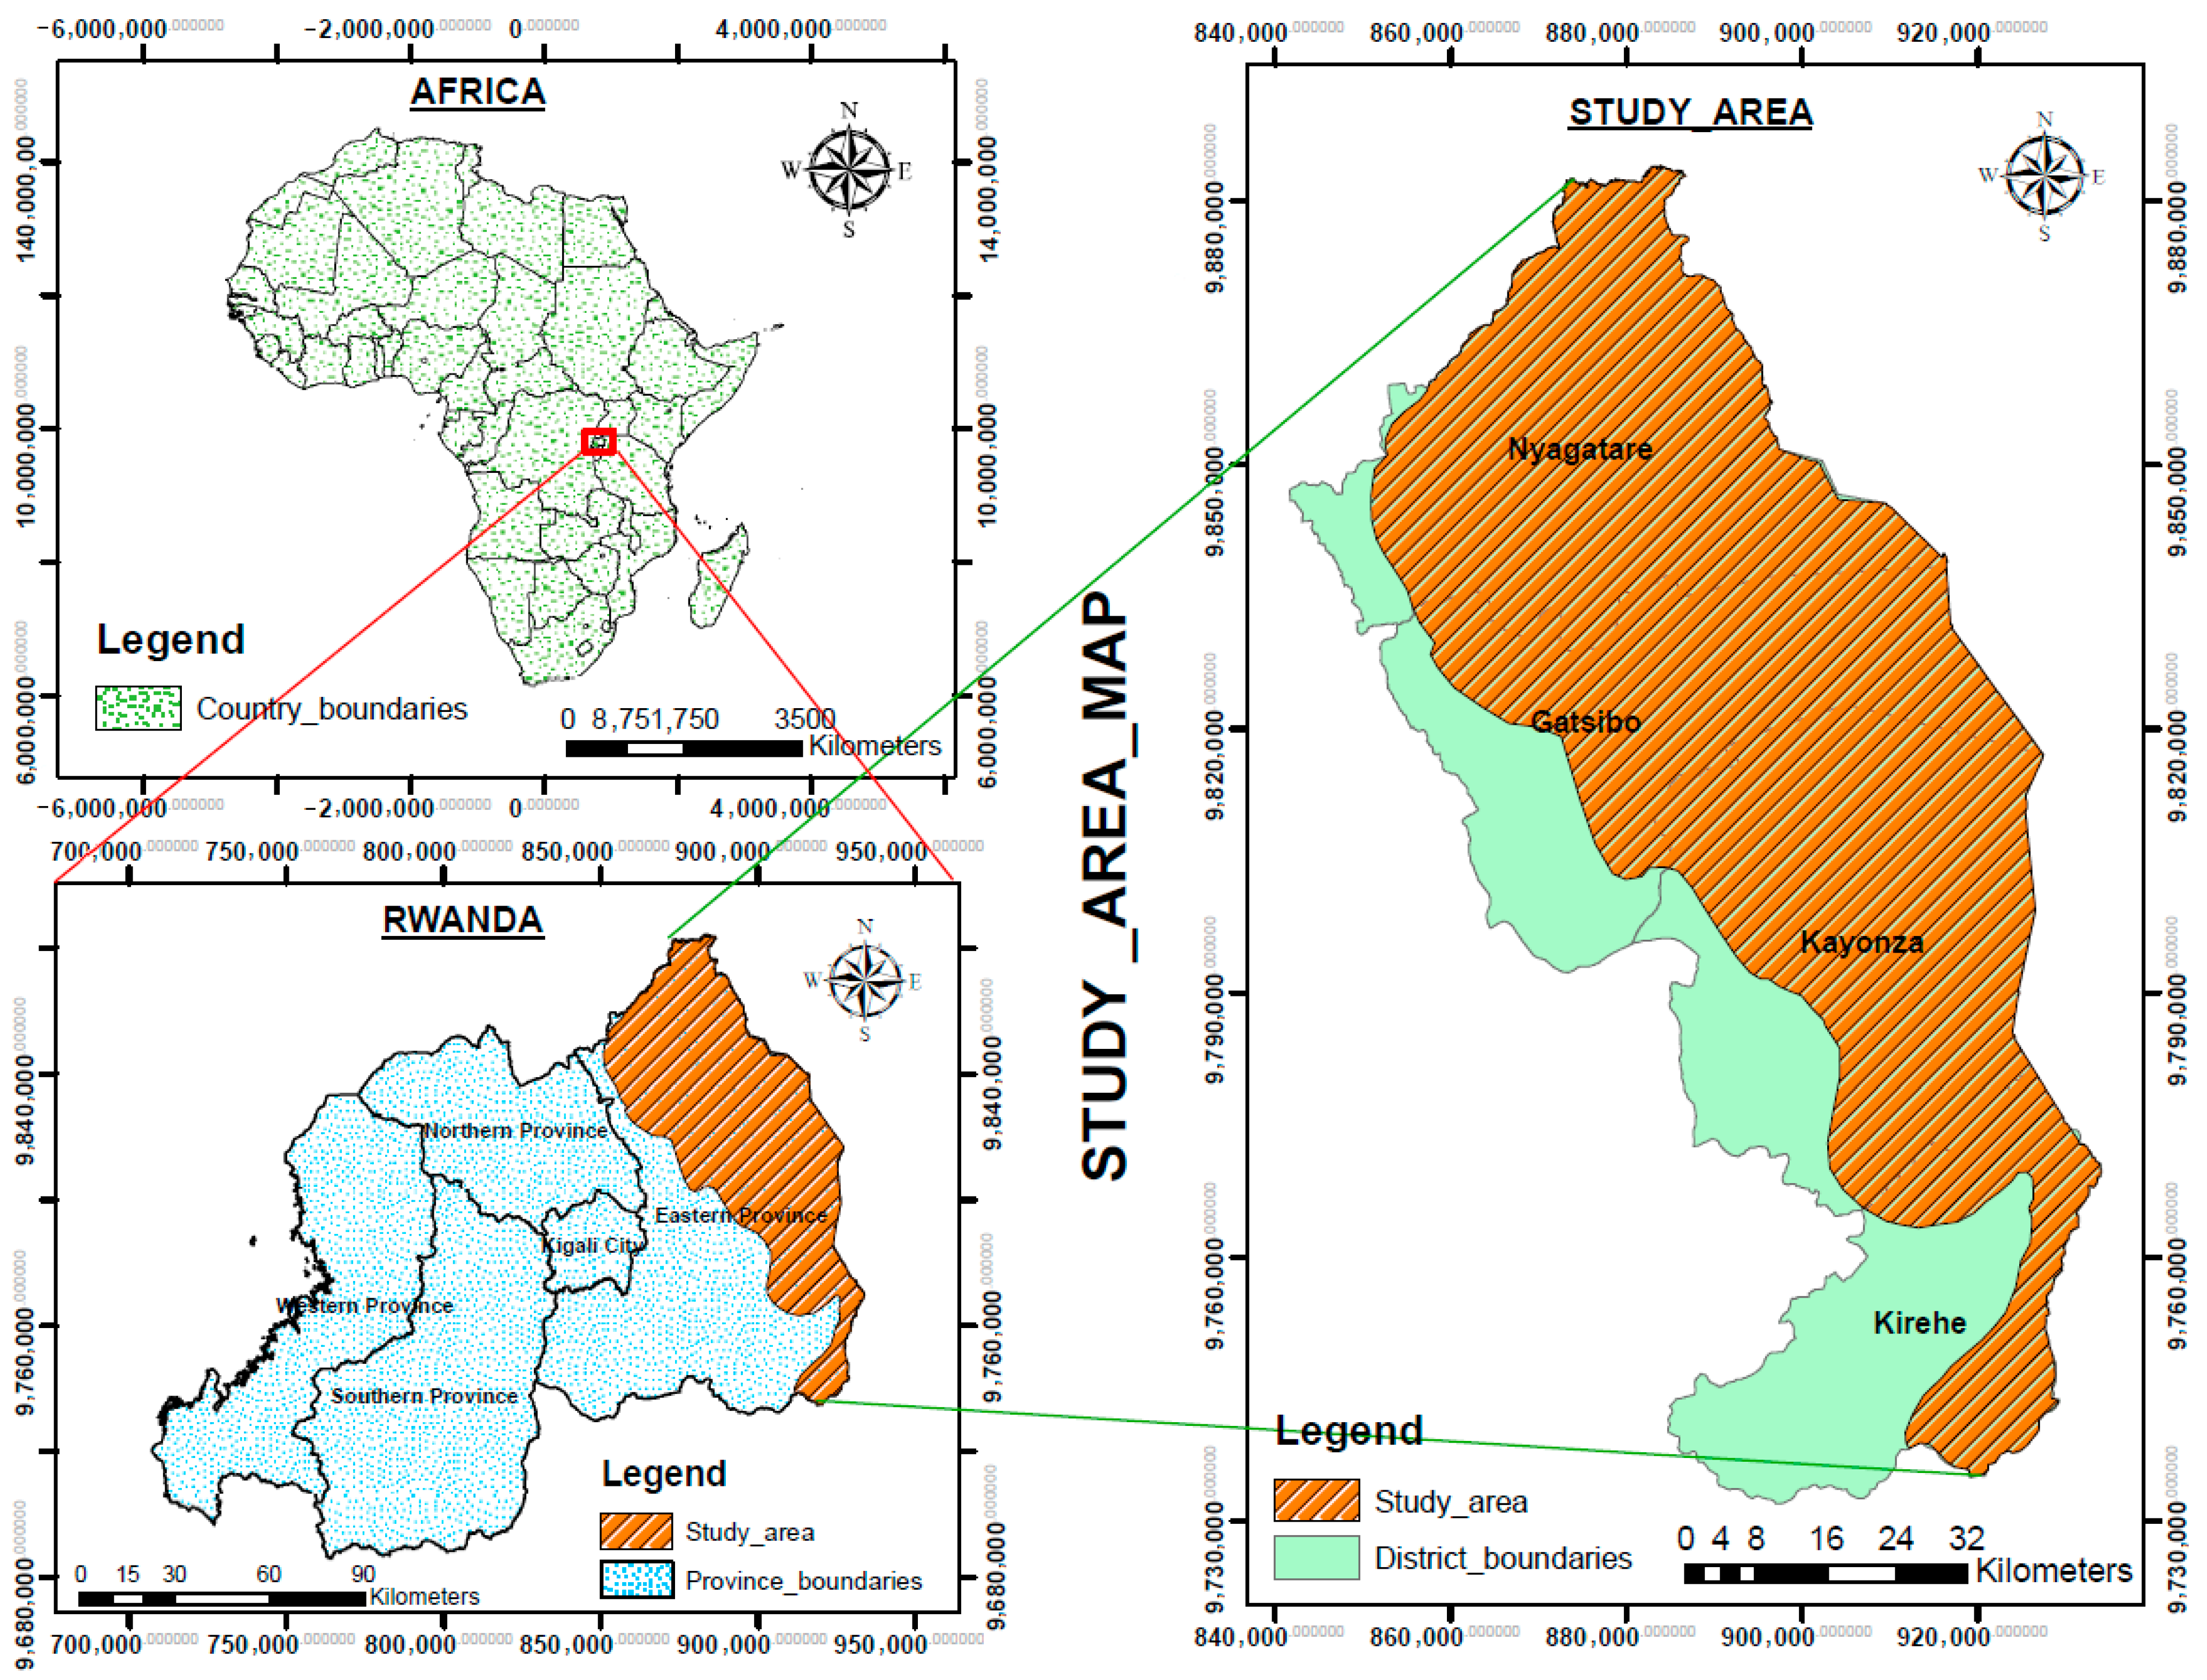
Figure 1. Eastern Savanna Agroecological Zone.
Water 17 02045 g001
Figure 2. Summarized method used.
Water 17 02045 g002
Figure 3. Average precipitation for 20 stations in ESAEZ (Source: Rwanda Meteorological Agency).
Water 17 02045 g003
Figure 4. Study area characteristics: (a) DEM, (b) terrain slope.
Water 17 02045 g004
Figure 5. Study area characteristics: (a) rainfall (mm), (b) land use and land cover.
Water 17 02045 g005
Figure 6. Soil characteristics in Rwandan Eastern Savanna agroecological Zone; (a) soil texture and (b) hydrologic Soil Group.
Water 17 02045 g006
Figure 7. Study area characteristics: (a) curve numbers, (b) potential maximum retention.
Water 17 02045 g007
Figure 8. Study area runoff characteristics: (a) study area stream network levels, (b) drainage density.
Water 17 02045 g008
Figure 9. The 8 main water reservoirs and percolation tanks.
Water 17 02045 g009
Table 1. Source of data.
NoPrimary DataSpatial ResolutionFormatSourceMap Derived
1Digital Elevation Model10 mRasterRwanda Land Management AuthoritySlope, watershed, Drainage density, stream network
2Land Use Land Cover90 mRasterRwanda Land Management AuthorityLand Use Land Cover map
3Rainfall Data-Point source dataRwanda Meteorological AgencyRainfall map
4Rwanda Soil Map5 × 5 Arc minutesVectorDigital Soil Map of the World
(https://www.fao.org/soils-portal/data-hub/soil-maps-and-databases/faounesco-soil-map-of-the-world/en/ (accessed on 25 February 2025)
Soil texture and HSG maps
Table 2. Weighted overlay analysis integrating the key features [61].
Thematic LayerFeature ClassRangeWeightRank for Surface Water StorageRank for Groundwater Recharge
Runoff coefficient>0.40Very high6015
0.40–0.30High24
0.30–0.20Moderate33
<0.20Low42
Slope0–3%Nearly level40110
3–5%Gentle29
5–10%Moderately gentle48
10–15%Steep66
15–20%Moderately steep84
>20%Very steep102
Table 3. Key criteria for evaluating ideal locations for stormwater harvesting structures and relative importance [62].
Check DamFarm PondPercolation PondContour BundingContour Trenching
Land slope: <15%Land slope:
<5%
Land slope:
<10%
Land slope:
<6%
Land slope:
10–25%
Soil: fine-textured soilSoil: fine-textured soilSoil: light-textured soilSoil: light/medium-textured soilSuitable sites: hilly areas
Drainage order: 1–4Drainage order: 1–4Drainage order:
1–4
Rainfall: <800 mmRainfall: <800 mm
Table 5. Main water harvesting structures and their locations.
DescriptionXYVolume (10 Million m3)
W_R1563441448519570.242
W_R2552905648716178.51
W_R3537817148748827.38
W_R4533740448547652
W_R5560529948323447.94
W_R6554288148148661.91
W_R7569773448138175.88
W_R8593726447794051.88
Table 6. Slope–Risk matrix that summarizes the relationship between slope classes, runoff potential, erosion risk, land suitability, and recommended conservation practices.
Slope Class (%)DescriptionRunoff PotentialErosion RiskLand SuitabilityRecommended Conservation PracticesSources
0–5Nearly flatLow–ModerateLow (Waterlogging risk)Suitable for agriculture, infrastructureSubsurface drainage, raised beds, controlled traffic farming[4,83]
5.01–10Gently slopingModerateLow–ModerateIdeal for rainfed croppingCover crops, mulching, and conservation tillage[84]
10.01–15Moderately steepModerate–HighModerateConditional for agriculture (with management)Strip cropping, agroforestry, and contour farming[85]
15.01–20SteepHighHighMarginal for agricultureBench terracing, stone bunds, grass strips, check dams[86]
>20Very steepVery HighVery HighUnsuitable for agricultureExclusion from cultivation, afforestation, and natural regeneration[5,9]
Disclaimer/Publisher’s Note: The statements, opinions and data contained in all publications are solely those of the individual author(s) and contributor(s) and not of MDPI and/or the editor(s). MDPI and/or the editor(s) disclaim responsibility for any injury to people or property resulting from any ideas, methods, instructions or products referred to in the content.