Article

Forecasting Channel Morphodynamics in the Ulken Almaty River (Ile Alatau, Kazakhstan)

by
Ainur Mussina
1,
Marzhan Tursyngali
1,*,
Kassym Duskayev
1,
Javier Rodrigo-Ilarri
2,
María-Elena Rodrigo-Clavero
2,* and
Assel Abdullayeva
1
1
Department of Meteorology and Hydrology, Al-Farabi Kazakh National University, Almaty 050040, Kazakhstan
2
Instituto de Ingeniería del Agua y del Medio Ambiente (IIAMA), Universitat Politècnica de València, 46022 Valencia, Spain
*
Authors to whom correspondence should be addressed.
Water 2025, 17(13), 2029; https://doi.org/10.3390/w17132029
Submission received: 19 May 2025 / Revised: 24 June 2025 / Accepted: 4 July 2025 / Published: 6 July 2025
(This article belongs to the Section Water Erosion and Sediment Transport)

Abstract

This article focuses on forecasting morphological changes in small rivers, using the Ulken Almaty River, located on the northern slope of the Ile Alatau range in the Tien Shan mountain system, as a case study. One of the key components of river morphology is the dynamics of channel processes, including erosion, accretion, and the shifting of channel forms. Understanding these processes in rivers flowing through urbanized areas is essential for mitigating environmental and infrastructural risks. Despite their importance, studies of this nature in Kazakhstan remain at a formative stage and are largely fragmentary, underscoring the need for modern approaches to river morphology analysis. Three representative sections of the Ulken Almaty River (upstream, midstream, and downstream) were selected for analysis. Satellite imagery from 2012 to 2021 was used for manual digitisation of river channel outlines. Annual erosion and accretion areas were calculated based on these data. The DSAS 5.1 module, integrated into ArcGIS 10.8.1, was applied to determine the rates of erosion and accretion over the ten-year period. To forecast future channel changes, the Kalman filter model was employed, enabling projections for 10 and 20 years into the future. A comparative analysis of the intensity of the erosion and accretion processes was conducted for each river section. Spatial and temporal variations in bank dynamics were identified, with the most significant changes occurring in the middle and lower reaches. Forecasted scenarios indicate the possible deformation pathways of the river channel influenced by both natural and anthropogenic factors. The results provide valuable insights into the spatiotemporal dynamics of fluvial processes in small mountain rivers under the pressure of urban development and climatic variability. The methodology employed in this study offers practical applications for urban planning, river management, and the mitigation of geomorphological hazards.

1. Introduction

Small rivers play a crucial role in the water balance and ecosystem functioning, providing water supply, supporting biological diversity, and regulating hydrological processes. However, changes in their morphostructure—driven by anthropogenic impacts, climate change, and natural processes—can significantly affect ecosystem stability and water quality. In this context, forecasting changes in the morphostructures of small rivers has become an important task for effective water resource management and the development of environmental protection strategies.
The morphostructure of small rivers is characterised by a diversity of features and processes, including meanders, floodplains, and channel dynamics. These are shaped by both internal (geological, geomorphological) and external (climatic, hydrological, and anthropogenic) factors. Predicting changes in these structures enables the identification of potential pathways of river evolution and the assessment of risks related to flooding, erosion, and ecosystem degradation.
In hydrological and morphological theory, the continuous alteration of the riverbed and floodplain morphology under the influence of flowing water constitutes the essence of the channel process [1]. This process is inherently complex and multifactorial. The primary drivers of channel dynamics are the liquid and solid components of the water flow. Forecasting these processes is often associated with significant methodological challenges and typically requires considerable labour input. A scientifically robust prediction of channel deformation necessitates a sound understanding of meander development under natural conditions, the rates at which these deformations occur, and the underlying causes of their initiation [2]. The pace of riverbed reshaping is determined by the hydraulic characteristics of the flow and the resistance of the soil to erosion. Deformation rates are quantified by measuring the spatial displacement of the riverbed and its elements over a specific time interval (expressed in m/year). The rate and localisation of bank erosion are influenced by bank morphology, geological structure, and the morphodynamic type of the river channel [3].
The study of the morphology of small rivers is a relevant and multifaceted task. In Kazakhstan, such research is in its infancy and is fragmentary in nature. Further development of riverbed topics requires the introduction of modern monitoring and modelling methods. Along with the use of monitoring data, GIS technologies, and remote sensing, an important direction is the integration of numerical and physical modelling of riverbed processes—in particular, hydraulic characteristics and sediment transport. This will allow for more accurate predictions of the morphodynamic changes in riverbeds under the influence of anthropogenic and climatic factors.
In Kazakhstan, research on the morphological structure of rivers is still in the early stages of development. Among the pioneering works in this field are those by Zhandaev [4,5,6,7,8,9], who investigated regressive erosion and the capture of headwaters in the rivers of the Ile Alatau. His studies laid the foundation for subsequent investigations into channel dynamics in the mountainous regions of Kazakhstan.
A significant contribution to the study of channel processes was made by Abdrasilov, who focused on the formation of inland deltas, particularly the Ile River delta [10,11]. His research examined the impact of anthropogenic factors on channel stability—an issue of growing importance in the context of climate change and the increasing exploitation of water resources. The topic of channel stability and the influence of hydraulic structures on river morphological processes was also addressed in collaboration with Burlibayev [12].
Chigrinets and Duskayev analysed the characteristics of sediment transport in the Ili and Zhetisu Alatau river basins, highlighting its importance for assessing the intensity of erosion processes. Their work contributes significantly to the understanding of how erosion affects both hydrological regimes and the ecological characteristics of mountain rivers in the region [13,14,15,16].
Erosion and sediment accumulation processes were studied by Dostay, who advanced the understanding of mechanisms governing the morphological evolution of river channels [17].
A valuable addition to the field was provided by Golubtsov, who investigated the morphodynamics of small rivers in Kazakhstan, including patterns of channel deformation under anthropogenic influence [18,19].
Remote sensing and laser scanning methods are increasingly applied in Kazakhstan for monitoring river channel changes. For instance, Khalykov employed terrestrial laser scanning to study gully erosion in mountainous areas, identifying key factors contributing to channel degradation and bank erosion [20,21,22]. The formation of channel barriers of both anthropogenic and natural origin in the Bukhtyrma River basin has also been analysed using GIS and remote sensing technologies [23], representing an important aspect of channel transformation in mountainous terrain.
Extensive studies in the Commonwealth of Independent States (CIS) have further enriched the field of river morphology. A pioneer in riverbed science, Velikanov developed the concept of dynamic channel flows, treating rivers as self-regulating “stream–channel” systems [24,25,26,27].
In the CIS context, Makkaveev made a foundational contribution through the development of the concept of channel morphodynamics and river channel stability. His research established a theoretical basis for analysing channel processes, including the role of hydrodynamic forces in shaping channel evolution [28,29,30,31,32].
The study of channel processes, river morphodynamics, and hydraulic structures was further advanced by Mirtskhulava [33,34], whose work contributed to the theory of channel stability and channel formation mechanics, particularly in mountain rivers. His research is closely linked to methods for predicting changes in channel systems and assessing their stability, which are essential for hydropower development, land reclamation, and water resource protection.
Chalov systematized channel processes and introduced a typological classification of river morphodynamics. His contributions were instrumental in improving the understanding of small river channel stability [35,36,37,38]. A specific study on the dynamics and stability of small mountain rivers in the Ile Alatau region—under local natural and climatic conditions—was presented by Kuznetsov under Chalov’s supervision [39,40]. Their findings enabled a more nuanced consideration of the geographical and climatic features in channel process analysis.
Research by Druzhinin refined the parameters used to determine flow velocity and facilitated the calculation of cross-sectional characteristics in mountain rivers. He is also developing a method for predicting flow depth based on the hydromorphometric properties of mountain streams [41].
Grishanin contributed to the development of channel change prediction methods by proposing quantitative techniques for analysing channel deformation [42,43], while Baryshnikov focused on the morphodynamic characteristics of rivers, examining the influence of both natural and anthropogenic factors on channel stability [2,44].
International research on river morphology encompasses a wide range of topics, from fluvial geomorphology to the prediction of channel form evolution. Foundational studies by Lane (1954) and Leopold and Wolman (1957) established key principles for understanding channel processes and morphology [45,46].
A landmark contribution by Montgomery and Buffington (1997) introduced a classification of mountain river channels based on morphological characteristics [47]. Chin (1999) examined step–pool structures in mountain streams, offering insights into channel stability under steep-gradient conditions [48].
Recent studies actively employ remote sensing methods and GIS technologies, utilizing high-resolution satellite imagery and numerical modelling to accurately monitor the spatiotemporal dynamics of channel processes. A number of studies are devoted to the automated analysis of bank migration and the prediction of erosion processes. The application of the DSAS (Digital Shoreline Analysis System) tool has proven to be an effective means for the quantitative assessment of shoreline dynamics, including river channels [49,50,51,52,53,54,55,56,57,58,59]. The DSAS methodology enables the calculation of bank migration rates, channel width, and zones of accretion and erosion, ensuring data comparability across different temporal intervals. These techniques can be adapted for studying the channel processes of small rivers in the Ile Alatau range.
The study of small river morphology is a pressing and multidimensional task. In Kazakhstan, research in this area remains at a developmental stage and is largely fragmented. A comprehensive understanding of channel processes requires the integration of modern monitoring and modelling techniques. Research experience from CIS countries and international studies has demonstrated that combining field observations, GIS-based modelling, and remote sensing provides the most accurate means of assessing the dynamics of channel processes and predicting morphological changes under anthropogenic and climatic influences.
The objective of this study is to forecast changes in the morphological structure of small rivers, using the Ulken Almaty River—located on the northern slope of the Ile Alatau range—as a case study. The research focuses on analysing the spatial and temporal dynamics of channel processes, identifying the relationship between erosion intensity and both channel-forming and full-channel water discharges, and evaluating the potential risks associated with bank erosion, channel deformation, and the formation of channel barriers.
The results of this study are intended to support the development of effective water management strategies, reduce the impact of anthropogenic pressures on river systems, and mitigate risks to urban infrastructure. Furthermore, the findings can be applied to monitor riverine changes associated with urban expansion, inform the planning of engineering protection works, and guide the implementation of preventive measures to counteract the adverse effects of channel processes under evolving climatic conditions.

2. Materials and Methods

2.1. Study Area

The Ile Alatau is one of the most water-abundant regions of Kazakhstan, characterised by a densely branched river network and a high density of watercourses [60,61]. The hydrographic network of the Ile Alatau primarily belongs to the Ile River basin. This region presents a sharp contrast in landscape: arid, drought-prone plains lie in close proximity to humid, mountainous terrains. Rivers play a central role in the region’s hydrography, exhibiting the typical features of mountain watercourses—rapid flow velocities and intense erosional activity. Despite the relatively modest widths of most riverbeds, their valleys often form expansive canyons, with depths reaching 800–1000 m.
River segments are conventionally divided into upper, middle, and lower reaches based on water yield, terrain orography, flow velocity, anthropogenic usage, and the morphometric characteristics of the watercourse itself. The upstream reach is distinguished by steep gradients, high flow velocities, shallow depths, and intense processes of scour and sediment transport. In the midstream section, the channel becomes wider due to the inflow from major tributaries, resulting in increased discharge. At the same time, the slope and flow velocity decrease, leading to a reduction in scouring capacity. In the downstream reach, scouring processes diminish significantly, the gradient becomes minimal, and further widening of the channel occurs. As the slope continues to decrease, sediment deposition intensifies, contributing to the formation of a broad delta [62,63].
The basin of the Ulken Almaty River (Figure 1) has been delineated according to elevation and hydromorphometric parameters, defining the upper reach as ≥2500 m a.s.l., the midstream as 1000–2500 m a.s.l., and the downstream as ≤1000 m a.s.l. All analyses and results in this study are referenced to this morphodynamic zonation.
Based on the source characteristics and type of hydrological feeding, the rivers of the Ile Alatau can be classified into three categories: high-mountain glacial, mid-mountain, and seasonal. The Ulken Almaty River is the largest glacially fed river in the region; however, atmospheric precipitation and groundwater contributions also play important roles in sustaining its flow. Ulken Almaty is a second-order tributary of the Ile River and a first-order tributary of the Kaskelen River. It is one of the major high-discharge rivers within the administrative boundaries of the city of Almaty.
The total length of the Ulken Almaty River is 96 km. The watershed area at the mountain outlet is approximately 280 km2, while the total watershed area at its confluence with the Kaskelen River reaches 425 km2. The average weighted elevation of the watershed at the mountain outlet is about 3000 m, with the highest elevations in the upper reaches ranging from 4200 to 4300 m [64].
The Ulken Almaty River exhibits a bimodal flow regime, characterised by a spring flood and a prolonged summer flood. The latter, driven by active glacial melt, typically occurs rapidly in mid-summer. Consequently, flood events in this river persist over an extended period—from April through the end of August [65].
According to hydrological data [60], the long-term average discharge at the station “Ulken Almaty—1.1 km above Ulken Almaty Lake” is 1.72 m3/s, while at the station “Ulken Almaty—2 km below the mouth of the Terisbutak stream,” it reaches 5.50 m3/s. The recorded maximum discharges at these stations are 9.38 m3/s and 23.8 m3/s, respectively. Under extreme mudflow conditions, peak discharges can reach up to 10,000 m3/s [66,67].

2.2. Data and Software
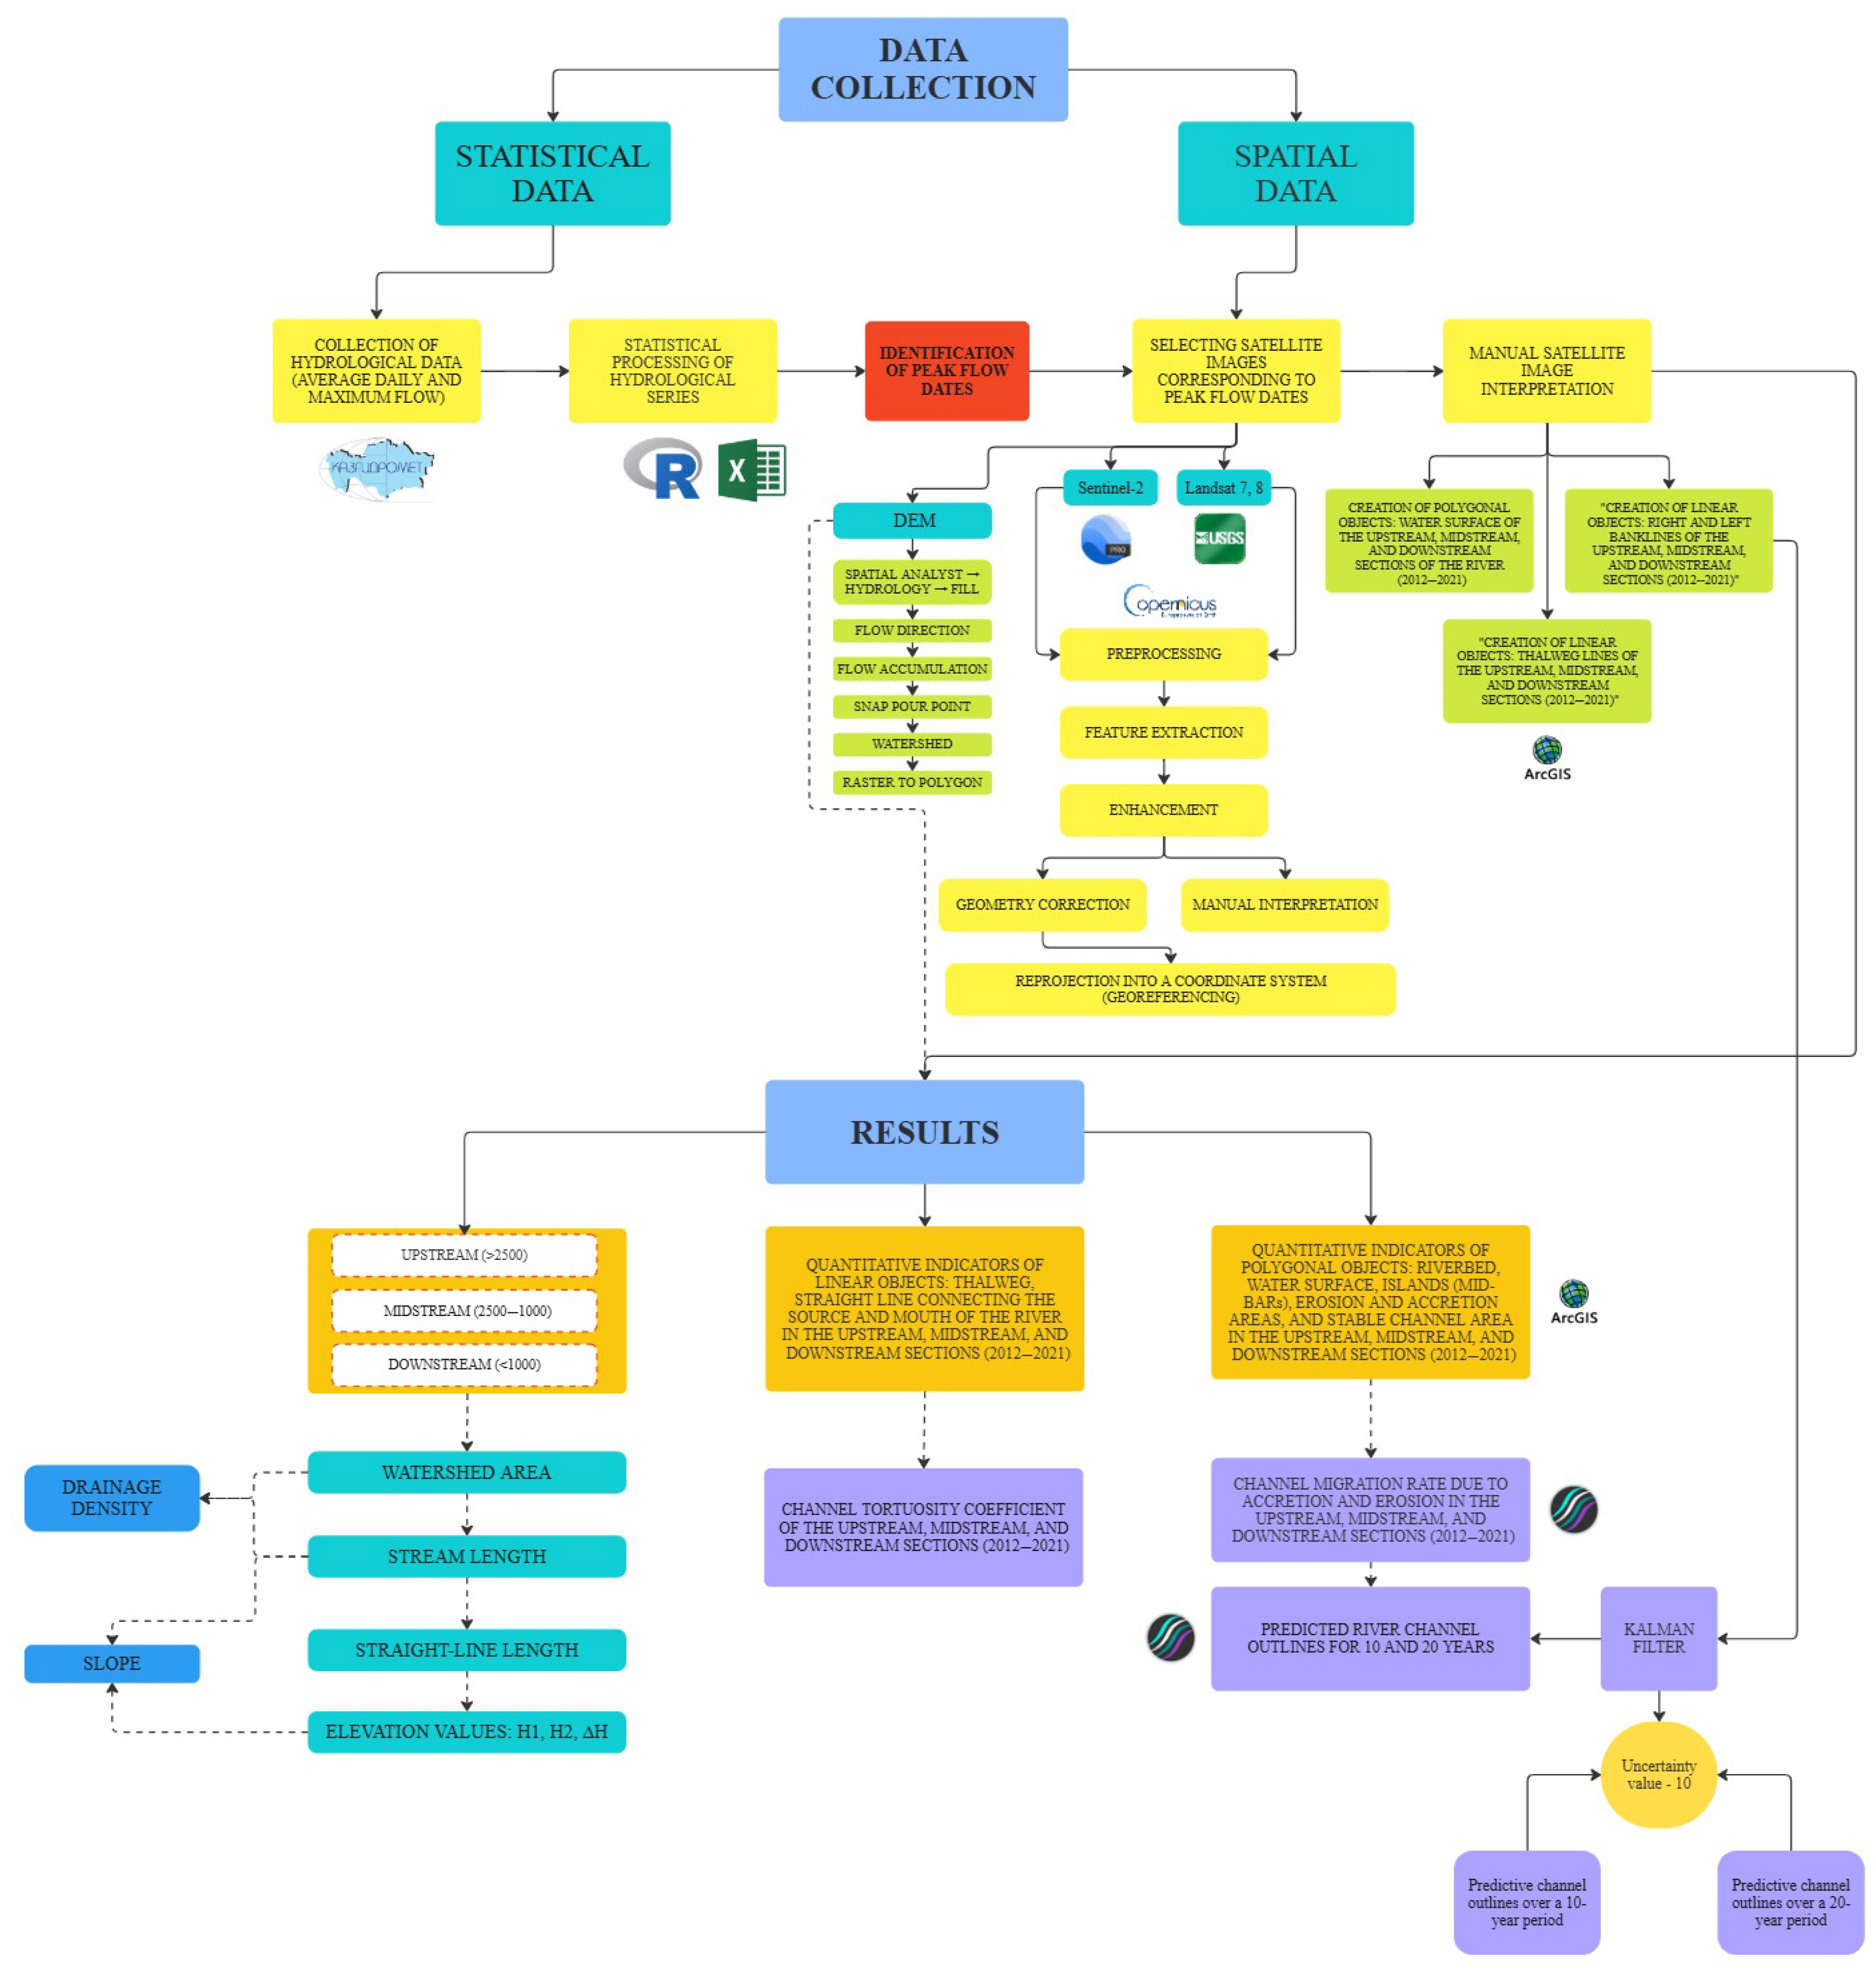
The study involved the collection and analysis of both statistical and spatial data. Hydrological data—including average daily and maximum daily water discharge values for the period 2012–2021 at the hydrological station “Ulken Almaty River—1.1 km above Ulken Almaty Lake”—were obtained from the open-access database of Kazhydromet (https://kazhydromet.kz/en/meteo_db (accessed on 5 June 2025)). This hydrological database has been publicly available since January 2023 and provides downloadable statistical data in various formats across different time intervals.
Spatial data, specifically remote sensing (RS) and satellite imagery, were sourced from multiple global open-access platforms. Satellite images from Sentinel-2 (10 m resolution), Landsat 7, and Landsat 8 (30 m resolution) were retrieved from the Copernicus Open Access Hub [68], the USGS Earth Explorer [69], and archived imagery available through the Google Earth Pro application [56,70,71,72].
A range of software tools was used to process these datasets, enabling the forecasting of river channel outlines and the extraction of the morphometric characteristics of both the riverbed and the riparian zone within the river basin.
In this study, R Studio 2022.12.0+353 was used to analyse the hydrological data series, assess the statistical characteristics of water discharge, and identify patterns of its variation. This software enables trend analysis, the construction of probability curves for water flow, and the determination of extreme discharge values, which is essential for understanding the dynamics of channel processes. R Studio is an integrated environment for working with the R programming language, designed for statistical analysis, data processing, and graph creation. It allows researchers in various fields to automate complex calculations, apply machine learning methods, and visualize the results of their analysis.
Figure 2 shows the flowchart for predicting river channel dynamics used in this study.
As part of the study on the changes in the morphological structure of small rivers in the Ile Alatau, the MS Excel spreadsheet editor was used for processing and analysing the hydrological series, as well as for identifying peak water discharge values by constructing water discharge hydrographs over the selected period. It allows for data systematization, statistical processing, and the visual representation of results in the form of graphs and charts. With its powerful tools for working with tables, formulas, statistical calculations, and data visualization, it enables effective information structuring and the identification of regularities.
High-resolution imagery was essential for identifying long-term channel deformations, the erosion and deposition of banks, and changes in the morphometric characteristics of small rivers. Google Earth Pro 7.3.6 serves as a valuable data source, providing easy access to imagery with resolutions ranging from 0.3 m to 1 m. Google Earth Pro 7.3.6 is designed for the analysis and visualization of spatial data based on satellite imagery and three-dimensional terrain models. It is widely used in scientific research, environmental monitoring, and spatial planning, enabling the tracking of landscape and object changes over time.
In the context of studying changes in the morphological structure of small rivers, ArcGIS 10.8 software provides a wide range of tools for spatial analysis and statistics, modelling channel processes, and visualizing the obtained results. As an effective tool for analysing and assessing water resources and hydrological processes, as well as for making timely and informed management decisions, ArcGIS 10.8 allows for modelling hydrological processes, analysing watersheds, and identifying potential areas of degradation and bank line expansion. The application of geospatial analysis methods facilitates a detailed study of changes in the hydrographic network and the assessment of the impact of climatic and anthropogenic factors. It contributes to improving management and efficiency across various sectors.
A specialised extension to ArcGIS developed by the United States Geological Survey (USGS) Digital Shoreline Analysis System (DSAS 5.1) is also used to assess retrospective dynamics and predict future shoreline changes. This tool is used in studies of hydrological and geomorphological processes, allowing automated calculation of indicators of shoreline change based on time-series data. The main functions of DSAS 5.1 allow the determination of key parameters of shoreline dynamics, such as absolute shoreline change between two dates (Net Shoreline Movement (NSM)), identification of the rate of shoreline change based on two time points (End Point Rate (EPR)), identification of the average rate of shoreline change calculated using Linear Regression Rate (LRR), and a more accurate version of LRR that takes into account data errors (Weight Linear Regression Rate (WLR)) and the range of shoreline change over the whole period analysed (Shoreline Change Envelope (SCE)).
The Kalman filter method, integrated into DSAS 5.1, allows the modelling of shoreline change based on trends in past shoreline change values. Although DSAS was originally developed to analyse the shorelines of seas and oceans, it is now actively used to study river channel dynamics, allowing the assessment of erosion and accumulation processes and bank migration and predicting changes in the river network.
For a more complete and detailed description of the DSAS process, reference can be made to [73]. The DSAS 5.1 method is widely used and has been validated for analysing shoreline dynamics, including riverbanks and inland water bodies. In particular, ref. [58] demonstrated its effectiveness in studying riverbank changes over various time periods ranging from 10 to 50 years. Moreover, refs. [52,57,59] confirmed the reliability of the DSAS method by comparing its calculations with a similar tool in a GIS environment, which supports its applicability under diverse geomorphological conditions.

2.3. Methods

The formation of river channel morphology is determined by the interaction between flowing water and channel sediments, with the intensity of this interaction largely dependent on the volume and frequency of water discharge. In this context, channel-forming and full-channel discharges play a fundamental role, serving as triggers for changes in riverbank alignment and channel morphology [28,74,75,76,77,78,79,80].
Channel-forming water discharge (Qform) refers to the volume of water at which the most significant changes in the riverbed are observed, including sediment transport, bank erosion, and the redistribution of channel forms. As noted by Makkaveev, various methods based on the statistical analysis of hydrological data and discharge distribution curves are used to determine Qform. This parameter serves as a key indicator of channel transformations and plays a crucial role in modelling the morphodynamics of rivers.
The full-channel water discharge (Qfull) is defined as the volume of water that fills the channel up to the level of its banks. This is often used as an alternative to Qform, especially in cases where hydrological information is limited. In this study, average annual discharge values were taken as the full-channel water discharge Qfull.
The annual distribution of discharge in mountain rivers is notably uneven. The Ulken Almaty River basin experiences a pronounced summer flood regime, typical of rivers with a mean watershed elevation (Have) exceeding 3000 m. The majority of annual runoff (approximately 70–75%) occurs during the flood season, which spans from May to September and peaks in July due to intense snowmelt and glacier runoff. Discharge during the spring transition period (March–April) accounts for 5–10% of the annual total [64,81]. Winter flows, observed from October through February, contribute an average of 20–25% of the total annual discharge, depending on the hydrological conditions of a given year. This intra-annual discharge variability significantly influences erosion processes, which are most active during the warmer months. Elevated flow levels intensify channel deformation, particularly bank erosion, as water velocity and hydraulic forces increase [23].
An analysis of discharge data from the hydrological station “Ulken Almaty River—1.1 km above Ulken Almaty Lake” for the 10-year period 2012–2021 enabled the identification of peak discharge dates. Maximum discharge values were determined through hydrograph construction, employing temporal analysis and statistical filtering techniques. Corresponding satellite imagery was selected for spatial analysis based on the timing of peak discharge events (see Table 1). Remote sensing (RS) data underwent standard preprocessing procedures, including geometric correction, coordinate system alignment, and image quality enhancement.
The spatial analysis process involves several stages, beginning with the preprocessing of remote sensing data (RS). This stage included geometric correction and the overlay of the coordinate grid (georeferencing). Data from global and regional sources such as ALOS PALSAR (Advanced Land Observing Satellite Phased Array type L-band Synthetic Aperture Radar) were used to construct the DEM. The data were acquired in GeoTIFF format with a spatial resolution of 12.5 m. Prior to analysis, the raw DEM data underwent standard preprocessing steps in ArcGIS 10.8, such as merging multiple DEM fragments (mosaic) and extracting the study area based on watershed boundaries. Additional procedures included filtering and removing artifacts (such as noise and outliers resulting from data interpolation) and transforming the data to the appropriate projection system (reprojection). These steps ensured the spatial consistency and accuracy of the dataset, which is essential for the subsequent modelling of channel processes and bank line modifications. The projection transformation was vital for the accurate representation of riverbed features in the model, thus enhancing the quality of the spatial analysis and ensuring the reliability of the results. During the final preparation of the DEM, “false depressions” caused by interpolation and rounding errors in elevation values were corrected. These voids were addressed using the Fill function from the Spatial Analyst module in ArcGIS 10.8, ensuring continuity and precision in the terrain model and allowing for a more accurate assessment of channel changes and a clearer understanding of the river’s morphostructure. Using the DEM, the watershed boundary of the Ulken Almaty River and its tributaries was delineated with the Flow Direction and Flow Accumulation functions. The resulting raster was then converted to vector format for further analysis.
Based on the obtained vector data, the hydrographic characteristics of the study area were extracted, which in turn were defined as a set of morphometric characteristics of water bodies and their catchment areas, providing a fairly complete picture of the nature, shape, size, and length of water bodies and some of their physical and geographical features.
In this study, the morphometric characteristics of the watershed and watercourse were used to assess changes in river channel morphostructure. These characteristics enable the identification of patterns in the dynamics of channel deformations, the determination of factors influencing the transformation of channel forms, and the evaluation of potential changes in riverbeds. The assessment of watercourse morphometric characteristics includes the analysis of values such as lengths, average slopes, tortuosity coefficients, and longitudinal and cross-sectional profile indicators for selected river segments, which allows for the identification of the intensity of channel processes and the degree of their stability [82,83,84]. Parameters of the watershed [82,83,84], such as area, average elevation above sea level, average width, and drainage density, are used to study the impact of erosion processes on the morphological structure of river channels. A comprehensive approach to analysing hydrographic characteristics ensures a thorough examination of channel dynamics and enables the forecasting of the future evolution of river systems.
The river channel in each selected satellite image was manually deciphered based on direct and indirect interpretation features [56,85]. Manual interpretation of satellite images was carried out in ArcGIS 10.8. Based on the image interpretation, the upstream, midstream, and downstream sections of the river channels were outlined manually from the digitised satellite images in FCC, pixel by pixel, in ArcGIS 10.8 using Google Earth Pro images.
False Colour Composite (FCC)—a false colour satellite image is one in which the Red (R), Green (G), and Blue (B) values do not correspond to the true colours of red, green, and blue. A standard False Colour Composite (FCC) blue is assigned to green radiations (0.5 to 0.6 μm), green is assigned to red radiations (0.6 to 0.7 μm), and red is assigned to Near Infrared radiation (0.7 to 0.8 μm).
The measurement accuracy of the river channel, water surface, islets, and bank lines from spatial data is limited by manual digitising.
Separate polygonal and linear layers were created in ArcGIS 10.8 to analyse the dynamics of the river channel in selected time slices (2012–2021) to identify channel changes and assess the intensity of accretion and erosion processes. Analytical methods were applied to determine trends in bank changes in terms of erosion and accretion [86].
Unchanged sections for each time interval were included in the study. Equations (1) and (2) were used in the calculations.
For erosion, E = AP − UA
where E is the bank erosion, AP is the area of the previous year, and UA is the unchanged area.
For accretion, Ac = AN − UA
where Ac is the accretion area, AN is the area of the current year, and UA is the unchanged area.
To predict the future evolution of the river channel over 10- and 20-year periods, the DSAS 5.1 module was employed, enabling the calculation of the erosion and accretion rate of the riverbanks over time. For this analysis, polygonal features were transformed into linear features, representing the right and left bank boundaries of the river channel, to accurately assess erosion dynamics
The baseline lines for the right and left riverbanks were drawn with the consideration of the water protection strip width (35 m), in accordance with the Akimat of Almaty Region’s Resolution No. 246, dated 21 November 2011. Afterward, transects were created at 1 m intervals, crossing the riverbank lines identified from satellite images. In the next step of the study, historical riverbank lines were analysed using the EPR and LRR statistical parameters from the DSAS program, providing the rates of change of the riverbanks in two variations.
The resulting line layers were used for further calculations of possible river channel changes based on the application of the Kalman filter method built into DSAS 5.1.
The Kalman filter approach in the DSAS programme involves determining the linear rate of shoreline change calculated using DSAS, followed by an estimate of the shoreline position and rate of change every 0.1 years, providing an estimate of spatial uncertainty at each time step [73]. The Kalman filter method calculates the shoreline position using Equation (3) [87].
Y(t + dt) = Y(t) + m·dtY(t + dt) = Y(t) + m·dtY(t + dt) = Y(t)
where Y(t) denotes the shoreline position at time t and m is the rate of shoreline change in m/year. The time step dt is set to 0.1 years.
The use of the Kalman filter in DSAS enables the prediction of future changes in river channels and shorelines, accounting for spatial uncertainty. This makes the tool highly effective for modelling and forecasting the morphological structure of river channels.

3. Results and Discussion

The Ulken Almaty River is classified as a mountain river, characterised by a mixed feeding regime with a predominance of glacial and snowmelt contributions, altitudinal zonation, and active channel deformation processes. These hydrological and geomorphological features are directly reflected in its morphometric characteristics, which include high variability in channel width, dynamic riverbanks, and pronounced segmentation based on dominant channel processes. Such characteristics render the river’s morphometry particularly sensitive to both natural drivers and anthropogenic influences. As a result of the spatial analysis, the key morphometric parameters of the river channel and watershed were determined for the studied sections of the Ulken Almaty River basin (Table 2).
The data in the table show significant differences in the morphometric parameters of the upstream, midstream, and downstream sections of the river basin, which are influenced by altitudinal zonation, geomorphological conditions, and the morphostructure of the river network.
The upstream section (>2500 m) is characterised by the largest watershed area of 213 km2, with a river length of 7.99 km. The elevation difference (ΔH) is 0.60 km, and the channel slope is 4.29° (74.8‰). According to Leontiev and Rychagov’s classification [88], this value corresponds to gentle slopes. The drainage density in this section is relatively low at 0.04 km/km2, which is typical for mountainous areas with steep slopes and active linear erosion. The tortuosity coefficient is 1.12, indicating a weak channel sinuosity typical of steep slopes [61,83].
The midstream section (2500–1000 m) has the smallest watershed area of 93.3 km2, with a river length of 18.7 km. The elevation difference reaches 1.51 km, the highest value among all sections, leading to the steepest channel slope of 4.61° (80.5‰), although it is still classified as a gentle slope. The drainage density increases to 0.20 km/km2, reflecting a more branched river network and a more developed drainage system. The tortuosity coefficient is 1.15 (slightly sinuous), which also indicates a slight increase in channel sinuosity compared to the upstream portion of the river.
The downstream section (<1000 m) has a watershed area of 165 km2, with a river length of 50.1 km. The elevation amplitude is 0.44 km, resulting in a sharp decrease in the slope to 0.50° (8.72‰) (very gentle). This is typical for floodplain or foothill areas, where sediment accumulation and meandering are observed. The drainage density reaches its maximum value of 0.30 km/km2, and the tortuosity coefficient is 1.21 (moderately sinuous), confirming the increasing sinuosity of the channel in the downstream section.
In general, as one moves downstream, there is an increase in channel width, drainage density, and tortuosity coefficient, while the channel slope steadily decreases. These changes reflect the typical pattern of the morphological structure of the river system, associated with the transition from erosional processes in the upstream to depositional processes in the downstream.
The Ulken Almaty River is characterised by hazardous hydrological events (such as mudflows, sediment-induced floods, etc.), which can rapidly alter the morphological appearance of the river valley. In addition to mudflow events, this river experiences phases of high water (floods) and low water (low-flow periods), indicating an uneven distribution of runoff throughout the year.
In studies [64,81] based on the calculated runoff distribution using the composition method on the Ulken Almaty River (1.1 km above Ulken Almaty Lake), a pronounced seasonal pattern of intra-annual runoff distribution is observed. The main volume of annual runoff is generated during the warm season, from May to September, which is associated with the melting of snow and glaciers in the high-altitude basin of Ile Alatau.
In years with high flow, the largest monthly contribution to the annual runoff occurs in August, accounting for up to 22.8% (5.77 m3/s). In years with average flow, the peak occurs in July, at 22.2% (4.76 m3/s). In low-flow years, the highest contribution is again observed in August, accounting for 22.9% (4.09 m3/s).
The lowest runoff values are recorded during the winter months (December–March), due to consistently negative temperatures and the absence of glacier and snow cover melting. In years with high flow, the smallest monthly contribution to the annual runoff is observed in March, at 2.17% (0.55 m3/s). In years with average flow, the minimum value also occurs in March, at 2.53% (0.54 m3/s). In low-flow years, March remains the month with the smallest contribution, at 2.55% (0.46 m3/s).
During the study, daily water discharge data (average daily and maximum instantaneous values observed during the day) from the past 10 years were processed, and flow graphs (hydrographs) were constructed based on these data (Figure 3).
As a result of processing and analysing the statistical data, it was determined that the values of average annual water discharges (full channel) range from 1.33 m3/s (2020) to 3.34 m3/s (2016). The maximum instantaneous water discharges (channel forming) ranged from 6.26 m3/s (2020) to 26.1 m3/s (2015).
The analysis of the course of average daily water discharges confirmed that in the intra-annual section, the highest values are characteristic of the summer period. In addition, the study of daily water discharges for the period from 2012 to 2021 made it possible to identify significant inter-annual variability of both maximum and minimum values, as well as the amplitude of fluctuations in discharges during the year.
The maximum instantaneous water discharge values vary from 4.27 m3/s (in 2020) to 14.7 m3/s (in 2015), indicating significant differences in water availability in individual years. The minimum water discharges remain at a consistently low level, varying from 0.61 m3/s (in 2012 and 2013) to 0.15 m3/s (in 2019), which may be due to both climatic factors and the peculiarities of watercourse recharge in the winter–spring period.
The highest amplitude of flow fluctuations (ΔQ), reaching 14.5 m3/s, was recorded in 2015, indicating a sharp contrast between the flood and low-water periods. Similar high amplitudes were also recorded in 2017 (ΔQ = 13.9 m3/s) and 2019 (ΔQ = 13.2 m3/s). At the same time, the lowest amplitude of water discharge was observed in 2020 (ΔQ = 4.06 m3/s), which may indicate a uniform water supply throughout the year or the absence of significant floods that affect river channel changes.
High values for the amplitude of daily water discharge (ΔQ) have a considerable impact on the channel morphostructure and its dynamics. Sharp fluctuations between the minimum and maximum water discharges during the year lead to increased hydraulic head, which in turn contributes to the activation of channel-forming processes. Significant flood rises increase the erosive capacity of the stream and the processes of bank scouring, redistribution of sediment, and erosion of the channel bed and the formation of new elements of channel relief (temporary channels, islets, shoals, etc.) are observed [89,90,91,92]. The peculiarity of this study is the identification of daily discharge amplitudes as an independent indicator influencing channel transformations, which represents an element of scientific novelty.
As a rule, most mobile sections of the channel react to sudden changes in flow rates by shifting the channel axis, which may be accompanied by the development of meandering, widening or narrowing of the channel, and changes in depth profiles.
Thus, the amplitude of daily discharge is one of the features determining the intensity of morphodynamic changes in the channel zone. Consideration of this parameter is necessary for the comprehensive assessment of channel stability, modelling of channel deformations, and development of measures to manage channel processes.
In this study, when selecting satellite images for analysing the changes in river channel morphology, priority was given to those dates that coincided with periods of maximum water discharge.
As a result of digitising the riverbed outlines in the ArcGIS 10.8 software environment, a map was compiled (Figure 4), showing the spatial location of the Ulken Almaty riverbed for the period 2012–2021.
The morphometric characteristics of the watercourse for the selected period are presented in tabular form (Table 3).
The morphometric characteristics of the Ulken Almaty River channel demonstrate pronounced spatial and temporal variability, reflecting the peculiarities of the geomorphological processes within different altitudinal sections. Such parameters as riverbed area, islet area, water surface area, channel centreline (thalweg) length, straight-line length (from source to mouth), and tortuosity coefficient were analysed for the period from 2012 to 2021.
The upstream section is characterised by relatively stable values of morphometric indicators. The riverbed area varied from 16,630 m2 (2014) to 25,767 m2 (2015) over this time period, with moderate increases in some years. The area of islets remained small, reaching a maximum value of 5509 m2 in 2015, but this figure was less than 3.00 m2 in other years. The water surface area showed an increase from 13,812 m2 (2014) to 22,793 m2 (2018), which may indicate an increase in water content and partial channel widening. The thalweg length varied between 1.95 and 1.99 km. The average channel width varied from 8.64 to 14.2 m, reflecting moderate fluctuations in the channel profile without abrupt transformations. The tortuosity coefficient ranged from 1.08 to 1.12, which corresponds to a slightly sinuous channel type.
The midstream section was characterised by greater variability in morphometric parameters. The riverbed area here reached 22,453 m2 in 2017 but decreased to 13,143 m2 in subsequent years (2020). The area of islets in this section remained insignificant, being less than 600 m2 throughout all years of observation. The water surface area varied from 10,081 m2 to 22,114 m2, possibly related to fluctuations in seasonal flow and changes in channel forms. The thalweg length varied from 2.37 to 2.42 km. The average channel width ranged from 4.90 to 10.5 m, indicating high flow dynamics and localised changes in channel profile width. The tortuosity coefficient ranged between 1.10 and 1.12, reflecting a stable geomorphological configuration of the channel without significant meandering.
The downstream section of the river is characterised by the highest values of morphometric characteristics, indicating the declivity of the area under consideration. The highest values for the riverbed area reached 52,449 m2 in 2015, remaining at a high level until 2020. The area of islets was also significant—and in places reached up to 1316 m2 (2014)—indicating active processes of channel accumulation and the formation of multi-armed structures. The water surface area varied from 37,758 to 52,820 m2, reaching a maximum in 2020. The thalweg length increased to 4.11 km (2012), stabilising at 3.86–3.89 km in subsequent years. The average channel width ranged from 10.4 to 14.6 m, reflecting the widening of the channel network and the formation of a branched multi-strand channel. The tortuosity coefficient in this section was highest at 1.62 to 1.78, which is a result of the development of meanders, islets, and oxbow channels in this section.
The general dynamics of morphometric parameters allows us to trace the regularities of their changes along the altitudinal belts. Riverbed areas, water surface areas, and thalweg lengths increase naturally downstream. The area of islets, although not so linear in dynamics, also reaches a maximum in the downstream section, which is associated with channel branching and accumulation processes. The tortuosity coefficient shows an increasing trend from upstream to downstream, reflecting the increasing complexity of channel morphostructure.
The morphodynamic activity of the Ulken Almaty River channel was assessed based on the analysis of spatial changes, including areas of erosion, accretion (accumulation), and stability (unchanged), covering 2012–2021 (Table 4).
In the upstream section of the river, the areas of erosion varied between 5086 m2 (2016–2017) and 12,791 m2 (2014–2015). The highest levels of erosion were observed in 2014–2015 and 2017–2018, which is likely associated with extreme hydrological events (increased maximum water discharges). At the same time, the areas of accretion remained relatively stable, reaching a maximum of 21,949 m2 in 2014–2015. Stable sections of the channel were first recorded starting in 2014, with the area of unchanged zones gradually increasing from 3838 m2 to 13,558 m2 by 2020–2021, indicating partial stabilisation of the channel morphology in this section.
The midstream section showed higher areas of both erosion and accretion compared to the upstream section. The most intense erosion processes were recorded in 2017–2018, reaching 19,073 m2, while the maximum accretion occurred in 2017–2018, totalling 14,682 m2. Stable areas occupied relatively small zones, ranging from 2988 m2 to 14,565 m2, indicating the dominance of active channel processes, which were influenced by both seasonal runoff dynamics and likely local scouring and sediment deposition.
In the downstream section of the river, the highest levels of erosional activity were observed, reaching 23,227 m2 in 2020–2021 and 21,804 m2 in 2015–2016, confirming the trend of increasing channel mobility as the absolute elevation decreases. Accretion also had high values, with maximum areas recorded at 18,465 m2 in 2013–2014 and 18,495 m2 in 2014–2015. Meanwhile, the areas of stable sections showed a gradual decrease from 42,839 m2 (2012–2013) to 29,962 m2 (2020–2021), which reflects the intensification of channel dynamics in the downstream section.
The gathered data collectively indicate that in the river channel system of the Ulken Almaty River during the study period, both erosion and accretion processes dominate, with a gradual reduction in the area of stable sections. These processes are most actively observed in the midstream and downstream sections, which can be attributed to the decreasing slopes, reduced flow rates, increased channel width, and the influence of channel forming water discharges.
In years with high discharge amplitude (e.g., 2015, 2017, 2019), there was likely an intensification of channel reorganization processes, particularly in areas with unstable banks and loose sediment deposits. Additionally, such years contribute to the partial or complete removal of previously deposited alluvial forms, which may compromise the stability of the entire channel system.
To visually represent the spatiotemporal changes in channel processes of the Ulken Almaty River, graphs of the distribution of erosion and accretion areas across altitudinal zones were constructed for the study period (Figure 5).
Figure 5 shows the spatial distribution of erosive and accumulative processes in the Ulken Almaty River channel at three elevations—upstream (a), midstream (b), and downstream (c)—for the period 2012–2021. Analysis of the graphs allows us to identify pronounced differences in the dynamics of morphodynamic processes along the longitudinal profile of the channel.
The upstream section (Figure 5a) is characterised by intense accretion, which increases from the starting point, peaks (~5000 m2) at about 1.50 km, and then decreases towards the lower part of the watercourse. Erosion along this section reaches a maximum at 1.00 km (~4000 m2) before stabilising at around 3500 m2. This indicates an active redistribution of sediment: accumulation occurs in the central part of the section, whereas at the beginning of the section there is intensive erosion.
In the midstream (Figure 5b) of the river, accretionary processes dominate, with a maximum of about 3000 m2 within 2.00 km. In contrast to the upstream, accretion is more evenly distributed here and fluctuations in values are not so sharp. Erosion processes are most pronounced in the first 0.50 km (about 2000 m2) and further changes are minimal. This may indicate the stabilisation of channel forms and the presence of areas with stable flow.
The downstream section (Figure 5c) is characterised by alternating areas of erosion and accretion, which is probably related to changes in channel morphology and the local hydrodynamic conditions. Accretion ranges from 500 to 2300 m2, reaching a maximum at about 2.80 km. Erosion here is most intense around 0.50–1.00 km (more than 4000 m2) and then exhibits wave-like fluctuations. This pattern may be due to the complex morphology of the channel and its fill level, changes in gradient, and the impact of economic activities.
For the calculation of erosion and accretion rates, in accordance with the DSAS 5.1 user guide, the attributes of shapefiles representing the baseline and bank line data, including historical riverbank locations, were prepared in ArcGIS 10.8.
When creating transects for the calculations, the following parameters were set: maximum search distance—150 m, transect spacing length—1 m, smoothing distance—2500. Each bank line is measured at the point of intersection of the transect, and the rate of bank line change is calculated based on these measurement points. Changes in the bank line positions over a specific period of time serve as the basis for calculating the rate of bank line change (in m/year).
In this study, the erosion and accretion rates of the riverbank sections were classified using the EPR and LRR methods (Table 5).
The data presented in the table summarize the average and maximum values of erosion and accretion rates for the left and right banks of the Ulken Almaty River across three altitudinal zones: upstream, midstream, and downstream. The assessment is based on the calculation of LRR (Linear Regression Rate) and EPR (End Point Rate) indicators, which reflect the linear and overall changes in the bank line in m/year.
In the upstream section, accretion processes dominate on the right bank, where the average accretion rate reaches 1.58 m/year (EPR), with relatively low average erosion rates (−0.33 m/year). The maximum accretion rate on the right bank is 35.6 m/year, significantly exceeding the corresponding rate on the left bank (0.65 m/year). At the same time, the left bank in this area exhibits more pronounced erosion processes, with an average erosion rate of −1.64 m/year and a maximum of −5.78 m/year. This asymmetry may be attributed to factors such as the direction of the main flow, the slope of the river channel, or the local hydraulic conditions.
In the midstream section, there is a balance between erosion and accretion, but overall, the processes are less intense. The average erosion rates on both banks range from −0.70 to −0.86 m/year, indicating a reduction in lateral movement compared to the upstream section. Accretion is weakly expressed: the average accretion rates on both banks do not exceed 0.34 m/year, with maximum values not exceeding 3.27 m/year. Therefore, the midstream section represents a relatively stable zone, where the dynamics of the bank line are calm.
The highest channel mobility is observed in the downstream section (Figure 6). The maximum erosion rates reach −13.4 m/year on the right bank and −8.81 m/year on the left bank, indicating active scouring processes. At the same time, accretion is also intense, with maximum rates of 14.8 m/year (left bank) and 12.9 m/year (right bank) and average rates exceeding 1 m/year. This confirms that the downstream section is the most dynamic zone, where both accretion and erosion processes occur simultaneously, possibly due to the flatness of the area in question. Changes in the morphostructure of the channel require special attention in terms of spatial planning, monitoring, and potential riverbank protection measures. The differences between the LRR and EPR indicators also allow us to conclude that in some areas short-term changes dominate, while in others a stable long-term trend of bank relocation can be observed.
In this study, the results of the forecast of channel changes are presented in the form of channel contours for 10- and 20-year periods, taking into account erosion and accumulation processes (Figure 7, Figure 8 and Figure 9).
The predicted position of the right bank (Figure 7a) indicates moderate shifts in the coastline compared to its position in 2021. The most pronounced discrepancy between the current and predicted lines is observed near the mouth of the section, where active meander formation is observed. Towards the source, the degree of discrepancy decreases significantly, which may indicate a more stable morphology for the right bank in the upper reaches and less channel mobility. Separate local areas of presumed erosion remain throughout the profile.
The left bank (Figure 7b) shows greater dynamism, especially in the mouth area, where the predicted river contours for the 20- and 10-year predictions differ significantly from the current position of the coastline. This indicates lateral erosion in the zone of active meanders. Towards the source, the predicted shifts become less pronounced, but in some places the 10- and 20-year contours diverge significantly, which may indicate unstable areas with a high probability of further channel transformations.
The upper part of the river section shows a relatively stable channel, especially on the right bank, with minimal predicted changes.
In the area where the river flows into Ulken Almaty Lake, the most active channel transformations have been recorded, including the expansion of meanders and increased bank instability.
In the upper part of the middle course, the predicted shifts of the right bank have a small amplitude and are relatively uniform. The difference between the 10-year and 20-year forecasts is insignificant here, indicating a relatively stable coastline. However, towards the lower part, there are areas with increased divergence between the current coastline and the forecast coastline, especially in the bends.
Similarly, the left bank is also characterised by a stable configuration near the upper part of the section, with minimal differences between the coastline position in 2021 and the 10- and 20-year forecasts. However, as we move towards the lower part, there are local areas with more pronounced predicted shifts, mainly within active meanders. In most cases, the 10- and 20-year forecasts are practically identical, which may indicate a weak erosion/accumulation trend or stabilising processes (e.g., scrub encroachment, slope flattening or protective structures).
In the upper part of the downstream section, the predicted changes in the position of the right bank are not very pronounced: the 10- and 20-year forecast lines practically coincide, which indicates that the channel configuration will remain stable.
As we approach the lower part, in the area of pronounced meandering, there is an increase in the divergence between the current and predicted coastlines, indicating the intensification of lateral erosion processes. In some areas, the predicted displacement reaches 15–20 m, mainly on the convex sides of the meanders, reflecting the high morphodynamic activity of the riverbed, probably due to the absence of bank reinforcements.
In the lower part of the left bank, the predicted shifts in the bank line do not exceed a few metres, which indicates the morphodynamic stability of the riverbed. However, in the areas where the river bends, the predicted line (20-year prediction) is shifted outwards from the river meanders, indicating active erosion transformation. Judging by its outline, the left bank is more susceptible to changes in certain areas.

4. Conclusions

This study evaluated morphostructural changes in the river channel across three segments—upstream, midstream, and downstream—based on GIS and remote sensing (RS) data. It was established that morphometric parameters such as riverbed area, channel width and length, water surface area, islet area, and the tortuosity coefficient generally increased in the upper and middle reaches. In contrast, these parameters exhibited a decreasing trend in the lower reaches over the study period.
Spatial analysis of the delineated river sections enabled quantitative estimation of erosion and accretion zones, revealing significant variability in bank line dynamics. These processes were found to be strongly influenced by the river’s hydrological regime and the seasonal pattern of floodwater contributions. However, their intensity is not determined solely by discharge; other influencing factors include the geological structure of the banks, the presence and condition of riparian vegetation, and anthropogenic activities such as flow regulation and hydraulic infrastructure development. Additionally, geomorphological conditions—including bank slope, sediment granulometry and lithology, and underlying tectonic activity—exert a substantial impact on channel dynamics.
The findings indicate that the integration of GIS and RS technologies constitutes the most effective approach for analysing morphological transformations in the river network, particularly in data-scarce environments. This methodological integration enabled the detection of historical channel changes and supported the projection of future morphological development scenarios over 10- and 20-year horizons. These forecasts were generated using the DSAS 5.1 extension within the ArcGIS 10.8 environment, applying the Kalman filter for trajectory smoothing and prediction of bank line positions.
The results hold practical significance for a variety of engineering and environmental management applications, including the design of hydraulic structures, land-use zoning, delineation of water protection zones, and risk assessment related to bank erosion and mudflow hazards. Specifically, the identification of areas exhibiting the greatest riverbank instability provides a basis for planning and justifying riverbank protection and channel stabilisation measures. Predicted trajectories of bank line migration offer essential input for land-use planning, particularly in avoiding the siting of infrastructure in high-risk zones. Furthermore, the inclusion of long-term channel variability in water protection zone delineation enables a more accurate and dynamic approach to environmental regulation, which is increasingly relevant under conditions of climate change and intensifying anthropogenic pressure.
Nonetheless, this study is limited by the scarcity of monitoring data on both liquid and solid runoff, the absence of detailed field data on the geological characteristics of bed sediments, and the uneven availability of RS imagery across the study area. These constraints may affect the precision and reliability of long-term morphological forecasts.
Future research should aim to expand the monitoring network by incorporating unmanned aerial vehicles (UAVs) and very-high-resolution satellite imagery. In this context, the continued integration of GIS and RS remains a promising direction for producing scientifically robust forecasts and supporting adaptive river basin management.
The comprehensive application of GIS and RS tools provides a reliable and efficient means for assessing morphostructural changes in river systems, thereby supporting the prediction and management of erosion and accretion dynamics. To enhance predictive accuracy, we propose broadening the scope of analysis by incorporating high-resolution datasets and advanced hydrodynamic modelling. Furthermore, the integration of artificial intelligence (AI) and machine learning techniques [93,94] offers significant potential for improving forecasts of riverbank evolution, given the growing adoption of these technologies in contemporary river morphology research.

Author Contributions

Conceptualization, A.M.; methodology, A.M. and K.D.; software, M.T. and A.A.; formal analysis, A.M. and M.T.; data curation, M.T. and A.A.; investigation, A.M. and K.D.; resources, M.T. and A.A.; writing—original draft preparation, A.M. and M.T.; writing—review and editing, J.R.-I. and M.-E.R.-C.; visualization, M.T., J.R.-I. and M.-E.R.-C.; supervision, A.M.; project administration J.R.-I. and M.-E.R.-C. All authors have read and agreed to the published version of the manuscript.

Funding

This research received no external funding.

Data Availability Statement

Data used in this study were obtained from the national hydrometeorological service the Republican State Enterprise “Kazhydromet” with the author’s participation.

Acknowledgments

The authors acknowledge Erasmus + CBHE project “Land management, Envi-ronment and SoLId-WastE: inside education and business in Central Asia” (LESLIE), project number ERASMUS-EDU-2023-CBHE No. 101129032, for its cooperation in the dissemination of this work.

Conflicts of Interest

The authors declare no conflicts of interest.

References

  1. Antropovskij, V.I.; Denisova, I.V.; Izotov, A.V. Hydrological and Morphological Approach to the Study of Channel Processes. Proc. Russ. State Pedagog. Univ. Named After A. I. Herzen 2005, 13, 233–241. (In Russian) [Google Scholar]
  2. Baryshnikov, N.B.; Isaev, D.I. Channel Processes: Textbook; Saint Petersburg State University of HydroMeteorology (RSHU): Moscow, Russia, 2014; p. 504. (In Russian) [Google Scholar]
  3. Dumnov, A.D.; Kirsanov, A.A.; Kiseleva, E.A.; Lipiyainen, K.L.; Rybalskiy, N.G.; Snakin, V.V.; Afanasyev, A.N.; Borisova, O.K.; Velichko, A.A.; Grebennikova, T.A. National Atlas of Russia, Volume 2: Nature. Ecology; CPA “Cartographia”: Moscow, Russia, 2007; ISBN 5-85120-250-5. (In Russian) [Google Scholar]
  4. Zhandaev, M.Z. Regressive Erosion and Interception of River Headwaters (on the Example of the Rivers of the Zailiysky Alatau). Geomorfologiya 1975, 1, 73–78. (In Russian) [Google Scholar] [CrossRef]
  5. Zhandaev, M.Z. On the Issue of Gully Erosion in Northern Kazakhstan. Sci. Notes Kazakh State Univ. 1954, 18, 73–75. (In Russian) [Google Scholar]
  6. Zhandaev, M.Z. Features of the Development of the Hydrographic Network in the Eastern Part of the Zailiysky Alatau. Proc. Acad. Sci. Kazakh SSR. Geol. Ser. 1954, 18, 128–132. (In Russian) [Google Scholar]
  7. Zhandaev, M.Z. Morphostructures of the Zailiysky Alatau and Its Foothills. In Proceedings of the Republican Scientific and Methodological Conference on Geography, Almaty, Kazakhstan, 15–17 April 1970; pp. 105–106. (In Russian). [Google Scholar]
  8. Zhandaev, M.Z. Erosion and Spatial Development of River Valleys. In Contemporary Relief-Forming Processes in the Territory of Kazakhstan: Collected Articles; Kazakh State University: Almaty, Kazakhstan, 1988; pp. 3–16. (In Russian) [Google Scholar]
  9. Zhandaev, M.Z. Channel Processes and the Problem of the Origin of Rivers and River Valleys. Proc. All-Union Geogr. Soc. 1991, 123, 425–429. (In Russian) [Google Scholar]
  10. Abdrasilov, S.A. Channel Processes and the Formation of Intracontinental Deltas: A Case Study of the Ili River Delta; Rauan: Almaty, Kazakhstan, 1994; 191p. (In Russian) [Google Scholar]
  11. Abdrasilov, S.A.; Dyusenova, R.K.; Pulatova, E.A. Assessment of the Channel Stability of the Irtysh River Using A.V. Karaushev’s Method. In Natural and Social Problems of the Geography of Arid Territories; Kazakh University: Almaty, Kazakhstan, 2001; pp. 34–46. (In Russian) [Google Scholar]
  12. Burlybaev, M.Z.; Abdrasilov, S.A.; Tairov, T.Z. Assessment of the Channel Stability of the Irtysh River Using K.V. Grishanin’s Method. Hydrometeorol. Ecol. 2002, 3, 54–61. (In Russian) [Google Scholar]
  13. Chigrinets, L.Y.; Duskayev, K.K. Sediment Runoff Study of Mountain Rivers of the Zailiysky and Dzhungarian Alatau. Bull. Kazakh State Univ. Ser. Ecol. 1997, 2, 71–77. (In Russian) [Google Scholar]
  14. Duskayev, K.K.; Chigrinets, L.Y. Study of Water Erosion Characteristics for Assessing the Ecological Condition of Mountain Rivers in Southeastern Kazakhstan. In Stability, Anthropogenic Transformation and Optimization of the Natural Environment of Kazakhstan: Proceedings of the Republican Scientific Conference; Almaty, Kazakhstan, 1998; pp. 44–46. (In Russian) [Google Scholar]
  15. Duskayev, K.K.; Chigrinets, L.Y. Assessment of the Intensity of Erosion Processes in the River Basins of the Zailiysky and Dzhungarian Alatau Using Sediment Discharge Data. In Problems of Hydrometeorology and Ecology: Proceedings of the International Conference Dedicated to the 50th Anniversary of the KazSRI ECM; Almaty, Kazakhstan, 2001; pp. 168–170. (In Russian) [Google Scholar]
  16. Duskayev, K.K.; Chigrinets, L.Y. Sediment Runoff and Assessment of the Erosional Activity of Mountain Rivers in Kazakhstan. In Proceedings of the 27th Plenary Interuniversity Coordination Meeting on the Problem of Erosional, Channel, and Estuarine Processes, Izhevsk, Russia, 8–12 October 2012; Reports and Brief Communications. pp. 106–107. (In Russian). [Google Scholar]
  17. Dostay, Z.D.; Musabayeva, M.N. Channel Processes as a Factor of Intrasystem Organization of Geosystem Development. Hydrometeorol. Ecol. 2007, 3, 100–105. (In Russian) [Google Scholar]
  18. Golubtsov, V.V. Classification of Channels of Semi-Mountainous and Mountain Streams Based on the Roughness Coefficient. Hydrometeorol. Ecol. 2001, 1–2, 87–101. (In Russian) [Google Scholar]
  19. Golubtsov, V.V. Modeling of Mountain River Runoff Under Conditions of Limited Information; Kazhydromet: Almaty, Kazakhstan, 2010; 232p, ISBN 978-601-278-368-1. (In Russian) [Google Scholar]
  20. Khalykov, Y.Y.; Lyy, Y.F.; Kakimzhanov, Y.K.; Makimbayeva, M.M.; Sharapkanova, Z.M. Study of Gully Erosion Using Method of Terrestrial Laser Scanning. Hydrometeorol. Ecol. 2020, 2, 146–164. (In Kazakh) [Google Scholar]
  21. Khalykov, Y.; Lyy, Y.; Abitbayeva, A.; Togys, M.; Valeyev, A. Terrestrial laser scanning methods formonitoring erosion of the southwestern shore of Alakol lake. In Proceedings of the 20th International Multidisciplinary Scientific GeoConference SGEM 2020, Albena, Bulgaria, 16–25 August 2020; STEF92 Technology: Sofia, Bulgaria, 2020; pp. 117–130. [Google Scholar] [CrossRef]
  22. Khalykov, Y.; Lyy, Y.; Sarybaev, E.; Togys, M.; Uksukbayeva, S.; Sharapkhanova, Z. Study of Conditions of Gully Formation in Mountain Regions of South-East Kazakhstan with Use of GIS-Technologies. Geod. Cartogr. 2021, 47, 54–65. [Google Scholar] [CrossRef]
  23. Taukenov, T.R.; Yerzhanova, Z.S. Formation of Log Jams on the Rivers of the Buktyrma Basin and Their Geomorphodynamic Functions. Hydrometeorol. Ecol. 2018, 2, 118–129. (In Russian) [Google Scholar]
  24. Velikanov, M.A. On the Formulation of the Problem of Channel Processes. Meteorol. Hydrol. 1946, 3, 36–46. (In Russian) [Google Scholar]
  25. Velikanov, M.A. Dynamics of Channelized Flows. Vol. I: Flow Structure; Gostekhizdat: Moscow, Russia, 1954; 324p. (In Russian) [Google Scholar]
  26. Velikanov, M.A. Dynamics of Channelized Flows. Vol. II: Sediments and the Channel; Gostekhizdat: Moscow, Russia, 1955; 323p. (In Russian) [Google Scholar]
  27. Velikanov, M.A. Channel Process; Gospfizmatizdat: Moscow, Russia, 1958; 395p. (In Russian) [Google Scholar]
  28. Makkaveev, N.I. The River Channel and Erosion in Its Basin; Faculty of Geography, Moscow State University: Moscow, Russia, 2003; 353p, (Reprint of 1955 ed.). (In Russian) [Google Scholar]
  29. Makkaveev, N.I.; Chalov, R.S. On the Morphological Features of Modern Accumulation in a River Valley. Izv. Ross. Akad. Nauk. Seriya Geogr. 1963, 3, 84–89. (In Russian) [Google Scholar]
  30. Makkaveev, N.I.; Shataeva, S.G.; Mityakova, M.P. Channel Stability Index. Meteorol. Hydrol. 1967, 5, 72–83. (In Russian) [Google Scholar]
  31. Makkaveev, N.I. Runoff and Channel Processes; Moscow State University Publishing House: Moscow, Russia, 1971; 115p. (In Russian) [Google Scholar]
  32. Makkaveev, N.I. Erosional and Accumulative Processes and the Relief of a River Channel. Selected Works; Moscow State University Publishing House: Moscow, Russia, 1998; 285p, ISBN 5-211-03899-1. (In Russian) [Google Scholar]
  33. Mirtskhulava, T.E. Channel Scour and Methods for Assessing Their Stability; Kolos: Moscow, Russia, 1967; 179p. (In Russian) [Google Scholar]
  34. Mirtskhulava, T.E. Fundamentals of the Physics and Mechanics of Channel Erosion; Gidrometeoizdat: Leningrad, Russia, 1988; 303p, ISBN 5-286-00041-X. (In Russian) [Google Scholar]
  35. Chalov, R.S.; Khmeleva, N.V. Development of the Theory of Erosional and Accumulative Processes in the Works of Professor N.I. Makkaveev. In Soil Erosion and Channel Processes, Issue 7; Moscow University Press: Moscow, Russia, 1979; pp. 5–20. (In Russian) [Google Scholar]
  36. Chalov, R.S. Geographical Studies of Channel Processes; Moscow University Press: Moscow, Russia, 1979; 232p. (In Russian) [Google Scholar]
  37. Chalov, S.R.; Ermakova, A.S.; Yesin, E.V. Logjams on Rivers, Their Channel-Forming and Environmental Role. Vestn. Mosk. Univ. Seriya 5 Geogr. 2010, 6, 25–31. (In Russian) [Google Scholar]
  38. Chalov, R.S.; Kamyshev, A.A. Concepts of Hydromorphology and River Morphodynamics in Channel Processes Science. Izv. Ross. Akad. Nauk. Seriya Geogr. 2020, 84, 844–854. (In Russian) [Google Scholar] [CrossRef]
  39. Kuznetsov, K.L. Channel Processes of Mountain Rivers of the Zailiyskiy Alatau and the BAM Zone: Abstract of the Dissertation for the Degree of Candidate of Geographical Sciences; Kuznetsov, K.L., Ed.; Moscow State University Named after M.V. Lomonosov, Order of Lenin, Order of the Red Banner of Labour, and Order of the October Revolution: Moscow, Russia, 1987; 24p. (In Russian) [Google Scholar]
  40. Kuznetsov, K.L.; Chalov, R.S. Mountain rivers channel processes and morphology under conditions of frequent mudflows (a case study of the Zailiysky Alatau rivers). Geomorfologiya 1988, 2, 71–78. [Google Scholar]
  41. Druzhinin, G.A. Study of Basic Hydromorphometric Characteristics in Mountain Channel Flows: Abstract of the Dissertation for the Degree of Candidate of Technical Sciences; Druzhinin, G.A., Ed.; Central Asian Research Institute of Irrigation (Sredneaziatskiy NII Irrigatsii), Ministry of Land Reclamation and Water Management of the USSR: Tashkent, USSR, 1977; 20p. (In Russian) [Google Scholar]
  42. Grishanin, K.V. Dynamics of Channelized Flows, 2nd ed.; Gidrometeoizdat: Leningrad, Russia, 1979; 312p. (In Russian) [Google Scholar]
  43. Grishanin, K.V. Stability of River and Canal Channels; Gidrometeoizdat: Leningrad, Russia, 1974; 144p. (In Russian) [Google Scholar]
  44. Baryshnikov, N.B.; Popov, I.V. Dynamics of Channelized Flows and Channel Processes; Gidrometeoizdat: Leningrad, Russia, 1988; 454p, ISBN 5-286-00012-6. (In Russian) [Google Scholar]
  45. Lane, E.W. The importance of fluvial morphology in hydraulic engineering. Am. Soc. Civ. Eng. Proc. 1954, 81, 745. [Google Scholar] [CrossRef]
  46. Leopold, L.B.; Wolman, M.G. River channel patterns: Braided, meandering, and straight. US Government Printing Office. US Geol. Survey Prof. Paper 1957, 282, 39–84. [Google Scholar]
  47. Montgomery, D.R.; Buffington, J.M. Channel-reach morphology in mountain drainage basins. GSA Bull. 1997, 109, 596–611. [Google Scholar] [CrossRef]
  48. Chin, A. The morphologic structure of step–pools in mountain streams. Geomorphology 1999, 27, 191–204. [Google Scholar] [CrossRef]
  49. Chrisben Sam, S.; Gurugnanam, B. Coastal transgression and regression from 1980 to 2020 and shoreline forecasting for 2030 and 2040, using DSAS along the southern coastal tip of Peninsular India. Geod. Geodyn. 2022, 13, 585–594. [Google Scholar] [CrossRef]
  50. Debnath, J.; Sahariah, D.; Saikia, A.; Meraj, G.; Nath, N.; Lahon, D.; Annayat, W.; Kumar, P.; Chand, K.; Singh, S.; et al. Shifting Sands: Assessing Bank line Shift Using an Automated Approach in the Jia Bharali River, India. Land 2023, 12, 703. [Google Scholar] [CrossRef]
  51. Hasanuzzaman, M.; Bera, B.; Islam, A.; Shit, P. Estimation and prediction of riverbank erosion and accretion rate using DSAS, BEHI, and REBVI models: Evidence from the lower Ganga River in India. Nat. Hazards 2023, 118, 1163–1190. [Google Scholar] [CrossRef]
  52. Felipe, A.J.B.; Alejo, L.A.; Padre, R.J.; Bareng, J.L.R. Past and future river bank trend assessment of lower Cagayan River, Philippines. Environ. Dev. Sustain. 2024, 26, 1–36. [Google Scholar] [CrossRef]
  53. Shuangmi, X.; Wenzhu, Z.; Bin, W.; Shengquan, L.; Guanhai, G.; Yanhua, L. Evaluating the migration of boundary river shorelines and coastal land cover changes for the Beilun River between China and Vietnam. J. Hydrol. Reg. Stud. 2025, 57, 102167. [Google Scholar] [CrossRef]
  54. Singh, B.; Bhattacharjee, N. Bank line Migration Analysis of Brahmaputra River in Morigaon District, Assam using Automated Method. Indian J. Sci. Technol. 2024, 17, 2508–2518. [Google Scholar] [CrossRef]
  55. Harikrishna, S.; Gurugnanam, B.; Bairavi, S.; Shekar, S. Geospatial technology based shoreline change analysis (1992–2022) and predictive forecast modeling for 2032 and 2042, utilizing DSAS, along the eastern coast of India. Kuwait J. Sci. 2024, 51, 100272. [Google Scholar] [CrossRef]
  56. Article, A.; Kılar, H.; Aydın, O.; Kelimeler, A.; Kıyı, K.; Tahmini, H.; Filtresi, K.; Dijital, Ş.; Şeridi, K.; Sistemi, A. Applying the kalman filter model to forecast shoreline positions: A case study in Şile, İstanbul. Türk Coğrafya Derg. 2024, 85, 47–53. [Google Scholar]
  57. Ranjan, A.; Thendiyath, R. Analysis of channel shifting and its impact on morphometric parameters of Sone river basin, Bihar, India. Acta Geophys. 2025, 73, 3531–3547. [Google Scholar] [CrossRef]
  58. Abd-Elhamid, H.F.; Zeleňáková, M.; Barańczuk, J.; Gergelova, M.B.; Mahdy, M. Historical Trend Analysis and Forecasting of Shoreline Change at the Nile Delta Using RS Data and GIS with the DSAS Tool. Remote Sens. 2023, 15, 1737. [Google Scholar] [CrossRef]
  59. Islam, M.S.; Crawford, T.W. Assessment of Spatio-Temporal Empirical Forecasting Performance of Future Shoreline Positions. Remote Sens. 2022, 14, 6364. [Google Scholar] [CrossRef]
  60. Chigrinets, A.G.; Duskayev, K.K.; Mazur, L.P.; Chigrinets, L.Y.; Musina, A.K.; Zhanabayeva, Z.A.; Akhmetova, S.T. Rivers of the Metropolis of Almaty: Monograph; Izaza University: Almaty, Kazakhstan, 2021; 310p, ISBN 978-601-04-5247-3. (In Russian) [Google Scholar]
  61. Duskayev, K.; Mussina, A.; Rodrigo-Ilarri, J.; Zhanabayeva, Z.; Tursyngali, M.; Rodrigo-Clavero, M.E. Study of temporal changes in the hydrographic network of small mountain rivers in the Ile Alatau, Kazakhstan. Hydrol. Res. 2023, 54, 1420–1431. [Google Scholar] [CrossRef]
  62. Dostaiuly, Z. General Hydrology; Karasai: Almaty, Kazakhstan, 2011; 280p, ISBN 978-601-7212-10-0. (In Kazakh) [Google Scholar]
  63. Davydov, L.K.; Dmitrieva, A.A.; Konkina, N.G. General Hydrology, 2nd ed.; revised and expanded; Gidrometeoizdat: Saint Petersburg, Russia, 1973; 462p. (In Russian) [Google Scholar]
  64. Resursy Poverkhnostnykh Vod SSSR. Bassein oz. Balkhash; Gidrometeoizdat: Leningrad, Russia, 1970; Volume 13, p. 643. (In Russian) [Google Scholar]
  65. Zhandayev, M.Z. Nature of the Zailiyskiy Alatau; Alma-Ata, Kazakhstan, 1978; 159p. (In Russian) [Google Scholar]
  66. Duskayev, K.K.; Chygrynets, A.G.; Mussina, A.K.; Zhanabayeva, Z.A.; Akhmetova, S.T.; Yermash, E.K. Assessment of the Maximum Water Discharge of the Rivers of Almaty. Hydrometeorol. Ecol. 2019, 2, 96–110. (In Russian) [Google Scholar]
  67. Medeu, A.R.; Baimoldaev, T.A.; Kirenskaya, T.L. Mudflow Phenomena of South-Eastern Kazakhstan: V.4. Part 1 Monograph; Anthology of Mudflow Phenomena and Their Research, Institute of Geography: Almaty, Kazakhstan, 2016; p. 576. (In Russian) [Google Scholar]
  68. Copernicus Browser. Available online: https://browser.dataspace.copernicus.eu/ (accessed on 19 November 2024).
  69. USGS Science for a Changing World. EarthExplorer. Available online: https://earthexplorer.usgs.gov/ (accessed on 25 November 2024).
  70. Mei, G.; Tipper, J.; Xu, N. 3D Geological Modeling and Visualization of Rock Masses Based on Google Earth: A Case Study. In Proceedings of the 2013 5th International Conference on Computer Science and Information Technology, Amman, Jordan, 27–28 March 2013; IEEE: Piscataway, NJ, USA, 2013. [Google Scholar] [CrossRef]
  71. Nwilo, P.; Okolie, C.; Onyegbula, J.; Arungwa, I.; Ayoade, O.; Daramola, O.; Orji, M.; Uyo, I. Positional Accuracy Assessment Of Historical Google Earth Imagery. Appl. Geomat. 2022, 14, 545–568. [Google Scholar] [CrossRef]
  72. Kochetkov, A.V. Prospects for the Use of Google Earth Information Resources for Surveying and Designing Transport Infrastructure Facilities. Electron. Sci. J. Alm. Space Time 2013, 4, 18. (In Russian) [Google Scholar]
  73. Himmelstoss, E.A.; Henderson, R.E.; Kratzmann, M.G.; Farris, A.S. Digital Shoreline Analysis System (DSAS) Version 5.1 User Guide (Report Nos. 2021–1091; Open-File Report, p. 104); USGS Publications Warehouse: Reston, VA, USA, 2021. [Google Scholar] [CrossRef]
  74. Kiselev, D.V.; Zemtsov, V.A. Determination of Characteristic Water Discharges with the Most Intensive Impact on River Channel Formation (Case Study of the Rivers of Tomsk Region). Tomsk. State Univ. J. 2011, 351, 169–174. (In Russian) [Google Scholar]
  75. Kamenskov, Y.U.I. On the Definition and Significance of Channel-Forming Water Discharge. Meteorol. Hydrol. 1986, 7, 119–120. (In Russian) [Google Scholar]
  76. Antropovsky, V.I. Hydrological and Morphological Patterns and Baseline Forecasts of River Channel Transformation; Krismas+: St. Petersburg, Russia, 2006; p. 216. (In Russian) [Google Scholar]
  77. Karasev, I.F. Channel-Forming Water Discharges. Meteorol. Hydrol. 1986, 8, 94–98. (In Russian) [Google Scholar]
  78. Chalov, R.S. Channel-Forming Water Discharges. Vestn. Mosk. Univ. Ser. 5 Geogr. 2006, 1, 11–19. (In Russian) [Google Scholar]
  79. Navratil, O.; Albert, M.; Herouin, E.; Gresillon, J. Determination of bankfull discharge magnitude and frequency: Comparison of methods on 16 gravel-bed river reaches. Earth Surf. Process. Landf. 2006, 31, 1345–1363. [Google Scholar] [CrossRef]
  80. Navratil, O.; Albert, M.-B.; Breil, P. Test of three methods to detect the overbank flow from water level time-series analysis. Hydrol. Process. 2010, 24, 2452–2464. [Google Scholar] [CrossRef]
  81. Chigrinets, A.G.; Duskayev, K.K.; Satmurzaev, A.A.; Insigenova, A.E.; Salavatova, Z.T. Study of the Main Characteristics and Intra-Annual Distribution of the Water Flow of the Rivers of the Territory of Almaty City. Hydrometeorol. Ecol. 2021, 3, 44–62. (In Russian) [Google Scholar] [CrossRef]
  82. STO GGI 52.08.48-2020; Selection of a Digital Cartographic Base for Determining Hydrographic Characteristics. FSBI SHI: Saint Petersburg, Russia, 2020. (In Russian)
  83. R 52.08.874-2018; Determination of Hydrographic Characteristics by Cartographic Method. FSBI SHI: Saint Petersburg, Russia, 2018. (In Russian)
  84. STO GGI 52.08.40-2017; Determination of Morphometric Characteristics of Terrestrial Water Bodies and Their Catchment Areas Using Geographic Information System Technology Based on Digital Maps of the Russian Federation and Satellite Images. FSBI SHI: Saint Petersburg, Russia, 2017. (In Russian)
  85. Shikhov, A.N.; Gerasimov, A.P.; Ponomarchuk, A.I.; Perminova, E.S. Thematic Decoding and Interpretation of Medium- and High-Resolution Satellite Images: Textbook; Perm State National Research University: Perm, Russia, 2020; p. 191. (In Russian) [Google Scholar]
  86. Ophra, S.J.; Begum, S.; Islam, R.; Islam, M.N. Assessment of bank erosion and channel shifting of Padma River in Bangladesh using RS and GIS techniques. Spat. Inf. Res. 2018, 26, 599–605. [Google Scholar] [CrossRef]
  87. Farris, A.S.; Long, J.W.; Himmelstoss, E.A. Accuracy of shoreline forecasting using sparse data. Ocean. Coast. Manag. 2023, 239, 106621. [Google Scholar] [CrossRef]
  88. Leontyev, O.K.; Rychagov, G.I. General Geomorphology; Vysshaya Shkola: Moscow, Russia, 1979; p. 287. (In Russian) [Google Scholar]
  89. Chalov, R.S. Channel Studies: Theory, Geography, Practice. Vol. 1. Channel Processes: Factors, Mechanisms, Forms of Manifestation and Conditions for the Formation of River Channels; LKI Publishing House: Moscow, Russia, 2008; p. 608. (In Russian) [Google Scholar]
  90. Chalov, R.S. Types of Channel Processes and Principles of Morphodynamic Classification of River Channels. Geomorphology 1996, 1, 25–36. (In Russian) [Google Scholar]
  91. Baryshnikov, N.B. Anthropogenic Impact on Self-Regulating Systems: River Basin–Streamflow–Channel; Russian State Hydrometeorological University: Saint Petersburg, Russia, 1999; p. 218. (In Russian) [Google Scholar]
  92. Baryshnikov, N.B.; Pagin, A.O. Hydraulic Resistance of River Channels. Bull. Admiral S.O. Makarov State Univ. Marit. Inland Shipp. 2010, 6, 90–93. (In Russian) [Google Scholar] [CrossRef]
  93. Khan, Z.U.; Khan, D.; Murtaza, N.; Pasha, G.A.; Alotaibi, S.; Rezzoug, A.; Benzougagh, B.; Khedher, K.M. Advanced Prediction Models for Scouring Around Bridge Abutments: A Comparative Study of Empirical and AI Techniques. Water 2024, 16, 3082. [Google Scholar] [CrossRef]
  94. Zeeshan, A.; Nadir, M.; Ghufran, A.P.; Sohail, I.; Abdul, R.G.; Fakhar, M.A. Predicting scour depth in a meandering channel with spur dike: A comparative analysis of machine learning techniques. Phys. Fluids 2025, 37, 045158. [Google Scholar] [CrossRef]
Figure 1. Ulken Almaty River basin.
Water 17 02029 g001
Figure 2. Flowchart for predicting river channel dynamics.
Water 17 02029 g002
Figure 3. Hydrographs of the channel-forming and full-channel water discharges at the hydrological station “Ulken Almaty River—1.1 km above Ulken Almaty Lake”.
Water 17 02029 g003
Figure 4. Delineation of the Ulken Almaty River channel in different years: (A) downstream; (B) midstream; (C) upstream.
Water 17 02029 g004aWater 17 02029 g004b
Figure 5. Spatial distribution of erosion and accretion of the Ulken Almaty River channel from 2012 to 2021: (a) upstream; (b) midstream; (c) downstream.
Water 17 02029 g005aWater 17 02029 g005b
Figure 6. Channel dynamics of the Ulken Almaty River ((a)—upstream; (b)—midstream; (c)—downstream), 2012–2021.
Water 17 02029 g006
Figure 7. Forecast of right (a) and left (b) bank line shifts of the Ulken Almaty River (upstream).
Water 17 02029 g007
Figure 8. Forecast of right (a) and left (b) bank line shifts of the Ulken Almaty River (midstream).
Water 17 02029 g008
Figure 9. Forecast of right (a) and left (b) bank line shifts of the Ulken Almaty River (downstream).
Water 17 02029 g009
Table 1. Time points for selecting satellite images.
SectionsUpstream SectionMidstream SectionDownstream Section
Image date12 August 201212 August 201219 August 2012
--15 August 2013
14 May 201414 May 201414 May 2014
15 August 201515 August 201515 August 2015
9 July 20169 July 201612 August 2016
17 June 201717 June 201717 June 2017
20 July 201820 July 201820 July 2018
--18 June 2019
13 July 202021 June 202028 May 2020
22 August 202122 August 202122 August 2021
Table 2. Morphometric parameters of watercourse and watershed of the Ulken Almaty River.
No.SectionWatershed AreaStream LengthStraight-Line LengthChannel WidthDrainage DensityRiver Source ElevationRiver Mouth ElevationElevation DifferencesRiver SlopeTortuosity Coefficient
F, km2L, kmL’, kmB, kmDd, km/km2H1, kmH2, kmΔH, kmI, ‰I, 0K
1Upstream (>2500 m)2137.997.1011.70.043.102.510.6074.84.291.12
2Midstream (2500–1000 m)93.318.716.27.700.202.511.001.5180.54.611.15
3Downstream (<1000 m)16550.141.513.00.301.000.560.448.720.501.21
Table 3. Evolution of the morphometric parameters of watercourse and watershed of the Ulken Almaty River between 2012 and 2021.
YearsSectionRiverbed Area Islet Area Water Surface AreaChannel Centreline LengthStraight-Line LengthChannel Width Tortuosity Coefficient
m2m2m2mmBave, mBmax, mBmin, m
2012Upstream18,729310115,628196417979.8851.63.931.09
2013---------
201416,630281713,812198518018.6451.82.981.10
201525,787550920,2781973176514.162.31.811.12
201623,146285920,2871955177512.554.84.361.10
201724,833433820,4951946178512.953.54.461.09
201825,676288322,7931944180314.260.05.691.08
2019---------
202019,522276816,7531951179910.249.02.781.08
202121,578356018,0171984179710.851.74.061.10
2012Midstream13,20637312,833237621536.215.81.01.10
2013---------
201410,33825710,081241521514.934.01.21.12
201517,31057616,734238021568.020.91.31.10
201621,35816321,195240221629.921.23.71.11
201722,45333922,1142383216410.521.22.91.10
201818,06153617,525237021498.618.12.41.10
2019---------
202013,14316012,983237521556.418.61.71.10
202115,37337314,999239521517.019.21.71.11
2012Downstream46,16964245,5274111235512.333.52.871.75
201349,40259848,8044095235413.052.14.471.74
201441,109131639,7924182235410.632.14.141.78
201552,44962051,8294082235413.744.54.861.73
201650,60141250,1883816235614.239.75.831.62
201750,68337950,3043805235713.831.35.051.61
201849,86846549,4033839235413.740.84.211.63
201948,57541848,1573855235513.329.75.341.64
202053,18938752,8023853235514.635.55.991.64
202138,966120837,7583894235510.425.41.711.65
Table 4. Areas of channel changes in the Ulken River, Almaty: erosion, accretion, and unchanged areas.
YearsErosion Area, m2Accretion Area, m2Unchanged Area, m2
UpstreamMidstreamDownstreamUpstreamMidstreamDownstreamUpstreamMidstreamDownstream
2012–2013--3330--6563--42,839
2013–2014--18,465--10,172--30,937
2014–201512,7917293715521,94914,26518,4953838304533,954
2015–20169703508523,6527061913321,80416,08412,22528,797
2016–20175086679319,3566773788719,43918,06014,56531,245
2017–2018812519,07314,360896814,68213,54516,707338036,323
2018–2019--7979--6686--41,889
2019–2020--8562--13,175--40,013
2020–2021596410,15523,227802012385900413,558298829,962
Table 5. Erosion and accretion rate summary of Ulken Almaty River.
Riverbank Change AnalysisRight BankLeft Bank
LRR (m/year)EPR (m/year)LRR (m/year)EPR (m/year)
UpstreamAverage erosion rate−0.49−0.33−1−1
Average accretion rate1.151.580.250.19
Maximum erosion rate−11.5−9−5.78−4.54
Maximum accretion rate26.335.61.050.65
MidstreamAverage erosion rate−0.62−0.70−0.750
Average accretion rate0.280.320.320.34
Maximum erosion rate−2.11−2−3−10.5
Maximum accretion rate1.861.873.283
DownstreamAverage erosion rate−10−0.560
Average accretion rate1.231.151.591
Maximum erosion rate−13.4−12.5−8.81−8.79
Maximum accretion rate1211.014.818.1
Disclaimer/Publisher’s Note: The statements, opinions and data contained in all publications are solely those of the individual author(s) and contributor(s) and not of MDPI and/or the editor(s). MDPI and/or the editor(s) disclaim responsibility for any injury to people or property resulting from any ideas, methods, instructions or products referred to in the content.

