Article

Risk Analysis and Assessment of Water Supply Projects Using the Fuzzy DEMATEL-ANP and Artificial Neural Network Methods

by
Mohammad Khalilzadeh
1,*,
Sayyid Ali Banihashemi
2,
Ali Heidari
3,
Darko Božanić
4 and
Aleksandar Milić
4,*
1
Industrial Engineering Department, Faculty of Engineering and Natural Sciences, Istinye University, Sarıyer, Istanbul 34396, Turkey
2
Department of Industrial Engineering, Payame Noor University, Tehran 193954697, Iran
3
School of Industrial Engineering, College of Engineering, University of Tehran, Tehran 1417614411, Iran
4
Military Academy, University of Defence, 11000 Belgrade, Serbia
*
Authors to whom correspondence should be addressed.
Water 2025, 17(13), 1995; https://doi.org/10.3390/w17131995
Submission received: 5 May 2025 / Revised: 3 June 2025 / Accepted: 20 June 2025 / Published: 2 July 2025

Abstract

Today, companies face complexities and uncertainties that make it difficult to manage various risks. One of the important tools for achieving success in water supply projects is the proper implementation of risk management processes and activities throughout the project’s make-span. Risk identification and assessment are two important steps in project risk management. In this research, the Fuzzy DEMATEL and Fuzzy ANP as well as Artificial Neural Network methods are exploited for the analyzing and ranking of environmental risks of water supply projects. Risks are classified and then prioritized by the Fuzzy ANP and Artificial Neural Network methods into four main categories, including technical, organizational, project management, and external risks. The weight of each of the technical, organizational, project management, and external risks using the ANP method was obtained as 0.31, 0.26, 0.25, and 0.18, respectively, and the following weights were obtained using the Artificial Neural Network: 0.42, 0.27, 0.22, and 0.09, respectively. The results show that although the exact weights differed between methods, especially for technical and external risks, the overall prioritization of risk categories followed a broadly consistent pattern. In addition, the risk associated with the suppliers obtained the highest weight among the external risks; the risk associated with the high cost of materials gained the highest weight among the organizational risks; the risk associated with the requirements acquired the highest weight among the technical risks; and finally, the risk associated with communication achieved the highest weight among the project management risks. The method presented in this research helps project managers and decision-makers in the water supply industry to make a better and more realistic risk assessment by considering the mutual effects of project risks.

1. Introduction

The development and optimization of water supply networks are critical components in ensuring the sustainable management of water resources, especially in the face of rapid urbanization and climate change. Recent studies have underscored the importance of strategic planning and innovative design in the construction of these networks [1,2]. These studies collectively highlight the multifaceted challenges and innovative solutions associated with the construction and optimization of water supply networks. They underscore the critical need for interdisciplinary approaches that combine engineering, environmental science, and socio-economic considerations to develop resilient and efficient water infrastructure systems.
As these projects scale up, there is a growing need to balance development with environmental sustainability to minimize negative impacts on the ecosystem [3]. These activities are often associated with significant environmental pollution, and require governments, industries, and stakeholders to adopt cost-effective and eco-friendly solutions [4]. The growing emphasis on sustainable development and environmental stewardship has prompted the adoption of more sustainable practices in the construction of water supply networks [5,6]. To assess the true environmental impacts, it is crucial to evaluate the sources and nature of emissions and their contributions to environmental degradation, affecting water, air, soil, and biodiversity [7].
Despite significant efforts to integrate sustainability into the construction projects of water supply networks, many large-scale infrastructure initiatives fail to meet their initial objectives. Approximately 98% of projects suffer from cost overruns or schedule delays. On average, the actual costs of projects exceed initial estimates by 80%, and project timelines are frequently extended by more than 20 months [8]. This highlights the critical need for improved risk management practices to address the uncertainties associated with these projects and ensure their timely, cost-effective completion.
Risk management is a crucial concern across all types of projects [9,10]. In civil engineering, effective risk management involves identifying, assessing, and mitigating risks to maximize the likelihood of favorable outcomes and minimize negative impacts. According to Polishchuk et al. [11], risk management processes are vital in identifying and managing potential hazards to reduce uncertainty and enhance project success. It involves systematically identifying major risks, evaluating their potential impacts, and implementing strategies to minimize or avoid these risks [12]. The process of risk assessment typically begins with identifying risk threats, estimating their likelihood, and evaluating their impact on the project’s activities [13,14]. Once the main risks are identified, their severity and probability are analyzed, allowing for prioritization and the development of effective mitigation strategies [15].
While risk management techniques are widely utilized in project-based industries, there is a noticeable gap in studies specifically focused on managing environmental risks in civil engineering projects. Most of the research in this field has tended to overlook environmental risks, focusing more on financial, technical, or operational risks. This is especially concerning as the environmental impacts of construction projects can be severe and far-reaching. Recent studies, such as those by Alvarado et al. [16] and Hatefi and Tomošaitienė [17], argue for the integration of environmental risk management frameworks in civil engineering projects to address pollution, habitat disruption, and resource depletion. However, despite these calls for more environmental consideration, structured approaches for identifying and mitigating environmental risks in construction projects are still underdeveloped [18].
Hence, this study bridges the gap by integrating Fuzzy DEMATEL-ANP and an ANN to assess environmental risks in water supply projects, addressing the lack of dynamic risk assessment frameworks in the existing literature [16]. This research focuses specifically on the identification and mitigation of environmental risks in civil engineering projects, particularly those associated with air, water, and soil contamination, while also incorporating broader health and safety concerns. The novelty of this study lies in its structured approach to environmental risk identification, using a combination of DEMATEL-ANP (Decision-Making Trial and Evaluation Laboratory–Analytical Network Process) and Artificial Neural Network (ANN) methods. By leveraging these methodologies, this research aims to provide a comprehensive decision-making framework for environmental risk management in civil engineering projects.
The necessity of this research is driven by the growing emphasis on sustainable development, the increasing complexity of modern infrastructure projects, and the pressing need to mitigate environmental risks. Effective environmental risk management is not only essential for protecting the ecosystem but also for ensuring the long-term viability of construction projects. As infrastructure development continues to expand, particularly in urban areas, it becomes crucial to assess and manage the environmental consequences of construction projects to avoid long-term harm to the environment.
The objectives of this study are as follows:
  • Identifying the key factors influencing environmental risks in civil engineering projects;
  • Examining the likelihood of various environmental risks occurring in these projects;
  • Analyzing the factors affecting environmental risks using a combination of DEMATEL-ANP and ANN techniques;
  • Evaluating the impact of environmental risks on project outcomes using the DEMATEL method;
  • Ranking the environmental risks using the Fuzzy ANP method;
  • Assessing the relative weight of environmental risks using ANN methods.
The research employs a multi-criteria decision-making (MCDM) approach to evaluate and rank the factors influencing environmental risk management in civil engineering projects. MCDM techniques, particularly DEMATEL, ANP, and fuzzy logic, are widely recognized for their ability to handle complex decision-making environments with multiple conflicting criteria [19,20,21]. DEMATEL is used to model cause-and-effect relationships among environmental risks, providing a deeper understanding of the interactions between various risk factors [22,23]. The Fuzzy ANP method enhances decision-making by incorporating expert opinions and handling the uncertainty associated with risk assessments [24]. ANNs are applied to assess the relative weight of environmental risks based on historical data and expert judgment, improving the precision of environmental risk prioritization.
The novelties of the present research include the following:
Hybrid methodology:
  • This study introduces a novel hybrid approach combining Fuzzy DEMATEL-ANP and an ANN for the environmental risk assessment in water supply projects. While DEMATEL and the ANP have been used separately in risk management, their integration with fuzzy logic and ANN methods to handle uncertainties and dynamic interdependencies among risks is a significant advancement.
  • The ANN component further enhances the model’s adaptability by learning from data, offering a data-driven complement to the expert-driven Fuzzy DEMATEL-ANP framework.
Focus on environmental risks:
  • Unlike prior studies that predominantly address financial, technical, or operational risks in projects, this research specifically targets environmental risks (e.g., pollution, resource depletion, and climate impacts) in water supply projects. This fills a critical gap in the literature, as environmental risks are often underrepresented despite their growing regulatory and societal importance.
Dynamic risk prioritization:
  • This study not only ranks risks statistically but also models their cause–effect relationships via DEMATEL and weighted interdependencies via ANP. This dual analysis provides a more nuanced understanding of which risks are drivers (causes) and which are outcomes (effects), enabling targeted mitigation strategies.
Validation with real-world data and application:
  • The framework is applied to two real-world water supply projects, demonstrating its practicality. In addition, the validation via the ANN bridges the gap between theoretical models and field applications.
The significance of this study can be stated as follows:
Practical implications for project managers:
  • This study offers a decision-making toolkit for prioritizing environmental risks, such as supplier-related risks (highest in external risks) and high material costs (top organizational risk). This aids managers in allocating resources effectively to mitigate high-impact risks.
Contribution to sustainable development:
  • By integrating environmental risk management into project planning, this study aligns with the UN’s Sustainable Development Goals (SDGs), particularly SDG 6 (Clean Water and Sanitation) and SDG 11 (Sustainable Cities). It addresses the urgent need to balance infrastructure development with ecological preservation.
Methodological advancements:
The hybrid model advances the multi-criteria decision-making (MCDM) literature by achieving the following:
Handling linguistic ambiguities in expert judgments (fuzzy logic);
Capturing non-linear relationships among risks (ANN);
Providing a scalable framework adaptable to other infrastructure projects.
Policy and regulatory relevance:
  • The findings underscore the importance of regulatory frameworks for environmental risk mitigation, offering empirical support for stricter compliance in water supply projects.
The structure of this paper is as follows: Section 2 provides a detailed review of the literature on environmental risk management in civil engineering projects and the application of MCDM techniques. Section 3 outlines the research methodology, detailing the integration of DEMATEL, ANP, and ANN methods for the environmental risk assessment. Section 4 presents the results of the case study, while Section 5 concludes this paper by summarizing the findings and discussing the implications of this study for future research and practice.

2. The Literature Review

The rapid growth of infrastructure projects, particularly in civil engineering, has intensified the need for effective risk management frameworks that can address the multifaceted risks, including environmental, financial, and operational challenges. This is especially important as environmental risks associated with construction and infrastructure development have become a major concern due to their long-lasting and sometimes irreversible impacts on ecosystems and human health [4]. In the context of project portfolio management, understanding and mitigating these risks is critical to ensuring the success and sustainability of large-scale projects [25,26].

2.1. Recent Studies on Water Supply Network Projects

The construction and optimization of water supply networks have been extensively studied due to their critical role in sustainable urban development and efficient resource management. Recent research has focused on various aspects, including network resilience, supply and demand optimization, and sustainability-driven construction methodologies.
Zhang et al. [27] developed an integrated hydraulic optimization model to improve the efficiency of municipal water distribution systems. Their approach, based on graph-theoretical analysis, facilitated an optimal configuration of pipe layouts, reducing energy consumption and minimizing operational risks. While their model significantly enhanced pressure management and leakage detection, the study lacked real-time adaptability to dynamic environmental conditions.
Similarly, Biswas et al. [28] examined the impact of urban expansion on water supply infrastructure, proposing a demand-based network expansion model. Their findings highlighted the necessity of adaptive planning strategies to address population growth and climate variability. However, their model did not fully integrate real-time monitoring mechanisms, which are essential for ensuring long-term system resilience.
The environmental sustainability of water supply network construction has been a major research focus. Sun et al. [29] explored the life-cycle environmental impact of water supply infrastructure, identifying critical factors influencing carbon emissions and resource consumption. Their study advocated for the adoption of green construction materials and low-energy treatment processes to mitigate ecological footprints. However, the study primarily focused on large-scale urban projects and did not extensively examine small- and mid-sized water supply networks, which also play a crucial role in rural development.
In addition, Macchiaroli et al. [30] introduced a sustainability assessment framework that integrates multi-criteria decision-making (MCDM) techniques to evaluate the environmental, social, and economic dimensions of water infrastructure projects. Their findings emphasized the importance of stakeholder engagement in promoting sustainable project outcomes. However, their model faced challenges in balancing cost-efficiency with sustainability metrics, which remains a key issue in developing economies.
Ensuring the resilience of water distribution networks is a critical research area, particularly in response to climate change and extreme weather events. Asadi [31] developed a risk-based asset management model for aging water infrastructure, incorporating machine learning techniques to predict pipe failures and optimize maintenance schedules. Their findings demonstrated the effectiveness of predictive analytics in reducing operational disruptions. However, the study did not consider the economic feasibility of implementing such advanced systems in low-income urban areas. Another significant contribution by Ward et al. [32] focused on disaster preparedness in water supply systems, particularly in areas prone to floods and droughts. Their resilience framework integrated hydraulic modeling and climate risk projections, enabling proactive adaptation strategies. While their approach improved network robustness, further research is required to incorporate real-time sensor data for more dynamic risk assessments.
Recent studies have increasingly emphasized dynamic risk assessment for climate adaptation. For instance, Xu et al. [33] quantify flood impacts using real-time hydrological data and network theory, while Cai et al. [34] integrate virtual water flows with infrastructure resilience metrics. These approaches demonstrate the value of multi-source data fusion—a direction our ANN framework could adopt by incorporating climate projections or sensor-derived degradation rates.

2.2. Recent Advances in Risk Management Frameworks

Several studies have made significant strides in developing risk management models that incorporate environmental risks. Zhang and Chen [35] utilized the BP-DEMATEL model to evaluate the key factors influencing proposal evaluation in government green procurement projects in China. Their approach demonstrated how risk factors such as environmental impact and sustainability could be incorporated into procurement decisions. However, the use of the BP-DEMATEL model presents challenges when addressing dynamic environmental risks as the model relies heavily on fixed inputs from decision-makers, which may not capture evolving environmental concerns adequately. In a similar vein, Shahabi et al. [36] proposed a fuzzy model based on Multi-Attribute Decision-Making (MADM) to prioritize investment risks in Iran’s mining industry. The study’s fuzzy approach allowed for better handling of uncertainty and expert subjectivity, particularly in the context of environmental risks in mining operations. However, the model was limited by its inability to adapt to real-time changes in environmental conditions, making it less applicable for long-term environmental risk management where conditions may change rapidly due to regulatory shifts or unforeseen events.
Kao et al. [37] employed a DEMATEL-Formative approach to assess sustainable development in the manufacturing industry. This hybrid approach, combining DEMATEL with a formative model, provides a nuanced assessment of sustainability-related factors, including environmental risks. However, Kao et al.’s study does not sufficiently address how environmental risks interact with other factors such as financial and operational risks, which could lead to oversimplified decision-making in complex projects. Also, Gani et al. [38] integrated DEMATEL-MMDE-ISM approaches to analyze environmental sustainability indicators in SMEs. Their model was successful in highlighting the importance of sustainability for small enterprises but the approach was limited by its lack of scalability for larger organizations involved in more complex projects. Moreover, the environmental sustainability indicators identified were not always directly applicable to the construction or infrastructure sectors, which involve more complex, large-scale environmental considerations.

2.3. Recent Approaches to Environmental Risk Assessment

Lin et al. [39] applied fuzzy set theory and machine learning techniques to assess risks in drilling systems. The study contributed to the literature by integrating machine learning for dynamic and real-time risk assessments, making it suitable for industries that face constant environmental fluctuations. However, the study’s applicability to large-scale infrastructure projects remains limited as it primarily focuses on drilling—a relatively specialized area of civil engineering. The lack of direct applicability to broader environmental risks such as air pollution and land degradation makes this approach less versatile for other sectors. Meanwhile, Tavassolirizi et al. [40] used the Analytic Network Process (ANP) to identify factors influencing delays in railway projects. While the study identified critical risks affecting project timelines, it did not integrate environmental risk factors, which have become increasingly significant in infrastructure development. The addition of an environmental risk assessment model could have further enhanced the study’s relevance, particularly in light of growing environmental regulations in the transport sector. Moreover, Feng et al. [41] focused on the sustainable risks in grape production using optimized BP neural networks. Although the study demonstrated the effectiveness of ANNs in managing risks, it lacked a comprehensive approach to environmental risks as it primarily targeted agricultural production. The methodology could be extended to infrastructure projects by incorporating more relevant environmental risks, such as water usage, air pollution, and ecological degradation, which are critical in construction projects.

2.4. Integrated Approaches and Gaps in Environmental Risk Management

Zhang et al. [9] employed an integrated fuzzy comprehensive evaluation and AHP method to assess risks in seawater desalination projects. The study addressed both technical and environmental risks in large-scale infrastructure projects but did not fully capture the dynamic nature of environmental changes, such as those induced by climate change or shifting regulatory standards. The application of this method could be improved by integrating real-time data to better anticipate environmental risks over the course of a project’s life-cycle. Andrić et al. [42] examined risks in railway projects, focusing on financial and operational risks but neglecting the environmental dimension. This gap in their risk assessment model highlights the lack of comprehensive frameworks that consider the increasing importance of environmental factors in project management. Similarly, Wu and Zhou [43] identified critical risk factors for construction projects but did not integrate environmental risks, even though environmental issues are now seen as integral to sustainable development in construction and civil engineering.
Campbell et al. [44] addressed environmental risks in seaweed farming development in Europe. Their study provides useful insights into environmental risks in a niche area of agriculture but does not address the broader spectrum of environmental risks in large-scale civil engineering or infrastructure projects. As seaweed farming is not directly comparable to construction projects, the study’s applicability to infrastructure risk management remains limited. Chen et al. [45] introduced a DEMATEL-ANP hybrid model for project risk management, providing valuable insights into mitigating risks and improving organizational performance. However, like many of the studies reviewed, their focus was more on general risk management and less on the specific environmental risks that increasingly dominate public and governmental concerns. Incorporating environmental risk factors into such models could enhance their relevance for sustainability-focused projects [46].

2.5. Research Gaps and Contributions of the Present Study

This study makes a meaningful contribution to the field of environmental risk management in civil engineering, particularly in the context of water supply projects. Its primary advancements are outlined as follows: Previous studies have extensively addressed financial, technical, and operational risks in infrastructure projects; however, environmental risks remain underexplored. This manuscript explicitly focuses on environmental risk factors, addressing an urgent and overlooked dimension in the project management literature, as emphasized in the Introduction and The Literature Review Sections. In addition, the integration of Fuzzy DEMATEL, Fuzzy ANP, and ANN methods in a single risk assessment model represents a significant methodological advancement. While these methods have been used independently or in limited combinations, their fusion in this study provides a more nuanced and adaptive approach to environmental risk analysis, capable of capturing both causal relationships (via DEMATEL), interdependencies (via the ANP), and dynamic learning (via the ANN). Unlike static models, this study introduces dynamic adaptability through the ANN component. It enables the model to recalibrate based on evolving expert input and environmental data. This is especially relevant in the context of increasing regulatory volatility and climate uncertainty, enhancing the practical utility of the framework. This study validates the proposed model using two actual water infrastructure projects in Tehran, demonstrating its real-world applicability. This grounding in practice bridges the gap between theoretical modeling and field implementation, a limitation in many existing studies. Also, this research aligns with and supports SDG 6 (Clean Water and Sanitation) and SDG 11 (Sustainable Cities and Communities), thereby contributing to global sustainability targets. By prioritizing environmental risks, this study provides a tool that can guide infrastructure development toward greater ecological responsibility. Moreover, the framework’s design allows for its adaptation to other infrastructure projects beyond water supply—making it a valuable, scalable model for broader application in sustainable project risk management.

3. Materials and Methods

In this study, a library research method was employed to collect foundational information for defining key concepts, planning essential needs, and explaining applications and their importance. For theoretical foundations and the literature review, relevant articles and books were utilized. In addition, internal and external study backgrounds were gathered through literature-based methods [47].
The required data for determining evaluation criteria, relationships between indices, and their interdependencies—used for weighting and creating an impact network—were sourced from the project management unit of an engineering company specializing in power plant projects. This company has implemented gas and steam turbine production for large-scale power plants and is working on producing industrial turbines with a capacity of 25 MW and associated compressors.
This research employs fuzzy logic due to its high flexibility in analyzing natural language expressions commonly used by experts. This approach aids in modeling and analyzing ambiguities stemming from human judgment and environmental uncertainties. In addition, triangular fuzzy numbers were chosen for their intuitive representation and ease of calculation [44]. Fuzzy numbers represent a range of possible values instead of a fixed, deterministic value, offering richer information about variables compared to deterministic numbers, which provide only a single precise value [48].
The Fuzzy DEMATEL method was utilized to evaluate performance criteria and related indices. This study’s data analysis was conducted through six steps:
  • Criteria Identification: Criteria and risk characteristics were determined through the literature review, expert consultations, and questionnaires. Validity checks were subsequently performed.
  • Impact Analysis via Fuzzy DEMATEL: This step determined the influence of each aspect on others using the Fuzzy DEMATEL method.
  • Weight Calculation using Fuzzy Inference System: This stage involved calculating the weights of identified risks.
  • Comparison of Calculated Weights: Weights obtained in Step 2 were compared with those from Step 3, and the final weights were determined.
  • Risk Prioritization: Risk weights and rankings were determined using the Fuzzy ANP method.
  • Model Validation: The entire model was validated using an ANN.

3.1. Fuzzy DEMATEL Technique

The DEMATEL technique is a decision-making method based on pairwise comparisons. It uses expert judgments to extract system factors and systematically structure them through graph theory principles. DEMATEL provides a hierarchical representation of system factors along with their interrelationships, quantifying their intensity as numerical scores.
This technique identifies and analyzes the interrelationships between criteria, constructing a network map. Directed graphs are used to better depict the relationships between system elements, dividing them into cause-and-effect groups and making the relationships comprehensible as a structural model.
DEMATEL is widely applied in addressing complex global issues and structuring sequences of presumed information. It assesses the intensity of interconnections, investigates feedback loops, and considers non-transitive relationships.
Steps for the Fuzzy DEMATEL method
Step 1: Forming Expert Groups: Gather collective knowledge to solve the problem.
Step 2: Identifying Evaluation Criteria and Designing Linguistic Scales: Experts identify research factors and indices, with evaluation criteria selected based on relevant domains. Linguistic scales and their corresponding fuzzy values are detailed in Table 1. These scales align with the traditional DEMATEL but use fuzzy numbers.
In MCDM problems, decision-makers primarily focus on ranking dimensions relative to identified criteria. A group of decision-makers provides linguistic assessments on the influence of criteria using a five-point linguistic scale from “No Influence” to “Very High Influence”. Table 1 presents the linguistic variables used in Fuzzy DEMATEL.
Step 3: Creating the Initial Fuzzy Direct Relationship Matrix by Collecting Expert Opinions: To measure the relationships between criteria, they must be placed in a square matrix, and experts are asked to compare them pairwise based on the extent of their influence on each other. In this survey, experts express their opinions based on Table 1. Assuming there are n criteria and p experts, we have p fuzzy matrices, each corresponding to the opinions of one expert with triangular fuzzy numbers as their elements.
Step 4: Normalizing the Fuzzy Direct Relationship Matrix: For this purpose, a linear scale transformation is used as the normalization formula to convert the scales of the criteria into comparable ones.
a ~ i j = j = 1 n Z ~ i j = j = 1 n l i j , j = 1 n m i j , j = 1 n r i j   a n d   r = max 1 i n j = 1 n r i j
X ~ = X ~ 11 X ~ 1 n X ~ m 1 X ~ m m   a n d   X ~ i j = Z ~ i j r = l i j r , m i j r , r i j r
Step 5: Calculating the Fuzzy Total Relationship Matrix: In this step, the inverse of the normalized matrix is first calculated, then subtracted from the matrix III, and finally, the normalized matrix is multiplied by the resulting matrix.
l i j = X l × I X l 1
m i j = X m × I X m 1
r i j = X r × I X r 1
Step 6: Creating and Analyzing the Causal Diagram: In this step, the sum of the elements of each row (Di) and the sum of the elements of each column (Ri) of the fuzzy matrix are calculated. The sum of the elements in each row (D) for each factor indicates the level of influence that factor has on other factors in the system. The sum of the elements in each column (R) for each factor indicates the level of influence that factor receives from other factors in the system.
Next, the values of D + RD + RD + R and D − RD − RD − R are easily obtained. To draw the causal diagram, similar to the deterministic DEMATEL method, these two values need to be defuzzified. In this case, the CFCS method is used for defuzzification. Therefore, the horizontal vector (D + RD + RD + R) represents the level of influence and interaction of the factor within the system. In other words, the higher the value of D + RD + RD + R for a factor, the greater the interaction it has with other factors in the system. The vertical vector (D − RD − RD − R) indicates the power of the influence of each factor. Generally, if D − RD − RD − R is positive, the variable is considered an independent (causal) variable; if it is negative, it is considered a dependent (effect) variable.
Step 7: After defuzzifying the numbers, a Cartesian coordinate system is drawn. In this system, the longitudinal axis represents the values of D + RD + RD + R, and the transverse axis represents D − RD − RD − R. Therefore, the horizontal vector in the coordinate system shows the level of influence and interaction of the factor in the system. In other words, the higher this value for a factor, the greater its interaction with other factors in the system. The vertical vector in the coordinate system shows the strength of influence of each factor. Generally, if this value is positive for a factor, it is considered an independent variable, and if it is negative, it is considered a dependent variable [23].

3.2. Fuzzy ANP Method

The Fuzzy ANP method is a multi-criteria decision-making (MCDM) approach related to fuzzy environments. In this method, the Fuzzy ANP technique is performed using the super matrix technique. The weights of the criteria can be obtained using methods such as the Chang method or the improved method. Then, the final weight is calculated using the ANP super matrix technique [49]. The steps of this method are as follows:
Step 1: Identification of Criteria, Sub-criteria, or Research Options: In this step, the factors and components of the research need to be extracted through methods such as the literature review or expert opinions and surveys.
Step 2: Determination of Relationships Between Factors and Components: One of the steps in the Fuzzy ANP method is to obtain the internal relationships. This can be performed through methods such as Fuzzy DEMATEL or collective expert opinions.
M i j = l i j , m i j , u i j
l i j = min B i j k
m i j = k = 1 n B i j k n
u i j = max B i j k
Step 3: Formation of Pairwise Comparison Tables and Calculation of Weights: Based on the network diagram of the research, pairwise comparison tables are formed, and the weights of the criteria and sub-criteria are determined. Pairwise comparisons are generally completed based on the fuzzy 9-point scale. The process is carried out as follows: first, the fuzzy pairwise comparisons are provided to the experts. After responding, the Fuzzy ANP inconsistency rate is calculated, and then, using the geometric mean method, the comparisons are integrated.
S k = j = 1 n M k j i = 1 m j = 1 n M i j 1
Step 4: Formation of the Initial Super matrix: Based on the weights obtained in the third step, the initial ANP super matrix is created. This super matrix essentially represents the relative weights that were calculated in step three.
V M 1 M 2 = 1 V M 1 M 2 = 0 V M 1 M 2 = hgt M 1 M 2
Step 5: Weighted Super matrix: In this step, the weighted super matrix is obtained. The weighted super matrix is derived from normalizing the initial super matrix. To normalize, each element is divided by the sum of the elements in each column.
w X i = W C 1 , W C 2 , , W C n T
Step 6: Limit Super matrix and Final Weights of Criteria: By raising the weighted matrix to a power, the limit matrix is obtained, which represents the final weights of the criteria and sub-criteria of the research.
W i = w i w i

3.3. Artificial Neural Networks (ANNs)

ANNs process information in a manner similar to how the human brain operates. They are composed of numerous processing elements (neurons) that are highly interconnected and work in parallel to solve a specific problem. Neural networks work by example and cannot be programmed to solve a specific problem. Therefore, an ANN is an idea for processing information inspired by the biological nervous system, processing information in a way that resembles the brain. The key element of this idea is the new structure of the information processing system. This system consists of a large number of highly interconnected processing elements called neurons, which coordinate to solve a problem. Like humans, ANNs learn by example, and an ANN is trained during a learning process to perform specific tasks such as pattern recognition and data classification. ANNs transfer knowledge or hidden rules from the data to the network’s structure during the learning process. Learning ability is the most important feature of an intelligent system. A system capable of learning is more flexible and easier to program, making it better at responding to new problems and equations. Consequently, the system is better able to handle new issues and equations. Humans have been trying for a long time to understand the biophysiology of the brain because the issues of human intelligence, learning, generalization, creativity, flexibility, and parallel processing in the brain have always been fascinating. The application of these capabilities in machines is highly desirable [7].
Algorithmic methods for implementing these features in machines are not suitable, so the methods should be based on biological models. Just like humans learn through example—such as a child recognizing different types of animals by seeing them—an ANN is a data processing system inspired by the human brain. It delegates the task of processing data to small, highly interconnected processors that work in parallel to solve a problem. In these networks, through programming knowledge, a data structure is designed to function like a neuron. This data structure is called a node. A network is then created between these nodes, and by applying a learning algorithm, the network is trained. In this memory or neural network, the nodes have two states—active (on or 1) and inactive (off or 0)—and each edge (synapse or connection between nodes) has a weight. Positive weights cause the activation of the next inactive node, while negative weights deactivate or inhibit the next node (if it is active) [7].
In this study, ANNs are used not only as a validation mechanism but also as a potential tool for dynamic adaptation in risk prioritization. To enhance the methodological innovation, this research incorporates a multilayer perceptron (MLP) ANN with backpropagation that goes beyond static validation. The ANN was designed to learn from historical expert data and predict the relative importance of environmental risk categories. Furthermore, a framework is proposed for integrating time-sensitive variables (such as seasonal climate data or market fluctuations) as dynamic inputs to retrain the model periodically, allowing the ANN to adaptively recalibrate risk weights. In addition to training the MLP model, an exploratory comparison was conducted with alternative machine learning architectures, including decision trees and support vector machines. The MLP demonstrated the highest performance in terms of predictive accuracy and generalization, thereby justifying its use. Future iterations of the model could integrate recurrent neural networks (RNNs) for temporal pattern recognition, particularly if time-series environmental data become available. These extensions position the ANN as an adaptive learning component in the overall risk assessment framework, making the approach more resilient and responsive to evolving environmental and project conditions.
Details of the ANN network
Size of data/sample: This study utilized evaluations from 16 experts in project risk management to assess the impact of various criteria on project risk. These experts provided their inputs through a structured questionnaire, which formed the basis for the ANN analysis. The data were divided into three sets for training, validation, and testing, following a standard split: Training set—60% of the data (approximately 10 expert evaluations); Validation set—20% of the data (approximately 3 expert evaluations); and Test set—20% of the data (approximately 3 expert evaluations).
Input variables: The input variables for the ANN were the four main risk categories identified in this study: technical risks (e.g., requirements, low-quality technology, and automation complexity), organizational risks (e.g., project dependency, high material costs, and incorrect customer preference forecasts), project management risks (e.g., communication issues, planning deviations, and excessively long supply chains); and external risks (e.g., suppliers, market conditions, and climate). Each of these categories was evaluated by the experts on a scale reflecting their perceived impact on project risk.
Output variable: The output variable was the normalized weight of each risk category, representing its relative importance in influencing project risk. These weights were derived from the ANN’s analysis and were used to rank the risk categories (e.g., technical risks were found to have the highest weight, followed by organizational, project management, and external risks).
ANN architecture and training: The ANN employed was a multilayer perceptron (MLP) with a backpropagation learning algorithm, chosen for its effectiveness in pattern recognition and prediction tasks.
The network architecture included the following: input layer—4 neurons (corresponding to the four risk categories); hidden layer—16 neurons (determined through an exhaustive search to minimize validation error); and output layer—1 neuron (representing the normalized weight of the risk category).
The training process involved iterative adjustments to the weights and biases to minimize the Mean Squared Error (MSE), with the best-performing model selected based on the validation performance.

3.4. Statistical Population, Sampling Method, and Sample Size

In this study, a group of decision-making experts was used to validate the criteria, weight the features, and rank the choices. Notably, this study was conducted with the participation of 16 subject-matter experts. In this study, the following two projects from an engineering company in Tehran, Iran, were examined and evaluated for environmental impacts:
(1)
Increasing the capacity of Tehran’s sixth drinking water treatment plant by 1250 L per second with an estimated project duration of 18 months. The project budget was IRR 260 billion, with 536 project activities.
(2)
Digging and equipping 85 wells with a capacity of 2375 L per second to increase the water supply capacity of Tehran with an estimated project duration of 12 months. The project budget was IRR 150 billion, with 446 project activities.
Environmental Risks of the Examined Projects
In this section, the environmental risks of the projects are first identified based on the literature of this study. The environmental risks of the projects are shown in Table 2.

4. Results

4.1. Demographic Information

According to the demographic data analysis, it was found that 25% of the participants were women and 75% were men. Among the participants, 56% were between 35 and 45 years old, 25% were between 45 and 55 years old, and 19% were older than 55 years. Regarding educational background, 44% had a bachelor’s degree, 37% had a master’s degree, and 19% had a doctoral degree. In terms of work experience, 19% of individuals had 5 to 10 years of experience, 44% had 10 to 15 years of experience, and 38% had more than 15 years of experience.

4.2. Research Findings

Selection of risk evaluation indicators: initial identification of criteria
First, through a review of the relevant literature and using the theoretical foundations of the research, the project risk criteria are identified and categorized. Accordingly, these criteria are categorized as follows:
  • Project Management criteria: Significant deviations in market predictions, planning, overly lengthy supply chains with many connections, and communication issues;
  • Organizational criteria: Project dependencies, low-quality materials, high material costs, and incorrect customer preference forecasts;
  • External criteria: Suppliers, risks arising from politics and regulations, market conditions, unstable relationships with vendors, procurement, and climate;
  • Technical criteria: Requirements, low-quality technology, complexity in automation, and poor product performance and quality.
Evaluation of criteria
In this stage, the reliability and validity of the environmental risk factor were examined using Cronbach’s alpha reliability coefficient. A questionnaire was distributed among 16 experts in the field of project risk management to validate each sub-criterion. The results are shown in Table 3.
Based on the results of the validation review, the final classification of risk factors was extracted, as shown in Table 4.
Determining the Impact of Criteria Using DEMATEL
The results obtained from the DEMATEL method are presented in Table 5.
Based on Table 5, the “suppliers” factor has the highest D value, making it the most influential factor. The “excessively extended supply chain comprising numerous interconnections and links” factor also has the highest R value, making it the most susceptible factor. Furthermore, the external factors have the highest D + R value, indicating the strongest interrelationship with other system factors. The criteria are ranked as follows: R11 > R1 > R12 > R2 > R10 > R15 > R3 > R9 > R4 > R13 > R14 > R8 > R6 > R7 > R5 > R16. The ranking of the criteria is based on the values of Di + Ri. Finally, a Cartesian coordinate system is plotted. In this system, the longitudinal axis represents the values of D + R, and the horizontal axis represents D − R. The position of each factor is determined by the point (D + R, D − R) in this coordinate system. This results in the graphical chart depicted in Figure 1.
The horizontal axis represents the importance of each criterion, while the vertical axis divides the criteria into cause and effect groups. These types of causal diagrams can help visualize the complex causal relationships of criteria in a structural model. In addition, by visualizing the causal diagram, we can make decisions by identifying the cause-and-effect criteria. The criteria R1, R2, R3, R4, R6, R5, and R7 are grouped as cause criteria, which are referred to as pure causes, while the group of effect criteria includes R9, R10, R12, R8, R11, R16, R14, R13, and R15. These latter criteria are also known as pure receivers.
Ranking the criteria using Fuzzy ANP
  • Creating the pairwise comparison matrix
The weight of each sub-criterion of project management is shown in Table 6.
Finally, by raising the power of the normalized super matrix, the weight of each criterion is obtained, as shown in Table 7.
Evaluation of importance weight using the ANN
Initially, in the first stage, the data are divided into training, test, and validation sets, which is performed randomly. In MATLAB software (R2024b, 24.2), 60% of the data are selected as the training set, 20% as the test set, and the remaining 20% as the validation data.
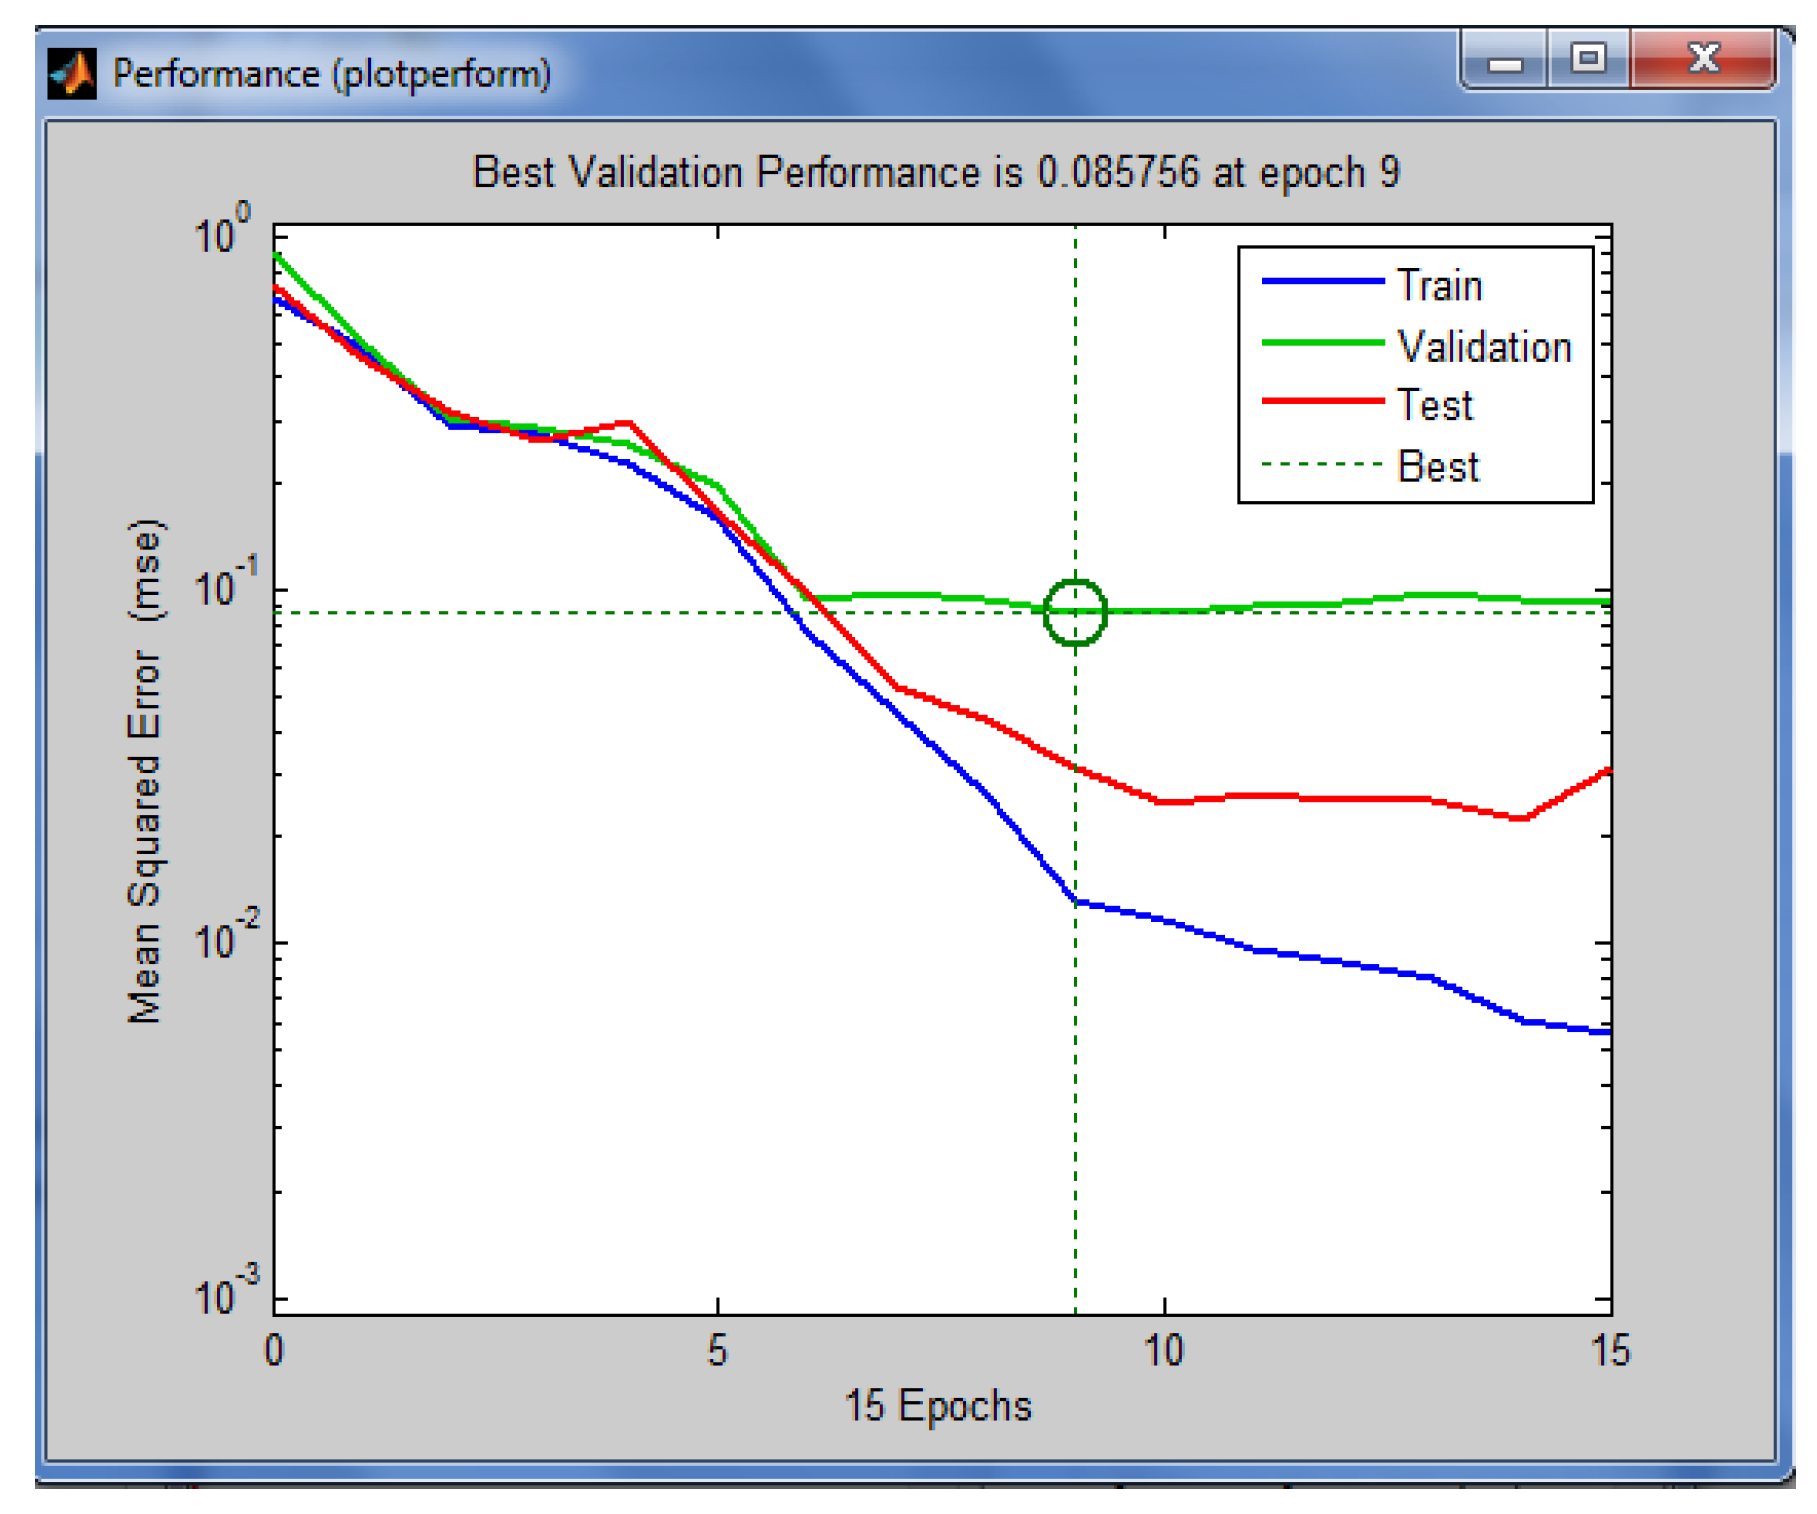
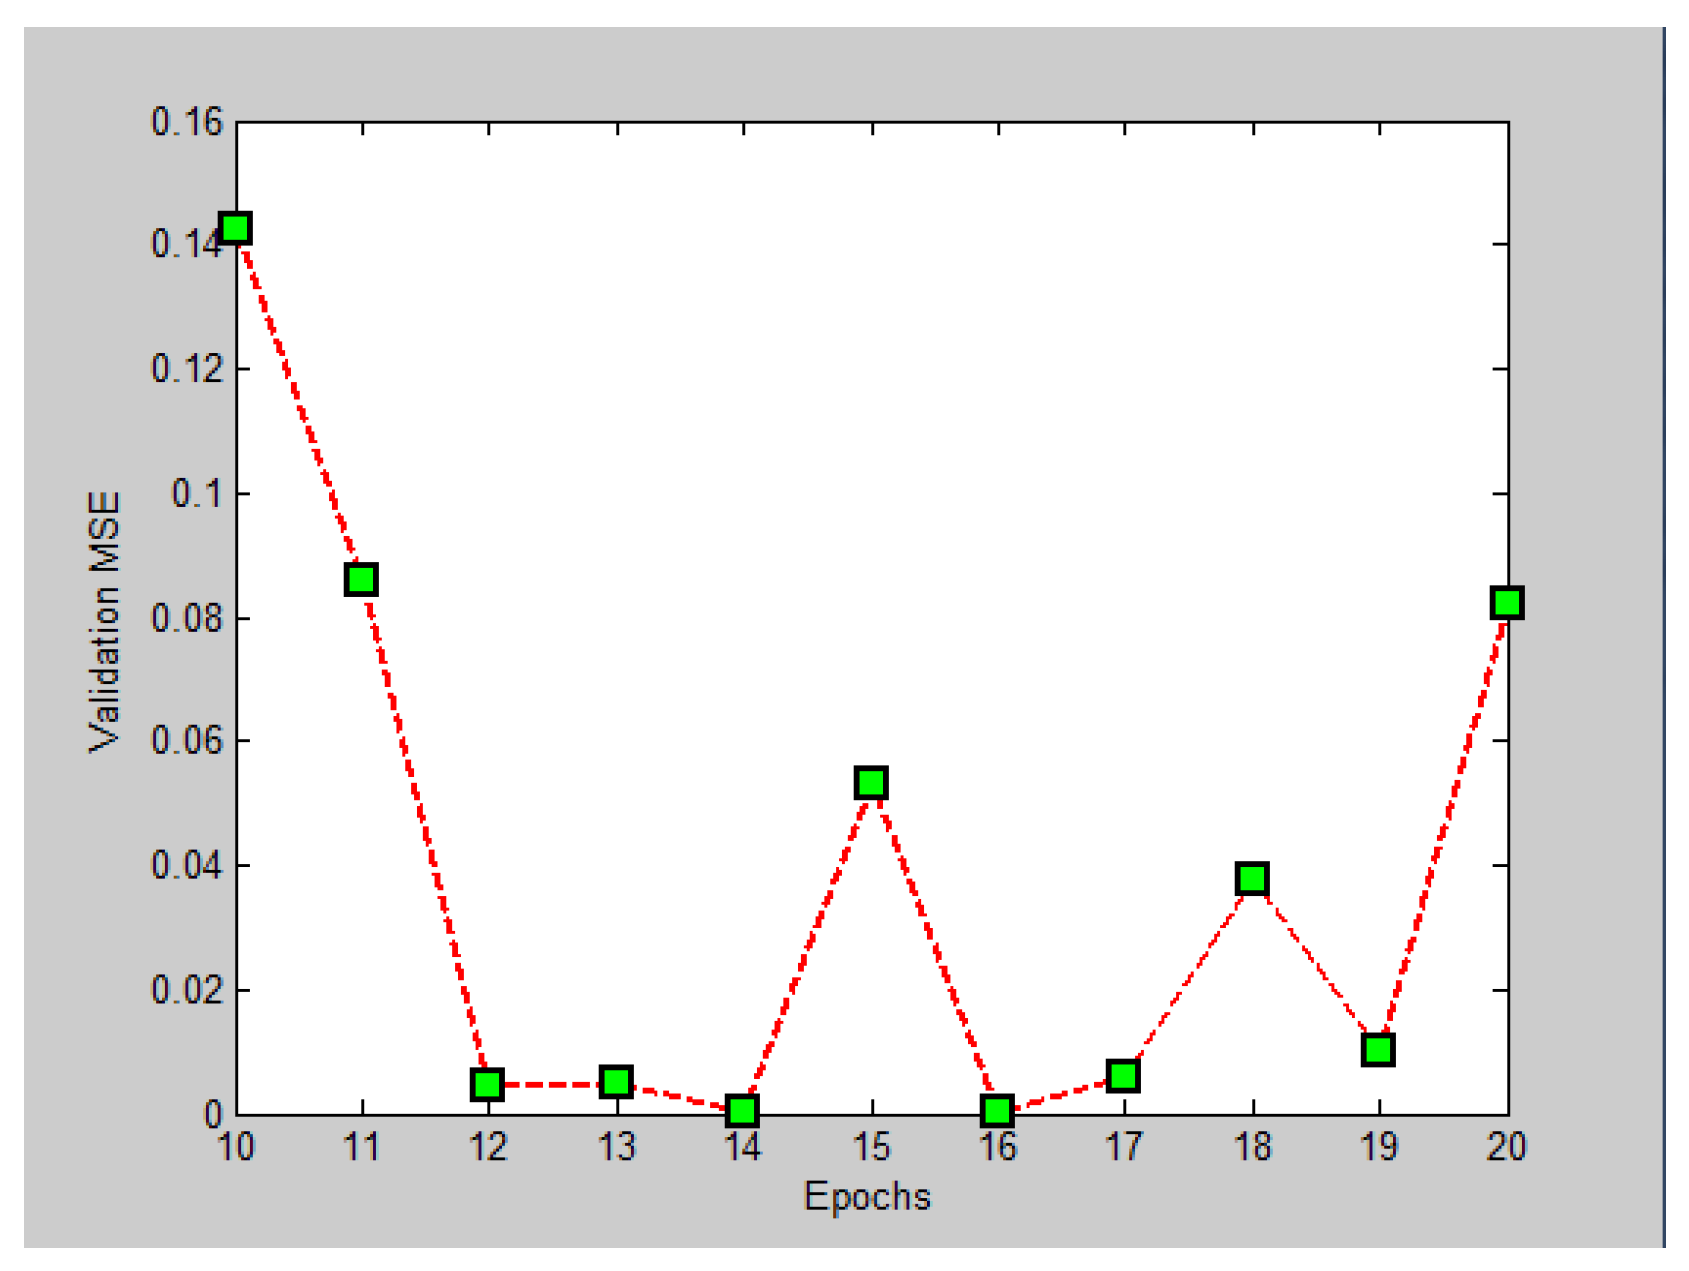
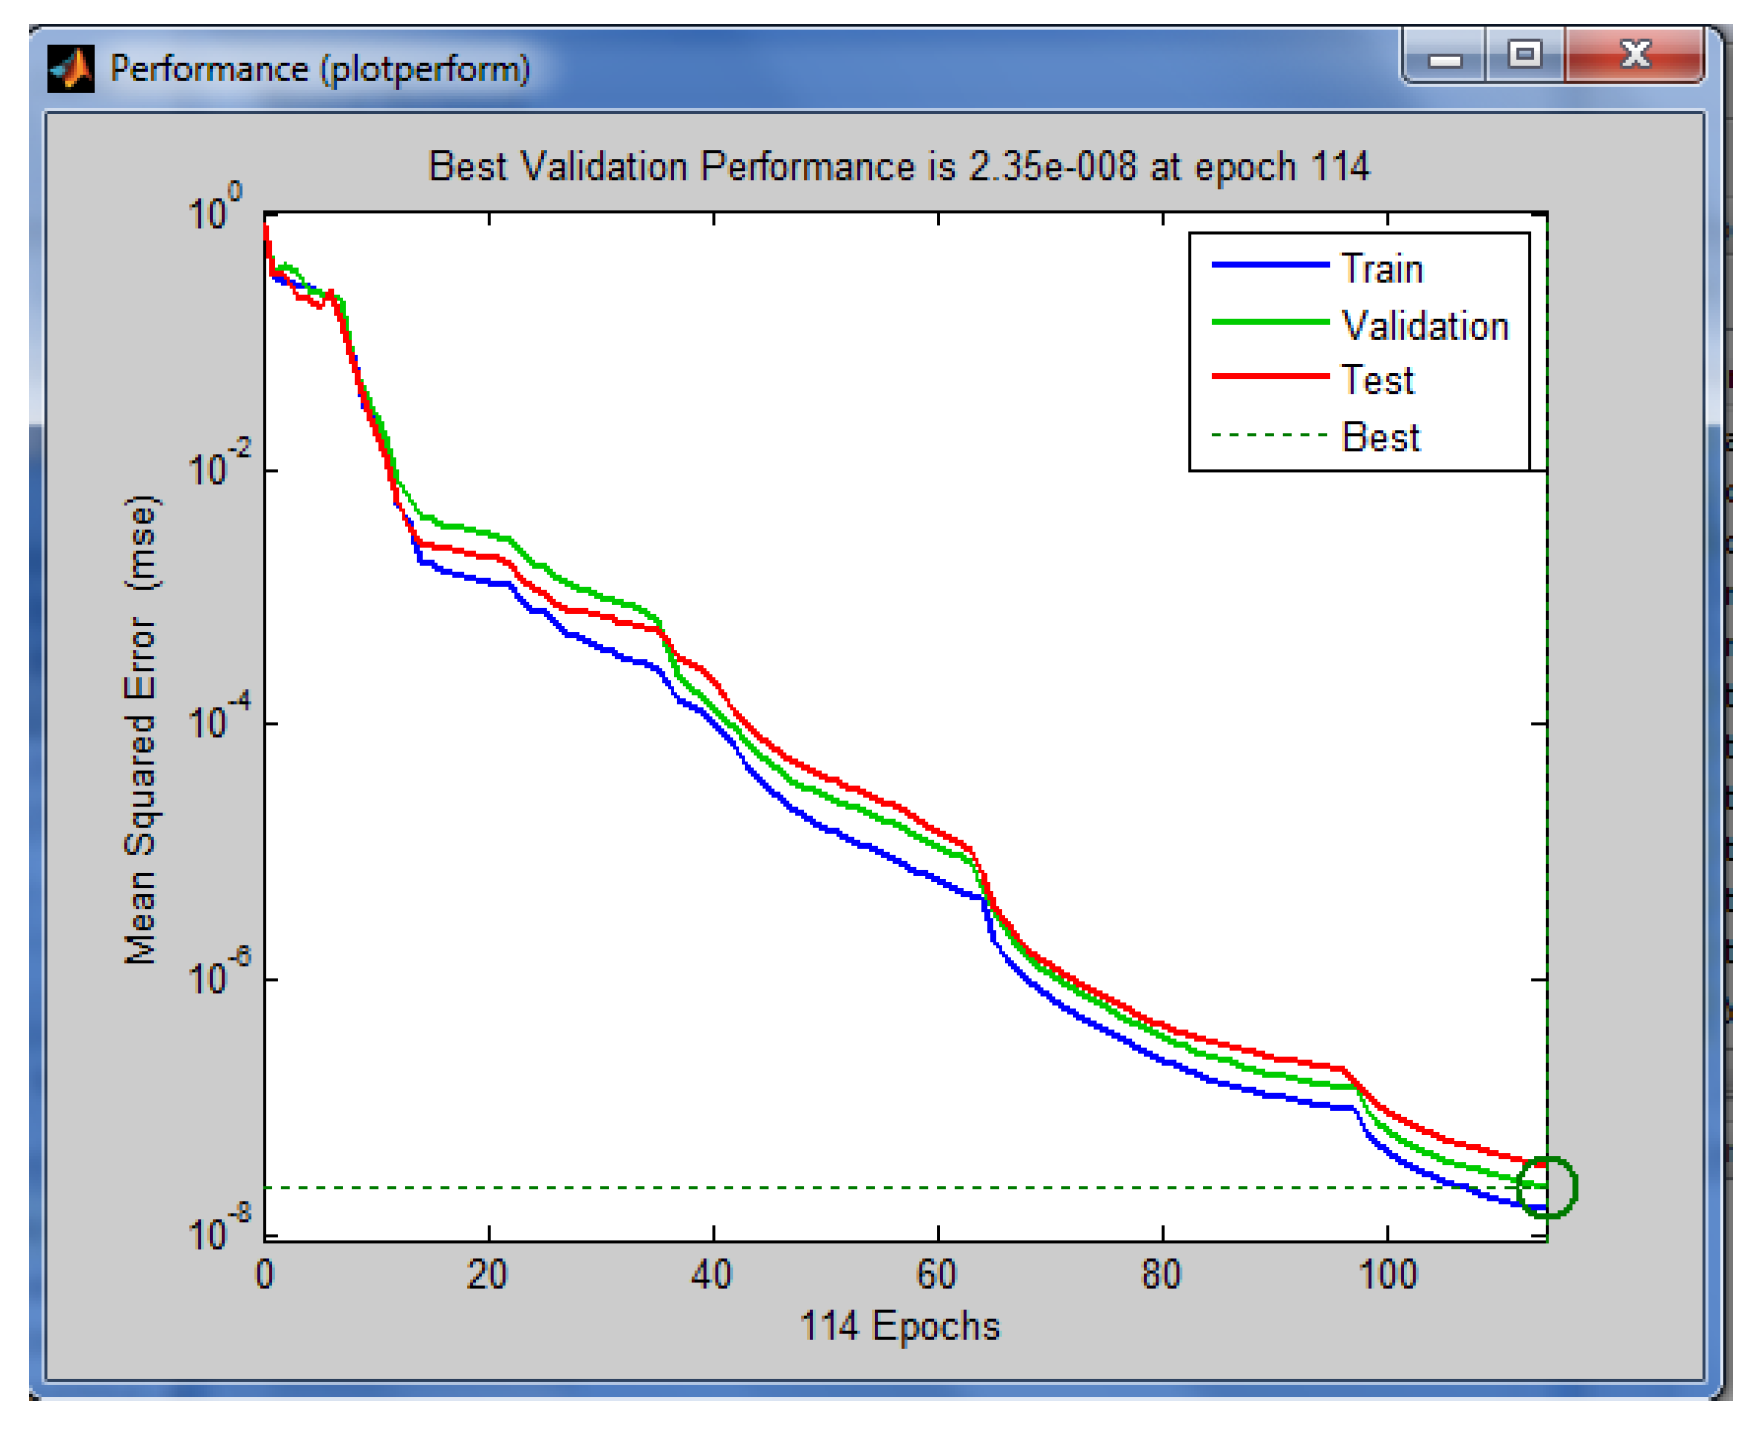
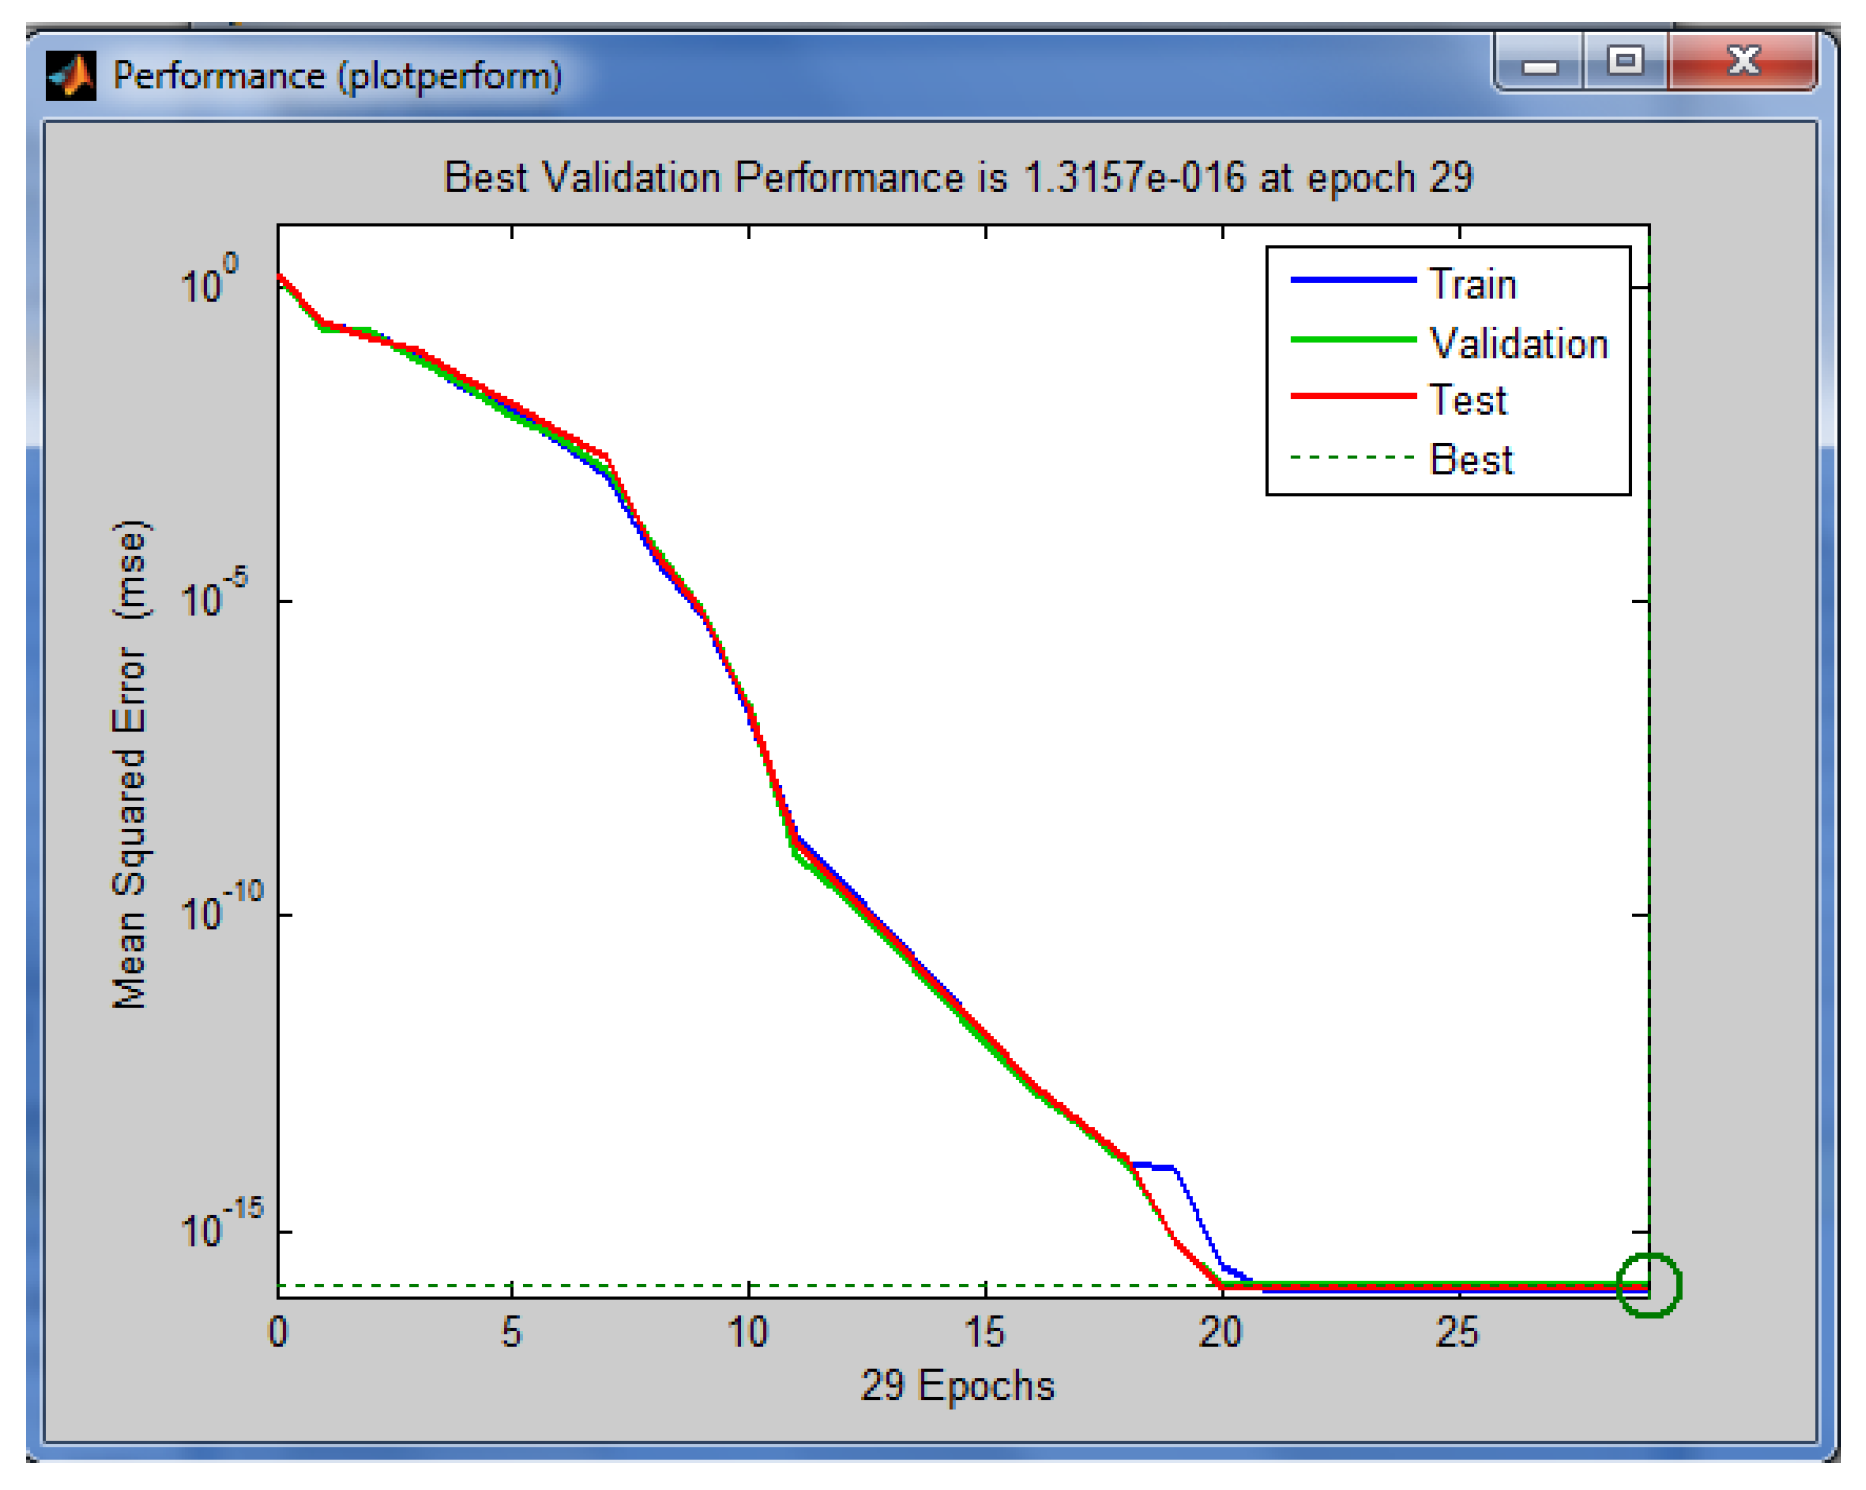
  • Designing the neural network: To create a network that can effectively display the relationship between the inputs, a multilayer perceptron neural network with the backpropagation error rule is used. For this purpose, the best network is the one that has the highest correlation coefficient along with the lowest possible error value.
  • Multilayer perceptron neural network (MLP): Since this is a pattern recognition and prediction problem, and the training datasets are scattered, one of the most suitable networks for making predictions is the multilayer network with the backpropagation learning rule. This type of network is widely used in similar studies. It is easier to work with and performs well in such cases. The more organized the network, the more symmetric it becomes, providing better results.
  • Determining the number of neurons and layers: To determine the number and elements of each layer in the multilayer perceptron, Heuristic Search and Exhaustive Search methods are used. The operation of these methods is as follows: Heuristic Search is used solely to determine the number of elements in a hidden layer. Meanwhile, due to the number of input elements and the complexity of the problem, Exhaustive Search is also applied.
The number of neurons in the hidden layer started from seven neurons, and at each stage, the training, validation, and testing errors were calculated. The training ends when the validation and testing errors are minimized, meaning that the increase in epochs is controlled. These experiments continued for the subsequent number of neurons, i.e., 8, 9, and so on up to 25 neurons. For example, Figure 2 shows the training process and the errors in the three sets (training, validation, and testing) for the case when the number of neurons in the hidden layer is 11. As observed, with the increase in epochs, the training error consistently decreases but care must be taken to ensure that the validation and testing errors also remain low. Therefore, the optimal number of epochs is considered to be nine, as indicated by the marked circle.
Therefore, the best criterion is the minimum validation error. The validation error for 10 to 20 neurons is shown in Figure 3.
As shown in Figure 4, the minimum validation error occurs when the number of neurons in the hidden layer is 14 or 16 but 16 neurons yield the lowest error. Therefore, the network was trained with 16 neurons in the hidden layer. Figure 5 and Figure 6 show the three types of errors for 14 and 16 neurons, indicating that the error for 16 neurons is the lowest.
Training of the MLP neural network
There are various algorithms for training a multilayer perceptron (MLP) with backpropagation, some of which are slow and time-consuming, while others are faster. The training methods can be broadly categorized into two groups: supervised learning methods and unsupervised or self-organizing methods. Supervised learning is used when the output vector of the network is predefined. In unsupervised learning, which is used for clustering or feature extraction, there is no feedback, and the network is trained to identify similarities between input vectors (different patterns), achieving clustering through that. In this research, supervised learning methods have been used.
During the design process of the multilayer network with the BP algorithm, the Exhaustive Search method was used to determine the optimal network by investigating the number of hidden layers and neurons in each hidden layer for training and testing the neural network. The results of this study on a network with a single hidden layer showed an increase in the average network error, as well as a high absolute error. On the other hand, these changes were such that with an increase in the number of neurons, and consequently an increase in the number of weights in the network, the changes in the network error on the training and test data were not significant. This means that increasing the number of neurons in the hidden layer only complicated the network’s topology. It is clear that with an increase in the number of neurons in the hidden layer in parallel with each other, the changes in the network error on the test data remained almost constant, while the error on the training data decreased. This contradicts the principle of not overfitting the network to training data, which is why the Exhaustive topology was used.
Since the initial weights are randomly chosen by the program in each training session, the network output will vary each time. However, by repeatedly training the network with different topologies, the results will converge around a value. During topology selection, achieving a minimum error on the test data with good fit was the goal. When the Mean Squared Error (MSE) from the training data and the validation data have the smallest difference, training is concluded, and after training, the software automatically saves the layer weights where the training and validation errors are minimal. These weights are then used for network testing.
Neural network output
In this step, the impact of the criteria on the project risk is evaluated using an ANN. For this, a questionnaire was distributed among 16 experts in project risk management, and they were asked to determine the impact of each of the criteria on the project risk. The results of the experts’ evaluations are shown in Table 8.
The results of calculating the risk criteria weights of the project using the ANN have been reviewed. The weight of each criterion is shown in Table 9.
The comparison of the results of the ANP and neural network methods is shown in Table 10.

5. Discussion

5.1. Practical Implications

The findings of this study offer significant practical insights for environmental risk management in water supply projects. The integration of Fuzzy DEMATEL, Fuzzy ANP, and Artificial Neural Network (ANN) methods provided a nuanced framework that prioritizes environmental risks by capturing both their interdependencies and dynamic characteristics. This hybrid approach responds to the increasing complexity of modern infrastructure projects, where static evaluations fall short in addressing evolving environmental, technical, and operational conditions.
One key insight is the dominant influence of technical risks, which were ranked highest across both the ANP and ANN analyses. This finding affirms observations made by Alvarado et al. [16], who emphasized the critical role of technological inefficiencies, poor system performance, and inadequate technical planning in increasing environmental exposure. The sub-criteria “low-quality technology” and “performance limitations” ranked particularly high in our model, underscoring the need for technological innovation and rigorous design standards in early project phases.
Organizational risks, especially those related to material costs and forecasting inaccuracies, were the second most influential category. This is consistent with findings by Shahabi et al. [36], who showed that insufficient organizational foresight and internal misalignments often amplify environmental vulnerabilities. For instance, fluctuating material costs not only affect budgets but may lead to the selection of environmentally inferior alternatives, increasing the project’s ecological footprint [55].
While external risks ranked lowest in the aggregate prioritization, the “supplier” sub-criterion was identified as the single most influential risk factor in the DEMATEL analysis. This mirrors the results of Ward et al. [32], who demonstrated the systemic impact of supply chain disruptions on infrastructure robustness. Our findings suggest that external risks, although often less visible in aggregate metrics, can act as critical triggers within the broader risk ecosystem.
The ANN component of this study, implemented via a multilayer perceptron model, confirmed and reinforced the expert-driven rankings obtained via Fuzzy ANP. This consistency validates previous calls, such as those by Lin et al. [39], for more adaptive models capable of learning from expert inputs and evolving over time. The ANN’s ability to dynamically adjust weightings based on new data inputs enhances the model’s practical relevance, especially in regions with rapidly changing environmental or regulatory conditions.
Moreover, by incorporating environmental considerations into the planning and execution phases of water supply projects, this framework supports progress toward the UN’s Sustainable Development Goals, notably SDG 6 (Clean Water and Sanitation) and SDG 11 (Sustainable Cities and Communities). It provides a structured path for aligning technical decision-making with broader sustainability outcomes.

5.2. Managerial Discussions

From a managerial perspective, the findings of this study emphasize the importance of strategic alignment between environmental objectives and project-level decision-making. This hybrid methodology enables project managers to move beyond intuitive or ad hoc risk assessments by offering a quantifiable, repeatable, and adaptable framework. This aligns with the growing demand in the literature for structured environmental risk governance models, as advocated by Sun et al. [29] and Asadi [31].
The prioritization of technical risks suggests that project managers must allocate sufficient resources to technological evaluation and system integration. As demonstrated by the work of Zhang et al. [53], the performance of technical systems—particularly in high-stakes environments like the water supply—directly influences environmental safety and resilience. Managers must, therefore, prioritize early-stage investment in quality control, system testing, and performance monitoring to mitigate technical failures with potentially large environmental consequences.
Organizational planning also plays a crucial role. Risks associated with cost forecasting, supplier selection, and material quality highlight the need for more sophisticated procurement and budgeting processes. These findings reinforce the managerial insights of Macchiaroli et al. [30], who emphasized the trade-offs between economic feasibility and environmental responsibility. Managers are encouraged to implement procurement policies that balance affordability with long-term sustainability and environmental performance.
Importantly, the DEMATEL analysis adds a layer of causal understanding that is often missing in conventional prioritization models. For example, the identification of “suppliers” as a root cause risk allows managers to target high-leverage points in the risk network. Instead of attempting to mitigate all risks simultaneously, resources can be focused on controlling a few high-impact variables. This strategic targeting of root causes echoes managerial best practices highlighted in the risk propagation models proposed by Chen et al. [45].
The ANN framework, which demonstrated high predictive reliability, offers project managers a practical tool for continuous risk recalibration. By retraining the ANN with updated expert inputs or project-specific data, managers can adapt their strategies over time without needing to rebuild the entire assessment model. This flexibility is particularly valuable in environments with fluctuating regulatory standards or climate-sensitive conditions, as emphasized by Xu et al. [33] and Cai et al. [34].
Lastly, the managerial value of this study extends to policy compliance, stakeholder engagement, and corporate reputation management. As environmental performance becomes increasingly visible and regulated, having a transparent and defensible risk prioritization framework positions organizations to respond proactively to audits, community concerns, and sustainability reporting standards [56]. This reflects the broader trend toward integrated project governance and environmental accountability, as seen in recent work by Campbell et al. [44] and Polishchuk et al. [11].
Ultimately, this study provides not only a robust methodological contribution but also a practical roadmap for environmental risk management. It equips managers with both analytical clarity and operational flexibility to navigate the complexities of sustainable infrastructure development.

6. Conclusions

One of the essential tools for project success is risk management throughout the project lifecycle. The goal of risk management is to identify risks as much as possible, find ways to manage those risks, and identify the factors responsible for each. Efficient risk management requires a correct understanding of project risks. This goes beyond merely documenting the risks and prioritizing them based on their probability and impact on the project. The various risks arising during the risk management process should be categorized in such a way that allows for their proper identification. So far, there has been limited research on the environmental risks of construction projects. This research, using Fuzzy DEMATEL and Fuzzy ANP methods, provides a way to analyze and rank risks. According to the results, four main aspects of risk have been identified: external, organizational, technical, and project management. The integration of Fuzzy DEMATEL, Fuzzy ANP, and an ANN in this study provides a hybrid model capable of addressing both expert-based reasoning and data-driven prediction. Importantly, the role of the ANN in this framework has been extended beyond static validation to support dynamic risk assessment. By incorporating learning from expert input and simulating evolving project and environmental variables, the ANN module enables the model to adapt to changing conditions, such as fluctuating climate patterns or updated market conditions. This dynamic adaptation allows for more responsive risk prioritization and supports proactive decision-making. Additionally, the comparative analysis with other machine learning models confirmed the suitability of MLP in the given context, laying the foundation for future expansion with more complex neural architectures like RNNs.
As infrastructure projects become more complex and data-rich, the adaptive learning capacity of ANNs provides a significant methodological advancement over traditional static models, and offers valuable support for decision-makers in risk-intensive environments. Based on the prioritization by the ANN and ANP methods, it has been determined that technical factors, organizational factors, project management, and external factors are ranked in that order. Both Fuzzy ANP and ANN methods yielded consistent ranking orders, though with varying weight magnitudes. Notably, the supplier-related risk emerged as the most influential factor, while an overly extended supply chain was identified as the most vulnerable. By incorporating the ANN, the model enables real-time adaptation to changing project conditions and expert input, representing a methodological advancement over static MCDM approaches. This dynamic capability is particularly relevant for complex infrastructure projects subject to uncertainty and evolving environmental challenges. The proposed framework not only enhances environmental risk prioritization but also supports sustainable project planning, aligning with global sustainability targets such as SDG 6 (Clean Water and Sanitation) and SDG 11 (Sustainable Cities and Communities).
In any research, the researcher faces various obstacles and limitations. In this study, researchers faced several significant barriers, including the unwillingness of experts to respond to the questionnaire questions and possibly negligence in their answers, the significant physical distance between the experts, and the numerous indices available for evaluation. Also, it should be noted that this research relied on expert judgments for data collection, which may introduce biases due to individual perspectives, experiences, or cognitive limitations. The accuracy of results depends on the expertise and consistency of the respondents. In addition, the case studies focused on water supply projects in Tehran, Iran, which may restrict the applicability of the results to other regions with different environmental, regulatory, or infrastructural conditions. Also, this study emphasizes qualitative expert input over quantitative environmental metrics (e.g., real-time pollution levels and climate data), which could enhance the robustness of risk assessments. Moreover, practical limitations in data collection (e.g., expert availability and project documentation) may have influenced the depth of analysis for certain risk factors. Furthermore, the study’s findings may not account for variations in regulatory frameworks or cultural attitudes toward environmental risk management in different countries.
Based on the findings of this study, the following suggestions are made for future studies: This research can be applied to other project-based companies, and the results can be compared with the results obtained from current research. It is necessary to use linear programming models to define risk management methods for the identified risks in this research. The prioritization of technical, organizational, project management, and external factors in each section of companies should be performed using the FUCOM method, a new method in decision-making. The Fuzzy DEMATEL-ANP-ANN framework provides a scalable baseline for risk ranking, particularly in regions lacking granular environmental datasets. Future iterations could adopt dynamic indicators such as extreme weather frequency as supplementary inputs to the ANN, bridging expert knowledge and data-driven adaptation.

Author Contributions

Conceptualization, M.K. and S.A.B.; methodology, M.K., S.A.B., and A.H.; software, M.K.; validation, M.K.; formal analysis, M.K.; investigation, M.K.; resources, M.K., S.A.B., A.H., D.B., and A.M.; data curation, M.K.; writing—original draft preparation, M.K., S.A.B., and A.H.; writing—review and editing, M.K., S.A.B., A.H., D.B., and A.M.; visualization, M.K.; supervision, M.K., D.B., and A.M.; project administration, M.K. All authors have read and agreed to the published version of the manuscript.

Funding

This research received no external funding.

Data Availability Statement

Data supporting the reported results are presented within the article.

Conflicts of Interest

The authors declare no conflicts of interest.

References

  1. Li, J.; Jia, D.; Tian, H.; Wang, M. Application of Hongye Municipal Pipeline Software in Drip Irrigation Project Design. Haihe Water Resour. 2023, 7, 111–113. [Google Scholar]
  2. Zhang, Y.; Li, J. Piping Material Selection in Water Distribution Network Using an Integrated Multi-Criteria Decision-Making Method. Water 2023, 17, 342. [Google Scholar] [CrossRef]
  3. Petrov, S.; Aleksandrova, S.; Kirova, S. Environmental effects of green bonds and other forms of financing in the European Union. Int. J. Econ. Sci. 2024, 13, 81–105. [Google Scholar] [CrossRef]
  4. Badmus, S.O.; Tanimu, G.; Adamu, S. Synthesis of a novel polymer-assisted AlNiMn nanomaterial for efficient removal of sulfate ions from contaminated water. Environ. Sci. Pollut. Res. 2022, 29, 42560–42600. [Google Scholar] [CrossRef]
  5. Shaktawat, A.; Vadhera, S. Risk management of hydropower projects for sustainable development: A review. Environ. Dev. Sustain. 2021, 23, 45–76. [Google Scholar] [CrossRef]
  6. Zhou, Q. A Review of Sustainable Urban Drainage Systems Considering the Climate Change and Urbanization Impacts. Water 2014, 6, 976–992. [Google Scholar] [CrossRef]
  7. Chen, J.; Jiskani, I.M.; Jinliang, C.; Yan, H. Evaluation and future framework of green mine construction in China based on the DPSIR model. Sustain. Environ. Res. 2020, 30, 13. [Google Scholar] [CrossRef]
  8. Park, J.E. Cost Overruns and Schedule Delays of Major Projects: Why We Need Reference Class. Doctoral Thesis, Columbia University, New York, NY, USA, 2021. Available online: https://academiccommons.columbia.edu/doi/10.7916/d8-9cn7-c433 (accessed on 10 June 2025).
  9. Zhang, Y.; Wang, R.; Huang, P.; Wang, X.; Wang, S. Risk evaluation of large-scale seawater desalination projects based on an integrated fuzzy comprehensive evaluation and analytic hierarchy process method. Desalination 2020, 478, 114286. [Google Scholar] [CrossRef]
  10. Macek, D.; Vitásek, S. ESG risk analysis and preparedness of companies in the Czech Republic. Int. J. Econ. Sci. 2024, 13, 38–54. [Google Scholar] [CrossRef]
  11. Polishchuk, V.; Kelemen, M.; Gavurová, B.; Varotsos, C.; Andoga, R.; Gera, M.; Szabo, S. A fuzzy model of risk assessment for environmental start-up projects in the air transport sector. Int. J. Environ. Res. Public Health 2019, 16, 3573. [Google Scholar] [CrossRef]
  12. Komazec, N.; Janković, K.; Mladenović, M.; Mijatović, M.; Lapčević, Z. Ranking of risk using the application of the AHP method in the risk assessment process on the Piraeus-Belgrade-Budapest railway corridor. J. Decis. Anal. Intell. Comput. 2024, 4, 176–186. [Google Scholar] [CrossRef]
  13. Vahabzadeh, S.; Haghshenas, S.; Ghoushchi, S.; Guido, G.; Simic, V.; Marinkovic, D. A new framework for risk assessment of road transportation of hazardous substances. Facta Univ. Ser. Mech. Eng. 2025. Available online: https://casopisi.junis.ni.ac.rs/index.php/FUMechEng/article/view/12885 (accessed on 13 March 2025).
  14. Mohan, V.; Ota, M.; Iqbal, P. A Comparative Study to Find the Optimal Ordering Quantity of the Risk-Neutral and Risk-Averse Newsvendor. Yugosl. J. Oper. Res. 2023, 33, 323–340. [Google Scholar] [CrossRef]
  15. Božanić, D.; Pamučar, D.; Komazec, N. Applying D numbers in risk assessment process: General approach. J. Decis. Anal. Intell. Comput. 2023, 3, 286–295. [Google Scholar] [CrossRef]
  16. Alvarado, E.; Garcia, A.; Rodriguez, P. Environmental risk assessment in construction projects: A comprehensive review. J. Environ. Manag. 2022, 295, 113024. [Google Scholar] [CrossRef]
  17. Hatefi, S.M.; Tamošaitienė, J. An integrated fuzzy DEMATEL-fuzzy ANP model for evaluating construction projects by considering interrelationships among risk factors. J. Civ. Eng. Manag. 2019, 25, 114–131. [Google Scholar] [CrossRef]
  18. Chatterjee, K.; Zavadskas, E.K.; Tamošaitienė, J.; Adhikary, K.; Kar, S. A hybrid MCDM technique for risk management in construction projects. Symmetry 2018, 10, 46. [Google Scholar] [CrossRef]
  19. Ortíz-Rodriguez, O.O.; Sonnemann, G.; Villamizar-G, R.A. The carbon footprint of water treatment as well as sewer and sanitation utilities of Pamplona in Colombia. Environ. Dev. Sustain. 2021, 24, 3982–3999. [Google Scholar] [CrossRef]
  20. Gazi, K.H.; Raisa, N.; Biswas, A.; Azizzadeh, F.; Mondal, S.P. Finding the Most Important Criteria in Women’s Empowerment for Sports Sector by Pentagonal Fuzzy DEMATEL Methodology. Spectr. Decis. Mak. Appl. 2025, 2, 28–52. [Google Scholar] [CrossRef]
  21. Seeta, T.; Mbuli, N. Application of ANP in the Power System: A Review. In Proceedings of the 2022 International Conference on Green Energy, Computing and Sustainable Technology (GECOST), Miri, Sarawak, Malaysia, 26–28 October 2022; pp. 428–434. [Google Scholar]
  22. Su, C.M.; Horng, D.J.; Tseng, M.L.; Chiu, A.S.; Wu, K.J.; Chen, H.P. Improving sustainable supply chain management using a novel hierarchical grey-DEMATEL approach. J. Clean. Prod. 2016, 134, 469–481. [Google Scholar] [CrossRef]
  23. Shakeri, H.; Khalilzadeh, M. Analysis of factors affecting project communications with a hybrid DEMATEL-ISM approach (A case study in Iran). Heliyon 2020, 6, e04430. [Google Scholar] [CrossRef] [PubMed]
  24. Lin, Z.; Jianping, Y. Risk Assessment Based On Fuzzy Network (F-ANP) In New Campus Construction Project. Syst. Eng. Procedia 2011, 1, 162–168. [Google Scholar] [CrossRef]
  25. Najmi, M.; Mehrmanesh, H.; Shadnoush, N. Risk Identification and Analysis Based on the Integrated Approach of PMBOK and RFMEA in Petrochemical Industry Projects. J. Bus. Manag. 2023, 15, 218–239. [Google Scholar]
  26. Zhou, J.; Sun, W.; Yang, X. Risk assessment of hazardous waste disposal projects using an integrated fuzzy AHP-TOPSIS method. Environ. Manag. 2021, 67, 987–1001. [Google Scholar]
  27. Zhang, H.; Liu, J.; He, K. Graph-theoretical optimization of municipal water supply networks: A case study of pressure and leakage control. Water Supply 2023, 23, 118–133. [Google Scholar] [CrossRef]
  28. Biswas, R.R.; Sharma, R.; Gyasi-Agyei, Y. Adaptation to climate change: A study on regional urban water management and planning practice. J. Clean. Prod. 2022, 355, 131643. [Google Scholar] [CrossRef]
  29. Sun, J.; Wang, Q.; Huang, F. Environmental impacts of water supply infrastructure: A life-cycle assessment perspective. Water 2023, 16, 567. [Google Scholar] [CrossRef]
  30. Macchiaroli, M.; Dolores, L.; De Mare, G. Multicriteria Decision Making and Water Infrastructure: An Application of the Analytic Hierarchy Process for a Sustainable Ranking of Investments. Appl. Sci. 2023, 13, 8284. [Google Scholar] [CrossRef]
  31. Asadi, Y. Employing machine learning in water infrastructure management: Predicting pipeline failures for improved maintenance and sustainable operations. Ind. Artif. Intell. 2024, 2, 8. [Google Scholar] [CrossRef]
  32. Ward, P.J.; de Ruiter, M.C.; Mård, J.; Schröter, K.; Van Loon, A.; Veldkamp, T.; von Uexkull, N.; Wanders, N.; AghaKouchak, A.; Arnbjerg-Nielsen, K.; et al. The need to integrate flood and drought disaster risk reduction strategies. Water Secur. 2020, 11, 100070. [Google Scholar] [CrossRef]
  33. Xu, F.; Li, X.; Zhang, H.; Wang, Y. Resilience Assessment of Subway System to Waterlogging Disaster. Sustain. Cities Soc. 2024, 113, 105710. [Google Scholar] [CrossRef]
  34. Cai, Q.; Fang, D.; Chen, B. Ecological Network Analysis for Urban Physical-Virtual Water Cycle: A Case Study of Beijing. Ecol. Model. 2024, 501, 110972. [Google Scholar] [CrossRef]
  35. Zhang, Y.; Chen, Q. Identifying Key Influential Factors of Bid Evaluation in Government Public Project Green Procurement in China Using BP-DEMATEL Model. Math. Probl. Eng. 2022, 2022, 8223757. [Google Scholar] [CrossRef]
  36. Shahabi, R.S.; Basiri, M.H.; Qarahasanlou, A.N.; Mottahedi, A.; Dehghani, F. Fuzzy MADM-Based Model for Prioritization of Investment Risk in Iran’s Mining Projects. Int. J. Fuzzy Syst. 2022, 24, 3189–3207. [Google Scholar] [CrossRef]
  37. Kao, F.C.; Huang, S.C.; Lo, H.W. A rough-fermatean DEMATEL approach for sustainable development evaluation for the manufacturing industry. Int. J. Fuzzy Syst. 2022, 24, 3244–3264. [Google Scholar] [CrossRef]
  38. Gani, A.; Bhanot, N.; Talib, F.; Asjad, M. An integrated DEMATEL-MMDE-ISM approach for analyzing environmental sustainability indicators in MSMEs. Environ. Sci. Pollut. Res. 2022, 29, 2035–2051. [Google Scholar] [CrossRef]
  39. Lin, S.S.; Shen, S.L.; Zhou, A.; Xu, Y.S. Risk assessment and management of excavation system based on fuzzy set theory and machine learning methods. Autom. Constr. 2021, 122, 103490. [Google Scholar] [CrossRef]
  40. Tavassolirizi, M.; Sarvari, H.; Chan, D.W.M.; Olawumi, T.O. Factors affecting delays in rail transportation projects using Analytic Network Process: The case of Iran. Int. J. Constr. Manag. 2020, 22, 2712–2723. [Google Scholar] [CrossRef]
  41. Feng, J.; Yuan, B.; Li, X.; Tian, D.; Mu, W. Evaluation on risks of sustainable supply chain based on optimized BP neural networks in fresh grape industry. Comput. Electron. Agric. 2021, 183, 105988. [Google Scholar]
  42. Andrić, J.M.; Wang, J.; Zhong, R. Identifying the critical risks in railway projects based on fuzzy and sensitivity analysis: A case study of belt and road projects. Sustainability 2019, 11, 1302. [Google Scholar] [CrossRef]
  43. Wu, Y.; Zhou, J. Risk assessment of urban rooftop distributed PV in energy performance contracting (EPC) projects: An extended HFLTS-DEMATEL fuzzy synthetic evaluation analysis. Sustain. Cities Soc. 2019, 47, 101524. [Google Scholar] [CrossRef]
  44. Campbell, I.; Macleod, A.; Sahlmann, C.; Neves, L.; Funderud, J.; Øverland, M.; Hughes, A.D.; Stanley, M. The environmental risks associated with the development of seaweed farming in Europe-prioritizing key knowledge gaps. Front. Mar. Sci. 2019, 6, 107. [Google Scholar] [CrossRef]
  45. Chen, Y.S.; Chuang, H.M.; Sangaiah, A.K.; Lin, C.K.; Huang, W.B. A study for project risk management using an advanced MCDM-based DEMATEL-ANP approach. J. Ambient Intell. Humaniz. Comput. 2019, 10, 2669–2681. [Google Scholar] [CrossRef]
  46. Jin, X.; Jiang, W.; Fang, D.; Wang, S.; Chen, B. Evaluation and Driving Force Analysis of the Water-Energy-Carbon Nexus in Agricultural Trade for RCEP Countries. Appl. Energy 2024, 353, 122143. [Google Scholar] [CrossRef]
  47. Khairuddin, S.H.; Hasan, M.H.; Hashmani, M.A.; Azam, M.H. Generating clustering-based interval fuzzy type-2 triangular and trapezoidal membership functions: A structured literature review. Symmetry 2021, 13, 239. [Google Scholar] [CrossRef]
  48. Liu, Y.; Eckert, C.M.; Earl, C. A review of fuzzy AHP methods for decision-making with subjective judgements. Expert Syst. Appl. 2020, 161, 113738. [Google Scholar] [CrossRef]
  49. Cheng, E.W.; Li, H. Application of ANP in process models: An example of strategic partnering. Build. Environ. 2007, 42, 278–287. [Google Scholar] [CrossRef]
  50. Cheng, B.; Lu, K.; Li, J.; Chen, H.; Luo, X.; Shafique, M. Comprehensive assessment of embodied environmental impacts of buildings using normalized environmental impact factors. J. Clean. Prod. 2020, 334, 130083. [Google Scholar] [CrossRef]
  51. Shamsadini, K.; Askari Shahamabad, M.; Askari Shahamabad, F. Analysis of factors affecting Environmental Audit (EA) implementation with DEMATEL method. Soc. Responsib. J. 2023, 19, 777–796. [Google Scholar] [CrossRef]
  52. Norouzi Masir, R.; Khalokakaie, R.; Ataei, M.; Mohammadi, S. Structural analysis of impacting factors of sustainable development in underground coal mining using DEMATEL method. J. Min. Environ. 2018, 9, 567–579. [Google Scholar]
  53. Zhang, Z.; Malik, M.Z.; Khan, A.; Ali, N.; Malik, S.; Bilal, M. Environmental impacts of hazardous waste, and management strategies to reconcile circular economy and eco-sustainability. Sci. Total Environ. 2020, 807, 150856. [Google Scholar] [CrossRef] [PubMed]
  54. Nag, R.; O’Rourke, S.M.; Cummins, E. Risk factors and assessment strategies for the evaluation of human or environmental risk from metal (loid) s–A focus on Ireland. Sci. Total Environ. 2022, 802, 149839. [Google Scholar] [CrossRef] [PubMed]
  55. Chen, X.; Zhou, B.; Štilić, A.; Stević, Ž.; Puška, A. A Fuzzy–Rough MCDM Approach for Selecting Green Suppliers in the Furniture Manufacturing Industry: A Case Study of Eco-Friendly Material Production. Sustainability 2023, 15, 10745. [Google Scholar] [CrossRef]
  56. Štilić, A.; Puška, A. Integrating Multi-Criteria Decision-Making Methods with Sustainable Engineering: A Comprehensive Review of Current Practices. Eng 2023, 4, 1536–1549. [Google Scholar] [CrossRef]
Figure 1. Cartesian coordinates chart of the DEMATEL method.
Water 17 01995 g001
Figure 2. Final output of MATLAB software.
Water 17 01995 g002
Figure 3. The network training process.
Water 17 01995 g003
Figure 4. Determining the neurons of the hidden layer.
Water 17 01995 g004
Figure 5. Triple error rates for 14 neurons.
Water 17 01995 g005
Figure 6. Triple error rates for 16 neurons.
Water 17 01995 g006
Table 1. Fuzzy variables [23].
Linguistic TermsDefinite EquivalentTriangular Fuzzy Numbers
No impact (No)1(0.25, 0, 0)
Very low impact (VL)2(0.5, 0.25, 0)
Low impact (L)3(0.75, 0.5, 0.25)
High impact (H)4(1, 0.75, 0.5)
Very high impact (VH)5(1, 1, 0.75)
Table 2. Identified project environmental risks.
RowMain Risk CategorySub-CriteriaSources
1Project ManagementMajor deviation in market forecastCheng et al. [50]
2 PlanningShamsadini et al. [51], and Norouzi et al. [52]
3Supply ChainExcessively extended supply chain comprising numerous interconnections and linksCheng et al. [50], Campbell et al. [44], and Zhang & Chen [35]
4Communication Ghani et al. [38], and Campbell et al. [44]
5OrganizationalProject dependencyShamsadini et al. [51], Norouzi et al. [52], and Zhang & Chen [35]
6 Poor quality of production materialsZhang & Chen [35], Campbell et al. [44], and Shahabi et al. [36]
7 High material costsShamsadini et al. [51]
8 Incorrect prediction of customer preferencesCheng et al. [50], Norouzi et al. [52], and Shahabi et al. [36]
9External FactorsSuppliersGhani et al. [38], Wu & Zhou [43], and Shamsadini et al. [51]
10 Hazards from policies and regulationsShamsadini et al. [51], Norouzi et al. [52], and Kao et al. [37]
11 MarketKao et al. [37], and Zhang et al. [53]
12 Unstable relationships with vendorsZhang & Chen [35], and Shahabi et al. [36]
13 ClimateCheng et al. [50], Wu & Zhou [43], and Zhang et al. [53]
14TechnicalRequirementsKao et al. [37], Campbell et al. [44], and Shahabi et al. [36]
15 Low-quality technologyGhani et al. [38], Wu & Zhou [43], and Nag et al. [54]
16 Automation complexityKao et al. [37], and Nag et al. [54]
17 PerformanceShamsadini et al. [51], Norouzi et al. [52], and Wu & Zhou [43]
18 Low-quality productsShamsadini et al. [51] and Norouzi et al. [52]
Table 3. Validation of results for each criterion based on Coefficient of Variation Ratio (CVR).
CriteriaSub-CriteriaNumber of Evaluators Agreeing with the QuestionCalculated CVRMinimum Acceptable CVRCriterion Validation
Project ManagementMajor deviation in market forecast150.8750.49Approved
Planning140.750.49Approved
Excessively extended supply chain comprising numerous interconnections and links150.8750.49Approved
Communications120.50.49Approved
OrganizationalProject dependency140.750.49Approved
Poor quality of production materials150.8750.49Approved
High cost of production materials130.6250.49Approved
Incorrect prediction of customer preferences120.50.49Approved
ExternalSuppliers130.6250.49Approved
Risks due to policies and regulations110.3750.49Rejected
Market130.6250.49Approved
Unstable relations with purchase vendors100.250.49Rejected
Climate140.8750.49Approved
TechnicalRequirements130.6250.49Approved
Low-quality technology140.750.49Approved
Automation complexity120.50.49Approved
Performance130.6250.49Approved
Poor quality of products120.50.49Approved
Table 4. Final environmental risk criteria of the project.
Risk CategorySub-Criteria of Each Category
External FactorSuppliers (R1)
Market (R2)
Climate (R3)
OrganizationalProject dependency (R4)
Poor quality of production materials (R5)
High cost of production materials (R6)
Incorrect prediction of customer preferences (R7)
TechnicalRequirements (R8)
Low-quality technology (R9)
Automation complexity (R10)
Performance (R11)
Poor quality of products (R12)
Project ManagementMajor deviation in market forecast (R13)
Planning (R14)
Excessively extended supply chain comprising numerous interconnections and links (R15)
Communications (R16)
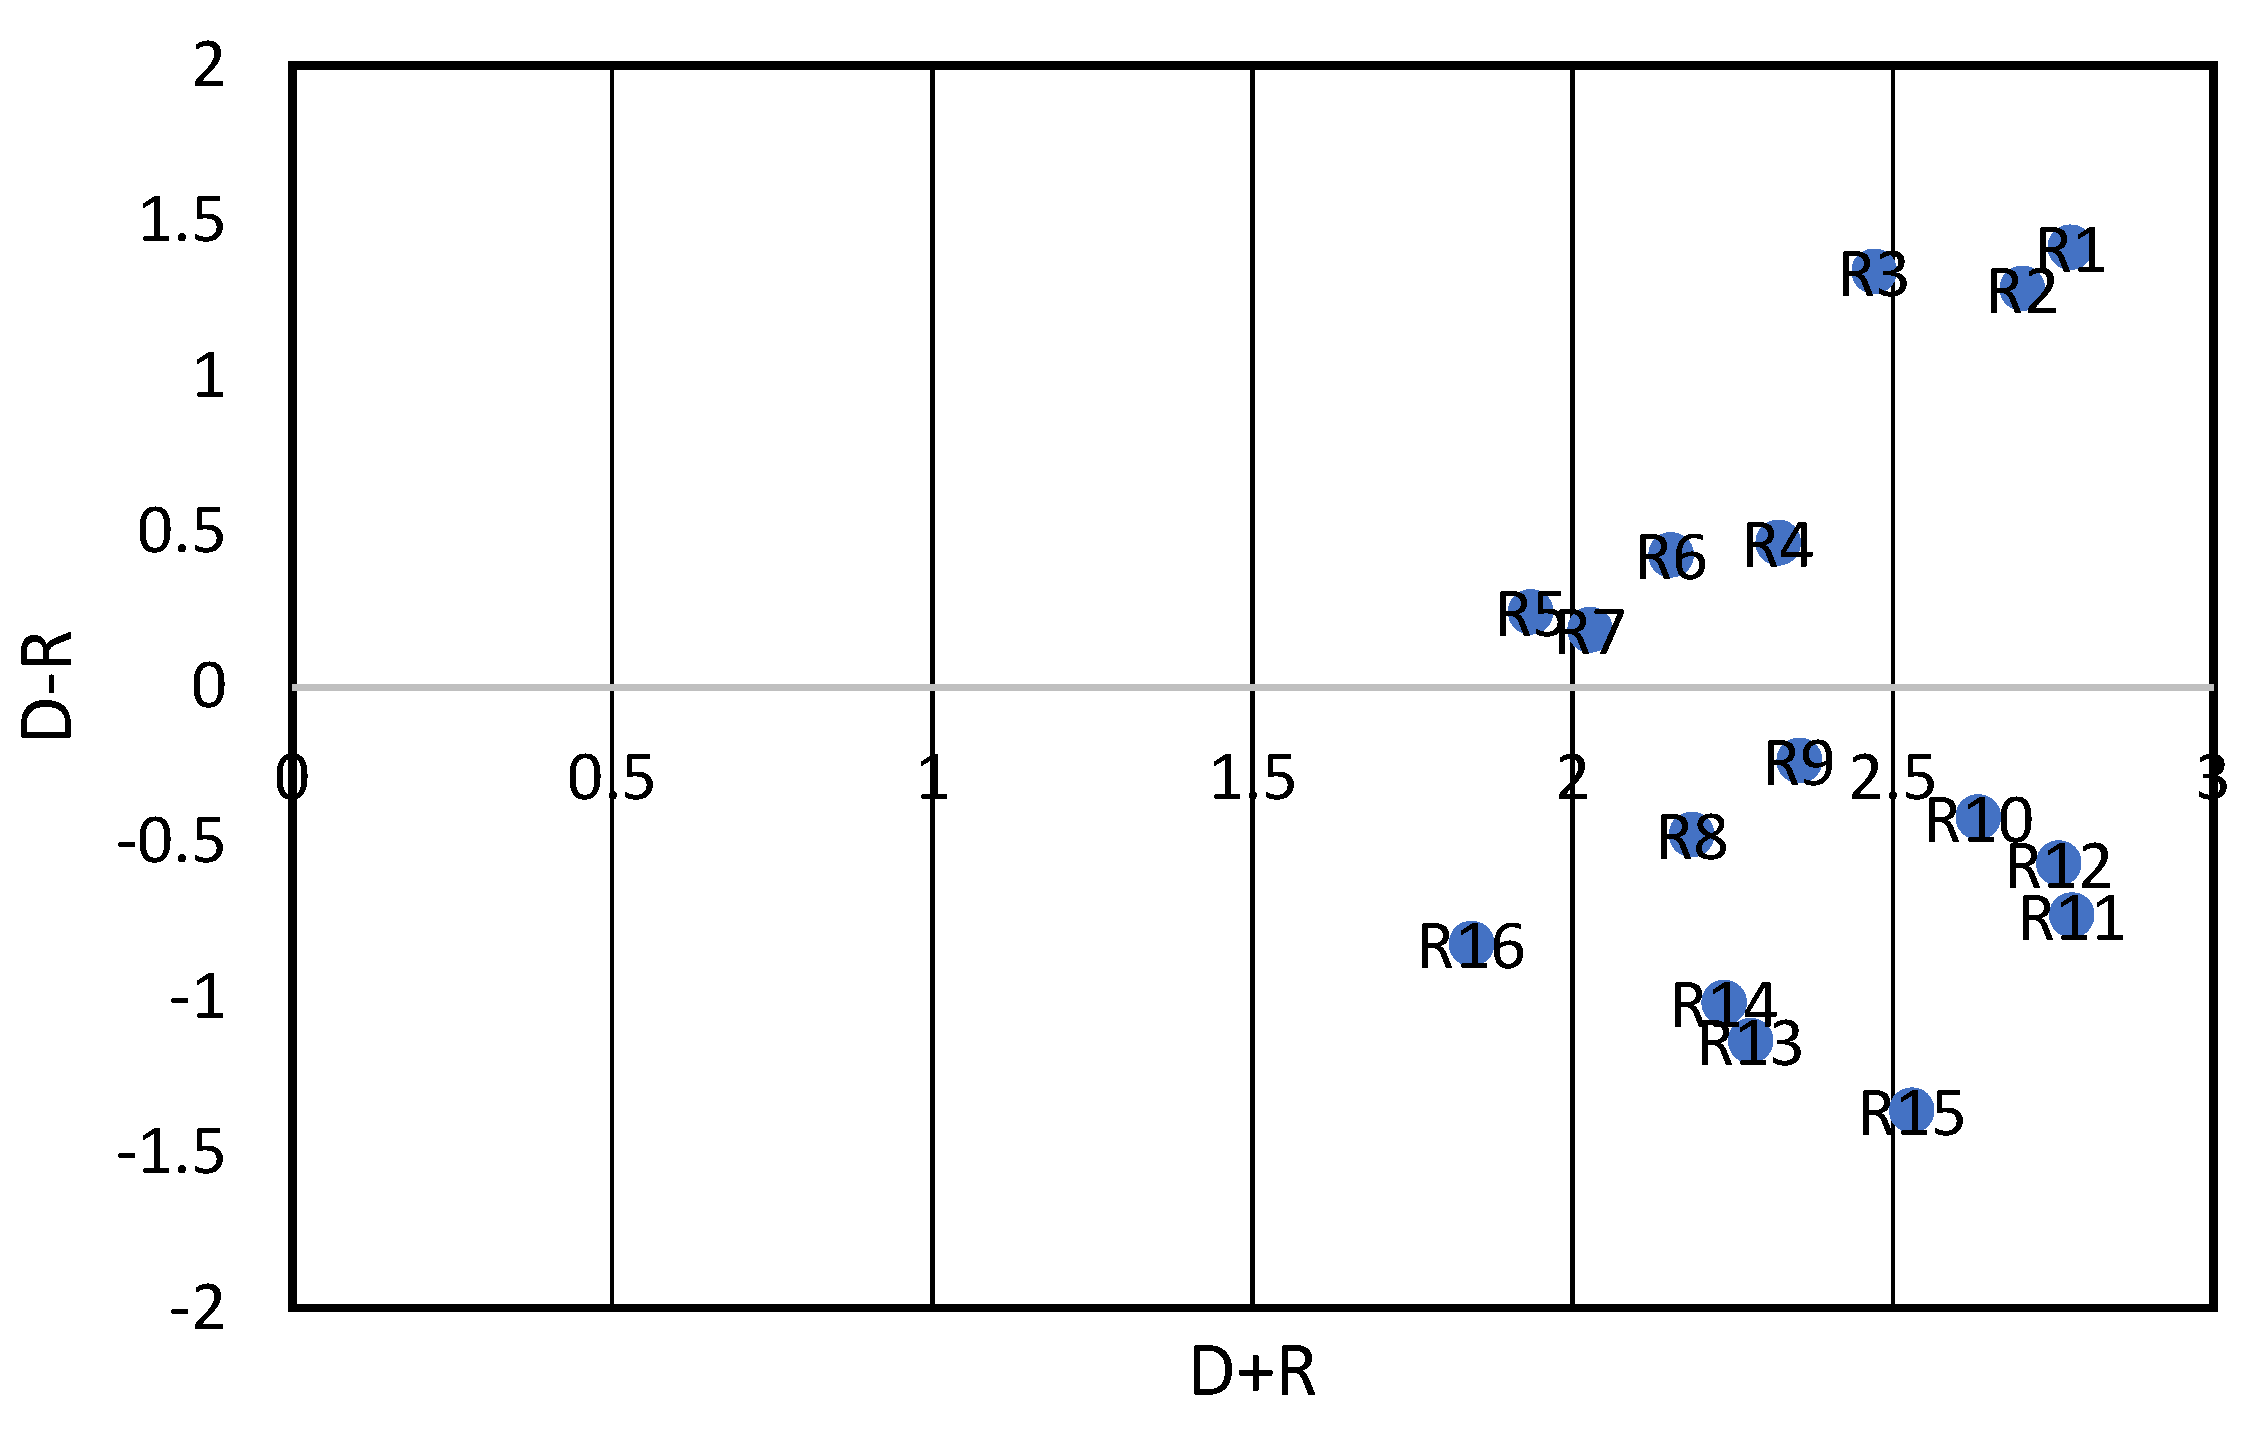
Table 5. Formation of impact and influence values.
RisksD − RD + RRD
Suppliers1.4142.7780.6822.096R1
Market1.2812.7030.7111.992R2
Climate1.3372.4710.5671.904R3
Project dependency0.4632.3210.9291.392R4
Poor quality of production materials0.2411.9350.8471.088R5
High cost of production materials0.4242.1540.8651.289R6
Incorrect prediction of customer preferences0.1832.0270.9221.105R7
Requirements−0.4762.1861.3310.855R8
Low-quality technology−0.2382.3541.2961.058R9
Automation complexity−0.422.6341.5271.107R10
Performance−0.7362.781.7581.022R11
Low-quality products−0.5692.7591.6641.095R12
Major deviation in market forecast−1.142.2781.7090.569R13
Planning−1.0172.2371.6270.61R14
Excessively extended supply chain comprising numerous interconnections and links−1.3642.531.9470.583R15
Communications−0.8281.8421.3350.507R16
Table 6. Weight of project management criteria.
CriterionSub-CriterionNon-Normalized WeightNormalized Weight
ExternalSuppliers0.820.30
Market0.400.14
Climate0.330.12
OrganizationalProject Dependency0.560.20
Poor Quality of Manufactured Materials0.630.23
High Material Costs0.720.26
Incorrect Forecast of Customer Preferences0.250.09
TechnicalRequirements0.140.05
Low-Quality Technology0.900.32
Automation Complexity0.270.10
Performance0.610.22
Low-Quality Products0.390.14
Project ManagementCommunications0.340.13
Planning0.750.27
Excessively Extended Supply Chain Comprising Numerous Interconnections and Links0.670.24
Significant Deviation in Market Forecasting1.000.36
Table 7. Weight of each criterion.
CriterionSub-CriterionWeight
ExternalSuppliers0.06
Regulations0.04
Customers0.08
OrganizationalProject dependency0.07
Poor quality of manufactured materials0.04
High material costs0.09
Incorrect forecast of customer preferences0.06
TechnicalRequirements0.08
Low-quality technology0.05
Automation complexity0.05
Performance0.06
Low-quality products0.07
Project ManagementSignificant deviation in market forecasting0.05
Planning0.05
Excessively extended supply chain comprising numerous interconnections and links0.07
Communications0.08
Table 8. Evaluation of criteria affecting project risk.
ExpertProject ManagementTechnicalOrganizationalExternal
10.60.80.60.4
20.60.60.40.4
30.41.00.80.2
40.60.81.00.2
50.40.80.60.6
60.40.60.60.4
70.60.80.40.6
80.20.60.80.2
90.60.60.60.2
100.81.00.60.6
110.40.60.40.4
120.40.40.60.6
130.40.60.80.2
140.80.60.60.4
150.60.80.40.2
160.40.80.40.4
Table 9. Weight of each criterion influencing project risk.
Criteria Influencing Project RiskNormalized Weight
Technical67
Project Management35
Organizational43
External17
Table 10. Comparison of results between ANP and neural network methods.
CriterionWeight Computed Using Neural NetworkWeight Computed Using ANPRanking of Computed Weights
External0.090.184
Organizational0.270.262
Technical0.420.311
Project Management0.220.253
Disclaimer/Publisher’s Note: The statements, opinions and data contained in all publications are solely those of the individual author(s) and contributor(s) and not of MDPI and/or the editor(s). MDPI and/or the editor(s) disclaim responsibility for any injury to people or property resulting from any ideas, methods, instructions or products referred to in the content.

