Article

Research on the Risk of a Multi-Source Hydrological Drought Encounter in the Yangtze River Basin Based on Spatial and Temporal Correlation

1
School of Infrastructure Engineering, Dalian University of Technology, Dalian 116024, China
2
Department of Water Resources Research, China Institute of Water Resources and Hydropower Research, Beijing 100038, China
*
Author to whom correspondence should be addressed.
Water 2025, 17(13), 1986; https://doi.org/10.3390/w17131986
Submission received: 17 May 2025 / Revised: 25 June 2025 / Accepted: 30 June 2025 / Published: 1 July 2025
(This article belongs to the Section Hydrology)

Abstract

For a long time, drought disasters have brought about a wide range of negative impacts on human socio-economics. Especially in large basins with many tributaries, once hydrological drought occurs synchronously in several tributaries, the hydrological drought condition in the mainstream will be aggravated, which will lead to more serious losses. However, there is still a lack of research on the probabilistic risk of simultaneous hydrologic droughts in various areas of large watersheds. In this study, the Standardized Runoff Index was used to characterize hydrological drought, and the Standardized Runoff Index (SRI) sequence characteristics of each region were analyzed. Subsequently, a multiregional hazard encounter probability distribution model with an R-vine structure was constructed with the help of the vine copula function to study the risk pattern of simultaneous hydrological drought in multiple tributaries under environmental changes. The model results showed that the probability of the four basins gradually decreased from 7.5% to 0.16% when the SRI changed from ≤−0.5 to ≤−2.0, indicating that the likelihood of the joint distribution of the compound disaster decreases with increase in the drought extremes. Meanwhile, the probability of hydrological drought in the three major basins showed significant spatial differences, and the risk ranking was Dongting Lake Basin > Poyang Lake Basin > Han River Basin. The model constructed in this study reveals the disaster risk law, provides theoretical support for the measurement of hydrological drought risk in multiple regions at the same time, and is of great significance for the prediction of compound drought disaster risk.

1. Introduction

As the global climate changes, extreme disasters continue to occur, posing a major threat to people’s lives and property and seriously affecting socio-economic development [1]. The encounter of extreme disasters in time and space has resulted in compound disaster events. With the deepening understanding of various types of extreme disaster events and their mechanisms, compound disasters have attracted widespread attention [2]. The complexity of composite hazard encounters poses a significant challenge to the combined risk metrics of hazard events, which has become an urgent fundamental science problem for the composite risk prediction of hydrological and meteorological hazards [3].
Drought is one of the costliest and most widespread natural disasters in the world [4,5,6,7]. From 1980 to 2017, droughts caused an average annual direct economic loss of USD 20.23 billion globally [8]. Current research on drought focuses on the propagation of different droughts, their spatial and temporal characteristics, and the drivers of drought. Kaizheng Xiang et al. [9] explored the mechanisms and propagation characteristics of meteorological and groundwater droughts in the Yellow River Basin. At the same time, Li Mei [10] conducted a study on the propagation processes and driving mechanisms of meteorological, hydrological, and agricultural droughts in the Mongolian Plateau. Gao et al. [11] examined the impact of climate change on the link between meteorological drought and agricultural drought. Jiang et al. [12] estimated the probability of the propagation of meteorological to ecological droughts using a hybrid machine-learning approach. This transfer between the droughts calculated from rainfall station data and hydrologic station data is applicable to small and medium-sized watersheds. However, it cannot reflect the regional variability of large watersheds with large areas and complex topography. Existing drought-related studies on large watersheds or large spatial scales mainly utilize gridded data analysis. These studies utilize gridded rainfall and runoff data to illustrate the characteristics of drought changes graphically. Chenhao Ge et al. [13] investigated the propagation of meteorological droughts to ecological droughts on a China-wide scale based on gridded data. Liang Li et al. [14] investigated the transmission of droughts among different droughts in the Yellow River Basin using gridded data. Mesfin Mamo Haile et al. [15] discussed the spatial and temporal characteristics and the drivers of groundwater drought in the Nile River Basin. Buliao Guan et al. [16] focused on the meteorological and atmospheric circulation factors that affected the SPEI (Standardized Precipitation Evapotranspiration Index) aridity index in the Haihe River Basin. However, these studies neglected the spatial correlation of hydrological processes among different tributaries. They lacked an in-depth exploration of the risk of spatial and temporal correlation of the hydrological droughts in multi-tributary basins [17]. Hydrologic droughts in large basins originate in tributaries, and when several tributaries experience drought at the same time, the overlapping of the droughts can exacerbate the problem [18]. Therefore, an in-depth study of the drought encounter risk of multiple tributaries is of great practical significance to current drought scheduling work. Nevertheless, few studies have been conducted to analyze the drought risk encountered by different tributaries in large basins.
Copula functions are highly adaptable and flexible. Any marginal distribution can be connected to construct a joint distribution by the copula function [19,20]. Since all the information on the variables is contained in the marginal distributions, the transformation process does not distort the information. Currently, copula functions are widely used in correlation analysis in hydrometeorology and other fields [21,22]. The function effectively models hydrological events and their correlation structures and is widely used in hydrological frequency analysis, precipitation prediction, drought identification, and other fields. It can identify the dependence of extreme hydrological events and their multivariate characteristics, effectively reducing the computational difficulty [23]. However, when studying multiple variables, the traditional two-dimensional copula function is not applicable, and it is necessary to construct a high-dimensional joint distribution by combining two by two. This can cause dimensional catastrophe and lead to parameterization difficulties. Bedford et al. [24] proposed the idea of vine copula, which solves the limitation of extending to higher dimensions and improves the flexibility by constructing a multivariate conditional dependence structure and decomposing the multivariate joint distribution by using the pair copula function to build a vine copula model. In recent years, vine copula has been increasingly used in the risk assessment and prediction studies of compound hydrometeorological hazard events. However, the application of vine copula in modelling probability distributions and probability calculations for simultaneous multi-region drought encounters is still limited.
The 2022 mega-drought event in the Yangtze River basin resulted in severe losses [25]. Currently, drought research in the basin is mainly based on downscaled grid data [26,27], which can identify drought evolution characteristics. However, it is challenging to assess the risk of varying drought intensities in the major tributaries (e.g., Han River) and key lake areas (e.g., Dongting Lake and Poyang Lake). This research gap seriously restricts the construction of a comprehensive drought risk assessment system in the basin. Therefore, this study aimed to analyze the hydrological drought characteristics of the Yangtze River tributaries (and lake areas) and to construct a multi-source hydrological drought encounter risk model for the basin.
In this study, based on the runoff data of Dongting Lake, Hanjiang River, and Poyang Lake in the Yangtze River Basin (YRB), the hydrological drought index was calculated, and the drought characteristics of each region were analyzed. Given the spatial and temporal correlation of the droughts in several tributaries and lakes, a spatial and temporal coupled multi-source hydrological drought encounter risk calculation model based on vine copula was constructed. Accordingly, the hydrological drought risk for each region in the Yangtze River Basin was calculated and analyzed.
This paper explores the characteristics of hydrological drought in each region of the YRB. It proposes the construction of a risk model for drought encounters in the YRB to obtain the probabilistic risk characteristics of hydrological drought encounters in each region of the YRB. The overall research framework consisted of the following steps (Figure 1):
(1) Firstly, this research calculated the SRI series of each regional hydrological unit, fitted its optimal probability distribution function, calculated the probability risk of the occurrence of hydrological drought events under different conditions, and quantitatively revealed the frequency characteristics for the occurrence of hydrological droughts under different conditions in the spatial dimension.
(2) A multidimensional drought joint probability distribution model was constructed based on the vine copula theory, and on the basis of Kendall’s rank correlation coefficient, combined with the maximum spanning tree algorithm to select the appropriate R-vine structure and the basis of the minimum of the sum of the Akaike Information Criterion (AIC), the type of the copula function was optimized and the parameter values were calculated. Finally, a multi-source hydrological drought encounter model for Dongting Lake–Yichang–Hanjiang–Poyang Lake and a multi-source hydrological drought encounter model for Dongting Lake–Yichang–Hanjiang–Poyang Lake–Datong in the YRB were established to analyze the probability of encountering drought risks in different regions and to provide a basis for quantifying the risk transfer of the drought chain in the YRB.

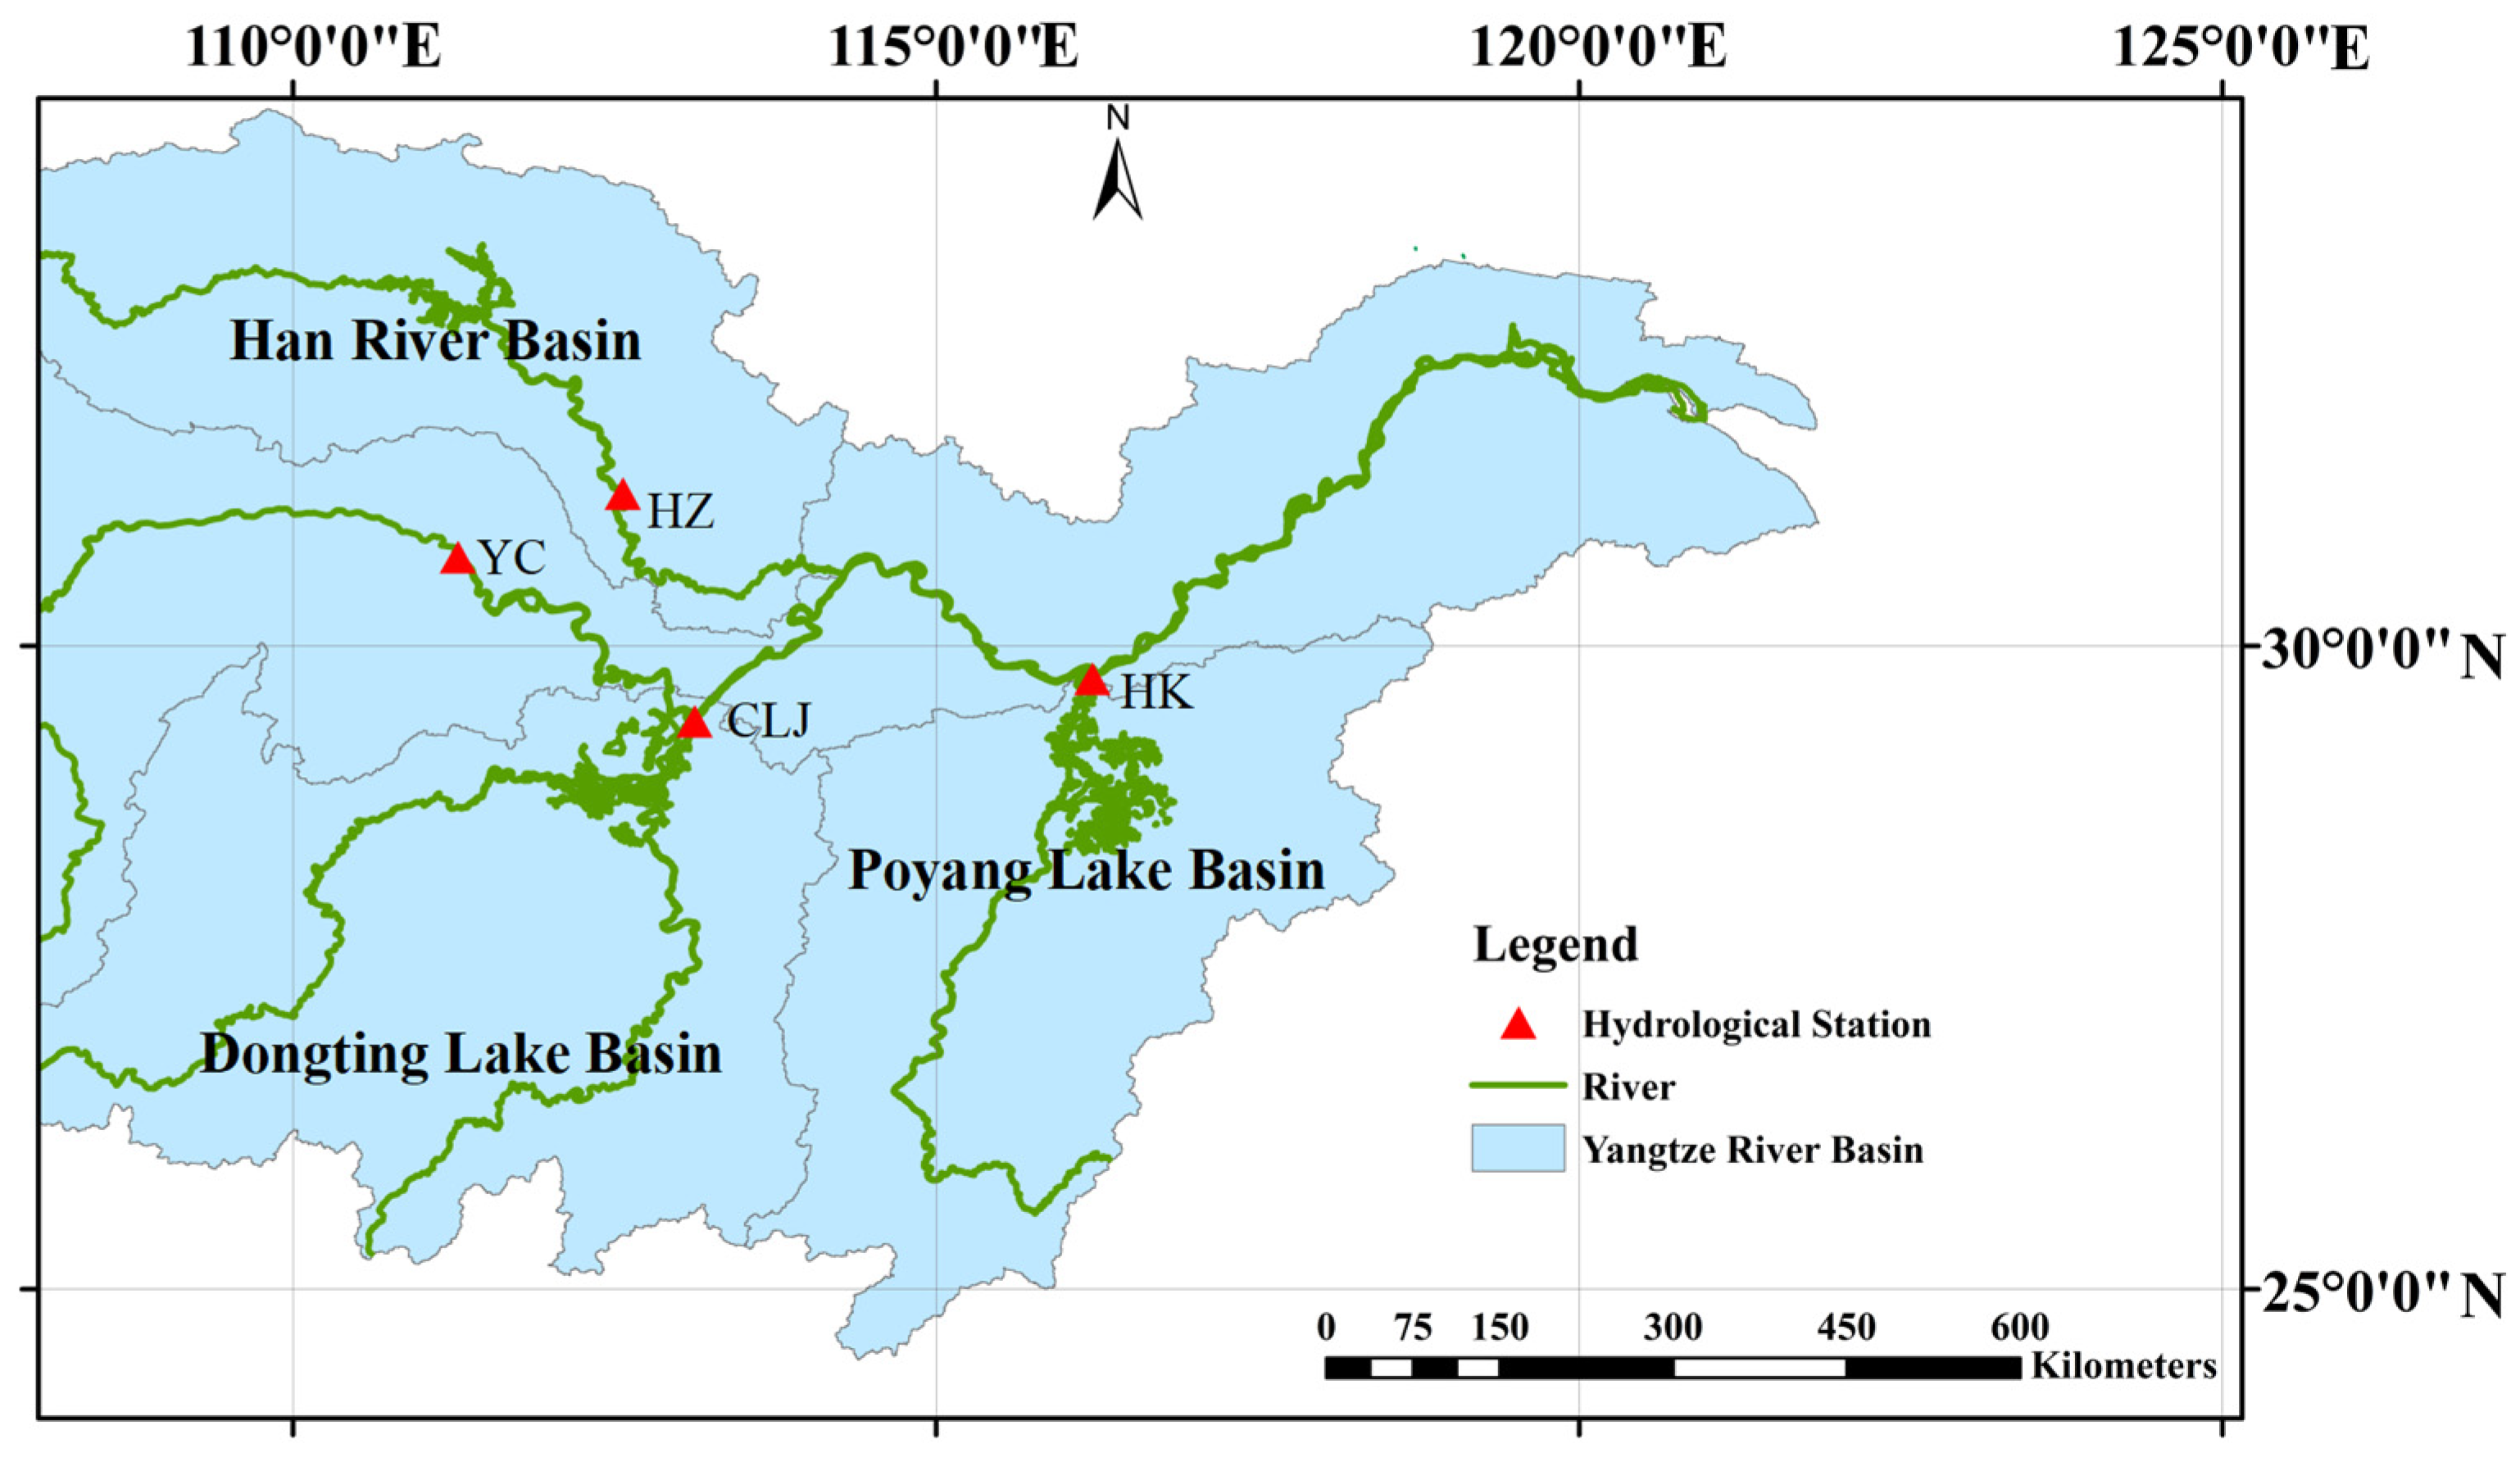
2. Study Area and Data

The YRB originates from the Tanggula Mountains in Qinghai Province. Its geographic location is between 90°33′–122°25′ east longitude and 24°30′–35°45′ north latitude. The YRB spans 19 provinces, cities, and autonomous regions in the three major economic zones of eastern, central, and western China. With a total area of 1.8 million square kilometers, it is the largest river basin in China and the third largest globally. The YRB has a well-developed water system and many tributaries. The Minjiang, Jialing, and Hanjiang rivers cover an area of more than 100,000 square kilometers, and lakes such as Dongting Lake and Poyang Lake converge into it. The Yangtze River basin covers 18.8 per cent of the country, with a population of 459 million and an annual water resource of 987.4 billion cubic meters (36 per cent of the country’s total), and is the lifeblood of the water supply for eastern, central, and southwestern China. It maintains 32.5% of the nation’s food production capacity and is the core area for national food security. In 2022, the Yangtze River Basin mega-drought event exposed a system vulnerability: extreme drought in the northern tributaries expanded into a basin-wide crisis due to rainfall anomalies, resulting in 4.08 million hectares of crops being affected, 4.99 million people experiencing drinking water difficulties, and a loss of USD 4.9 billion [25]. Several major hydraulic hub projects above the Three Gorges Gezhouba Dam in the upper reaches of the YRB altered the natural runoff. Therefore, in this study, each tributary upstream of Yichang Station was considered a watershed (upper Yangtze River). The runoff data from Yichang Station were used to represent the runoff of the upper Yangtze River. This study covered the upper reaches of the YRB, including Dongting Lake in the middle and lower reaches of the YRB and Poyang Lake along the Han River. In order to study the hydrological drought encounters in these four areas, we collected monthly-scale runoff data from four hydrological control stations in the YRB (Yichang, Chenglingji, Huangzhuang, and Hukou) for a total of 43 years from 1980 to 2022. Among them, Yichang represented the outflow from the Three Gorges, Chenglingji represented the runoff from the Dongting Lake basin, Huangzhuang represented the runoff from the Hanjiang River basin, and Hukou represented the runoff from the Poyang Lake basin. The distribution of the hydrological stations is shown in Figure 2.

3. Methodology

In this study, based on the spatial and temporal correlation of hydrological drought in the Yangtze River Delta region, the hydrological drought index of each region was first calculated. Following that, the distribution characteristics of the series of drought indices were analyzed. On this basis, the hydrological drought index and its distribution characteristics in each region were used to construct a multi-source hydrological drought encounter model based on the vine copula function, which quantified the probabilistic risk of multi-source hydrological drought encounters.

3.1. Drought Characteristics of Each Region

3.1.1. Drought Index

The SRI was first proposed by Shukla and Wood [28] to reflect drought changes on multiple time scales. The SRI has been widely applied to describe hydrological drought [29,30]. Studies have shown that this index is well-suited to characterize hydrological drought in the YRB [31,32]. Therefore, the SRI was used in this study to measure the water in the YRB. The computational procedure of the SRI is shown in detail in Shukla and Wood’s paper [28].

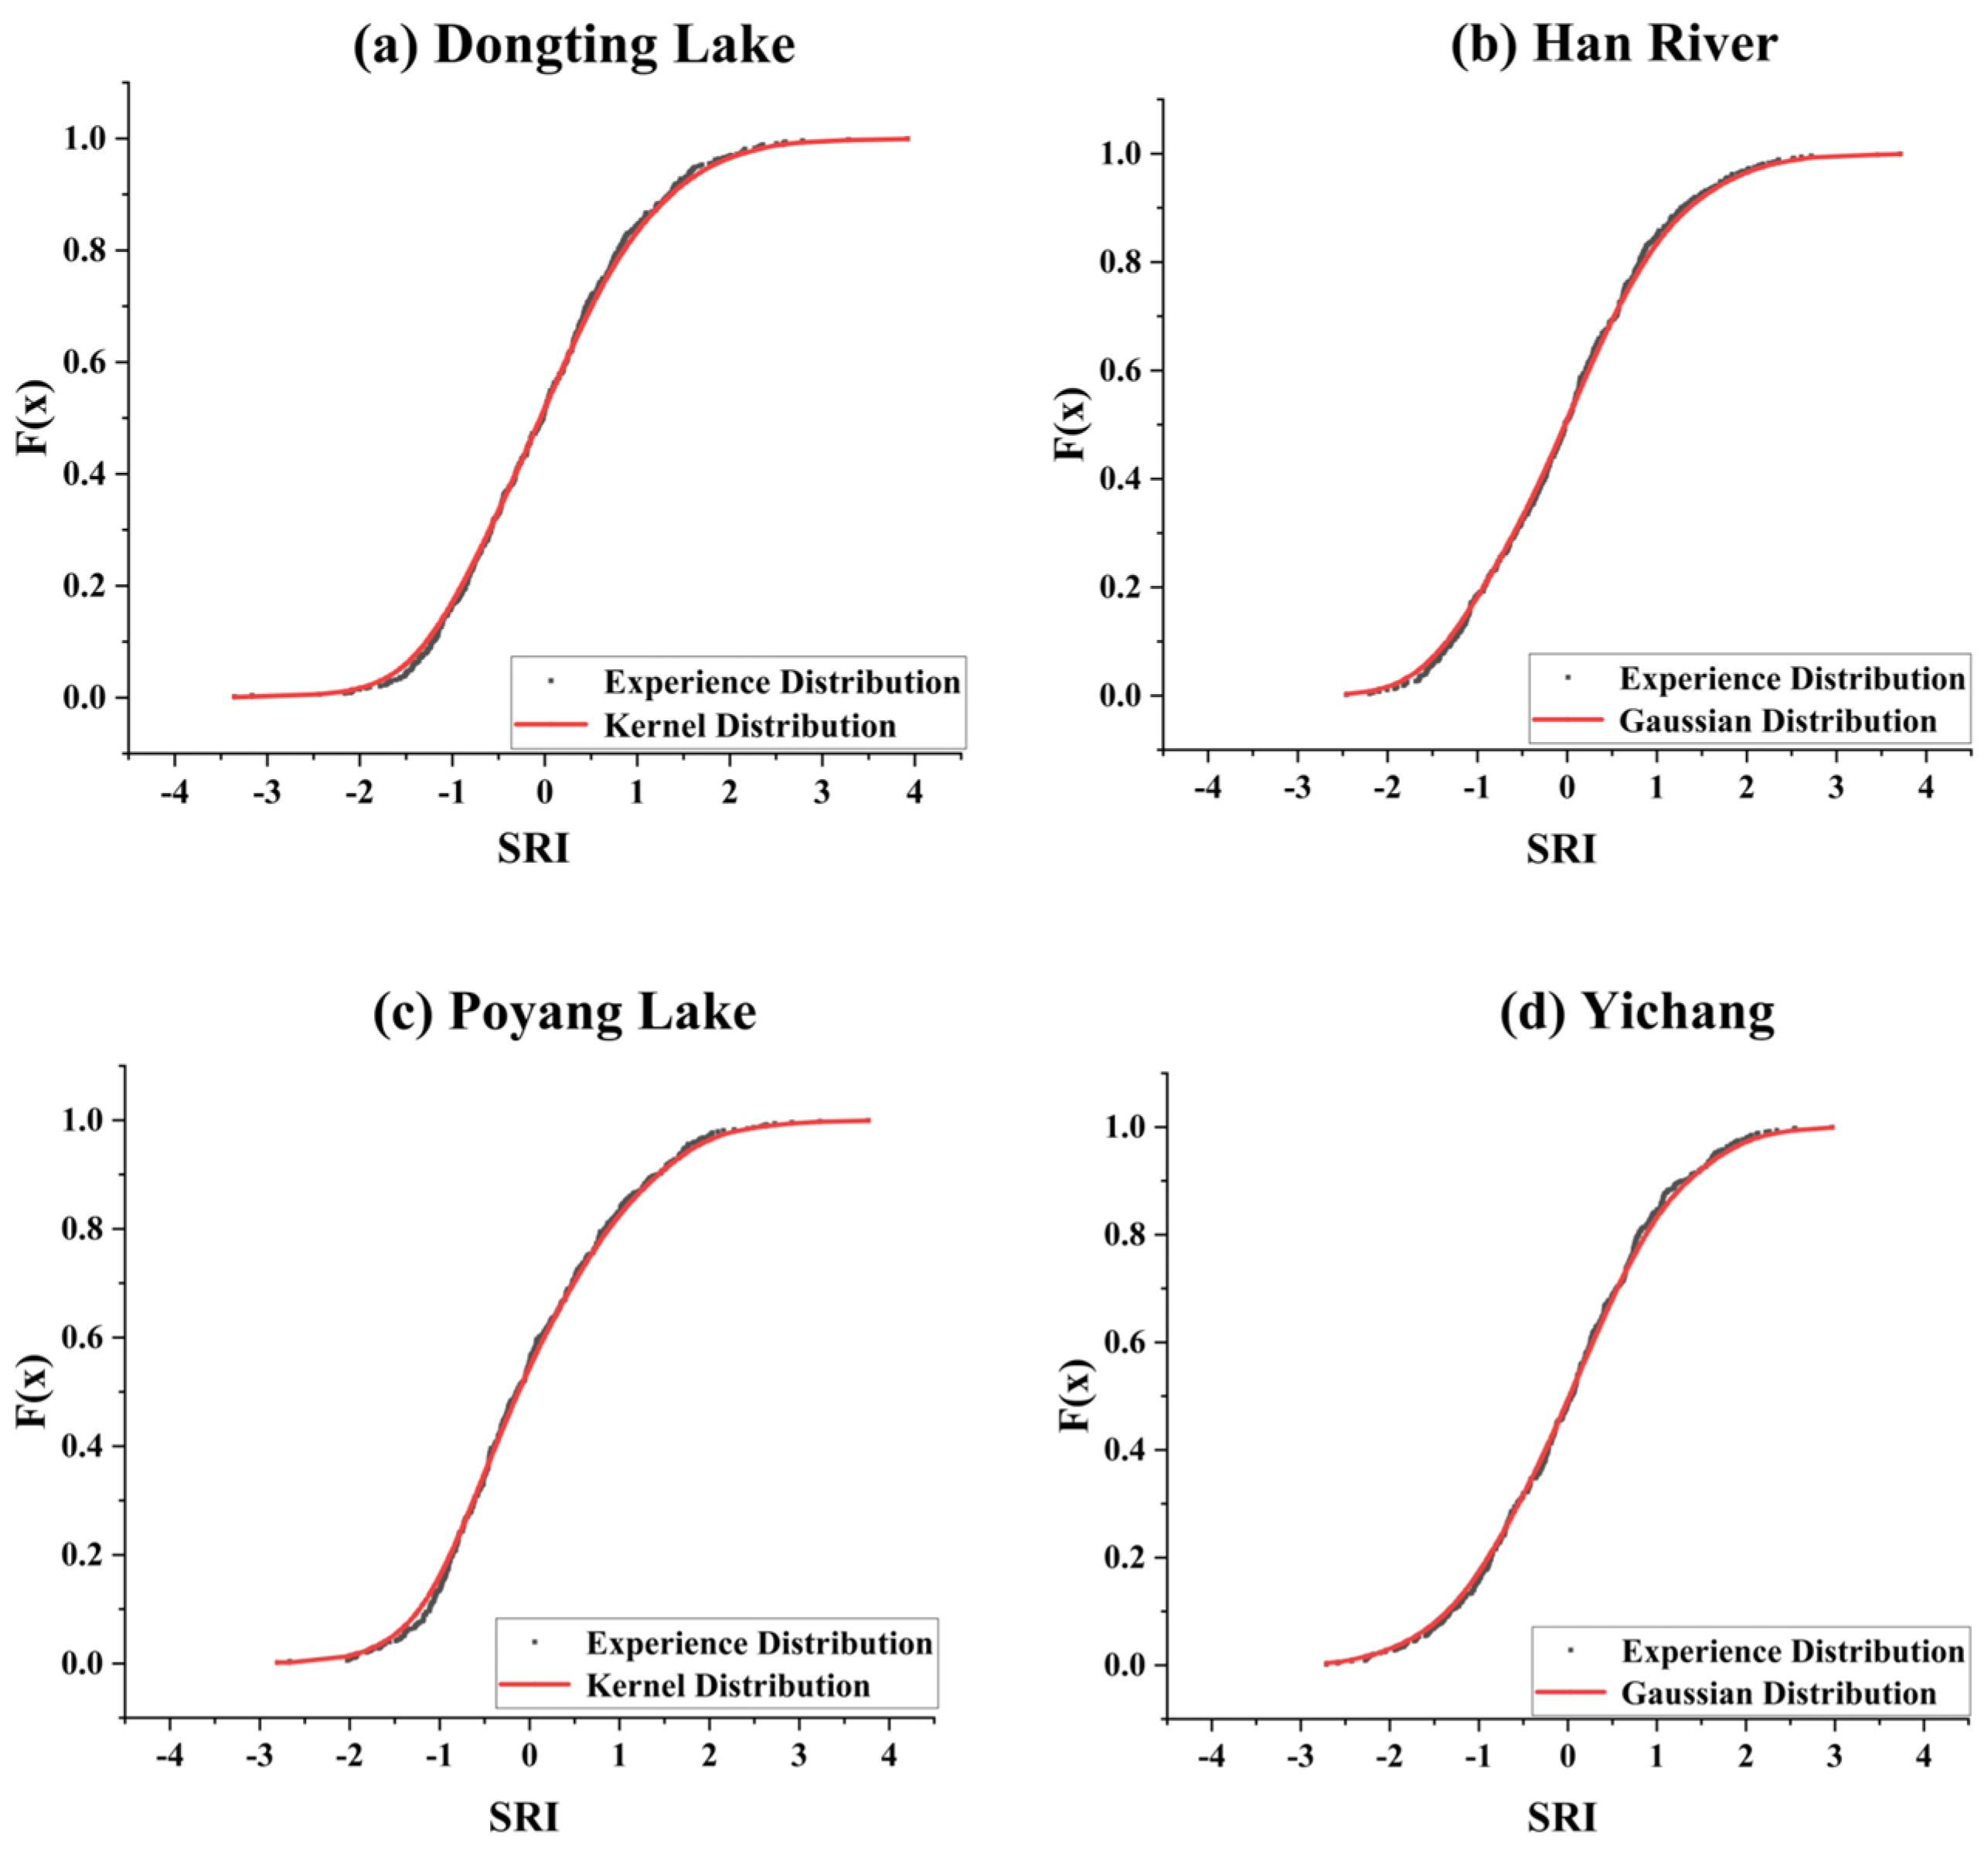
3.1.2. SRI Distribution Fitting

This study fitted empirical distributions for computing the SRI using seven distinct distribution functions prevalent in hydrology: EV, GEV, Kernel, Logistic, Gaussian, and t. The parameters were estimated using the method of Excellent Likelihood, and the distributions were optimized by the Root Mean Squared Error (RMSE) and R-Square (R2). The R2 value close to 1 and the minimum RMSE were taken as the selection criteria, and the optimal distribution function was selected by combining the two metrics.

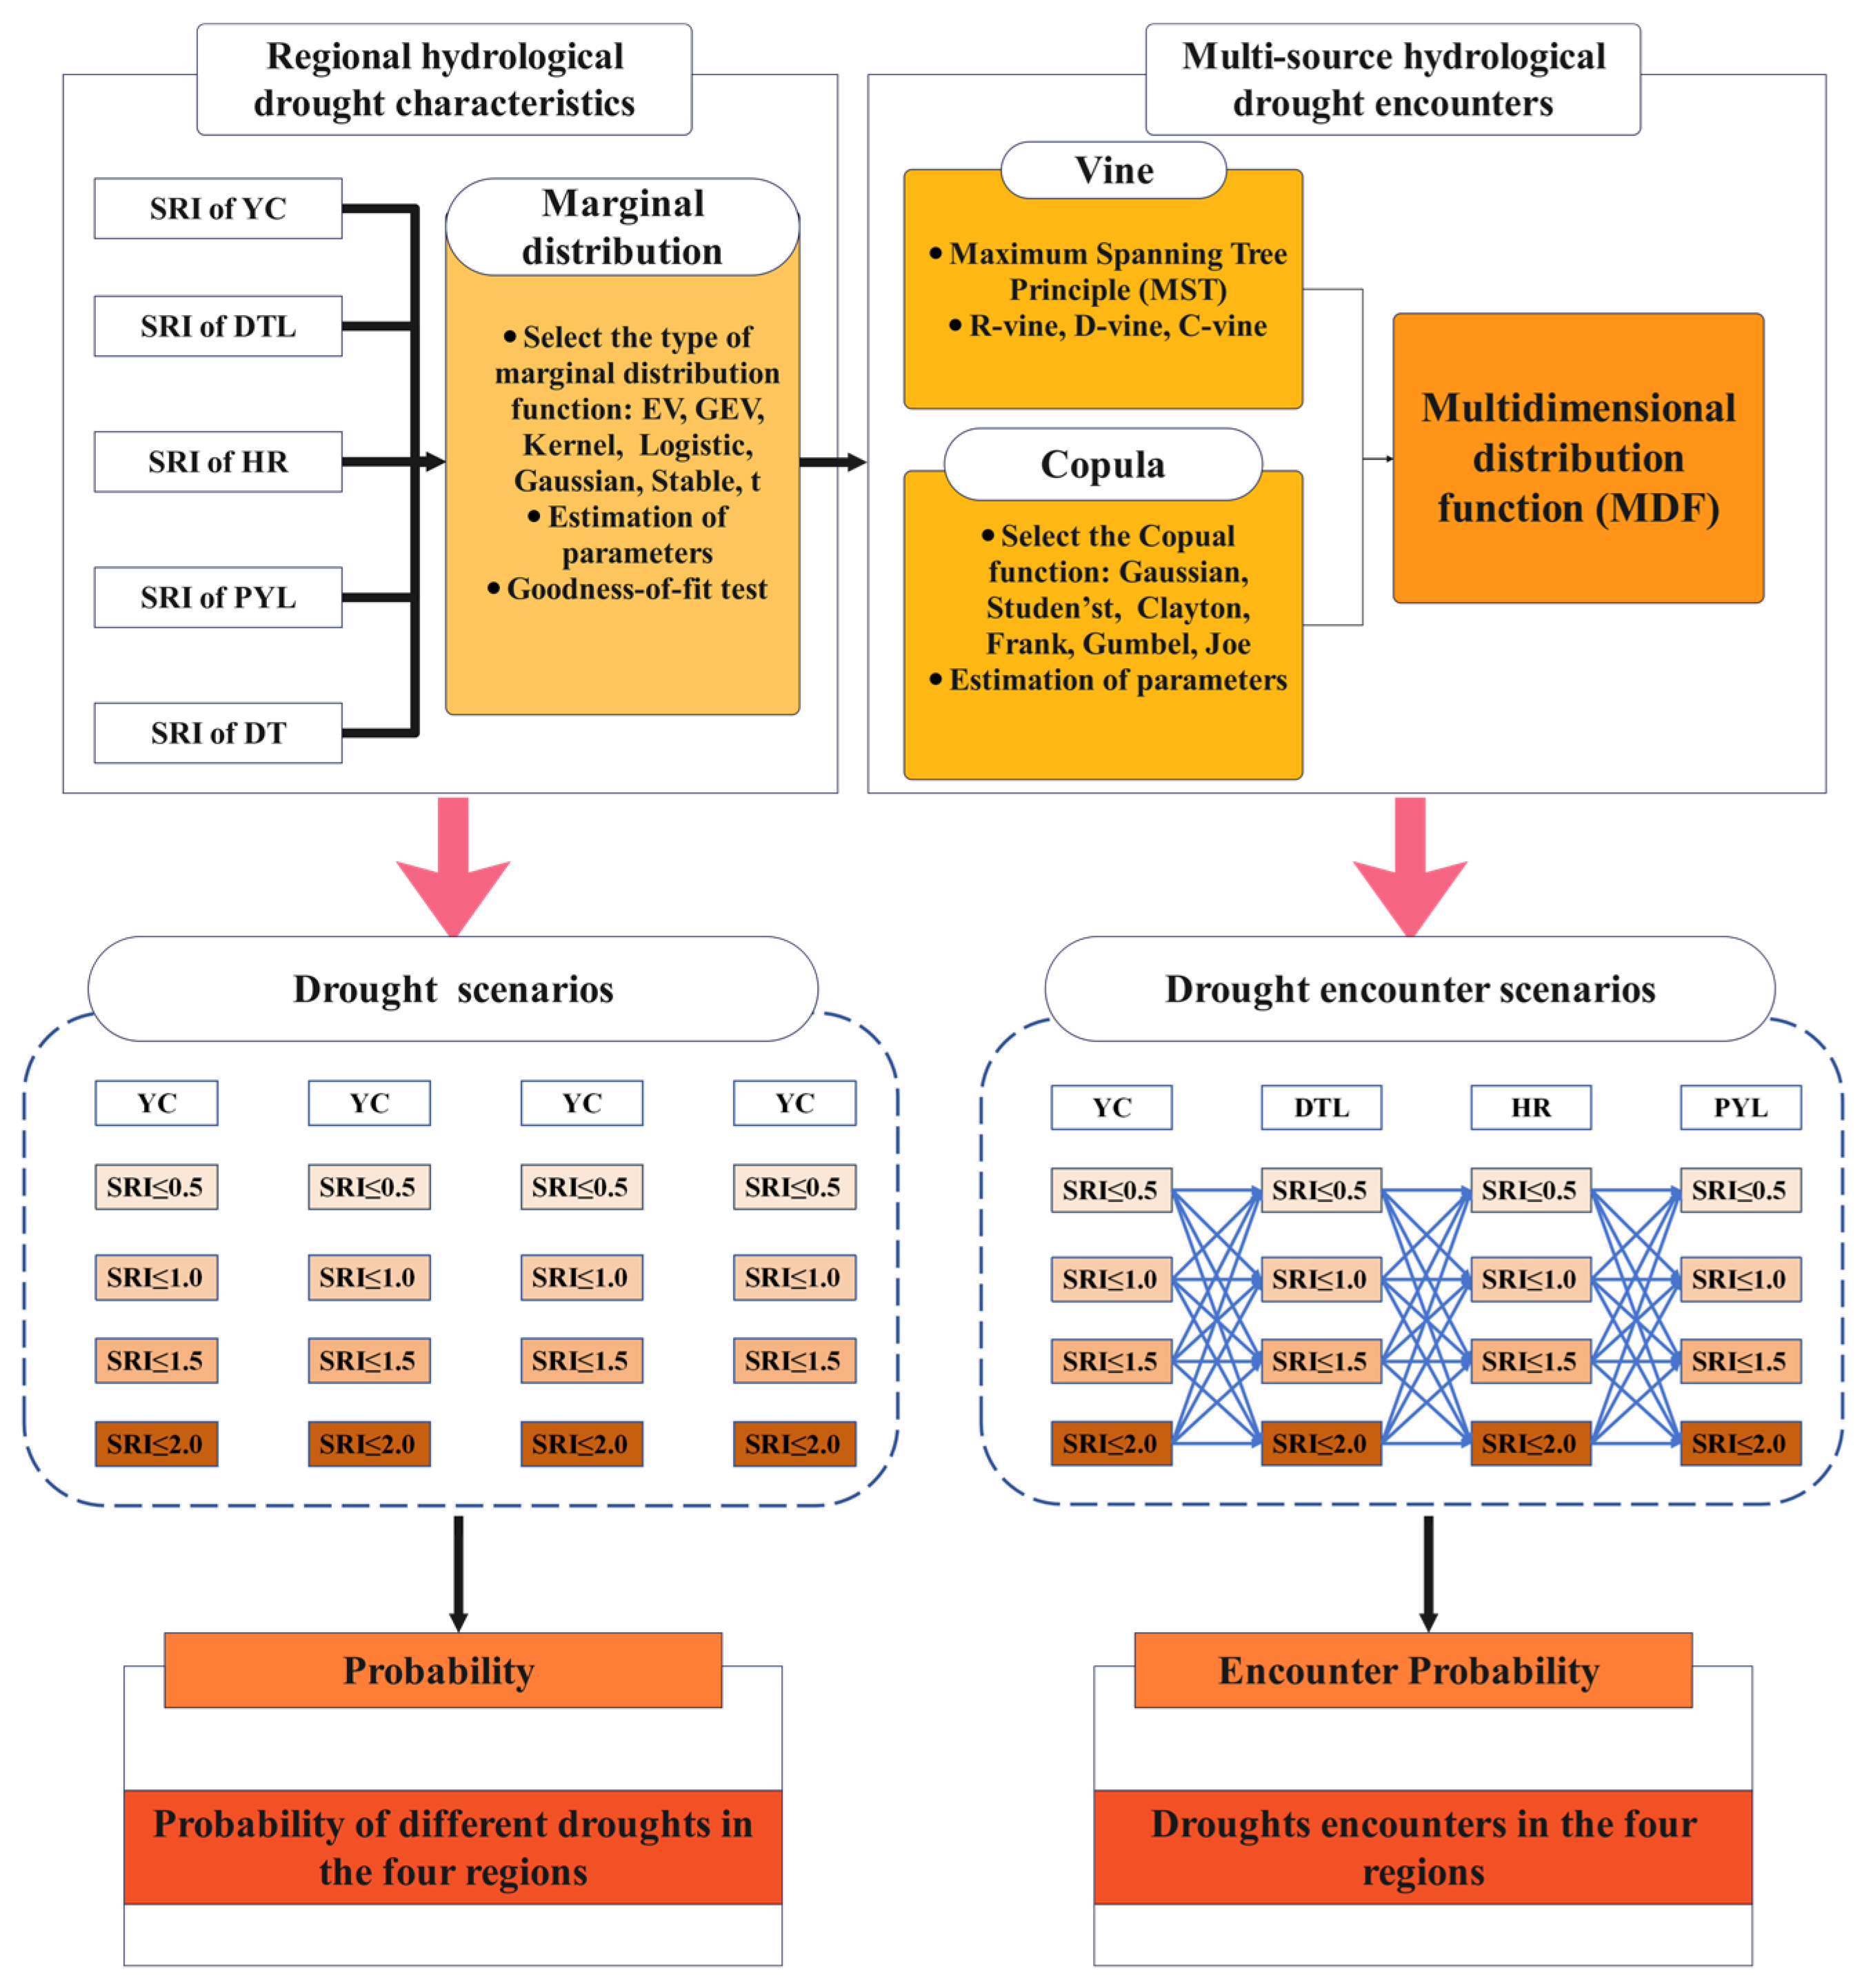
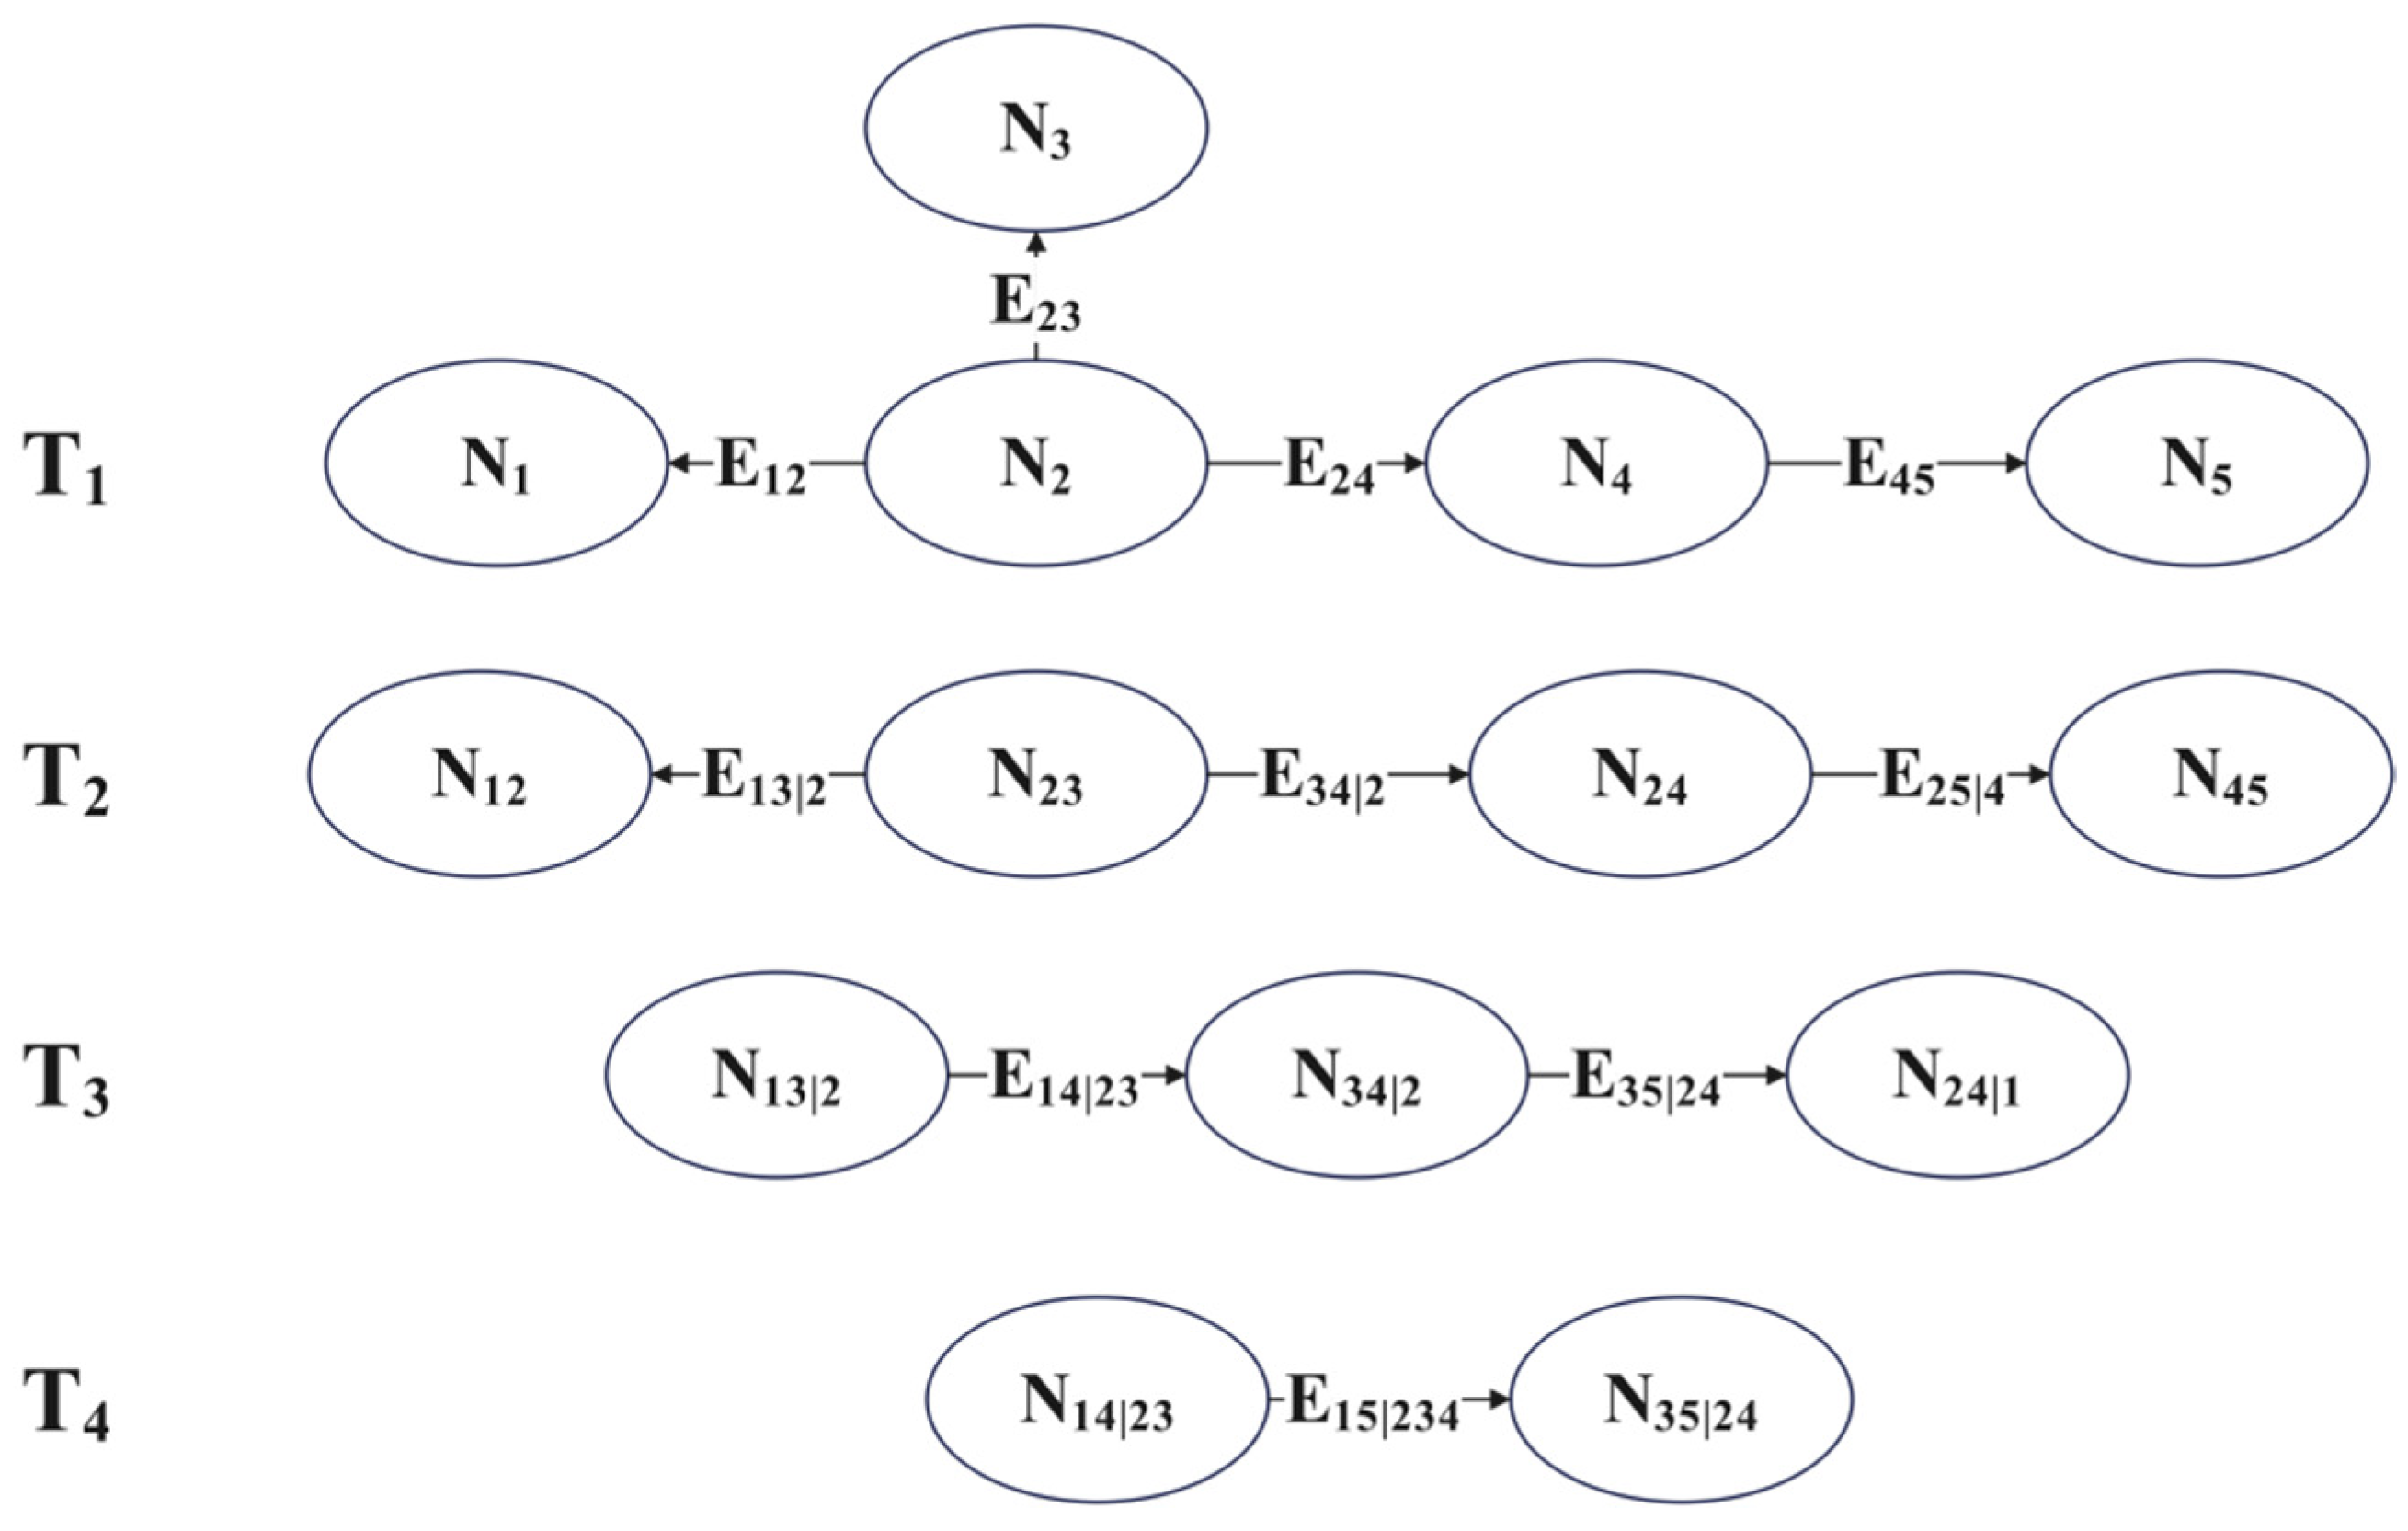
3.2. Multi-Source Hydrologic Drought Encounter Risk Calculation Model

The YRB covers a vast area with many tributaries and complex hydrometeorological conditions. The copula function can be used to construct a multidimensional distribution function and assess the risk of multi-region drought encounters. However, the complexity of parameter and formula calculations limits the application of two-dimensional copula in higher-dimensional modelling. Vine copula was proposed by Joe [33]. The idea was to decompose the n-dimensional joint density function into n(n − 1)/2 binary copula density functions, constructing a hierarchical “vine-like” connectivity structure, which breaks through the bottleneck of high-dimensional modelling, maintains the feasibility of calculations, and flexibly characterizes the complex high-dimensional dependencies and heterogeneity of droughts [34]. Vine copula consists of three typical architectures, namely C-vine, D-vine, and R-vine, which optimize the connection order of variables through graphical modelling and enhance the flexibility of the structure [35]. It is suitable for constructing the joint probability distributions of multivariate risks such as composite drought disasters. The R-vine architecture is suitable for constructing joint probability distributions for multiple risk events, such as composite drought hazards, which can retain the nonlinear and asymmetric dependence characteristics among the hazard elements and reduce the complexity of high-dimensional modelling through the tree decomposition strategy. Therefore, the R-vine structure was selected in this study to provide a methodological framework for the risk assessment of multi-regional extreme event encounters.
The R-vine structure is shown in Figure 3 and consists of nodes, trees, and edges. Each vine structure consists of a number of sequence trees, T, and each sequence tree contains a number of nodes, N, and the lines between the nodes form the edges of the tree, E. Each edge on each tree in the R-vine structure corresponds to a pairwise copula density function. By multiplying these pairwise copula density functions, we can get the corresponding multivariate copula density function, which can then be used to obtain the joint density function of multivariate random variables.
In the R-vine structure, the nodes of a five-dimensional random variable can be connected in different ways and in different orders to produce a variety of R-vine structure construction results. Generally, it is based on the use of Kendall’s rank correlation coefficient, combined with the maximum spanning tree algorithm to select the appropriate R-vine structure [36], and the trees all need to satisfy the following conditions:
S = M A X   ( τ X , Y )
where τ X , Y denotes the Kendall’s rank correlation coefficient. X and Y represent two data sequences.
The copula function type on each edge is preferred, and the parameter values are calculated based on the minimum sum of the tree’s Akaike Information Criterion (AIC) at each level [37].
A I C = 2 ln c ( u i 1 , u i 2 | θ ) + 2 P
where c ( u i 1 , u i 2 | θ ) denotes the fitted copula function, and P denotes the number of parameters.
In this study, the application of the R-vine copula function based on multiregional SRI sequences provided a methodology for risk assessment of multiregional hydrologic drought event encounters. Based on the SRI sequences of each region in the watershed, the optimal vine structure system for the drought encounter model was constructed in this study using the maximum spanning tree algorithm. The copula function types and their optimal parameter combinations for each structural edge were systematically screened by minimizing the Akaike Information Criterion (AIC). Table 1 shows the copula functions and corresponding parameters for each edge of the vine structure of the Dongting Lake–Yichang–Han River–Poyang Lake drought encounter hierarchical tree model.
The constructed Yichang–Dongting Lake–Han River–Poyang Lake drought encounter hierarchical tree model portrayed the regional drought correlation mechanism through three levels of trees. Three sets of binary copula-based associations were built at the first level: Dongting Lake–Yichang and Han River–Yichang both used the Student’s t copula with the parameters (ρ = 0.82, ν = 5.49) and (ρ = 0.59, ν = 7.93), respectively, and Poyang Lake–Dongting Lake utilized the Gumbel copula (θ = 1.36) to characterize asymmetric dependence. The second level expanded the conditional associations, including Poyang Lake–Yichang, which used the Joe copula (θ = 1.06) association under the Dongting Lake condition, and Han River–Dongting Lake, which used the Frank copula (θ = −0.64) regulation under the Yichang condition. The final level revealed higher-order interactions, resolving the multivariate nonlinear coupling for Poyang Lake–Han River through the Gaussian copula (ρ = −0.10) under the Dongting Lake–Yichang joint condition.

4. Results and Analysis

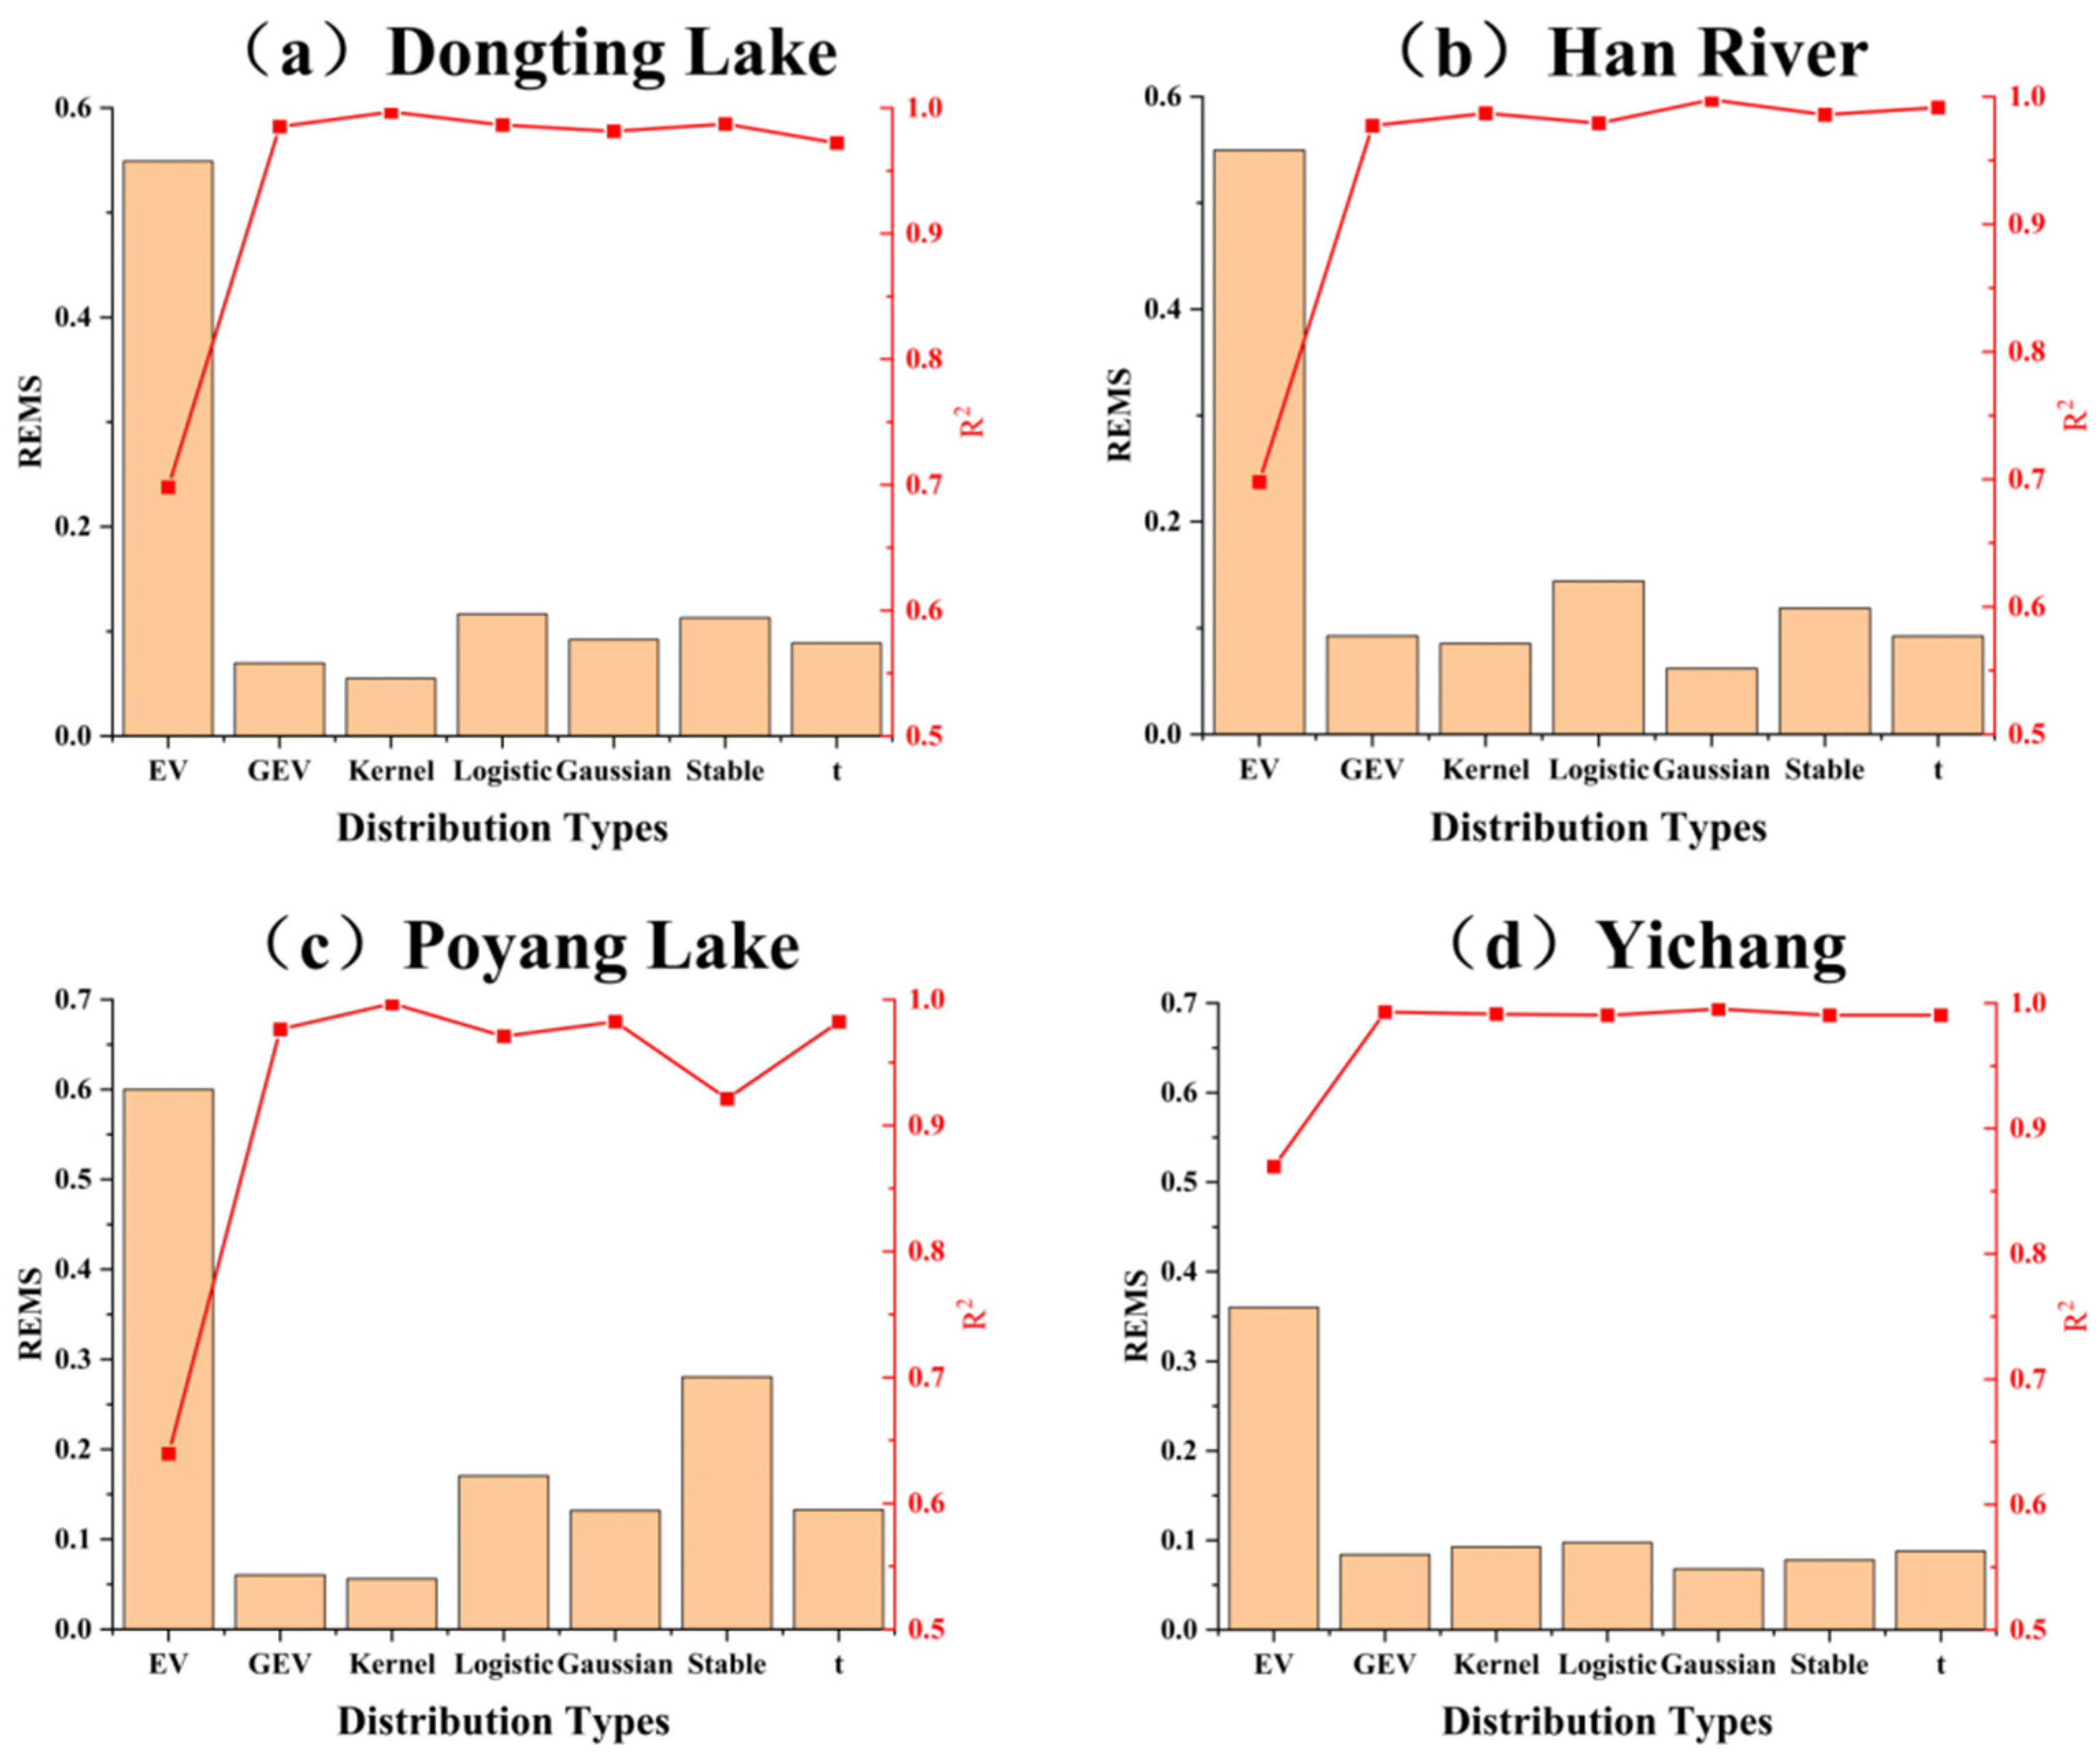
4.1. Fitting the Optimal Marginal Distribution

Figure 4 illustrates the results of fitting the distribution of SRI sequences for each watershed, and Figure 5 illustrates the violin plots of the SRI sequences for each watershed. As shown in Figure 4, the series of the four basins showed REMS values around 0.5, R2 values below 0.5, and the worst below 0.2 when fitted with the EV distribution. The series of the four basins showed poorer results when equipped with the EV distribution. The other six distributions were fitted differently in different basins because the YRB is a vast area with different basins and different regions, meteorological conditions, and topographic conditions, which were manifested as different distributions in the SRI sequences. Six different distribution functions (GEV, Kernel, Logistic, Gaussian, Stable, and t) were used to fit the SRI series in the YRB. According to the violin plots in Figure 5, it could be observed that the violin plots of the SRIs in the upper Yangtze River and Han River Basin were more consistent. At the same time, those of the SRI sequences in the Dongting Lake Basin and Poyang Lake Basin were consistent. According to the information in Figure 4, the results of the SRI sequence fitting in the upper Yangtze River and Han River basin were closer to the Gaussian distribution. Similarly, the SRI sequence fitting results of Dongting Lake basin and Poyang Lake basin were closer to the kernel distribution. Therefore, in this paper, Gaussian distribution was chosen for the SRI distribution in the upper Yangtze River and Han River basin, and nuclear distribution was chosen for the SRI distribution in the Dongting Lake basin and Poyang Lake basin.
The violin–beeswarm plot obtained from the SRI sequence statistics for each watershed are shown in Figure 5. Based on the calculated optimal distribution of the SRI series for each watershed, the probability of the different levels of drought for each watershed was obtained, as shown in Figure 6.
According to the statistical results in Figure 5 and Figure 6, the SRI sequences of Dongting Lake Basin and Poyang Lake Basin were characterized by kernel distributions, which were different from the Gaussian distribution pattern of other basins, which may be related to the asymmetry of its hydrological process and the frequent occurrence of extreme events. The highest probability of an SRI ≤ −0.5 was for the Poyang Lake Basin at 34.7%, which reflected the fragile state of the water balance in this region. The probability of an SRI ≤ −1.0 in Dongting Lake Basin (16.7%) was significantly higher than that in other distribution areas, indicating the increased sensitivity of its hydrological system to climate change. The probability distributions of the SRIs at Hanjiang and Yichang stations showed typical Gaussian distributions. The probability of an SRI < −2.0 at Yichang station was 2.7%, which was 1.3–1.6 times higher than that at other stations, which may be related to its special geographic location as the dam site of the Three Gorges Project—the water level regulation in the reservoir area exacerbates the fluctuation of the hydrological situation [38]. As a control station of the Yangtze River Commission, the probability of drought in each class was the lowest, with a probability of an SRI < −2.0 of 1.1%, which highlighted the hydrological buffer role of the large-scale river system. When the SRI ≤ −2.0, the probability was only 1.1%, highlighting the hydrological buffer role of large-scale river systems.
It is particularly noteworthy that the probability of the SRI ≤ −1.5 was less than 5% at all stations, and an SRI ≤ −2.0 was generally less than 3%, which was consistent with the relatively rare characteristic of widespread, persistent drought in the YRB in historical observations. However, the abnormally high probability of SRI ≤ −2.0 of 2.7% at Yichang station echoed the ecological water level fluctuations triggered by the frequent “storage, clearing, and drainage” scheduling of the Three Gorges Reservoir area in recent years, suggesting that human activities have restructured the drought pattern in the region. This spatial heterogeneity provides an essential basis for regional drought management.

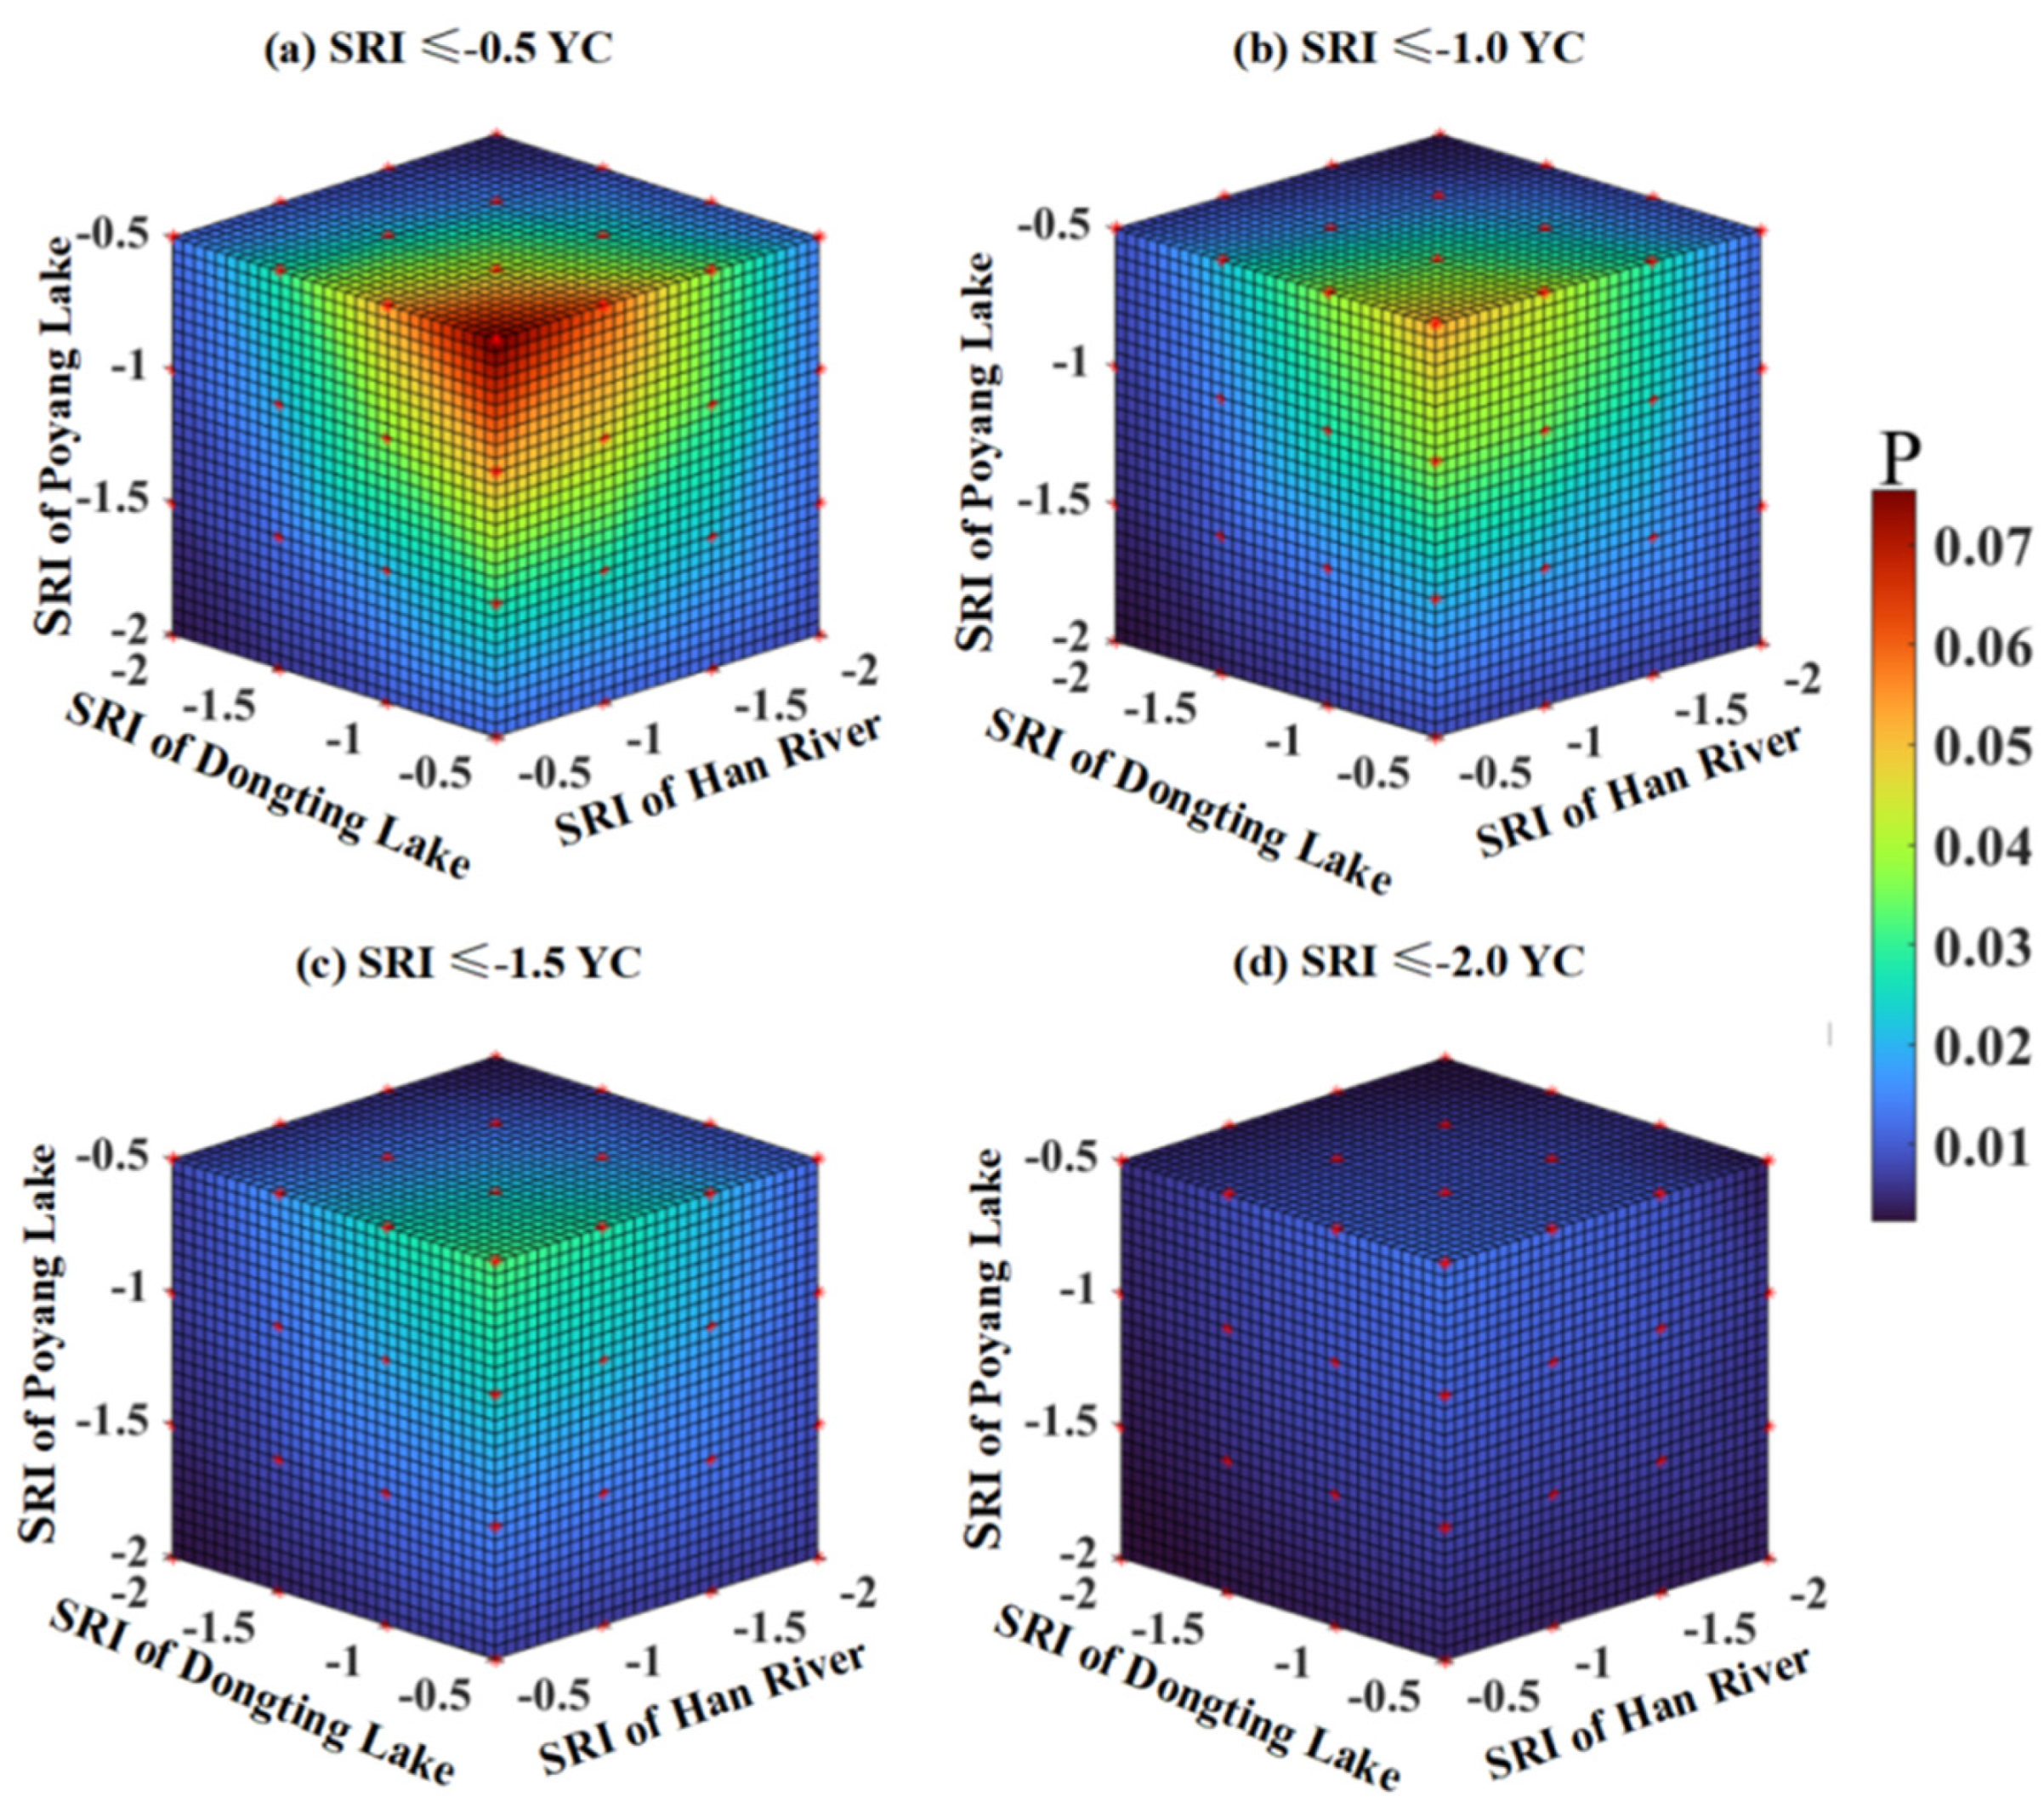
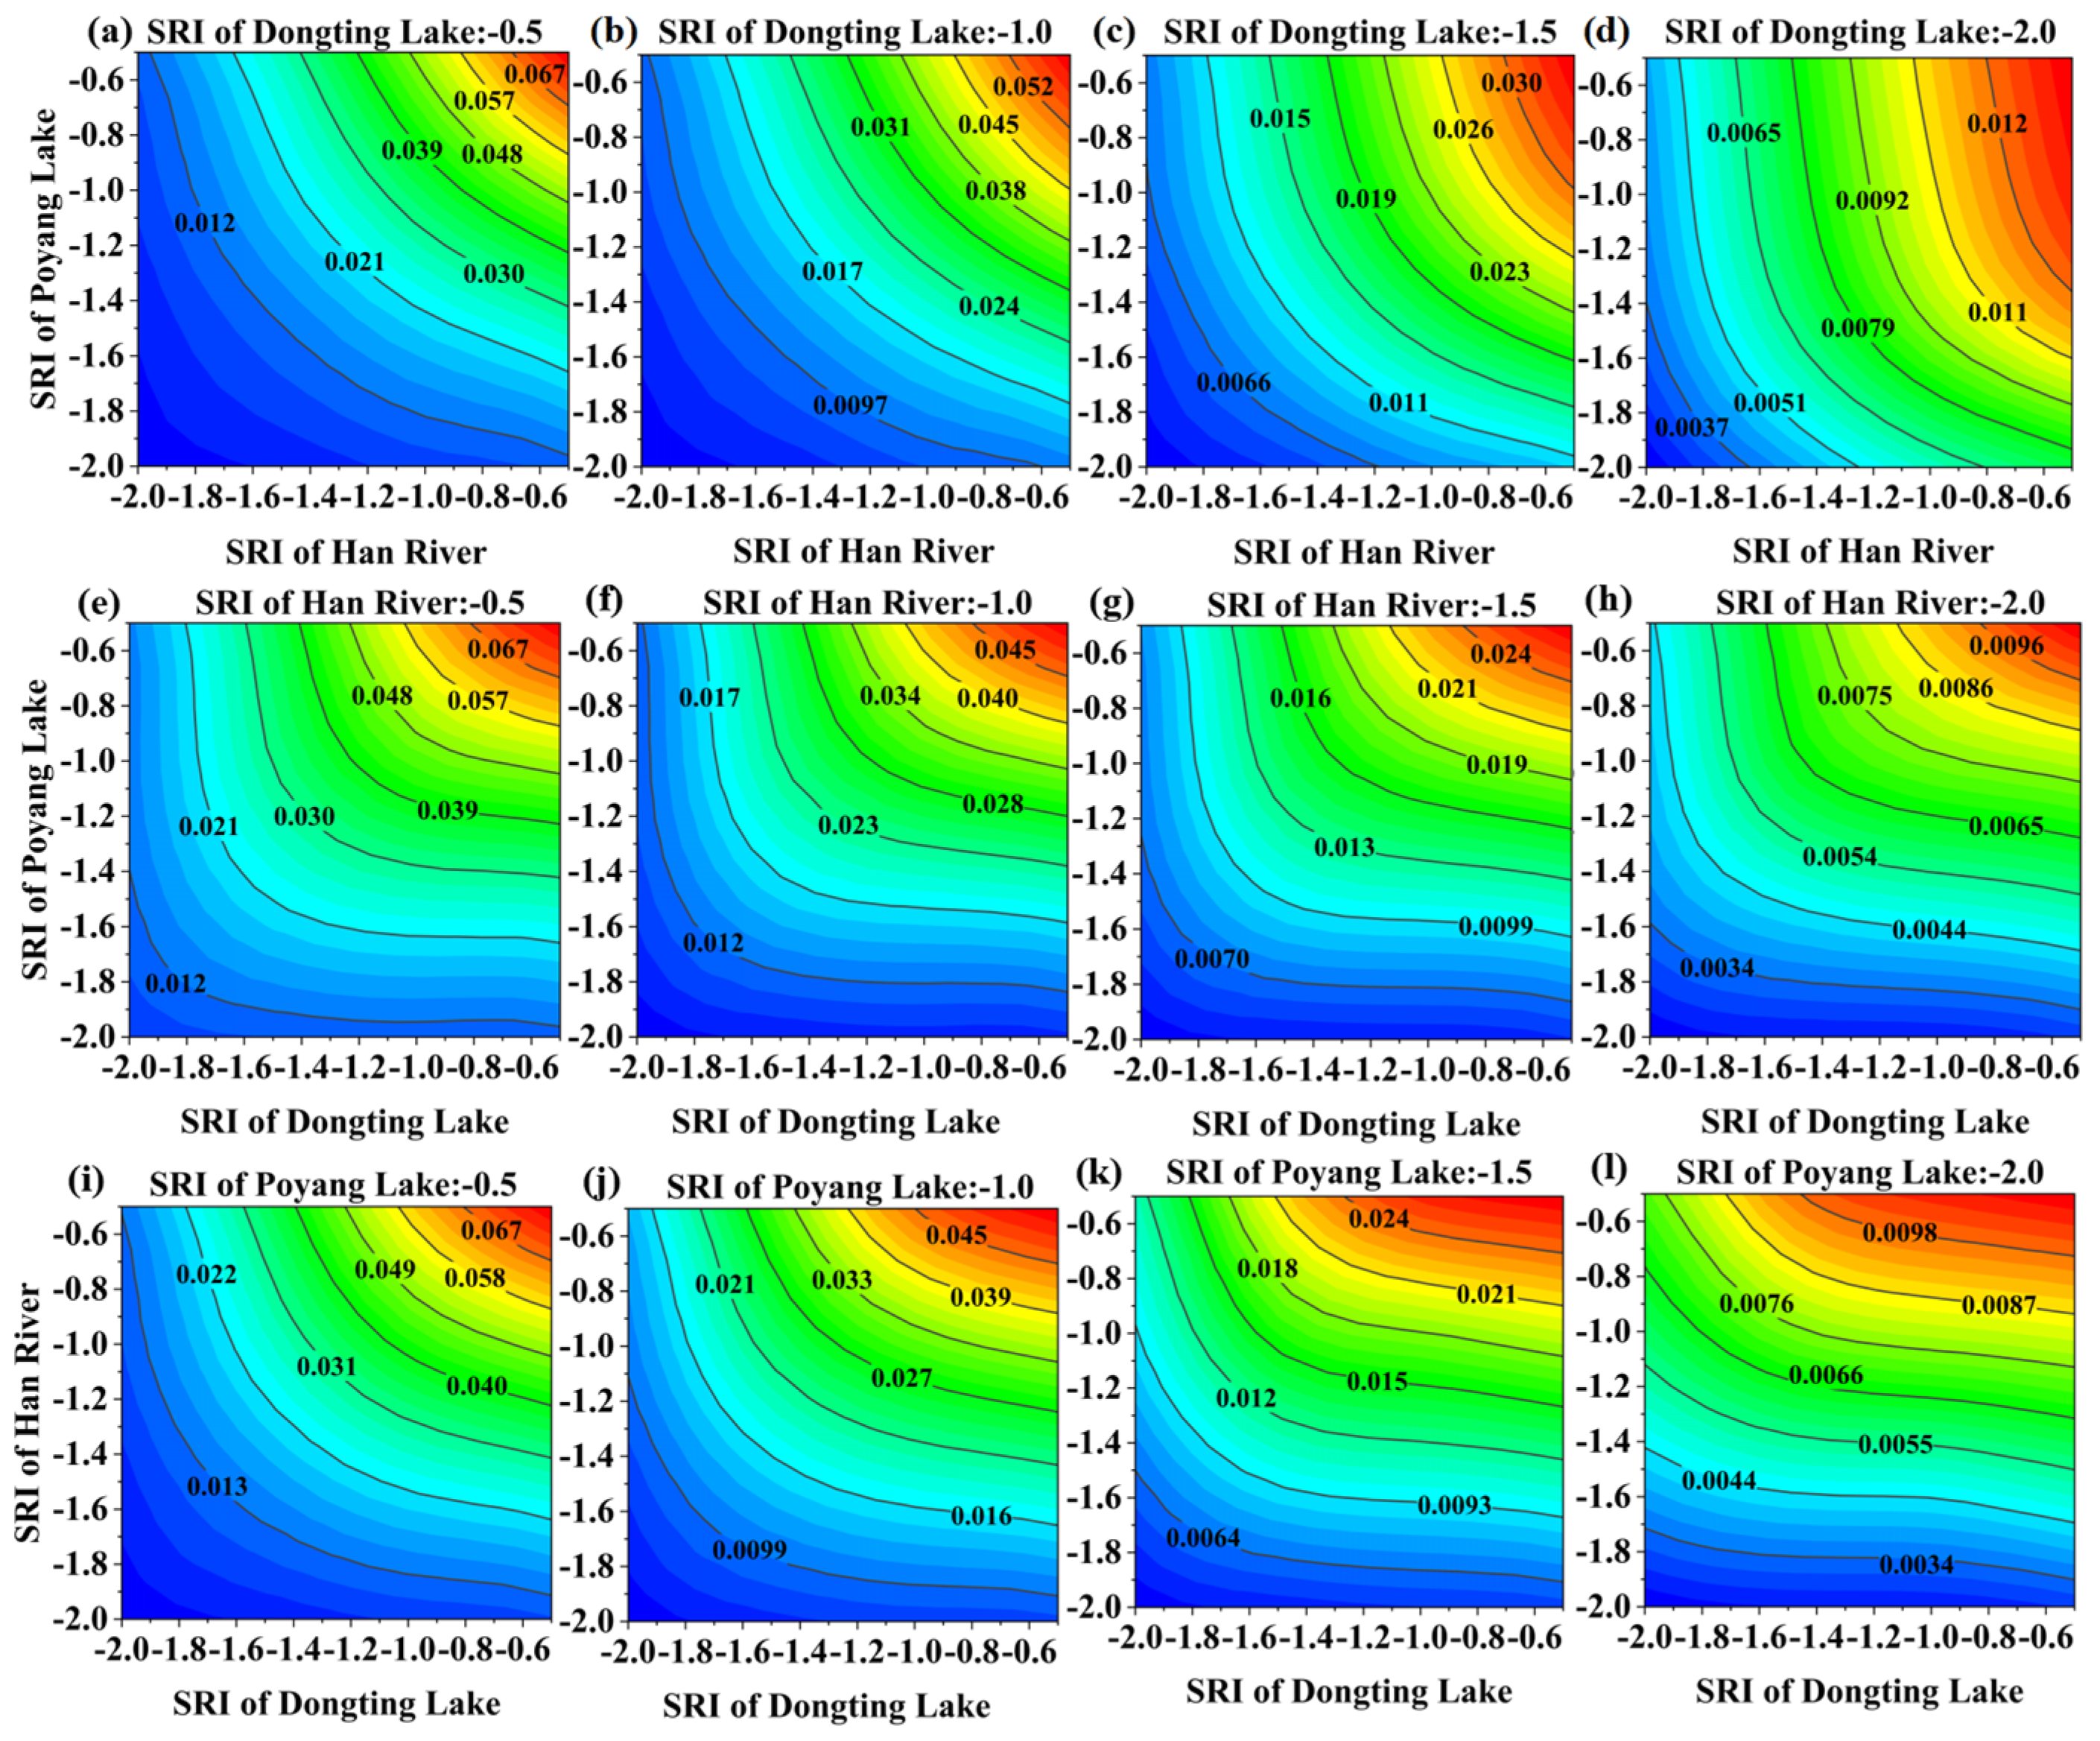
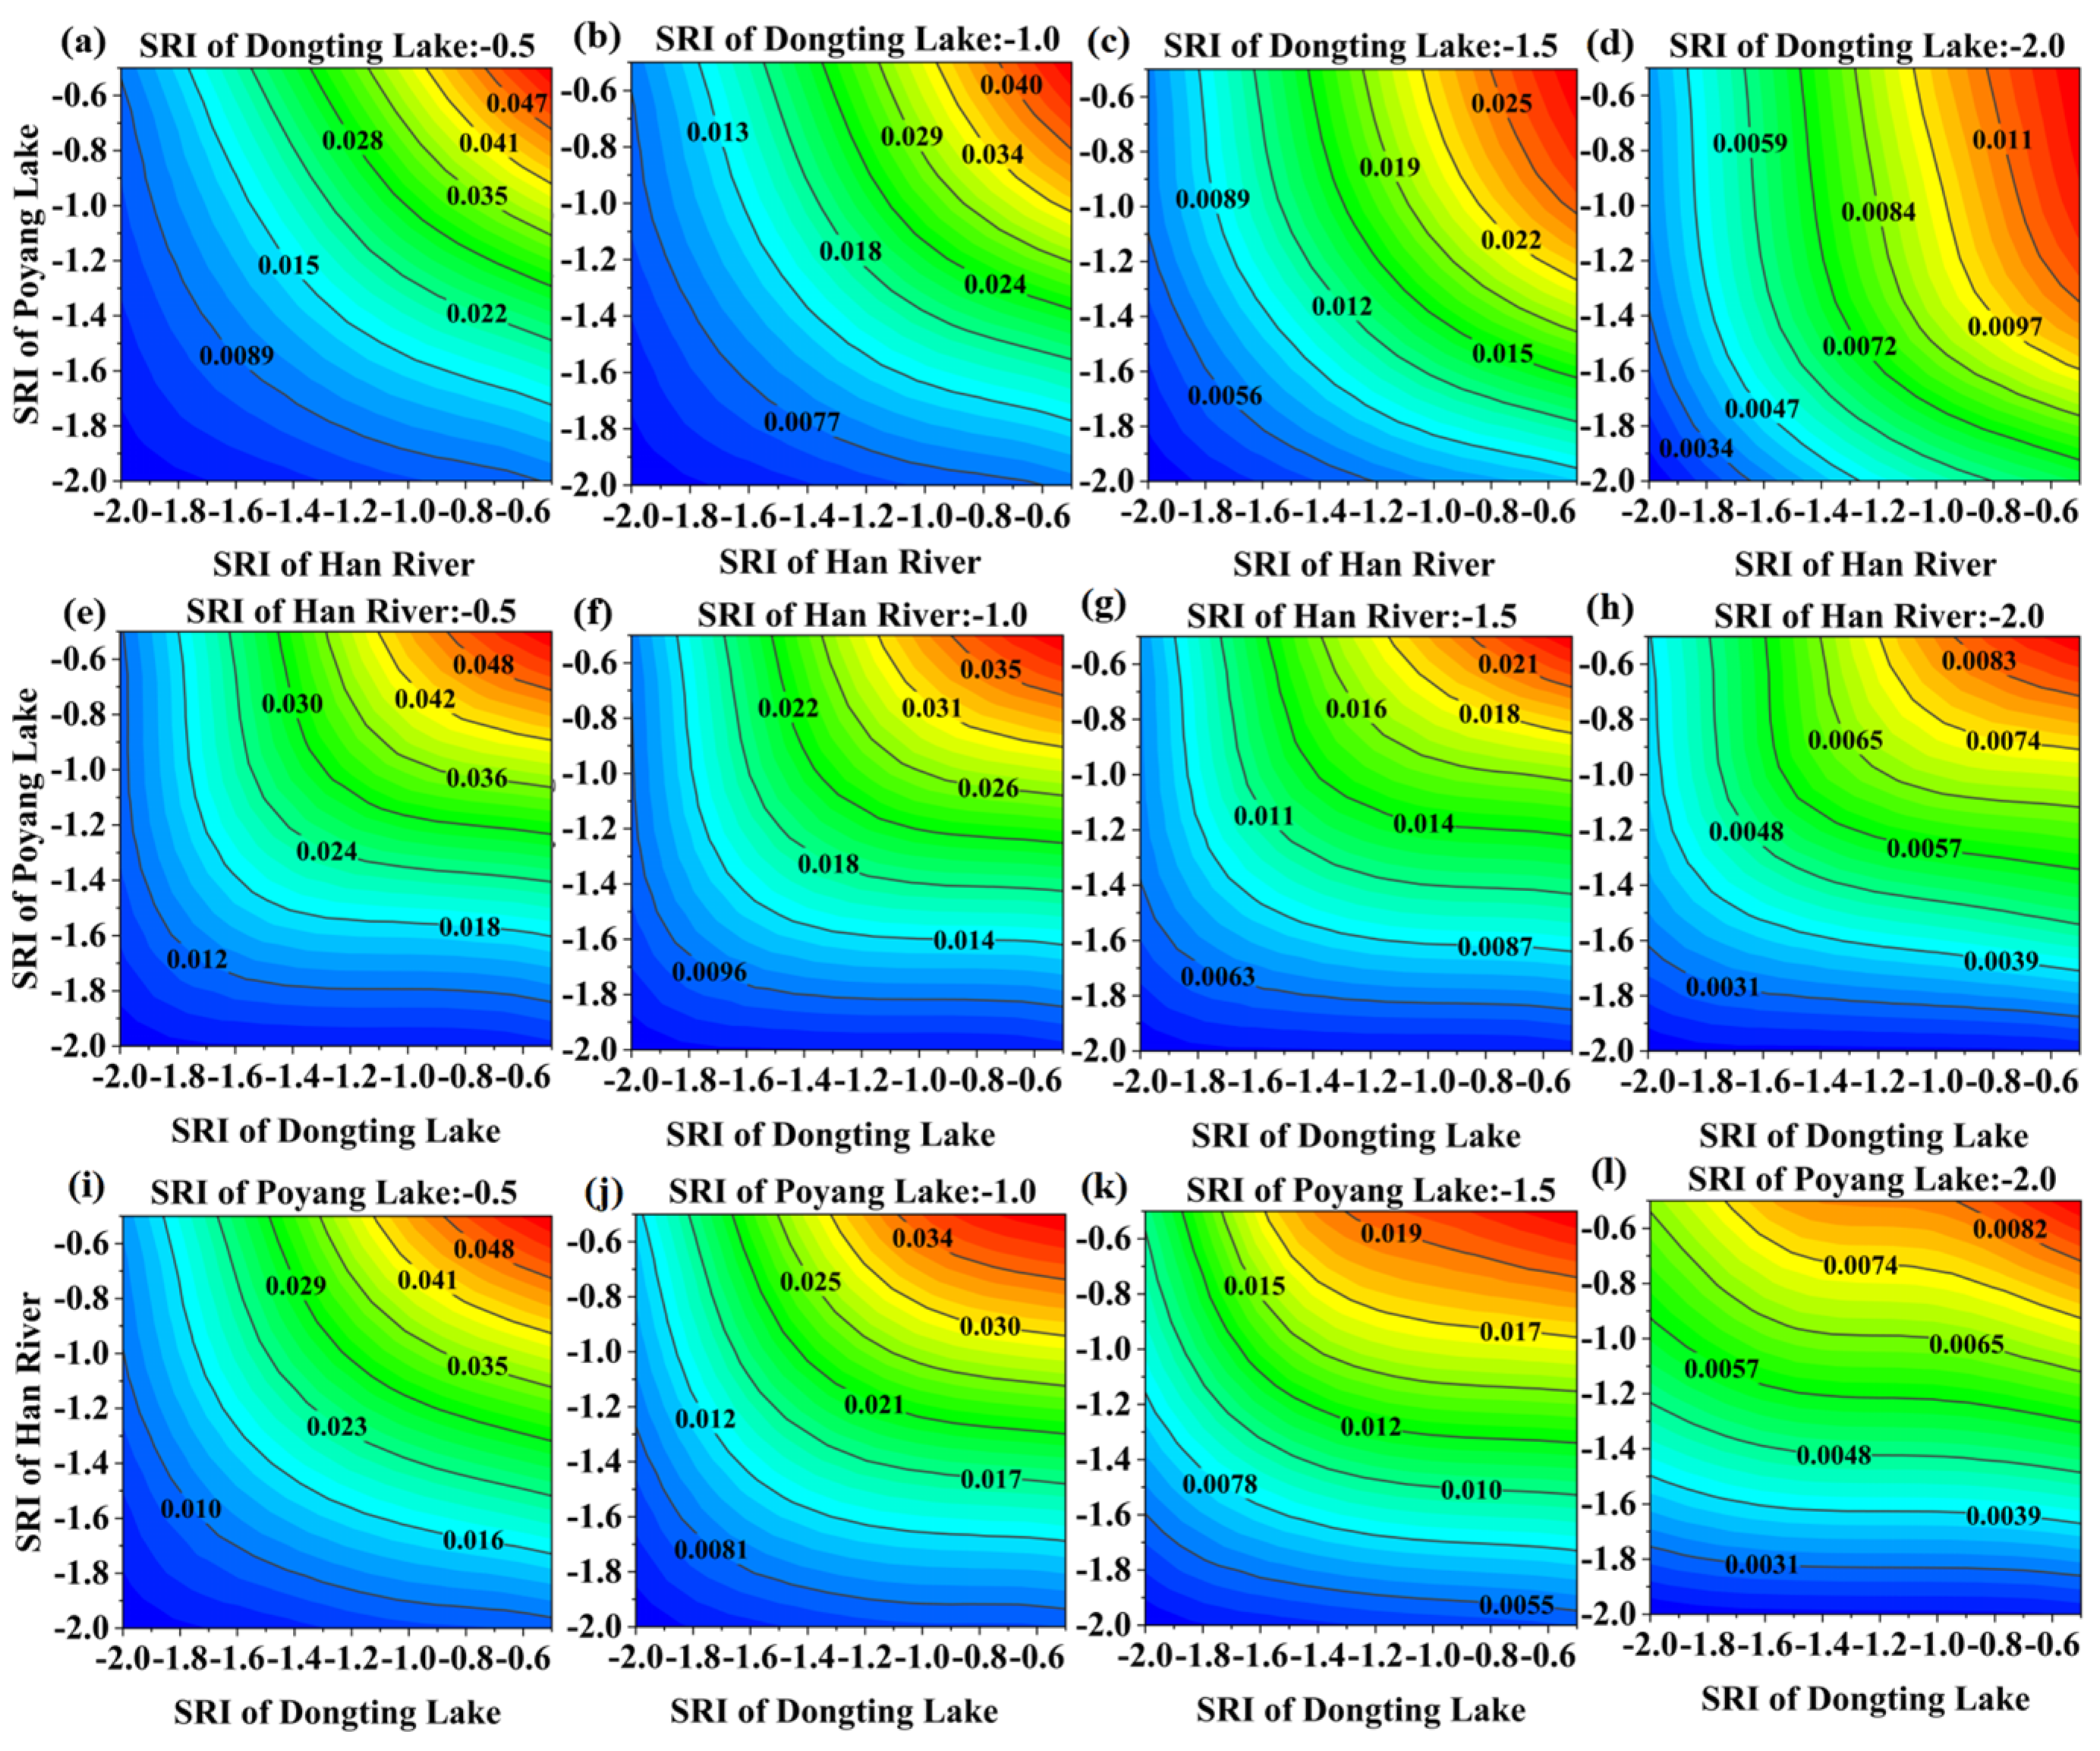
4.2. Jointly Distributed Probabilities

In this study, a four-dimensional joint distribution probability model of the hydrological drought sequences in four basins, namely, the upper YRB, Dongting Lake, Han River, and Poyang Lake, were established. In order to analyze different scenarios in depth, using the established encounter probability distribution model of drought hazards in the YRB, this study designed and calculated different encounter scenarios of four hydrological drought hazards in the four basins. Table 2 shows the specific calculation results for particular scenarios, i.e., four drought hazard encounter scenarios of the same level in the four basins. Figure 6 systematically revealed the spatial pattern of multi-source hydrological drought encounter risk in the Dongting Lake–Yichang–Hanjiang–Poyang Lake composite system in the YRB. The four subfigures (a–d) corresponded to the risk probability distributions of the hydrological drought combinations with the hydrological droughts of Poyang Lake, Han River, and Dongting Lake basins under the different conditions of hydrological droughts at Yichang Station (SRI ≤ −0.5, −1.0, −1.5, and −2.0), respectively. The variable p represents the probability of the encounters, i.e., the risk, and the gradient of the risk color scale from dark red (high-risk) to dark blue (low-risk), and presents the gradient of the probability of the occurrence of the composite drought events visually. The variable P represents the probability of encounter, i.e., risk. The left and right vertical axes of the subplots represent the standardized runoff indices of Dongting Lake, Hanjiang River, and Poyang Lake, respectively. According to the results in Table 2 and Figure 6, the more extreme the single-hazard scenario is, the lower the probability of a compound disaster.
A comparison of the subplots (a–d) of Figure 7 revealed that the probability of the occurrence of multi-basin composite droughts showed a significant attenuation trend as the drought extremes at Yichang station increased. For example, when the SRIs of Dongting Lake, Hanjiang River, and Poyang Lake ≤ −2.0 and the SRI of Yichang ≤ −0.5, the probability of encountering drought was 0.2312%; while, when the drought SRI of Yichang itself ≤ −2.0, the risk of experiencing drought plummeted to 0.1565%. This decay pattern was also evident in the subplots: in subplot (a) for Yichang SRI ≤ −0.5, for example, when the three basins were elevated from SRI ≤ −0.5 to SRI ≤ −2.0, the risk of encounter dropped sharply from 7.5549% to 0.2312%, a decrease of 97%. This phenomenon revealed the nonlinear characteristics of the probability of hydrological drought encounters, which is closely related to the hydrological compensation effect among basins.
In order to show the detailed change characteristics of the encounter probability, this study cut the four box plots in Figure 7 along the X-axis, Y-axis, and Z-axis to obtain inaccessible profiles showing the detailed change characteristics of the probabilities under different encounter scenarios. Among them, Figure 8, Figure 9, Figure 10 and Figure 11 show the profiles of the plots (a–d) in Figure 6, which represent the distribution contours of each stream under different hydrological drought combination levels for SRI ≤ −0.5, SRI ≤ −1.0, SRI ≤ −1.5, and SRI ≤ −2.0 in the upper YRB and the three major basins in the lower YRB, respectively. The red area in the figure represents the high probability area, and the more the color tended to be red, the higher the probability was. However, the changes in different basins were not the same.
Figure 8 reveals the spatial distribution characteristics of the hydrological drought probability in the three major basins in the YRB through three-dimensional profile cuts. The first row shows that the red high probability area in the Poyang Lake basin (Y-axis direction) dominated from SRI ≤ −1.0 to SRI ≤ −2.0, and its spatial distribution had not shrunk significantly, indicating that the basin still maintained a high probability of drought under extreme drought conditions. In contrast, the area of high probability region in the Han River basin (X-axis direction) shrunk significantly with the intensification of drought level, especially at SPI ≤ −2.0, which confirmed that the drought vulnerability of the basin was relatively low [39].
The second row of the Han River basin profile analysis shows that the Dongting Lake basin (X-axis direction) maintained a wide range of red high-probability zones under different drought levels. Its probability contour remained intact at SPI ≤ −2.0, whereas the high probability zones of the Poyang Lake basin (Y-axis direction) showed significant fragmentation under the same conditions. This comparison confirmed that the hydrological response of the Dongting Lake basin was more sensitive under extreme drought conditions, and its drought persistence risk was significantly higher than that of the Poyang Lake Basin [40].
The Poyang Lake basin profile in the third row further verified the regional heterogeneity: from SRI ≤ −1.0 to SRI ≤ −2.0, the probability contour of the Dongting Lake basin (X-axis direction) only underwent a morphological change with a magnitude of less than 10%, whereas the Han River basin (Y-axis direction) had already experienced a complete disappearance of the probability core area at SRI ≤ −2.0. Comprehensive three-dimensional visualization analysis showed that the probability of an occurrence of hydrological drought in the three major basins showed significant spatial heterogeneity, and its risk ranking was as follows: Dongting Lake Basin (the highest) > Poyang Lake Basin > Han River Basin (the lowest).
Notably, the contour probability maps in Figure 8, Figure 9, Figure 10 and Figure 11 revealed a significant longitudinal decay pattern. This spatial response characteristic suggested that the upstream drought stress would have a gradient transfer effect to the midstream area through the hydrological connection of the basin. Still, the different basins showed differentiated buffering capacity due to the differences in their hydrogeological conditions [41]. Among them, the Dongting Lake Basin showed stronger drought-sustaining characteristics due to the special structure of hydrological connectivity.
In this study, we constructed a multi-source drought co-occurrence risk model for the Yangtze River Delta region. By quantifying the probability distribution of the hydrological drought combinations under different conditions, this research provides the first detailed characterization of drought co-occurrence risks at critical nodes within the Yangtze River Basin, offering a scalable methodological framework for multi-source hydrological drought risk analysis in large river basins.
Currently, there is a gap in research on the risk of hydrological droughts in different sub-basins within the same large basin. However, the vine copula method has been applied more in the field of drought. For example, H. Wang [42] used vine copula to quantify the risk of propagation from meteorological drought (MD) and agricultural drought (AD) to hydrological drought (HD) in the Aral Sea Basin. At the same time, Guizeng Qi et al. [43] investigated the impacts of extreme composite droughts (the superposition of soil drought and meteorological droughts) on vegetation productivity in China. Both studies focused on the composite nature of different drought types, but neither quantified drought co-occurrence in the spatial dimension. Similarly, Luo et al. [17] applied a vine copula to calculate the co-occurrence characteristics of meteorological drought indices in different watersheds; however, their drought indices were based solely on the regional precipitation factor, which failed to reflect the regional composite meteorological drought characteristics adequately. Wang Lichuan et al. [44] quantified the co-occurrence risk of drought among large basins using a vine copula, which provided a basis for inter-basin water transfer projects. However, the study did not sufficiently consider the heterogeneity of different basins within the large basins. Xiangyang Zhang et al. [45] evaluated the hydrological drought risk using a four-dimensional copula function model. However, the focus of their study was to analyze the characteristics of hydrological drought itself (including the duration of drought) and the drought index of different basins. They evaluated drought itself (including the four dimensions of duration, severity, development speed, and recovery speed) rather than the spatial co-occurrence problem.
In contrast, the compound drought risk calculation model proposed in this study explicitly quantified the co-occurrence risk of hydrological droughts among different tributaries within a large river basin. It calculated the probabilities of the different grades of hydrological drought occurring in each tributary of the Yangtze River Basin, thereby providing critical guidance for decision-making on emergency drought-response water transfers by hydraulic hubs within the basin.

5. Conclusions

Given the frequent occurrence of droughts in the Yangtze River Basin and the relative lack of research on the risk probability of encountering hydrological droughts in its various tributaries, this study constructed a probability distribution model for the simultaneous occurrence of multiple hydrological droughts in the basin using the vine copula method. The optimal probability distribution model for each tributary was determined through various goodness-of-fit tests. In addition, the joint cumulative probability calculation method for the simultaneous occurrence of hydrological drought disasters in four basins—namely, the upper and middle reaches of the Yangtze River, Dongting Lake, Han River, and Poyang Lake—was elaborated in detail, along with an analysis of examples. The conclusions are as follows:
(1) The distribution characteristics of the hydrological drought indicator (SRI) series in the tributaries of the Yangtze River Basin exhibited significant differences. Statistical analysis revealed that the SRI series in the upper and middle reaches of the Yangtze River and the Han River basin exhibited more consistent characteristics with those of a Gaussian normal distribution. In contrast, the SRI series in the Poyang Lake basin and Dongting Lake basin tended to follow the kernel distribution. The results based on the constructed probabilistic model further revealed that the joint and marginal probabilities of hydrological drought disasters in Poyang Lake and Dongting Lake Basin were significantly higher than those in the Hanjiang River Basin. The primary reason for the formation of this risk distribution pattern is that Poyang Lake and Dongting Lake, being large riverside lakes, have a substantial water area. The large water bodies significantly increase the regional sensitivity to climatic factors such as rising temperatures and increased evaporation. Under meteorological drought conditions, strong thermal evaporation leads to accelerated runoff loss in the lake basin area and the surrounding catchment area, disrupting the balance between water resource replenishment and depletion and thereby significantly increasing the likelihood and severity of drought events.
(2) In this study, based on the constructed optimal probability model and related mathematical expressions, the joint cumulative probability of the composite hazard combinations under different hydrological drought encounter scenarios was quantitatively calculated for the key areas of the Yangtze River Basin (upper and middle reaches of the Yangtze River, Dongting Lake, Hanjiang River, and Poyang Lake). The results showed that the probability of the four basins experiencing a region-wide hydrological drought at the same time decreased significantly with the increase in drought severity: specifically, the joint probability of all basins experiencing a mild drought (SRI ≤ −1.0) to all basins experiencing an extreme drought (SRI ≤ −2.0) decreased sharply from 7.55% to 0.16%. This trend suggested that as drought scenarios become more extreme (i.e., progressing from mild drought to extreme drought), the likelihood of the four basins experiencing a severe hydrological drought disaster in synchrony decreases significantly.
(3) This study focused on hydrological drought hazard analysis, and the constructed joint probability distribution model of hydrological droughts in the Yangtze River Basin can be further extended to the study of hydrological drought hazards in other potential composite events or regions. The research results provide a scientific basis for predicting the risk of various hydrological drought combinations in the Yangtze River Delta region. This paper focused on the risk of encountering different levels of hydrological droughts in the tributaries of the Yangtze River Basin. However, the specific impacts of drought encounters on the mainstem of the Yangtze River are still unclear and need to be explored urgently. Therefore, a follow-up study can provide a comprehensive analysis of the impacts on the hydrological situation and water resources system of the main stem of the Yangtze River after the tributaries experience different levels of hydrological droughts. Research in this direction will provide more critical support for the drought emergency response and drought water transfer decision-making of the basin’s hydraulic hubs.

Author Contributions

Conceptualization, H.W.; methodology, J.L.; software, J.L.; formal analysis, J.L.; writing—original draft preparation, J.L.; writing—review and editing, J.L. and H.W.; visualization, H.W.; funding acquisition, H.W. All authors have read and agreed to the published version of the manuscript.

Funding

The research is financially supported by the National Key R&D Program of China (2021YFC3000200).

Data Availability Statement

The original contributions presented in this study are included in the article. Further inquiries can be directed to the corresponding author.

Acknowledgments

We would like to thank Yunzhong Jaing for data curation and Ding Wei for helpful discussions regarding this project.

Conflicts of Interest

The authors declare no conflicts of interest.

References

  1. Stott, P. How climate change affects extreme weather events. Science 2016, 352, 1517–1518. [Google Scholar] [CrossRef]
  2. Zscheischler, J.; Westra, S.; van den Hurk, B.J.J.M.; Seneviratne, S.I.; Ward, P.J.; Pitman, A.; AghaKouchak, A.; Bresch, D.N.; Leonard, M.; Wahl, T.; et al. Future climate risk from compound events. Nat. Clim. Change 2018, 8, 469–477. [Google Scholar] [CrossRef]
  3. Zscheischler, J.; Seneviratne, S.I. Dependence of drivers affects risks associated with compound events. Sci. Adv. 2017, 3, e1700263. [Google Scholar] [CrossRef]
  4. Meza, I.; Siebert, S.; Döll, P.; Kusche, J.; Herbert, C.; Eyshi Rezaei, E.; Nouri, H.; Gerdener, H.; Popat, E.; Frischen, J.; et al. Global-scale drought risk assessment for agricultural systems. Nat. Hazard. Earth Syst. 2020, 20, 695–712. [Google Scholar] [CrossRef]
  5. Vicente-Serrano, S.M.; Quiring, S.M.; Peña-Gallardo, M.; Yuan, S.; Domínguez-Castro, F. A review of environmental droughts: Increased risk under global warming? Earth-Sci. Rev. 2020, 201, 102953. [Google Scholar] [CrossRef]
  6. Zeng, Z.; Wu, W.; Peñuelas, J.; Li, Y.; Jiao, W.; Li, Z.; Ren, X.; Wang, K.; Ge, Q. Increased risk of flash droughts with raised concurrent hot and dry extremes under global warming. Npj Clim. Atmos. Sci. 2023, 6, 134. [Google Scholar] [CrossRef]
  7. Zhou, Z.; Zhang, L.; Chen, J.; She, D.; Wang, G.; Zhang, Q.; Xia, J.; Zhang, Y. Projecting Global Drought Risk Under Various SSP-RCP Scenarios. Earth’s Future 2023, 11, e2022EF003420. [Google Scholar] [CrossRef]
  8. Zhang, X.; Hao, Z.; Singh, V.P.; Zhang, Y.; Feng, S.; Xu, Y.; Hao, F. Drought propagation under global warming: Characteristics, approaches, processes, and controlling factors. Sci. Total Environ. 2022, 838, 156021. [Google Scholar] [CrossRef]
  9. Xiang, K.; Song, W.; Lu, J.; Zhao, A.; Lu, Y.; Feng, T.; Liu, H.; Gui, R.; Chen, L. Investigating the drought propagation dynamics between meteorological and groundwater drought in the Yellow River Basin, China. J. Hydrol. 2025, 660, 133446. [Google Scholar] [CrossRef]
  10. Mei, L.; Aru, H.; Tong, S.; Wang, Y.; Guo, E.; Zhang, T.; Yin, S.; Bao, Y. Study on the propagation processes and driving mechanisms of meteorological, hydrological, and agricultural droughts on the Mongolian Plateau. J. Hydrol. 2025, 660, 133511. [Google Scholar] [CrossRef]
  11. Gao, Y.; Zhao, T.; Tu, T.; Tian, Y.; Zhang, Y.; Liu, Z.; Zheng, Y.; Chen, X.; Wang, H. Spatiotemporal links between meteorological and agricultural droughts impacted by tropical cyclones in China. Sci. Total Environ. 2024, 912, 169119. [Google Scholar] [CrossRef]
  12. Jiang, T.; Su, X.; Zhang, G.; Zhang, T.; Wu, H. Estimating propagation probability from meteorological to ecological droughts using a hybrid machine learning copula method. Hydrol. Earth Syst. Sci. 2023, 27, 559–576. [Google Scholar] [CrossRef]
  13. Ge, C.; Sun, P.; Yao, R.; Wang, Y.; Chen, W.; Bian, Y.; Zhang, Q. Characteristics of propagation from meteorological drought to ecological drought in China: Lag and cumulative effects. Atmos. Res. 2024, 304, 107405. [Google Scholar] [CrossRef]
  14. Li, L.; Peng, Q.; Wang, M.; Cao, Y.; Gu, X.; Cai, H. Quantitative analysis of vegetation drought propagation process and uncertainty in the Yellow River Basin. Agric. Water Manag. 2024, 295, 108775. [Google Scholar] [CrossRef]
  15. Haile, M.M.; Li, F.; Ai, Z.; Chen, G.; Leng, P. Spatiotemporal characteristics and driving factors of groundwater drought in Nile River Basin (NRB). Catena 2025, 257, 109194. [Google Scholar] [CrossRef]
  16. Guan, B.; Wang, Q.; Jiang, S.; Zhao, Y.; Li, H.; Chang, H.; Yang, W.; He, G.; Wang, Y. Analysis of the meteorological factors and atmospheric circulation factors over SPEI drought index in Haihe River Basin, China. Atmos. Res. 2025, 325, 108182. [Google Scholar] [CrossRef]
  17. Luo, Q.; Liu, X.; Wang, K.; Liu, C. Increasingly frequent co-occurrence of drought or pluvial in multiple tributaries of the Yangtze River basin. J. Hydrol. 2024, 633, 131035. [Google Scholar] [CrossRef]
  18. François, B.; Vrac, M. Time of emergence of compound events: Contribution of univariate and dependence properties. Nat. Hazards Earth Syst. Sci. 2023, 23, 21–44. [Google Scholar] [CrossRef]
  19. Dong, S.; Jiao, C.; Tao, S. Joint return probability analysis of wind speed and rainfall intensity in typhoon-affected sea area. Nat. Hazards 2017, 86, 1193–1205. [Google Scholar] [CrossRef]
  20. Yin, C.; Wang, J.; Yu, X.; Li, Y.; Yan, D.; Jian, S. Definition of Extreme Rainfall Events and Design of Rainfall Based on the Copula Function. Water Resour. Manag. 2022, 36, 3759–3778. [Google Scholar] [CrossRef]
  21. Wang, Y.; Li, C.; Liu, J.; Yu, F.; Qiu, Q.; Tian, J.; Zhang, M. Multivariate Analysis of Joint Probability of Different Rainfall Frequencies Based on Copulas. Water 2017, 9, 198. [Google Scholar] [CrossRef]
  22. Tosunoğlu, F.; Onof, C. Joint modelling of drought characteristics derived from historical and synthetic rainfalls: Application of Generalized Linear Models and Copulas. J. Hydrol. Reg. Stud. 2017, 14, 167–181. [Google Scholar] [CrossRef]
  23. Brunner, M.I.; Furrer, R.; Favre, A. Modeling the spatial dependence of floods using the Fisher copula. Hydrol. Earth Syst. Sci. 2019, 23, 107–124. [Google Scholar] [CrossRef]
  24. Bedford, T.; Cooke, R.M. Probability Density Decomposition for Conditionally Dependent Random Variables Modeled by Vines. Ann. Math. Artif. Intell. 2001, 32, 245–268. [Google Scholar] [CrossRef]
  25. Ma, F.; Yuan, X. When Will the Unprecedented 2022 Summer Heat Waves in Yangtze River Basin Become Normal in a Warming Climate? Geophys. Res. Lett. 2023, 50, e2022GL101946. [Google Scholar] [CrossRef]
  26. Li, P.; Yu, Z.; Jiang, P.; Wu, C. Spatiotemporal characteristics of regional extreme precipitation in Yangtze River basin. J. Hydrol. 2021, 603, 126910. [Google Scholar] [CrossRef]
  27. Yang, P.; Zhang, S.; Xia, J.; Zhan, C.; Cai, W.; Wang, W.; Luo, X.; Chen, N.; Li, J. Analysis of drought and flood alternation and its driving factors in the Yangtze River Basin under climate change. Atmos. Res. 2022, 270, 106087. [Google Scholar] [CrossRef]
  28. Shukla, S.; Wood, A.W. Use of a standardized runoff index for characterizing hydrologic drought. Geophys. Res. Lett. 2008, 35, L02405. [Google Scholar] [CrossRef]
  29. Yao, N.; Zhao, H.; Li, Y.; Biswas, A.; Feng, H.; Liu, F.; Pulatov, B. National-Scale Variation and Propagation Characteristics of Meteorological, Agricultural, and Hydrological Droughts in China. Remote Sens. 2020, 12, 3407. [Google Scholar] [CrossRef]
  30. Zhou, Z.; Shi, H.; Fu, Q.; Ding, Y.; Li, T.; Liu, S. Investigating the Propagation From Meteorological to Hydrological Drought by Introducing the Nonlinear Dependence With Directed Information Transfer Index. Water Resour. Res. 2021, 57, e2021WR030028. [Google Scholar] [CrossRef]
  31. Li, R.; Chen, N.; Zhang, X.; Zeng, L.; Wang, X.; Tang, S.; Li, D.; Niyogi, D. Quantitative analysis of agricultural drought propagation process in the Yangtze River Basin by using cross wavelet analysis and spatial autocorrelation. Agric. For. Meteorol. 2020, 280, 107809. [Google Scholar] [CrossRef]
  32. Yu, J.; Zou, L.; Xia, J.; Dou, M.; Liu, H.; Zuo, L. Future changes in hydrological drought across the Yangtze River Basin: Identification, spatial–temporal characteristics, and concurrent probability. J. Hydrol. 2023, 625, 130057. [Google Scholar] [CrossRef]
  33. Joe, H. Families of m-Variate Distributions with Given Margins and m(m-1)/2 Bivariate Dependence Parameters. In Distributions with Fixed Marginals and Related Topics; Lecture Notes-Monograph Series; Institute of Mathematical Statistics: Beachwood, OH, USA, 1996; Volume 28, pp. 120–141. Available online: https://www.jstor.org/stable/4355888 (accessed on 13 March 2024).
  34. Ni, L.; Wang, D.; Wu, J.; Wang, Y.; Tao, Y.; Zhang, J.; Liu, J.; Xie, F. Vine copula selection using mutual information for hydrological dependence modeling. Environ. Res. 2020, 186, 109604. [Google Scholar] [CrossRef]
  35. Aas, K.; Czado, C.; Frigessi, A.; Bakken, H. Pair-copula constructions of multiple dependence. Insur. Math. Econ. 2009, 44, 182–198. [Google Scholar] [CrossRef]
  36. Zhu, K.; Kurowicka, D.; Nane, G.F. Common sampling orders of regular vines with application to model selection. Comput. Stat. Data Anal. 2020, 142, 106811. [Google Scholar] [CrossRef]
  37. Huang, Z.; Chen, X.; Pan, Z.; Gao, R.; Men, J.; Bi, P.; Huang, N.; Zhang, F.; Yang, R. Increasingly frequent and severe dry-to-wet abrupt alteration events are striking the Yangtze River Basin in China. Atmos. Res. 2025, 315, 107926. [Google Scholar] [CrossRef]
  38. Sun, Y.; Zhang, Q.; Song, W.; Tang, S.; Singh, V.P. Hydrological responses of three gorges reservoir region (China) to climate and land use and land cover changes. Nat. Hazards 2025, 121, 1505–1530. [Google Scholar] [CrossRef]
  39. Xing, L.; Zhao, R.; Sun, H.; Li, M.; Tan, Z. Analysis of drought characteristics and comparison of historical typical years with 2022 drought in the Yangtze River Basin. Nat. Hazards 2024, 120, 3699–3718. [Google Scholar] [CrossRef]
  40. Huang, S.; Zhang, X.; Chen, N.; Li, B.; Ma, H.; Xu, L.; Li, R.; Niyogi, D. Drought propagation modification after the construction of the Three Gorges Dam in the Yangtze River Basin. J. Hydrol. 2021, 603, 127138. [Google Scholar] [CrossRef]
  41. Xu, G.; Wu, Y.; Liu, S.; Cheng, S.; Zhang, Y.; Pan, Y.; Wang, L.; Dokuchits, E.Y.; Nkwazema, O.C. How 2022 extreme drought influences the spatiotemporal variations of terrestrial water storage in the Yangtze River Catchment: Insights from GRACE-based drought severity index and in-situ measurements. J. Hydrol. 2023, 626, 130245. [Google Scholar] [CrossRef]
  42. Wang, H.; Li, Y.P.; Huang, G.H.; Zhang, Q.; Ma, Y.; Li, Y.F. Quantifying Multidimensional Drought Propagation Risks under Climate Change: A Vine-Copula Bayesian Factorial Analysis Method. J. Hydrol. 2024, 637, 131396. [Google Scholar] [CrossRef]
  43. Qi, G.; Song, J.; Chen, S.; Gong, Y.; Bai, H.; She, D.; Xia, J.; Fu, Y.H. Increasing impacts of compound extreme droughts on vegetation. J. Hydrol. 2025, 660, 133447. [Google Scholar] [CrossRef]
  44. Wang, L.; He, F.; Zhao, Y.; Wang, J.; Lu, P.; Jia, Y.; Liu, K.; Deng, H.; Cui, H. Inter-basin Water Transfer Will Face Greater Drought Risk in the Future. J. Environ. Manag. 2025, 385, 125649. [Google Scholar] [CrossRef] [PubMed]
  45. Zhang, X.; Wu, Z.; Wang, H.; Yu, Z.; Chen, Y. A hydrological drought risk assessment method based on a four-dimensional Copula function model integrating development andrecovery speed characteristics. Ecol. Indic. 2025, 177, 113751. [Google Scholar] [CrossRef]
Figure 1. Research framework.
Water 17 01986 g001
Figure 2. Overview of the study area (YC for Yichang Station, CLJ for Chenglingji Station, HZ for Huangzhuang Station, HK for Hukou Station).
Water 17 01986 g002
Figure 3. Schematic diagram of the R-vine structure.
Water 17 01986 g003
Figure 4. Plots of the fitting results. (a) Dongting Lake, (b) Han River, (c) Poyang Lake, (d) Yichang.
Water 17 01986 g004
Figure 5. Violin–beeswarm plot of the SRI sequences in different regions of the Yangtze River Basin.
Water 17 01986 g005
Figure 6. Cumulative probability probabilities of the SRI series in tributaries of the Yangtze River Basin. (a) Dongting Lake Basin, (b) Han River Basin, (c) Poyang Lake Basin and (d) Yichang.
Water 17 01986 g006
Figure 7. Four-dimensional joint distribution probability of hydrologic drought in four watersheds.
Water 17 01986 g007
Figure 8. Contour plots of the probability of encountering droughts with an SRI ≤ −0.5 in the YC and other classes in the two lakes and Han River basins.
Water 17 01986 g008
Figure 9. Contour plots of the probability of encountering droughts with an SRI ≤ −1.0 in the YC and other classes in the two lakes and Han River basins.
Water 17 01986 g009
Figure 10. Contour plots of the probability of encountering droughts with an SRI ≤ −1.5 in the YC and other classes in the two lakes and Han River basins.
Water 17 01986 g010
Figure 11. Contour plots of the probability of encountering droughts with an SRI ≤ −2.0 in the YC and other classes in the two lakes and Han River basins.
Water 17 01986 g011
Table 1. Copula function selection and parameter estimation for each side of the arid cascade tree model of Dongting Lake–Yichang–Hanjiang–Poyang Lake.
Tree LevelVariableOptimal Copula Model
Types of CopulaParameter Estimates
First level treeDongting Lake, YichangStudent’s t[0.82, 5.49]
Han River, YichangStudent’s t[0.59, 7.93]
Poyang Lake, Dongting LakeGumbel1.36
Second level treePoyang Lake, Yichang; Dongting LakeJoe1.06
Han River, Dongting Lake; YichangFrank−0.64
Third level treePoyang Lake, Han River; Dongting Lake, YichangGaussian−0.10
Table 2. Joint cumulative probability of multi-bump drought disaster in the YRB under four scenarios.
ScenariosYichangDongting LakeHan RiverPoyang LakeJoint Cumulative Probability
1SRI ≤ −2.0SRI ≤ −2.0SRI ≤ −2.0SRI ≤ −2.00.16%
2SRI ≤ −1.5SRI ≤ −1.5SRI ≤ −1.5SRI ≤ −1.50.71%
3SRI ≤ −1.0SRI ≤ −1.0SRI ≤ −1.0SRI ≤ −1.02.63%
4SRI ≤ −0.5SRI ≤ −0.5SRI ≤ −0.5SRI ≤ −0.57.55%
Disclaimer/Publisher’s Note: The statements, opinions and data contained in all publications are solely those of the individual author(s) and contributor(s) and not of MDPI and/or the editor(s). MDPI and/or the editor(s) disclaim responsibility for any injury to people or property resulting from any ideas, methods, instructions or products referred to in the content.

