Article

A Quantitative Assessment of the Impacts of Land Use and Natural Factors on Water Quality in the Red River Basin, China

1
School of Earth Sciences, International Joint Research Center for Karstology, Yunnan Institute of Geography, Yunnan University, Kunming 650500, China
2
Institute of International Rivers and Eco-Security, Yunnan University, Kunming 650500, China
*
Author to whom correspondence should be addressed.
Water 2025, 17(13), 1968; https://doi.org/10.3390/w17131968
Submission received: 2 April 2025 / Revised: 25 April 2025 / Accepted: 27 April 2025 / Published: 30 June 2025

Abstract

The quality of water in the Red River is a complex interplay between human-induced changes and inherent natural variables. This research utilized the snapshot sampling approach, garnering water quality data from 45 sampling sites in the Red River and crafting 24 environmental indicators related to land use and inherent natural determinants at the catchment scale. Through Spearman rank correlation and redundancy analyses, relationships among land use, natural variables, and water quality were elucidated. Our variance partitioning revealed differentiated impacts of land use and natural factors on water quality. Pivotal findings indicated superior water quality in the Red River, driven mainly by land use dynamics, which showed a distinct geomorphic gradient. Specific land use attributes, like cropland patch density, grassland’s largest patch index, and urban metrics, were pivotal in explaining variations in parameters such as total nitrogen, ammonia, and temperature. Notably, the configuration of land use had a more profound influence on water quality than merely its components. In terms of natural influences, while topography played a dominant role in shaping water quality, other factors like soil and weather had marginal impacts. Elevation was notably linked with metrics like total phosphorus and suspended solids, whereas precipitation and slope significantly determined electrical conductivity and chlorophyll-a models. In sum, incorporating both land use configurations and natural determinants offers a more comprehensive understanding of water quality disparities in the Red River’s ecosystem. For holistic water quality management, the focus should not only be on the major contributors like croplands and urban areas but also on underemphasized areas like grasslands. Tweaking cropland distribution, recognizing the intertwined nature of land use and natural elements, and tailoring land management based on topographical variations are essential strategies moving forward.

1. Introduction

The water quality of rivers is influenced by both human activities and natural factors [1,2,3,4]. The primary impact of human activities on the natural environment relates to land use [5]. Numerous studies have shown that the composition and landscape configuration characteristics of land use significantly influence water quality [6,7,8]. Generally, the characteristics of land use components determine the pollutant load discharged into the water body from the watershed, whereas the configuration traits of land use influence the transport mechanisms and hydrology of these pollutants [9,10,11,12,13,14]. Furthermore, the composition and spatial configuration of watershed land use simultaneously affect water quality [8]. Therefore, investigating both aspects is crucial to identify the primary factors that impact water quality.
Natural factors have an indispensable effect on aquatic ecosystems [15,16,17,18]. For example, topography significantly affects subsurface soil erosion [18], while precipitation is a driving force behind the hydrological processes in watersheds and is a key factor in soil erosion [1]. Soil type, particularly its permeability and erosion resistance, is pivotal in determining rates of surface runoff and soil erosion [19]. Consequently, these natural elements are integral to soil erosion and hydrological models, such as the Universal Soil Loss Equation, which calculates soil loss by considering factors like rainfall erosivity, soil erodibility, slope length, vegetation cover, and conservation practices [20]. Similarly, the Soil Conservation Service (SCS) model [21], developed by the Soil Conservation Service of the United States Department of Agriculture (USDA) in 1985, accounts for rainfall and surface characteristics, including land use, slope, soil hydrological conditions, antecedent moisture condition, and vegetation type to estimate surface runoff comprehensively. Furthermore, solar radiation, as the principal energy source for Earth’s physical, biological, and chemical processes, such as snowmelt, crop photosynthesis, evapotranspiration, and growth, affects various ecosystem functions. It also plays a critical role in hydrological and ecosystem process models by influencing microclimates through variations in air temperature, soil temperature, evapotranspiration, soil moisture, and photosynthesis [22].
Water quality is a comprehensive indicator of watershed geomorphology, hydrology, biological processes, and human activity. Changes in these factors affect the status of water quality [23]. Therefore, quantitatively identifying the effects of various factors on water quality presents substantial challenges. Mechanistic models, such as hydrological models, offer precise characterizations of the impacts of land use and natural factors on hydrological and soil erosion processes. However, due to the numerous model parameters, calibration and verification are challenging. Additionally, the need for high data accuracy and the inherent complexity of hydrological processes introduce uncertainties in the results of hydrological models [24,25,26]. With advances in statistical analyses and Geographic Information System (GIS) technology, the integration of multivariate statistical models and GIS methods has emerged as an effective research technique for regional water quality impact analysis.
The Red River Basin exhibits a diverse geographic environment, encompassing mountains, hills, and plains that give rise to a variety of landforms. This area supports a wide variety of land use types, including croplands, forests, grasslands, and others [27]. This facilitates more precise and applicable quantitative assessments of how land use and natural factors impact water quality. The Red River Basin is further characterized by its numerous tributaries and abundant water resources, which contribute to its economic prosperity [28]. Additionally, located in a subtropical plateau mountain monsoon climate zone [29], the Red River Basin boasts rich biodiversity, diverse agriculture, and a significant human footprint, adding to the uniqueness of this region for research. Conducting quantitative assessments of the influence of land use and natural factors on water quality in the Red River Basin can identify key land use and natural factor indicators influencing water quality in the region. The findings are expected to provide a scientific foundation for water resource protection and environmental enhancement, as well as critical references for rational land use planning and management.

2. Materials and Methods

2.1. Study Area

The Red River originates from the eastern foothills of Ailao Mountain in central Yunnan Province, China, and flows from northwest to southeast, entering Vietnam at Hekou County, Yunnan Province (Figure 1). The river traverses diverse climatic and soil zones within a longitudinal range–gorge region of the plateau mountains, distinguishing itself as a major dry–hot valley globally, noted for its complex land use patterns and unique geographical setting [27]. As of 2020, the predominant land uses within the Red River Basin were forest (56.46%), cropland (29.34%), grassland (6.93%), and shrubland (6.17%). The region experiences a tropical monsoon climate, characterized by an average annual precipitation ranging from 1000 to 1600 mm [30,31], and an average annual temperature between 15 °C and 21 °C. The rainy season spans from May to October, accounting for more than 80% of the total annual runoff, with peak runoff typically occurring in August, while the dry season lasts from November to April, reaching its lowest runoff in March [29].

2.2. Water Sampling Measurements

Along the mainstem and major tributaries of the Red River, a total of 45 sampling sites were set up at different stretches, including source streams, urban river sections, and cropland river sections. Field surveys were carried out during the rainy season (August) of 2020, under stable flow conditions, defined as less than 10 mm of precipitation over a 48 h period [32].
Ten water quality parameters were measured at the sampling sites and in the laboratory. Water conductivity (EC, μs·cm−1), water temperature (TEM, °C), and dissolved oxygen (DO, mg·L−1) were measured in the field (METTLER-SG3, Mettler Toledo, Columbus, OH, USA; YSI DO200, YSI Incorporated, Yellow Springs, OH, USA). Total nitrogen (TN, mg·L−1), total phosphorus (TP, mg·L−1), ammonia nitrogen (NH3-N, mg·L−1), nitrate nitrogen (NO3-N, mg·L−1), permanganate index (CODMn, mg·L−1), chlorophyll-a (Chl-a, μg·L−1), and suspended solids (SS, g·L−1) were measured in the laboratory according to “Water and Wastewater Monitoring and Analysis Methods” (State Environmental Protection Administration 2002). Further details on the analytical techniques used for each parameter and the storage and preservation of samples can be found in a recent study [33].

2.3. Land Use and Natural Factors Statistics

Land use within the study area was classified into eight categories based on Landsat 8 Operational Land Imager (OLI) imagery from 2020 with a resolution of 30 m × 30 m, tailored to meet the specific requirements of the study. The categories are as follows: (1) cropland, (2) forest, (3) grassland, (4) shrubland, (5) wetland, (6) water bodies, such as rivers and reservoirs, (7) urban areas, and (8) bare land. To focus on the impacts of dominant land use types and owing to their minimal coverage in the Red River Basin, wetlands (0.01%), water bodies (0.37%), and bare land (0.001%), these land use types were excluded from subsequent analyses.
Land use indices were meticulously selected at both landscape and type levels to capture various attributes such as area, density, shape, aggregation, and diversity of the landscape. At the landscape level, indices such as the total landscape area (TA), largest patch index (LPI), patch density (PD), landscape shape index (LSI), aggregation index (AI), Shannon Diversity Index (SHDI), and Shannon Evenness Index (SHEI) were utilized. Additionally, 25 land use indices, including Percentages of Landscape (PLAND), LPI, PD, LSI, and AI, were calculated for five land use types: cropland, forest, grassland, shrubland, and urban areas. These indices were computed using FRAGSTATS 4.2, based on land use data from the upstream catchment of each sampling site [34]. Furthermore, the average hydrological distance for each land use type (cropland, forest, grassland, shrubland, and urban areas) in the upstream catchment of the sampling sites was determined using ArcGIS 10.2.
Elevation (ELEVA) and slope (SLOPE) were selected as key geomorphological metrics for this study. Elevation influences several factors such as slope gradient, precipitation patterns, vegetation cover, and soil types, all of which are critical in modulating soil erosion [35,36]. Similarly, slope is a crucial determinant of surface runoff and soil erosion; as the slope gradient increases, so does the velocity of surface runoff and the degree of soil erosion [37,38]. These two metrics were calculated based on Advanced Spaceborne Thermal Emission and Reflection Radiometer Global Digital Elevation Model data (30 m × 30 m).
Soil type metrics within the study were reclassified into four categories based on a 1:1,000,000 scale soil-type map, specific watershed characteristics, and the requirements of the study. The classification aligned soil types with similar runoff capacities by employing the partition criterion used in the Hydrological Soil Group (HSG) of the Soil Conservation Service (SCS) models [39]. The reclassification ranged from low to high runoff capacity: Category A encompasses soil types characterized by good permeability and low runoff potential, whereas Category D includes soils with poor permeability and high runoff potential (Table 1). It is important to note that water bodies were excluded from the hydrologic soil group classifications.
Solar radiation was selected over air temperature to represent the spatial variation in heat, due to the minimal spatial variations in temperature during the summer months. The total solar radiation was computed using the Solar Radiation Tool in ArcGIS 10.2. This calculation was based on the Digital Elevation Model and considered several factors, including latitude, viewing range, topography (such as elevation, slope, aspect, slope position, and terrain masking), and atmospheric conditions (such as cloud cover). For these calculations, the weather conditions were assumed to be uniform sky, with a transmittivity set at 0.5 and a diffuse proportion of 0.3. The total solar radiation was accumulated from the onset of the rainy season through to the end of the sampling period (May–July).
Precipitation serves as the primary source of surface runoff in the Red River Basin. Precipitation data were obtained from a monthly precipitation dataset with a 1 km resolution provided by the National Tibetan Plateau Science Data Center [40]. The ArcGIS Raster Calculator Tool was utilized to compute the cumulative precipitation data for the Red River Basin from May to July 2020.
Finally, the analysis involved extracting several key variables for each sampling site, based on the upstream catchment area. These variables encompassed the average elevation, slope, soil type, as well as the average total solar radiation and cumulative precipitation. This comprehensive data extraction facilitated a detailed assessment of how environmental factors, such as topography and climate, influence the study outcomes across different catchment areas.

2.4. Data Analysis

2.4.1. Screening of Important Land Use Index

The stepwise multiple regression (stepwise MLR model) was employed to pinpoint key land use indices that significantly affect water quality. In this analysis, various water quality parameters were considered as dependent variables, while land use indices were used as explanatory variables. The criteria for selecting the best predictive model encompassed a high adjusted R2 value and a variance inflation factor (VIF) below 10, signifying minimal multicollinearity. The land use indices ultimately incorporated into the optimal predictive model were deemed most effective in explaining water quality variations.

2.4.2. Effects of Land Use and Natural Environment on Water Quality

The coefficient of variation was used to analyze the variations in each metric. Spearman’s correlation was conducted to explore the relationships among land use, natural factors, and water quality. Redundancy analysis (RDA) was utilized to assess the total influence of all factors on water quality. Variance partitioning analysis (VPA) was used to evaluate the effect of different groups of factors on water quality. Furthermore, a multiple linear regression model was implemented to explore the impact of land use and natural factors on a single water quality parameter. The RDA and VPA were conducted in Canoco 5.0, and Spearman’s correlation and the multiple linear regression model were implemented in SPSS 22.0.

3. Results

3.1. The Best Prediction Model of Water Quality and Important Land Use Index

Except for Chl-a, the best prediction model was obtained for other water quality parameters (Table 2). Sixteen land use indices, namely 1PLAND, 3PLAND, 7PLAND, 1PD, 2PD, 3PD, 7PD, 1LPI, 3LPI, 7LPI, 1AI, 7AI, 7LSI, 4FLOW, 7FLOW, and TA, were screened. Among them, the proportion of land use indices representing urban areas (6/16) and croplands (4/16) was the highest, indicating that the effects of urban areas and croplands on river water quality were more prominent in the Red River Basin.

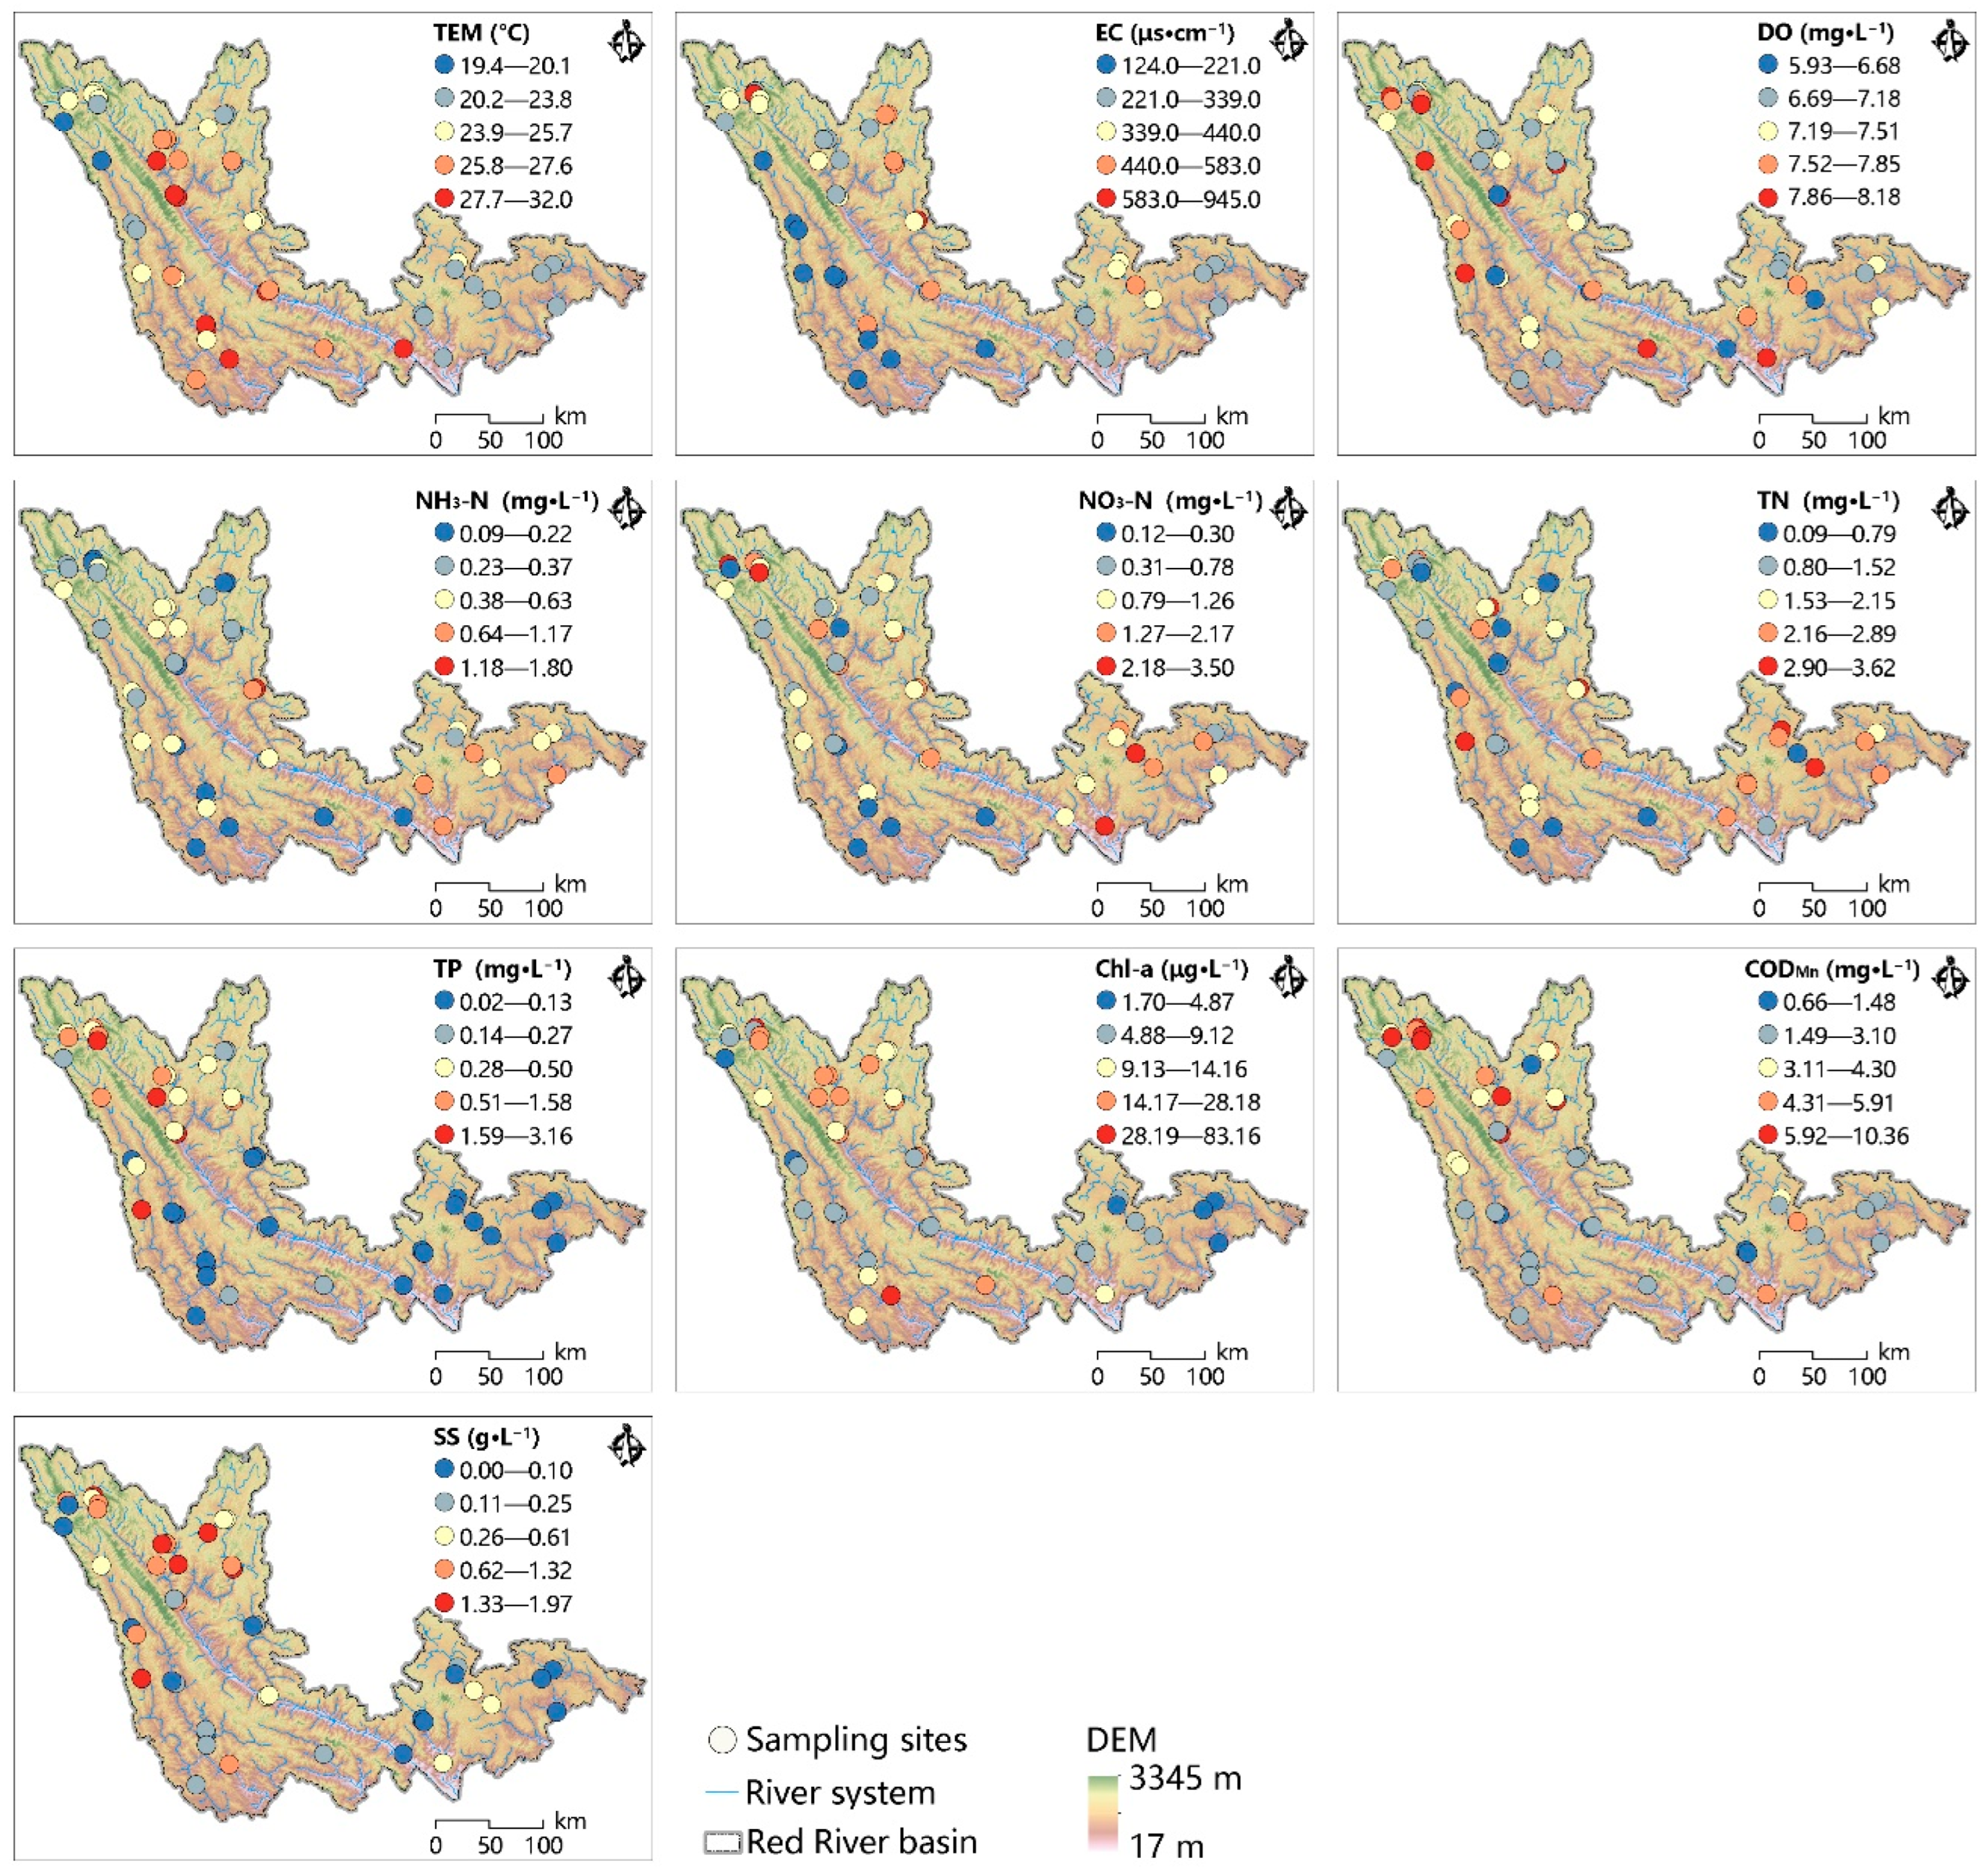
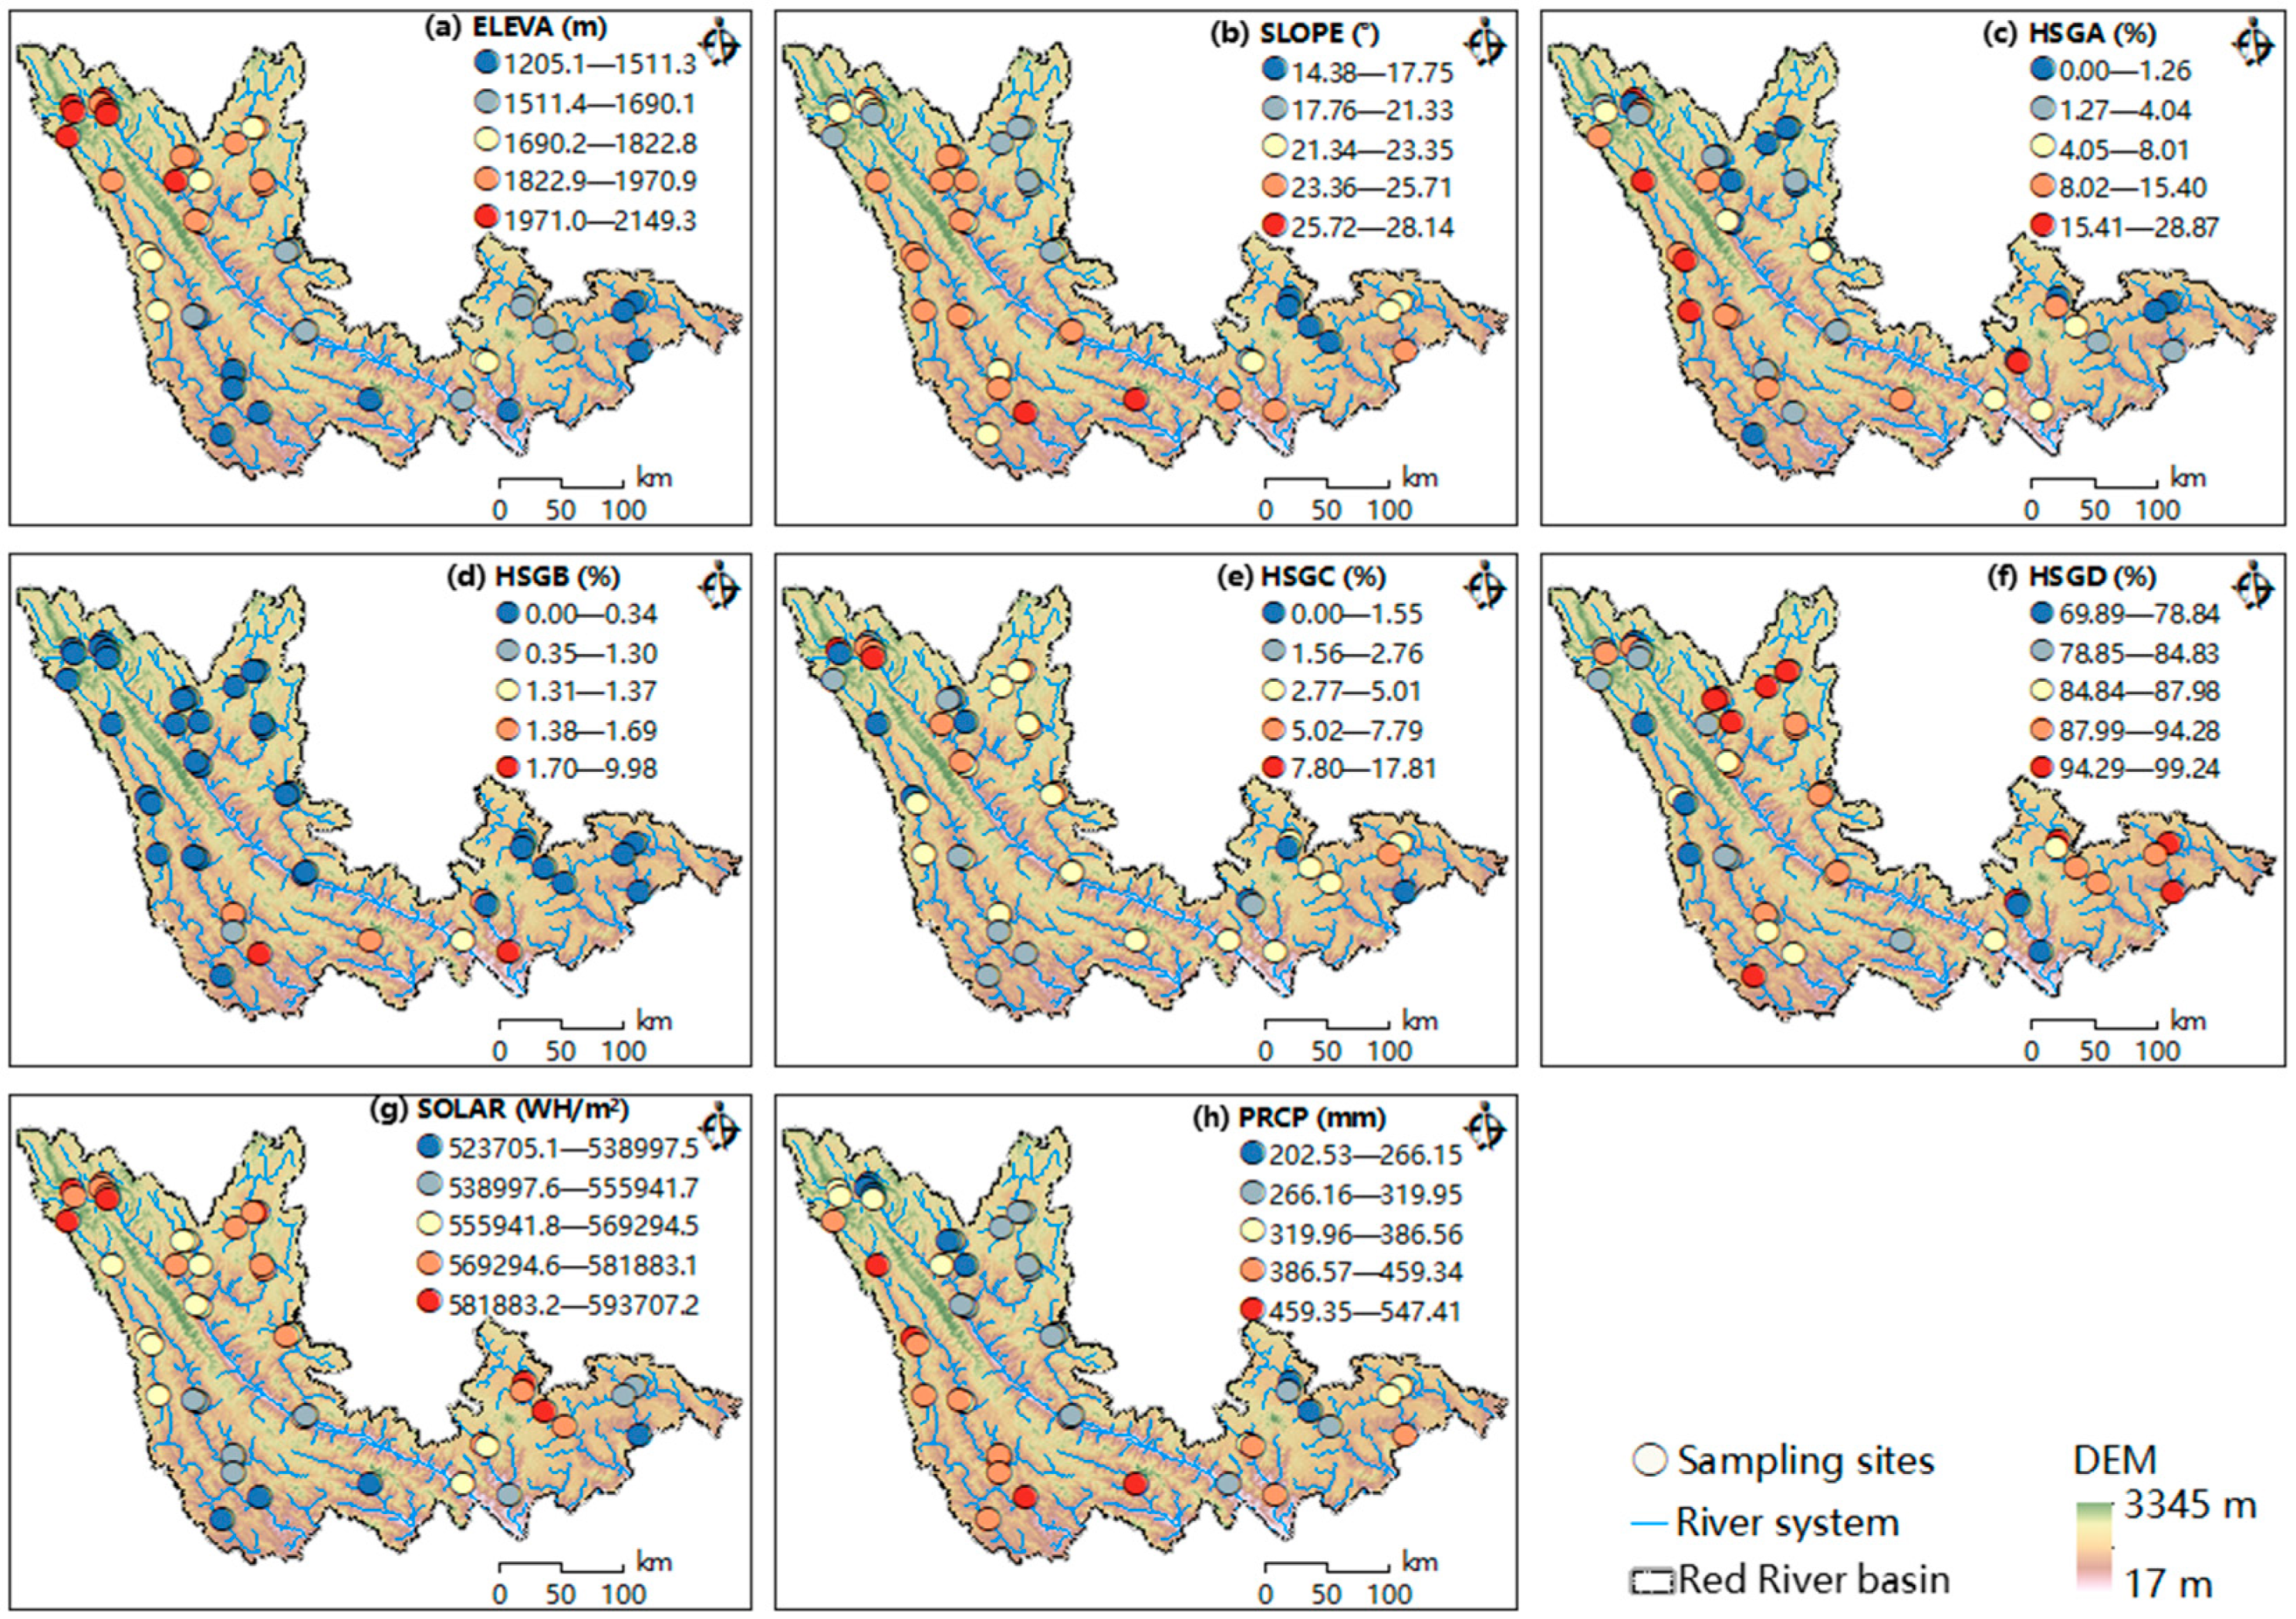
3.2. Characteristics of Water Quality, Land Use, and Natural Factors

The water quality in the Red River Basin was in good condition. The physicochemical parameters of TEM, EC, DO, and the nitrogen group (NH3-N, NO3-N, TN) in the study area showed moderate variation (coefficient of variation < 70%) (Table 3); however, the spatial difference was insignificant. As shown in Figure 2, TEM was higher in the middle reaches of the Yuanjiang River, as well as in the Amo River and Tengtiao River, which are located in the southwestern part of the basin. EC was higher in the upper reaches of the Yuanjiang River to the northeast of the basin, while the Babian and Amo Rivers in the west and the Tengtiao River in the south recorded lower EC levels. DO showed no apparent spatial patterns. The spatial distribution of nitrogen group parameters showed high values in the upper reaches of the Yuanjiang River to the northwest, the Nanxi River, and the Panlong River to the east of the basin. TP, Chl-a, CODMn, nutrient and organic pollution parameters, and SS showed strong variation (coefficient of variation > 100%), and their spatial distributions were similar, with higher values in the northwestern part of the basin.
The indices of land use and natural factors, as well as their variations, are shown in Table 4. The largest patch index for cropland, grassland, and urban areas (1LPI, 3LPI, and 7LPI) within the basin, the hydrological distance index of shrubland and urban areas (4FLOW and 7FLOW), and the total landscape area (TA) for the upstream basin at the sample site showed strong variation (coefficient of variation > 100%). The percentages of cropland, grassland, and urban areas (1PLAND, 3PLAND, and 7PLAND); the patch density of cropland, forest, grassland, and urban areas (1PD, 2PD, 3PD, and 7PD); and the landscape shape index of urban area (7LSI) showed moderate variation (10% < coefficient of variation < 100%). The aggregation indices of cropland and urban areas (1AI and 7AI) showed weak variations (coefficient of variation < 10%).
Among the natural factors, the proportions of hydrological soil group A (HSGA) and hydrological soil group B (HSGB) exhibited strong variation (coefficient of variation > 100%). Elevation (ELEVA), slope (SLOPE), the proportion of hydrological soil group C (HSGC), and precipitation (PRCP) demonstrated moderate variation (10% < coefficient of variation < 100%). The proportions of hydrological soil group D (HSGD) and solar radiation (SOLAR) showed weak variation (coefficient of variation < 10%).
The elevation in the northwest of the basin was higher, whereas it was lower in the south and east of the watershed (Figure 3a). The slopes of Nanjian and Lufeng to the north, Yimen and Xinping in the middle, and Wenshan to the east of the basin were relatively gentle, whereas the slopes of Jingdong and Zhenyuan to the west and Xichou and Malipo to the east of the basin were relatively steep (Figure 3b). HSGD was the main soil in the basin (proportion of HSGD > 60%). HSGA and HSGB were mainly distributed in the western and southern parts of the basin, respectively. HSGC was mainly distributed in the upstream area southeast of the basin (Figure 3c–f). The upper reaches of the northern and eastern parts of the basin near Wenshan received higher solar radiation, whereas the southern and eastern parts of the basin near Xichou and Malipo received lower solar radiation (Figure 3g). At the boundary of the Yuanjiang River, there was higher precipitation in the southwest compared with that in the northeast (Figure 3h).

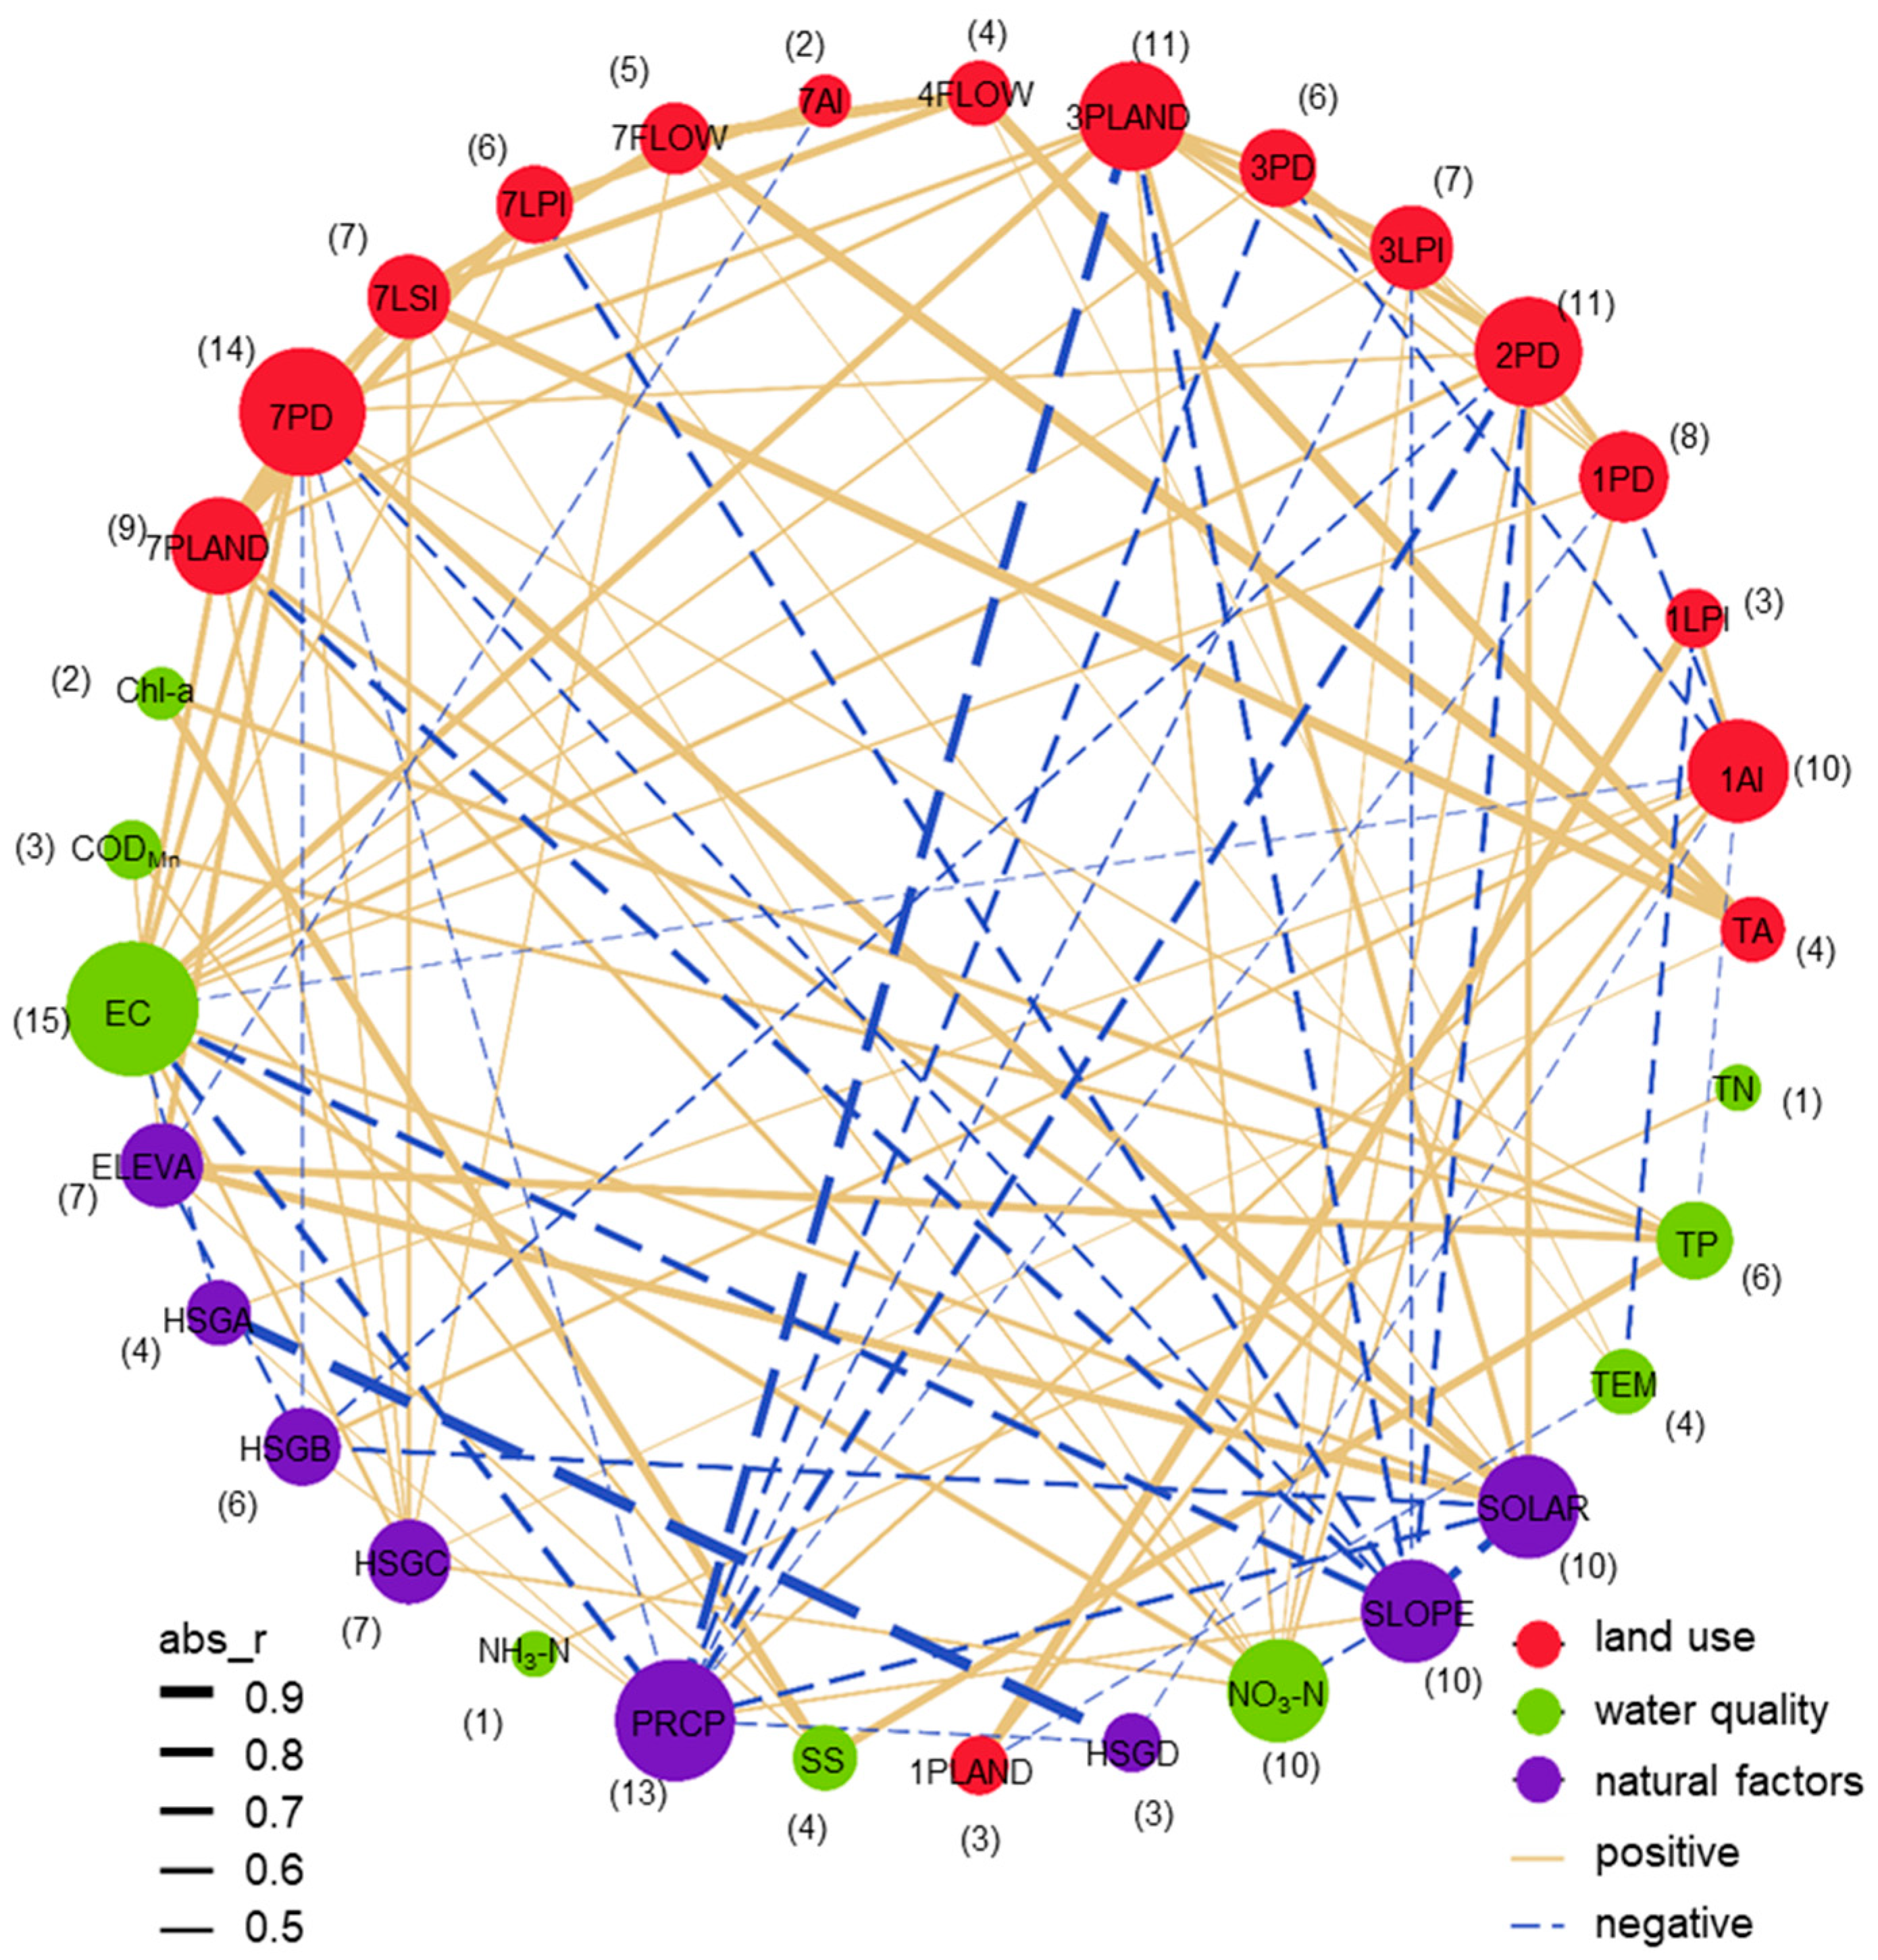
3.3. Correlation Between Land Use, Natural Factors, and Water Quality Parameters

A strong correlation was observed between land use and natural factors. The land use indices such as 3PLAND, 3PD, 3LPI, 2PD, and 1PD were negatively correlated with PRCP; 7PLAND, 7PD, 7LPI, 3PLAND, 3LPI, and 2PD were negatively correlated with SLOPE. However, 7PLAND, 7PD, 7LPI, 3PLAND, and 2PD showed strong positive correlations with SOLAR. Apart from the significant negative correlation between 2PD and HSGB and between 1AI and HSGC, most of the land use indices showed a positive correlation with hydrological soil groups; for example, 1AI was significantly positively correlated with HSGA and HSGB, and 7PLAND, 7PD, 7LSI, and 7FLOW were significantly positively correlated with HSGC. There was a significant positive correlation between 7PD and ELEVA and a significant negative correlation between 7AI and ELEVA (Figure 4).
EC and NO3-N showed strong correlations with land use and natural factors, whereas correlations between other water quality parameters and these factors were weak. EC was mostly positively correlated with land use indices and SOLAR and HSGC among natural factors, but it was negatively correlated with PRCP, SLOPE, and HSGA. NO3-N exhibited weak positive correlations with most land use indices and natural factors; it showed significant positive correlations with SOLAR and HSGC and a negative correlation with SLOPE. TP, TEM, and SS were significantly correlated with specific parameters; for example, TP was positively correlated with 7PD and ELEVA. TEM was positively correlated with 4FLOW and 7FLOW and negatively correlated with 1PLAND and 1LPI. SS was positively correlated with ELEVA. DO, TN, NH3-N, Chl-a, and CODMn showed no significant correlation with land use or natural factors (Figure 4).

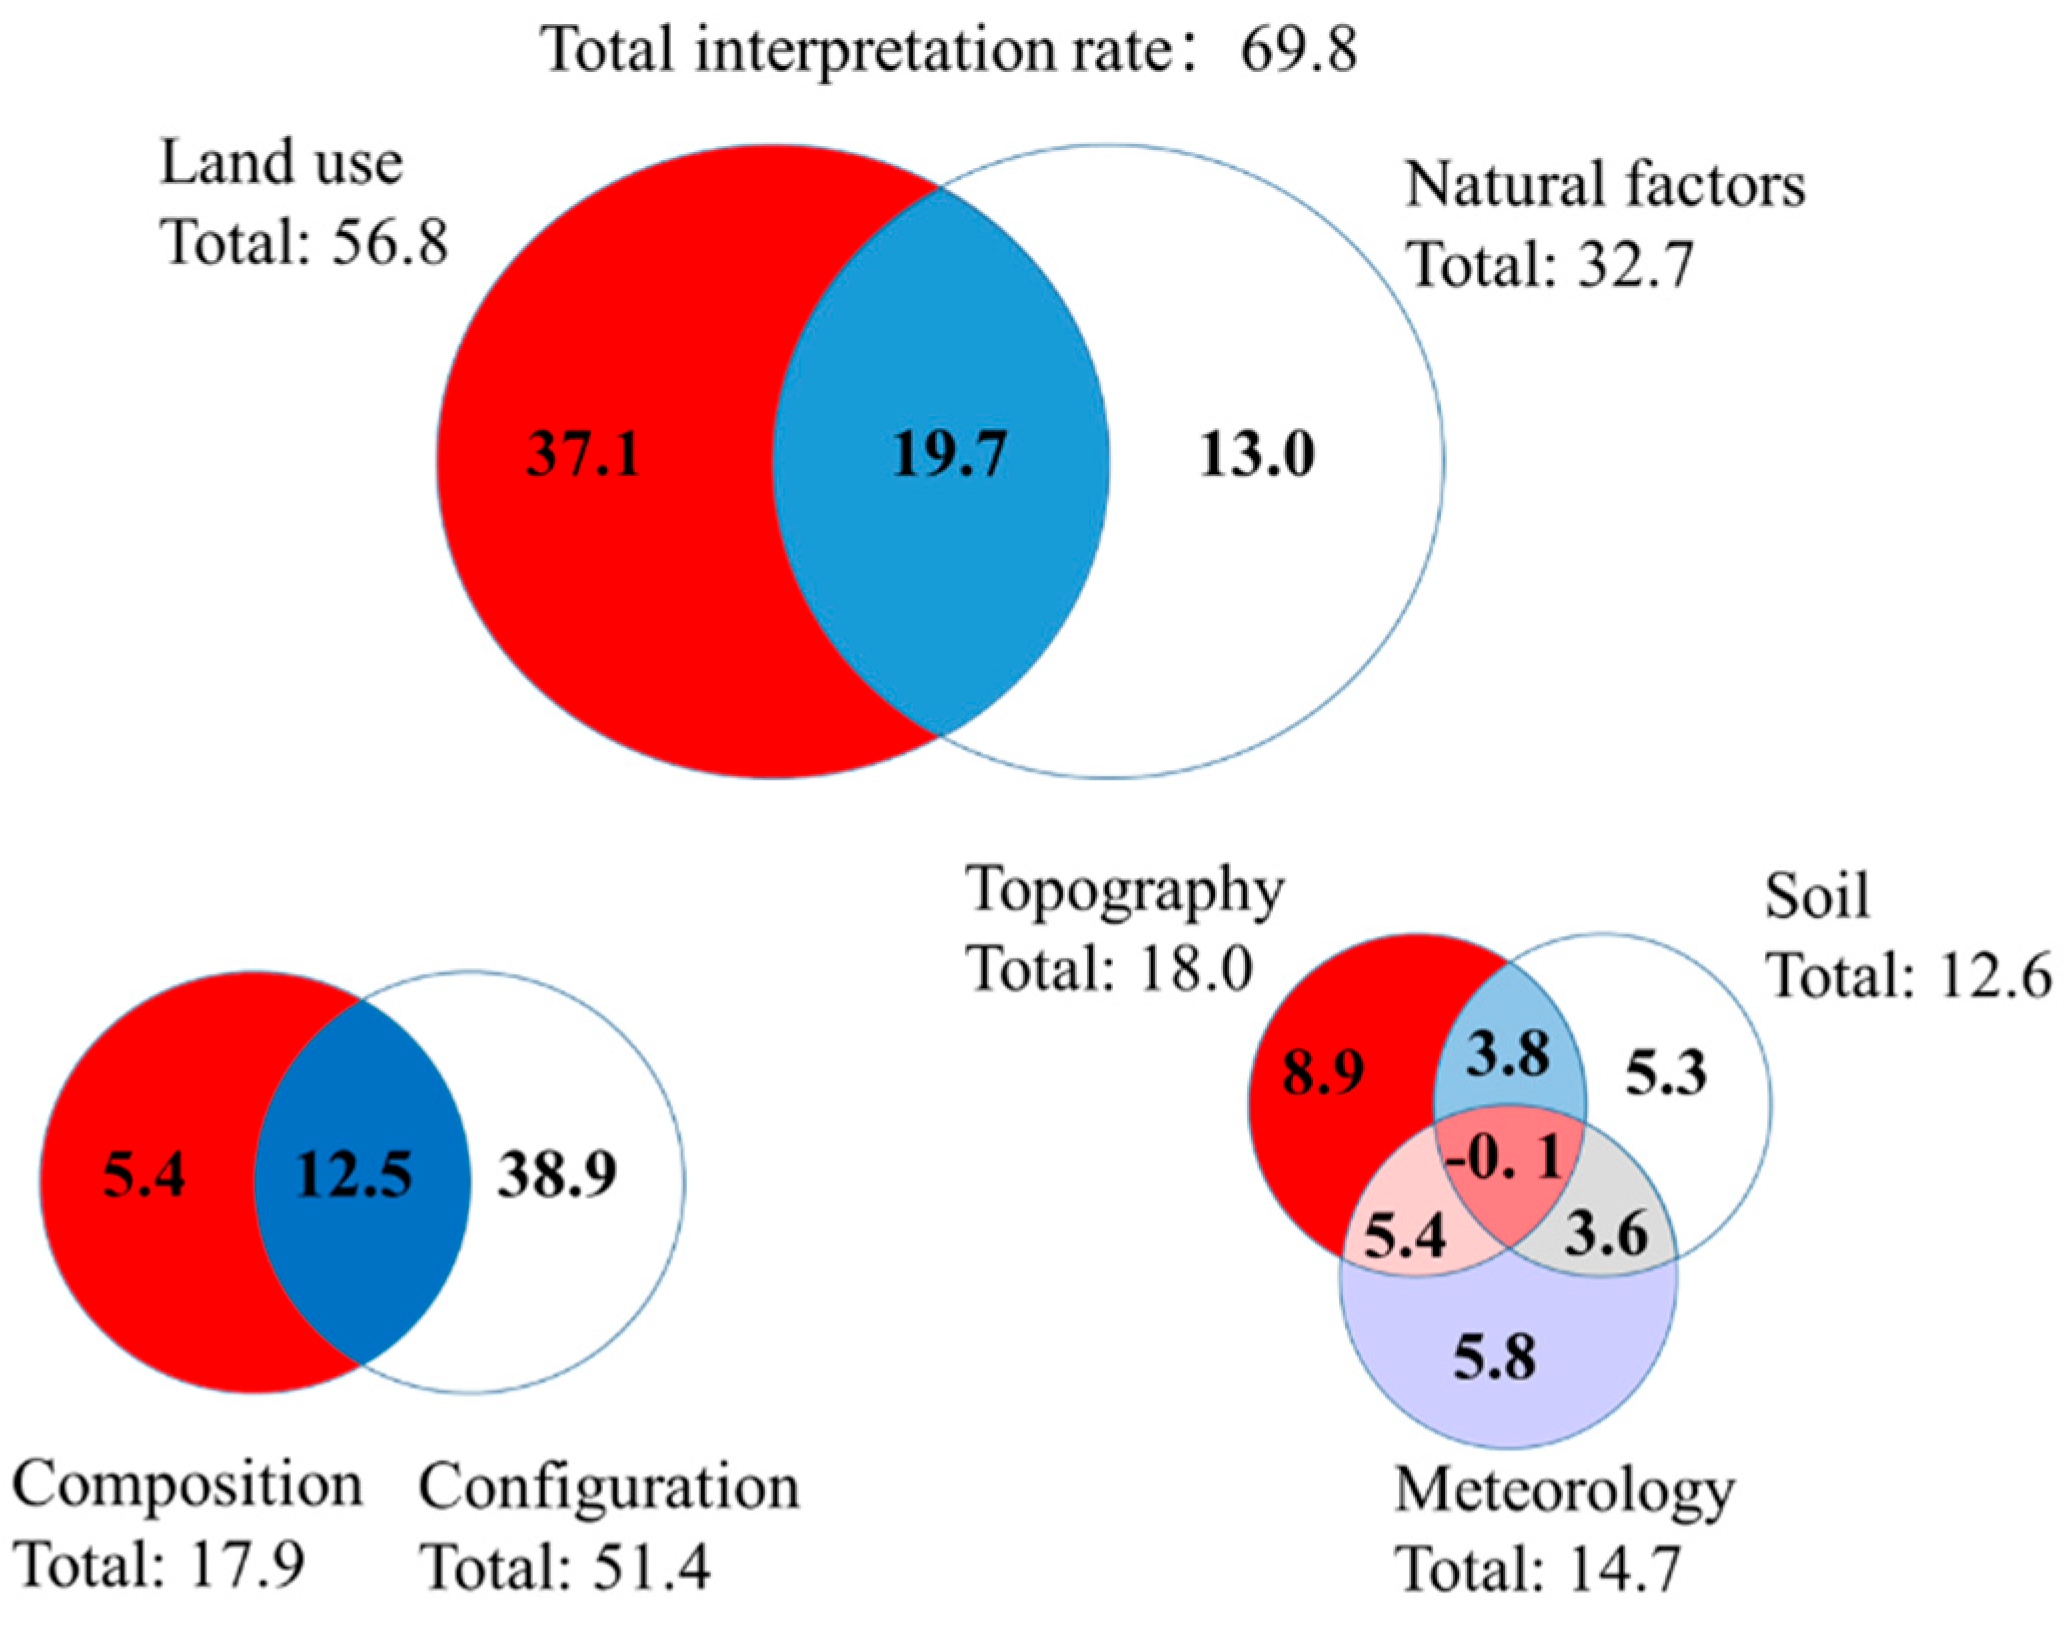
3.4. Mulivariate Drivers of Water Quality Variation from Land Use and Natural Factors

Redundancy analysis (RDA) accounted for 69.8% of the variance in water quality, elucidating the relationship between land use, natural factors, and water quality parameters. Specifically, Axes 1 and 2 explained 20.9% (p < 0.05) and 18.5% (p < 0.05) of the variance in the water quality, respectively (Table 5). Axis 1 represented the nutritional gradient and was positively correlated with TP, CODMn, Chl-a, DO, and SS. It showed a strong positive correlation with urban areas (7LSI, 7PD), grassland (3PD), ELEVA, HSGC, and other indicators. Conversely, it exhibited a strong negative correlation with PRCP, HSGD, and other indicators. Axis 2 denoted the nitrogen pollution gradient and was positively correlated with nitrogen group parameters and EC, while negatively correlated with TEM. It showed a strong positive correlation with cropland (1PLAND, 1PD, and 1LPI), forest (2PD), grassland (3PLAND, 3PD, and 3LPI), urban areas (7PLAND, 7PD, 7LPI, and 7AI), SOLAR, and other indicators. On the other hand, it displayed a negative correlation with hydrological distance (4FLOW and 7FLOW), soil (HSGA and HSGB), SLOPE, and other indicators. Cropland and urban areas were the primary land use types that affected the water quality of the study area. Topography (ELEVA and SLOPE), soil (HSGA and HSGB), and meteorology (SOLAR and PRCP) were identified as the principal natural factors affecting the water quality in the study area (Figure 5).
The results of variance partitioning analysis (VPA) showed that 69.8% of the variance in water quality was explained by land use and natural factors (i.e., all sorting axes), and the common interpretation rate between land use and natural factors was 19.7%. After removing the common interpretation rate, the individual interpretation rate of land use (37.1%) was higher than that of natural factors (13.0%). This suggests that land use is the most significant variable in explaining the variance in water quality within the study area. Specifically, land use alone accounted for 56.8% of the total variance in water quality; within this, component indices contributed 5.4%, and configuration indicators contributed 38.9%, while sharing an explanatory power of 12.5% between them. Configuration indicators emerged as the primary factors driving variance in water quality among land use variables.
For natural factors, the total explained variance in water quality was 32.7%. Topography alone accounted for the highest individual contribution, explaining 8.9% of the variance. Meteorological and soil factors contributed similarly, explaining 5.8% and 5.3% of the variance in water quality, respectively. The combined explanatory powers of topography and meteorology, topography and soil, and meteorology and soil were 5.4%, 3.8%, and 3.6%, respectively. A negative common interpretation rate of -0.1% among the three factors suggests potential collinearity, indicating that their combined influence might reduce the explanatory power. Compared with soil and meteorological factors, topographic factors were identified as more crucial in explaining water quality variance in the study area (see Figure 6).

3.5. Variations in Water Quality Parameters in Response to Land Use and Natural Factors

The results from stepwise multiple regression (MLR) analysis of water quality, land use, and natural factors (Table 6) indicated that the explanatory power of environmental factors in the river basin varied among different water quality parameters. The models for water temperature (TEM), electrical conductivity (EC), and nitrate nitrogen (NO3-N) exhibited higher explanatory power (adjusted R2 > 0.5), whereas the models for other nutrient and organic parameters showed lower explanatory power (adjusted R2 < 0.4).
The model identifies the optimal explanatory variables that effectively explain each water quality parameter. The results indicated that elevation (ELEVA) was the main explanatory variable, with the largest regression coefficients in the models for total phosphorus (TP), permanganate index (CODMn), and suspended solids (SS). Water temperature (TEM) and nitrate nitrogen (NO3-N) were primarily influenced by urban areas, with hydrological flow in urban areas (7FLOW) and the percentage of urban land (7PLAND) serving as the main explanatory variables for their respective models. For electrical conductivity (EC) and dissolved oxygen (DO), the main explanatory variables were precipitation (PRCP) and total area (TA), respectively. The ammonia nitrogen (NH3-N) and total nitrogen (TN) models identified the largest patch index in grasslands (3LPI) and patch density in croplands (1PD) as the main explanatory variables. For chlorophyll-a (Chl-a), slope (SLOPE) was the key explanatory variable. The selected optimal explanatory variables included various factors such as components of cropland and urban area (1PLAND and 7PLAND), land use configuration (1PD, 7FLOW, 3LPI, and TA), topography (ELEVA and SLOPE), and meteorology (PRCP).

4. Discussion

4.1. Combined Effects of Land Use Composition, Land Use Configuration, and Natural Factors on Water Quality

The combined analysis of land use and the natural factors explained 69.8% of the variance in water quality, and only 17.9% of the variance could be explained by land use components alone. Previous studies have focused on the relationship between land use and water quality based on the land use component index. In these studies, land use could only explain 3% to 48% of the variance in water quality in watersheds [41,42,43]. The significant increase in the interpretation rate showed that water quality was comprehensively affected by land use components, land use configurations, and natural factors. Other unexplained variances in water quality could be related to point source pollution or other factors such as basin area, differences in flow, or random factors [44].

4.2. Covariance Effect of Land Use and Natural Factors and Their Relative Impact on Water Quality

The variance partitioning analysis (VPA) revealed a common interpretation rate of 19.7% for the variation in water quality attributed to both land use and natural factors. This accounted for approximately a third of the total interpretation rate of land use (56.8%). This suggests that a certain degree of collinearity exists between land use and natural factors. Additionally, the study highlighted that regional variations in natural factors and their impact on water quality are crucial considerations when examining the relationship between land use and water quality. Neglecting these factors could lead to an overestimation of land use’s influence on water quality [45,46]. Among the various natural factors, topography emerged as the strongest predictor of water quality [47]. Correlation and redundancy analyses further supported this finding, revealing a strong correlation between land use indices and topography factors. In addition, the composition and arrangement of land use within the catchment exhibited distinct geomorphic gradients. For instance, higher catchment elevations were associated with an increased proportion and patch density of urban areas. Conversely, steeper slopes corresponded to a decrease in the proportion and patch density of cropland. These patterns suggested a covariant relationship between topography and the composition and configuration of land use. Considering topography’s pivotal role in regional environmental differentiation and its significant impact on human land use patterns and intensity [48,49], it is imperative to examine the relationship between land use and water quality within various geomorphic contexts to formulate a more precise model. This methodology enables a deeper insight into how the natural environment influences land use decisions and their subsequent effects on water quality.
VPA also showed that the single interpretation rate of land use indexes (37.1%) was significantly higher than that of natural factors (13.0%). This suggests that, while natural environmental factors notably influence water quality, the impact of land use is even more pronounced. Land use indices have emerged as key variables explaining variations in water quality. Notably, the single interpretation rate of the land use configuration index (38.9%) significantly exceeds that of the component index (5.4%). This indicates that the spatial arrangement of land use has a substantially greater impact on water quality than the individual components themselves. This contradicts the viewpoint put forth by Lee et al. [12], that land use components are the primary determinants of the pollutant load imported and carry greater significance at the watershed scale.
Domestic sewage, industrial wastewater, and agricultural non-point source pollution are the main sources of river water pollutants [43]. In the Red River Basin, forest cover (56.5%) and cropland (29.3%) predominate, while urban areas constitute only 0.7% of the land use. Thus, the contribution of pollutants from industrial and residential activities is limited. Instead, the spatial configuration of land use influences material cycles and energy flow, thereby impacting regional water quality through the processes of pollutant generation, transfer, and transformation [50,51]. The Red River is a typical longitudinal range–gorge region with plateau mountains. The lack of contiguous land results in scattered cropland and complex land use patterns. This configuration likely exacerbates agricultural non-point source pollution, as the dispersion of pollutants depends more on the spatial configuration of land use rather than mere land use types. This underscores the need for integrated land and water management strategies that consider both land use patterns and the natural characteristics of the watershed.
The results of VPA showed that the explanatory power of soil factors on water quality was limited. The probable reasons for this phenomenon are as follows: (1) Reduction in soil data accuracy. Hydrological Soil Groups (HSGs) broadly summarize soil attribute information, which may reduce the accuracy of the soil data and diminish the sensitivity of water quality to changes in soil attributes. (2) Geographical incompatibility of soil classification. The HSG classification refers to the classification standard of the Soil Conservation Service (SCS) model from the United States, which is tailored to the soil texture and hydrological characteristics of North America. This classification may not align well with the soil systems found in China, potentially affecting its applicability and accuracy in Chinese contexts [52]. (3) Impact of land use changes. Urbanization and other land use changes lead to an increase in impervious surfaces, reducing soil permeability and water yield in the basin. These changes can disrupt the natural soil–water interactions, diminishing the influence of soil type on water quality. Human activities thus interfere with the natural effects of soil types, reducing the explanatory power of soil factors regarding water quality. These factors together suggest that, while soil characteristics are important, their role in explaining water quality variations can be obscured by modifications in land use and the limitations of the soil classification models used.
Meteorological factors provided an inadequate explanation for variations in water quality. This may be attributed to data being collected during the early rainy season (May–July) and the consideration of average solar radiation. Additionally, the spatial variability in precipitation was minimal (coefficient of variation < 25%), which might limit the detection of the impact of precipitation on water quality. This issue could also stem from the chosen indicators and the timing of data collection. Specifically, the solar radiation data, which represented the accumulated amount over the early rainy season, failed to account for the moderating effect of forest cover, potentially misrepresenting the actual thermal conditions of the watershed. Moreover, the water quality data were collected during the base flow period, which might not capture significant meteorological impacts evident during rainstorm events, such as the “First Flush” effect, where initial runoff carries a concentrated load of pollutants [53].

4.3. Variations in the Impact of Land Use and Natural Factors on Single Water Quality Parameters

The impacts of land use and natural factors on specific water quality parameters differed. Land use was the most significant explanatory variable for ammonia nitrogen (NH3-N), nitrate nitrogen (NO3-N), total nitrogen (TN), water temperature (TEM), and dissolved oxygen (DO) [54], while natural factors were the most significant explanatory variables for total phosphorus (TP), permanganate index (CODMn), suspended solids (SS), electrical conductivity (EC), and chlorophyll-a (Chl-a) [55]. Land use types such as croplands, grasslands, and urban areas significantly influence nitrogen levels within the watershed. NH3-N was significantly correlated with the largest grassland patch index (3LPI), indicating that NH3-N was closely related to the dominance of grassland in the catchment. This correlation is likely due to the grasslands being used for grazing, where livestock emissions contribute to NH3-N levels in the river [56]. NO3-N was closely related to the percentage of the urban area landscape (7PLAND), where high population density and intensive economic activities lead to elevated pollutant loads. Additionally, impervious surfaces in these areas facilitate surface runoff, potentially increasing nutrient concentrations in rivers and degrading water quality [44]. TN was significantly correlated with cropland patch density (1PD), indicating that nutrient inputs from agricultural runoff, particularly fertilizers, are a primary source of riverine nitrogen. TEM was positively correlated with the hydrological distance in urban areas (7FLOW), which could be attributed to the prolonged exposure to solar radiation over longer hydrological pathways. DO levels were inversely related to the total area (TA) of the catchment. This study employed a nested method to segment the catchment area, wherein downstream monitoring sites encompass the upstream catchments. Consequently, larger TAs, primarily located downstream, experience slower river flows and higher pollution levels, resulting in lower DO concentrations. Conversely, upstream regions, characterized by steeper gradients and faster flows, typically exhibit better water quality and higher DO levels. It is worth noting that in the Red River Basin, there is a positive correlation between elevation and urban land use (7PD), indicating a significantly higher proportion of built-up areas in the higher regions. This is because the Red River Basin has a deeply incised valley with limited usable land, pronounced dry-hot valley characteristics, and low rainfall [57,58], making its geological and physiographic conditions unsuitable for urban development. In contrast, the relatively higher mountainous areas receive more rainfall and enjoy a more favorable climate for habitation, while also offering relatively more usable land conditions that facilitate urban development. As a result, an “valley-avoiding, mountain-preferring” pattern of urban distribution has emerged [59].
In addition to the impacts of land use components and configurations, the impact of natural factors on water quality also warrants attention. The results showed that elevation (ELEVA) had a significant influence on TP, CODMn, and SS, all of which exhibit a positive correlation. TP and CODMn are strongly influenced by anthropogenic activities [60], resulting in altitudinal distribution trends that follow the altitudinal pattern of urban land use. This pattern may be associated with the characteristics of land use in the higher elevation areas of the Red River region, specifically in Dali, Chuxiong, and Yuxi, which are located in the watershed’s northwest. These economically developed, densely populated areas with intense human activity are reflected in elevated levels of TP, CODMn, and SS in rivers [60]. Conversely, the eastern and southern regions of the basin, characterized by lower elevations and proximity to the Vietnam border, have sparse populations, lower human activity, and dense forest cover, resulting in lower concentrations of these substances in rivers. Precipitation had a significant effect on EC, with a noted negative correlation. This relationship may stem from the collection of water quality data during the base flow period, which diminishes the scouring effect of rainstorms and reduces ion concentrations through dilution [16]. Additionally, slope has a significant positive correlation with chlorophyll-a (Chl-a), indicating that slope has a positive promoting effect on organic pollution, consistent with previous findings [47,61]. In areas with steep slopes, the increased flow velocity and soil erosion rate contribute to heightened organic pollution [43].

4.4. Implications for Land Management in the Red River

Cropland and urban areas are critical land use components for water pollution control in the Red River Basin. Analysis indicates that cropland, urban areas, and grasslands significantly impact water quality. Extensive agricultural practices in the Red River region contribute to substantial non-point source pollution, exacerbated by inadequate enforcement of agricultural pollution control measures. Although the government has initiated agricultural industrial restructuring and implemented “Zero growth” policies for fertilizers and pesticides [62], the transition in production modes makes it challenging to reduce the existing levels of agricultural non-point source pollution significantly. Additionally, the development and management of urban domestic sewage collection and treatment facilities are insufficient, with ongoing issues of direct and non-compliant discharges. Therefore, priorities for improving water quality in the Red River should include accelerating agricultural industry restructuring, enhancing the management of non-point source pollution from agriculture, intensifying urban domestic pollution treatment, and expediting the construction of sewage collection and treatment infrastructure.
Currently, grasslands are overlooked as land use components in water quality management. Although they comprise only 6.9% of the Red River Basin, grasslands play a significant role, as evidenced by the strong correlation between NH3-N and the Largest Grassland Patch Index (3LPI) in the basin. Since 2014, the “Modern Grassland Animal Husbandry Promotion Action” project has been implemented in ten southern provinces, including Yunnan Province, to enhance the development of animal husbandry and increase grassland utilization. This initiative may result in elevated NH3-N outputs from these areas, potentially making grasslands a notable source of NH3-N in the Red River. In response, it is imperative that future governmental efforts focus on strengthening animal husbandry and grassland management to mitigate the impact of this sector on river water quality.
The strategic reallocation of land use, particularly cropland, is crucial for future water quality management in the Red River Basin. Analysis indicates that TN and NO3-N are positively correlated with cropland patch density (1PD), whereas TP is negatively correlated with the largest patch index of cropland (1LPI). These correlations suggest that increased fragmentation of cropland within the basin is associated with higher levels of nitrogen and phosphorus in the river. Consequently, expediting the transformation of agricultural industry structures, deepening land circulation reforms, and encouraging large-scale farming are essential strategies to effectively reduce the prevalence of agricultural non-point source pollution.
In land management, it is critical to acknowledge the covariant relationship between land use and natural factors and to implement zoning management tailored to different geomorphological areas. Analysis indicates a covariant relationship between land use patterns and ELEVA, with ELEVA showing a positive correlation with TP, CODMn, and SS in the Red River. Based on these findings, it is advisable to adopt land use zoning management practices according to catchment elevation. Specifically, the higher elevation regions of Dali, Chuxiong, and Yuxi in the northwest of the basin should be prioritized for enhanced urban pollution control and soil erosion prevention.

5. Conclusions

In the Red River Basin, statistical analysis has shown that overall water quality is satisfactory, although variability exists among different parameters. Stable indicators include water temperature (TEM), electrical conductivity (EC), and ammonia nitrogen (NO3-N), whereas total phosphorus (TP), chlorophyll-a (Chl-a), permanganate index (CODMn), and suspended solids (SS) exhibit significant fluctuations, particularly in the northwestern part of the basin. Quantitative analysis employing redundancy analysis (RDA), correlation analysis, and stepwise multiple regression indicates that water quality results from an interplay between land use and natural factors. There is a notable correlation between different land use indices and natural factors such as precipitation, slope, and soil type, with land use patterns displaying geographical gradients. Land use is the predominant factor, accounting for 56.8% of the variance in water quality, while natural factors contribute 32.7%. Key indices influencing water quality include urban area proportions of the landscape (7PLAND), cropland area proportions of the landscape and cropland area patch density (1PLAND, 1PD), urban hydrological distances (7FLOW), the largest patch indices of grassland (3LPI), and overall landscape area (TA). Urban and cultivated areas significantly impact nitrogen and temperature indicators, whereas elevation (ELEVA) is notably associated with phosphorus and organic pollutants. Additionally, meteorological and topographic factors such as precipitation (PRCP) and slope (SLOPE) also influence water quality.
To improve water quality, the focus should be on land use management and optimization. This approach ensures sustainable water resource use and environmental protection by considering both land use and natural factors. In addition to emphasizing urban and cropland management, the management of livestock farming and grasslands should also be strengthened to reduce the impact of livestock farming. In the land management of the Red River Basin, we should also pay more attention to optimizing land use, promoting farmland transfer, and adjusting agricultural structures, as these measures will help reduce agricultural non-point source pollution.

Author Contributions

K.H. and C.C. designed the experiments. C.C., H.T., Y.H. (Yangyidan He) and X.F. conducted the experiments. X.C., Y.H. (Yu Han), L.Y. (Liqin Yan), L.Y. (Liling Yang), Y.H. (Yuan He) and C.C. assisted with the data collection. K.H. and C.C. wrote the main manuscript text and prepared the figures; C.C. and X.C. made revisions. All authors have read and agreed to the published version of the manuscript.

Funding

This research was funded by the National Natural Science Foundation of China (32371711, 32060304) and the Global Environment Facility Project (5665). And The APC was funded by grant number 32371711.

Data Availability Statement

The data that support the findings of this study are available from the corresponding author upon reasonable request. The data are not publicly available due to privacy or ethical restrictions.

Acknowledgments

We thank the Landsat Science website of the USGS Earth Resources Observation and Science (EROS) Center (https://landsat.gsfc.nasa.gov/data/, accedded on 26 April 2025) for providing the remote sensing image data used in this study. We would also like to thank the anonymous reviewers and editors of this manuscript.

Conflicts of Interest

All of the authors claim that none of the material in this paper, “A quantitative assessment of the impacts of land use and natural factors on water quality in the Red River basin, China”, has been published or is under consideration for publication elsewhere. All authors declare that they have no conflicts of interest. This paper does not contain any studies performed by any of the authors with human participants or animals. The funding sponsors had no role in the design of the study; in the collection, analyses, or interpretation of data; in the writing of the manuscript, or in the decision to publish the results.

References

  1. Jiang, A.; Wang, D.; Ning, Z.; Li, P.; Xu, T.; Zhu, B.; Peng, Q.; Jin, T.; Lin, J.; Zhang, D. Spatio-Temporal Characteristics and Influencing Factors of Water Quality in Xiangxi Bay under the Operation of the Three Gorges Reservoir. J. Contam. Hydrol. 2025, 270, 104518. [Google Scholar] [CrossRef] [PubMed]
  2. Baker, A. Land Use and Water Quality. In Encyclopedia of Hydrological Sciences; John Wiley & Sons, Ltd.: Hoboken, NJ, USA, 2006. [Google Scholar]
  3. Dalu, T.; Wasserman, R.J.; Tonkin, J.D.; Alexander, M.E.; Dalu, M.T.B.; Motitsoe, S.N.; Manungo, K.I.; Bepe, O.; Dube, T. Assessing Drivers of Benthic Macroinvertebrate Community Structure in African Highland Streams: An Exploration Using Multivariate Analysis. Sci. Total Environ. 2017, 601, 1340–1348. [Google Scholar] [CrossRef] [PubMed]
  4. Wu, F.; Yang, X.; Cui, Z.; Ren, L.; Jiang, S.; Liu, Y.; Yuan, S. The Impact of Human Activities on Blue-Green Water Resources and Quantification of Water Resource Scarcity in the Yangtze River Basin. Sci. Total Environ. 2024, 909, 168550. [Google Scholar] [CrossRef]
  5. Lu, J.; Cai, H.; Zhang, X.; Fu, Y. Water Quality in Relation to Land Use in the Junshan Lake Watershed and Water Quality Predictions. Water Supply 2021, 21, 3602–3613. [Google Scholar] [CrossRef]
  6. Dodds, W.K.; Oakes, R.M. Headwater Influences on Downstream Water Quality. Environ. Manag. 2008, 41, 367–377. [Google Scholar] [CrossRef] [PubMed]
  7. Hunsaker, C.T.; Levine, D.A. Hierarchical Approaches to the Study of Water Quality in Rivers. BioScience 1995, 45, 193–203. [Google Scholar] [CrossRef]
  8. Sun, Y.; Guo, Q.; Liu, J.; Wang, R. Scale Effects on Spatially Varying Relationships between Urban Landscape Patterns and Water Quality. Environ. Manag. 2014, 54, 272–287. [Google Scholar] [CrossRef]
  9. Guo, Q.; Ma, K.; Yang, L.; He, K. Testing a Dynamic Complex Hypothesis in the Analysis of Land Use Impact on Lake Water Quality. Water Resour. Manag. 2010, 24, 1313–1332. [Google Scholar] [CrossRef]
  10. Lee, S.-W.; Hwang, S.-J.; Lee, S.-B.; Hwang, H.-S.; Sung, H.-C. Landscape Ecological Approach to the Relationships of Land Use Patterns in Watersheds to Water Quality Characteristics. Landsc. Urban Plan. 2009, 92, 80–89. [Google Scholar] [CrossRef]
  11. Li, Y.L.; Liu, K.; Li, L.; Xu, Z.X. Relationship of Land Use/Cover on Water Quality in the Liao River Basin, China. Procedia Environ. Sci. 2012, 13, 1484–1493. [Google Scholar] [CrossRef]
  12. Wu, J.; Jin, Y.; Hao, Y.; Lu, J. Identification of the Control Factors Affecting Water Quality Variation at Multi-Spatial Scales in a Headwater Watershed. Environ. Sci. Pollut. Res. 2021, 28, 11129–11141. [Google Scholar] [CrossRef]
  13. Pak, H.Y.; Chuah, C.J.; Yong, E.L.; Snyder, S.A. Effects of Land Use Configuration, Seasonality and Point Source on Water Quality in a Tropical Watershed: A Case Study of the Johor River Basin. Sci. Total Environ. 2021, 780, 146661. [Google Scholar] [CrossRef]
  14. Deng, F.; Liu, W.; Liu, W.; Xu, Y.; Sun, Y.; Zhang, C.; Sun, M.; Yuan, Y. Regional Differences in the Impact of Land Use Pattern on Total Phosphorus Concentration in the Yangtze River Basin. Land 2025, 14, 210. [Google Scholar] [CrossRef]
  15. Nguyen, B.T.; Vo, L.D.; Nguyen, T.X.; Quang, N.X. The Interactive Effects of Natural Factor and Pollution Source on Surface Water Quality in the Lower Mekong River Basin, Southwestern Vietnam. Water Resour. 2020, 47, 865–876. [Google Scholar] [CrossRef]
  16. Zhang, Y.; Guo, F.; Meng, W.; Wang, X.-Q. Water Quality Assessment and Source Identification of Daliao River Basin Using Multivariate Statistical Methods. Environ. Monit. Assess. 2009, 152, 105–121. [Google Scholar] [CrossRef]
  17. Zhou, N.; Westrich, B.; Jiang, S.; Wang, Y. A Coupling Simulation Based on a Hydrodynamics and Water Quality Model of the Pearl River Delta, China. J. Hydrol. 2011, 396, 267–276. [Google Scholar] [CrossRef]
  18. VishnuRadhan, R.; David Thresyamma, D.; Sarma, K.; George, G.; Shirodkar, P.; Vethamony, P. Influence of Natural and Anthropogenic Factors on the Water Quality of the Coastal Waters around the South Andaman in the Bay of Bengal. Nat. Hazards 2015, 78, 309–331. [Google Scholar] [CrossRef]
  19. Heathcote, A.J.; Filstrup, C.T.; Downing, J.A. Watershed Sediment Losses to Lakes Accelerating despite Agricultural Soil Conservation Efforts. PLoS ONE 2013, 8, e53554. [Google Scholar] [CrossRef]
  20. Li, X.; Song, Z.; Lu, Y.; Weng, B.; Li, J.; Liu, Y.; Wang, Z.; Gou, Y. Evaluation of Soil Erosion in the Changhua River Basin on Hainan Island Based on the Chinese Soil Loss Equation Model. Heliyon 2024, 10, e38291. [Google Scholar] [CrossRef]
  21. SCS. National Engineering Handbook, Section 4: Hydrology. In US Soil Conservation Service; USDA: Washington, DC, USA, 1985. [Google Scholar]
  22. Tan, M.L.; Juneng, L.; Kuswanto, H.; Do, H.X.; Zhang, F. Impacts of Solar Radiation Management on Hydro-Climatic Extremes in Southeast Asia. Water 2023, 15, 1089. [Google Scholar] [CrossRef]
  23. Hamid, A.; Bhat, S.U.; Jehangir, A. Local Determinants Influencing Stream Water Quality. Appl. Water Sci. 2019, 10, 24. [Google Scholar] [CrossRef]
  24. Rodriguez, D.A.; Tomasella, J. On the Ability of Large-Scale Hydrological Models to Simulate Land Use and Land Cover Change Impacts in Amazonian Basins. Hydrol. Sci. J. 2016, 61, 1831–1846. [Google Scholar] [CrossRef]
  25. Wang, S.; Kang, S.; Zhang, L.; Li, F. Modelling Hydrological Response to Different Land-use and Climate Change Scenarios in the Zamu River Basin of Northwest China. Hydrol. Process. Int. J. 2008, 22, 2502–2510. [Google Scholar] [CrossRef]
  26. Wei, X.; Zhang, M. Quantifying Streamflow Change Caused by Forest Disturbance at a Large Spatial Scale: A Single Watershed Study. Water Resour. Res. 2010, 46, W12525. [Google Scholar] [CrossRef]
  27. Ding, J.; Yin, L.; Shi, X.; Duan, X. Study on Characteristics of Landscape Pattern Evolution in Red River Basin. J. Yunnan Univ. 2017, 35, 780–788. [Google Scholar]
  28. Zheng, X. Ethnic Water Culture and Agricultural Civilization in the Reaches of Red River. Soc. Sci. Yunnan 2004, 6, 103–107+129. [Google Scholar]
  29. Li, Y.; He, D.; Ye, C. Spatial and Temporal Variation of Runoff of Red River Basin in Yunnan. J. Geogr. Sci. 2008, 18, 308–318. [Google Scholar] [CrossRef]
  30. Le, T.P.Q.; Garnier, J.; Gilles, B.; Sylvain, T.; Van Minh, C. The Changing Flow Regime and Sediment Load of the Red River, Viet Nam. J. Hydrol. 2007, 334, 199–214. [Google Scholar] [CrossRef]
  31. Li, X.; Li, Y.; He, J.; Luo, X. Analysis of Variation in Runoff and Impacts Factors in the Yuanjiang-Red River Basin from 1956 to 2013. Resour. Sci. 2016, 38, 1149–1159. [Google Scholar] [CrossRef]
  32. Grayson, R.B.; Gippel, C.J.; Finlayson, B.L.; Hart, B.T. Catchment-Wide Impacts on Water Quality: The Use of ‘Snapshot’ Sampling during Stable Flow. J. Hydrol. 1997, 199, 121–134. [Google Scholar] [CrossRef]
  33. Ding, J.; Jiang, Y.; Fu, L.; Liu, Q.; Peng, Q.; Kang, M. Impacts of Land Use on Surface Water Quality in a Subtropical River Basin: A Case Study of the Dongjiang River Basin, Southeastern China. Water 2015, 7, 4427–4445. [Google Scholar] [CrossRef]
  34. McGarigal, K.; Cushman, S.A.; Ene, E. FRAGSTATS v4: Spatial Pattern Analysis Program for Categorical and Continuous Maps. In Computer Software Program Produced by the Authors at the University of Massachusetts, Amherst; University of Massachusetts: Amherst, MA, USA, 2012; Volume 15. [Google Scholar]
  35. Liang, S.; Fang, H. Quantitative Analysis of Driving Factors in Soil Erosion Using Geographic Detectors in Qiantang River Catchment, Southeast China. J. Soils Sediments 2021, 21, 134–147. [Google Scholar] [CrossRef]
  36. Yisehak, K.; Belay, D.; Taye, T.; Janssens, G.P.J. Impact of Soil Erosion Associated Factors on Available Feed Resources for Free-Ranging Cattle at Three Altitude Regions: Measurements and Perceptions. J. Arid. Environ. 2013, 98, 70–78. [Google Scholar] [CrossRef]
  37. Xiao, B.; Wang, Q.; Wu, J.; Huang, C.; Yu, D. Protective Function of Narrow Grass Hedges on Soil and Water Loss on Sloping Croplands in Northern China. Agric. Ecosyst. Environ. 2010, 139, 653–664. [Google Scholar] [CrossRef]
  38. Ye, L.; Cai, Q.; Liu, R.; Cao, M. The Influence of Topography and Land Use on Water Quality of Xiangxi River in Three Gorges Reservoir Region. Environ. Geol. 2009, 58, 937–942. [Google Scholar] [CrossRef]
  39. NRCS. Chapter 7–Hydrologic Soil Groups. In NRCS–National Engineering Handbook (NEH), Part 630–Hydrology; USDA NRCS: Washington, DC, USA, 2009; pp. 1–7. [Google Scholar]
  40. Peng, S. 1-Km Monthly Precipitation Dataset for China (1901–2017); National Tibetan Plateau Data Center: Beijing, China, 2020. [Google Scholar]
  41. Molina, M.C.; Roa-Fuentes, C.A.; Zeni, J.O.; Casatti, L. The Effects of Land Use at Different Spatial Scales on Instream Features in Agricultural Streams. Limnologica 2017, 65, 14–21. [Google Scholar] [CrossRef]
  42. Liu, J.; Cheng, F.; Zhu, Y.; Zhang, Q.; Song, Q.; Cui, X. Urban Land-Use Type Influences Summertime Water Quality in Small- and Medium-Sized Urban Rivers: A Case Study in Shanghai, China. Land 2022, 11, 511. [Google Scholar] [CrossRef]
  43. Liu, X.; Liu, H.; Jing, J.; Liu, Y.; Xu, Z.; Cao, X.; Ma, L.; Zhuo, Y.; Wen, L.; Wang, L. How the Land Use/Cover Changes and Environmental Factors at Different Scales Affect Lake Water Quality in Arid and Semi-Arid Regions. Front. Ecol. Evol. 2023, 11, 1188927. [Google Scholar] [CrossRef]
  44. Chen, J.; Lu, J. Effects of Land Use, Topography and Socio-Economic Factors on River Water Quality in a Mountainous Watershed with Intensive Agricultural Production in East China. PLoS ONE 2014, 9, e102714. [Google Scholar] [CrossRef]
  45. Kuma, H.G.; Feyessa, F.F.; Demissie, T.A. Assessing the Impacts of Land Use/Land Cover Changes on Hydrological Processes in Southern Ethiopia: The SWAT Model Approach. Cogent Eng. 2023, 10, 2199508. [Google Scholar] [CrossRef]
  46. Ding, J.; Jiang, Y.; Liu, Q.; Hou, Z.; Liao, J.; Fu, L.; Peng, Q. Influences of the Land Use Pattern on Water Quality in Low-Order Streams of the Dongjiang River Basin, China: A Multi-Scale Analysis. Sci. Total Environ. 2016, 551–552, 205–216. [Google Scholar] [CrossRef]
  47. Deng, L.; Li, W.; Liu, X.; Wang, Y.; Wang, L. Landscape Patterns and Topographic Features Affect Seasonal River Water Quality at Catchment and Buffer Scales. Remote Sens. 2023, 15, 1438. [Google Scholar] [CrossRef]
  48. Peterson, E.E.; Sheldon, F.; Darnell, R.; Bunn, S.E.; Harch, B.D. A Comparison of Spatially Explicit Landscape Representation Methods and Their Relationship to Stream Condition. Freshw. Biol. 2011, 56, 590–610. [Google Scholar] [CrossRef]
  49. Shen, Z.; Zhang, Q.; Yue, C.; Zhao, J.; Hu, Z.; Lv, N.; Tang, Y. The Spatial Pattern of Land Use/Land Cover in the Water Supplying Area of the Middle- Route of the South-to-North Water Diversion (MR-SNWD) Project. Acta Geogr. Sin. 2006, 61, 633–644. [Google Scholar]
  50. Zhang, B.; Li, J.; Yuan, B.; Li, M.; Zhang, J.; Guo, M.; Liu, Z. Spatial-Temporal Characteristics and Driving Factors of Surface Water Quality in the Jing River Basin of the Loess Plateau. Water 2024, 16, 3326. [Google Scholar] [CrossRef]
  51. Luo, Z.; Shao, Q.; Zuo, Q.; Cui, Y. Impact of Land Use and Urbanization on River Water Quality and Ecology in a Dam Dominated Basin. J. Hydrol. 2020, 584, 124655. [Google Scholar] [CrossRef]
  52. Jiang, X.; Wang, L.; Ma, F.; Li, H.; Zhang, S.; Liang, X. Localization Method for SWAT Model Soil Database Based on HWSD. China Water Wastewater 2014, 30, 135–138. [Google Scholar] [CrossRef]
  53. Arya, M.S.; Biju, A.; Benchamin, D. Assessment of Spatial and Temporal Variations in Water Quality Using Multivariate Statistical Analysis in the Munroe Island, Kerala, India. Acta Ecol. Sin. 2023, 43, 751–763. [Google Scholar] [CrossRef]
  54. Yan, Z.; Li, P.; Li, Z.; Xu, Y.; Zhao, C.; Cui, Z. Effects of Land Use and Slope on Water Quality at Multi-Spatial Scales: A Case Study of the Weihe River Basin. Environ. Sci. Pollut. Res. 2023, 30, 57599–57616. [Google Scholar] [CrossRef]
  55. Pantelic, M.; Dolinaj, D.; Stankov, U.; Lescesen, I. Correlation Analysis of Impact of Natural Parameters on Water Quality of the River Danube near Novi Sad for the Period 2004–2011. Geogr. Pannonica 2013, 17, 74–78. [Google Scholar] [CrossRef]
  56. Nelson Mwaijengo, G.; Msigwa, A.; Njau, K.N.; Brendonck, L.; Vanschoenwinkel, B. Where Does Land Use Matter Most? Contrasting Land Use Effects on River Quality at Different Spatial Scales. Sci. Total Environ. 2020, 715, 134825. [Google Scholar] [CrossRef] [PubMed]
  57. Li, Y.; He, J.; Li, X. Hydrological and Meteorological Droughts in the Red River Basin of Yunnan Province Based on SPEI and SDI Indices. Prog. Geogr. 2016, 35, 758–767. [Google Scholar]
  58. Tao, H.; Zhou, J. Study on the Geographic Distribution and Influencing Factors of Dai Settlements in Yunnan Based on Geodetector. Sci. Rep. 2024, 14, 8948. [Google Scholar] [CrossRef] [PubMed]
  59. Yang, L.; He-Yang, Y.; Tang, H.; Chen, C.; He, K. Terrain Gradient Effect and Functional Zoning of Land Use Change in the Red River Basin of Yunnan Province. J. Yunnan Univ. Nat. Sci. 2024, 46, 276–287. [Google Scholar]
  60. Trinh, D.A.; Do, N.T.; Panizzo, V.N.; McGowan, S.; Salgado, J.; Large, A.R.G.; Henderson, A.C.G.; Vu, T.T. Anthropogenic Impacts on the Water Chemistry of a Transboundary River System in Southeast Asia. J. Asian Earth Sci. X 2024, 12, 100183. [Google Scholar] [CrossRef]
  61. Lei, C. Evaluating Coupled Influences of Slope Class and Land Use Change on Water Quality Using Single and Composite Indices in an Agricultural Basin. CATENA 2025, 248, 108584. [Google Scholar] [CrossRef]
  62. Zhang, Z.; Hou, L.; Qian, Y.; Wan, X. Effect of Zero Growth of Fertilizer Action on Ecological Efficiency of Grain Production in China under the Background of Carbon Emission Reduction. Sustainability 2022, 14, 15362. [Google Scholar] [CrossRef]
Figure 1. Locations of sampling sites in the Red River Basin.
Water 17 01968 g001
Figure 2. Spatial distribution of water quality parameters. Note: TEM, EC, and DO are water temperature, electrical conductivity, and dissolved oxygen, respectively. NH3-N, NO3-N, TN, and TP are ammonia nitrogen, nitrate nitrogen, total nitrogen, and total phosphorus, respectively. Chl-a, CODMn, and SS are chlorophyll-a, permanganate index, and suspended solids, respectively.
Water 17 01968 g002
Figure 3. Spatial distribution of natural factors. Note: ELEVA and SLOPE are elevation and slope, respectively. HSGA, HSGB, HSGC, and HSGD are hydrologic soil group A, hydrologic soil group B, hydrologic soil group C, and hydrologic soil group D, respectively. SOLAR and PRCP are solar radiation and precipitation, respectively.
Water 17 01968 g003
Figure 4. Correlation network diagram of land use, natural factors, and water quality parameters. Note: abs_r is Spearman’s correlation coefficient. Land use: 3PLAND and 7PLAND are grassland and urban area proportions of the landscape, respectively. 1PD, 2PD, 3PD, and 7PD represent cropland, forest, grassland, and urban area patch density, respectively. 1LPI, 3LPI, and 7LPI are the largest patch indices of cropland, grassland, and urban area, respectively. 7LSI is the urban area landscape shape index. 1AI and 7AI are the cropland and urban aggregation indices, respectively. 4FLOW and 7FLOW are the shrubland and urban hydrological distances, respectively. TA is the total landscape area. Natural factors: ELEVA and SLOPE are elevation and slope, respectively. HSGA, HSGB, HSGC, and HSGD are hydrologic soil group A, hydrologic soil group B, hydrologic soil group C, and hydrologic soil group D, respectively. SOLAR and PRCP are solar radiation and precipitation, respectively. Water quality: TEM and EC are water temperature and electrical conductivity, respectively. NH3-N, NO3-N, TN, and TP are ammonia nitrogen, nitrate nitrogen, total nitrogen, and total phosphorus, respectively. Chl-a, CODMn, and SS are chlorophyll-a, permanganate index, and suspended solids, respectively.
Water 17 01968 g004
Figure 5. Redundancy analysis ranking chart of land use, natural factors, and water quality. Note: Land use: 1PLAND, 3PLAND, and 7PLAND are cropland, grassland, and urban area proportions of the landscape, respectively. 1PD, 2PD, 3PD, and 7PD represent cropland, forest, grassland, and urban area patch density, respectively. 1LPI, 3LPI, and 7LPI are the largest patch indices of cropland, grassland, and urban area, respectively. 7LSI is the urban area landscape shape index. 1AI and 7AI are the cropland and urban aggregation indices, respectively. 4FLOW and 7FLOW are the shrubland and urban hydrological distances, respectively. TA is the total landscape area. Natural factors: ELEVA and SLOPE are elevation and slope, respectively. HSGA, HSGB, HSGC, and HSGD are hydrologic soil group A, hydrologic soil group B, hydrologic soil group C, and hydrologic soil group D, respectively. SOLAR and PRCP are solar radiation and precipitation, respectively. Water quality: TEM, EC, and DO are water temperature, electrical conductivity, and dissolved oxygen, respectively. NH3-N, NO3-N, TP, and TN are ammonia nitrogen, nitrate nitrogen, total phosphorus, and total nitrogen, respectively. Chl-a, CODMn, and SS are chlorophyll-a, permanganate index, and suspended solids, respectively.
Water 17 01968 g005
Figure 6. Venn diagram of variance interpretation rate (%) of water quality for land use and natural factors.
Water 17 01968 g006
Table 1. Soil types in the Red River Basin and the hydrological soil group division of the SCS model.
Hydrologic Soil GroupSoil TypesMinimum Infiltration Rate (mm/h)Permeability
AYellow-brown earth, dark-brown earth, meadow soil, dark felty soil>7.62Rapid
BHumid-thermo ferralitic3.81–7.62Quick
CPaddy soil1.27–3.81Moderate
DBrown earth, torrid red soil, limestone soil, purplish soil, lateritic red earth, red earth, yellow earth0.00–1.27Slow
Table 2. The best model of water quality parameters based on land use indices.
ParametersAdjusted R2pThe Best Stepwise Multiple Regression (MLR) ModelVIF
TEM0.425<0.001TEM = 25.132 + 1.229 × 7FLOW − 0.953 × 1LPI1.109
EC0.610<0.001EC = 348.131 + 78.351 × 3PLAND − 92.491 × 1AI + 68.779 × 7AI1.218
DO0.357<0.001DO = 7.330 − 0.768 × TA + 0.533 × 4FLOW + 0.133 × 7PD9.877
NH3-N0.340<0.001NH3-N = 0.434 + 0.158 × 3LPI + 0.136 × 1AI + 0.116 × 3PD1.024
NO3-N0.593<0.001NO3-N = 1.113 + 0.647 × 7PLAND + 0.247 × 1PD − 0.272 × 7LPI1.904
TP0.2610.001TP = 0.499 + 0.339 × 7PD − 0.284 × 1LPI1.053
TN0.0900.025TN = 1.748 + 0.336 × 3LPI1.000
CODMn0.2240.002CODMn = 4.893 + 5.767 × 7LSI3.436
SS0.2120.003SS = 0.884 − 0.017 × 1PLAND + 0.104 × 2PD1.163
Note: In the model, the log-transformed (log (x + 1)) and z-normalized values are the dependent and independent variables, respectively. TEM, EC, and DO are water temperature, electrical conductivity, and dissolved oxygen, respectively. NH3-N, NO3-N, TP, and TN are ammonia nitrogen, nitrate nitrogen, total phosphorus, and total nitrogen, respectively. CODMn and SS are the permanganate index and suspended solids, respectively. Land use: 1PLAND, 3PLAND, and 7PLAND are cropland, grassland, and urban area proportions of the landscape, respectively. 1PD, 2PD, 3PD, and 7PD represent cropland, forest, grassland, and urban area patch density, respectively. 1LPI, 3LPI, and 7LPI are the largest patch indices of cropland, grassland, and urban area, respectively. 7LSI is the urban area landscape shape index. 1AI and 7AI are the cropland and urban aggregation indices, respectively. 4FLOW and 7FLOW are the shrubland and urban hydrological distances, respectively. TA is the total landscape area.
Table 3. Basic statistical characteristics of water quality parameters.
Water Quality Parameter (Unit)MinimumMeanMedianMaxStandard DeviationCoefficient of Variation (%)
TEM (°C)19.4025.1324.8032.002.6110.40
EC (μs·cm−1)124348322945162.1646.58
DO (mg·L−1)5.9307.3307.3508.1800.516.96
NH3-N (mg·L−1)0.0920.4350.3671.8010.3069.69
NO3-N (mg·L−1)0.1211.1130.9233.5000.7567.67
TP (mg·L−1)0.0180.4990.1603.1560.71142.44
TN (mg·L−1)0.0931.7501.7543.6161.0057.10
Chl-a (μg·L−1)1.70414.2599.52183.15814.35100.66
CODMn (mg·L−1)0.6564.0603.03010.3612.4760.75
SS (g·L−1)0.0030.5530.3241.9720.59106.47
Note: Coefficient of variation > 100% is highlighted in bold. TEM, EC, and DO are water temperature, electrical conductivity, and dissolved oxygen, respectively. NH3-N, NO3-N, TP, and TN are ammonia nitrogen, nitrate nitrogen, total phosphorus, and total nitrogen, respectively. Chl-a, CODMn, and SS are chlorophyll-a, permanganate index, and suspended solids, respectively.
Table 4. Basic statistical characteristics of land use and natural factors.
Indicator (Unit)MinimumMeanMedianMaxStandard DeviationCoefficient of Variation (%)
1PLAND (%)8.71029.08630.75947.99210.1534.91
3PLAND (%)0.0908.4308.08527.8735.9570.30
7PLAND (%)0.00020.8300.6093.1100.7185.59
1PD (n/km2)0.0980.3760.3710.7720.1436.57
2PD (n/km2)0.3042.9452.9516.9821.6556.13
3PD (n/km2)0.4275.6696.09710.0361.9935.02
7PD (n/km2)0.0000.0540.0460.1970.0479.73
1LPI (%)0.55710.3016.96144.14810.86105.44
3LPI (%)0.0070.6700.2736.4721.15170.95
7LPI (%)0.00020.1740.1120.8840.19109.50
7LSI1.00015.1699.45661.01913.6089.68
1AI (%)88.52092.24892.16996.2711.741.89
7AI (%)81.29088.84489.36294.4493.263.67
4FLOW (m)679470,53949,312412,22670,401.2299.81
7FLOW (m)597877,05554,129390,40377,545.25100.64
TA (ha)6461329,285144,1583,220,281576,299.70175.02
ELEVA (m)1205.1401739.9001762.6592149.317222.1612.77
SLOPE (°)14.38022.44622.83528.1452.7312.15
HSGA (%)0.0006.9724.04428.8697.28104.45
HSGB (%)0.0000.5780.0009.9801.88325.83
HSGC (%)0.0004.1053.83117.8113.0073.17
HSGD (%)69.89188.34590.59599.2457.198.14
SOLAR (WH/m2)523,705565,054566,955593,70716,589.792.94
PRCP (mm)202.533350.580323.436547.41284.8624.20
Note: Coefficient of variation > 100% is highlighted in bold. Land use: 1PLAND, 3PLAND, and 7PLAND are cropland, grassland, and urban area proportions of the landscape, respectively. 1PD, 2PD, 3PD, and 7PD represent cropland, forest, grassland, and urban area patch density, respectively. 1LPI, 3LPI, and 7LPI are the largest patch indices of cropland, grassland, and urban area, respectively. 7LSI is the urban area landscape shape index. 1AI and 7AI are the cropland and urban aggregation indices, respectively. 4FLOW and 7FLOW are the shrubland and urban hydrological distances, respectively. TA is the total landscape area. Natural factors: ELEVA and SLOPE are elevation and slope, respectively. HSGA, HSGB, HSGC, and HSGD are hydrologic soil group A, hydrologic soil group B, hydrologic soil group C, and hydrologic soil group D, respectively. SOLAR and PRCP are solar radiation and precipitation, respectively.
Table 5. Redundancy analysis of land use, natural factors, and water quality.
Explanatory VariableVariance Explained Rate (%)RDA Statistic
Pseudo-Fp-Value
All the indicatorsAxis120.90.20.020 *
Axis218.50.30.002 **
All sorting axes69.82.10.002 **
Indicator groupLand use indicator56.82.30.002 **
Natural factor32.72.60.002 **
Indicator categoryComposition17.93.00.002 **
Configuration51.42.50.002 **
Topography18.04.60.002 **
Soil12.62.00.006 **
Meteorology14.73.60.002 **
Note: * p < 0.05, ** p < 0.01.
Table 6. The best model of water quality parameters based on land use and natural factors.
ResponseAdjusted R2pThe Best Stepwise Multiple Regression (MLR) ModelVIF
TEM0.651<0.001TEM = 3.258 + 0.015 × 7FLOW − 0.072 × SOLAR − 0.066 × PRCP − 0.066 × 4FLOW − 0.03 × 1PD8.483
EC0.651<0.001EC = 5.755 − 0.173 × PRCP + 0.132 × 7PLAND + 0.127 × 1PD − 0.113 × HSGA1.496
DO0.395<0.001DO = 4.668 − 0.15 × TA + 0.10 × 4FLOW + 0.024 × 7PD9.877
NH3-N0.1810.002NH3-N = 0.343 + 0.082 × 3LPI1.000
NO3-N0.536<0.001NO3-N = 0.688 + 0.193 × 7PLAND + 0.155 × 1PD1.009
TP0.386<0.001TP = 0.327 + 0.204 × ELEVA − 0.117 × 1LPI1.000
TN0.0870.027TN = 0.936 + 0.134 × 1PD1.000
Chl-a0.1430.015Chl-a = 2.561 + 0.334 × SLOPE + 0.265 × ELEVA1.026
CODMn0.1370.007CODMn = 1.561 + 0.227 × ELEVA1.000
SS0.301<0.001SS = 0.379 + 0.139 × ELEVA − 0.132 × 1PLAND1.003
Note: The most significant variables (maximum regression coefficient) are shown in bold. In the model, the log-transformed (log (x + 1)) and z-normalized values are the dependent and independent variables, respectively. TEM, EC, and DO are water temperature, electrical conductivity, and dissolved oxygen, respectively. NH3-N, NO3-N, TP, and TN are ammonia nitrogen, nitrate nitrogen, total phosphorus, and total nitrogen, respectively. Chl-a, CODMn, and SS are chlorophyll-a, permanganate index, and suspended solids, respectively. Land use: 1PLAND, 3PLAND, and 7PLAND are cropland, grassland, and urban area proportions of the landscape, respectively. 1PD, 2PD, 3PD, and 7PD represent cropland, forest, grassland, and urban area patch density, respectively. 1LPI, 3LPI, and 7LPI are the largest patch indices of cropland, grassland, and urban area, respectively. 7LSI is the urban area landscape shape index. 1AI and 7AI are the cropland and urban aggregation indices, respectively. 4FLOW and 7FLOW are the shrubland and urban hydrological distances, respectively. TA is the total landscape area. Natural factors: ELEVA and SLOPE are elevation and slope, respectively. HSGA, HSGB, HSGC, and HSGD are hydrologic soil group A, hydrologic soil group B, hydrologic soil group C, and hydrologic soil group D, respectively. SOLAR and PRCP are solar radiation and precipitation, respectively.
Disclaimer/Publisher’s Note: The statements, opinions and data contained in all publications are solely those of the individual author(s) and contributor(s) and not of MDPI and/or the editor(s). MDPI and/or the editor(s) disclaim responsibility for any injury to people or property resulting from any ideas, methods, instructions or products referred to in the content.

