Article

Mechanistic Analysis of the Impact of Farmers’ Livelihood Transformation on the Ecological Efficiency of Agricultural Water Use in Arid Areas Based on the SES Framework

1
College of Economics and Management, Xinjiang Agricultural University, Urumqi 830052, China
2
Border Development and Security Governance Research Institute, Shihezi University, Shihezi 832000, China
3
College of Marxism, Shihezi University, Shihezi 832000, China
4
College of Science, Shihezi University, Shihezi 832000, China
*
Author to whom correspondence should be addressed.
Water 2025, 17(13), 1962; https://doi.org/10.3390/w17131962
Submission received: 16 May 2025 / Revised: 26 June 2025 / Accepted: 28 June 2025 / Published: 30 June 2025
(This article belongs to the Section Water Use and Scarcity)

Abstract

Water resources have become a critical factor limiting agricultural development and ecological health in arid regions. The ecological efficiency of agricultural water use (EEAWU) serves as an indicator of the sustainable utilization of agricultural water resources, taking into account both economic output and environmental impact. This paper, grounded in the social–ecological system (SES) framework, integrates multidimensional variables related to social behavior, economic decision-making, and ecological constraints to construct an analytical system that examines the impact mechanism of farmers’ part-time employment on the EEAWU. Utilizing survey data from 448 farmers in the western Tarim River Basin, and employing the super-efficiency SBM model alongside Tobit regression for empirical analysis, the study reveals the following findings: (1) the degree of farmers’ part-time employment is significantly negatively correlated with EEAWU (β = −0.041, p < 0.05); (2) as the extent of part-time employment increases, farmers adversely affect EEAWU by altering agricultural labor allocation, adjusting crop structures, and inadequately adopting water-saving measures; (3) farm size plays a negative moderating role in the relationship between farmers’ part-time engagement and the EEAWU, where scale expansion can alleviate the EEAWU losses associated with part-time employment through cost-sharing and factor substitution mechanisms. Based on these findings, it is recommended to enhance the land transfer mechanism, promote agricultural social services, implement tiered water pricing and water-saving subsidy policies, optimize crop structures, and strengthen environmental regulations to improve EEAWU in arid regions.

1. Introduction

The Tarim River Basin, with a temperate continental climate, is located in the arid northwest China. Due to frequent drought and little rainfall, water resources in the Tarim River Basin are extremely scarce, leading to the formation of a fragile environment. Agriculture has the largest proportion in the local industrial structure, and agricultural water consumption has long occupied the vast majority of the total water consumption in the basin (about 90%) [1]. However, some studies have shown that the efficiency level of agricultural water has been low [2]. Moreover, many farmers apply pesticides and fertilizers excessively to increase crop yield in agricultural production [3,4]. The fertilizer that is not fully absorbed by crops is easy to lose through irrigation water into groundwater or surface water, which damages the water ecological environment of the basin. Additionally, under conditions of limited water resources, substantial agricultural water use has encroached upon the allocation of water for natural ecosystems in the basin [5]. This encroachment significantly constrains and impacts the sustainable development of both socio-economic and ecological environments in the Tarim River Basin. Therefore, enhancing agricultural water use efficiency within environmental constraints is a crucial strategy to alleviate the conflict between water supply and demand in the basin and to achieve sustainable development of agricultural, economic, and environmental benefits.
A large number of studies have been conducted on the evaluation of water use efficiency in agriculture [6,7] and industry [8,9] at home and abroad, but the previous measurements of water use efficiency is limited to the economic efficiency of water resources. Undesired outputs related to water use efficiency and environmental considerations are rarely included in efficiency calculations. Nanere et al. [10] and Chen et al. [11] pointed out that not considering or failing to correctly consider environmental factors when measuring production efficiency yielded a biased estimate. Liu et al. [12] reported that the agricultural water use efficiency calculated by incorporating undesired outputs was more in line with the actual level. A system that incorporates undesirable outputs such as agricultural non-point source pollution into the measurement of agricultural water use efficiency is commonly referred to as the ecological efficiency of agricultural water use (EEAWU) [13]. The EEAWU essentially refers to the ratio between economic growth and environmental impact in the utilization of agricultural water resources. Its output indicators encompass not only economic benefits but also environmental advantages, specifically reflecting a model of sustainable agricultural development that maximizes agricultural output while optimizing water resource use and minimizing water pollution [14]. Consequently, the less water pollution generated during the agricultural production process, the higher the EEAWU [15]. The gray water footprint is an effective method for assessing water pollution. It quantifies the amount of freshwater needed to dilute pollutants in water bodies to meet environmental water quality standards or natural background concentrations, thereby evaluating water pollution from a water quantity perspective. The agricultural gray water footprint specifically assesses the impact of pollutants such as nitrogen and phosphorus generated during agricultural production on the ecological environment of surface or groundwater. Compared to agricultural non-point source pollution, the agricultural gray water footprint more accurately reflects the state of water pollution in agricultural production, making it more theoretically significant and practically valuable [14].
The key to achieving the agricultural production goal of “efficient water use and low pollution” lies in farmers’ behavioral decisions regarding the adoption of water-saving irrigation techniques and the precise application of fertilizers. These production decisions can influence the EEAWU by altering water resource allocation and emissions of water pollution. However, existing research primarily focuses on the macrolevel assessment of agricultural water use efficiency in the Tarim River Basin or on the allocation and evaluation of agricultural water resources at the regional scale [3,5,16,17]. There remains a pressing need for in-depth exploration of how farmers’ behaviors influence agricultural water use efficiency from a microlevel perspective.
With the accelerated urbanization and industrialization, the livelihood patterns of farmers have commenced to transform. For example, part-time farmers have emerged as an inevitable trend in the agricultural development across various countries [18]. In rural areas, the proportion of full-time farmers has declined, while the proportion of part-time farmers has increased [19]. Part-time farming not only brings about changes in rural society and economy, but also brings about changes the resource allocation of farmers in agricultural production, which has a profound impact on the coordinated development of rural economy, society, and ecology. Agricultural water irrigation and fertilizer application are essential in farming. In the Tarim River Basin, dominated by irrigated agriculture, farmers have switched from full-time to part-time farming. Whether this shift affects the EEAWU and how merits further discussion. The actions and decision-making processes of part-time farmers extend beyond mere economic considerations; they are influenced by a complex interplay of various factors, encompassing social, cultural, and ecological dimensions. Consequently, the impact of farmers’ part-time activities on water resource utilization should be analyzed within the context of the social–ecological interaction system. The social–ecological system (SES) theoretical framework proposed by Elinor Ostrom offers a comprehensive and multidimensional perspective for analyzing this complex mechanism [20]. The SES framework is predominantly employed to examine and comprehend issues pertaining to social behavior, the management of public affairs, and the sustainable utilization of public resources. This framework underscores the interconnectedness of social and ecological systems, integrating essential variables such as resource systems, governance structures, resource units, and user interactions to clarify the mechanisms through which human behavior influences the natural environment. The EEAWU serves as a comprehensive indicator for measuring the economic and ecological benefits of agricultural water resources, reflecting both the demands of economic development and the requirements for ecological sustainability. Given that agricultural water resources represent a quintessential public pool resource, their utilization is shaped by the interplay of various factors, including resource systems, governance frameworks, and user behaviors within the SES paradigm. Consequently, the integration of part-time agricultural labor into the SES framework analysis can systematically elucidate its impact pathways on the EEAWU, considering the dimensions of social behavior, economic decision-making, and ecological limitations.
Some scholars have analyzed the EEAWU in the Tarim River Basin based on the Sustainable Development Goals (SDGs) framework [13]. Although the SDGs framework proposes macrolevel goals such as improving water use efficiency, it does not provide specific analytical tools, making it particularly difficult to integrate the interactions among social, economic, and ecological subsystems. In contrast, the SES framework, by integrating multilevel core variables, can systematically analyze the interactions and feedback mechanisms between these subsystems, thereby more effectively revealing the key driving factors and coupling processes that affect the EEAWU. Therefore, the SES framework provides a more suitable analytical tool for a deeper understanding of the complex mechanisms of the EEAWU in the Tarim River Basin. Existing research has found that water-saving irrigation technology [13], agricultural crop structure [12], and excessive use of fertilizers all have significant impacts on agricultural ecological efficiency [21]. Part-time farmers, based on cost and benefit trade-offs, will optimize or adjust the resource allocation methods in agricultural production, such as adjusting labor resource distribution [22], changing crop structures [23], substituting production factors [24], and deciding whether to adopt water-saving irrigation production technologies [25]. These adjustments in resource allocation can affect the improvement in agricultural irrigation efficiency or water pollution control. This dynamic mechanism of “farmer behavior decision-making–resource allocation adjustment–ecological environment feedback” is precisely the core analytical focus of the SES framework.
From 1970 to 2020, the cultivated land area in the upper and middle reaches of the Tarim River Basin significantly increased, with a growth rate far exceeding that of the downstream areas [26]. Additionally, regions within the basin that have high agricultural water consumption are also concentrated in the west (upper and middle reaches). Based on this characteristic, this study constructs a non-desired output indicator system that includes agricultural gray water footprint (the EEAWU) using survey data from 448 households in the western basin acquired during 2022. It also introduces the SES framework to integrate multidimensional variables of social behavior, economic decision-making, and ecological constraints, systematically analyzing how farmers’ mixed-income behaviors influence the interactions among the “social–economic–ecological” subsystems and affect the EEAWU. This study breaks through the limitations of traditional research that analyzes from a single economic or ecological dimension, conducting a systematic analysis from social, economic, and ecological multidimensions, and provides a multidimensional assessment framework based on a microperspective for the sustainable use of water resources in arid regions.

2. Theoretical Analysis

2.1. Social–Ecological System (SES)

The SES applies interdisciplinary knowledge from ecology, economics, sociology, and political science to the analysis of the complex relationship between social systems and ecosystems, providing a detailed interdisciplinary common language for describing and systematically diagnosing human society [27]. The core variable of this study is that the EEAWU is consistent with the connotation of the framework, that is, different from traditional economic efficiency, the EEAWU is a composite concept with economic, social, and ecological connotations. The SES framework consists of multilevel variables, each of which can be further divided into several variables. Therefore, it is able to describe in detail various aspects of socio-ecological systems. In the first level, the four systems, namely the resource system (RS), the resource unit (RU), the governance system (GS), and the actor (A), jointly affect the interaction (I) and the outcome of collective action (O) in a certain scenario. Further, the interaction and interaction results among all variables are also affected by two subsystems representing the overall environment, namely the social, economic, and political background (S) and the related ecosystem factors (ECO) (Figure 1).

2.2. Analysis of the Mechanism of Part-Time Farming (S2-a) on the Ecological Efficiency of Agricultural Water Use (O1 and O2-a)

Labor-force transfer and the weakening of human capital hinder the adoption of water-saving technologies. Water-saving irrigation technologies, by precisely controlling the amount and timing of irrigation water, not only improve irrigation water efficiency but also help retain soil nutrients [28]. This technology reduces the usage and runoff of chemical fertilizers and pesticides, potentially increasing the utilization rate of nitrogen fertilizers by 3% to 5% [29], thereby achieving the dual benefits of reduced agricultural production costs and decreased environmental pollution. However, part-time farmers face obstacles such as constraints in human capital and economic rationality trade-offs when deciding whether to adopt water-saving technologies or change irrigation methods. The increase in non-agricultural employment opportunities has led to the loss of young agricultural labor, resulting in an aging trend among agricultural workers. Compared to middle-aged and young agricultural laborers, older workers have diminished cognitive abilities, a reduced willingness to learn new technologies, and lower risk-taking capacities. As a result, agricultural production tends to rely on previous planting experiences, leading to a lower adoption rate of production technologies such as water-saving irrigation [30]. As the degree of part-time farming deepens, farmers increasingly depend on non-agricultural income, directing more energy toward non-agricultural employment, which is relatively more economically beneficial. This shift may lead to a more extensive approach to agricultural irrigation, and their perception of agricultural water resource shortages diminishes, further suppressing the motivation to adopt water-saving technologies. Additionally, the insufficient supply of effective agricultural labor caused by part-time farming makes it difficult for farmers to invest enough effort in meticulous field management, including timely maintenance and optimization of irrigation systems. The rough irrigation management and insufficient adoption of water-saving technologies by part-time farmers limit the improvement in irrigation water efficiency, becoming a significant source of losses in the EEAWU.
The strategy of factor substitution exacerbates agricultural water pollution. In the face of labor loss caused by part-time farming and the risk-averse nature of smallholder production [31], part-time farmers tend to adopt a “capital substituting labor” strategy to maintain expected yields and ensure stable income [32]. According to the theory of induced technological change, rational smallholders will choose to increase inputs of easily accessible and short-term effective agricultural materials such as fertilizers and pesticides to compensate for the lack of labor [32]. This phenomenon is particularly pronounced in the cultivation of land-intensive crops like grains [33]. However, this strategy often leads to the excessive application of fertilizers and pesticides. In arid irrigated agricultural areas, the excess fertilizers and pesticides that are not fully absorbed by crops can easily enter water bodies through surface runoff, soil leaching, or seepage, resulting in water pollution. The deepening of part-time farming, especially the excessive use of fertilizers due to factor substitution, significantly increases the gray water footprint of agricultural production and is a key environmental factor in inhibiting the EEAWU.
The trend toward “grain-oriented” crop structure reduces resource utilization efficiency. Part-time farmers consider multiple factors when adjusting their crop structure, including the availability of labor time [23], fluctuations in crop market prices, and their risk tolerance. Based on the scarcity of agricultural labor time and a preference for stable income, part-time farmers exhibit a “grain-oriented” crop structure. They tend to reduce the cultivation of labor-intensive economic crops like cotton, which have relatively high market risks but also high added value, and instead increase the proportion of planting staple crops like wheat and corn, which require less labor, are easier to manage, have relatively stable yields, and are strongly supported by policies. However, the transformation of the crop structure impacts resource utilization efficiency. For staple crops with lower added value and relatively stable yields, farmers tend to adopt traditional irrigation techniques that require lower cost inputs. These traditional irrigation methods have relatively low water use efficiency and are not conducive to implementing precise fertilization, leading to fertilizer loss and water pollution.
The aforementioned pathways do not operate in isolation but interact within the SES framework: part-time farming alters the characteristics and resource utilization behavior decisions of core actors (A)—farmers. These behavioral decisions affect resource units (RU) and, under given resource system (RS) conditions and governance system (GS) environments, collectively determine the comprehensive ecological economic performance regarding the EEAWU.

2.3. Moderating Effect of Farm Size (RU5-a) on the Relationship Between EEAWU (O1 and O2-a) and Part-Time Farming (S2-a)

Arable land is the fundamental material condition for agricultural production, and its scale affects the agricultural income of farming households. Therefore, there are differences in the input of agricultural production factors and technology choices among farmers with different farm sizes. This difference essentially reflects the interaction of “actor characteristics–resource unit attributes” in the SES framework. The expansion of farm size, as an optimization of resource units, can alleviate through various mechanisms the issues of extensive irrigation and excessive fertilizer use caused by part-time farming.
First, there is the cost-sharing effect. From a cost–benefit perspective, large-scale farmers benefit from economies of scale, making the reduction in fertilizer use or the promotion of water-saving irrigation technologies more effective in lowering production input costs [34]. This also facilitates specialization and refinement in the agricultural production process. Therefore, larger-scale farmers are more inclined to adopt water-saving technologies and reduce fertilizer use to lower production costs in order to enhance agricultural economic benefits. Secondly, regarding factor substitution and management optimization, large-scale farmers are better able to comprehensively weigh their capital investment capabilities and resource allocation efficiency compared to small-scale farmers. They can scientifically arrange various production factors to achieve an optimal combination of resources, which makes it more likely for them to reduce the use of fertilizers and pesticides, thereby lowering the risk of agricultural water pollution. Research by Wu et al. found that for every 1% increase in farm size, the use of fertilizers and pesticides per hectare significantly decreases by 0.3% and 0.5% [35]. Finally, there is the motivation for long-term benefits and green production. Diversified income can alleviate the financial constraints on farmers regarding the input of agricultural production factors, enabling them to adopt better resource allocation strategies [24]. The expansion of farm size increases the potential agricultural income for farmers. To avoid resource depletion caused by short-term behaviors, large-scale diversified farmers are more willing to invest in water-saving equipment, hire professional labor, or adopt green production services to enhance resource utilization efficiency and long-term sustainability. In contrast, small-scale part-time farmers invest more energy in non-agricultural work, and agricultural production relies more on traditional experience, which can lead to excessive fertilization. Therefore, farm size (RU5-a) plays a negative moderating role in the relationship between part-time farming (S2-a) and the EEAWU, meaning that expanding the farm size can mitigate the losses brought by part-time farming to the EEAWU. The core mechanism behind this is the cost-sharing effect, the feasibility of factor substitution, and the pursuit of long-term benefits.
Based on the above analysis, this study explains the impact mechanism of part-time farmers on the EEAWU (Figure 2) and proposes the following research hypotheses:
Hypothesis 1 (H1). 
The extent of part-time job engagement has a significant negative impact on the EEAWU.
Hypothesis 2 (H2). 
Farm size plays a moderating role in the relationship between the extent of part-time job engagement and the EEAWU, which is stronger for farmers with extensive part-time job engagement.
Figure 2. Mechanism diagram of the effect of part-time farmers on the EEAWU.
Water 17 01962 g002

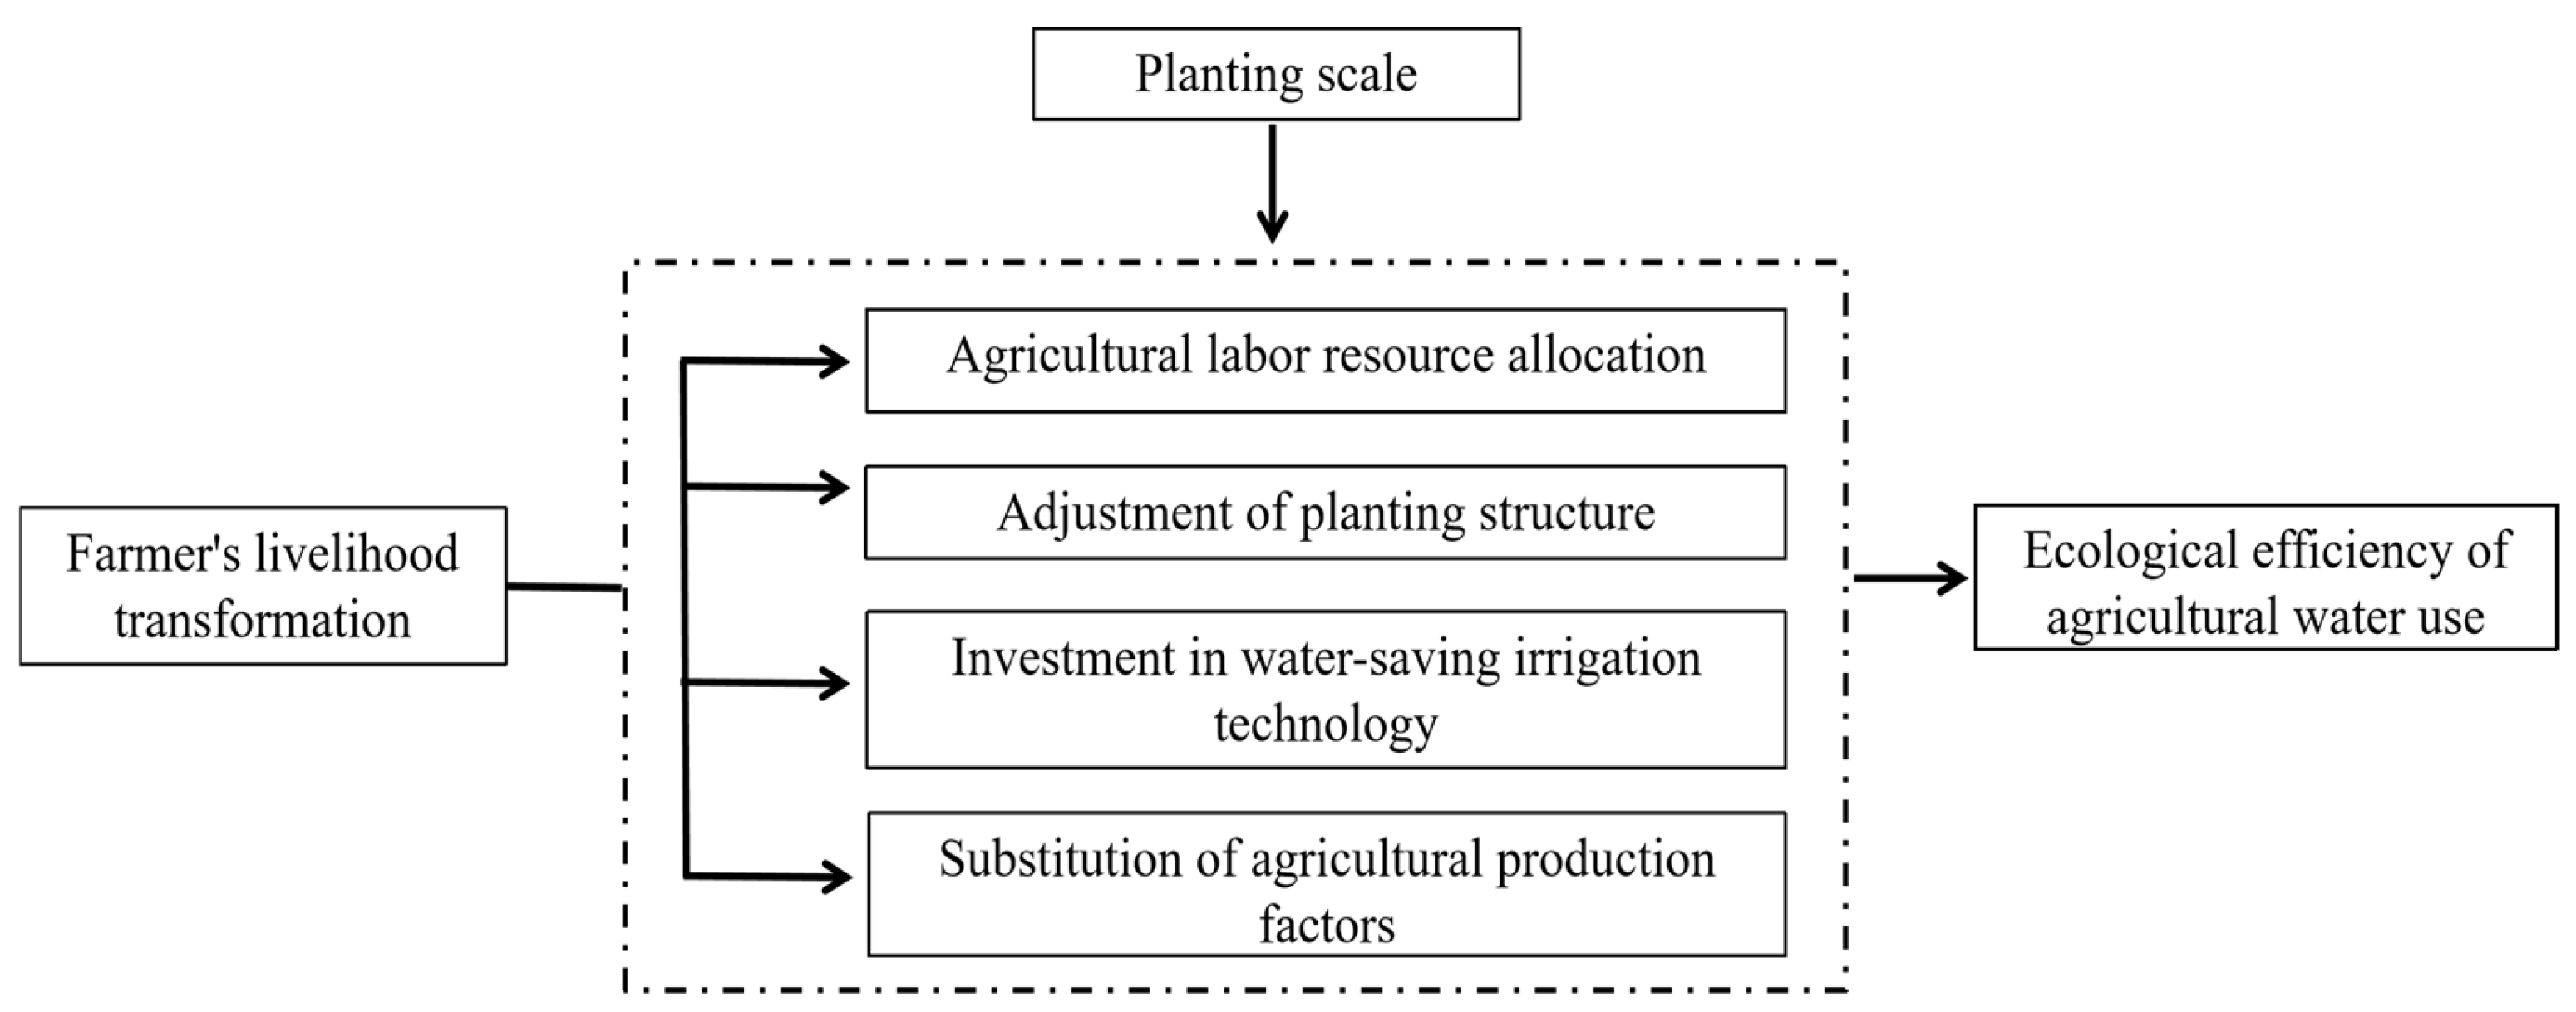
2.4. Construction of an SES Analysis Framework for the Analysis of the Impact of Part-Time Farming on the Ecological Efficiency of Agricultural Water Use (EEAWU)

Based on this theoretical analysis of the impact of part-time farming on the EEAWU, an SES analysis framework is constructed to systematically analyze the complex relationships among various factors. In the SES framework, part-time farming can reflect the dependence of farmers on agricultural production and agricultural water resources, and indirectly reflect the trend in rural labor migration. Therefore, part-time farming (S2-a) can be used as a situational variable and included in the demographic trend subsystem of the social, economic, and political background (S). The EEAWU is the result of the interaction of multiple variables. It is a variable for the social performance (O1) and ecological performance (O2) in interaction (I) and outcome (O).
Farmers are key actors in agricultural production (A), and their characteristics can have a direct impact on the EEAWU. The increase in a farmer’s age can affect their agricultural production experience, physical strength, and willingness and ability to learn new technologies, which in turn influences the adoption of water-saving technologies and the precision of field management, ultimately affecting irrigation efficiency and water pollution control. The health status of the household head directly impacts their ability to invest labor and manage resources, limiting their application of water-saving measures and the implementation of precise fertilization, which affects the EEAWU. Therefore, the age of the household head (A2-a) and the health status of the household head (A2-b) are chosen to represent the socio-economic attributes of the actor (A). The crop structure reflects the resource utilization history and experience (A3) formed by the actor (A) based on practice. Different planting choices not only reflect farmers’ expectations for agricultural income but also directly drive their decisions on the adoption of water-saving measures and the input of fertilizers and pesticides, ultimately impacting the EEAWU. Based on the agricultural planting situation in the research area and relevant literature [36], the proportions of economic crops (e.g., cotton) and food crops (e.g., wheat and corn) in the total cultivated area are chosen to represent the crop structure. The adoption of water-saving irrigation technology is an effective means to alleviate the pressure on agricultural water resources in arid and semi-arid regions. The decision to adopt such technology reflects the resource utilization experience and technical knowledge level accumulated by the user (A) under specific conditions. The use of water-saving technology can significantly improve water resource utilization efficiency, reduce fertilizer loss through its fertilization effect, and lower the agricultural gray water footprint, making it a core driving factor for enhancing the EEAWU. Therefore, this study considers whether to adopt agricultural water-saving measures (A3-a), the proportion of food crops (A3-b), and the proportion of economic crops (A3-c) as the third-level variables of the user’s resource utilization history and experience (A3).
Arable land is a key resource element unit (RU) in agricultural production. The expansion of arable land scale can easily create scale effects by reducing the cost of technology adoption per unit area, promoting specialized management, and enhancing long-term investment willingness, such as adopting water-saving facilities and green technologies to improve irrigation efficiency and reduce fertilizer abuse. The number of arable land plots can reflect its distribution and aggregation, which may affect the uniform application and precise management of water-saving technology. This analysis considers the number of arable land plots (RU6-a) and arable land scale (RU5-a) as third-level variables in terms of resource units (RU). The resource system (RS) in this study refers to the agricultural water resource system and its related characteristics. Farmers’ perception of the degree of agricultural water scarcity can indirectly reflect the abundance or shortage of local water resources, which is an important manifestation of the core attributes of the resource system. At the same time, the degree of farmers’ perception of water scarcity will influence their agricultural water use decisions. Farmers with a high level of perception are more inclined to conserve water and adopt water-saving technologies. This behavioral change can effectively enhance irrigation water efficiency, thereby making a positive contribution to the EEAWU. Therefore, the perception of irrigation water scarcity (RS3-a) is considered a tertiary variable in the resource system (RS). The governance system (GS) refers to the institutional arrangements and organizational effectiveness that influence the acquisition, use, and management of agricultural water resources. The convenience of irrigation can reflect the operational maintenance level and management efficiency of local irrigation infrastructure. Convenient irrigation conditions can reduce the irrigation management costs and time investment for farmers, thereby improving irrigation efficiency and potentially indirectly reducing fertilizer runoff pollution caused by excessive irrigation. Ultimately, this positively promotes EEAWU, which is why the convenience of irrigation (GS1-a) is included as a tertiary variable in the management system (GS) (Table 1).

3. Materials and Methods

3.1. Data Sources

This study measured the EEAWU of farmers in the Tarim River Basin from a microscopic perspective, and the data primarily originates from a survey conducted by the research team in January 2022, targeting farmers in the Aksu region, Hotan region, Kizilsu Kirghiz Autonomous Prefecture, and Kashgar region, all located in the western part of the Tarim River Basin. The survey locations were mainly concentrated in the upper and middle reaches of the basin. Stratified sampling and random sampling were combined for sampling. In each county of the four regions, a number of towns were randomly selected, and two communities were randomly selected as research subjects in each town. Finally, 15–20 farming households were randomly selected in each community selected for investigation. The research encompasses farmers’ and villages’ basic circumstances, livelihood capital, family income, input of agricultural production factors, as well as irrigation and water conservancy. To ensure the validity of the questionnaire data, the research team opted to collect data through one-on-one, face-to-face interviews. A total of 465 questionnaires were collected. After excluding responses from non-farming households and those with significant missing or incomplete information, 448 valid questionnaires remained, resulting in a response rate of 96.3%.

3.2. Methods for the EEAWU Measurement

Crop farming is the foundation of agricultural development and the key for the green development of agriculture. Therefore, this study measured the EEAWU from the perspective of crop farming, a narrow sense of agriculture.
At present, the widely used efficiency measurement methods in academia include non-parametric methods such as data envelopment analysis (DEA) and parametric methods such as stochastic frontier analysis (SFA). Compared to the SFA, DEA does not require the specification of a functional form, which helps avoid biases caused by the subjective choice of function form [12,30]. It is more suitable for multi-input, multi-output models that include undesirable outputs. The SBM model proposed by Tone in 2001 is a non-radial, non-angular efficiency measurement method based on slack variables [37]. This model overcomes the limitations of traditional DEA models that ignore slack variables in input–output analysis. The efficiency values measured by the SBM model are all less than or equal to 1 [4], which cannot identify differences among farmers located on the EEAWU efficient frontier. The super-efficiency SBM model proposed by Tone in 2002 not only considers undesirable outputs but also addresses the slack issue of input–output variables [38]. The efficiency values measured by this model are not limited to the range of 0–1, allowing for comparison and differentiation of effective decision-making units on the frontier, thus enabling a more accurate ranking of efficient farmers in agricultural ecological water use [12]. Since this study views the agricultural gray water footprint as an undesirable output of agricultural ecological water use, the super-efficiency SBM model that includes undesirable outputs is chosen for analysis. This model not only avoids the problem of overestimating efficiency due to neglecting environmental negative impacts but also effectively reflects the dual objectives of “economy–environment” in agricultural production. Furthermore, this model is an effective tool for calculating ecological efficiency and has been widely applied in the assessment of ecological efficiency [12,39].
In this study, the EEAWU of farmers was measured by the super-efficiency SBM model. The farmers in the sample set were all regarded as an independent decision-making unit (DMU). The super-efficiency SBM model was established as follows:
Min ρ = 1 1 K k = 1 K s k / x k d 1 + 1 N + M M = 1 N s n + / y n d + m = 1 M s m / u m d
s . t . x k d = j = 1 j λ j x k j + s k , k = 1 , 2 , , K
y n d = j = 1 j λ j y n j s n + ,       n = 1,2 , N
u m d = j = 1 j λ i u m j + s m , m = 1 , 2 , , M
λ j 0 , s k 0 , s n + 0 , s m 0 , j = 1 , 2 , , n
where ρ, K, N, and M are the ecological efficiency of agricultural water use, the number of inputs, the number of expected outputs, and the number of undesired outputs of DMU, respectively; s k ,   s n + , and s m are the amount of relaxation in input indicators, expected outputs, and undesired outputs, respectively; x k d ,   y n d , and u m d are the output of input indicators, expected outputs, and undesired outputs, respectively; x k j ,   y n j , and u m j are the kth input, the nth expected output, and the mth undesired output of the jth farmer, respectively; and λ is the weight coefficient of the decision unit. When ρ is smaller than 1, the EEAWU is low and needs to be improved. When ρ is greater than or equal to 1, the EEAWU is at a satisfactory level.

3.3. Evaluation Indexes for the EEAWU

According to the actual agricultural production activities and related literature, in addition to the irrigation water consumption, the arable land rental, seed costs, chemical fertilizer and pesticide costs, machine service costs, and labor costs were selected as the inputs of agricultural production. Due to the diversity of agricultural products produced by farmers, the total agricultural output value is representative of agricultural economic benefits. Therefore, the total output value of planting was chosen as the desired output indicator (Table 2).
The gray water footprint of agriculture includes the gray water footprint of crop farming and the gray water footprint of animal husbandry. This study discussed agriculture in the narrow sense; that is, the gray water footprint of crop farming was regarded as an undesirable output. Nitrogen fertilizers account for a high proportion of chemical fertilizer usage and have the largest share in water pollution. Therefore, some scholars calculated the agricultural gray water footprint index using the nitrogen leaching rate [14,21,40]. Because crops are mainly drip-irrigated due to the scarce precipitation in the Tarim River Basin, nitrogen fertilizer application commonly causes groundwater pollution. According to the relevant research results [40], the fertilizer nitrogen leaching rate was 10%. Based on the method of Hoekstrad et al. [41], the calculation formula for the gray water footprint index was as follows:
W F p l a g r a y = a × A p p l c m a x c n a t
where WFpla-gray represents the gray water footprint of crop farming (m3); a is the fertilizer nitrogen leaching rate (%); Appl is the nitrogen fertilizer application rate for a unit area (kg); cmax is the maximum allowable concentration of pollutants in the receiving water body (kg/m3), with a limit of no more than 10 mg of nitrogen per liter of drinking water (thus cmax is set at 0.01 kg/m3); and cnat is the natural background concentration of pollutants in the receiving water body (kg/m3), assuming the concentration of nitrogen in natural water bodies is 0, so cnat is set at 0 kg/m3.

3.4. Variable Selection and Modeling

3.4.1. Variable Selection

The EEAWU calculated by the super-efficiency SBM model was used as the explained variable.
This study mainly describes the influence of farmers’ part-time employment on the EEAWU, so the engagement degree and type of farmers’ part-time employment were used as core explanatory variables. According to the method of scholars [30,42], farmers whose non-farm income accounted for 10% or less of the total household income were defined as full-time farmers, and 1 was assigned to them. Farmers whose non-farm income accounted for 10~50% were defined as Type I part-time farmers, and 2 was assigned to them. Farmers whose non-farm income accounted for more than 50% were defined as Type II part-time farmers, and 3 was assigned to them. To deeply analyze the influence of part-time farmers on the EEAWU, based on relevant literature and the classification of part-time farmers [30], Type I and Type II part-time farmers were further divided into self-employed part-time farmers and employed part-time farmers. Self-employed part-time farmers refer to those whose individual operation income exceeds 50% of the total family income, while wage-earning part-time farmers are those whose wage income makes up more than 50% of the total family income.
According to the SES framework, the EEAWU is simultaneously affected by multiple subsystems of economic, social, and political background (S); resource system (RS); resource unit (RU); governance system (GS); and actor (A). Therefore, in the empirical analysis, control variables were selected from the variables that represent the characteristics of RU, GS, A, and RS (Table 3), so that the empirical analysis of the impact of farmers’ part-time employment on the EEAWU can be carried out under the condition of controlling the changes in related subsystems (Supplementary Materials).

3.4.2. Selection of Model Strategy and Modeling

Since the EEAWU measured by the super-efficiency SBM model is a limited variable with a minimum value of 0, to avoid the estimation bias caused by ordinary least squares (OLS) regression, the Tobit regression model based on the maximum likelihood method was selected to analyze the driving factors of the EEAWU. The specific model was constructed as follows: (Equation (3) represents the part-time job engagement degree; Equation (4) includes control variables on the basis of Equation (3)):
E f f i c i e n c y = α 0 + α 1 x 1 + ε 1
E f f i c i e n c y = α 0 + α i x i + β j y j + ε i
where Efficiency represents the EEAWU of farmers, α0 is a constant term, x1 is the farmers’ part-time job engagement degree, α1 is the estimated coefficient, Ɛ1 is the stochastic disturbance. Control variables are included in Equation (4) on the basis of Equation (3). xi is the full-time farmers, Type I part-time farmers, Type II part-time farmers, self-employed part-time farmers, and employed part-time farmers; αi is the estimated coefficient of farmers’ part-time job type; βj is the estimated coefficient of the control variables; yj is the jth control variable; and Ɛi is the stochastic disturbance.

4. Descriptive Statistics

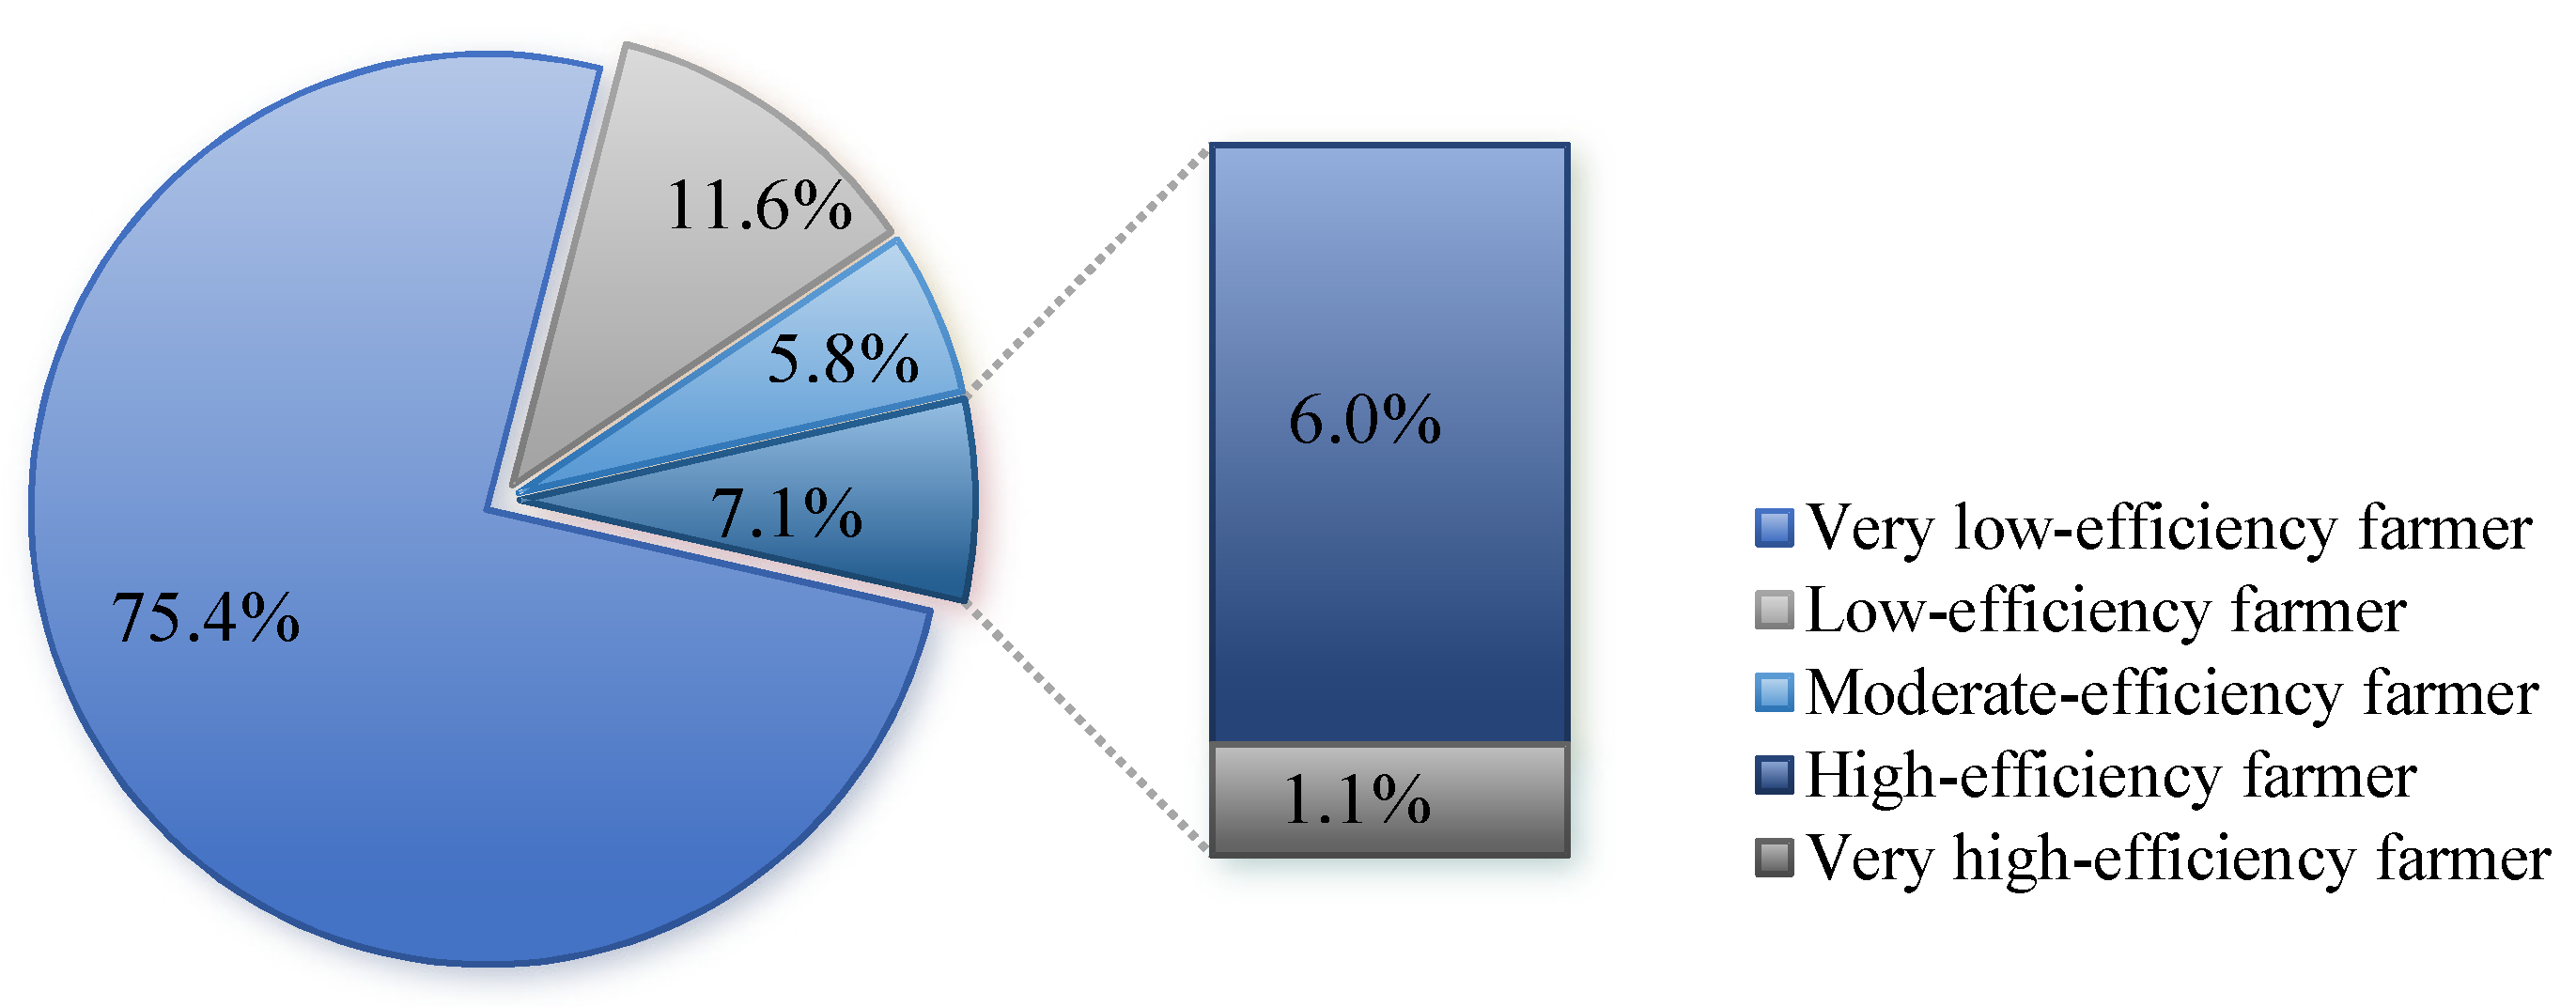
4.1. Analysis of the EEAWU of Sample Farmers

The EEAWU based on the above input and output indicators was calculated using MATLAB R2018a. The average value of the EEAWU for the sample farmers is 0.25, with 68.3% of the sample falling below the average. There are significant differences in the EEAWU values among the sample farmers, with only 1.1% of farmers having efficiency values greater than 1, reaching a maximum of 1.75. This indicates that they are at the frontier of the EEAWU, achieving an optimal balance between agricultural input–output and the impact on the water environment. This group of farmers consists mainly of full-time farmers and Type I part-time farmers. They achieve precise water and fertilizer management through the comprehensive adoption of water-saving technologies and realize efficiency breakthroughs by relying on the cultivation of cash crops and scaled operations. In contrast, the group of farmers with the lowest efficiency value, only 0.003, shows a significant gap from the frontier of agricultural ecological water use efficiency. To further reflect the distribution in EEAWU by farmers under environmental constraints in the study area, the efficiency values of the surveyed farmers were classified into five levels (Figure 3). The efficiency values of most farmers were concentrated in the very low-efficiency range of [0–0.3], accounting for 75.4% of the sample size (n = 338), which was significantly higher than the values in the other ranges. The low-efficiency range (0.3–0.5] comprises 11.6% of the sample (n = 52), the moderate-efficiency range (0.5–0.7] constitutes 5.8% (n = 26), the high-efficiency range (0.7–1] represents 6% (n = 27), and the very high-efficiency range (>1) accounts for only 1.1% (n = 5). This indicates that the EEAWU among the sample farmers exhibits a distribution characteristic with a large proportion of low efficiency and a small proportion of medium to high efficiency. Thus, the overall level of efficiency is low and there is much room for improvement.

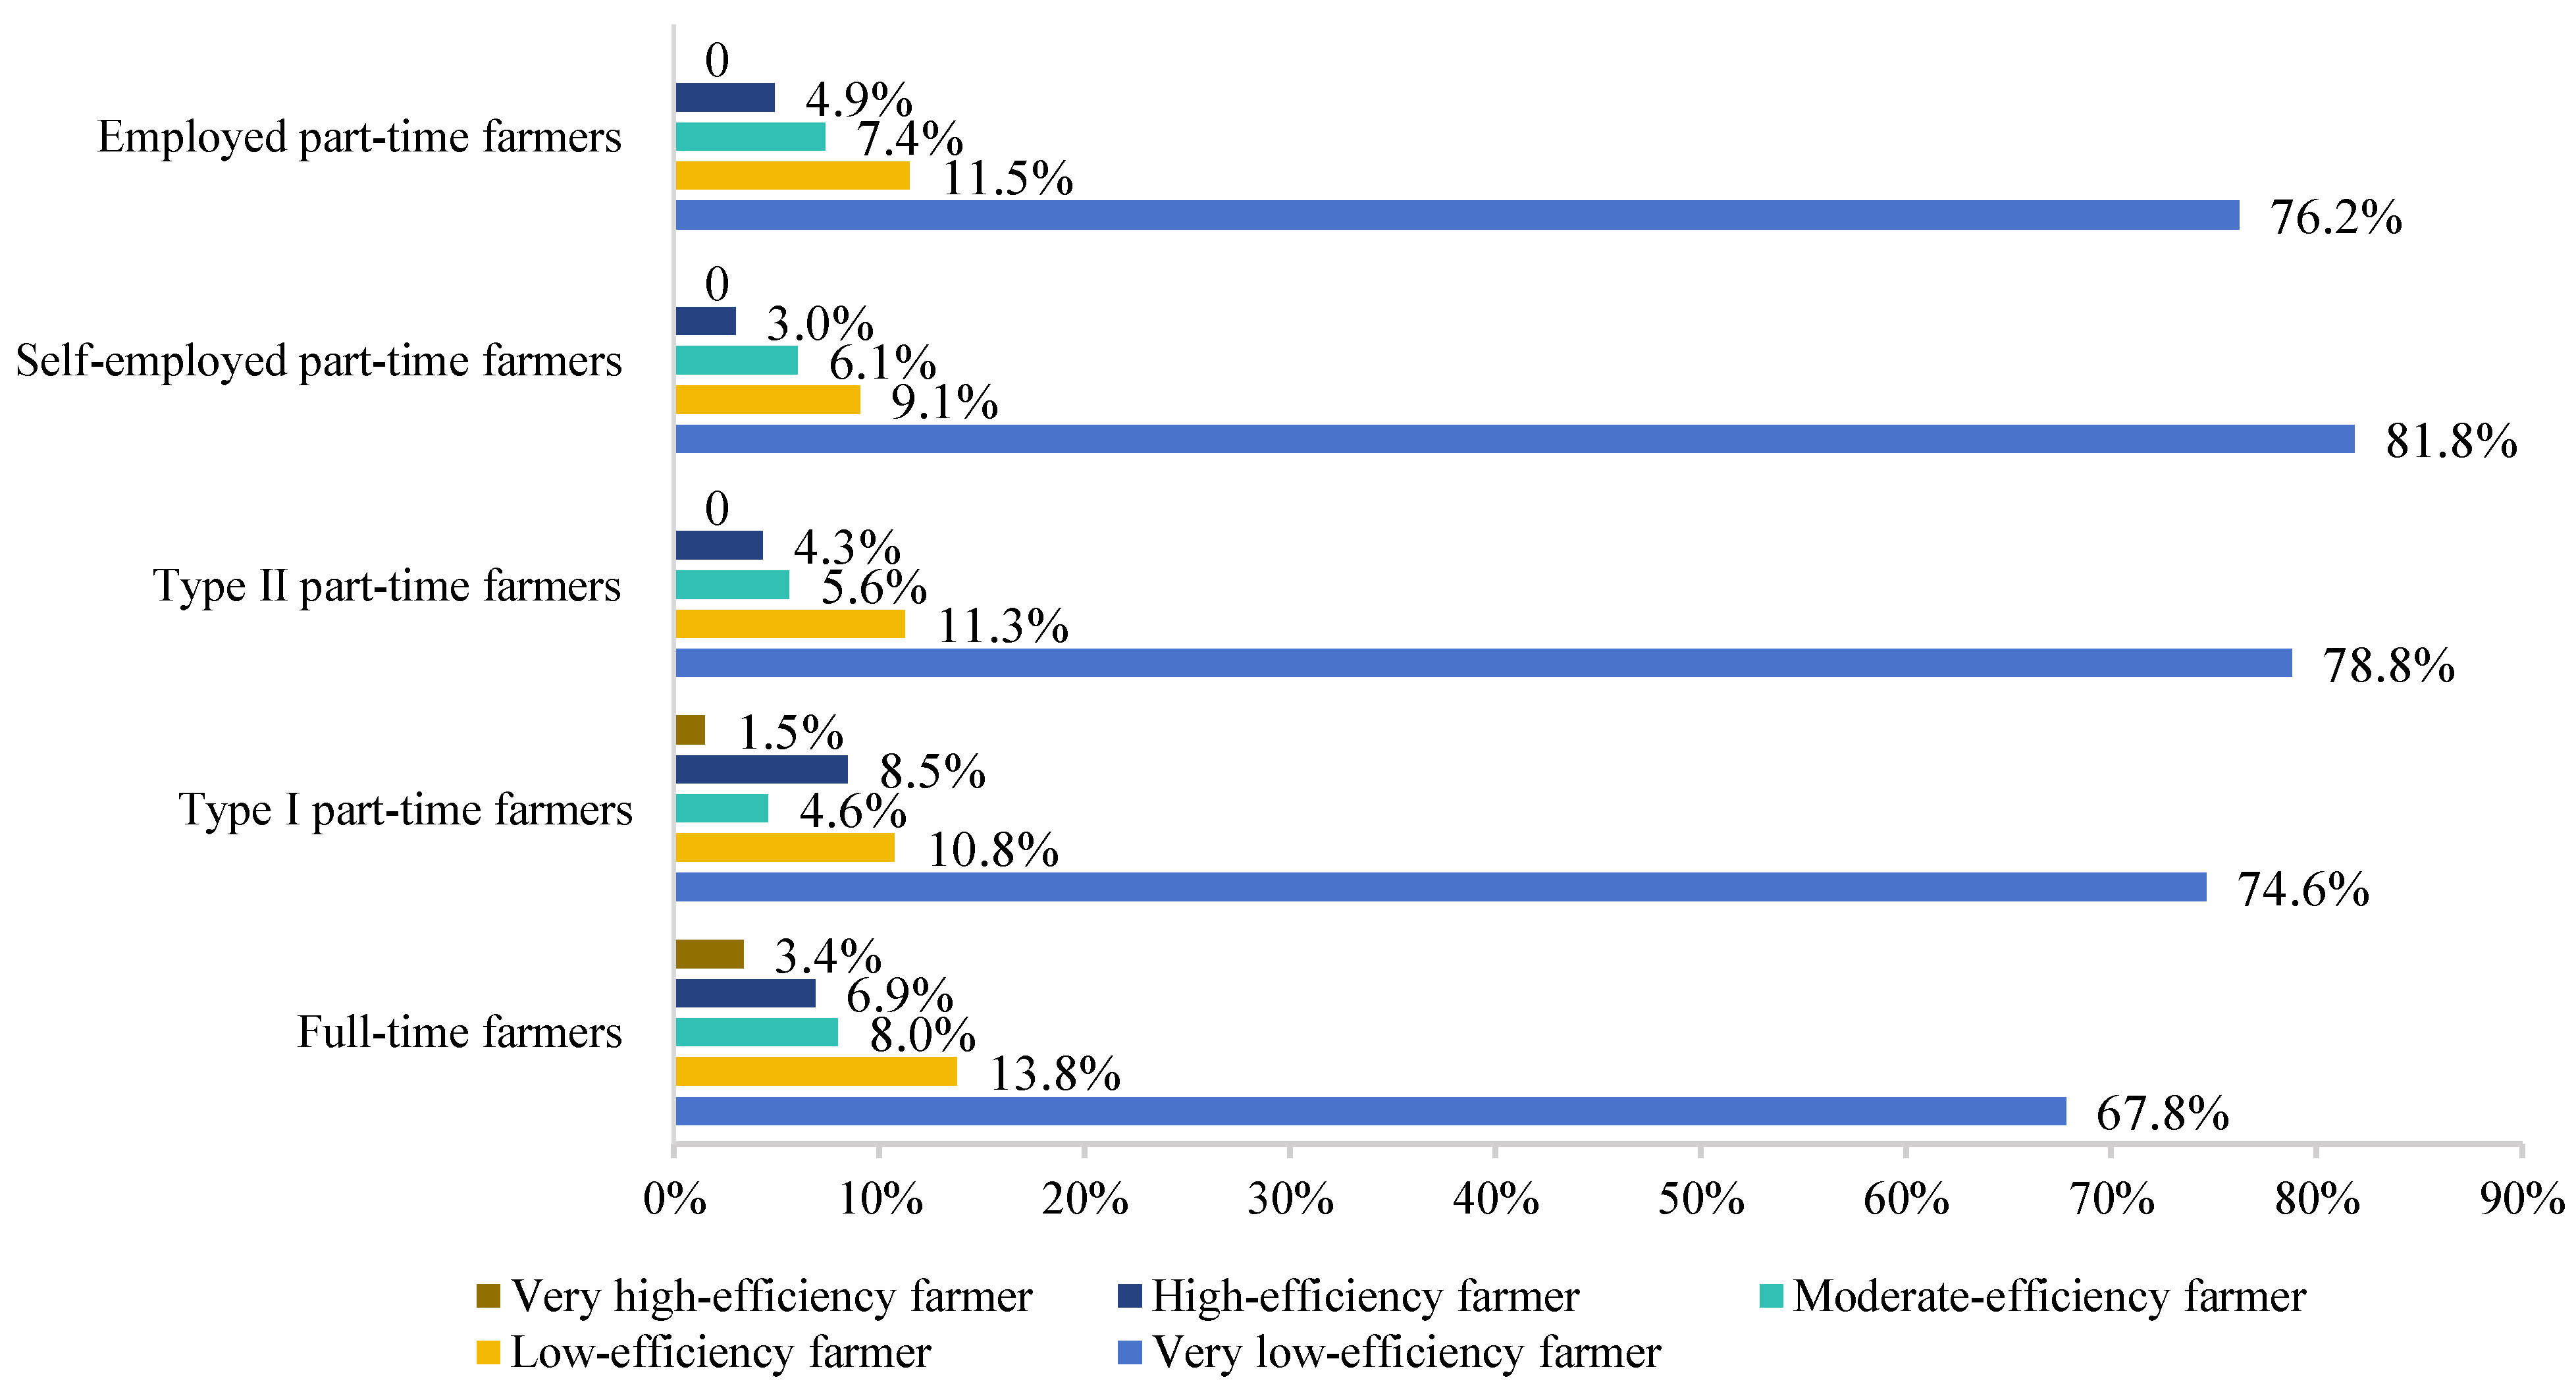
4.2. Analysis of the EEAWU for Different Types of Part-Time Farmers

According to farmers’ part-time job engagement degree, farmers were divided into Type I part-time farmers, Type II part-time farmers, and full-time farmers. The average EEAWU was 0.31, 0.27, and 0.22 for full-time farmers, Type I part-time farmers, and Type II part-time farmers in the basin, respectively. Therefore, under environmental constraints, the efficiency of full-time farmers was the highest. The EEAWU of Type I and Type II part-time farmers gradually decreased with the increase in part-time job engagement degree. The average EEAWU was 0.23 for employed part-time farmers and 0.21 for self-employed part-time farmers. This indicates that self-employed part-time farmers are more likely to lose the EEAWU (Figure 4). Through this descriptive analysis, it can be seen that the part-time job engagement degree and the types of part-time farmers affect the EEAWU. However, this relationship is purely descriptive, and numerous factors influence the EEAWU of part-time farmers. In the absence of control variables, this descriptive relationship cannot accurately represent the connection between the degree and type of part-time farming and the EEAWU. Therefore, this was further empirically verified by the econometric model.

5. Regression Analysis

5.1. Analysis of Tobit Regression Results

Before regression, to avoid the estimation bias caused by multicollinearity between variables, this study calculated the variance inflation factor (VIF) for the variables involved in Formulas (3) and (4) to test whether there was collinearity between the variables. The results showed that the maximum VIF value of the variables was 1.54, the minimum value was 1.02, and the average was 1.26. All the VIF values were less than 3, so there was no multicollinearity between the variables.
The estimation results of the Tobit model conducted using Stata 17.0 software are shown in Table 4. Model 1 only took the part-time job engagement degree as the independent variable, and did not include control variables. The regression results showed a negative correlation between the part-time job engagement degree and the EEAWU (p < 0.01). Model 2 included control variables on the basis of Model 1, and the regression results also showed a negative correlation (p < 0.05).
The regression results for Model 1 and Model 2 showed a significant negative correlation between the part-time job engagement degree and the EEAWU. Thus, H1 was confirmed. Only 14.9% of the total sample were full-time farmers in the study area. This indicates that there are many part-time farmers in the study area. From the perspective of social factors, with the increase in the part-time job engagement degree, the negative effects of reduced dependence on farm income and agricultural labor transfer, labor force aging on the EEAWU were much stronger than the positive effects of farmers’ household income increase on the EEAWU.
The regression results for Model 3 showed a positive correlation between full-time farmers and the EEAWU (p < 0.05). From the perspective of environmental system, the improvement in the EEAWU relies on the promotion and application of water-saving technologies and green production technologies. For full-time farmers, agriculture is the main source of income, the shortage of irrigation water and the rising costs of irrigation have a seriously negative impact on household income. Therefore, more money may be spent on the use of water-saving technologies and the construction of farmland water facilities. The adoption rate of water-saving technologies among full-time farmers reaches 86%. Furthermore, to increase crop yield and maintain land productivity, most farmers choose to use green production technologies such as soil test-based fertilization with high costs to reduce the use of chemical fertilizers and alleviate water pollution caused by the excessive application of chemical fertilizers. The full-time farmers in the study area mainly grow high-value-added cash crops in a large area; especially, high-efficiency drip irrigation technology is widely used, which realizes precision fertilization and reduces chemical fertilizer application rate. Guan et al.’s research data from Aksu, Xinjiang indicated that collective drip irrigation reduced the intensity of fertilizer application by 10.31% [43]. This provides corroborating evidence for the positive role of technology adoption on efficiency observed in our study. Drip irrigation fertilization effectively synchronizes the supply of water and nitrogen fertilizer with the growth requirements of crops, thereby enhancing crop yield, water productivity, and the efficiency of nitrogen fertilizer utilization [44]. This ultimately reduces water pollution and improves the EEAWU. This reflects the importance of the environmental system in the SES; that is, the sustainable use of resources needs to account for the carrying capacity and ecological effects of the environmental system.
The independent variables in Models 4 and 5 were Type I and II part-time farmers, respectively. The EEAWU had a positive correlation with Type I part-time farmers (p > 0.1), but a negative correlation with Type II part-time farmers (p < 0.05). From the perspective of economic incentives, this may be due to that farm income is still one of the main income sources of Type I part-time farmers, and their crop structure is still dominated by cash crops. (The cash crop planting proportion for Type I part-time farmers in the study area was 79.2%). Therefore, most Type I part-time farmers still choose to invest in new farming techniques and water-saving technologies, and the drip irrigation technology use rate reaches 79.2%, which has a positive impact on the EEAWU [22]. The average proportion of farm income in the total income of Type II part-time farmers in the study area is 22.7%, so the part-time employment does not completely replace agricultural production in income. Some Type II part-time farmers still rely on agriculture, which leads to two situations: (1) Change in crop structure. The average proportion of full-time farmers, Type I and II part-time farmers who grow grain crops were 12.6%, 16.3%, and 48.2%, respectively. This indicates that with the increase in the part-time job engagement degree and the reduction in the number of agricultural laborers, farmers abandon the cultivation of cash crops that requires more energy and manpower, while transfer to the cultivation of grain crops that are easy to replace labor with machinery [45]. The initial adoption of water-saving technologies demands that farmers possess a certain level of technical knowledge and make corresponding investments in irrigation equipment [27]. Type II part-time farmers exhibit a low dependence on agricultural income and often opt for low-cost, yet inefficient, traditional irrigation methods based on a cost–benefit analysis. In the study area, flood irrigation is mostly used for grain crop cultivation, which is not conducive to improvement in the EEAWU. (2) Increase in land transfer. In the study area, 35% of Type II part-time farmers are more inclined to transfer out part of their arable lands, and the area of arable lands under their ownership decreases. To achieve the expected economic benefits and improve crop yields, in the context of agricultural labor shortage, some Type II part-time farmers appropriately reduce the number of chemical fertilizer applications, but increase the chemical fertilizer application rate in agricultural production [46]. Chemical fertilizers cannot be fully absorbed by crops and cause great losses, which causes the increase in agricultural gray water footprint and leads to the low EEAWU. This is consistent with the economic incentives in the SES, i.e., changes in economic interests affect the behavioral choices of individuals or groups.
The independent variables in Models 6 and 7 were self-employed and employed part-time farmers, respectively, and both showed a negative correlation with the EEAWU (p > 0.1). This may be due to the fact that the self-employed part-time farmers in the study area tend to engage in self-employed activities in their own villages or the near villages, and their time management is flexible. However, the employed part-time farmers in the study area mainly do odd jobs in nearby cities that are relatively far away during the slack season. During the busy farming season, both self-employed and employed part-time farmers can return home to work in agricultural management. Therefore, neither of these has resulted in the loss of family agricultural labors or extensive agricultural production, resulting in insignificant regression results.
It can be seen from Models 2–7 that the proportion of farmers cultivating grain crops and the proportion of farmers cultivating cotton had a negative impact on the EEAWU (p < 0.01). Although water-saving drip irrigation is used, which can improve the EEAWU, cotton is a cash crop with high water consumption. Cotton-growing area accounts for a large proportion of the study area, which makes the input–output efficiency of water resources in agricultural production low. Further analysis of the resource system (RS) and governance system (GS) variables reveals that the degree of water scarcity for agricultural irrigation and the convenience of irrigation show a positive correlation with the EEAWU, but this correlation does not reach a significant level. Within the SES framework, the resource system (RS) variable (degree of irrigation water shortage) and the governance system (GS) variable (irrigation convenience) need to indirectly influence the EEAWU by affecting “actor behavior” (A). Specifically, although theoretically, the perception of water scarcity can motivate water-saving behaviors, its direct impact is not significant in empirical terms. This may be because part-time farmers tend to choose irrigation methods based on cost–benefit principles; for instance, in the study area, they often use flood irrigation when growing food crops, rather than actively responding to the perception of water scarcity. Additionally, the convenience of irrigation facilities has not directly influenced efficiency, indicating that irrigation infrastructure must be effectively transformed into farmers’ adoption of water-saving technologies and refined management practices in order to impact the EEAWU.

5.2. Moderating Effect

On the basis of Model 2, the farm size and the interaction between farm size and part-time farmer type were added, to test whether farm size had a moderating effect on the relationship between EEAWU and part-time job engagement degree. Considering that the introduction of the interaction may lead to multicollinearity, the explanatory variables and farm size were centralized, and then the interaction was generated by decentralized variables. It was found that after adding the interaction in Model 2, the regression coefficient of the part-time job engagement degree and the EEAWU was still negative (p < 0.05), and the regression coefficient of the interaction and the EEAWU was also negative (p < 0.01) (Table 5). This indicates that the scale of planting has a negative moderating effect on the relationship between the degree of part-time farming and the EEAWU. As the scale of planting increases, farmers may focus more on the large-scale operation of agricultural production and the efficient use of resources, such as adopting water-saving technologies, optimizing crop structures, and reducing fertilizer usage, thereby alleviating the losses in the EEAWU caused by part-time farming, thus confirming hypothesis H2.
To further examine the moderating effect of farm size on the impact of the EEAWU in different types of part-time farming, we introduced the farm size and its interaction term with part-time farming types into the baseline models (3, 4, and 5). The results show that the moderating effect of farm size varies under different types of part-time farming, with a more significant negative moderating effect observed under Type II part-time farming. The possible reason is that as the scale of planting expands, even Type II part-time farmers will consider the economic benefits and sustainability of agricultural production to some extent, thus being more inclined to adopt measures such as water-saving irrigation technologies, optimizing crop structures, and increasing agricultural labor input to enhance the EEAWU, in order to reduce the negative impact of insufficient agricultural production inputs caused by part-time farming on the EEAWU. From the perspective of the SES framework, farm size acts as a resource unit (RU5-a) by influencing the production decisions of actors (A), specifically farmers: for Type II part-time farmers who rely more on non-agricultural income, small-scale planting exacerbates the vicious cycle of “labor loss–insufficient technology adoption–extensive management.” However, expanding the farm size can break this inefficient equilibrium through mechanisms such as cost-sharing effects and factor substitution effects.

5.3. Test for Endogeneity

Models 2–7 focus on the influence of part-time job engagement degree on the EEAWU, but there may be endogenous problems in the regression. The reasons follow: (1) Some variables may be missed. To avoid the influence of missing some variables on model estimation, this study selected control variables from the aspects of farmers’ characteristics, irrigation characteristics, and land characteristics as much as possible, but some variables that may be related to the part-time job engagement degree and have an impact on the EEAWU may still be missed. (2) Measurement error. In the process of cross-sectional data collection, there may be endogenous problems arising from spot checks. According to relevant literature, in this analysis, relevant instrumental variables were introduced for different core variables to solve possible endogeneity problems. The instrumental variables selected in this study were related to the explanatory variable (part-time job engagement degree), but do not directly affect the explained variable (EEAWU). Further, they were not related to the residuals of the models.
This study introduced the household income source diversity as an instrumental variable for the part-time job engagement degree, full-time farmers, and Type I and II part-time farmers. Most Type I part-time farmers in the study area are employed nearby during the slack season, and return home when there is a need for field management. Most Type II part-time farmers transfer most of their farmlands to other farmers, retaining a small farm and going out to work. Therefore, according to the situation in the study area, the proportion of income from part-time employment to total income was used as an instrumental variable for Type I and II part-time farmers. Household size is also an influencing factor affecting the type of part-time farmers. This study used the household size as an instrumental variable for self-employed part-time farmers.
The significance (p value) of DWH (Durbin–Wu–Hausman) in the test for endogeneity in Models 2, 3, 4, 5, 6, and 7 were 0.657, 0.995, 0.514, 0.876, 0.499, and 0.520, respectively. All model results are significantly unable to reject the null hypothesis that the explanatory variable is exogenous; thus, there is no endogeneity problem. Moreover, when testing whether there was a weak instrumental variable, the first-stage regression values of the selected instrumental variables were all greater than the cut-off values set by Stock and Yogo at the significance level of 1% [47]. This indicates that the instrumental variables selected in this study are valid.

5.4. Robustness Test

The SES framework also highlights the impact of institutional arrangements on the behavior of actors, including property arrangements, norms, policies, and social capital. Yang et al. [48] and Liu et al. [12] found that environmental regulation is conducive to improving agricultural water resource efficiency under environmental constraints. Therefore, this study tested the robustness of the model by adding the environmental regulation for control variables. According to the literature and considering the availability of data [12,48], the ratio of total nitrogen emissions from agricultural fertilizers to gross agricultural output value was taken as a negative indicator of environmental regulation—the higher the ratio, the weaker the environmental regulation. In addition, this analysis employs the “OLS model with robust standard errors” method as a substitute for the Tobit model in the re-estimation process.
The robustness test results (Tobit regression results for Models 1–7) showed that the effects of part-time job engagement degree, full-time farmers, and Type I and II part-time farmers on the EEAWU were all significant, which is consistent with the above empirical results (Table 6 and Table 7). This indicates a high robustness. Further, environmental regulation had a negative impact on the EEAWU in the basin (p < 0.01). In the future, increasing the constraint on agricultural non-point source pollution in the basin is one of the effective ways to improve the EEAWU.

6. Discussion

The sustainable use of resources relies on effective self-organization and governance structures. The average EEAWU among the surveyed farmers is 0.25, with 68.3% of participants exhibiting efficiency values below this average, and only 1.1% achieving a high-efficiency level. This indicates that the current governance mechanisms in the western basin (such as environmental regulation) require further optimization to better address the complexities of the social–ecological systems, thereby enhancing the EEAWU. Under the SES framework, part-time farmers are the main body of the system, and their behavior and decision-making are affected by the interaction of multiple subsystems of society, economy, and environment. Regarding economic incentives, as the extent of part-time farming increases, farmers’ reliance on agricultural income diminishes, leading to a decline in their enthusiasm for investing in irrigation and water resource management. On the social-factors level, part-time farming contributes to a shortage and imbalance in the allocation of agricultural labor resources, resulting in trends such as a shift toward grain cultivation and a reduced application of water-saving technologies and sustainable production practices. From an environmental perspective, part-time farmers are more likely to utilize traditional irrigation methods that require relatively low-cost inputs. To address the labor shortage and maintain stable agricultural income, they often over-apply fertilizer, which exacerbates water pollution and hinders the improvement in EEAWU. Therefore, the part-time farming behavior of farmers in the basin may have a significant negative impact on the EEAWU through multiple ways. The average EEAWU of full-time farmers in the sample is 0.31, which is higher than the 0.27 recorded for Type I part-time farmers and the 0.22 for Type II part-time farmers. This research aligns with the findings of Chang Ming, which are based on the 2018 data from the China Family Panel Studies (CFPS) [30]. His study indicates that farmers’ part-time employment can influence their adoption and maintenance of new technologies, such as water-saving irrigation and farmland water facilities, through pathways including the aging agricultural labor force, adjustments in crop structure, and reduced dependence on agriculture. This report further elucidates the moderating role of farm size, thereby expanding the analysis of how part-time employment impacts water resource efficiency within the SES framework. Specifically, the farm size serves as a negative regulation in the relationship between the degree of farmers’ part-time engagement and the EEAWU. This suggests that increasing the farm size can mitigate the losses in the EEAWU associated with part-time engagement through mechanisms such as cost-sharing and factor substitution.
This study is based on cross-sectional data analysis, which has certain limitations. Cross-sectional data struggles to reveal the degree of diversification among farmers, adjustments in crop structures, the adoption of water-saving technologies, and the dynamic evolution trajectory of the EEAWU itself, as well as the feedback mechanisms of their interactions. It also cannot assess the long-term cumulative effects of diversified behaviors on water resource utilization efficiency. Moreover, cross-sectional data reflects the average level of diversification among farmers over a year, which may not accurately capture the water-use decision-making behaviors of diversified farmers during peak water usage periods in spring and summer in the watershed. Therefore, deeply integrating the time dimension into the interactive analysis of the SES framework is an important direction for future research to more comprehensively reveal the complex relationship between farmers’ livelihood transitions and the sustainable use of water resources in arid regions. Subsequent research could establish a long-term panel database of farmers and conduct follow-up surveys on a fixed sample of farmers in arid areas, systematically collecting time-series data on their diversification status, agricultural production inputs and outputs, technology adoption, and environmental behaviors. This study utilized the SES framework to analyze the situation in the western Tarim River Basin, while regions such as Central Asia also face water resource shortages [49] and farmers’ livelihood transitions due to climate aridity and the intensive development of irrigated agriculture. In the future, the SES framework can be applied to explore the relationship between farmer behavior and agricultural water efficiency in similar arid regions such as Central Asia. However, significant differences exist across regions in social, economic, and societal aspects. Therefore, it is necessary to re-examine and determine the indicators corresponding to each level of variables based on the research questions to ensure the applicability of the analytical framework.

7. Conclusions and Policy Implications

This study is based on the SES framework and utilizes survey data from 448 farmers in the western Tarim River Basin. Through the super-efficiency SBM model and Tobit regression, it systematically analyzes the impact mechanism of farmers’ part-time employment behavior on the EEAWU and the moderating effect of farm size. The main conclusions are as follows: (1) The deepening of farmers’ part-time employment significantly suppresses improvement in the EEAWU. The deepening of part-time employment leads to reduced irrigation efficiency and fertilizer misuse through pathways such as labor transfer, a “grain-oriented” crop structure, and insufficient adoption of water-saving technologies, which have a significant negative impact on the EEAWU. (2) Farm size plays a differentiated moderating role, with a more significant negative moderating effect among Type II part-time farmers. The expansion of scale significantly buffers the negative impact of part-time employment on the EEAWU through cost-sharing and factor substitution mechanisms.
“The large country with small-scale farming” is the fundamental national condition of China’s agricultural operations [50], and smallholder family farming remains the primary form of agricultural production in China [51]. Currently, part-time farming has emerged as a common phenomenon, not only in China but also globally, and it will persist for a long time. Part-time farming can economically diversify farmers’ income, mitigate agricultural production risks, and enhance family economic stability. However, it cannot be overlooked that part-time farming also has negative effects, such as a reduction in the EEAWU. Therefore, the government must develop appropriate policies to effectively guide the water usage behaviors of part-time farmers. Based on these empirical findings, the following policy implications are proposed:
In order to reduce the extensive management of agriculture caused by farmers’ part-time work, the construction of an agricultural social service system should be implemented to provide professional and market-oriented outsourcing and trusteeship services for agricultural production. Chen et al. found that for farmers with a higher degree of part-time employment, the application of agricultural social services significantly impacts the reduction in fertilizer use [52]. Agricultural social services may help alleviate the labor and technology shortages faced by part-time farmers, thereby reducing agricultural water pollution caused by the improper use of fertilizers and pesticides. At the same time, to address the issue of high technical adoption costs for small-scale farmers who engage in part-time farming, the government should focus on nurturing new agricultural business entities. By enhancing the rural land transfer market and providing compensation for the benefits of land transfers, the government can encourage part-time farmers to moderately transfer their land to dedicated farming households or cooperatives, thereby promoting moderate-scale land operations. This approach fully utilizes the buffering effect of scale expansion to mitigate the negative impacts of part-time farming.
Cooperatives can enhance farmers’ awareness of relevant technologies by promoting water-saving irrigation and green production techniques. Simultaneously, they can lower the costs associated with technology adoption for farmers through collective purchasing and assistance in obtaining subsidy policies. Zhu et al. found that participation in cooperatives can encourage farmers to adopt water-saving irrigation techniques and decrease their reliance on chemical fertilizers in agricultural production [27]. The government should actively promote the establishment of professional cooperatives among grassroots farmers, encourage part-time farmers to join these cooperatives, reduce the time and knowledge costs associated with technology adoption, and enhance participation in sustainable agricultural production. Lei et al. point out that government agricultural subsidy policies play a crucial role in incentivizing farmers to adopt water-saving technologies [28]. The government should provide subsidies for purchasing water-saving equipment and implement green agricultural production policies. These measures would reduce the investment costs of water-saving facilities for part-time farmers, thereby increasing their participation in sustainable agricultural practices and decreasing the use of chemical fertilizers and pesticides. Additionally, the government should enhance the water rights trading system in river basins and consistently implement a tiered agricultural water pricing system combined with water-saving reward subsidies. This approach would raise awareness of water conservation among inefficient farmers and encourage them to adopt water-saving technologies.
Scientifically optimize the crop planting structure. While ensuring food security, moderately reduce the planting scale of water-intensive crops such as cotton, and simultaneously expand the proportion of planting crops with high economic output per unit of water or lower water consumption, such as specialty fruits. The specific crop selection should comprehensively consider the water and soil resource endowments of different regions within the watershed, market returns, and ecological protection requirements, forming a planting plan that is tailored to local conditions. On this basis, the government needs to establish and improve the water pollution control mechanism for excessive application of chemical fertilizers and pesticides, such as setting nitrogen and phosphorus emission limits for farmland, and further implement dynamic monitoring and a reward and punishment system, so as to strengthen the effectiveness of environmental supervision.

Supplementary Materials

The following supporting information can be downloaded at: https://www.mdpi.com/article/10.3390/w17131962/s1.

Author Contributions

Conceptualization, H.D. and G.W.; methodology, H.D.; software, H.D. and G.R.; validation, G.W., Y.Z. and X.Z.; formal analysis, H.D.; investigation, H.D., Y.Z., G.R. and X.Z.; resources, G.W.; data curation, G.W.; writing—original draft preparation, H.D., Y.Z., G.R. and X.Z.; writing—review and editing, H.D. and G.W.; visualization, H.D., Y.Z., G.R. and X.Z.; supervision, G.W.; project administration, G.W.; funding acquisition, G.W. All authors have read and agreed to the published version of the manuscript.

Funding

The research is supported by the Third Xinjiang Scientific Expedition Program (Grant No. 2022xjkk0106).

Data Availability Statement

The data that support the findings of this study are available from the corresponding author upon reasonable request.

Acknowledgments

We would like to thank the farmers in the Tarim River Basin for their generous contribution of time and their participation in this study.

Conflicts of Interest

The authors declare no conflicts of interest.

References

  1. Fang, G.; Chen, Y.; Li, Z. Variation in agricultural water demand and its attributions in the arid Tarim River Basin. J. Agric. Sci. 2018, 156, 301–311. [Google Scholar] [CrossRef]
  2. Huang, Y.; Li, Y.; Chen, X.; Ma, Y. Optimization of the irrigation water resources for agricultural sustainability in Tarim River Basin, China. Agric. Water Manag. 2012, 107, 74–85. [Google Scholar] [CrossRef]
  3. Wang, F.; Chen, Y.; Li, Z.; Fang, G.; Li, Y.; Xia, Z. Assessment of the Irrigation Water Requirement and Water Supply Risk in the Tarim River Basin, Northwest China. Sustainability 2019, 11, 4941. [Google Scholar] [CrossRef]
  4. Ran, G.; Wang, G.; Du, H.; Lv, M. Relationship of Cooperative Management and Green and Low-Carbon Transition of Agriculture and Its Impacts: A Case Study of the Western Tarim River Basin. Sustainability 2023, 15, 8900. [Google Scholar] [CrossRef]
  5. Zhang, J.; Bai, M.; Zhou, S.; Zhao, M. Agricultural Water Use Sustainability Assessment in the Tarim River Basin under Climatic Risks. Water 2018, 10, 170. [Google Scholar] [CrossRef]
  6. Wang, F.T.; Yu, C.; Xiong, L.C.; Chang, Y. How can agricultural water use efficiency be promoted in China? A spatial-temporal analysis. Resour. Conserv. Recycl. 2019, 145, 411–418. [Google Scholar] [CrossRef]
  7. Kaneko, S.; Tanaka, K.; Toyota, T.; Managi, S. Water efficiency of agricultural production in China: Regional comparison from 1999 to 2002. Int. J. Agric. Resour. Gov. Ecol. 2004, 3, 231–251. [Google Scholar] [CrossRef]
  8. Liu, K.; Yang, G.; Yang, D. Investigating industrial water-use efficiency in mainland China: An improved SBM-DEA model. J. Environ. Manag. 2020, 270, 110859. [Google Scholar] [CrossRef]
  9. Zou, D.; Cong, H. Evaluation and influencing factors of China’s industrial water resource utilization efficiency from the perspective of spatial effect. Alex. Eng. J. 2021, 60, 173–182. [Google Scholar] [CrossRef]
  10. Nanere, M.; Fraser, I.; Quazi, A.; D’Souza, C. Environmentally adjusted productivity measurement: An Australian case study. J. Environ. Manag. 2007, 85, 350. [Google Scholar] [CrossRef]
  11. Chen, S. Green Industrial Revolution in China: A Perspective from the change of Environmental Total Factor Productivity. Econ. Res. J. 2010, 45, 21–34+58. [Google Scholar]
  12. Liu, Y.; Song, Y. Evaluation and Influencing Factor Analysis of Agricultural Water Resource Efficiency in China Based on Super-efficiency SBM Model. China Rural Water Hydropower 2019, 1, 102–107. [Google Scholar]
  13. Ran, G.; Wang, G.; Du, H.; Lv, M. Spatial and temporal patterns of agroecological water use efficiency in arid zones under the framework of SDGs and the influencing factors. Water Sav. Irrig. 2023, 11, 1–10. [Google Scholar]
  14. Wang, S.; Lin, Y. Spatial Evolution and its Drivers of Regional Agro-ecological Efficiency in China’s from the Perspective of Water Footprint and Gray Water Footprint. Geogr. Sci. 2021, 41, 290–301. [Google Scholar]
  15. Liu, T. Spatial differences and pattern classification of agricultural ecological water use efficiency in China. Jiangsu Agric. Sci. 2016, 44, 443–446. [Google Scholar]
  16. Liu, Q.; Hu, D. Analysis of Influencing Factors of Agricultural Water-use Efficiency in Tarim River Basin. Jilin Water Resour. 2019, 05, 12–15+28. [Google Scholar]
  17. Yu, Y.; Yu, R.; Chen, X.; Yu, G.; Gan, M.; Disse, M. Agricultural water allocation strategies along the oasis of Tarim River in Northwest China. Agric. Water Manag. 2017, 187, 24–736. [Google Scholar] [CrossRef]
  18. Ge, D.; Kang, X.; Liang, X.; Xie, F. The Impact of Rural Households’ Part-Time Farming on Grain Output: Promotion or Inhibition? Agriculture 2023, 13, 671. [Google Scholar] [CrossRef]
  19. Yang, X.; Sang, Y. How Does Part-Time Farming Affect Farmers’ Adoption of Conservation Agriculture in Jianghan Plain, China? Int. J. Environ. Res. Public Health 2020, 17, 5983. [Google Scholar] [CrossRef]
  20. Elinor, O. A diagnostic approach for going beyond panaceas. Proc. Natl. Acad. Sci. USA 2007, 104, 15181–15187. [Google Scholar] [CrossRef]
  21. Deng, Y.; Chao, B. Provincial Agricultural Ecological Efficiency and Its Influencing Factors in China from the Perspective of gray Water Footprint. Sci. Agric. Sin. 2022, 55, 4879–4894. [Google Scholar]
  22. Hua, F. On the Labor Allocation Principle of Peasant Household’s Concurrentlyemployment Behavior: The Countermeasures of Large scale Agricultural Land Management in China Concurrent-business. J. Henan Univ. (Soc. Sci.) 2018, 58, 46–51. [Google Scholar]
  23. Zhao, D.; Zhou, H. Study on cropping structure adjustment under the background of rural-household differetiation from Rural Fixed Watch Points in 31 provinces of China. Resour. Sci. 2018, 40, 64–73. [Google Scholar]
  24. Huang, Y.; Luo, X.; Li, Z.; Li, D. Nonlinear effect of farmers’ off-farm employment on grain production efficiency. Resour. Sci. 2021, 43, 1605–1614. [Google Scholar] [CrossRef]
  25. Yang, F.; Li, A.; Zhou, C.; Huang, J.Y. Part-time Employment, Agricultural Water Shortage Perception and Water-saving Technology Adoption Behavior of Farmers—Based on the Survey Data of Farmers in Shaanxi Province. Water Sav. Irrig. 2019, 5, 113–116. [Google Scholar]
  26. Liu, Q.; Liu, Y.; Niu, J.; Gui, D.; Hu, B.X. Prediction of the Irrigation Area Carrying Capacity in the Tarim River Basin under Climate Change. Agriculture 2022, 12, 657. [Google Scholar] [CrossRef]
  27. Zhu, X.; Wang, G. Impact of Agricultural Cooperatives on Farmers’ Collective Action: A Study Based on the Socio-Ecological System Framework. Agriculture 2024, 14, 96. [Google Scholar] [CrossRef]
  28. Lei, X.; Yang, D. Research on the impact of water-saving technologies on the agricultural production efficiency of high-quality farmers-taking Jiangxi province and Guangdong province in China as examples. Front. Environ. Sci. 2024, 12, 1355579. [Google Scholar] [CrossRef]
  29. Yu, J.; Hong, L.; Jiang, H. Effects of Water-saving Irrigation on Pollution Control in Typical Irrigation District in Southern China. Water Sav. Irrig. 2011, 8, 1–4. [Google Scholar]
  30. Chang, M. Can Farmers’ Concurrent Business Behavior Affect Irrigation Efficiency? A Study Based on Microscopic Evidence from CFPS. J. Agro-For. Econ. Manag. 2020, 19, 681–689. [Google Scholar]
  31. Huang, J.; Qi, L.; Chen, R. Technical information knowledge, risk preference and pesticide application by farmers. J. Manag. World 2008, 05, 71–76. [Google Scholar]
  32. Xia, Q.; Li, D.; Zhou, H. Study on the influence of farmers’ concurrent business behavior on agricultural non-point source pollution. China Popul. Resour. Environ. 2018, 28, 131–138. [Google Scholar]
  33. Yang, S.; Fan, G. An Effect Analysis of the Impact of Part- time Farming on Rural Eco-environment. J. South China Agric. Univ. (Soc. Sci. Ed.) 2018, 17, 52–63. [Google Scholar]
  34. Zheng, S.; Yin, K.; Yu, L. Factors influencing the farmer’s chemical fertilizer reduction behavior from the perspective of farmer differentiation. Heliyon 2022, 8, e11918. [Google Scholar] [CrossRef]
  35. Wu, Y.; Xi, X.; Tang, X.; Chen, D. Policy distortions, farm size, and the overuse of agricultural chemicals in China. Proc. Natl. Acad. Sci. USA 2018, 115, 7010–7015. [Google Scholar] [CrossRef]
  36. Feng, M.; Chen, Y.; Duan, W.; Fang, G.; Li, Z.; Jiao, L.; Sun, F.; Li, Y.; Hou, Y. Comprehensive evaluation of the water-energy-food nexus in the agricultural management of the Tarim River Basin, Northwest China. Agric. Water Manag. 2022, 271, 107811. [Google Scholar] [CrossRef]
  37. Tone, K. A slacks-based measure of efficiency in data envelopment analysis. Eur. J. Oper. Res. 2001, 130, 498–509. [Google Scholar] [CrossRef]
  38. Tone, K. A slacks-based measure of super-efficiency in data envelopment analysis. Eur. J. Oper. Res. 2002, 143, 32–41. [Google Scholar] [CrossRef]
  39. Du, Y.-W.; Jiang, J.; Li, C.-H. Ecological efficiency evaluation of marine ranching based on the Super-SBM model: A case study of Shandong. Ecol. Indic. 2021, 131, 108174. [Google Scholar] [CrossRef]
  40. Du, H.; Wang, G.; Ran, G.; Lyu, M. Agricultural gray water footprint in the Tarim River Basin using SDGs analysise. Arid. Zone Res. 2023, 40, 1184–1193. [Google Scholar]
  41. Hoekstra, A.Y.; Chapagain, A.K.; Aldaya, M.M.; Mekonnen, M.M. The Water Footprint Assessment Manual: Setting the Global Standard; Earthscan: London, UK, 2011; pp. 30–40. Available online: https://waterfootprint.org/resources/TheWaterFootprintAssessmentManual_English.pdf (accessed on 27 June 2025).
  42. Su, W.; Jiang, G.; Wang, G. Analysis on the Influencing Factors of Peasant Household Lending and Industry in Shiyang River Basin of Gansu Province. Xinjiang Agric. Sci. 2022, 59, 2333–2340. [Google Scholar]
  43. Guan, C.; Ma, X.; Shi, X. The impact of collective and individual drip irrigation systems on fertilizer use intensity and land productivity: Evidence from rural Xinjiang, China. Water Resour. Econ. 2022, 38, 100196. [Google Scholar] [CrossRef]
  44. Li, H.; Mei, X.; Wang, J.; Huang, F.; Hao, W.; Li, B. Drip fertigation significantly increased crop yield, water productivity and nitrogen use efficiency with respect to traditional irrigation and fertilization practices: A meta-analysis in China. Agric. Water Manag. 2021, 244, 106534. [Google Scholar] [CrossRef]
  45. Qiu, T.; Luo, B. What Leads to a “Tendency to Plant Grains” in Agricultural crop structure? An Empirical Analysis Based on the Impact Factors of Land Property Rights and Factors Allocation. Chin. Rural. Econ. 2018, 2, 65–80. [Google Scholar]
  46. Zheng, X.; Zhang, X.; Lin, Q.; Guo, J. The Influence of Fertilization Outsourcing Service on Fertilizer Input Reduction of Part-time Farmers. J. Agrotech. Econ. 2023, 4, 35–51. [Google Scholar]
  47. Stock, J.H.; Yogo, M. Testing for Weak Instruments in Linear IV Regression. Nber Tech. Work. Pap. 2005, 14, 80–108. [Google Scholar] [CrossRef]
  48. Yang, Q.; Liu, H. Regional Disparity and Influencing Factors of Agricultural Water Resources Efficiency with the Constraint of Pollution. J. Quant. Technol. Econ. 2015, 32, 114–128+158. [Google Scholar]
  49. Huang, S.; Wortmann, M.; Duethmann, D.; Menz, C.; Shi, F.; Zhao, C.; Su, B.; Krysanova, V. Adaptation strategies of agriculture and water management to climate change in the Upper Tarim River basin, NW China. Agric. Water Manag. 2018, 203, 207–224. [Google Scholar] [CrossRef]
  50. Zhu, S. The Optimizationof Farmer Education Policy System from the Perspective of All-round Development. China Rural. Surv. 2024, 2, 2–23. [Google Scholar]
  51. Sun, Z.Y.; Sun, D.P.; Yu, B.T.; Wang, Z.G. How Does Concurrent BusinessAffect Farmers’Production Behavior of “One Family, Two Systems”? Empirical Evidencesfrom 1458 Household Questionnairesin Five Provinces of China. Chin. Rural. Econ. 2021, 6, 44–59. [Google Scholar]
  52. Chen, X.; Liu, T. Can Agricultural Socialized Services Promote the Reduction in Chemical Fertilizer? Analysis Based on the Moderating Effect of Farm Size. Int. J. Environ. Res. Public Health 2023, 20, 2323. [Google Scholar] [CrossRef] [PubMed]
Figure 1. Schematic diagram of the social–ecological system (SES) framework.
Water 17 01962 g001
Figure 3. The distribution proportion diagram for farmer households regarding the EEAWU.
Water 17 01962 g003
Figure 4. Distribution differences in the EEAWU among different types of part-time farming households.
Water 17 01962 g004
Table 1. Variables of the social–ecological system (SES) framework.
First-Level VariablesSecond- and Third-Level Variables
Social, economic, and political background (S)S2: Demographic trend
 S2-a: Part-time farming
Actor (A)A2: Socio-economic attributes of actors
 A2-a: Age of the head of household
 A2-b: Health of the head of household
A3: History and experience of resource utilization
 A3-a: Whether or not to use water-saving techniques in agricultural production
 A3-b: Proportion of food crop cultivated area
 A3-c: Proportion of cotton cultivated area
Resource unit (RU)RU5: Number of units
 RU5-a: Arable land area
RU6: Distinguishable features
 RU6-a: Number of arable lands
Governance system (GS)GS1: Government agencies
GS1-a: Irrigation convenience
Resource system (RS)RS3: Size of the resource system
 RS3-a: Severity of water scarcity for irrigation in farmland
Interaction (I) → Outcome (O) in an action contextO1: Social performance measurement; O2: Ecological performance measurement
O1 and O2-a: Ecological efficiency of agricultural water use
Table 2. Descriptive statistics of inputs and outputs.
VariableDefinitionStandard ErrorMean
Input (Resource variables)Arable landArable land area (ha)2.8822.117
SeedsSeed cost (USD)436.629219.577
Fertilizers and pesticidesFertilizer and pesticide costs (USD)4324.9061813.668
Machine servicesMechanical service cost (USD)1126.844517.951
LaborLabor cost (USD)1446.999564.885
Agricultural water consumptionIrrigation volume (m3)4.4812.561
Undesired output (Environmental variable)Agricultural water pollutionAgricultural gray water footprint (104m3)2.1920.914
Desired output (Economic variable)Economic outputGross agricultural output (USD)17,925.4359530.045
Table 3. Descriptive statistics for variables.
Variable TypeVariableDefinitionMeanStandard Deviation
Explained variableEEAWUContinuous variable (%)0.2520.272
Explanatory variableFull-time farmerRatio of non-farm income to total household income is 0–10%: Yes = 1; No = 00.1940.396
Type I part-time farmerRatio of non-farm income to total household income is 10–50%: Yes = 1; No = 00.2900.454
Type II part-time farmerRatio of non-farm income to total household income is 50–100%: Yes = 1; No = 00.5160.500
Farmers’ part-time job engagement degreeFull-time farmer = 1, Type I part-time farmer = 2,
Type II part-time farmer = 3
2.3210.780
Moderating variableCultivated areaContinuous variable (ha)2.1172.885
Control variableAge of the head of householdContinuous variable (year)46.21410.509
Health statusVery healthy = 1, somewhat healthy = 2, healthy = 3, poor health = 4, very poor health = 51.7751.087
Arable land characteristicsContinuous variable (number of arable lands)2.7411.965
Proportion of food crop growing areaProportion of wheat and maize growing area to total growing area (%)03200.409
Proportion of cotton growing areaProportion of cotton growing area to total growing area (%)0.3040.431
Degree of irrigation water shortageVery adequate = 1, somewhat adequate = 2, adequate = 3, inadequate = 4, severely inadequate = 53.6541.044
Convenience of irrigationVery inconvenient = 1, inconvenient = 2, convenient = 3, moderately convenient = 4, very convenient = 54.3300.916
Whether water-saving techniques are adopted?Adopted = 1, not adopted = 0.0.7340.457
Table 4. Regression results of the EEAWU and different part-time job engagement degrees/different part-time farmer types.
Variable CategoryVariableModel 1Model 2Model 3Model 4Model 5Model 6Model 7
Independent variableFarmers’ part-time job−0.043 ***
(0.018)
−0.041 **
(0.018)
0.062 **
(0.037)
0.011
(0.030)
−0.057 **
(0.027)
−0.038
(0.036)
−0.040
(0.025)
Control variableAge of the head of household −0.002
(0.001)
−0.002
(0.001)
−0.002
(0.001)
−0.002
(0.001)
−0.002
(0.001)
−0.002
(0.001)
Health condition −0.017
(0.012)
−0.016
(0.012)
−0.018
(0.012)
−0.018
(0.012)
−0.018
(0.012)
−0.018
(0.012)
Arable land characteristic 0.001
(0.005)
0.001
(0.005)
0.000
(0.006)
0.001
(0.005)
−0.000
(0.006)
−0.000
(0.006)
Proportion of food crop growing area −0.252 ***
(0.035)
−0.261 ***
(0.036)
−0.267 ***
(0.036)
−0.253 ***
(0.035)
−0.268 ***
(0.036)
−0.265 ***
(0.036)
Proportion of cotton growing area −0.276 ***
(0.042)
−0.267 ***
(0.041)
−0.260 ***
(0.041)
−0.276 ***
(0.042)
−0.260 ***
(0.040)
−0.270 ***
(0.042)
Degree of shortage of irrigation water 0.004
(0.012)
0.002
(0.012)
0.002
(0.012)
0.004
(0.012)
0.002
(0.012)
0.003
(0.012)
Convenience of irrigation 0.011
(0.014)
0.011
(0.014)
0.009
(0.013)
0.010
(0.014)
0.009
(0.013)
0.010
(0.013)
Whether water-saving techniques are adopted? 0.050 *
(0.024)
0.054 **
(0.024)
0.056 **
(0.024)
0.050 *
(0.024)
0.056 **
(0.024)
0.057 **
(0.024)
SIGMA 0.2700.2410.2420.2430.2420.2420.243
Constant 0.351 ***
(0.048)
0.523 ***
(0.089)
0.420 ***
(0.084)
0.441 ***
(0.082)
0.463 ***
(0.082)
0.450 ***
(0.082)
0.448 ***
(0.082)
DWH (Durbin–Wu–Huasman) test 0.65780.99520.51410.87620.49940.5204
Phase 1 F value 154.42 ***103.140 ***199.403 ***26.666 ***10.204 ***12.167 ***
Notes: *** p < 0.01; ** p < 0.05; * p < 0.1.
Table 5. Regression results for the moderating effect of farm size.
VariableModel 2Model 3Model 4Model 5
Explanatory variable−0.044 ** (0.017)0.046 (0.031)0.018 (0.027)−0.070 ** (0.027)
Part-time job engagement degree × farm size−0.001 *** (0.000)0.001 * (0.001)−0.001 * (0.001)−0.002 * (0.001)
Farm size−0.001 * (0.000)−0.001 (0.000)0.0001 (0.000)−0.001 (0.000)
Control variableControlledControlledControlledControlled
SIGMA0.2390.2400.2420.240
Constant0.530 *** (0.090)0.429 *** (0.084)0.441 *** (0.085)0.462 *** (0.084)
Notes: *** p < 0.01; ** p < 0.05; * p < 0.1.
Table 6. Robustness test results.
VariableModel 1Model 2Model 3Model 4Model 5Model 6Model 7
Core independent variable−0.034 **
(0.016)
−0.037 **
(0.016)
0.057 *
(0.030)
0.007
(0.026)
−0.050 *
(0.026)
−0.027
(0.044)
−0.043
(0.027)
Control variables ControlledControlledControlledControlledControlledControlled
Environmental regulation−5.020 ***
(1.364)
−3.511 ***
(1.259)
−3.639 ***
(1.258)
−3.762 ***
(1.262)
−3.537 ***
(1.262)
−3.711 ***
(1.265)
−3.835 ***
(1.258)
SIGMA0.2660.239 0.240 0.240 0.240 0.2400.240
Constant0.347 ***
(0.039)
0.513 ***
(0.089)
0.419 ***
(0.084)
0.440 ***
(0.084)
0.458 ***
(0.084)
0.446 ***
(0.084)
0.445 ***
(0.083)
Notes: *** p < 0.01; ** p < 0.05; * p < 0.1.
Table 7. OLS regression model.
VariableModel 1Model 2Model 3Model 4Model 5Model 6Model 7
Core independent variable−0.043 **
(0.018)
−0.041 **
(0.019)
0.062 *
(0.038)
0.011
(0.030)
−0.057 **
(0.027)
−0.038
(0.036)
−0.040
(0.025)
Control variables ControlledControlledControlledControlledControlledControlled
Constant0.347 ***
(0.039)
0.524 ***
(0.090)
0.420 ***
(0.085)
0.441 ***
(0.082)
0.463 ***
(0.083)
0.450 ***
(0.083)
0.448 ***
(0.083)
Notes: *** p < 0.01; ** p < 0.05; * p < 0.1.
Disclaimer/Publisher’s Note: The statements, opinions and data contained in all publications are solely those of the individual author(s) and contributor(s) and not of MDPI and/or the editor(s). MDPI and/or the editor(s) disclaim responsibility for any injury to people or property resulting from any ideas, methods, instructions or products referred to in the content.

