Article

Comprehensive Flood Risk Assessment for Quang Tri Province

by
Nguyen Tien Thanh
1,
Nguyen Thanh Hung
2,*,
To Vinh Cuong
2,
Vu Dinh Cuong
2,
Trieu Quang Quan
2 and
Nguyen Mai Dang
1
1
Thuyloi University, 175 Tay Son, Dong Da, Hanoi 100000, Vietnam
2
Key Laboratory of River and Coastal Engineering (KLORCE), Vietnam Academy for Water Resources, Hanoi 100000, Vietnam
*
Author to whom correspondence should be addressed.
Water 2025, 17(13), 1958; https://doi.org/10.3390/w17131958
Submission received: 24 May 2025 / Revised: 24 June 2025 / Accepted: 26 June 2025 / Published: 30 June 2025
(This article belongs to the Section Hydrology)

Abstract

Quang Tri, located in the central region of Vietnam, regularly experiences prolonged and extreme rainfall that causes severe and widespread flooding. This has resulted in significant losses in terms of both lives and property. Therefore, an integrated flood risk map is an essential tool for supporting disaster response and prevention efforts, utilizing a multi-criteria analysis approach to assess flood risks. This study proposes a method for constructing flood risk maps for the downstream areas of river basins in Quang Tri Province, based on the combination of the unweighted method by Iyengar and Sudarshan with multi-criteria and spatial analysis. The results indicate that during the historic flood in October 2020, the level of flood risk varied significantly among communes in 10 districts in the downstream areas. Specifically, the Hai Phong, Dien Sanh, Hai Hung, and Hai Quy communes in Hai Lang district had the largest proportion of the highest risk area (level 5), accounting for 3.76% of the total area. The area classified as medium risk (level 3) represented approximately 16.54%. The resulting flood risk map enables Quang Tri authorities to focus disaster prevention and response efforts more effectively on the most vulnerable areas identified, particularly the high-risk communes in Hai Lang district.

1. Introduction

In the context of climate change, natural disasters and extreme weather phenomena are increasing globally, with average global temperatures and sea levels rising at an unprecedented rate, raising concerns among nations worldwide [1]. Typically, Vietnam is one of the countries most heavily affected by climate change and sea level rise (SLR) [1]. According to MONRE (2016) [2], total annual rainfall will likely rise, while dry season rainfall will decrease. Sea levels may rise by 75 cm to 1 m, potentially submerging 40% of the Mekong Delta, 11% of the Red River Delta, and 3% of other coastal provinces. Ho Chi Minh City could see over 20% of its area flooded, affecting 10–12% of the population and resulting in an estimated 10% loss of GDP. A study indicates that approximately 59% of Vietnam’s total land area and 71% of its population are susceptible to cyclones and floods [3]. Furthermore, the World Bank (2019) [4] showed that Vietnam ranks as the seventh most disaster-prone country globally, with over 13,000 deaths and USD 6.4 billion in property losses over the past two decades.
Quang Tri, a province in central Vietnam, exhibits a complex interplay of topographical and climatic factors that heighten its susceptibility to natural disasters. The region’s varied terrain, characterized by both mountainous areas and low-lying plains, contributes to significant flooding and landslide risks, particularly during the monsoon season when heavy rainfall occurs. Facing these issues, Nguyen (2022) [5] deployed hybrid machine learning combined with remote sensing to evaluate the flood susceptibility using 14 conditioning factors and more than 1500 flood points in Quang Tri province. The findings show the eastern areas have high and very high flood susceptibility. Flood depth is calculated based on a state-of-the-art integrated model of machine learning, traditional hydrodynamic and spatial analysis [6,7]. Mapping the flood vulnerability for Quang Tri also involved using flood vulnerability indexes [8]. The study indicates that Gio Linh, Dong Ha, and Vinh Linh districts present the highest vulnerability.
Importantly, it is worthy noted that the problem of assessing flood and inundation disaster risk is complex, and has been studied theoretically and practically by many countries worldwide, with technologies continuously advancing. Notable achievements in this field include the study by King et al. (2010) [9], who proposed an improved formula for calculating integrated risk. This formula incorporates variables beyond depth and flow velocity depending on the type of disaster, such as risk elements, resilience, and mitigation. Sahoo et al. (2018) [10] applied geographic information system (GIS) technology to assess the risk of natural disasters for coastal areas in relation to tropical cyclones. The study took into account both physical and socio-economic factors when evaluating the risks posed by storms, including flooding and storm surges. Normally, in order to define the level of flood risk, factors such as hazard, exposure, and vulnerability should be integrated [11]. Zhang and Chen (2019) [12] utilized the Analytic Hierarchy Process (AHP) and multi-criteria analysis via GIS to assess comprehensive flood risk weights due to typhoon-induced rainstorms, based on four factors and 17 criteria. Sensitivity was assessed using elevation, slope, drainage infrastructure, and land cover. Vulnerability factors included population density, industrial output, farmland, and urbanization density. Adaptive capacity was evaluated using criteria such as monitoring station density, road density, per capita GDP, hospital beds, and medical personnel. Kazmierczak and Cavan [13] analyzed vulnerability in terms of infrastructure conditions, community diversity, and the proportion of elderly and children in the community. To evaluate flood risk by considering multiple factors such as meteorological, geographical, economic, social, and environmental, the Multi-Criteria Analysis (MCA) is widely applied for creating flood risk maps. Key techniques include the Analytic Hierarchy Process (AHP), Weighted Linear Combination (WLC), and others, which have been extensively studied for use in urban flood assessments. The integration of MCA with methods like deep learning has shown promise in identifying flood-prone areas [5,14]. However, MCA has limitations in determining subjective weights, relying heavily on expert judgments [15].
Dealing with flood and inundation disaster risks, Nguyen et al. (2011) [16] studied the integrated risk index as a function of hazard and vulnerability (VUL). However, this study only addressed single-disaster evaluation (floods), with VUL assessed from economic and environmental perspectives, and then determined the integrated flood risk levels. Trịnh (2010) [17] evaluated flood risk based on hazard and vulnerability maps, treating vulnerability as a function of land use and population density, without considering community resilience. This approach relied solely on the value density of different areas, assuming uniform socio-economic vulnerability. Can (2015) [18] established a scientific basis for assessing flood vulnerability in the Vu Gia–Thu Bon River basin for planning, prevention, and disaster mitigation, combining AHP and the Iyengar–Sudarshan weighting method [19]. This study developed basic criteria for vulnerability assessment, with detailed vulnerability index maps at the commune level, and addressed floods’ impacts on social systems (livelihoods, economy, society, environment). However, it did not account for hazard intensity or exposure levels, thus not fully evaluating flood risk comprehensively.
Recently, Huynh (2020) [20] assessed the current state, trends, and risks of typical single disasters (i.e., storms, floods, inundation, flash floods, storm surges, droughts) in the Central Coast region, analyzing multi-hazard possibilities and proposing a multi-hazard risk assessment method focusing on risk comparison, consecutive hazards, and time-dependent vulnerability. Nguyen (2021) [21] adopted a multi-hazard approach incorporating climate change, but did not assess interactions between disasters or compounded risks from consecutive or simultaneous events. Giang et al. (2021) [22] applied an assessment framework consisting of three main components of exposure, sensitivity, and resilience, along with 14 assessment indicators. Generally, the studies utilize a range of approaches and indicators to assess vulnerability within specific regions, but not for a province with a detailed environment and society factors.
In light of these challenges, this study aims to develop a detailed flood risk map for Quang Tri Province, utilizing advanced modeling techniques and local data to provide a more accurate representation of flood hazards. This research will not only fill the existing knowledge gaps, but will also serve as a critical tool for policymakers and disaster management agencies in enhancing flood preparedness and resilience. To do this, several steps and methodologies are implemented, as follows: (i) hydro-hydraulic modeling using MIKE model system and (ii) integrated flood risk mapping with the application of GIS technology for Quang Tri province.

2. Data Collection and Methodology
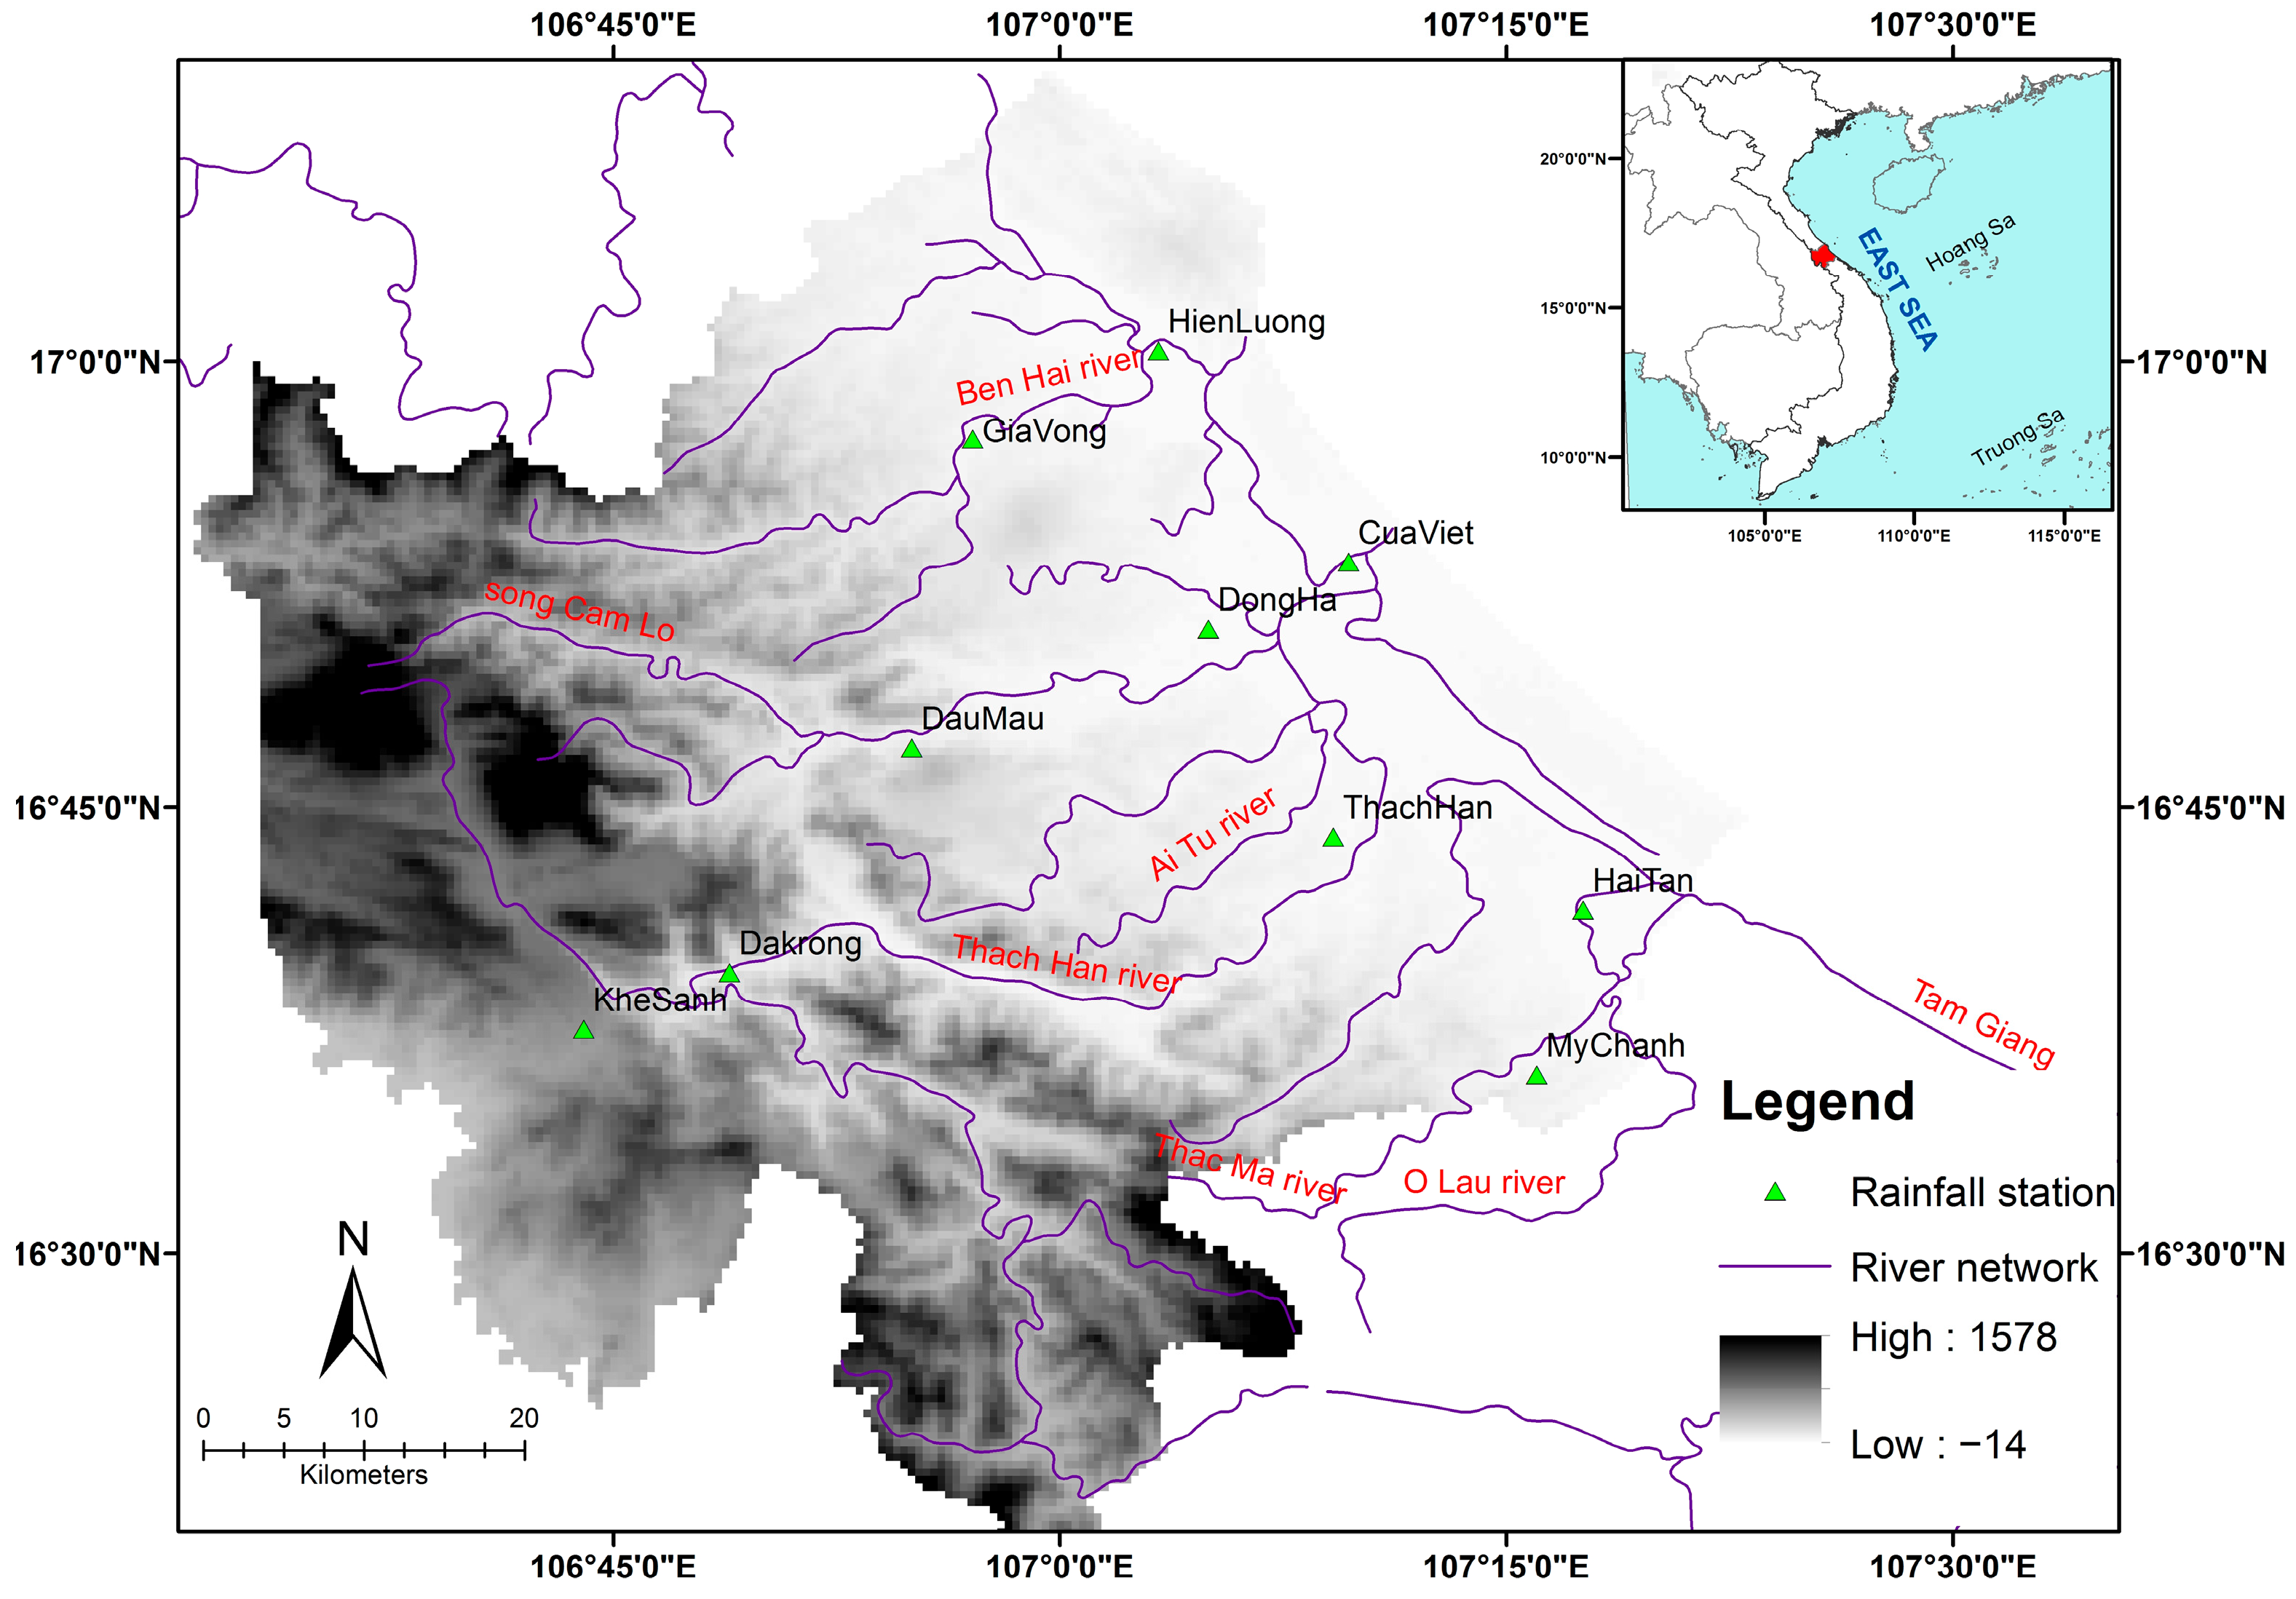
2.1. Study Area

Quang Tri, a province in North Central Vietnam, covers nearly 4734 km2, and is located between 106°32′–107°24′ E and 16°18′–17°10′ N. It borders Quang Binh Province to the north, Thua Thien Hue Province to the south, Savanakhet Province (Laos) to the west, and the East Sea to the east. The province has 12 rivers and approximately 60 tributaries, forming three main river systems, Ben Hai, Thach Han, and O Lau (My Chanh), with an average river density of 0.8–1 km/km2 (Figure 1).
  • Ben Hai River System: Originating from the northeastern slope of Lu Bu Mountain at 705 m, it flows through Vu Con, Ben Thao, and Xuan Hoa, before reaching the sea at Cua Tung. It comprises the Ben Hai River and Ben Xe tributary, with a total length of 76 km and a basin area of 923 km2.
  • Thach Han River System (Quang Tri River): The largest system in the province, it originates from the Ca Kut range (Vietnam-Laos border), stretching 169 km with a basin area of 2727 km2. It includes tributaries like Hieu, Vinh Phuoc, Nhung, Ai Tu, and Rao Quan rivers, characterized by meandering flows (sinuosity coefficient of 3.5).
  • O Lau River System (My Chanh): Located in the south, partially in Thua Thien Hue Province, it flows through the Lac estuary into Tam Giang Lagoon, with its main tributaries being My Chanh and O Khe rivers. It spans 65 km, with a basin area of 931 km2, an average flow of 44 m3/s, and a river density of 0.81 km/km2.

2.2. Data Collection

To analyze, assess, and develop flood risk maps for the study area, the following primary and secondary data were utilized.

2.2.1. Geographic Data

Land use data were collected from 2020 land use status maps of Quang Tri and Thua Thien Hue provinces at a 1/50,000 scale.
Maps at a 1/10,000 scale of Quang Tri and Thua Thien Hue provinces are used for flood simulation, extracting exposure criteria data (e.g., traffic density), and developing flood risk maps. The topographic DEM in Figure 1 is constructed from the 1:10,000 scale.
Hourly rainfall data during the flood events of 2009 and 2020 were collected for ten stations (i.e., GiaVong, ThachHan, CuaViet, KheSanh, DongHa, Dakrong, MyChanh, HaiTan, HienLuong, DauMau) as shown in Figure 1. Daily and hourly discharge data from 1997 to 2023 were gathered from the GiaVong hydrological station; water level data were gathered from hydrological stations at HienLuong on the Ben Hai River, ThachHan, and CuaViet on the Thach Han river, and HaiTan on the O Lau river; water level data at river mouths was derived utilizing predicted tidal data from a global tidal model prediction, specifically, TOPEX/Poseidon version 7.2 (TPXO7.2). The reason for this is the absence of coastal tidal gauge stations in the study area.

2.2.2. Socio-Economic Data

The socio-economic data including area, population, population density, land use, average income, poverty rate, occupational structure, healthcare, and education were sourced from the 2022 statistical yearbooks of districts in the Thach Han, Ben Hai, and O Lau river basins.

2.2.3. Field Surveys
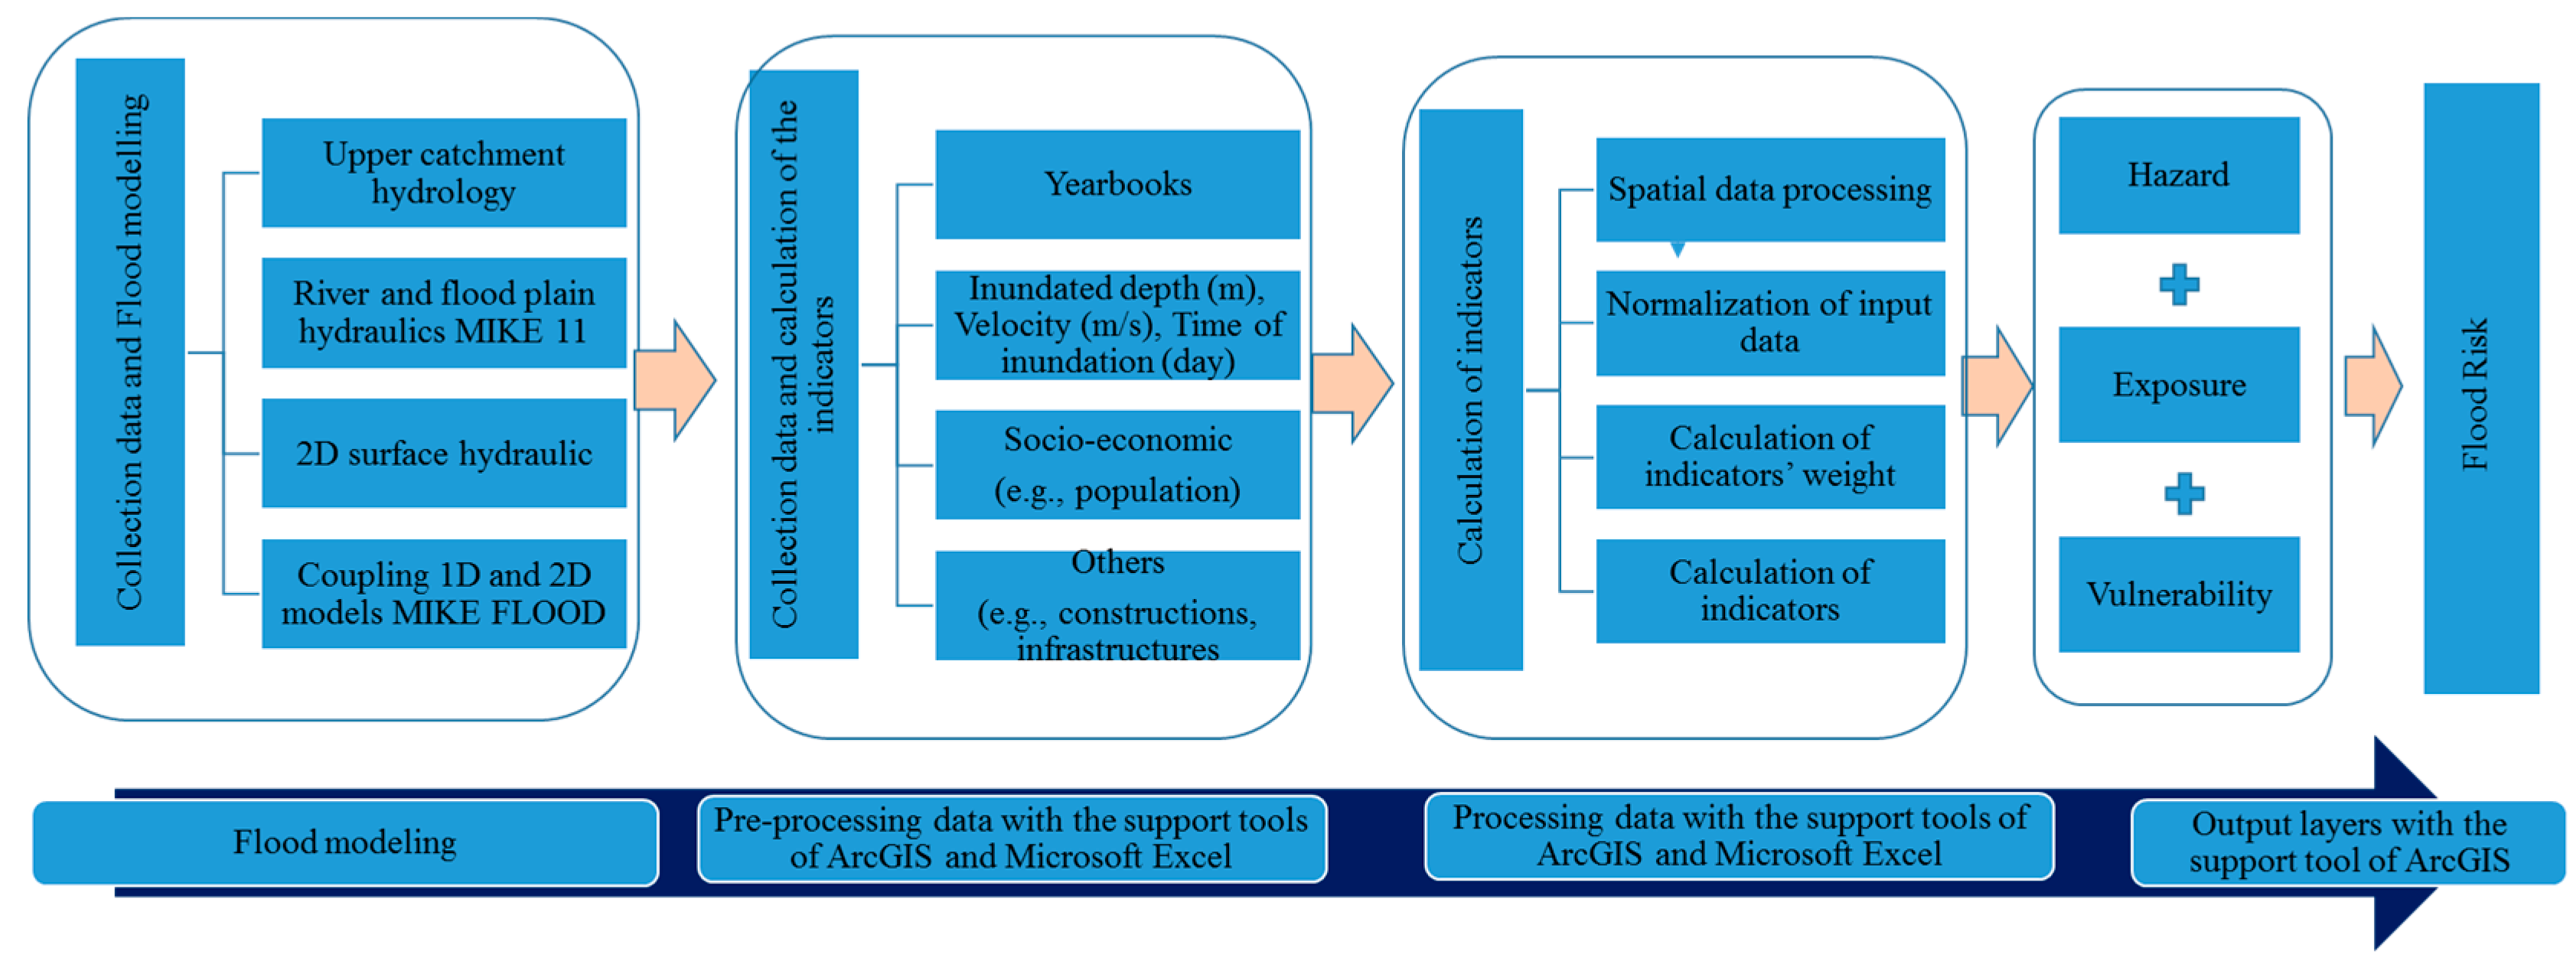
The study used flood trace survey data for the significant flood event in October 2020 to calibrate and validate the simulation model. The survey was implemented in August 2021 in collaboration with the Quang Tri Department of Water Resources on 3 river basins including Ben Hai, Thach Han and O Lau. A total of 134 flood traces were measured and converted to the national elevation system under the guidance of No. 973/2001/TT-TCĐC issued by Ministry of Natural Resources and Environment, Vietnam on 20 June 2001.

2.3. Methodology

2.3.1. Hydrologic–Hydraulic Model

To simulate inundation in the main river of Quang Tri province, the study uses a MIKE model system developed by the Danish Hydraulic Institute (DHI). This model is designed to represent the complex processes from the river network to the sea, incorporating various flood control structures such as dykes. The river network, extending from upstream to downstream and to the river mouth (specifically along the Ben Hai-Thach Han-O Lau river), is modeled using the 1-D hydraulic model MIKE 11. This quasi-1-dimensional unsteady flow modeling tool assumes that flows and water levels in the river channel can be accurately represented as a 1D system. It is utilized to model flow in channel sections and closed conduits that influence the hydraulics of the floodplain.
The MIKE FLOOD model integrates the 1-D hydraulic model (MIKE 11) with the 2-D hydraulic model (MIKE 21) to continuously simulate the flood process, from rising river levels to overbank flooding across the basin. This integration allows for the linking of channels and conduits to MIKE 21, a two-dimensional modeling system that simulates overbank flooding across the river basin for free surface flows where stratification can be neglected [23]. In this study, the MIKE 21 FM model with an unstructured grid was utilized, establishing the connection between MIKE 11 and MIKE 21 through lateral and standard links.
The MIKE 11 model is a river network computational model based on solving the Saint-Venant system of one-way equations. Meanwhile MIKE 21 FM is based on solving the continuity equation and motion equations.
Mathematically, the models are based on the Saint-Venant equations (1D) and the depth-averaged shallow water equations (2D), with brief descriptions offered via Equations (1)–(5).
Continuity equation (mass conservation)
A t + Q x = q l
Momentum equation
Q t + x Q 2 A + g A h x + g Q Q n 2 A R 4 / 3 = 0
Here, A is cross-sectional area (m2); Q is discharge (m3/s); h is water level (m); x is distance along the river (m); t is time (s); R is hydraulic radius (m); n is Manning’s roughness coefficient; ql is lateral inflow per unit length (m2/s).
Continuity equation
h t + ( h u ) x + ( h v ) y = 0
Momentum equation in the x-direction
( h u ) t + ( h u 2 ) x + ( h u v ) y = g h h x τ b x ρ
Momentum equation in the y-direction
( h v ) t + ( h u v ) x + ( h v 2 ) y = g h h y τ b x ρ
Here, h is water depth (m); u and v are depth-averaged velocities in the x and y directions (m/s); τbx and τby are bed shear stresses in the x and y directions (N/m2); ρ is water density (kg/m3).
MIKE FLOOD uses 1D–2D hydraulic links to simulate flow exchange between the river channel (MIKE 11) and the floodplain or surface flow area (MIKE 21). This exchange is governed by the continuity of mass and head at the coupling boundaries.
It is important to note that during the simulation of flooding in a river basin, calibration is a crucial step that ensures that the model accurately reflects the hydrological and hydraulic characteristics. The MIKE Flood model includes parameters that need to be calibrated in MIKE 11 and MIKE 21, and the linkage between MIKE 11 and MIKE 21. Several key parameters for calibration are as follows: (1) for MIKE 11, the Manning roughness coefficient (n) and the loss coefficient at structures (e.g., weirs, culverts, bridges); (2) for MIKE 21, surface roughness (i.e., Manning 2D) and grid resolution (i.e., grid size) to balance the requirements of accuracy and computational time; and (3) for the connection between MIKE 11 and MIKE 21, the location of flow exchange between the river (1D) and the depression (2D), the height of the connecting bank (threshold for water flow from the river to the flood depression), and the maximum exchangeable flow, which is influenced by the spillway loss coefficient in the lateral connection. Other parameters utilize the default values provided by the model.

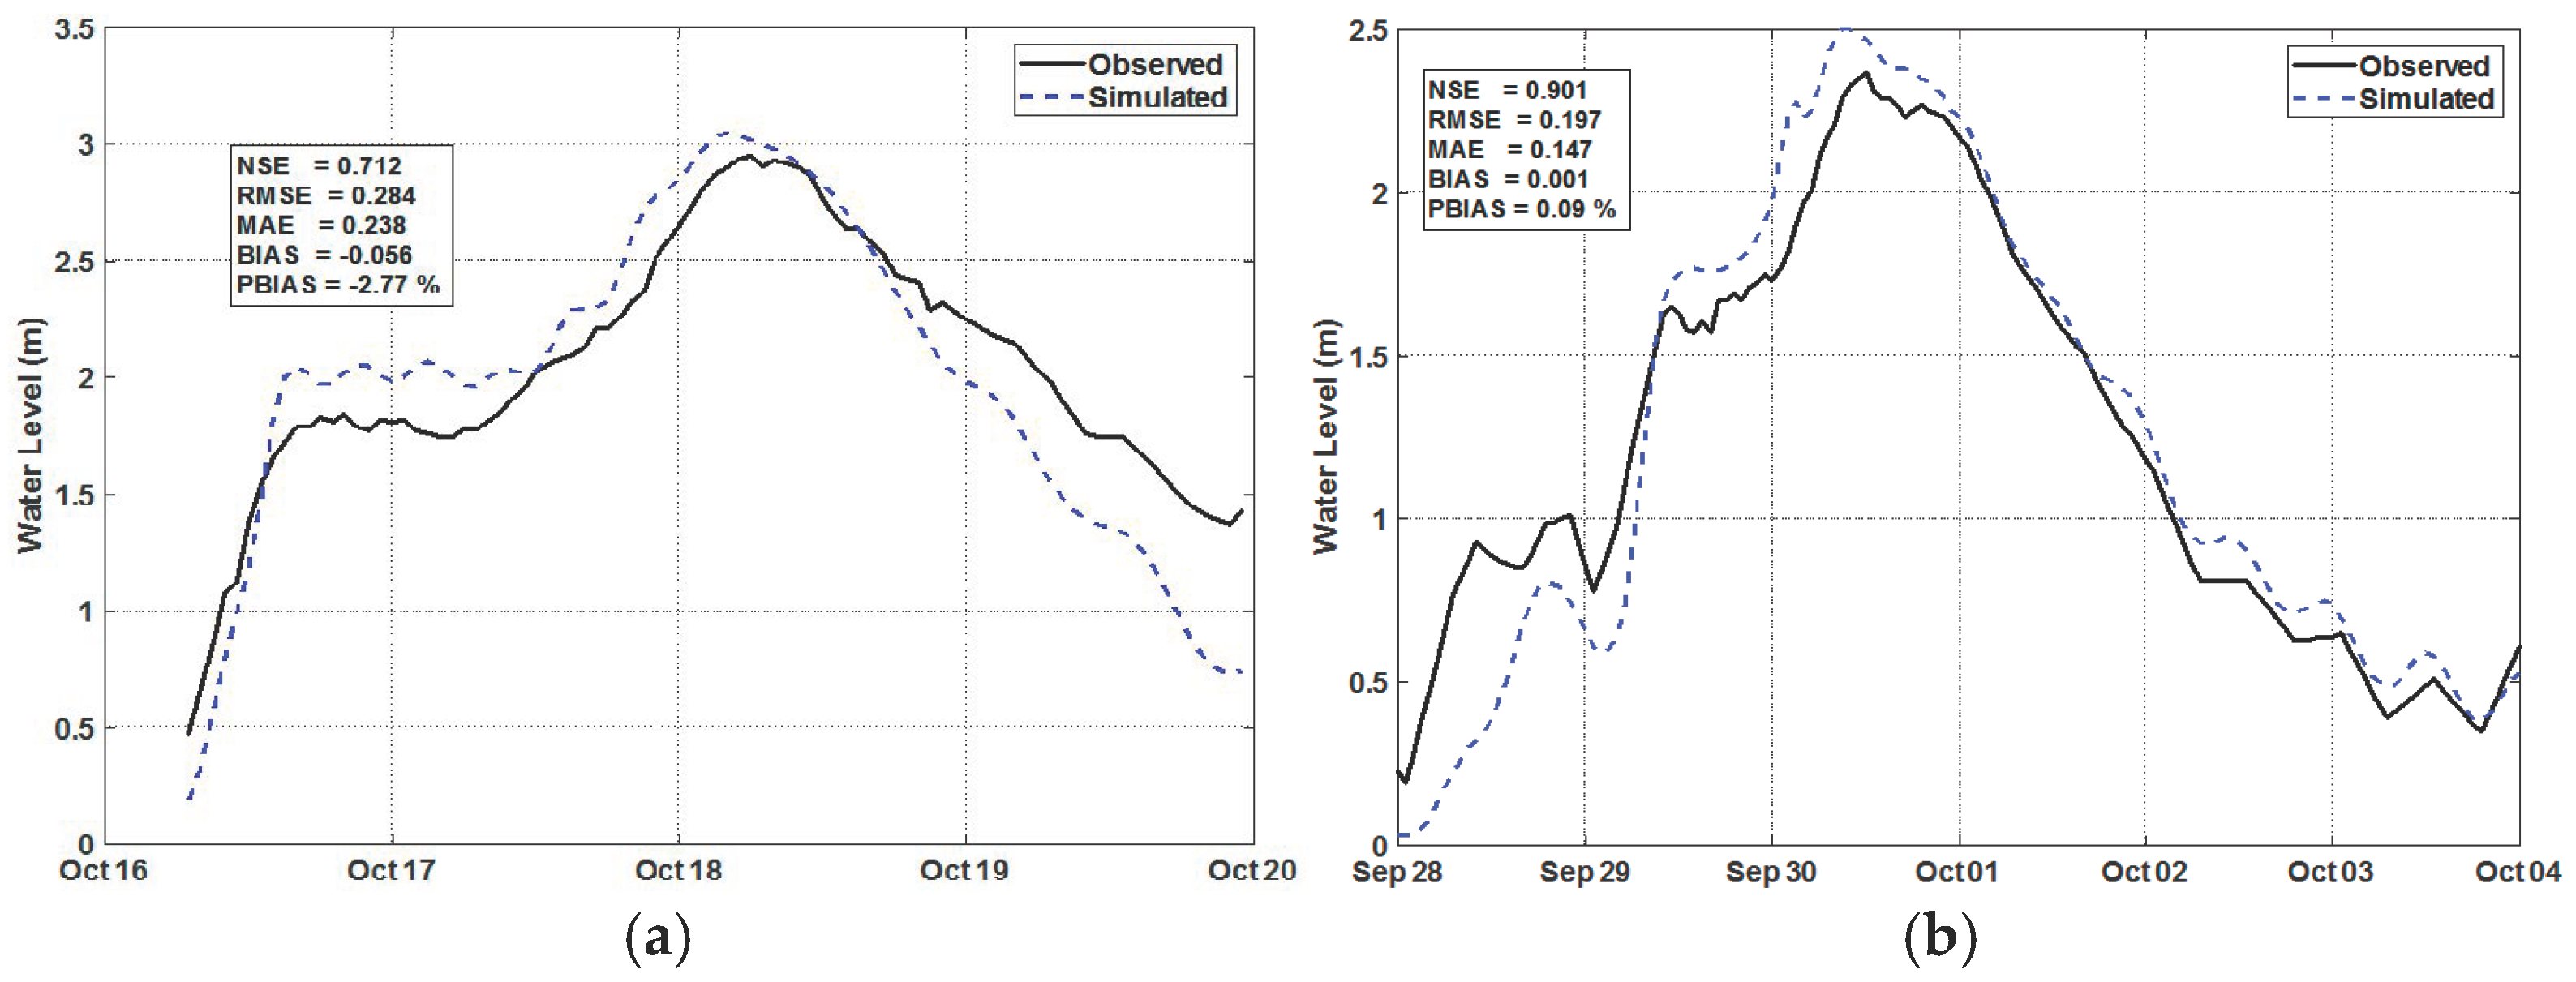
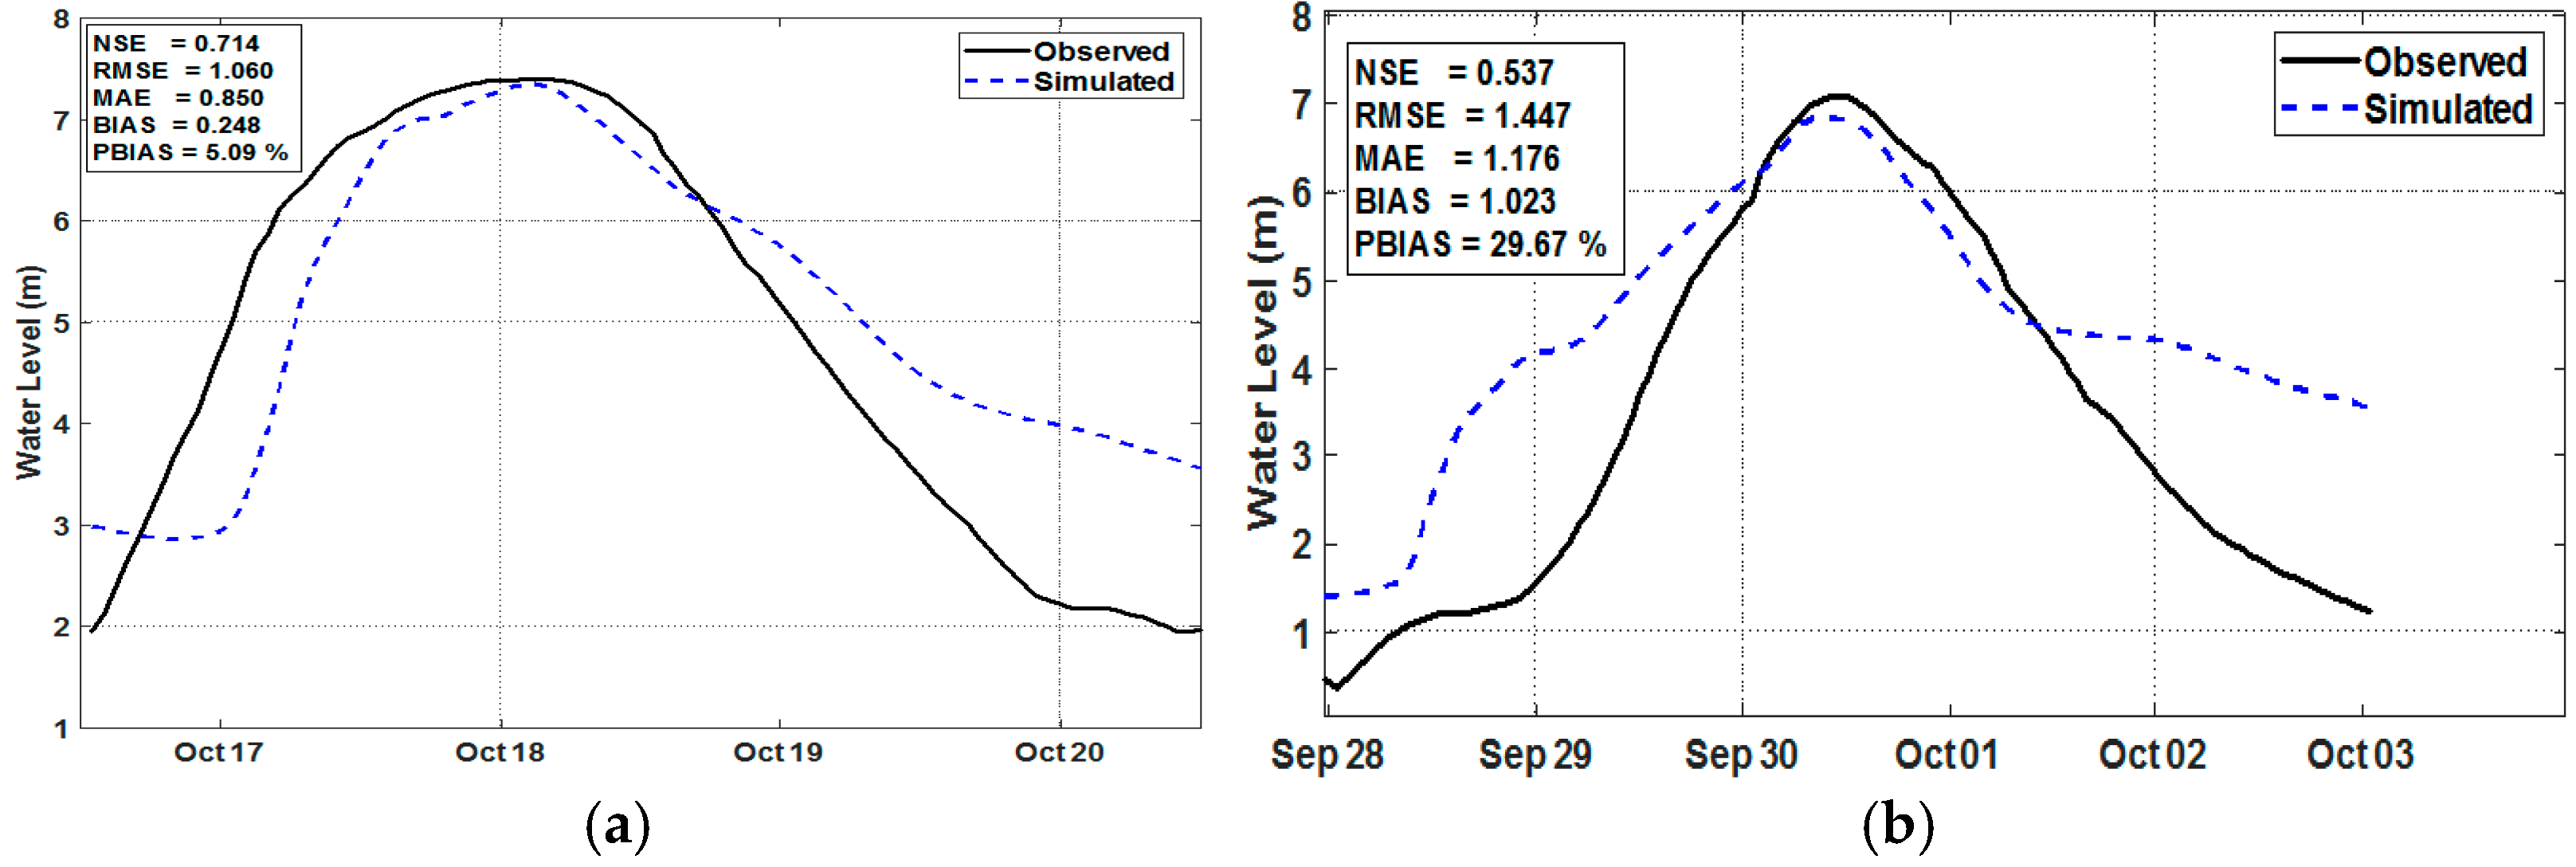
2.3.2. Model Calibration

The study utilizes the Nash–Sutcliffe criterion [24] to assess the agreement between the modeled and the measured data,
NSE = i = 1 n X i - X - 2 - i = 1 n X i - X i 2 i = 1 n X i - X - 2
Here, the following pertains:
X i =Measured value at time I;
X i =Calculated value at time I;
n=Number of pairs of comparison points between actual measured data and calculated data;
X - =Average measured value.
Table 1 shows the goodness-of-fit of the model using the NSE index.
Besides this, other statistical indices such as Root Mean Square Error (RMSE), Mean Absolute Error (MAE), Bias (BIAS) and Percent Bias (PBIAS) [25] are used in this study. PBIAS quantifies the average tendency of the simulated data to either exceed or fall short of their observed counterparts [26]. The ideal value of PBIAS is 0.0, where low-magnitude values suggest an accurate model simulation. Positive values indicate a bias of underestimation by the model, while negative values indicate a bias of overestimation. A PBIAS between ±10% and greater than ±25% are considered very good and poor for evaluating the accuracy of model simulations compared to observed data [25].

2.3.3. Selection of Indicators

As defined by UNDP (2015) [27], risk is the potential for loss of life, injury, or damage to assets within a system or community, calculated based on hazard, exposure, and vulnerability. A hazard refers to a process or event that can cause harm, while exposure indicates the presence of people or assets in areas at risk. Vulnerability describes how susceptible those people or assets are to harm. Exposure alone does not imply vulnerability, but vulnerability cannot exist without exposure. Risk assessments often use land use and built-up area data to evaluate what is at stake in hazard-prone zones. In this study, based on the available of data, several indicators area selected, as shown in Table 2.
Additionally, it is important to note that the selection of indicators highlights several key factors: (1) the region’s dependence on agriculture and fisheries; (2) the increased vulnerability of poorer populations to floods and inundation; (3) a higher proportion of elderly and children correlates with greater sensitivity and vulnerability, especially in terms of housing, which is affected differently depending on construction type; (4) individuals with higher incomes have a greater capacity to recover from natural disasters; (5) greater access to advanced technologies enhances recovery speed; (6) the ability to manage epidemics during and after disasters, along with providing healthcare support, is crucial; (7) a higher proportion of the population participating in health and social insurance provides stronger resources for response and recovery; (8) higher education levels improve information awareness and adaptive capacity; and (9) effective communication systems enhance the access to and dissemination of information, which supports prevention and adaptation, ultimately reducing disaster risk.

2.3.4. Normalization of Data

  • Since indicators have different units and magnitudes, they were normalized to dimensionless values between 0 and 1 for comparison across spatial units.
  • For positively correlated indicators,
y i j = X i j X m i n X m a x X m i n
  • For negatively correlated indicators,
y i j = X m a x X i j X m a x X m i n
Here, i is the index of unit spatial location; j is the index of index components; yij is the normalized value at the i-th spatial unit of the j-th component; Xij is the value of index components; Xmin is the minimum value of the index of the j-th component in all unit locations; Xmax is the maximum value of the index of the j-th component in all unit locations.

2.3.5. Weight Calculation for Component Indicators

After the normalization of the data, weights reflecting the importance and influence of each indicator on hazard, exposure, sensitivity, and adaptive capacity were calculated using the unequal weighting method proposed by Iyengar and Sudarshan (1982) [19], which are widely applied in vulnerability assessments. The key feature of this approach is that it does not require the subjective weighting of criteria by experts. Instead, it uses the statistical variance within each criterion’s data to implicitly determine their influence on the final score, with the aim of greater objectivity. Weights were determined as
w j = C V a r y i j
Here, wj is the weight of the jth index; yij is the normalized value in Equations (7) and (8); C is the normalization constant; Var is the variance. C and Var are determined by the formula
C = j = 1 n 1 V a r y i j 1
V a r y i j = 1 m 1 i = 1 m y i j y j ¯ 2
Here, m is the number of districts/communes/nodes (i = 1, m); n is the number of assessment indicators (j = 1, n); (yj) is the average value of districts/communes/nodes, determined by the following formula:
y j ¯ = 1 m i = 1 m y i j
After the normalization and weighting of the component indicators, the indices at the spatial units are calculated according to the following general formula:
M i = j = 1 n w j y i j ,   i = 1 , m
Here, Mi is the calculation index (hazard (denoted as Hi), exposure level (denoted as Ei), sensitivity level (denoted as Si), adaptive capacity (denoted as ACi)); i is the index of the i-th spatial unit; j is the index of the j-th risk component; n is the total index of the risk components; m is the total number of spatial units; wj is the weight of the j-th component index in the entire spatial unit; yij is the standardized value of the j-th component index, calculated according to Equation (7) or Equation (8).
Calculate vulnerability at spatial units (denoted as Vi).
Vi = (Si × WS) − (ACi × WAC)
Calculate the risk at spatial units (denoted as Ri).
Ri = Hi × Ei × Vi
The assessment indicators must be standardized according to a common scale so that they can be compared with each other. This process will divide the classes in each parameter into five levels of sensitivity to disaster risks—very low, low, medium, high and very high—corresponding to the levels prescribed in Decision No. 18/2021/QD-TTg on forecasting, warning, transmitting disaster information, and disaster risk levels. As a final step, spatial analysis is applied to map the flood risk. The method is implemented within a Geographic Information System (GIS) platform, allowing the criteria (spatial data layers) to be combined geographically to produce a comprehensive flood risk map. A flowchart of the study is presented in Figure 2.

3. Results and Discussion

3.1. Hydrologic–Hydraulic Model Performance
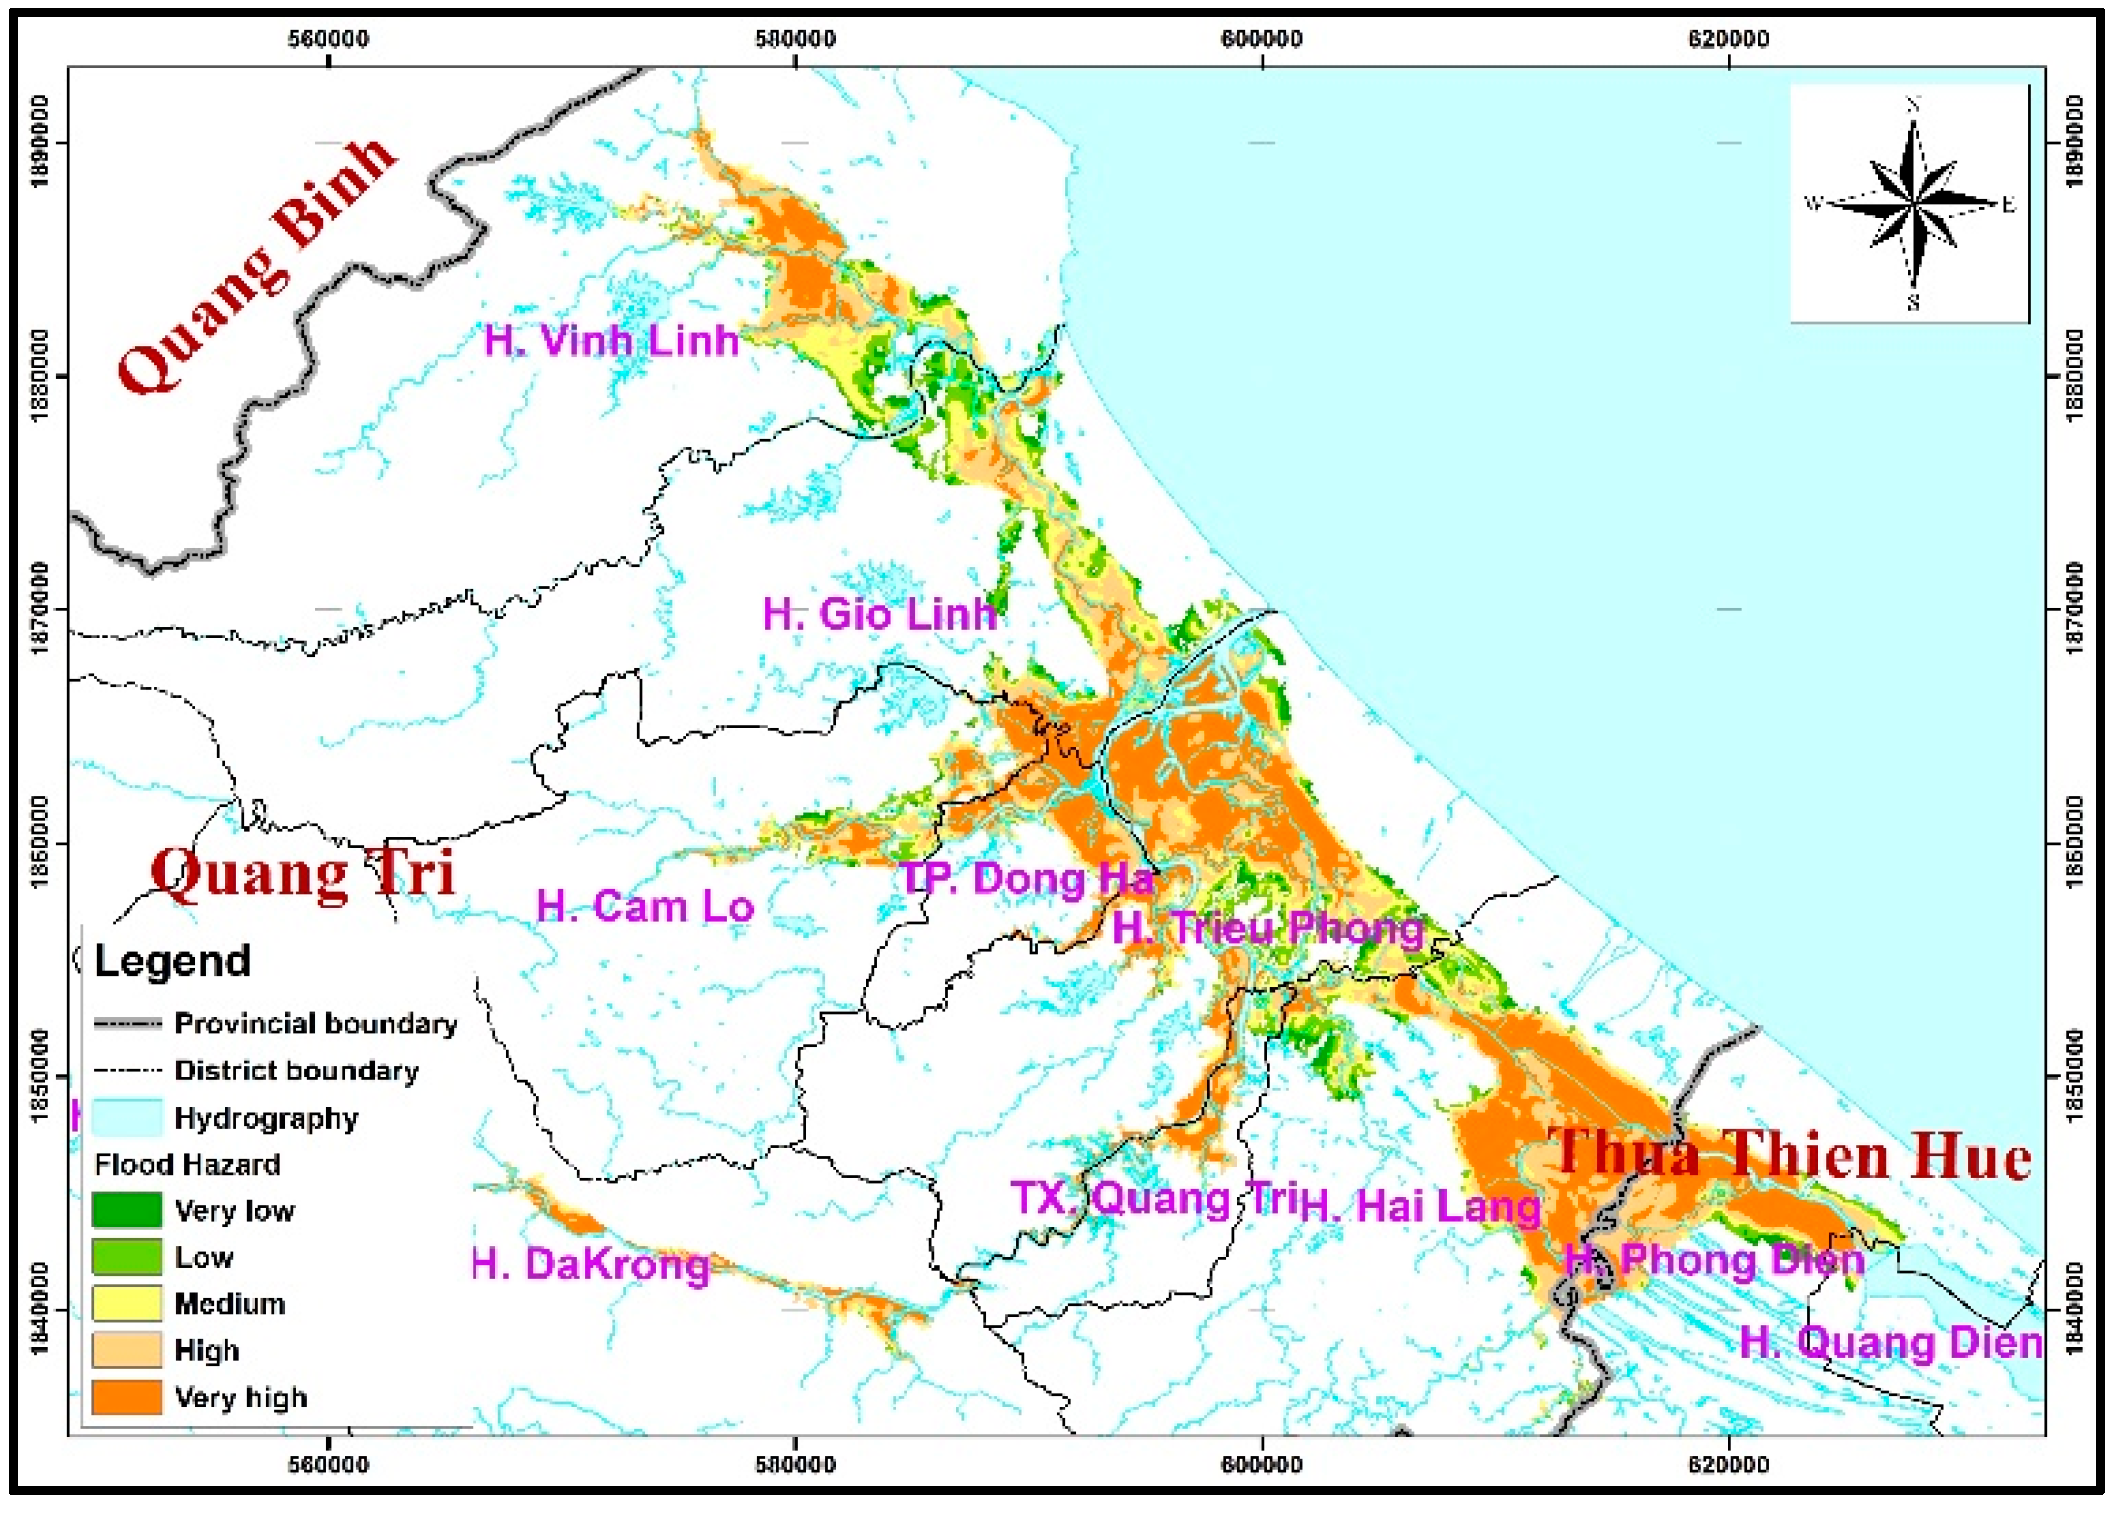
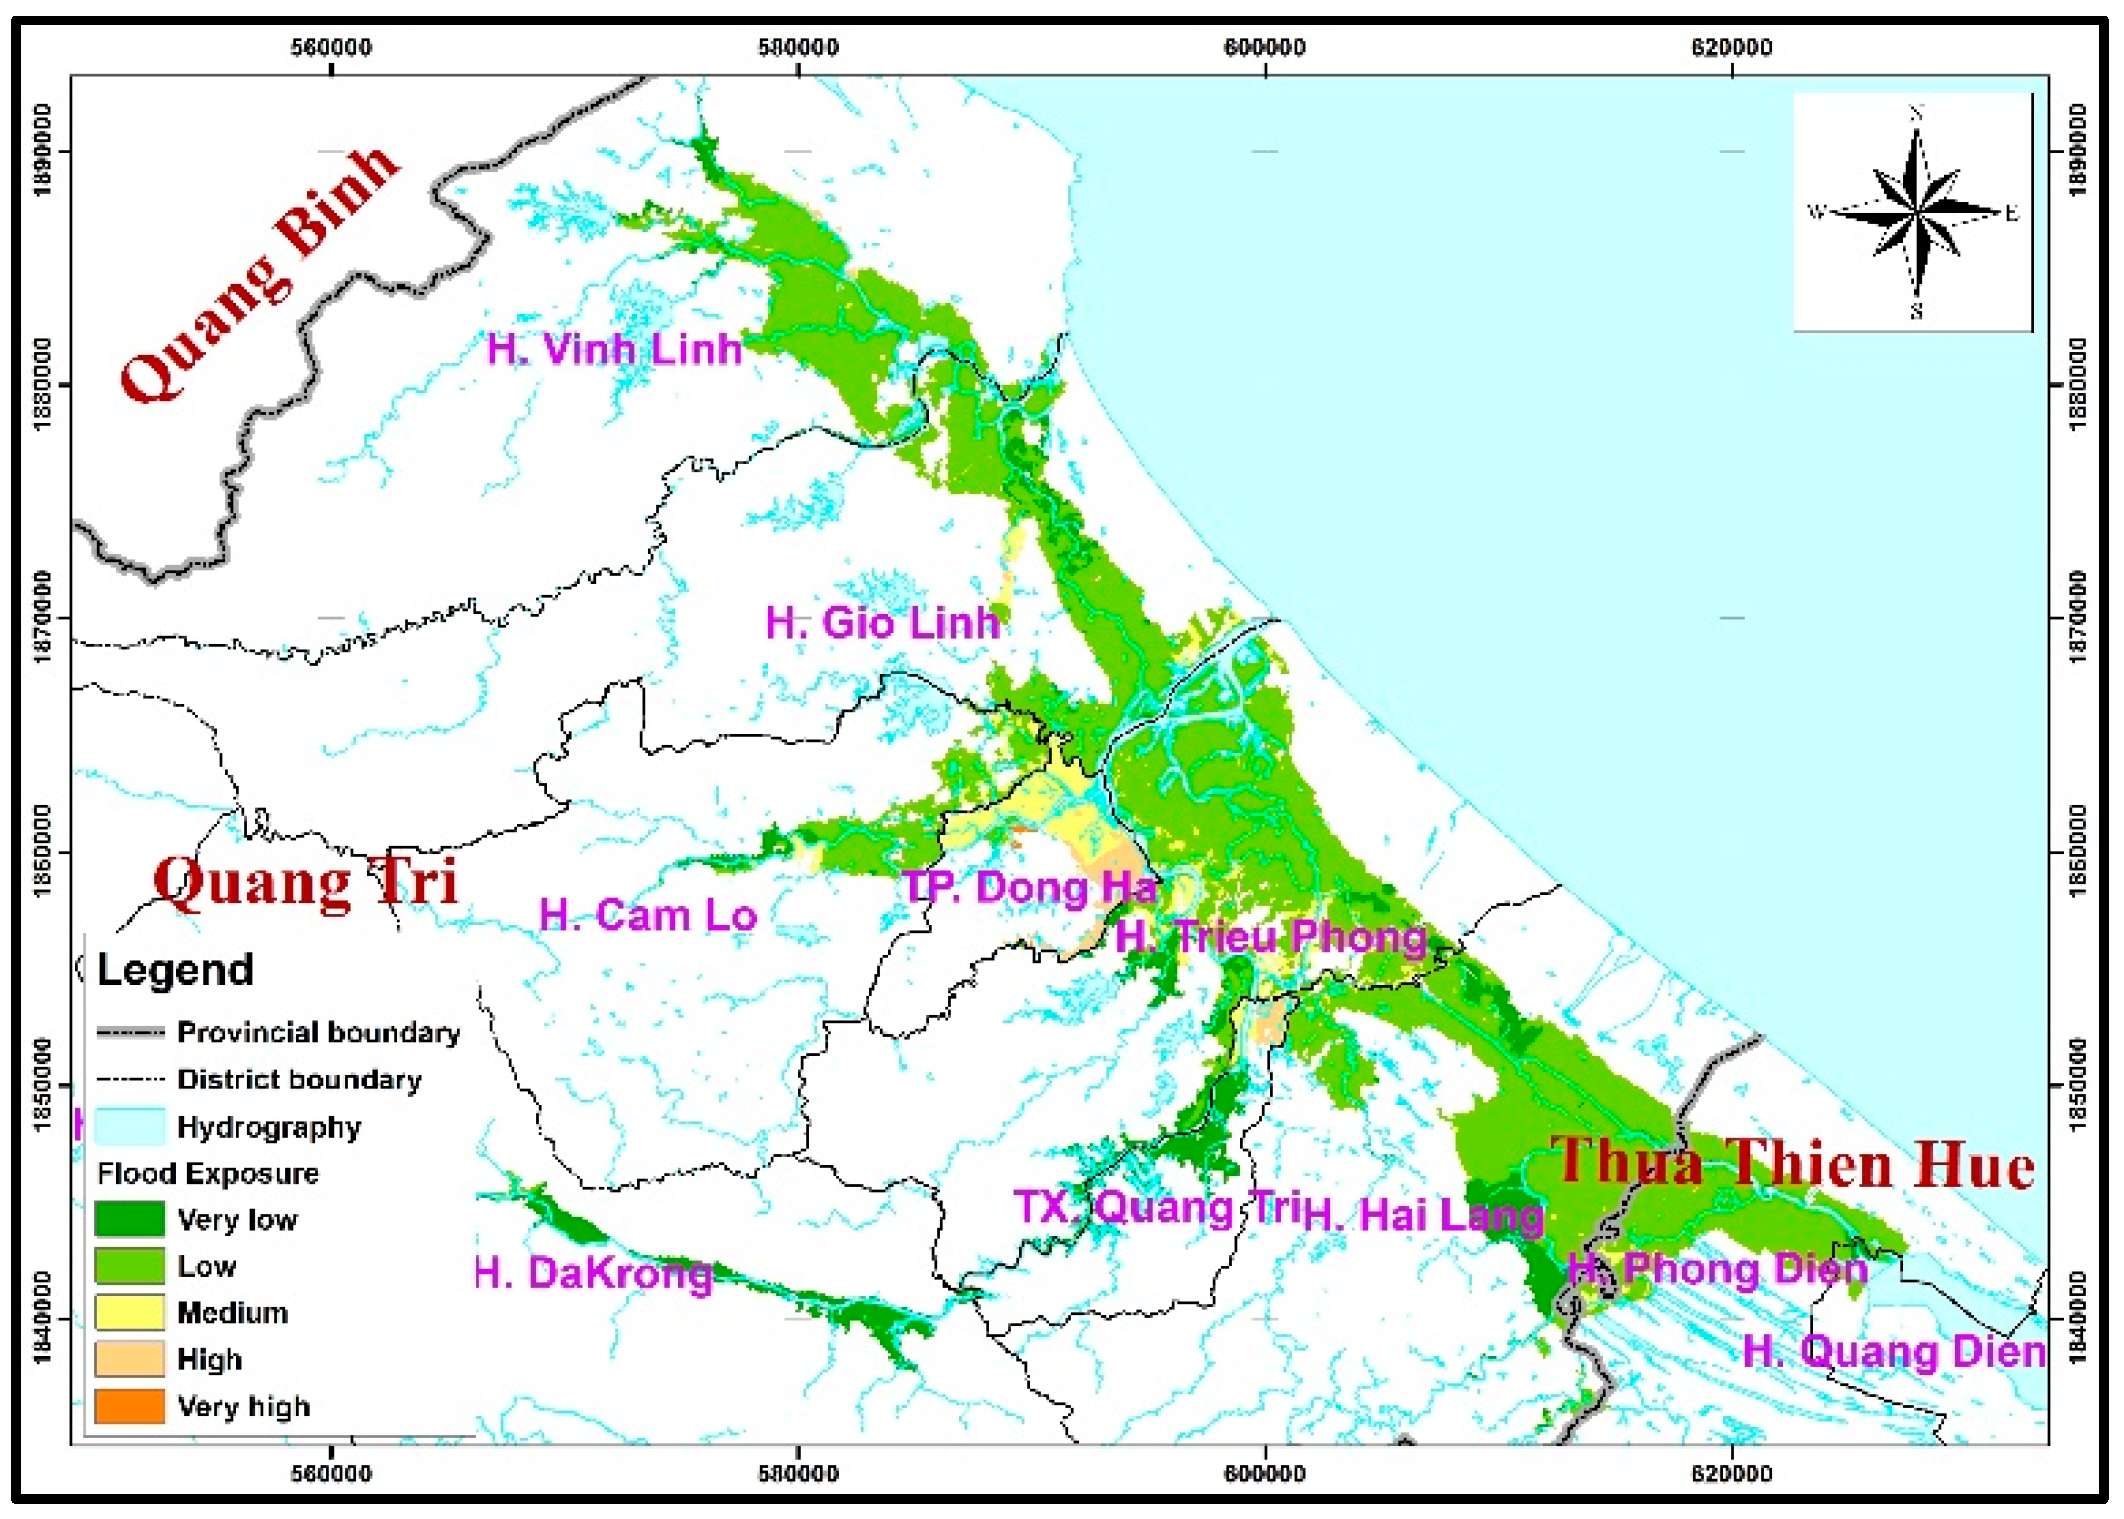
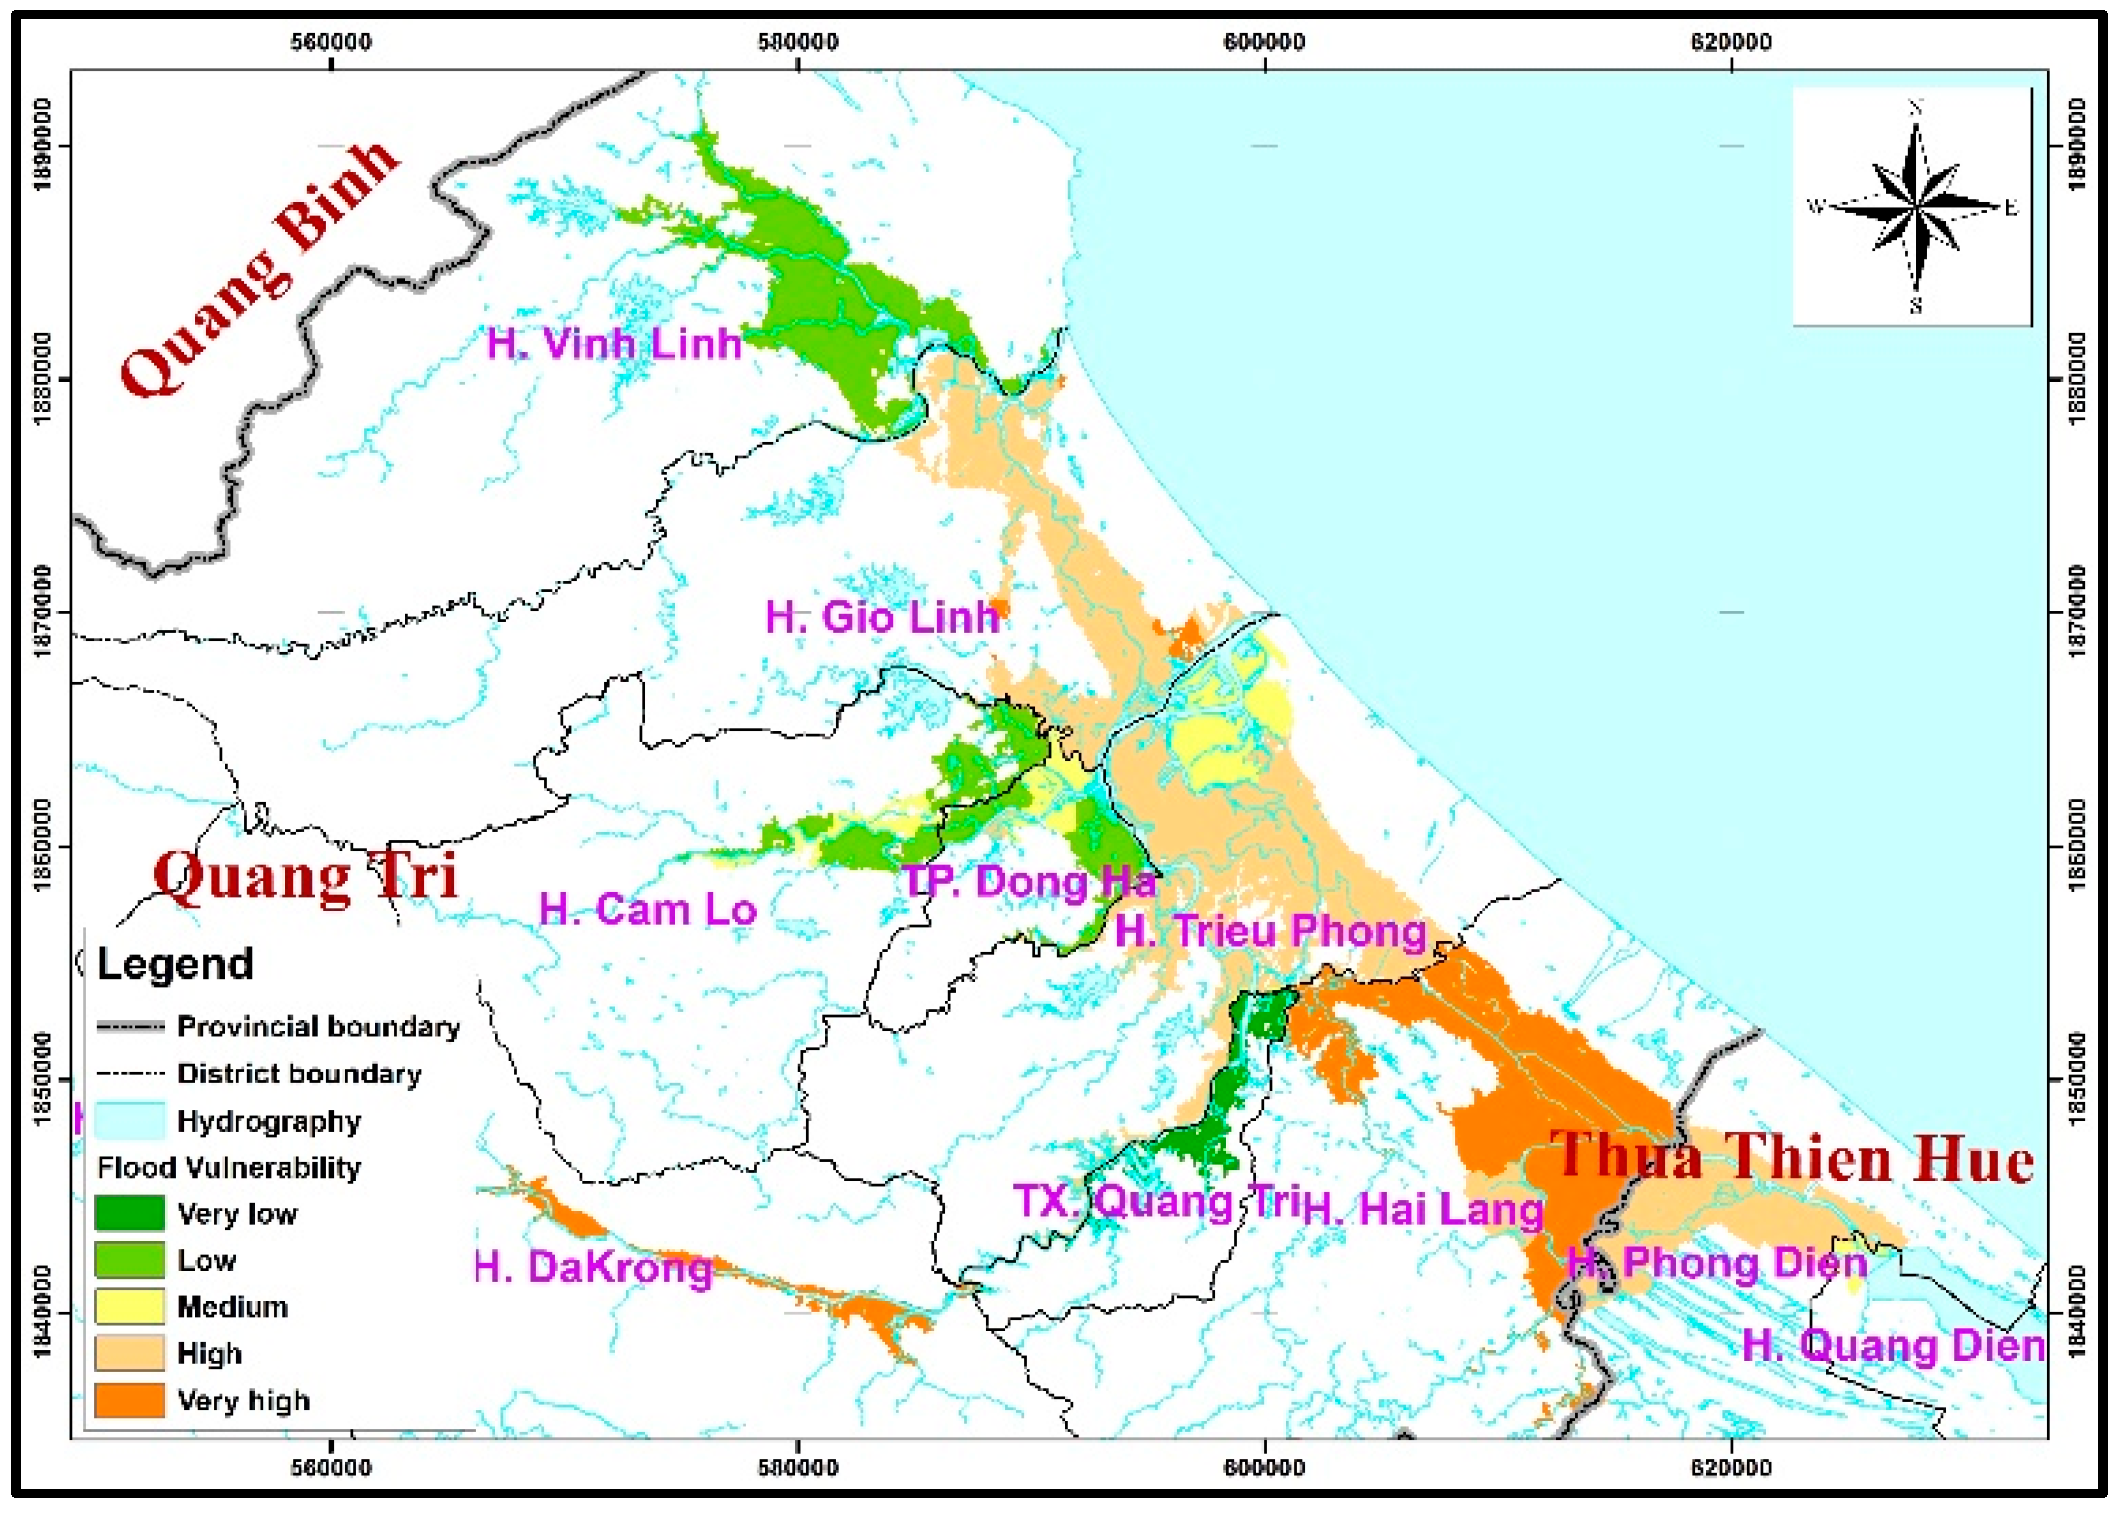
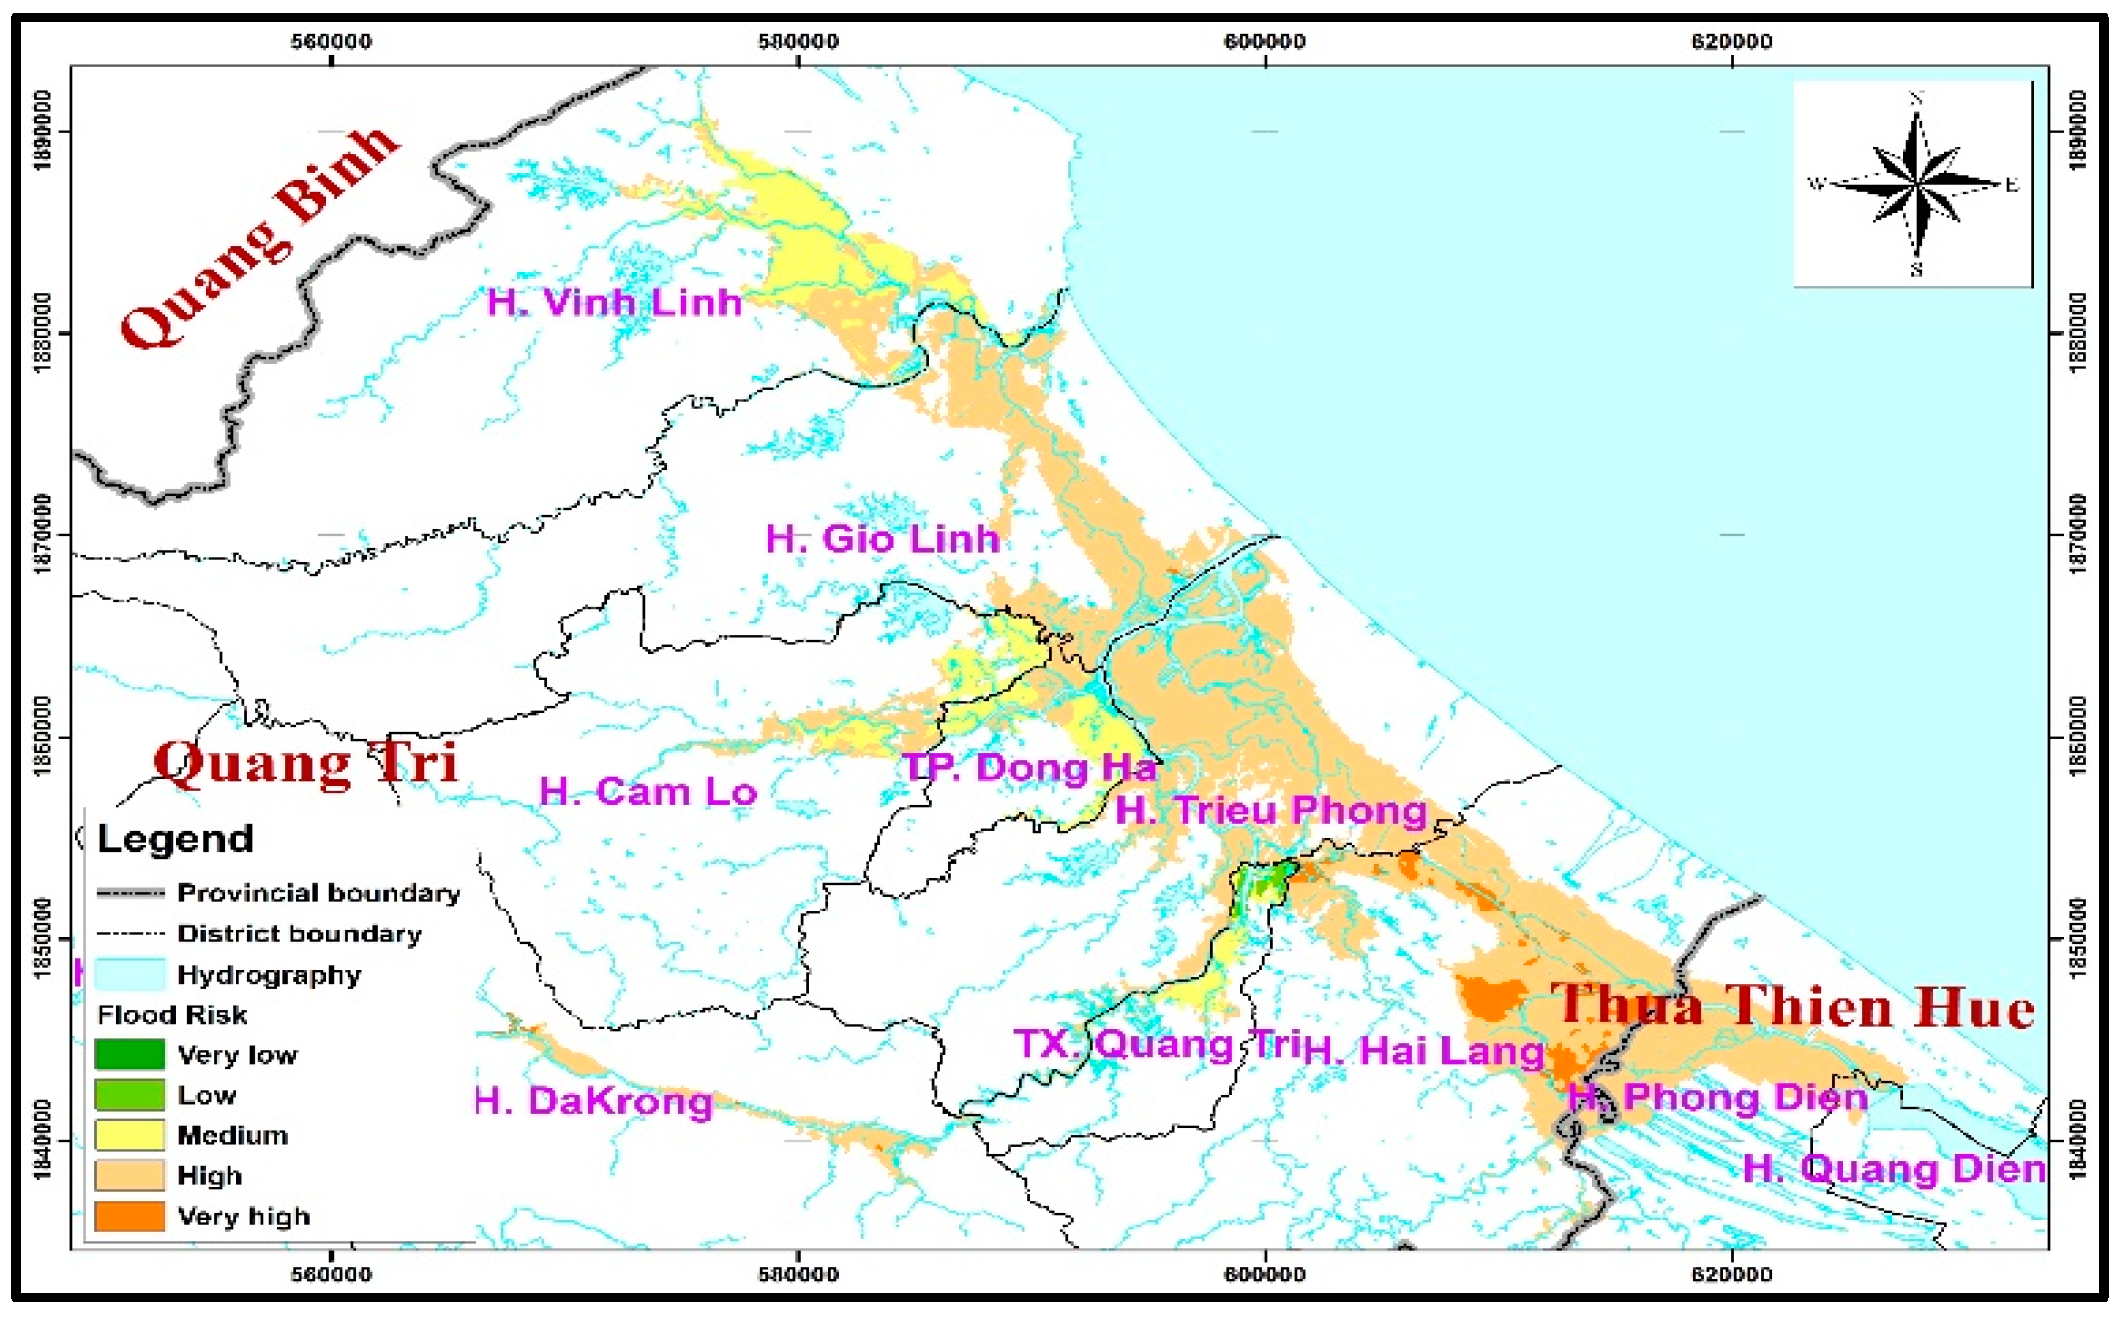
As first step, a network of hydraulic models is created as displayed in Figure 3. The MIKE-FLOOD flood simulation model represents a continuous connection between the Mike11 one-way hydraulic model simulating flood flows on rivers (a river network of 25 interconnected rivers) and the Mike21FM two-way hydraulic model simulating flood flows causing flooding on the coastal plain of Quang Tri province (Figure 3).
The MIKE-FLOOD model was calibrated and validated using hourly water level data series from Hien Luong hydrological station on Ben Hai River and Thach Han station on Thach Han River. The reliability of the results is evaluated using the Root Mean Square Error (RMSE), Mean Absolute Error (MAE), Bias (BIAS), Percent Bias (PBIAS) and Nash–Sutcliffe (NSE) criteria.
Figure 4 illustrates the performance of the hydrological model in simulating water levels at the Hien Luong station through both calibration (October 2020) and validation in 2009. The October 2020 flood event serves as a real-world test, validating the map’s ability to identify areas that actually experienced high flood impact. In the calibration period, the model captures the temporal dynamics of the observed hydrograph with a high degree of accuracy, particularly in terms of peak water level and timing, with statistical indices including NSE (0.71), RMSE (0.284 m), MAE (0.238 m), BIAS (−0.05) and PBIAS (−2.7%). Although minor deviations are observed during the rising and recession limbs, the overall agreement between observed and simulated data suggests a well-calibrated model. Similarly, during the validation period, the model demonstrates a strong predictive capability, successfully reproducing the peak discharge and general trend of the flood event with statistical indices (i.e., including NSE (0.9), RMSE (0.197 m), MAE (0.147 m), BIAS (0.001), PBIAS (0.09%)). The close correspondence between simulated and observed water levels in both periods underscores the model’s robustness and suitability for flood simulation and forecasting in the region.
The Figure 5 presents the calibration and validation results of simulated water levels at the Thach Han station for two distinct flood events, namely, October 2020 and 2009, respectively. During the calibration period, the simulated water level closely follows the observed hydrograph, accurately reproducing the overall shape and timing of the flood peak, although a slight underestimation is evident during the recession phase, with statistical indices including NSE (0.71), RMSE (1.06 m), MAE (0.85 m), BIAS (0.248), and PBIAS (5.09%). In the validation period, the model also performs well, successfully capturing the timing and magnitude of the peak water level. The statistical indices are NSE (0.53), RMSE (1.447 m), MAE (1.176 m), BIAS (1.023) and PBIAS (29.67%). Minor discrepancies are observed in the rising limb, where the simulated curve rises slightly earlier than the observed data. Nevertheless, the general agreement in both calibration and validation phases confirms the model’s capacity to simulate flood dynamics at Thach Han station with acceptable accuracy.

3.2. Flood Risk

After calculating the weights for each indicator, maps of flood hazard, exposure and vulnerability are created. By overlaying these maps, a flood risk map is created. As shown in Figure 6, the spatial distribution of flood hazard in Quang Tri province is largely influenced by a combination of topography, hydrological networks, land use, and human settlement patterns. High and very high flood hazard zones are concentrated along major river systems such as the Thach Han and O Lau Rivers, where flat terrain and low elevation create favorable conditions for water accumulation and slow drainage during heavy rainfall or upstream discharge. These floodplains are also densely populated and intensively used for agriculture, which reduces natural infiltration and increases surface runoff. Urban development in low-lying areas like Dong Ha and Quang Tri further exacerbates flood risks due to impermeable surfaces and limited drainage capacity. Moreover, upstream deforestation and changes in watershed characteristics may contribute to increased runoff volume and speed, intensifying flood impacts downstream. These factors together explain the heightened vulnerability in specific zones and underscore the importance of integrating land use planning with flood risk reduction. The flood hazard levels indicate that very high and high risks account for a substantial 70.22% of the total area, with 43.76% and 26.46%, respectively. These high-risk zones are mainly found in the Thach Han and O Lau river basins, and the upper reaches of the Ben Hai River. In contrast, medium- and low-hazard areas comprise only 26.10% of the total area, primarily located in the Ben Hai River basin and parts of Trieu Phong and Hai Lang districts. Very low-hazard areas make up just 3.77% of the total area, scattered across Vinh Son and Hien Thanh communes in Vinh Linh district, as well as Trieu Long and Trieu Tai communes in Trieu Phong district. These data highlight a significant vulnerability to flooding in the region, especially in the lower reaches of major rivers.
Figure 7 shows the flood exposure in Quang Tri. The flood exposure levels in Quang Tri province highlight areas with varying degrees of susceptibility to flood-related impacts. Notably, the green zones, representing high exposure, are closely aligned with major river basins and low-lying coastal areas, particularly in districts such as Vinh Linh, Gio Linh, Hai Lang, and Phong Dien. These regions are characterized by dense population, intensive agricultural activities, and proximity to hydrological networks, all of which increase the likelihood of human and infrastructural exposure during flood events. The spatial pattern suggests that exposure is not uniformly distributed, but rather concentrated in accessible flatlands and river deltas where socio-economic activities are clustered. These areas, despite being fertile and economically significant, face elevated risks due to the intersection of natural flood pathways and human presence. This underscores the need for adaptive land-use planning, early warning systems, and infrastructure reinforcement in highly exposed zones to mitigate the potential impacts of future flood events. The historic October 2020 flood demonstrated that flood risk varies dramatically between communes downstream.
The map presents the flood vulnerability distribution across Quang Tri province, emphasizing areas at heightened risk due to socio-economic and physical sensitivity. Very high- and high-vulnerability zones are concentrated in the coastal districts, such as Hai Lang, Quang Tri town, and Phong Dien, where population density is higher and housing, livelihoods, and infrastructure are more exposed to flood damage. These areas often lack resilient structures, have limited access to adaptive technologies, and host large proportions of vulnerable populations—including the elderly, children, and low-income households. Moreover, agriculture-dependent communities in these zones face greater recovery challenges, especially where public services and emergency support are limited. The inland regions like Gio Linh and Vinh Linh also exhibit moderate vulnerability, likely due to socio-economic constraints despite lower flood intensity. This indicates that low flood exposure occupies the largest area, accounting for 75.05%, and is predominantly found in most communes along the upper reaches of the Ben Hai River, as well as the lower reaches of the Thach Han and O Lau rivers. Very low exposure follows, comprising 14.66% of the area, primarily located in certain communes of the Ben Hai River basin and in Dakrong district. The remaining three exposure levels cover relatively small areas, mainly distributed in isolated communes and wards, such as Dong Le ward and Dong Luong ward in Dong Ha City, wards 2 and 3 in Quang Tri town, and Ho Xa and Gio Linh townships in Vinh Linh and Gio Linh districts, respectively.
The spatial variation in vulnerability reflects both natural conditions (e.g., elevation, terrain) and adaptive capacity, highlighting the need for targeted investment in infrastructure, education, healthcare access, and insurance systems to reduce vulnerability and enhance community resilience. The assessment of vulnerability (V) to flooding in the study area, as shown in Figure 8, reveals that high vulnerability accounts for the largest area at 45.11%, primarily in Trieu Phong, Phong Dien, and Gio Linh districts. Very high vulnerability follows, at 22.77%, mainly in three communes of Dakrong district, the Gio Viet commune in Gio Linh, and several communes in Hai Lang district. Low vulnerability comprises 20.12%, predominantly in the upper reaches of the Ben Hai River, including communes in Vinh Linh and some in Cam Lo districts.
The remaining vulnerability levels, very low and medium, cover smaller areas, with level 3 found in isolated communes such as Dong Thanh ward and Triệu An commune. Certain areas in Quang Tri town, like ward 3 and Hai Le commune, exhibit low vulnerability. Despite the high vulnerability in Dakrong district, floods typically recede quickly here due to steep terrain. These findings highlight the potential vulnerability of the region to flooding, and serve as a basis for future flood risk assessments.
The analysis of the data in Table 3 indicates that very low-risk areas occupy the smallest area, totaling only 8.16 ha (0.02%). Low-risk areas cover 259.24 ha (0.54%), primarily located in wards 2 and 3 of Quang Tri town. Medium-risk areas account for 7951 ha (16.54%), predominantly found in communes along the upper reaches of the Ben Hai River, including Cam Lo district, Dong Le ward, Trieu Giang commune, and the Hai Le commune. High-risk areas represent the largest portion, at 38,030.08 ha (79.13%), encompassing most of the heavily flood-affected regions in the lower reaches of the Thach Han, O Lau, and Ben Hai rivers. Very high-risk areas cover 1809.28 ha (3.76%), scattered across Hai Phong, Dien Sanh, Hai Hung, and Hai Quy communes in Hai Lang district, which have a limited capacity to respond to flooding. The percentages (3.76% level 5, 16.54% level 3) provide quantitative metrics for authorities to understand the scales of highest- and medium-risk exposure within the downstream region. As observed, approximately 3.76% of the study area, specifically the downstream communes, is classified at this critical level, level 5, indicating these regions are the most susceptible to severe flooding impacts. About 16.54% of the study area is categorized as medium risk, level 3, reflecting a significant vulnerability that is less extreme than that of level 5.
Figure 9 shows the flood risk map for Quang Tri province. As can be observed that the flood risk map accurately identifies the spatial distribution of the most severe hazards, particularly in high-risk communes such as Hai Phong, Dien Sanh, Hai Hung, and Hai Quy. This spatial specificity is critical for targeted resource allocation, enabling the prioritization of both structural measures (e.g., dyke reinforcement, reservoir construction) and non-structural interventions (e.g., land-use zoning, enhanced building codes, flood-proofing infrastructure, and wetland restoration) in areas with the highest vulnerability.

3.3. Discussions

Both MIKE-GIS [28] and SWMM-GIS [29,30] integrations provide valuable approaches for inundation mapping with a focus on urban areas, but with distinct technical characteristics. MIKE-GIS (particularly MIKE-FLOOD) demonstrates superior hydrodynamic modeling capabilities for coastal zones, accurately simulating complex interactions between tidal surges, wave overtopping, and rainfall–runoff processes through its coupled 1D-2D modeling framework. In contrast, SWMM-GIS integration excels in urban flood modeling, with optimized algorithms for stormwater drainage systems and faster computation times for rainfall–runoff scenarios. The GIS integration in both systems enables spatial analysis and visualization, but MIKE typically offers more sophisticated tools for coastal-specific parameters like salinity intrusion and sediment transport. While SWMM’s open-source nature and simpler parameterization make it more accessible for municipal applications, MIKE’s comprehensive coastal modeling suite provides greater accuracy for large-scale coastal inundation studies, albeit with higher computational demands and steeper learning curves. Both approaches face common limitations in tems of data requirements and validation challenges, though MIKE generally handles extreme coastal events more robustly due to its specialized numerical schemes. When simulating flood inundation in Quang Tri Province, the MIKE modeling system has been demonstrated to be the most effective tool, particularly due to its robust hydrodynamic capabilities in handling complex interactions between river systems and coastal processes, as shown in Section 3.1. The model allows for the integration of tidal boundary conditions from the East Sea while accounting for upstream dam operations—a key flood driver in the Thach Han basin, making it particularly suitable for addressing Quang Tri’s dual river–coastal flood risks

4. Conclusions

This study presents a comprehensive flood risk map for practical application in the downstream areas of river basins within Quang Tri Province. The mapping methodology combines the unweighted approach of Iyengar and Sudarshan with multi-criteria analysis, utilizing Geographic Information System (GIS) technology. The results from the historical flood scenario in 2020 indicate that nearly all communes in the study area are classified as having a high flood risk (level 4), encompassing a substantial area of 79.13%. This finding underscores the severe socio-economic impacts that flooding can have in Quang Tri Province. Notably, certain areas exhibit very high risk levels (level 5), including Hai Phong, Dien Sanh, Hai Hung, and Hai Quy communes in Hai Lang District, which account for 3.76% of the total area. Additionally, the area classified as medium-risk (level 3) comprises approximately 16.54%. Conversely, areas with low (level 2) and very low (level 1) risk levels are minimal, representing less than 5% of the total area. This indicates that the overall safety levels in the study area are low, with a predominant classification of high flood risk.

Author Contributions

Conceptualization, N.T.H., N.T.T., N.M.D. and T.V.C.; methodology, N.T.H., N.T.T., N.M.D., T.V.C. and V.D.C.; software, V.D.C., T.Q.Q. and N.T.H.; validation, N.T.H., N.M.D. and N.T.T.; formal analysis, N.T.H., N.T.T. and T.Q.Q.; investigation, N.T.H., N.M.D., T.V.C., V.D.C. and T.Q.Q.; data curation N.T.H., N.M.D., V.D.C., T.Q.Q. and T.V.C.; writing—original draft preparation, N.T.H., N.T.T. and N.M.D.; writing—review and editing, N.T.H., N.T.T. visualization, N.T.H., N.T.T., V.D.C. and T.Q.Q. All authors have read and agreed to the published version of the manuscript.

Funding

This study was funded by the Ministry of Science and Technology research project “Studying and applying the advanced technology in the establishment of an early warning system for natural disaster risks of flooding and inundation in Quang Tri province and adjacent areas. Nr. Code: ĐTĐLCN.81/22”.

Data Availability Statement

The original contributions presented in this study are included in the article. Further inquiries can be directed to the corresponding author.

Acknowledgments

The authors would like to express their gratitude to the People’s Committee of Quang Tri Province and the Ministry of Science and Technology for their support regarding data and funding.

Conflicts of Interest

The authors declare no conflicts of interest.

References

  1. IPCC. The Physical Science Basis: Working Group I Contribution to the Fifth Assessment Report of the Intergovernmental Panel on Climate Change; Cambridge University Press: Cambridge, UK, 2013; Available online: https://www.ipcc.ch/report/ar5/wg1 (accessed on 25 June 2025).
  2. MONRE. Climate Change and Sea Level Rise Scenarios for Vietnam; Ministry of Natural resources and Environment: Hanoi, Vietnam, 2016. [Google Scholar]
  3. GFDRR. Country Profile: Vietnam. 2011. Available online: https://www.gfdrr.org/en/publication/fiscal-impact-natural-disasters-vietnam (accessed on 10 March 2025).
  4. World Bank. Vietnam: Toward a Safe, Clean, and Resilient Water System. 2019. Available online: https://www.worldbank.org/en/country/vietnam/publication/vietnam-toward-a-safe-clean-and-resilient-water-system (accessed on 18 December 2024).
  5. Nguyen, H.D. Flood susceptibility assessment using hybrid machine learning and remote sensing in Quang Tri province, Vietnam. Trans. GIS 2022, 26, 2776–2801. [Google Scholar] [CrossRef]
  6. Nguyen, H.D.; Dang, D.K.; Nguyen, Y.N.; Van, C.P.; Truong, Q.H.; Bui, Q.T.; Petrisor, A.I. A framework for flood depth using hydrodynamic modeling and machine learning in the coastal province of Vietnam. Vietnam J. Earth Sci. 2023, 45, 456–478. [Google Scholar] [CrossRef] [PubMed]
  7. Chi, V.T.; Quang, D.N.; Tinh, N.X.; Tanaka, H. Estimation of floodwater depth in Quang Tri province using Sentinel-1 data. Tohoku J. Nat. Disaster Sci. 2022, 58, 99–104. [Google Scholar]
  8. Van, C.T.; Tuan, N.C.; Son, N.T.; Tri, D.Q.; Anh, L.N.; Tran, D.D. Flood vulnerability assessment and mapping: A case of Ben Hai-Thach Han River basin in Vietnam. Int. J. Disaster Risk Reduct. 2022, 75, 102969. [Google Scholar] [CrossRef]
  9. King, D.; Davidson, J.; Anderson-Berry, L. Disaster mitigation and societal impacts. In Global Perspectives on Tropical Cyclones; World Scientific Publishing: Singapore, 2010; pp. 409–436. [Google Scholar] [CrossRef]
  10. Sahoo, B.; Bhaskaran, P.K. Multi-hazard risk assessment of coastal vulnerability from tropical cyclones—A GIS based approach for the Odisha coast. J. Environ. Manag. 2018, 206, 1166–1178. [Google Scholar] [CrossRef] [PubMed]
  11. Zhang, K.; Shalehy, H.; Ezaz, G.T.; Chakraborty, A.; Mohib, K.M.; Liu, L. An integrated flood risk assessment approach based on coupled hydrological-hydraulic modeling and bottom-up hazard vulnerability analysis. Environ. Model. Softw. 2022, 148, 105279. [Google Scholar] [CrossRef]
  12. Zhang, J.; Chen, Y. Risk assessment of flood disaster induced by typhoon rainstorms in Guangdong province, China. Sustainability 2019, 11, 2738. [Google Scholar] [CrossRef]
  13. Kaźmierczak, A.; Cavan, G. Surface water flooding risk to urban communities: Analysis of vulnerability, hazard and exposure. Landsc. Urban Plan. 2011, 103, 185–197. [Google Scholar] [CrossRef]
  14. Pham, B.T.; Luu, C.; Van Dao, D.; Van Phong, T.; Nguyen, H.D.; Van Le, H.; von Meding, J.; Prakash, I. Flood risk assessment using deep learning integrated with multi-criteria decision analysis. Knowl.-Based Syst. 2021, 219, 106899. [Google Scholar] [CrossRef]
  15. da Silva, L.B.L.; Alencar, M.H.; de Almeida, A.T. Exploring global sensitivity analysis on a risk-based MCDM/A model to support urban adaptation policies against floods. Int. J. Disaster Risk Reduct. 2022, 73, 102898. [Google Scholar] [CrossRef]
  16. Nguyen, M.D.; Babel, M.S.; Luong, H.T. Evaluation of food risk parameters in the day river flood diversion area, Red River delta, Vietnam. Nat. Hazards 2011, 56, 169–194. [Google Scholar]
  17. Trinh, V. Flood Risk Assessment for Thach Han River Basin, Quang Tri Province. Master’s Thesis, University of Science, VNU, Hanoi, Vietnam, 2010. [Google Scholar]
  18. Can, T.V. Research on Establishing Scientific Basis for Assessing Flood Vulnerability in Vu Gia—Thu Bon River Basin to Serve Disaster Prevention Planning. Ph.D. Thesis, University of Science, VNU, Hanoi, Vietnam, 2015. [Google Scholar]
  19. Iyengar, N.S.; Sudarshan, P. A Method of Classifying Regions from Multivariate Data. Econ. Political Wkly. 1982, 17, 2047–2052. [Google Scholar]
  20. Huynh, T.L.H. Research on Scientific and Technological Solutions for Multi-Disaster Management, Develop Decision Support Tools to Respond to Multi-Disasters, and Apply Them on a Pilot Basis in the Coastal Area of Central Central Vietnam; National Project Code Nr. KC.08.24/16-20; Science and Technology Publishing House: Hanoi, Vietnam, 2020. [Google Scholar]
  21. Nguyen, X.H. Research on Building a Warning System for Natural Disaster Risk Levels of Storms and Tropical Depressions Based on Hydrometeorological Forecast Bulletins and Testing Application for the North Central Region; National Project Code Nr. KC.08.36/16-20; Science and Technology Publishing House: Hanoi, Vietnam, 2021. [Google Scholar]
  22. Giang, V.T.; Bac, D.K.; Chi, V.K.; Minh, N.D.; Van Liem, N.; Van Bao, D.; Nga, P.T.P. Assessment of flood vulnerability in coastal areas of Ha Tinh province. J. Geospat. Humanit. Res. 2021, 4, 2021. (In Vietnamese) [Google Scholar]
  23. DHI 2017 MIKE User and Reference Manual. Denmark. Available online: https://www.dhigroup.com/ (accessed on 20 March 2024).
  24. Nash, J.E.; Sutcliffe, J.V. River flow forecasting through conceptual models part I—A discussion of principles. J. Hydrol. 1970, 10, 282–290. [Google Scholar] [CrossRef]
  25. Moriasi, D.N.; Arnold, J.G.; van Liew, M.W.; Bingner, R.L.; Harmel, R.D.; Veith, T.L. Model Evaluation Guidelines for Systematic Quantification of Accuracy in Watershed Simulations. Trans. ASABE 2007, 50, 885–900. [Google Scholar] [CrossRef]
  26. Gupta, H.V.; Sorooshian, S.; Yapo, P.O. Status of automatic calibration for hydrologic models: Comparison with multilevel expert calibration. J. Hydrol. Eng. 1999, 4, 135–143. [Google Scholar] [CrossRef]
  27. UNDP. Viet Nam Special Report on Managing the Risks of Extreme Events and Disasters to Advance Climate Change Adaptation. 2015. Available online: https://www.vn.undp.org/content/vietnam/en/home/library/environment_climate/viet_nam_special_report_on_managing_the_risks_of_extreme_events_and_disasters.html (accessed on 15 December 2024).
  28. Nguyen, C.C.; Nguyen, B.Q.; Le, X.C.; Pham, L.T.; Vo, D.P.; Nguyen, T.H.; Vo, N.D. Urban inundation forecasting based on hydraulic models coupling MIKE Flood and MIKE Urban: A case study of Tam Ky City, Vietnam. River 2023, 2, 518–529. [Google Scholar] [CrossRef]
  29. Ngan, N.T.; Trung, N.H. Application of GIS and SWMM model to assess urban flooding in Hung Phu 1 Residential Area of Cai Rang District. J. Earth Sci. Environ. 2024, 8, 953–964. [Google Scholar]
  30. Lu, M.; Ni, T.; Ying, X. Urban flood risk analysis based on GIS and SWMM: A case study in Dujiangyan. In Advances in Measurement Technology, Disaster Prevention and Mitigation, Proceedings of the 3rd International Conference on Measurement Technology, Disaster Prevention and Mitigation (MTDPM 2022), Zhengzhou, China, 27–29 May 2022; CRC Press: Boca Raton, FL, USA, 2022; pp. 104–109. [Google Scholar]
Figure 1. The study area.
Water 17 01958 g001
Figure 2. Flowchart of the study.
Water 17 01958 g002
Figure 3. Hydraulic networks simulated in MIKE 11 with open-inflow boundaries Q~T and water-level boundaries H~T (a), and Bathymetry in MIKE-FLOOD (b).
Water 17 01958 g003
Figure 4. Hydraulic model performance for water level at Hien Luong for calibration (a) in Oct 2020 and validation (b) in 2009.
Water 17 01958 g004
Figure 5. Hydraulic model performance for water level at Thach Han for calibration (a) in October 2020 and validation (b) in September 2009.
Water 17 01958 g005
Figure 6. Flood hazard in Quang Tri.
Water 17 01958 g006
Figure 7. Flood exposure map in Quang Tri.
Water 17 01958 g007
Figure 8. Vulnerability of Quang Tri province to flooding.
Water 17 01958 g008
Figure 9. Risk of flood in Quang Tri province.
Water 17 01958 g009
Table 1. The goodness-of-fit.
NSE ValueThe Goodness of Fit
NSE ≤ 0.40Bad
0.40 < NSE ≤ 0.70Average
0.70 < NSE ≤ 0.85Good
0.85 < NSE ≤ 1.00Excellent
Table 2. List of indicators selected for the analysis of flooding risk.
GroupCriteriaIndicatorUnit
Hazard
(H)
Flooding (H1)Inundation depth (H11)m
Velocity (H12)m/s
Time of inundation (H13)day
Exposure
(E)
Population (E1)Population density (E11)person/km2
Lan use (E2)Lan use (E21)ha
Infrastructure (E3)Number of schools at all level (E31)school
Traffic density (E33)km/km2
Sensitivity (S)Agriculture (S1)Large agricultural products (S11)Million tons
Fisheries output (S12)Million tons
Society (S2)Rate of poor and near-poor households (S21)%
Proportion of elderly and children (0–15 years old; over 64 years old) (S22)%
Housing conditions (S3)Percentage of solid houses (S31)%
Temporary housing rate (S32)%
Adaptive Capacity (AC)Economy (AC1)Per capita income (AC11)Million VNĐ per year
Food crop yield (AC21)Ton/hectare
Health (AC2)Number of medical staff (AC21)People/10,000 people
Number of hospital beds (AC22)Beds/10,000 people
Percentage of people participating in insurance (AC23)%
Education (AC3)Ratio of high school graduates to total population (AC31)%
Information, communication (AC4)Percentage of mobile phone users (AC41)%
Percentage of people using the internet (AC42)%
Disaster prevention (AC5)Number of safe places for Evacuation (e.g., community housing) (AC51)point
Propaganda and training on disaster prevention and mitigation (AC52)point
Table 3. Areas of flood risk zones.
Risk LevelLevelArea (ha)Percentage (%)
Very low-level risk zone18.160.02
Low-level risk zone2259.240.54
Medium-level risk zone37951.0016.54
High-level risk zone438,030.0879.13
Very high-level risk zone 51809.283.76
Disclaimer/Publisher’s Note: The statements, opinions and data contained in all publications are solely those of the individual author(s) and contributor(s) and not of MDPI and/or the editor(s). MDPI and/or the editor(s) disclaim responsibility for any injury to people or property resulting from any ideas, methods, instructions or products referred to in the content.

