Article

A Pilot-Scale Study on Cross-Tube Ozone Catalytic Oxidation of Biochemical Tailwater in an Industrial Park in Suzhou (China)

1
School of Resources and Environmental Engineering, Hefei University of Technology, Hefei 230009, China
2
Wancho Environmental-Protection Co., Ltd., Suzhou 234000, China
*
Authors to whom correspondence should be addressed.
Water 2025, 17(13), 1953; https://doi.org/10.3390/w17131953
Submission received: 26 May 2025 / Revised: 23 June 2025 / Accepted: 26 June 2025 / Published: 29 June 2025
(This article belongs to the Section Wastewater Treatment and Reuse)

Abstract

Aiming at the defects of the low mass transfer efficiency and large floor space of the traditional ozone process, a cross-tube ozone catalytic oxidation pilot plant was designed and developed. By implementing lateral aeration and a modular series configuration, the gas–liquid mass transfer pathways were optimized, achieving a hydraulic retention time of 25 min and maintaining an ozone dosage of 43 mg/L, which significantly improved the ozone utilization efficiency. During the pilot operation in an industrial park in Suzhou, Anhui Province, the average COD removal efficiency of the device for the actual biochemical tail water (COD 82.5~29.7 mg/L) reached 35.47%, and the effluent concentration was stably lower than 50 mg/L, which meets the stricter discharge standard. The intermediate products in the system were also analyzed by liquid chromatography–mass spectrometry (LC-MS), and the key pollutants were selected for degradation path analysis. Compared to the original tower process in the park, the ozone dosage was reduced by 46%, the reaction residence time was reduced by 60%, and the cost of water treatment was reduced to 0.067 USD, which is both economical and applicable to engineering. This process provides an efficient and low-cost solution for the deep treatment of wastewater in industrial parks, and has a broad engineering application prospect.

1. Introduction

With the construction of industrial parks and the increasing diversification of their industrial structures, wastewater from these areas exhibits prominent characteristics, such as a complex composition, an accumulation of recalcitrant organic pollutants, and significant fluctuations in water quality and quantity. This has become a critical technical bottleneck, urgently requiring breakthroughs in the field of industrial wastewater treatment. As a highly efficient advanced oxidation process (AOP), ozone catalytic oxidation technology is widely applied in the advanced treatment of refractory organic wastewater, municipal sewage, and industrial effluents [1]. Owing to its advantages of low operating costs, elimination of auxiliary chemical reagents, and environmental friendliness, this technology demonstrates significant potential in the advanced treatment of industrial wastewater [2,3,4]. In order to promote the efficient decomposition of O3 to produce more •OH, effective catalysts or activators have been introduced. Various transition metal oxides (e.g., MnO2, TiO2, Co3O4, MoO3, and Fe2O3) have been reported to be suitable catalysts for catalyzing ozone [5,6,7,8,9]. The Lewis acid sites on metal oxide surfaces induce a charge imbalance, allowing them to strongly adsorb water molecules from the solution. The adsorbed water undergoes coordination with these Lewis acid sites, forming surface hydroxyl groups [10]. These hydroxyl groups, acting as basic oxygen-containing functional groups, serve as catalytic active centers. They readily react with molecular ozone to generate highly oxidative hydroxyl radicals (•OH) [11], thus playing a critical role in catalytic ozonation processes.
However, although ozone oxidation technology has attracted much attention in contemporary research [12,13,14,15,16], the existing ozone catalytic process still suffers from low utilization in practical applications and faces challenges in practical applications in wastewater treatment plants in industrial parks. Conventional ozonation systems typically employ basin-type or tower-type configurations, which entail substantial infrastructure requirements, including a large footprint, long hydraulic retention times (HRTs), and a high ozone dosage to maintain adequate pollutant removal efficiency. These limitations result in low ozone utilization efficiency and elevated operational costs. On the other hand, research on non-homogeneous catalysts has mainly focused on powdered catalysts, which face risks such as attrition and clogging in hydrodynamic reactions, limiting their large-scale use in water treatment [17]. In contrast, granular catalyst packing offers advantages such as the ease of loading/unloading during reactor operation, straightforward synthesis methods, and a combination of high catalytic efficiency and engineering applicability [18,19]. Furthermore, as ozone is a sparingly soluble gas with an inherently low solubility in water, a poorly designed reactor would result in significant ozone loss through unutilized off-gas emissions, leading to resource wastage. Therefore, developing novel catalytic ozonation reactors that allow for easy packing of catalysts while maintaining superior hydraulic conductivity holds significant practical implications for enhancing ozone utilization and process economics.
In this study, the actual biochemical wastewater tailwater of a wastewater treatment plant in an industrial park was used as the research object to carry out pilot-scale tests using an ozone reactor. The integrated horizontal ozone aeration cross-flow reactor incorporates structural innovations to reduce the environmental footprint and enhance mixing efficiency. By shifting from a co-directional flow (aligned water and gas flow) to a tangential cross-flow pattern and by systematically exploring optimal operating parameters, this system aims to maximize process performance while minimizing ozone waste and energy consumption. Finally, the feasibility of applying the system in actual water treatment is verified by pilot experiment data, which can improve the utilization rate and reduce the economic cost.

2. Materials and Methods

2.1. Chemicals and Reagents

All reagents utilized in this study were of analytical reagent grade and used as is without further purification. All aqueous solutions were prepared with deionized water (18.25 MΩ·cm, microporous). Chemical materials were purchased from Sinopharm Chemical Reagent Co., Ltd., Shanghai, China.
The experimental treatment water was obtained from the industrial park wastewater treatment plant in Suzhou, China. The biochemical secondary effluent of this wastewater treatment plant has a large fluctuation of chemical oxygen demand (COD) and other indicators, which is mainly due to the fact that the wastewater treatment plant concentrates on treating industrial wastewater discharged by more than a hundred chemical enterprises in the park. The discontinuous nature of the production cycle of the enterprises leads to significant fluctuations in the quality of the influent, with initial influent characteristics meeting typical industrial wastewater standards (COD of 204–555 mg/L, NH3-N of 20–40 mg/L, and BOD5 of 59.8–193 mg/L), which results in an intermittent exceedance of the quality of effluent from the biochemical treatment unit. The characteristics of the tested biochemical secondary effluent are shown in Table 1. Ozonation was applied as a tertiary treatment stage targeting recalcitrant organic residues after biological processes. A pure ozone–oxygen mixture (O3/O2 mass ratio: 8 ± 0.5 wt%) was introduced via a venturi jet.

2.2. Analytical Methods

Chemical oxygen demand (COD) was determined by the potassium dichromate oxidation method (HJ 828-2017, China) [20], colority by the dilution multiple method, suspended solids (SS) by gravimetric filtration, and total phosphorus by the ammonium molybdate spectrophotometric method (GB 11893-89, China) [21]. Gaseous ozone concentration in the reactor was continuously monitored using an online ozone detector, which was pre-calibrated using the iodometric titration method prior to experimental operation [22].
The reaction intermediates were characterized by liquid chromatography–mass spectrometry (LC-MS). The reaction was terminated by the addition of a quencher after sampling at different reaction times. Samples were immediately quenched with 0.1% (w/v) ascorbic acid, transported at 4 ± 0.5 °C in light-proof containers, and stored in dark refrigeration until analysis within 24 h. The samples with different reaction times went through non-targeted screening by LC-MS in the detection mass range of 50~1000 m/z at a flow rate of 0.3 mL/min. Different types of pollutants with high confidence matches were selected from the data results for further quantitative analyses, and the pollutant degradation pathways were then inferred.

2.3. Experimental Procedure

The cross-tube reactor wastewater treatment system and its components are shown in Figure 1a. The biochemical secondary effluent was pumped into the reaction system by controlling the ozone dosage, residence time, and other parameters of the device to optimize the removal effect. The treated effluent was separated into gases and liquids, and the tail gas was decomposed by the ozone destruction device to meet the emission standards.
The core devices used were a catalytic reactor and an ozone generator. The catalytic reactor is made of stainless steel and consists of four single tubes connected in series with an effective volume of 54 L. Each single tube was installed with an inserted perforated tube filled with catalyst, while a venturi jet was installed at the inlet end to deliver ozone from the jet so that the gas and water were fully mixed and transported to the reactor. The catalyst was filled with an inserted perforated tube, and the ozone gas was efficiently dissolved and transferred to the aqueous phase through the injector; then, it came into contact with the catalyst in the inserted perforated tube, thus increasing its utilization rate. The design of the inner tube also reduces the loss of catalyst caused by the impact of water flow, prolongs the service life of the catalyst, and further reduces the cost of treatment. Four reaction units were connected in series, and the effluent was discharged after the ozone reaction and periodically cleaned by a backflush pump.
A transverse tubular reactor was used, with the water inlet located at the same end of the reactor. In the process of gas–liquid mixing and mass transfer, the fluid dynamics inside the reactor presents directional transport characteristics. As shown in Figure 2, the ozone enters the reactor under the synergistic effect of the thrust generated by the aeration and the shear stress of the water flow, and its trajectory, in addition to the original buoyancy-driven vertical upward path, also forms a composite migration path from the bottom of the inlet end to the top of the outlet end, so that the gas phase is in full contact with the liquid phase. The flow system shows typical flat push flow characteristics, effectively inhibiting the common phenomenon of groove flow and short flow in traditional upflow reactors. Figure 1b shows the picture of the catalytic reactor at the pilot site. The ozone generator used in the experiment is a high-pressure discharge ozone generator with a production capacity of 0–50 g and an ozone concentration of 0–150 g/m3, with a rated power of 2.5 kW. The air source was used for the on-site production of oxygen, which integrates the processes of oxygen production, cooling, ozone production, and automated control and achieves automatic operation. During the operation of the pilot plant, the inlet pump flow rate was adjusted by a frequency converter and valve, the ozone generator was turned on to adjust the electronic interface parameters, and the ozone dosage was controlled by a flow meter and pressure valve. After one week of commissioning and stable operation, the hydraulic residence time (HRT) was adjusted by controlling the inlet water flow, and samples were taken several times during the experimental process, with the interval between each sample being double the HRT, to investigate the removal effect of the device on COD, colority, and other indicators and to test the performance of the device in terms of shock resistance through the continuous operation experiments.

2.4. Catalyst Characterization

The catalyst was produced in the laboratory with iron and manganese bimetallic loading. The catalyst was made of biotite, which was the carrier; γ-Al2O3 transition coating was produced by coating aluminum sol, and iron and manganese metal oxides were loaded by the impregnation method. The catalyst was prepared by impregnation and the roasting method, which is a simple preparation process that does not cause secondary pollution.
The catalyst was optimized through parametric screening, with the Fe/Mn molar ratio fixed at 2:1 for maximal activity. Biotite carriers were impregnated in a mixed solution of 0.5 mol/L Fe(NO3)3 and 0.25 mol/L Mn(NO3)2, followed by ultrasonic treatment (2 h) and calcination (400 °C for 3 h). This process ensured uniform loading of γ-Al2O3-coated active components while avoiding secondary pollution. Parametrically optimized conditions, 10 reuse cycles with activity retention, and performance comparison against a commercial benchmark are detailed in Supplementary Figures S1–S3.
As shown in Figures S4 and S5, after X-ray diffraction (XRD, PANalytical B.V., Almelo, The Netherlands) and X-ray photoelectron spectroscopy (XPS, Thermo, Waltham, MA, USA) characterization, it was determined that the surface active components mainly existed in the form of Fe2O3 and MnO2. The catalyst composition also included γ-Al2O3 (confirmed by Al2p binding energies at 73.85 eV and 74.65 eV). The catalyst exhibited a BET surface area of 68.3 m²/g, total pore volume of 0.13 cm3/g, and average pore diameter of 3.34 nm, facilitating ozone diffusion. The catalyst demonstrated exceptional structural integrity in extended operation, with manganese leaching consistently below detection limits (0.02 mg/L) and iron leaching stabilized at 0.05 mg/L (detailed data shown in Supplementary Table S1). During later continuous operation experiments, backwashing cycles did not significantly increase metal leaching, with variations confined within ±0.01 mg/L. This underscores the robustness of the Fe-Mn/γ-Al2O3/biotite architecture.

3. Results

3.1. Influence of Critical Parameters

3.1.1. Influence of HRT

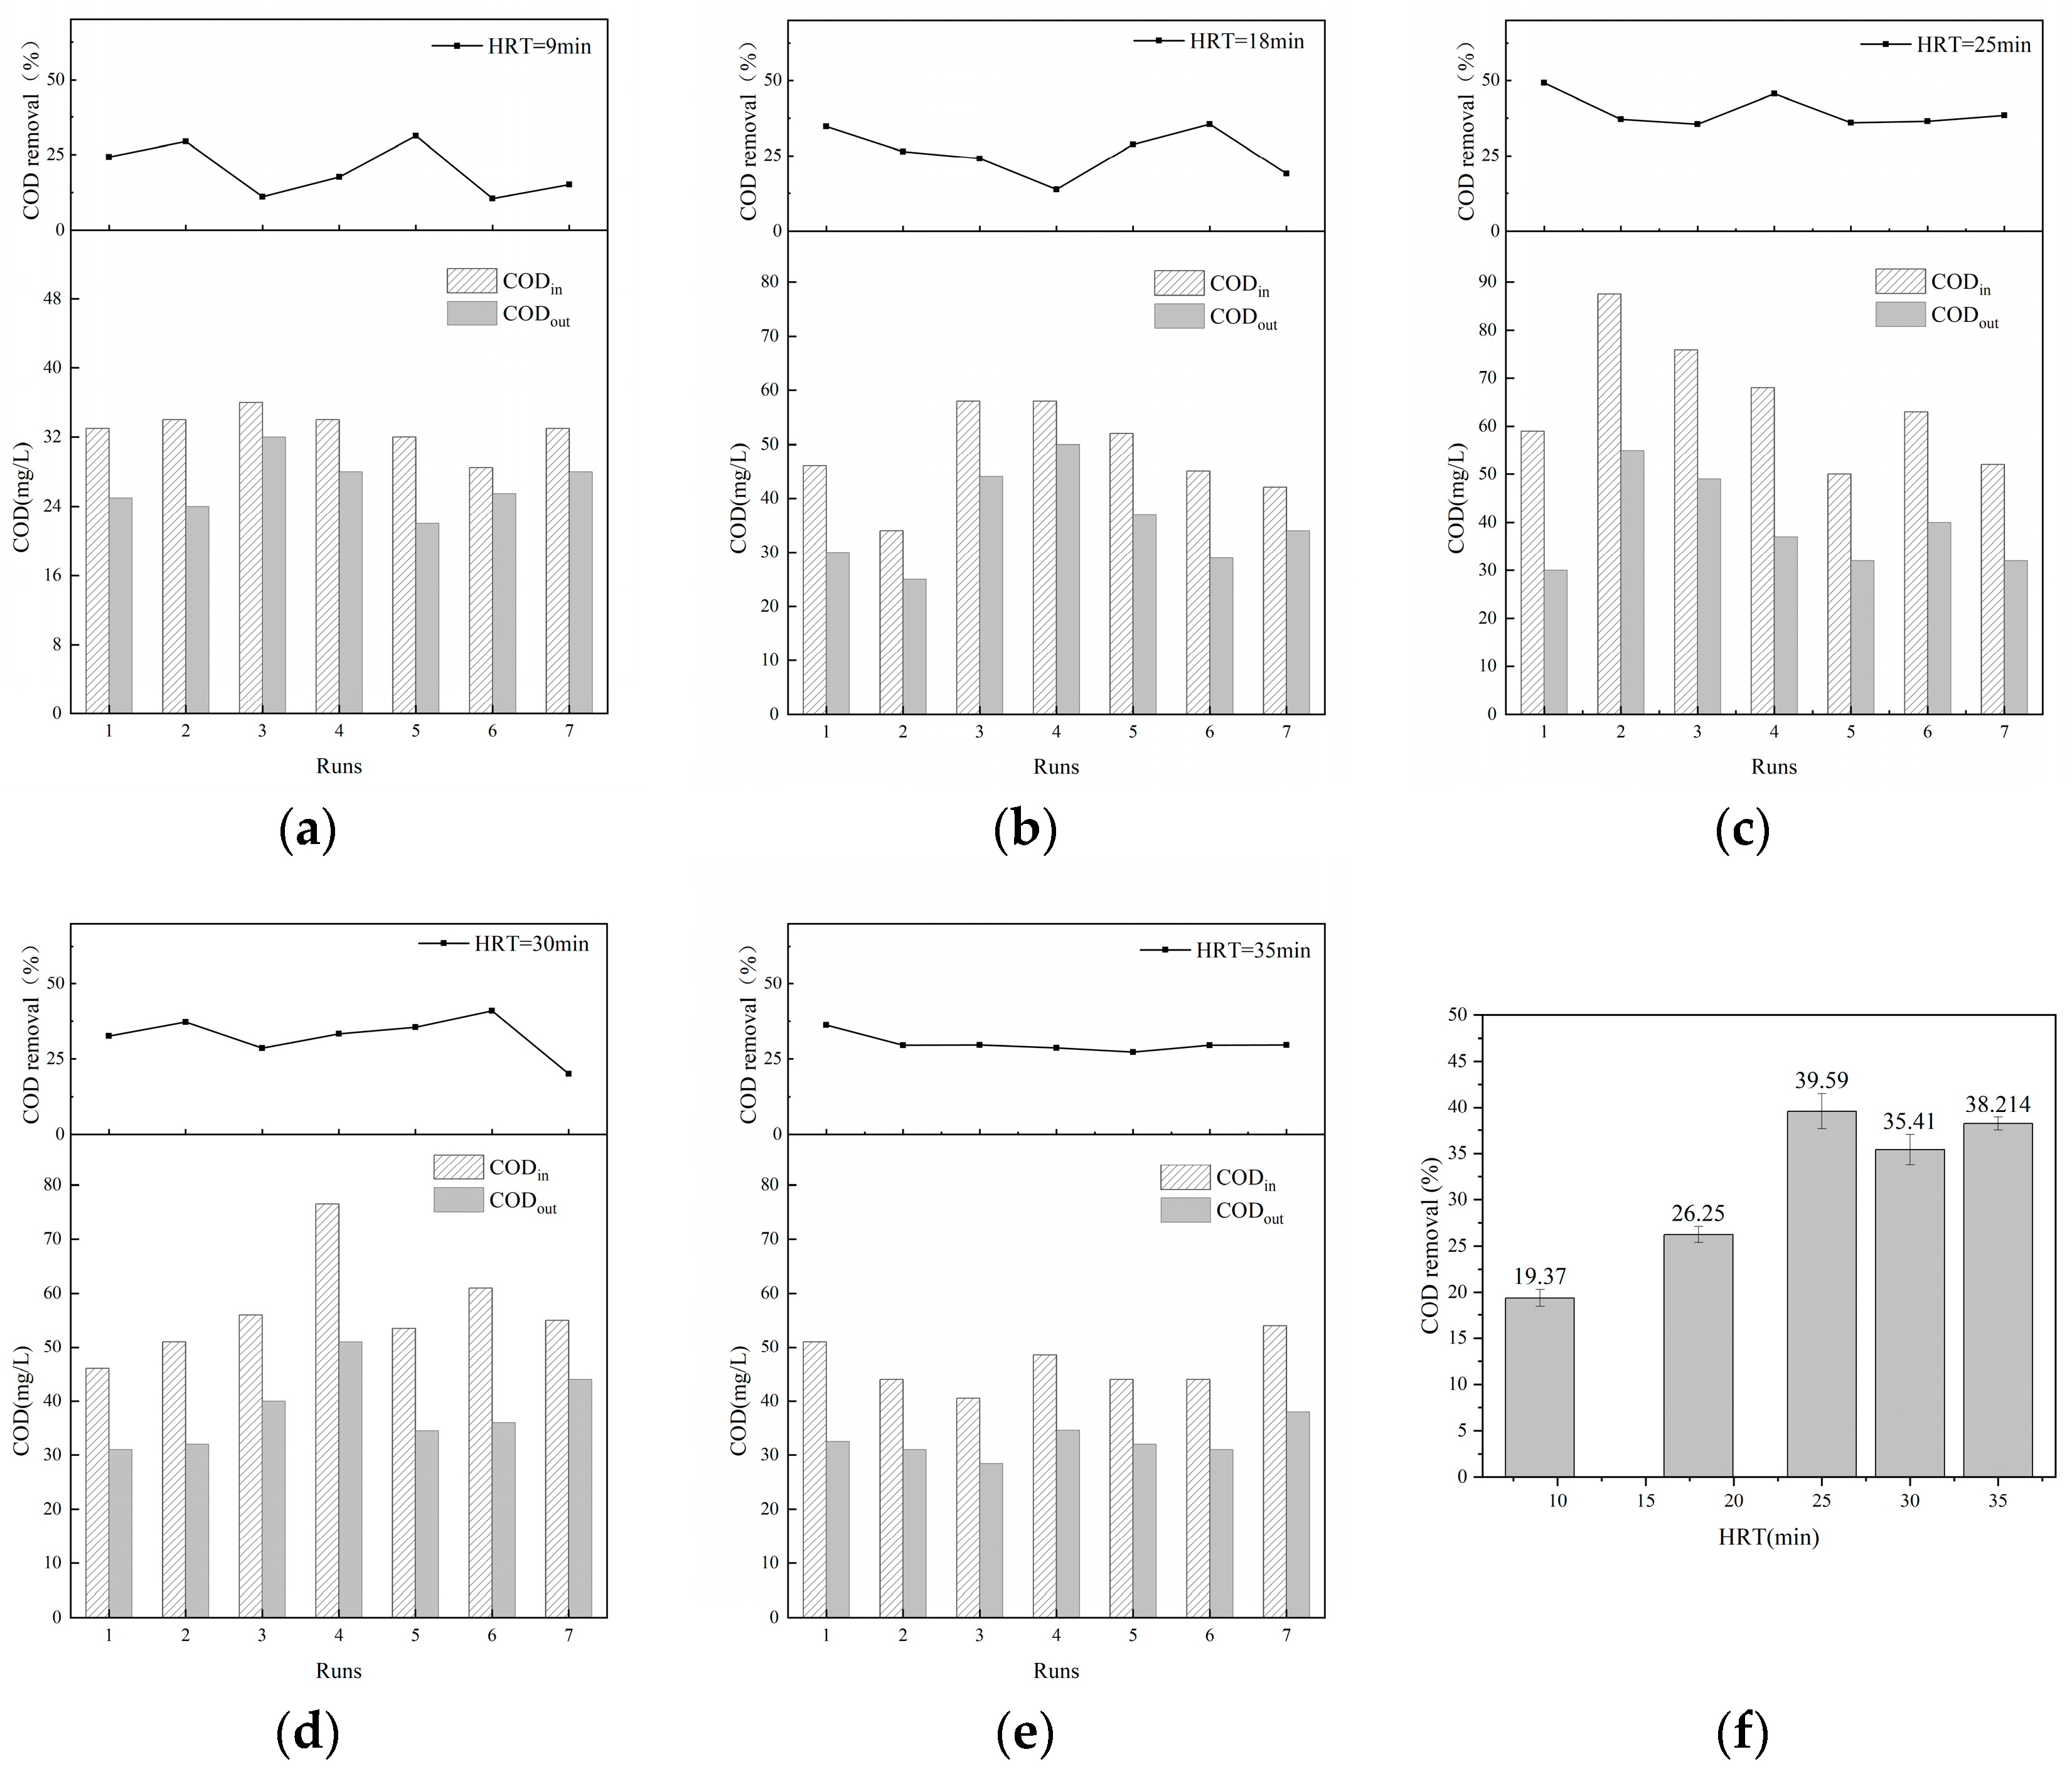
As an important parameter in ozone catalytic reaction, HRT was defined as the effective residence time of wastewater inside the catalytic system (HRT = V/Q, V: effective reaction volume inside the catalytic unit) [23]. While maintaining the conditions of 38 mg/L ozone dosage and ozone inlet flow rate of 250 L/h, different HRTs were achieved by changing the inlet flow rate. Seven experiments were repeated to determine the COD of ozone-catalyzed oxidized effluent under different hydraulic retention times, and the results are shown in Figure 3. The key process parameters (pH, O3 dose, and temperature) for purification experiments are specified in the Figure captions, with temperature values representing the mean room conditions during the pilot operation.
As can be seen in Figure 3, when the hydraulic time was 25 min, that is, when the influent water flow was about 128 L/min, the COD of the effluent from the cross-tube ozone reactor was stable at a concentration lower than 50 mg/L, the maximum removal efficiency reached 49.15%, and the average COD removal efficiency, measured by repeated experiments with sampling, was 39.77%. When the contact time was extended to 30 min and 35 min, the COD removal efficiency stabilized but did not improve significantly. Theoretically, an appropriate extension of HRTs in the ozone catalytic oxidation process is conducive to the enhancement of ozone decomposition efficiency and hydroxyl radical (•OH) generation, which in turn enhances the pollutant oxidation efficacy [24]. However, as the reaction time continued to increase, a large amount of easily degradable organic matter was removed from the water, and the concentration of the remaining pollutants decreased significantly. This resulted in a decrease in the effective contact opportunities between ozone molecules and pollutants. At the same time, the driving force of the reaction between free radicals and residual pollutants was weakened, which ultimately showed that the enhancement of pollutant removal efficiency tended to level off or even decrease. Taking the above theories together, the average COD removal efficiency at HRT = 30 min and 35 min was lower than that at HRT = 25 min, mainly due to the change in O3/CODin.
On the other hand, it was found that the ozone decomposition rate was 79% when HRT = 25 min by monitoring the ozone mass concentration in the tail gas. While the decomposition rate rose to 88% at HRT = 35 min, the COD removal efficiency did not increase simultaneously. This suggests that after more than 25 min, the residence time of ozone in the liquid phase is close to its half-life, and a large amount of ozone is converted to oxygen through self-decomposition rather than participating in the oxidation of pollutants [25]. Therefore, simply prolonging the HRT could not further improve the COD removal efficiency, but it might increase the treatment cost due to ineffective ozone decomposition.
In conclusion, when the HRT reaches more than 25 min, the hydraulic retention time has a smaller effect on COD removal. Therefore, from the perspective of ozone reaction characteristics and the cost and stability of effluent compliance, an optimal hydraulic retention time of 25 min was recommended.

3.1.2. Influence of Ozone Dosage and O3/CODin

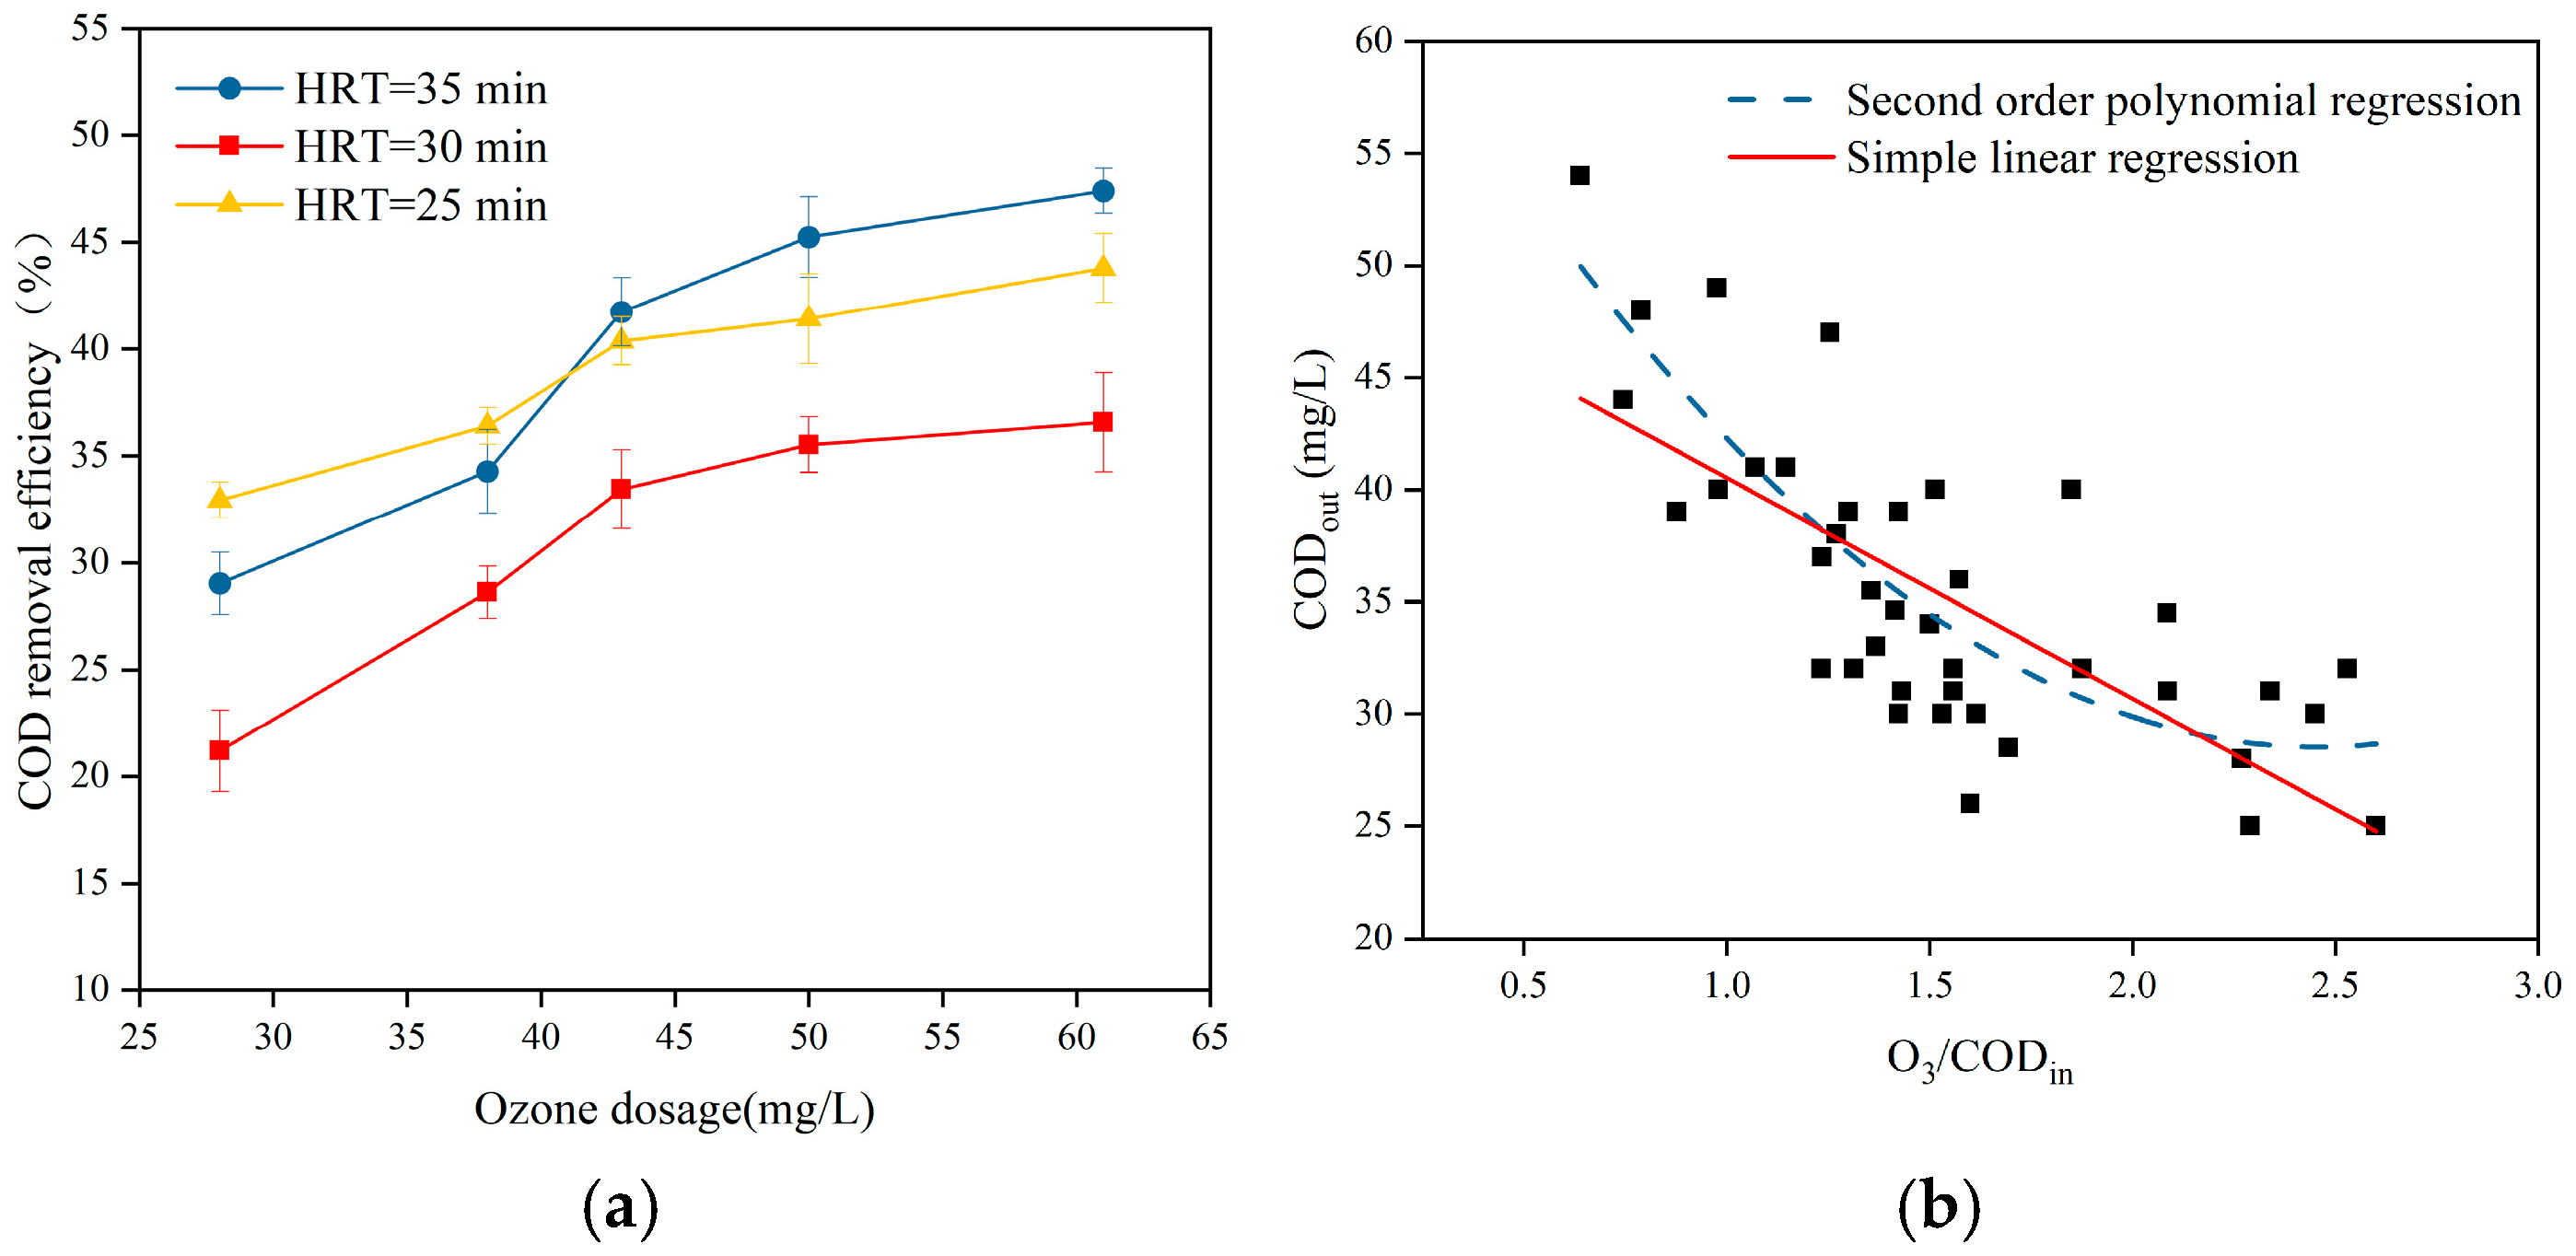
In addition to the HRT, ozone dosage and O3 dose equivalent (O3/CODin) are also important parameters in engineering design and operation. Under the conditions of HRTs of 25 min, 30 min, and 25 min and a stable ozone inlet flow rate of 250 L/h, experiments were carried out by varying the ozone dosing concentration, and the COD of the ozone catalytic oxidation effluent was measured under different ozone dosing concentrations; the results are shown in Figure 4.
As shown in Figure 4a, the overall COD removal efficiency increased with an increase in ozone dosage in the appropriate reaction time range. Taking the condition of hydraulic retention time of 35 min as an example, when the ozone dosage was increased from 38 mg/L to 43 mg/L, the increase in ozone content in the solution strengthened the mass transfer force at the gas–liquid interface, and the COD removal efficiency increased rapidly from 34.29% to 41.77%. When the ozone dosage was increased to 50 mg/L, the COD removal efficiency was 47.70%. When the ozone dosage was further increased to 61 mg/L, there was almost no increase in the COD removal efficiency. At this time, the ozone in the solution was saturated; too much ozone caused ineffective mass transfer, and it was difficult to enter into the liquid phase environment, which was sufficiently reactive with the organic residues [26]. The excess ozone was discharged, along with the exhaust gas, into the atmosphere, which resulted in an increase in energy consumption and even caused secondary pollution. This trend can also be observed by HRT = 25 min and 30 min. When the ozone dosage was increased from 38 mg/L to 43 mg/L, the COD removal efficiency increased faster; after that, with an increase in ozone dosage, there was a small increase in COD removal efficiency. The optimum ozone dosage of 43 mg/L was selected.
The relative ozone dosage O3/CODin can be used to characterize the stoichiometric relationship between ozone and pollutants in the reaction system, and its physical significance is the mass concentration ratio of ozone to the COD concentration in the influent water, rather than the ozone concentration level, which has a greater reference value in practical engineering. As shown in Figure 4b, O3/CODin is negatively correlated with COD in the effluent, i.e., the higher the O3/ CODin, the lower the COD effluent concentration. From the figure, it can also be seen that during this experiment, more than 90% of the experimental effluent COD value was below 50 mg/L, and nearly 50% of the experimental effluent COD reached about 30 mg/L, which proves that the removal effect is good. At a lower O3/CODin, increasing the ozone dosage can significantly reduce the effluent COD, but when the ozone dosage exceeds a certain range, ozone utilization decreases, indicating that the degradation of organic pollutants in the wastewater by this process is close to the limit [27] and that the economic benefits are low. For the industrial wastewater with significant COD fluctuations used in this pilot experiment, maintaining O3/CODin = 1.2~1.8 can ensure the stability of the effluent. For example, when CODin increased from 50 mg/L to 69 mg/L, real-time adjustment of ozone dosage according to O3/ CODin = 1.5 could still make the effluent COD stable below 50 mg/L. The results showed that the effluent COD could be stabilized by the real-time feedback of O3/CODin = 1.5. Later engineering applications can be adjusted through the real-time feedback of O3/CODin and the dynamic matching of ozone dosage and influent load to further enhance the adaptability of the process.

3.1.3. Influence of pH

Solution pH requires careful monitoring during catalytic ozonation due to its critical role in ozone decomposition into hydroxyl radicals. In this pilot system, raw influent was directly pumped from the biochemical secondary effluent tank. Adjusting influent pH through chemical dosing was deemed impractical, as it would significantly increase operational costs and disrupt wastewater treatment plant operations. Therefore, we focused on tracking pH dynamics throughout the reaction process to elucidate its functional impact.
Under optimal conditions (HRT = 25 min, ozone dosage = 43 mg/L, and ozone inlet flow rate = 250 L/h), pH variations in influent and effluent were systematically recorded during extended operation. As depicted in the scatterplot of Figure 5a, influent pH ranged from 6.94 to 7.90 (mean: 7.35 ± 0.16), while effluent pH varied between 6.90 and 7.66 (mean: 7.24 ± 0.17), yielding an average ΔpH of <0.1 unit. This sustained near-neutral effluent pH ensures compliance with discharge regulations (e.g., China’s GB 8978-1996 standard [28]: pH 6–9), eliminating the need for post-treatment pH adjustment. The corresponding COD removal efficiency fluctuated moderately (24–49%, average: 35.47%); yet, pH remained consistently neutral. Although no direct correlation was visually apparent, laboratory determination of catalyst pHpzc via the pH drift method [29] revealed a value of 7.3 ± 0.2, as shown in Figure 5b. This closely aligns with the operating pH (7.35 ± 0.17), confirming that the catalyst surface functioned near its zero-charge state. Such conditions minimize electrostatic barriers to pollutant adsorption and maximize •OH generation efficiency. Mechanistically, the initial degradation of organic pollutants into short-chain carboxylic acids during early-stage catalytic ozonation lowers the solution pH. Subsequently, advanced degradation of intermediates by hydroxyl radicals (generated via catalytic ozone decomposition) induces a slight pH recovery [30]. This dual-phase process explains why the effluent pH remained slightly lower than the influent; yet, ΔpH was consistently minimal, averaging less than 0.1 unit. Furthermore, system stability is attributed to intrinsic wastewater buffering capacity (from carbonate/phosphate species) and balanced proton dynamics during ozone decomposition and radical reactions, collectively maintaining an optimal reaction environment.
In summary, the HRT of 25 min and the ozone dosage of 43 mg/L are the optimal operating parameters of the ozone reactor according to the optimal wastewater treatment effect. The optimal pH range for catalytic activity was determined to be neutral, precisely aligned with the catalyst’s pHpzc value (7.3 ± 0.2). In the actual engineering application, the hydraulic retention time and ozone dosage, as two key factors to be considered in the ozone catalytic oxidation reaction, represent the enterprise’s consideration of the amount of treated water and energy consumption, respectively, according to the project’s actual water quality requirements for the selection of the appropriate hydraulic retention time and ozone dosage.

3.2. Continuous Operation Effect Verification

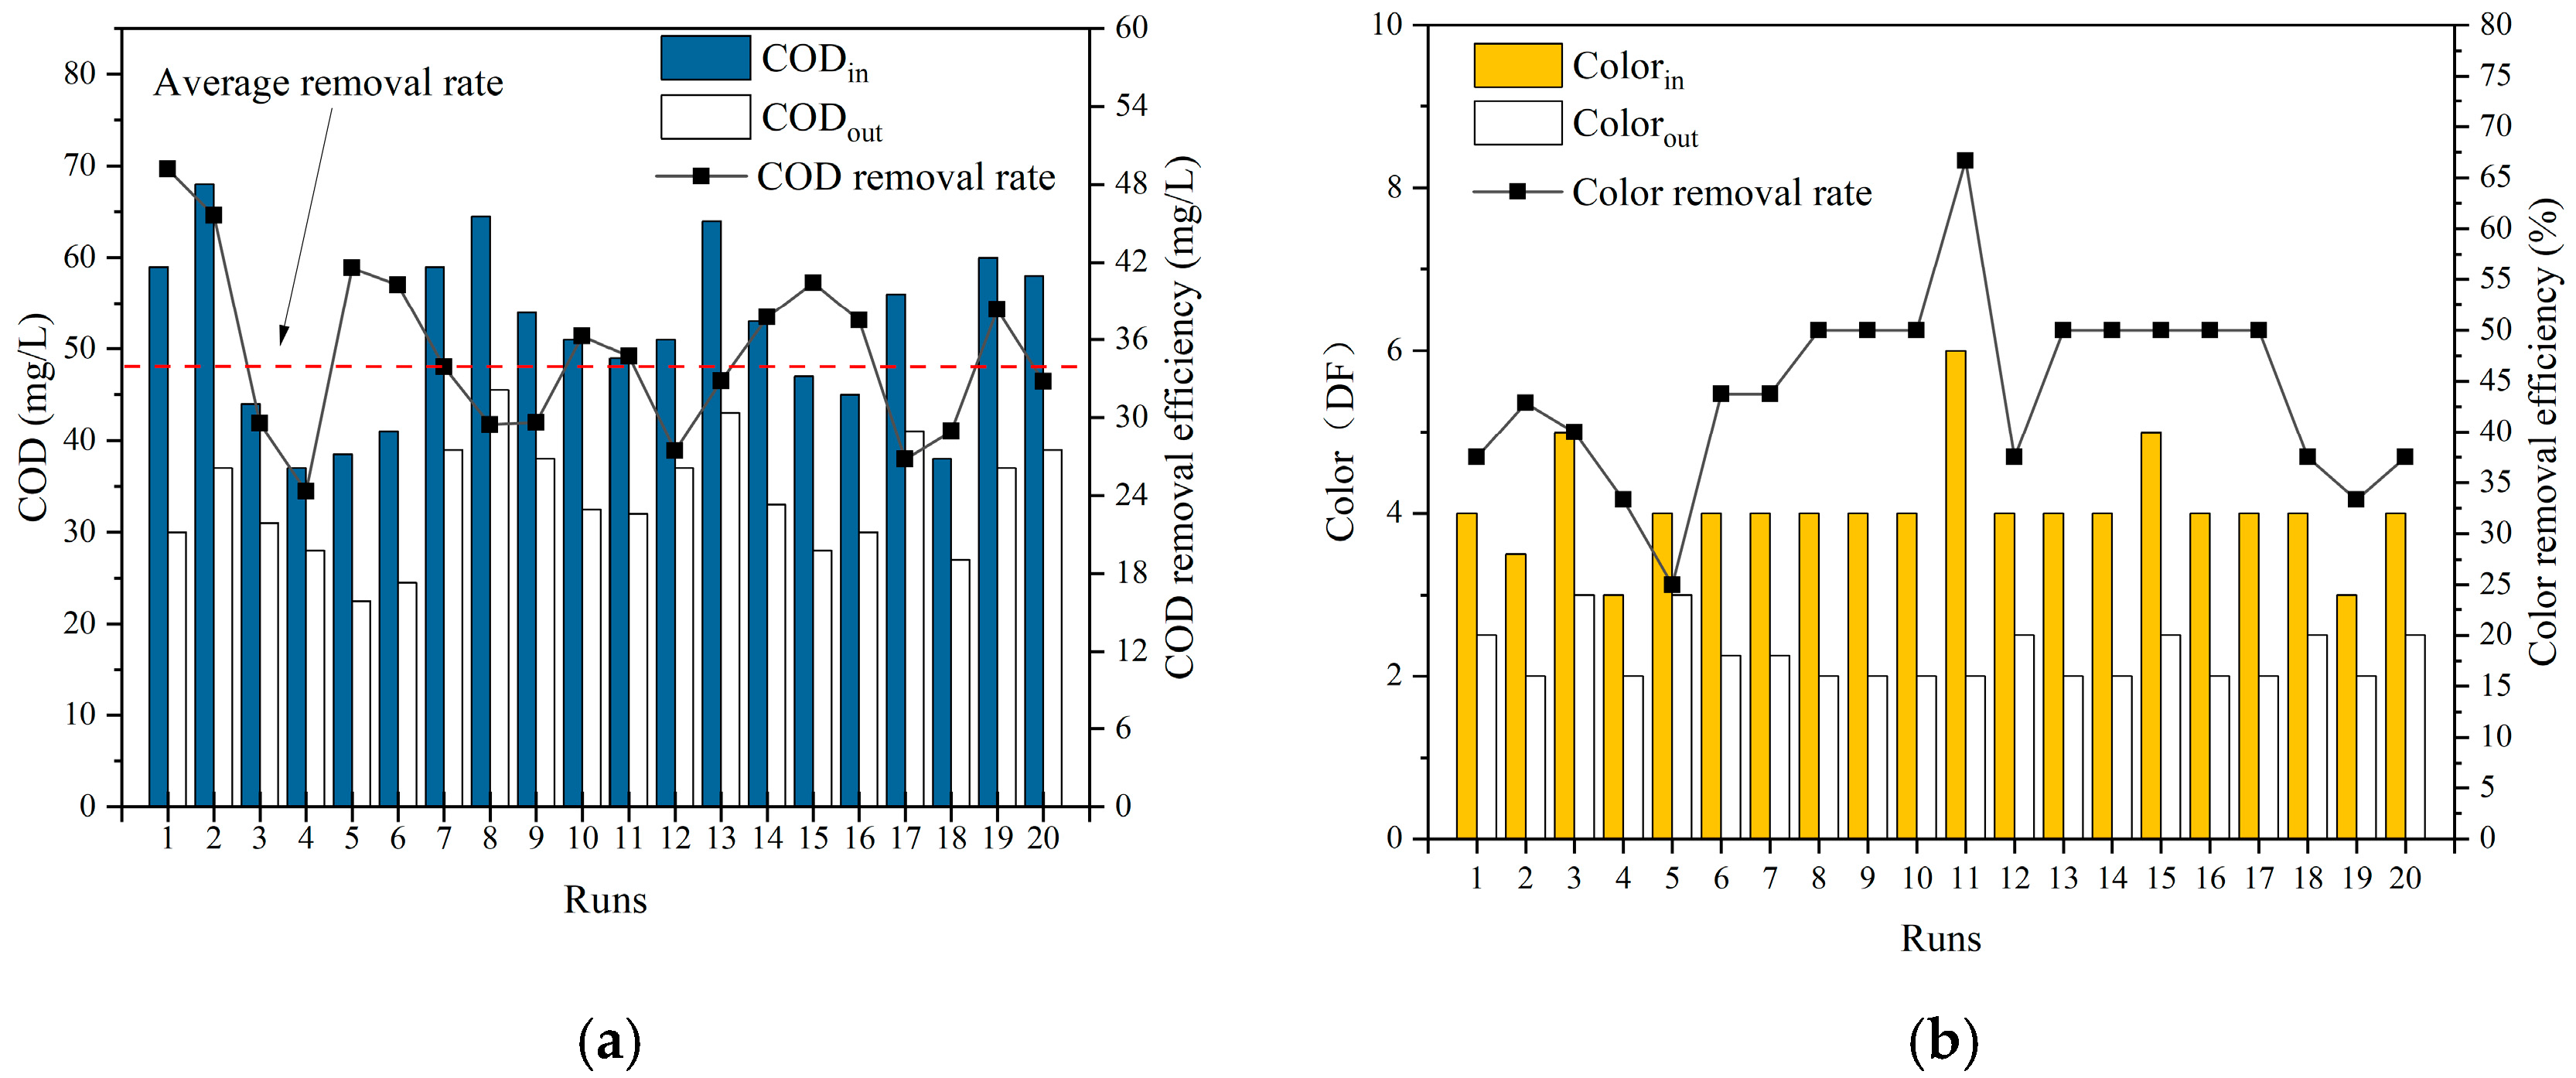
Under the above optimal operating conditions for the pilot plant, for a period of two weeks of continuous operation of the experiment, the daily water indicators were measured once, and water indicator sampling occurred two to four times. The COD monitoring data of the inlet and outlet water are shown in Figure 5.
From Figure 6a, the operating conditions for each operating period for 14 days of continuous operation can be seen. When the HRT is 25 min, the ozone inlet volume is 250 L/h, the ozone dosage concentration is 43 mg/L, and the relative ozone dosage O3/CODin is in the range of 1.24~2.27; when the influent COD is maintained at less than 60 mg/L, the effluent COD is stable at less than 50 mg/L. The device has a strong ability to resist the impact load, and the COD removal efficiency is 35.47%, on average, in continuous operation experiments. In particular, when the COD of influent water is maintained below 40 mg/L, the COD of effluent water can be further reduced to 30 mg/L or even 20 mg/L. However, it cannot be ignored that through the above experimental data, which were verified multiple times and subjected to cross-comparison, the following significant trend can be observed: after 4~5 days of continuous operation, there is a significant decline in the removal efficiency. At this time, the backwashing device should be turned on to backwash the cross-tube ozone oxidation reactor, and the continuous operation experiment should be continued on the same day after backwashing. The data reflect that the COD removal efficiency rebounded after the backwash. The decline in efficiency correlates with suppressed •OH generation due to fouling-induced site isolation. Although •OH was not directly monitored, converging evidence confirms physical blockage of active sites (Fe/Mn): the catalyst’s 3.34 nm pores are vulnerable to macromolecular clogging, impeding ozone diffusion; immediate post-backwash recovery verifies fouling reversibility [31].
At the same time, as shown in Table 2, the continuous operation of the experimental data also reflects that the cross-tube ozone catalytic oxidation equipment has a certain effect on the removal of other pollution indicators. Among them, the removal efficiency of colority can exceed 40%, and the average colority of the effluent reaches 2.38; the removal effect during the continuous operation is shown in Figure 6b. Even at low influent colority levels, the system achieved a 44.26% reduction in colority. This demonstrates its capacity for deep color removal, suggesting a significant potential for treating high-colority wastewaters—a scenario where ozone-based advanced oxidation has proven highly effective [32].

3.3. Pilot-Scale Reactor Kinetic Analysis

Each tube of the reactor had an inner diameter of 100 mm and a length of 2000 mm, while the inner tube had an inner diameter of 50 mm and a length of 1600 mm, with a catalyst filling ratio of 66.6%. The design flow rate was 150 L/h. The total volume was 63 L, and the volume of the catalyst reaction zone was 13 L. With an air source ozone generator, the rated gas flow rate was measured at 250 L/h. The process adopted a lateral aeration mode, so that the direction of water flow and air flow direction were the same as the tangential flow, which improved the mixing effect.
Catalytic ozone generation of •OH is a mechanism that is central to the deep treatment of industrial wastewater. Studies have shown that the O2 consumed in the oxidation of organic matter by •OH can be completely supplied by O3 decomposition [33]. In practice, the rate of •OH generation is governed by both the ozone mass transfer efficiency and the number of catalyst active sites [34]. When the catalyst active sites are uniformly distributed, the •OH production rate is positively correlated with the liquid-phase ozone concentration. Let the flow pattern of the cross-tube reactor be push flow; the variation of ozone concentration is shown in Equation (1).
dG dt = kG   ln G G 0 = kt
where G is the O3 concentration; G0 is the initial ozone dosage; t is the time; and k is the kinetic constant of the primary reaction. Then, the ozone decay ratio η is calculated according to Equation (2).
η = G G 0 = 2 t T 1 / 2
where T1/2 is the half-life of ozone in water. It can be seen that the ozone concentration decays exponentially with increasing air travel.
Regarding the ozone decomposition, the influence of the air distribution device is very large, and a venturi jet should be used for gas intake. The effective decomposition and utilization of O3 is also related to the direction of gas–liquid flow, in which the gas–liquid tangential flow has certain advantages over sequential intermittent and concurrent flow. The gas–liquid tangential flow can prolong the contact time between ozone and water, enhance the turbulent mass transfer between the gas–liquid phases, and have a significant effect on the removal efficiency of organic pollutants [35]. Regarding organic matter degradation, at a low concentration of industrial wastewater, the reaction rate is proportional to the concentration of organic matter but is also in line with the apparent first-level kinetic model: see Equation (3).
dC dt = k 1 GC
where k1 is the kinetic constant for the first-stage reaction of organic matter degradation and C is the concentration of organic matter.
G in Equation (3) is not constant, and it decays exponentially with the gas range. Therefore, the tangential flow homogenizes the oxidation reaction dynamics, thus homogenizing the reaction rate and helping overcome the mass transfer process as the controlling factor of the reaction. The tangential flow also enhances the turbulent mass transfer between the gas and liquid phases.
The role of •OH was further confirmed by radical scavenging tests, with synthetic wastewater simulating the key characteristics of the actual industrial effluent (COD ≈ 100 mg/L, pH 7.2). In lab-scale experiments, tert-butanol (TBA) was introduced as a radical scavenger to quench •OH. As shown in Figure 7, COD removal efficiency declined to 22.72% in the catalytic ozonation system with TBA addition, demonstrating a significant reduction from 52.78% without a scavenger. Conversely, TBA exhibited negligible inhibition in the sole ozonation system, confirming direct molecular ozone oxidation as the dominant pathway therein. The sharp decrease in COD removal upon TBA addition to the catalytic system verifies •OH generation and its critical contribution to pollutant degradation.
To ensure stable operation of the catalytic system, the water flow resistance of the iron-based monolithic catalyst packing in the tower reactor was estimated according to Equation (4). The calculation results show that the head loss of the reactor was 0.134 m, which is smaller than the head loss of the original ozone reactor in the general park.
H f = λ l d v 2 2 g
where Hf is the frictional head loss (m), l is the flow path distance (catalyst packing tube lengths in tower reactors) (m), d is the inner diameter of the reactor (m), v is the velocity (m/s), and λ is the resistance coefficient.
The tangential flow design not only homogenizes reaction kinetics but also enhances ozone mass transfer. The volumetric mass transfer coefficient (kLa) for ozone dissolution in the cross-tube reactor was determined to be 0.038 s−1 under standard operating conditions (HRT = 25 min, ozone dosage = 43 mg/L). This value integrates interfacial area calculations from venturi jet-generated micro-bubbles with penetration theory-based k1 modeling under extended contact time [36]. This value exceeds conventional bubble columns (typically 0.01–0.02 s−1) by 90–380% due to synergistic micro-bubble dispersion via venturi jet and extended bubble retention. This high-efficiency mass transfer, combined with catalytic •OH generation on Fe2O3/MnO2 surfaces, yielded an apparent first-order degradation rate constant of 0.021 min−1 for combined pollutants.

3.4. Proposed Degradation Pathways for Different Types of Pollutants

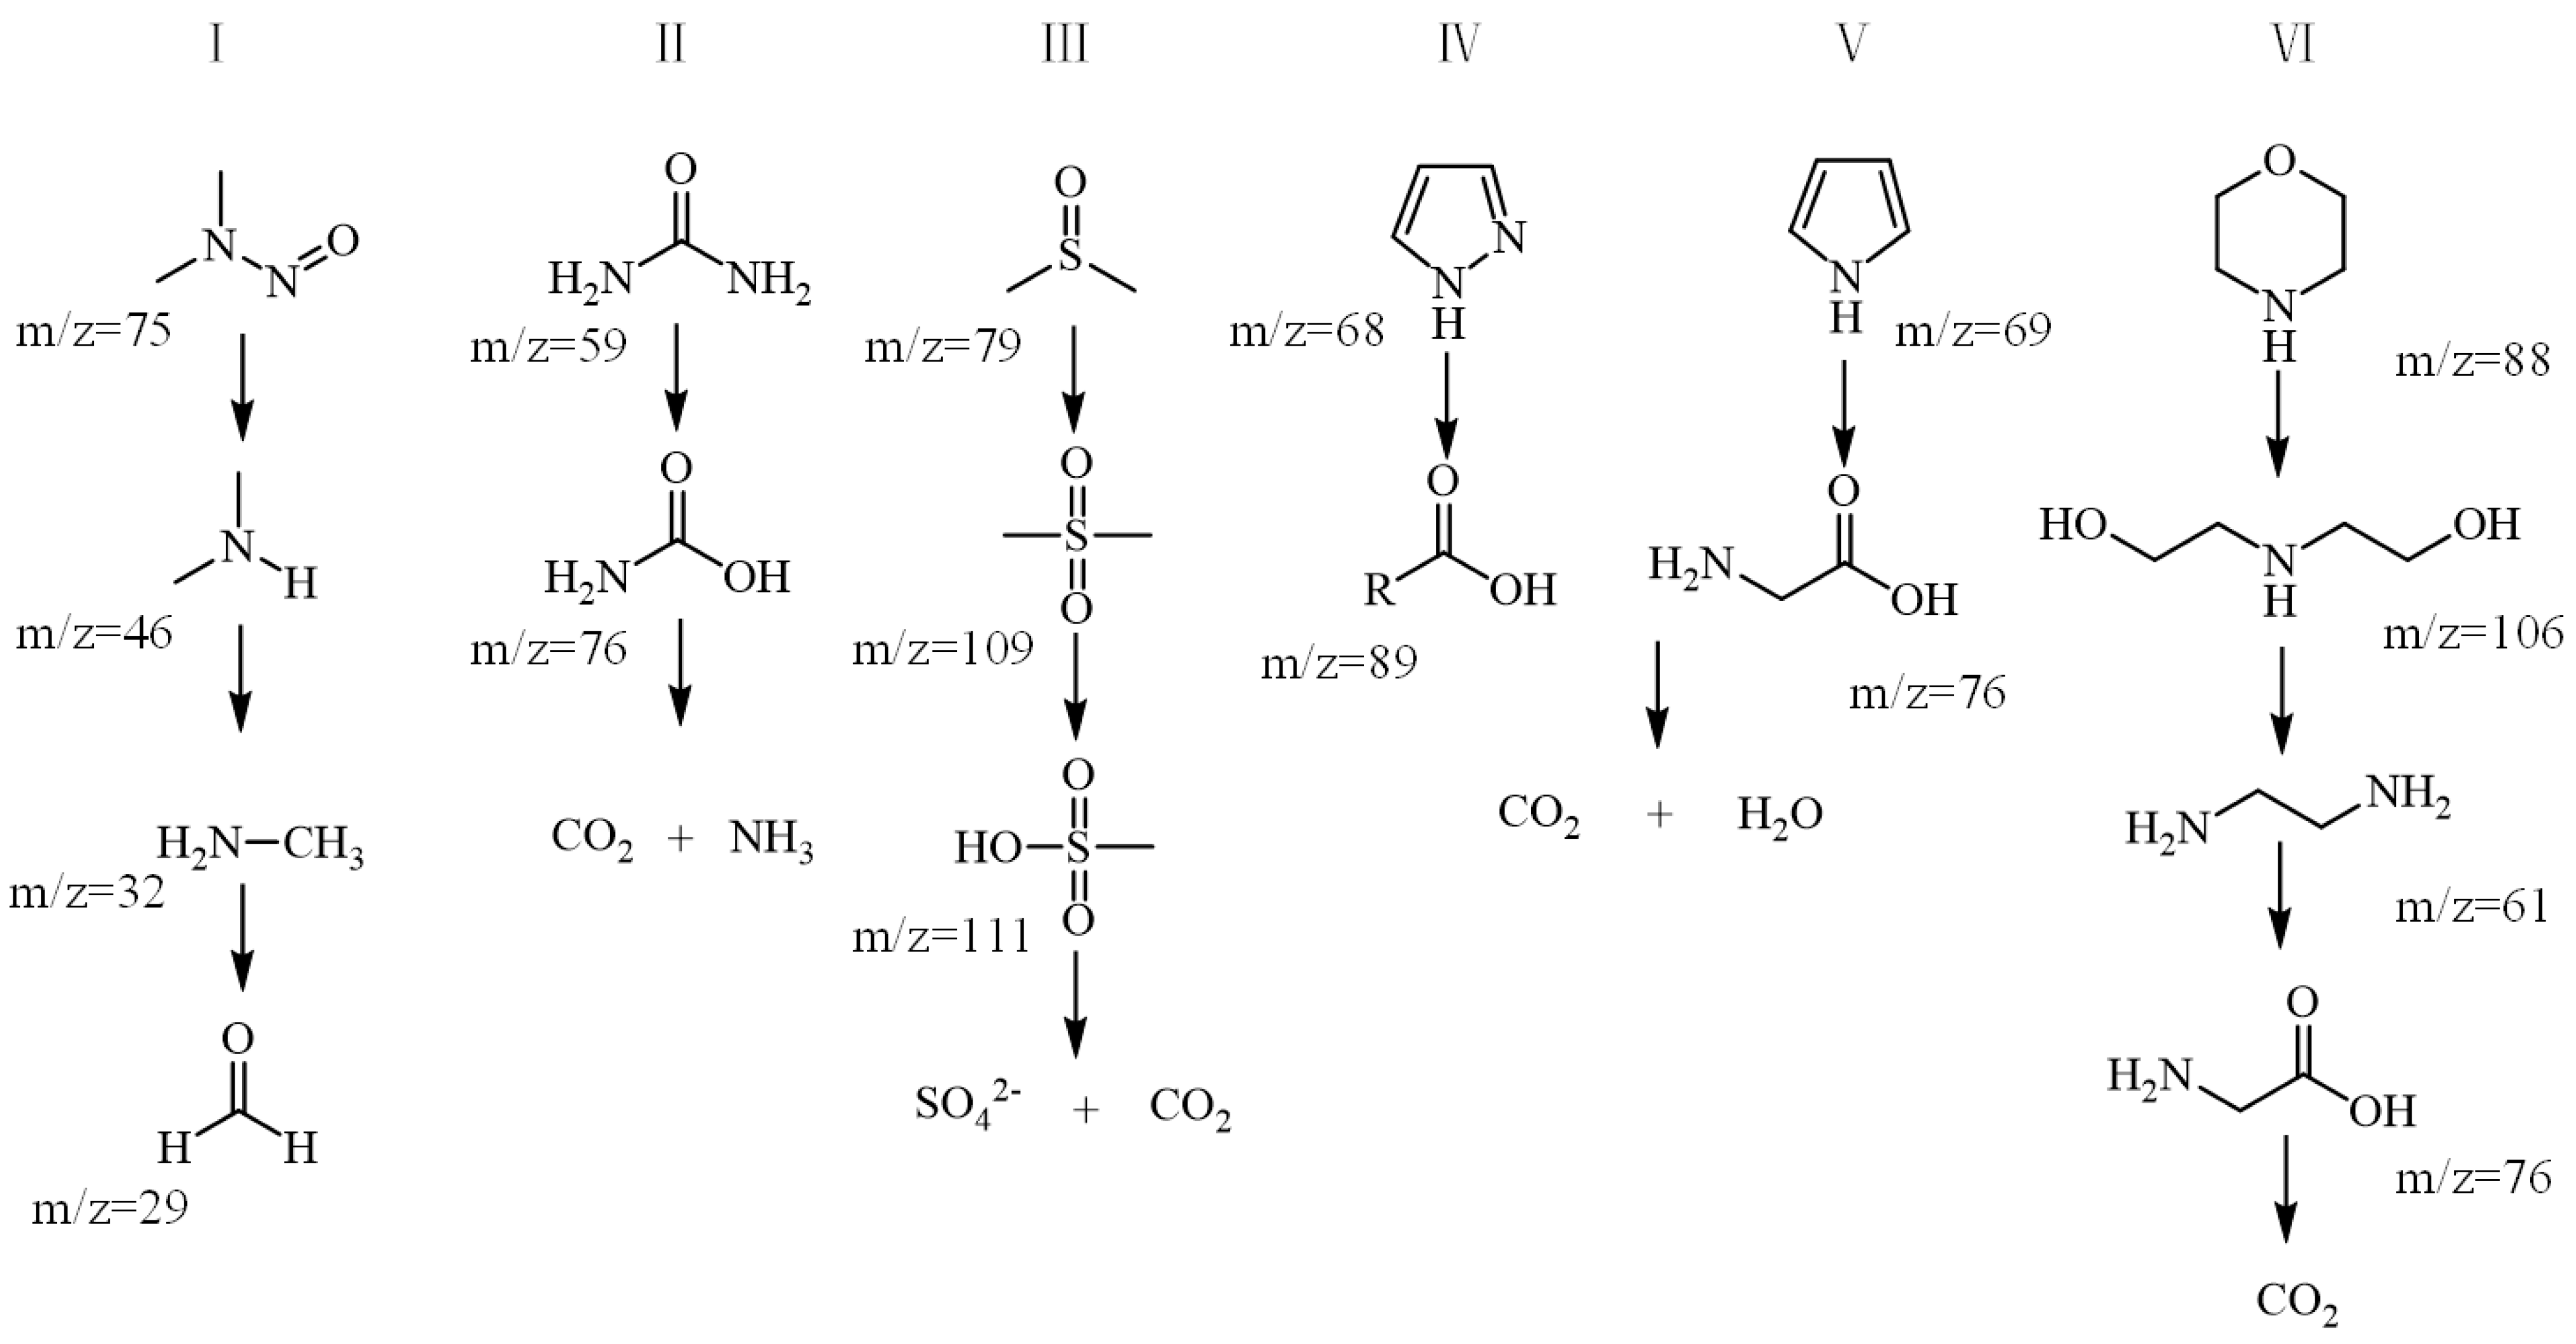
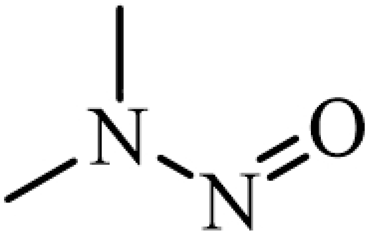
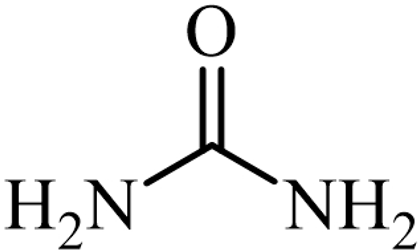
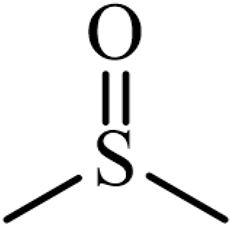
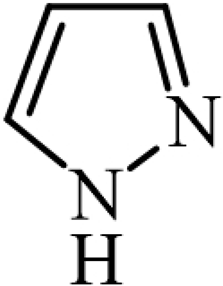
In order to investigate the degradation pathways of the process for organic pollutants, the intermediates of different reaction times were screened by LC-MS in a non-targeted manner, from which different types of organic pollutants with high confidence matches were selected [37], as shown in Table 3. Based on the LC-MS results, the degradation pathways of five different types of key pollutants in the cross-tube ozonation process were deduced, as shown in Figure 8. The sources of these key pollutants may include pesticides and fertilizers used in agricultural activities, as well as industrial wastewater generated from pharmaceutical, printing and dyeing, food processing, and other industries.
  • Nitrogen-containing organics
NDMA (m/z = 75.09) was first denitrated by direct oxidation via ozone to produce dimethylamine (DMA, m/z = 46.09). Subsequently, •OH further attacked the C-N bond of DMA to produce methylamine (m/z = 32.07), which was further oxidized to formaldehyde (m/z = 30.01) [38]. Eventually, formaldehyde was mineralized to CO2 and H2O by successive oxidation reactions.
Another nitrogenous organic substance, urea (m/z = 59.05), underwent a hydrolysis reaction in the presence of ozone to produce carbamic acid (m/z = 76.02). Carbamic acid was further decarboxylated to produce CO2 and ammonia (NH3) [39], and ammonia could be oxidized to nitrate (NO3) by ozone. The experimental data show that the abundance of carbamic acid, as a key intermediate, increased and then decreased with reaction time, consistent with the two-stage hydrolysis–mineralization feature.
  • Sulphur-containing compounds
DMSO (m/z = 79.14) was first oxidized to dimethyl sulfone (m/z = 109.11) under ozone attack, and then, hydroxyl radicals triggered the breaking of the S-O bond to produce methanesulfonic acid (m/z = 111.10). Methanesulfonic acid was further oxidatively decarboxylated [40] and, finally, mineralized to SO42− and CO2.
  • Heterocyclic compounds
Pyrrole (m/z = 68.10) and pyrazole (m/z = 69.09) first underwent a ring-opening reaction to form carboxylic acids (e.g., oxalic acid, m/z = 89.02) under the synergistic action of ozone and •OH. Oxalic acid was further decarboxylated to produce glycine (m/z = 76.08) [41], which was finally mineralized to CO2 and H2O.
  • Amines
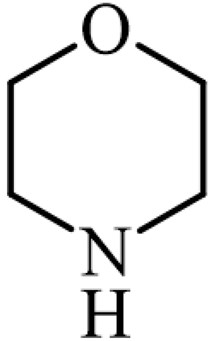
During the ozone oxidation of morpholine (m/z = 88.13), its six-membered ring was first opened by •OH to form diethanolamine (m/z = 106.15), followed by dehydroxylation to form ethylenediamine (m/z = 61.11). Ethylenediamine was further oxidized to form aminoacetic acid [42] (m/z = 76.08), which was finally mineralized to CO2. Notably, ozonation achieved morpholine ring-opening within minutes, whereas activated sludge systems required an adaptation period of 10–12 days for >90% degradation [43]. Furthermore, a morpholine shock load (35 mg/L) caused effluent concentration spikes (Figure 6), indicating biological sensitivity to loading variations. This highlights ozone’s advantage for refractory N-heterocycles.
While the proposed degradation pathways achieved high mineralization efficiency of target pollutants, effluent toxicity assessment is critical for evaluating environmental risks. Araújo et al. (2005) demonstrated that chemical oxygen demand (COD) removal does not equate to toxicity removal in activated sludge processes [44]. Key intermediates generated in this study, such as formaldehyde (from NDMA degradation) and ethylenediamine (from morpholine ring-opening), may pose ecological risks. Although the high removal efficiency of primary pollutants was achieved, the potential accumulation of short-lived intermediates warrants caution. Prior studies confirm that ozonation effluents require bioassessment for regulatory compliance. Future work will employ standardized bioassays) to quantify the acute toxicity of effluents.

3.5. Cost Analysis Estimates and Comparisons

The ozone oxidation reactor at our pilot wastewater treatment plant uses a traditional tower structure, treating approximately 500 m3/h of influent. These operational parameters were verified through daily logs from plant engineers, weekly effluent sampling by a third party, and comprehensive field surveys during the study period. The reactor tower has a single size of Φ6 × 8.5 m, a single unit volume of 220 m3, and a total of six reactors with high-efficiency dissolved gas devices and a total floor area of about 200 m3.
From the data in Table 4, it seems that the cross-pipe ozone oxidation catalytic equipment can greatly improve the ozone utilization, compared to the original ozone catalytic oxidation tower, where the ozone dosage was reduced by 46% and the residence time was reduced by about 60%, which can reach or even exceed the traditional ozone catalytic oxidation of the COD removal efficiency. At present, the cross-tube ozone catalytic oxidation equipment can reduce COD by 30–15 mg/L per unit of residence time, and the highest ΔCOD of the incoming and outgoing water is 33.25 mg/L, the lowest value is 9 mg/L, and the average value is 21.33 mg/L, which is better than the existing ozone catalytic oxidation device in the park. However, since the device is still in the pilot stage, the treatment load remains lower than the existing mature ozone catalytic oxidation device in the plant. Subsequently, the operating load can be improved by expanding the scale and by reasonably increasing the reaction unit of the plant.
The operating costs of the cross-tube ozone catalytic oxidation equipment mainly include electricity, catalyst packing loss, and equipment depreciation. The ozone generator adopts the on-site production of oxygen from an air source, which is more economical compared to liquid oxygen, which is used in the original ozone oxidation process in the park [45,46,47]. Based on the costing per cubic meter of water treatment in Table 5, it can be seen that the total comprehensive operating cost of the cross-tube ozone catalytic oxidation device is 0.067 USD/m3, of which the electricity consumption cost is about 0.034 USD/m3 and the equipment depreciation cost is about 0.024 USD/m3; the ozone generator, the pump, and the catalyst are calculated on the basis of a payback period of 8 years or 2 years, and the investment cost of the catalyst is about 0.009 USD/m3. If the biochemical tail water does not meet the standard and is discharged directly, it will exceed the threshold of the self-purifying ability of the water body, leading to environmental risks, such as an abnormal proliferation of microorganisms in the water body, while wasting water resources at the same time. The analysis of the economic benefits shows that the cross-tube ozone catalytic oxidation process has more advantages than the existing ozone oxidation process in terms of ozone utilization, and it can effectively target the characteristics of industrial wastewater, such as wastewater with a complex composition and difficult degradation of organic matter, to meet the emission standards and bring economic benefits to the enterprise. This process has the advantages of stable operation, a small footprint, a good removal effect, etc., which provides a preferred solution for the deep treatment of wastewater in industrial parks with both environmental and economic efficiency.

4. Conclusions

  • The cross-tube ozone catalytic oxidation device developed in this study, under the optimized parameters (HRT = 25 min, ozone dosage 43 mg/L), has a stable COD removal efficiency of 35.47% for the biochemical tail water of industrial parks, with the average value of COD in the effluent being below 50 mg/L. It also has a strong ability to resist shock loads. When the influent COD ≤ 40 mg/L, the effluent can be reduced to 30 mg/L or below. The colority removal efficiency exceeded 34%, with an average effluent colority of 2.38 DF. These results are markedly superior to those achieved by conventional tower-type ozonation processes.
  • By synergistically optimizing the HRT and ozone dosage, ozone utilization efficiency was markedly enhanced. The O3/CODin ratio remained stable between 1.24 and 2.27, while the ozone dosage was cut by 46% and the retention time was shortened by 60% compared to conventional processes. At the same time, the unit treatment cost dropped to only 0.486 USD/m3—34.5% lower than the original process (0.874 USD/m3)—thereby achieving both high efficiency and cost-effectiveness.
  • The device adopts a self-made biotite-based iron–manganese modified catalyst, which has both high catalytic activity and a low cost; the innovative design of the lateral aeration tangential cross-flow reactor improves the gas–liquid mass transfer efficiency and reduces the floor space, which provides technological support for the intensive design and stable operation of the catalytic ozone oxidation system in the actual project.
  • Several different types of degradation products in the experimental wastewater were analyzed by LC-MS, and five possible degradation pathways were listed and discussed. Based on the detected intermediates, it was deduced that ozone and •OH generated a series of intermediates by triggering the conversion pathways of hydroxylation, cyclization, and ring-opening of organic pollutants. The catalyst’s neutral pHpzc (7.2 ± 0.2) optimally matched the wastewater’s inherent near-neutrality (mean pH 7.35), maintaining surface charge balance for maximized •OH generation. This synergy resulted in the stable operation and deep oxidation of recalcitrant pollutants to CO2/H2O.

Supplementary Materials

The following supporting information can be downloaded at: https://www.mdpi.com/article/10.3390/w17131953/s1. Figure S1: Effect of different metal loadings on COD removal from simulated wastewater (Conditions: O3 flow 0.2 L/min, [O3] = 20 mg/L, pH0 = 7.2, COD0 ≈ 100 mg/L); Figure S2: Effect of different calcination times (a) and temperatures (b) on COD removal from simulated wastewater (Conditions: O3 flow 0.2 L/min, [O3] = 20 mg/L, pH0 = 7.2, COD0 ≈ 100 mg/L); Figure S3: Comparison of the catalyst recycling under laboratory conditions with a commercial catalyst (Conditions: O3 flow 0.2 L/min, [O3] = 20 mg/L, pH0 = 7.2, COD0 ≈ 100 mg/L); Figure S4: XRD diagram of catalyst; Figure S5: XPS images of catalysts: (a) full spectrum; (b) O1s; (c) Al2p; (d) Fe2p; (e) Mn2p; Table S1: Metal ion leaching during catalytic ozonation process.

Author Contributions

Conceptualization, K.C.; Methodology, P.W.; Validation, S.S. and J.W.; Formal analysis, P.W.; Resources, P.W.; Data curation, P.W.; Writing—original draft, P.W.; Writing—review & editing, K.C.; Visualization, K.C.; Supervision, K.C.; Project administration, S.S. and J.W.; Funding acquisition, J.W. All authors have read and agreed to the published version of the manuscript.

Funding

This work was supported by the Science and Technology Innovation Tackle Plan Project of Anhui Province (202423110050041) and the University Synergy Innovation Program of Anhui Province (GXXT-2023-046).

Data Availability Statement

All the data can be found in the manuscript and the Supplementary Materials. Further requests can be directed to the corresponding author.

Conflicts of Interest

Shijie Sun and Jiao Wang were employed by Wancho Environmental-Protection Co., Ltd. The remaining authors declare that the research was conducted in the absence of any commercial or financial relationships that could be construed as a potential conflict of interest.

References

  1. Li, M.; Fu, L.; Tan, Y.; Zhou, Y.; Wu, C. Application progress of catalytic ozonation in industrial effluents treatment. Ind. Water Treat. 2022, 42, 56–65. [Google Scholar]
  2. Zhang, J.; Liu, P.; Ren, Y.; Du, Y.; Geng, C.; Ma, J.; Zhao, F. Treatment of shale gas produced water by magnetic CuFe2O4/TNTs hybrid heterogeneous catalyzed ozone: Efficiency and mechanisms. J. Hazard. Mater. 2022, 423, 127124. [Google Scholar] [CrossRef] [PubMed]
  3. Zeng, Y.; Zhuo, Q.; Yu, J.; Qi, B.; Yu, B.; Fu, H. Constructing electron-enriched Cu-Mn binuclear sites for enhanced catalytic ozonation toward wastewater purification. Chem. Eng. J. 2024, 501, 157680. [Google Scholar] [CrossRef]
  4. An, W.; Li, X.; Ma, J.; Ma, L. Advanced treatment of industrial wastewater by ozonation with iron-based monolithic catalyst packing: From mechanism to application. Water Res. 2023, 235, 119860. [Google Scholar] [CrossRef]
  5. Han, Y.; Liu, Z.; Wang, Y.; Liang, W.; He, S.; Yue, L. Performance study of CeO2-Co3O4/Z in ozone catalytic oxidation of antibiotic wastewater. Mater. Lett. 2025, 390, 138386. [Google Scholar] [CrossRef]
  6. Dai, M.; Yang, C.; Yang, L.; Lin, Y.; He, S.; Li, X.; Niu, Q.; Wu, S. Performances and mechanisms of catalytic ozonation for paint wastewater via catalysts of Fe-Mn deposited within graphitized beads of γ-Al2O3. J. Clean. Prod. 2025, 495, 145099. [Google Scholar] [CrossRef]
  7. Gao, E.; Xu, J.; Liu, F.; Wu, Z.; Zhu, J.; Wang, W.; Li, J.; Yao, S.; Wu, Z. Highly efficient mineralization of phenol through catalytic ozonation using urchin-like CuxCe1Oy-BTC catalysts derived from metal-organic frameworks. J. Environ. Sci. 2025, 154, 575–589. [Google Scholar] [CrossRef]
  8. Zhong, J.; feng Mao, X.; Wang, G.; Li, H.; Li, J.; Qu, S.; Zhao, J. Synthesis of Cu/Mn/Ce polymetallic oxide catalysts and catalytic ozone treatment of wastewater. RSC Adv. 2024, 14, 35993–36004. [Google Scholar] [CrossRef]
  9. Mao, H.; Ye, S.; Wang, C.; Liu, J.; Guo, Y. Co-Mn bimetallic oxide catalyzed continuously ozonation of lignin to high-value added aromatic aldehydes under mild condition. Ind. Crops Prod. 2025, 226, 120644. [Google Scholar] [CrossRef]
  10. Chen, W.; Bao, Y.; Li, X.; Huang, J.; Tang, Y.; Li, L. Mineralization of salicylic acid via catalytic ozonation with Fe-Cu@ SiO2 core-shell catalyst: A two-stage first order reaction. Chemosphere 2019, 235, 470–480. [Google Scholar] [CrossRef]
  11. Huang, Y.; Yang, T.; Liang, M.; Wang, Y.; Xu, Z.; Zhang, D.; Li, L. Ni-Fe layered double hydroxides catalized ozonation of synthetic wastewater containing Bisphenol A and municipal secondary effluent. Chemosphere 2019, 235, 143–152. [Google Scholar] [CrossRef]
  12. Tian, X.; Zhu, J.; Tang, M.; Wang, D.; Nie, Y.; Yang, L.; Dai, C.; Yang, C.; Lu, L. Surface acidity and basicity of Mg/Al hydrotalcite for 2, 4-dichlorophenoxyacetic acid degradation with ozone: Mineralization, mechanism, and implications to practical water treatment. J. Hazard. Mater. 2021, 402, 123475. [Google Scholar] [CrossRef]
  13. Chen, H.; Wang, J. Catalytic ozonation of sulfamethoxazole over Fe3O4/Co3O4 composites. Chemosphere 2019, 234, 14–24. [Google Scholar] [CrossRef]
  14. Zhao, H.; Zhang, Q.; Tang, Y.; Hu, B.; Yang, X.; Hu, Q. ZnO-MgO/Al2O3adsorption-ozone catalytic oxidation treatment of refractory organic wastewater. Environ. Chem. 2021, 40, 818–827. [Google Scholar]
  15. Wang, J.; Chen, H. Catalytic ozonation for water and wastewater treatment: Recent advances and perspective. Sci. Total Environ. 2020, 704, 135249. [Google Scholar] [CrossRef] [PubMed]
  16. Dong, G.; Chen, B.; Liu, B.; Hounjet, L.J.; Cao, Y.; Stoyanov, S.R.; Yang, M.; Zhang, B. Advanced oxidation processes in microreactors for water and wastewater treatment: Development, challenges, and opportunities. Water Res. 2022, 211, 118047. [Google Scholar] [CrossRef] [PubMed]
  17. Zhang, M.Y.; Li, Z.X.; Yin, S.J.; Liu, W.J.; Ju, P.P.; Kong, X.H.; Liu, Y.F. Progress in the application of ozonation catalyzed by nano-catalysts. Appl. Chem. Ind. 2024, 53, 218–221+227. [Google Scholar]
  18. Zheng, Y.; Yu, Y.; Li, Y.; Wu, C.; Liu, W.; Liu, C. Adsorption of phosphorus or ammonia nitrogen by ceramsite made from waterworks sludge. Chin. J. Environ. Eng. 2015, 9, 756–762. [Google Scholar]
  19. Xian, G.; Fei, M.; Dong, T. Adsorption treatment of Cd2+ wastewater with clay based ceramsite. Ind. Water Treat. 2011, 31, 49–52. [Google Scholar]
  20. HJ 828-2017; Water Quality—Determination of Chemical Oxygen Demand—Potassium Dichromate Method. China Environmental Science Press: Beijing, China, 2017.
  21. GB 11893-89; Water Quality—Determination of Total Phosphorus—Ammonium Molybdate Spectrophotometric Method. China Standards Press: Beijing, China, 1989.
  22. Rakness, K.; Gordon, G.; Langlais, B.; Masschelein, W.; Matsumoto, N.; Richard, Y.; Robson, C.M.; Somiya, I. Guideline for measurement of ozone concentration in the process gas from an ozone generator. J. Int. Ozone Assoc. 1996, 18, 209–229. [Google Scholar] [CrossRef]
  23. Mahmood, Z.; Garg, S.; Yuan, Y.; Xie, L.; Wang, Y.; Waite, T.D. Performance evaluation and optimization of a suspension-type reactor for use in heterogeneous catalytic ozonation. Water Res. 2024, 254, 121410. [Google Scholar] [CrossRef] [PubMed]
  24. Fallah, N.; Bloise, E.; Santoro, D.; Mele, G. State of art and perspectives in catalytic ozonation for removal of organic pollutants in water: Influence of process and operational parameters. Catalysts 2023, 13, 324. [Google Scholar] [CrossRef]
  25. Long, J.; Guo, Y.; Yu, G.; Komarneni, S.; Wang, Y. Evaluation of the effect of catalysts on ozone mass transfer and pollutant abatement during laboratory catalytic ozonation experiments: Implications for practical water and wastewater treatment. ACS EST Eng. 2022, 3, 387–397. [Google Scholar] [CrossRef]
  26. Psaltou, S.; Mitrakas, M.; Zouboulis, A. Heterogeneous catalytic ozonation: Solution pH and initial concentration of pollutants as two important factors for the removal of micropollutants from water. Separations 2022, 9, 413. [Google Scholar] [CrossRef]
  27. Bani-Melhem, K.; Alnaief, M.; Al-Qodah, Z.; Al-Shannag, M.; Elnakar, H.; AlJbour, N.; Alu’datt, M.; Alrosan, M.; Ezelden, E. On the performance of electrocoagulation treatment of high-loaded gray water: Kinetic modeling and parameters optimization via response surface methodology. Appl. Water Sci. 2025, 15, 114. [Google Scholar] [CrossRef]
  28. GB 8978-1996; Integrated Wastewater Discharge Standard. China Standards Press: Beijing, China, 1996.
  29. Kragović, M.; Stojmenović, M.; Petrović, J.; Loredo, J.; Pašalić, S.; Nedeljković, A.; Ristović, I. Influence of alginate encapsulation on point of zero charge (pHpzc) and thermodynamic properties of the natural and Fe(III)-modified zeolite. Procedia Manuf. 2019, 32, 286–293. [Google Scholar] [CrossRef]
  30. Yan, H.; Lu, P.; Pan, Z.; Wang, X.; Zhang, Q.; Li, L. Ce/SBA-15 as a heterogeneous ozonation catalyst for efficient mineralization of dimethyl phthalate. J. Mol. Catal. A Chem. 2013, 377, 57–64. [Google Scholar] [CrossRef]
  31. Li, Z.; Chen, S.; Liu, L.; Qian, D.; Yuan, M.; Yu, J.; Chen, Z.; Yang, J.; Su, X.; Hu, J. Formation mechanism of persistent free radicals during pyrolysis of Fenton-conditioned sewage sludge: Influence of NOM and iron. Water Res. 2024, 254, 121376. [Google Scholar] [CrossRef]
  32. Hendrasarie, N.; Ramadhani, A.N.; Rosariawari, F.; Amalia, A. Hybrid Biofilter-Adsorption Performance to Removal Organic Matter and Color on Black Soybean Sauce Wastewater. IOP Conf. Ser. Earth Environ. Sci. 2025, 1454, 012030. [Google Scholar] [CrossRef]
  33. Flyunt, R.; Leitzke, A.; Mark, G.; Mvula, E.; Reisz, E.; Schick, R.; von Sonntag, C. Determination of OH, O2•−, and hydroperoxide yields in ozone reactions in aqueous solution. J. Phys. Chem. B 2003, 107, 7242–7253. [Google Scholar] [CrossRef]
  34. Zhang, S.; Quan, X.; Zheng, J.-F.; Wang, D. Probing the interphase “HO zone” originated by carbon nanotube during catalytic ozonation. Water Res. 2017, 122, 86–95. [Google Scholar] [CrossRef] [PubMed]
  35. Wang, Y.; Ma, L.; Shen, Z.; Liao, S.; An, W. Operation of iron-based monolithic catalyst packing ozonation for industry wastewater advanced treatment: The importance of gas–liquid flow patterns and wastewater flow regimes. Chem. Eng. J. 2024, 494, 153117. [Google Scholar] [CrossRef]
  36. Hai, J.; Zhang, G.; Cheng, J. Estimation of mass transfer coefficient in ozone absorption by linear least square fitting and Simplex search methods. J. Cent. South Univ. 2012, 19, 3396–3399. [Google Scholar] [CrossRef]
  37. Pang, H.; Zhang, J.; Allinson, M.; Gray, S.; Scales, P.J. A chemical credit framework to predict the removal performance of organic chemicals of concern from water through an ozonation process. Water Res. 2023, 232, 119671. [Google Scholar] [CrossRef]
  38. Song, Y.; Peng, J.; Zhao, Z.; Qin, W.; Jiang, J.; Ma, J. Novel insights into the control of N-nitrosodimethylamine (NDMA) and bromate formation during heterogeneous catalytic ozonation. Chem. Eng. J. 2023, 474, 145913. [Google Scholar] [CrossRef]
  39. Kim, J.Y.U.; Bessegato, G.G.; de Souza, B.C.; da Silva, J.J.; Zanoni, M.V.B. Efficient treatment of swimming pool water by photoelectrocatalytic ozonation: Inactivation of Candida parapsilosis and mineralization of Benzophenone-3 and urea. Chem. Eng. J. 2019, 378, 122094. [Google Scholar] [CrossRef]
  40. Jabesa, A.; Ghosh, P. A comparative study on the removal of dimethyl sulfoxide from water using microbubbles and millibubbles of ozone. J. Water Process Eng. 2021, 40, 101937. [Google Scholar] [CrossRef]
  41. Tekle-Röttering, A.; Lim, S.; Reisz, E.; Lutze, H.V.; Abdighahroudi, M.S.; Willach, S.; Schmidt, W.; Tentscher, P.R.; Rentsch, D.; McArdell, C.S. Reactions of pyrrole, imidazole, and pyrazole with ozone: Kinetics and mechanisms. Environ. Sci. Water Res. Technol. 2020, 6, 976–992. [Google Scholar] [CrossRef]
  42. Yang, Y.; Zhou, S.; Mao, Y.; Zhou, Y.; Cheng, X. Ce-modified NH2-MIL-88B enhances catalytic ozonation for effective antibiotic degradation. Environ. Res. 2025, 275, 121388. [Google Scholar] [CrossRef]
  43. Strotmann, U.; Weberruß, U.; Bias, W. Degradation of morpholine in several biodegradation tests and in wastewater treatment plants. Chemosphere 1993, 26, 1729–1742. [Google Scholar] [CrossRef]
  44. Araújo, C.V.; Nascimento, R.B.; Oliveira, C.A.; Strotmann, U.J.; da Silva, E.M. The use of Microtox® to assess toxicity removal of industrial effluents from the industrial district of Camaçari (BA, Brazil). Chemosphere 2005, 58, 1277–1281. [Google Scholar] [CrossRef] [PubMed]
  45. Quaff, A.; Venkatesh, S.; Venkatesh, K. Degradation of azo dye by ozone oxidation: Cost analysis and buffering effects on dye decomposition. Natl. Acad. Sci. Lett. 2021, 44, 339–341. [Google Scholar] [CrossRef]
  46. Chiavola, A.; Salvati, C.; Bongirolami, S.; Di Marcantonio, C.; Boni, M.R. Techno-economic evaluation of ozone-oxidation for sludge reduction at the full-scale. Comparison between the application to the return activated sludge (RAS) and the sludge digestion unit. J. Water Process Eng. 2021, 42, 102114. [Google Scholar] [CrossRef]
  47. Wu, C.-H.; Ng, H.-Y. Degradation of CI Reactive Red 2 (RR2) using ozone-based systems: Comparisons of decolorization efficiency and power consumption. J. Hazard. Mater. 2008, 152, 120–127. [Google Scholar] [CrossRef] [PubMed]
Figure 1. (a) Schematic and (b) photo of the experimental setup for the cross-tube reactor.
Water 17 01953 g001
Figure 2. Comparison of gas–liquid flow directions in (a) conventional tower reactor and (b) cross-tube reactor.
Water 17 01953 g002
Figure 3. (ae) COD removal at different hydraulic retention times. (f) Average COD removal efficiency at different HRTs (O3 dose: 38 mg/L, pH ≈ 7.35, T ≈ 17 °C).
Water 17 01953 g003
Figure 4. (a) COD removal efficiency at different ozone dosages (pH ≈ 7.35, T ≈ 17 °C). (b) Regression curves of O3/CODin and CODout.
Water 17 01953 g004
Figure 5. (a) pH detection of influent and effluent during operation (O3 dose: 43 mg/L, HRT = 25 min T ≈ 17 °C). (b) Determination of the point of zero charge (pHpzc).
Water 17 01953 g005
Figure 6. (a) COD and (b) color removal effect in continuous operation (O3 dose: 43 mg/L, HRT = 25 min, pH ≈ 7.35, T ≈ 17 °C).
Water 17 01953 g006
Figure 7. Effect of inhibitors on different ozone oxidation systems (lab conditions: O3 flow 0.2 L/min, O3 dosage = 20 mg/L, pH0 = 7.2, COD0 ≈ 100 mg/L).
Water 17 01953 g007
Figure 8. Degradation pathways for several different types of critical pollutants.
Water 17 01953 g008
Table 1. Characteristics of the tested biochemical secondary effluent.
ParameterpHCOD (mg/L)NH3-N (mg/L)TP (mg/L)SS (mg/L)Colority (DF)
Average value ± standard deviation7.35 ± 0.1656.21 ± 14.200.89 ± 0.520.16 ± 0.176.06 ± 1.484.08 ± 0.77
Table 2. A variety of water quality indicators in the effluent.
ParameterInfluentEffluentAverage Removal Efficiency
RangeAverage ValueRangeAverage Value
COD (mg/L)82.5~29.756.2257.5~22.536.2835.47%
TP (mg/L)0.77~0.020.160.65~0.0150.1318.75%
SS (mg/L)11~3.56.067.5~2.54.4426.68%
pH6.94~7.97.356.9~7.667.24-
Colority (DF)6~24.274~22.3844.26%
Table 3. Key pollutants detected by LC-MS analysis.
CompoundChemical StructureType
N-nitrosodimethylamine (NDMA)Water 17 01953 i001Nitrogen-containing organics
UreaWater 17 01953 i002
Dimethyl sulfoxide (DMSO)Water 17 01953 i003Sulphur-containing compounds
PyrroleWater 17 01953 i004Heterocyclic compounds
PyrazoleWater 17 01953 i005
MorpholineWater 17 01953 i006Amines
Table 4. Comparison of different processes in operating parameters.
SchemeOzone Dosage (mg/L)HRT (min)ΔCOD (mg/L)
Former ozone catalytic oxidation81 ± 57020~10
Cross-tube ozone catalytic oxidation42 ± 22530~15
Table 5. Comparison of different processes in terms of treatment cost.
SchemeItemsCost (USD/m3)Total Operational Costs (USD/m3)
Former ozone catalytic oxidationMaintenance of equipment0.0260.121
Electricity bill for operational costs 0.028
Liquid oxygen0.050
Catalyst costs0.017
Cross-tube ozone catalytic oxidationMaintenance of equipment0.0240.067
Catalyst costs0.009
Electricity bill for operational costs 0.034
Disclaimer/Publisher’s Note: The statements, opinions and data contained in all publications are solely those of the individual author(s) and contributor(s) and not of MDPI and/or the editor(s). MDPI and/or the editor(s) disclaim responsibility for any injury to people or property resulting from any ideas, methods, instructions or products referred to in the content.