
Experimental and Theoretical Evaluation of Buoyancy Reduction in Saturated Clay Soils


Abstract
1. Introduction
2. Research Methodology
2.1. Model Test
- (1)
- Test design
- (2)
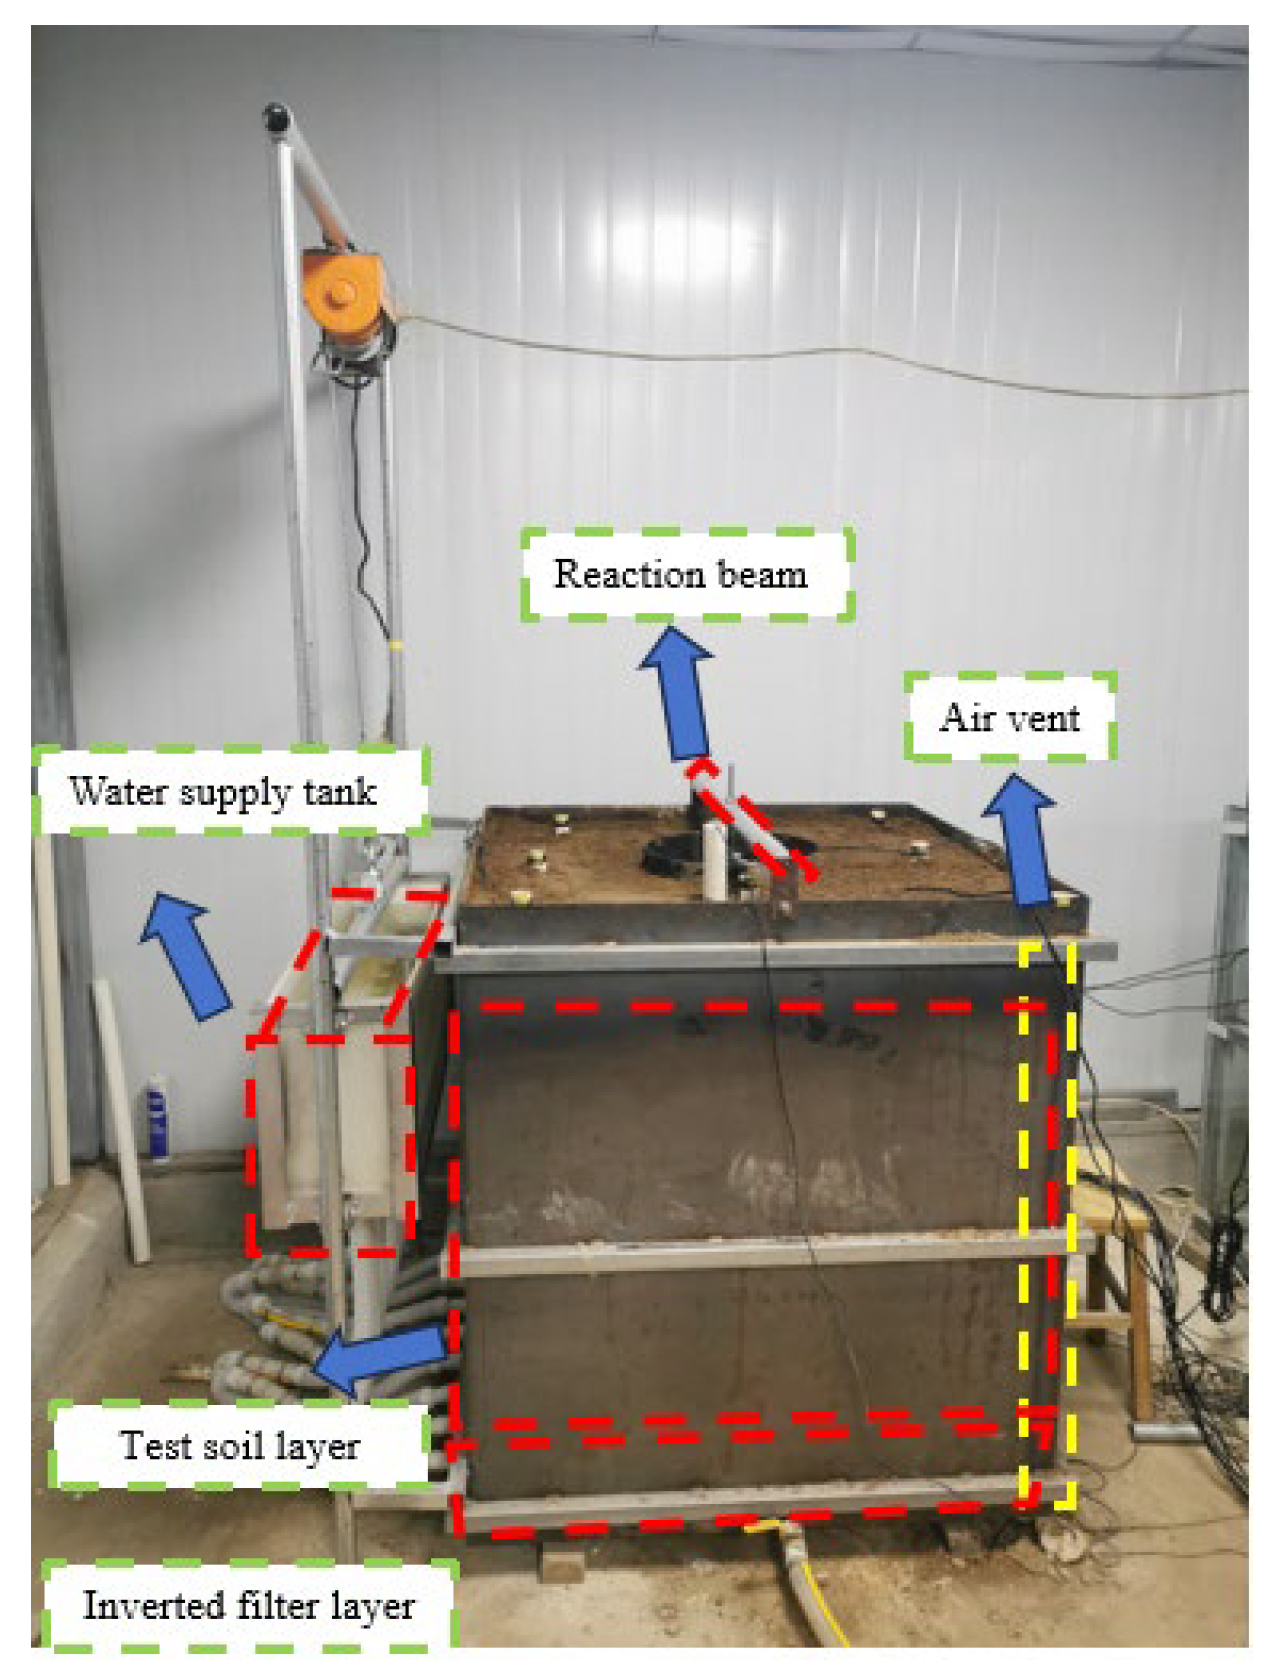
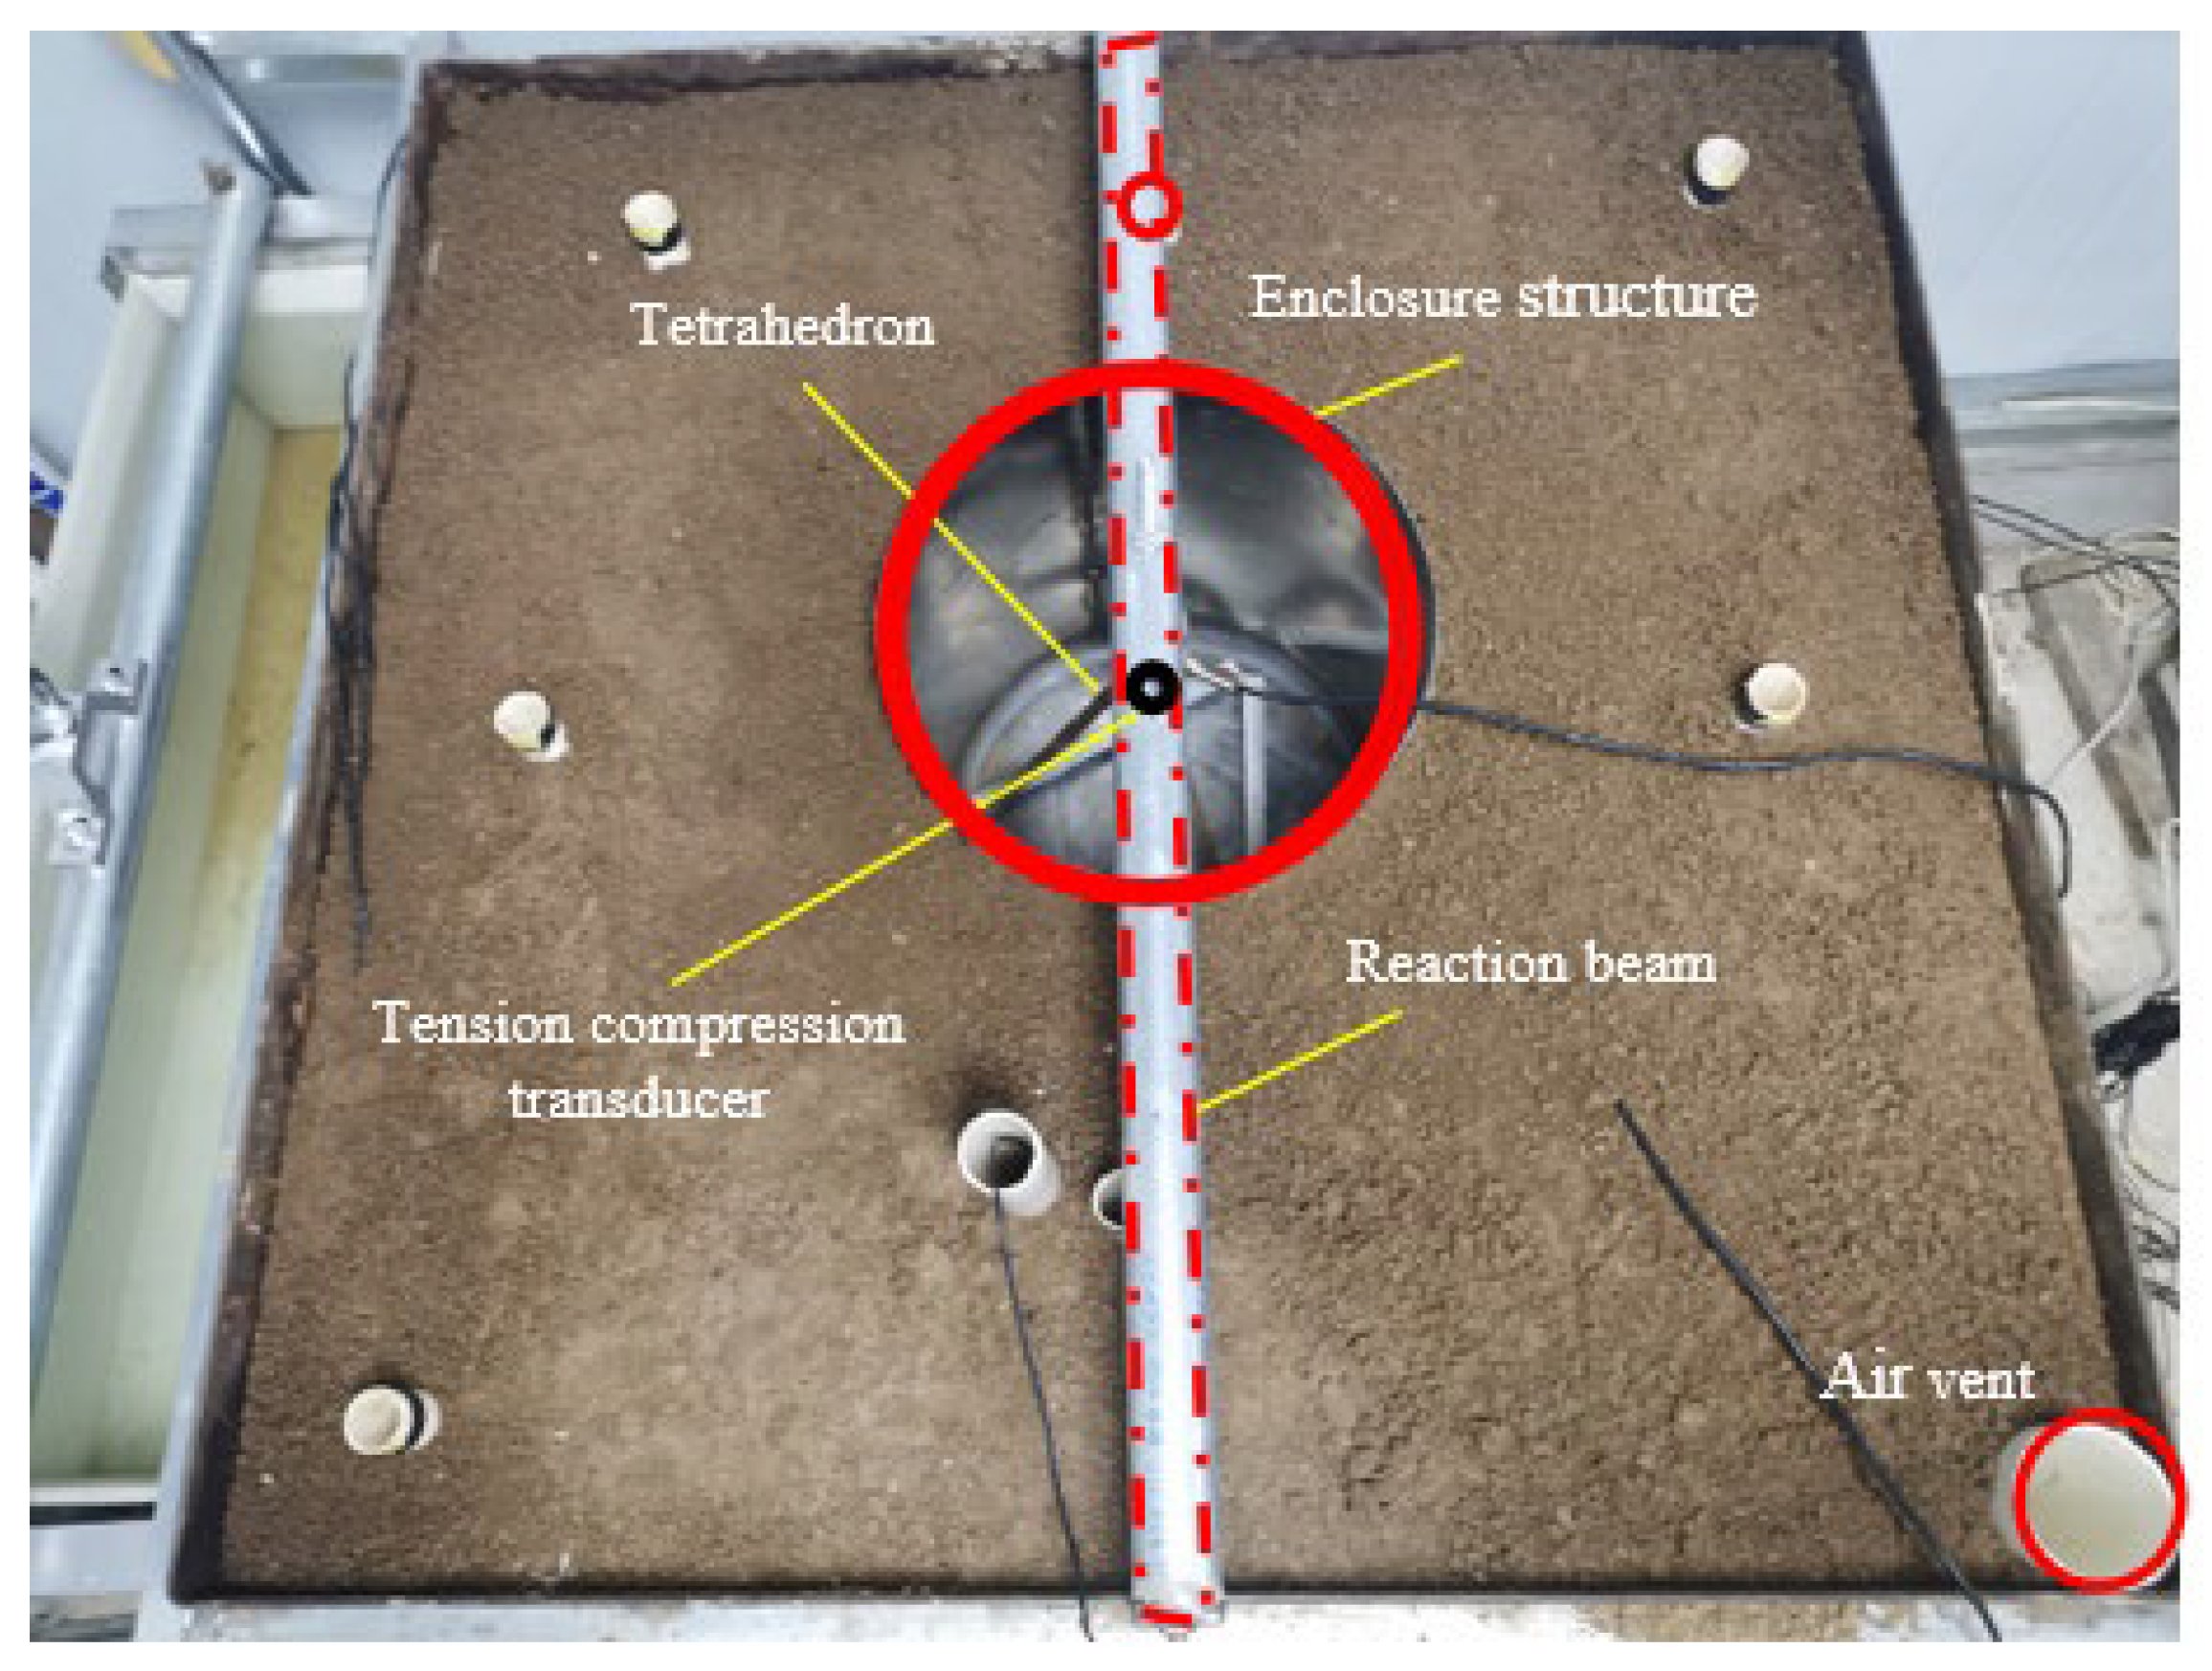
- Composition of the test device
- (3)
- Test procedure
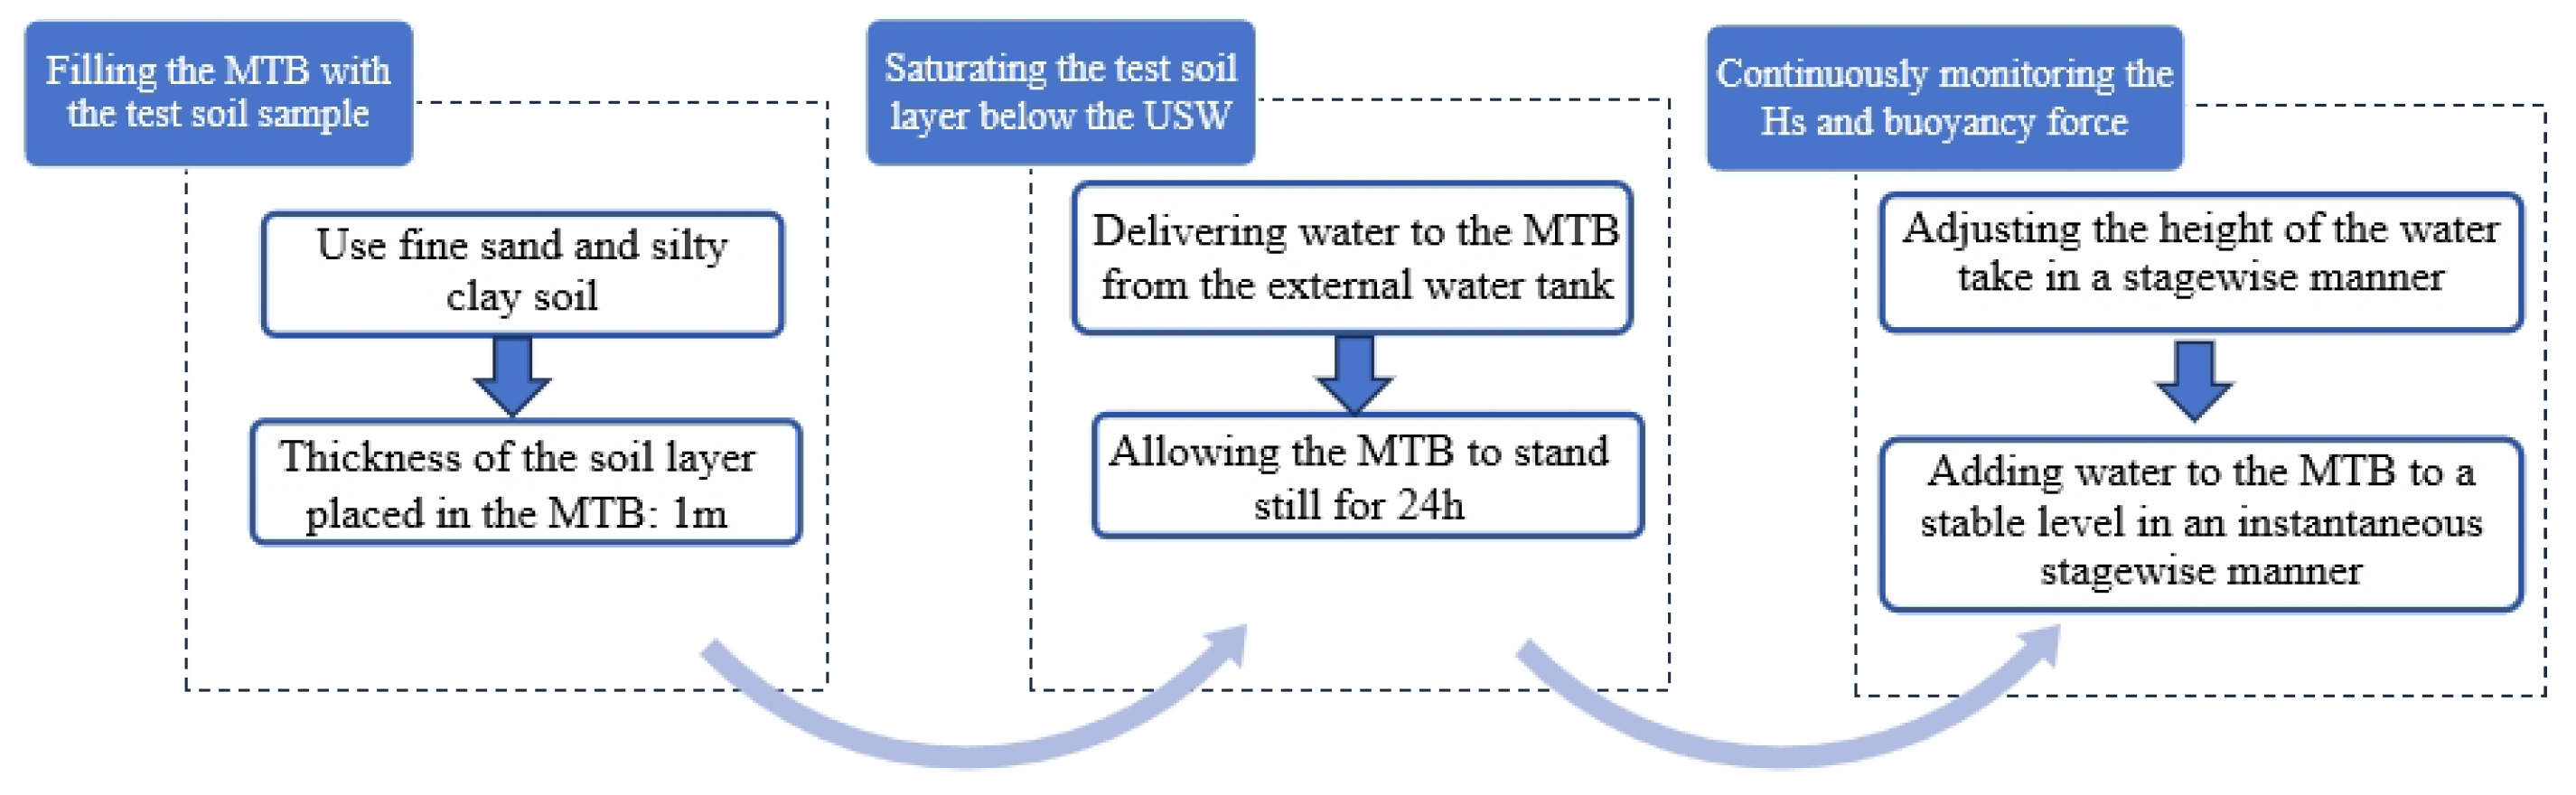
- ①
- Preparation and filling of soil samples. The fine sand and silty clay were used in the test. The effect of structural soil on the test results was not considered in this test; therefore, remolded soil was used instead of undisturbed soil. The retrieved soil samples were manually crushed in the laboratory. During the soil sample filling process, a small amount of water was sprinkled while laying down the soil. The soil was compacted multiple times using manual tamping. The thickness of each filling layer was not more than 20 cm. The filling process for fine sand and silty clay samples was the same. The physical properties of the test soil samples after filling are shown in Table 1 and Table 2. First, a test was conducted on the fine sand layer to verify the reliability of the test system, and then a continuous buoyancy monitoring test was conducted on the silty clay layer.
- ②
- Water supply from the external water tank. Water was continuously supplied to the model box through the external water tank, ensuring that the supply head remained aligned with the bottom of the rigid circular steel plate inside the model. The water level in the soil layer inside the box was continuously monitored. After the water level stabilized, the system remained at rest for 24 h, at which point the test soil layer below the underground engineering module was fully saturated.
- ③
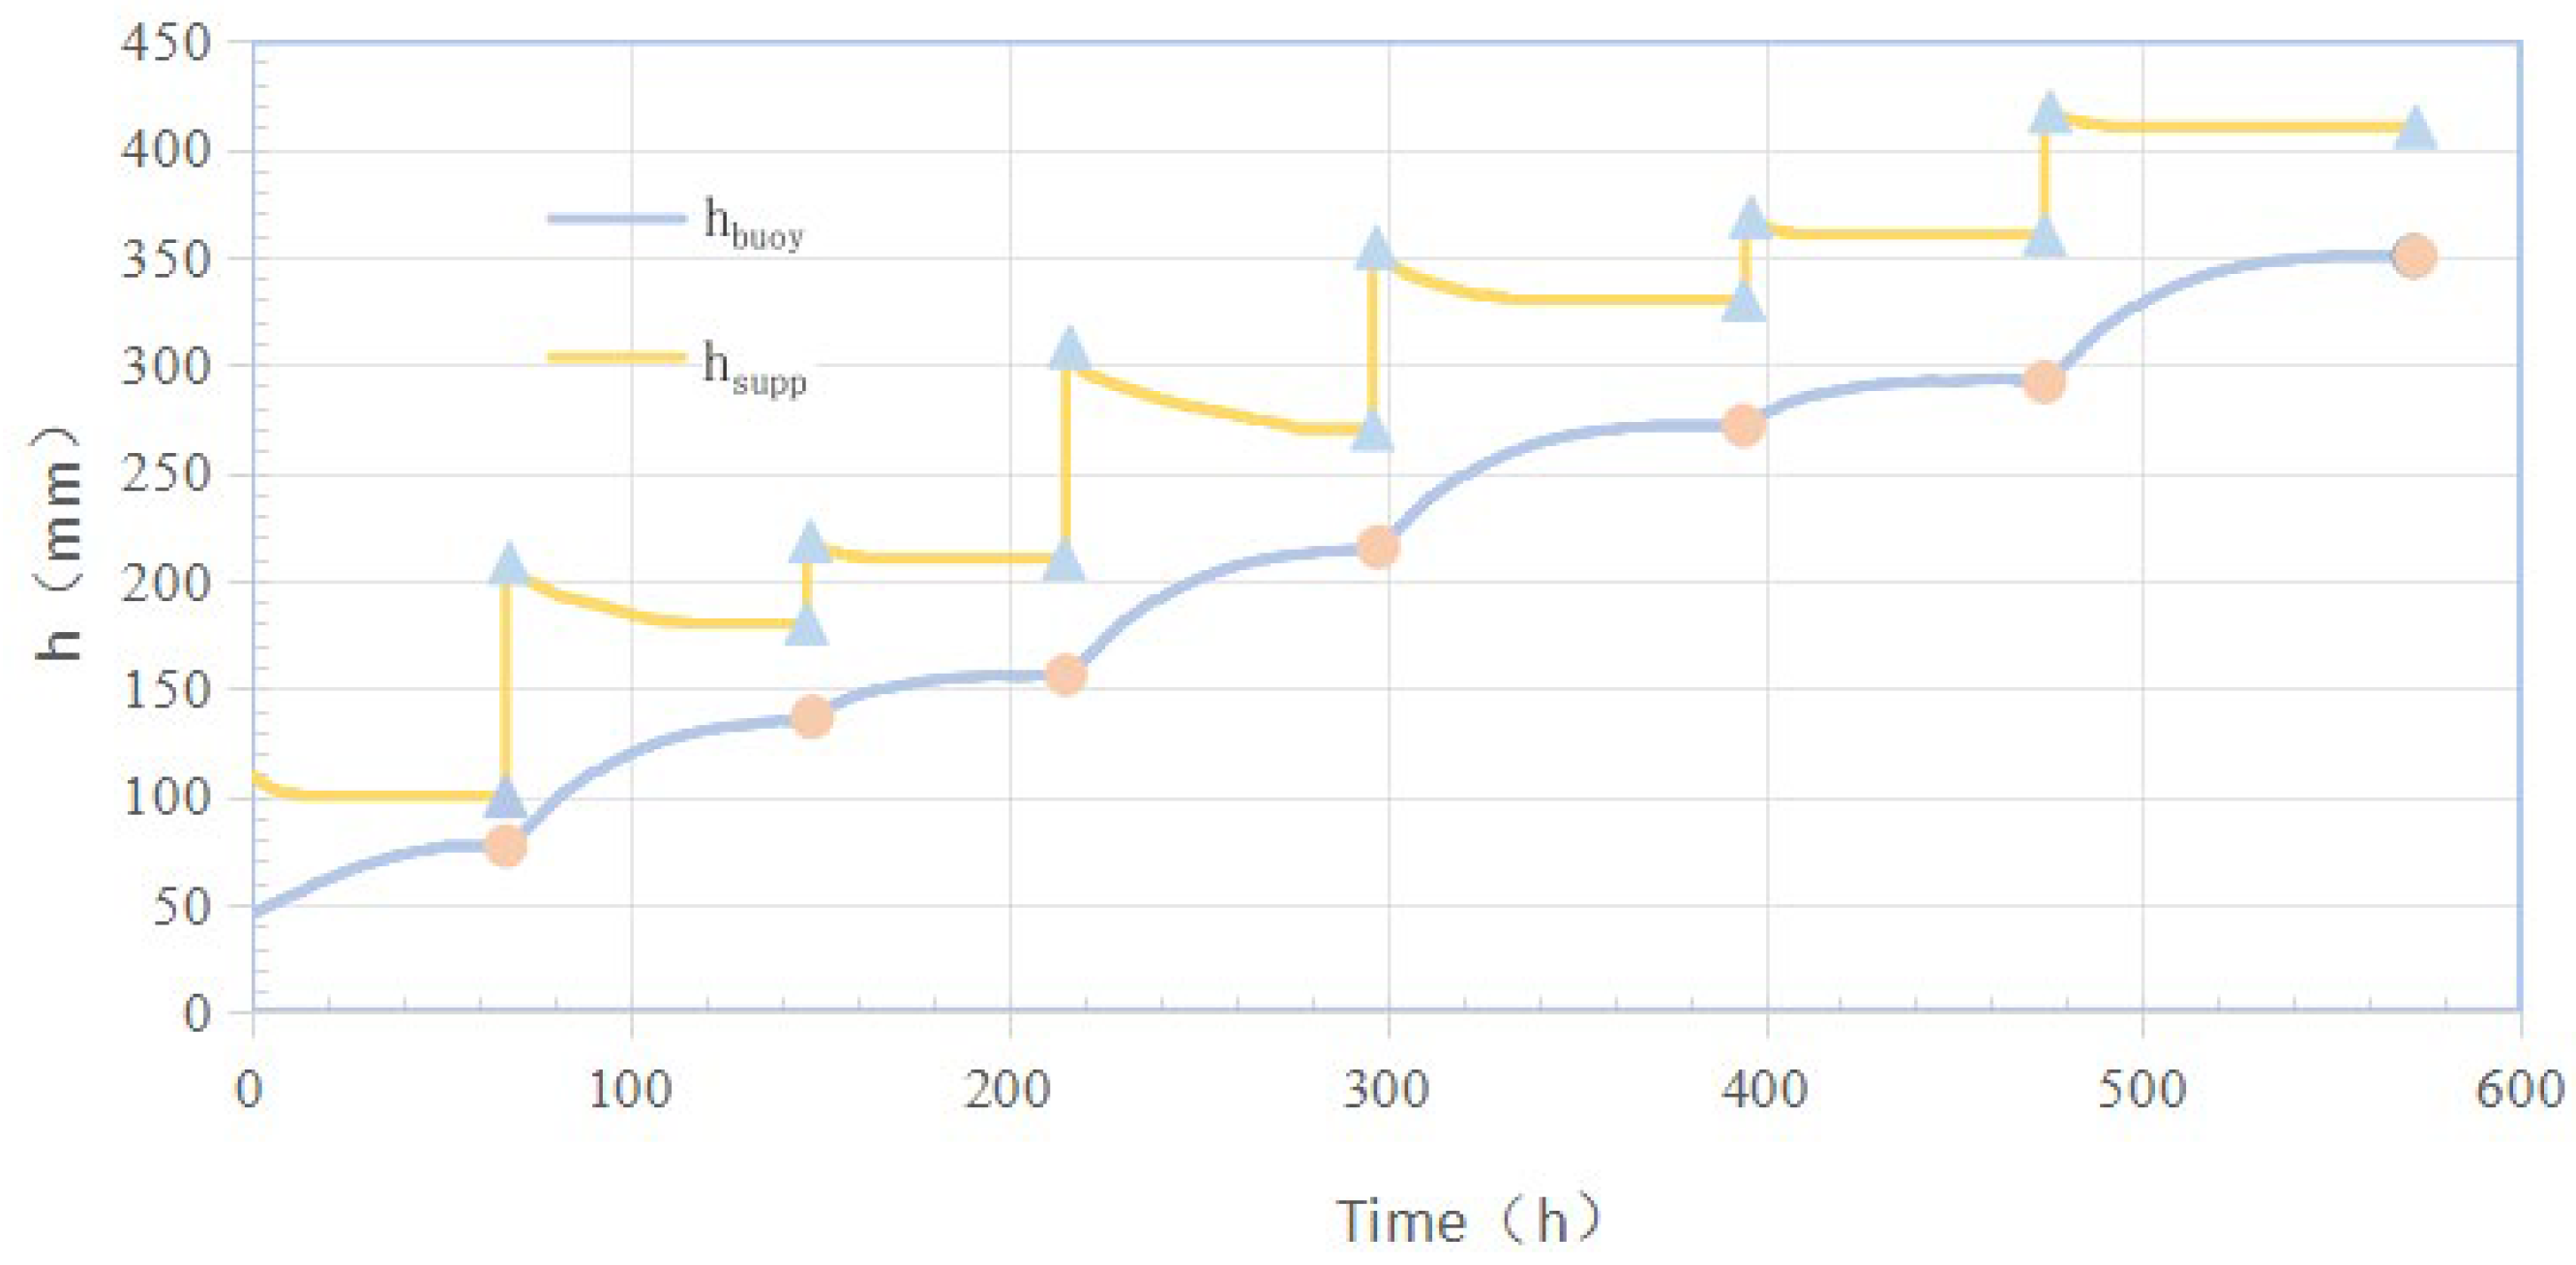
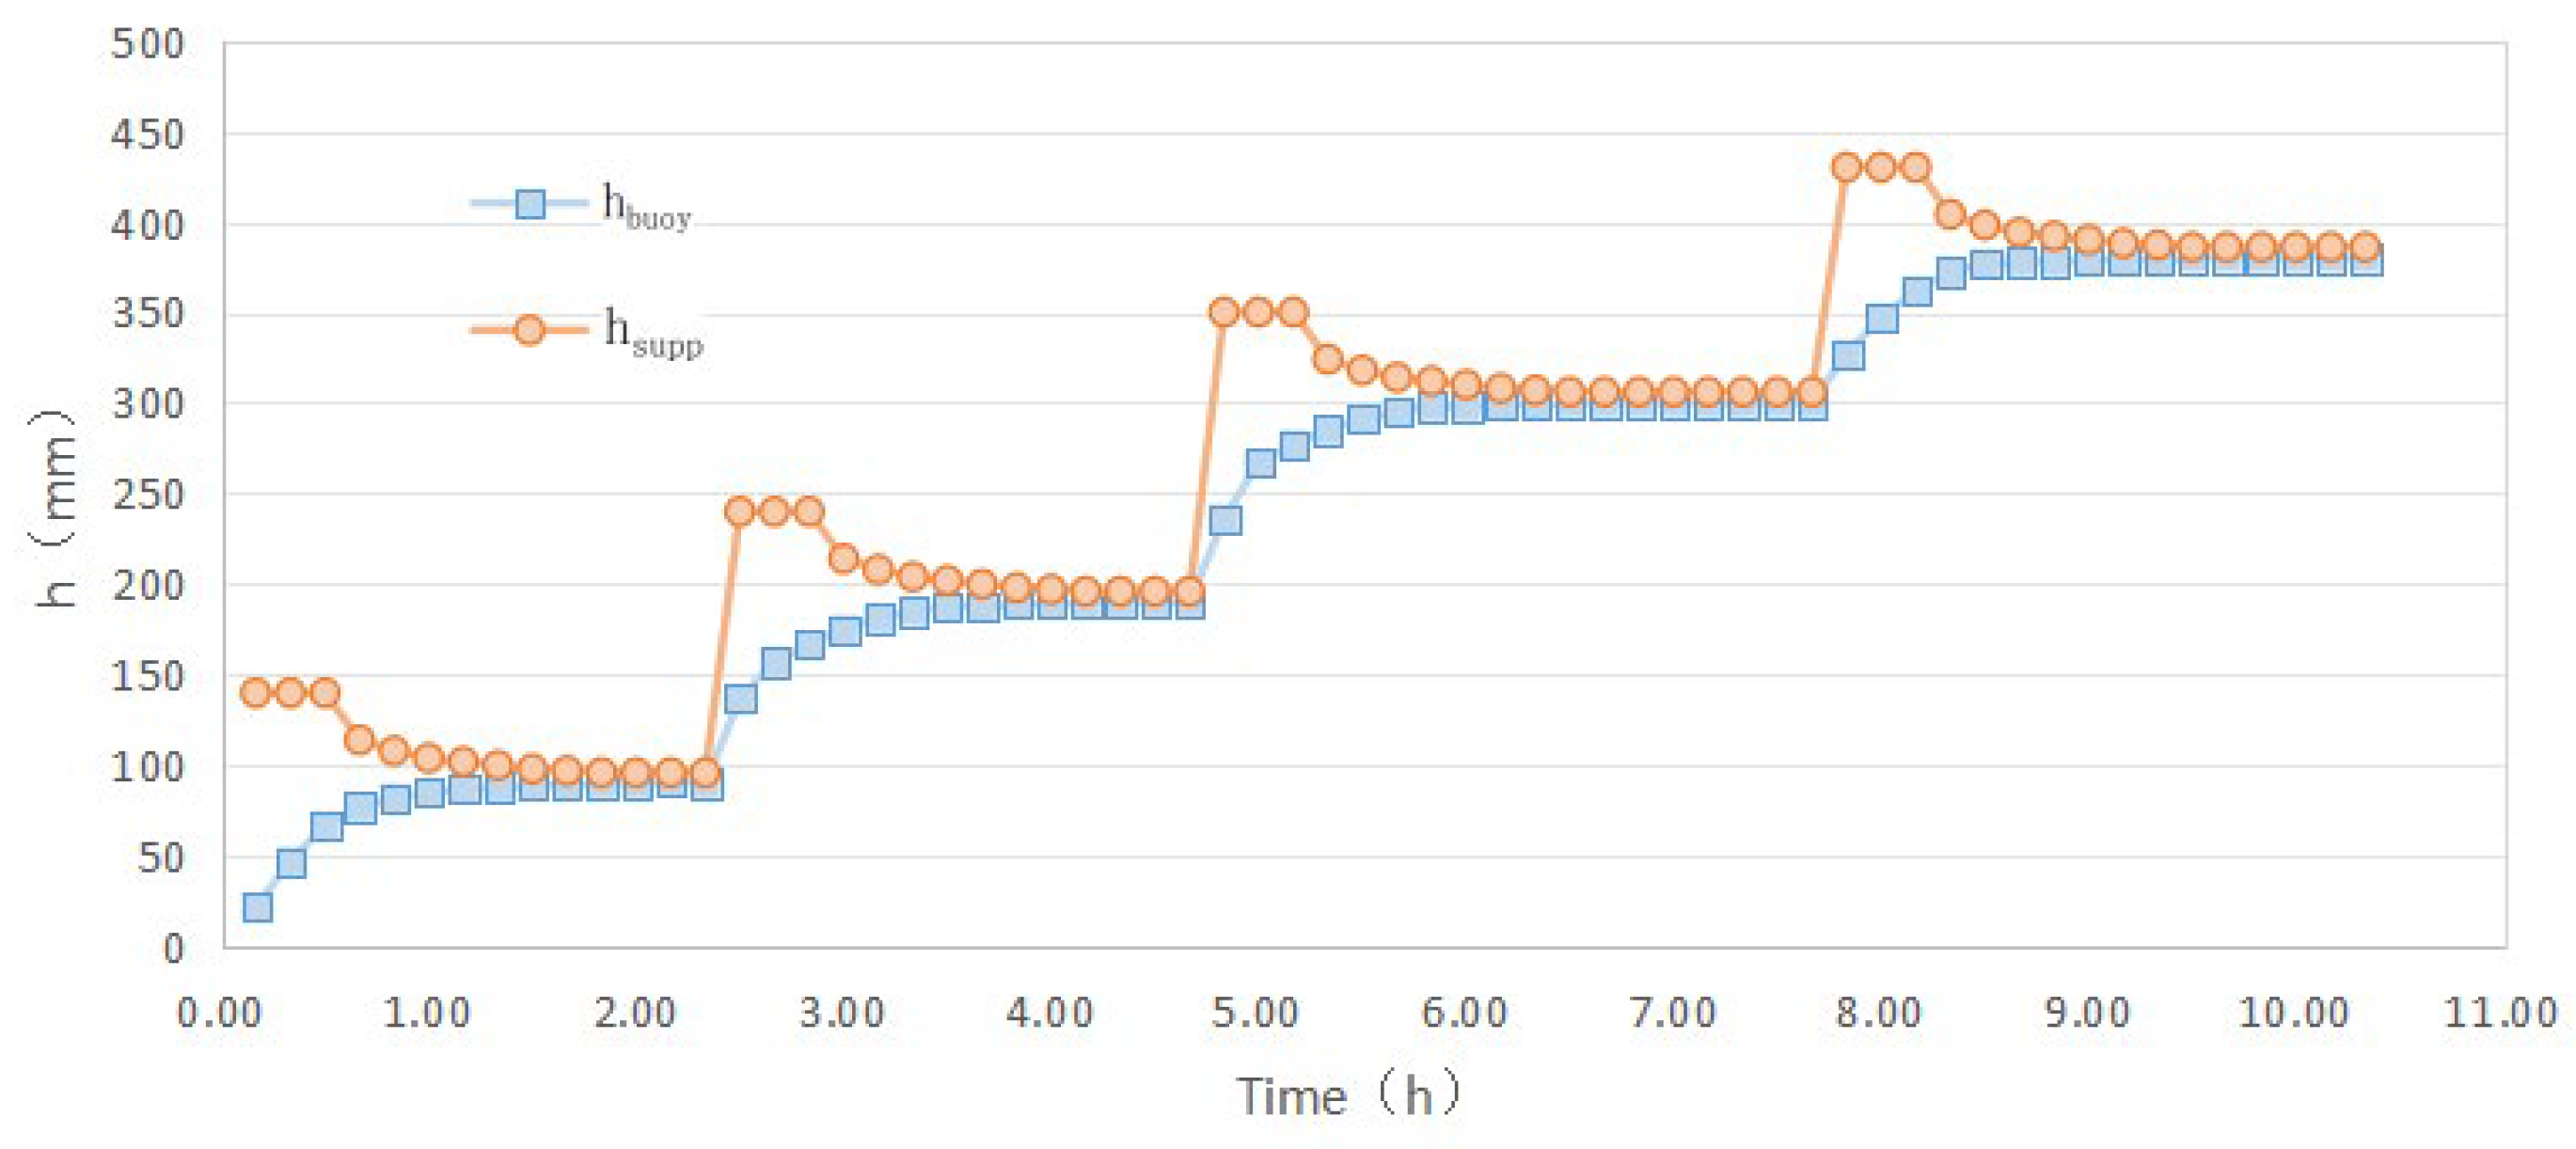
- Buoyancy monitoring test. The height of the water supply tank was adjusted to gradually increase the supply head. The increase in the supply head at each stage depended on the water level and buoyancy response rate of the soil layer in the model. At the beginning of each stage, water was added to the tank to maintain a stable supply head for a certain period; afterward, the water addition was stopped. After the water level in the test soil layer stabilized, the water supply level was further raised, and the next stage commenced. During the entire testing process, the water level and buoyancy were monitored in real time using automatic systems.

| Test Sample | Water Content w (%) | Wet Density ρ (g·cm−3) | Void Ratio e | Saturation Sr (%) | Dry Density ρd (g·cm−3) | Permeability Coefficient k (cm·s−1) |
|---|---|---|---|---|---|---|
| Sand | 26.7 | 1.96 | 0.64 | 96.1 | 1.63 | 5.59 × 10⁻³ |
| Test Sample | Water Content w (%) | Wet Density ρ (g·cm−3) | Porosity n (%) | Saturation Sr (%) | Dry Density ρd (g·cm−3) | Plastic Index Ip | Liquid Index IL | Permeability Coefficient | |
|---|---|---|---|---|---|---|---|---|---|
| kh (cm·s−1) | kv (cm·s−1) | ||||||||
| Silty clay | 21.1 | 1.71 | 44.6 | 95.9 | 1.35 | 13.4 | 0.46 | 1.45 × 10⁻⁵ | 1.16 × 10⁻⁵ |
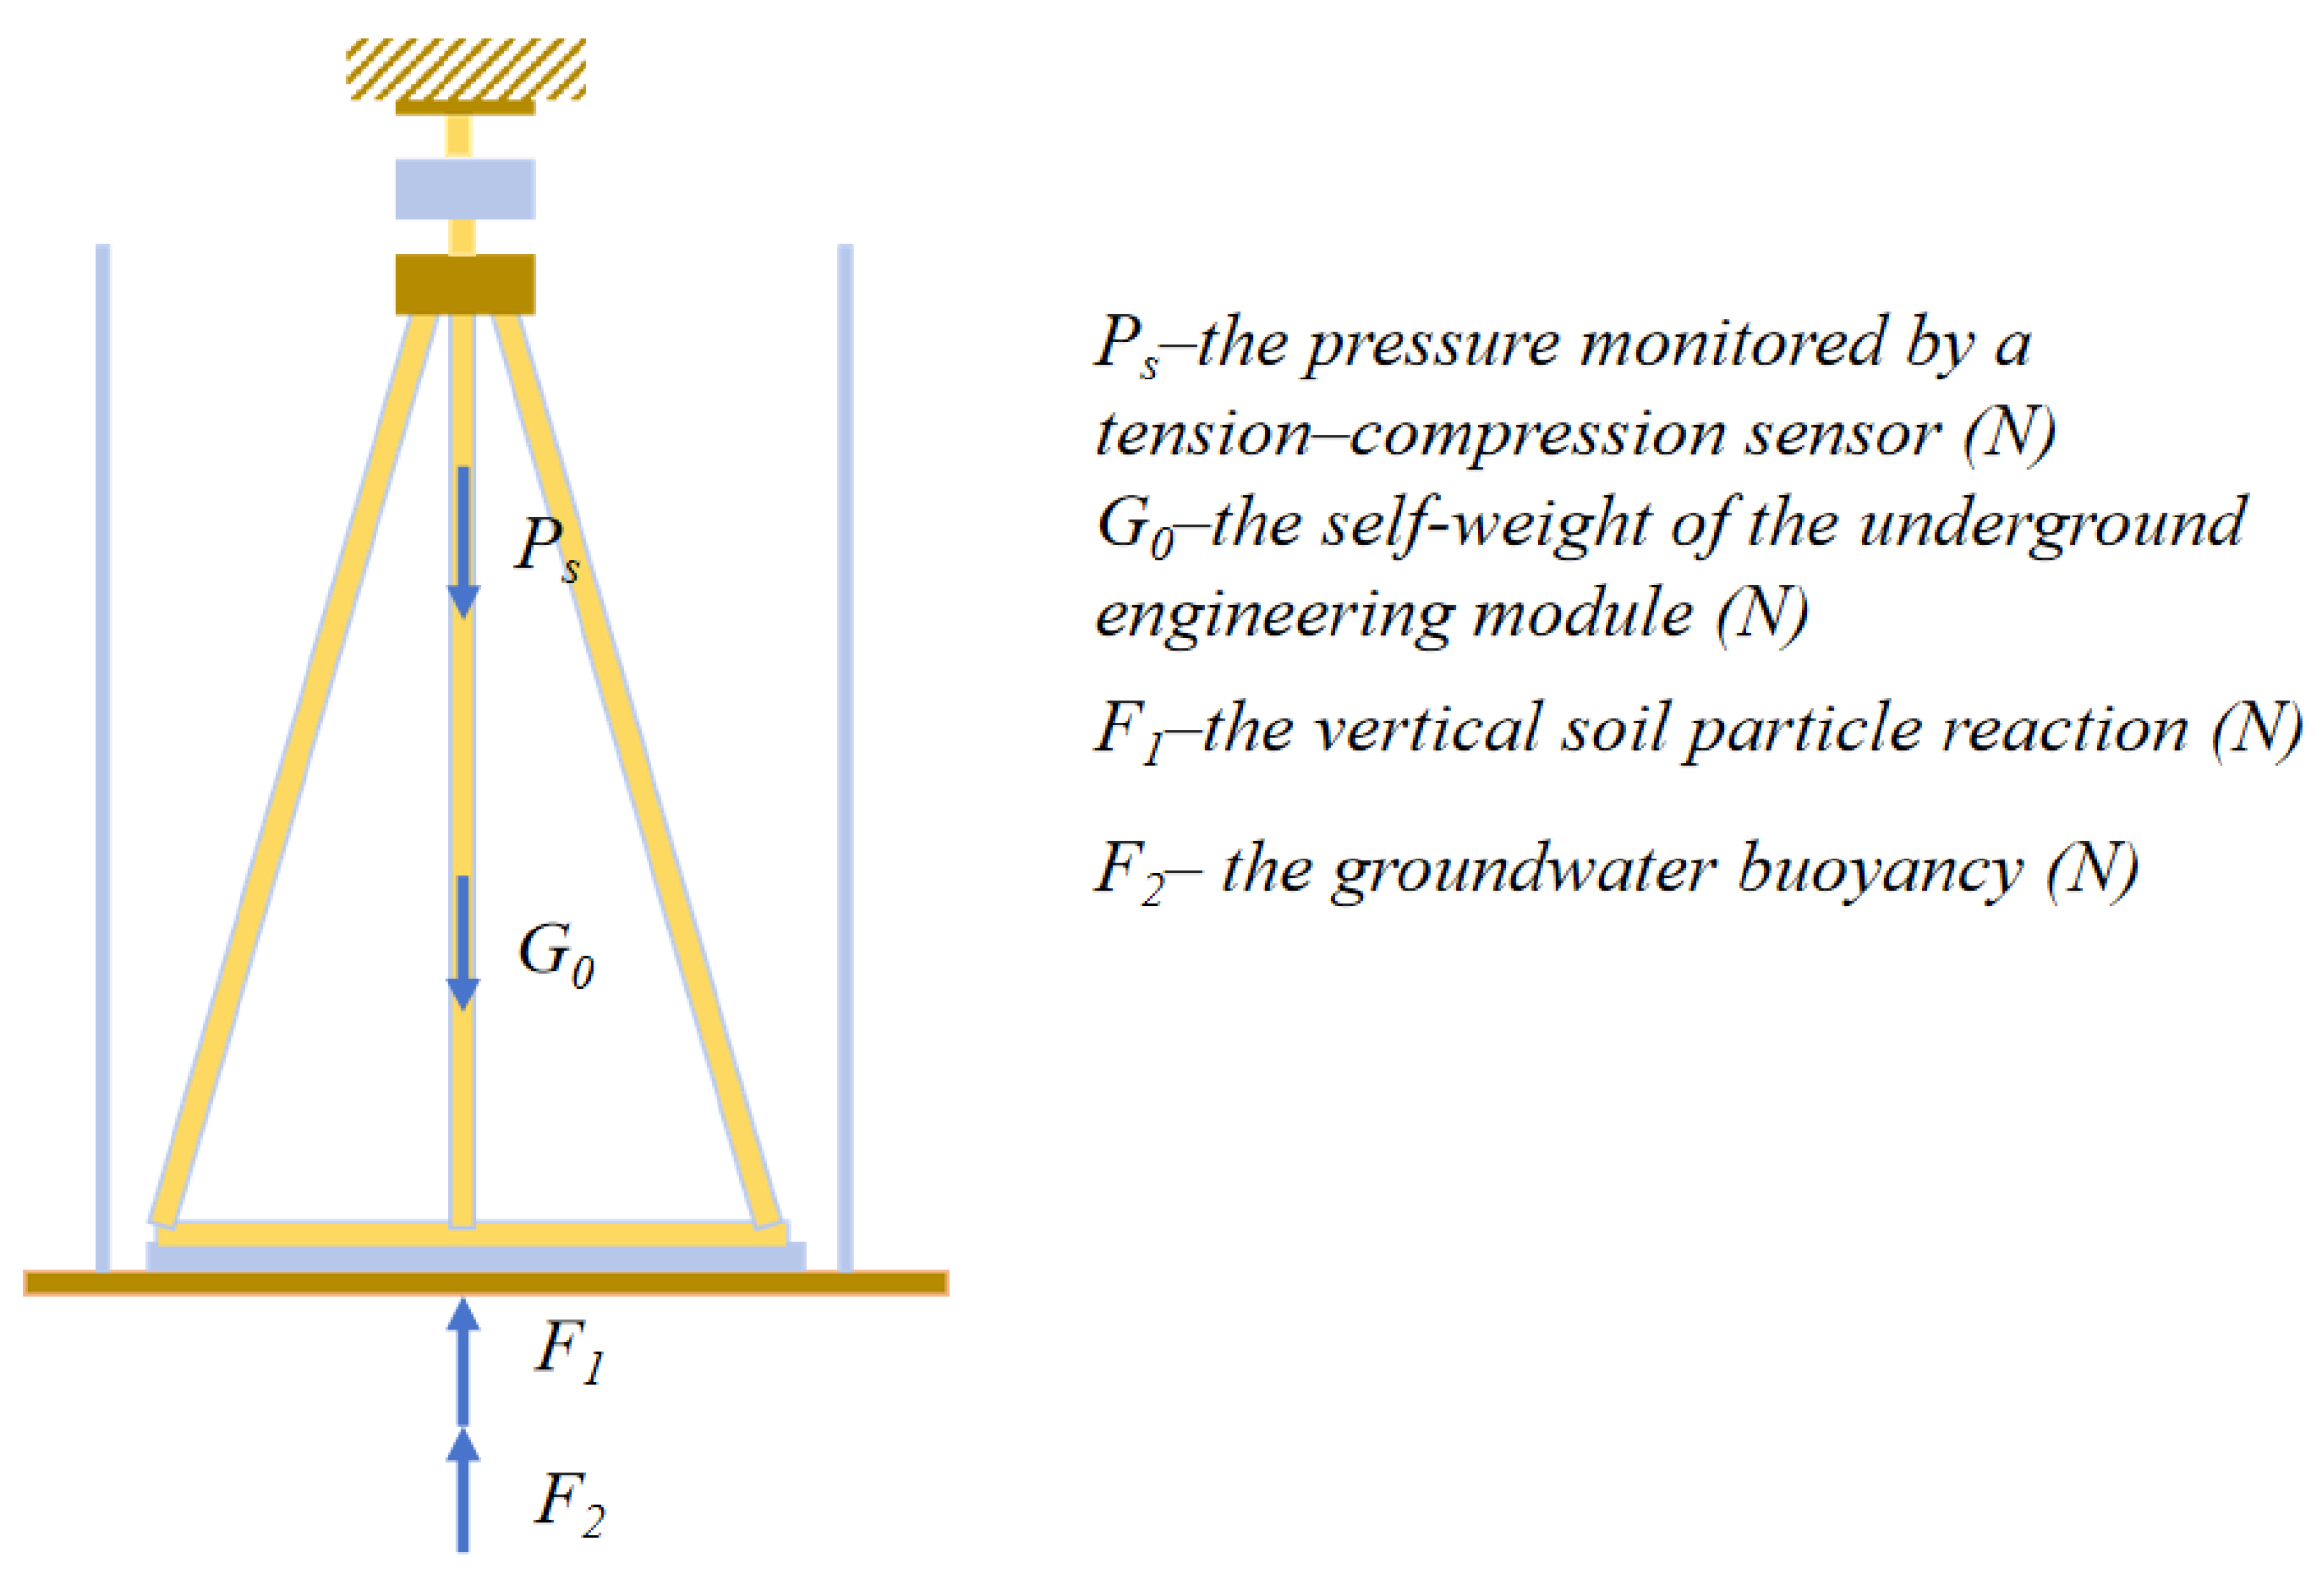
- (4)
- Force analysis
2.2. Geotechnical Test
- (1)
- Mercury injection test
- (2)
- Measurement test for the volume ratios of soil particles and bound water
- (3)
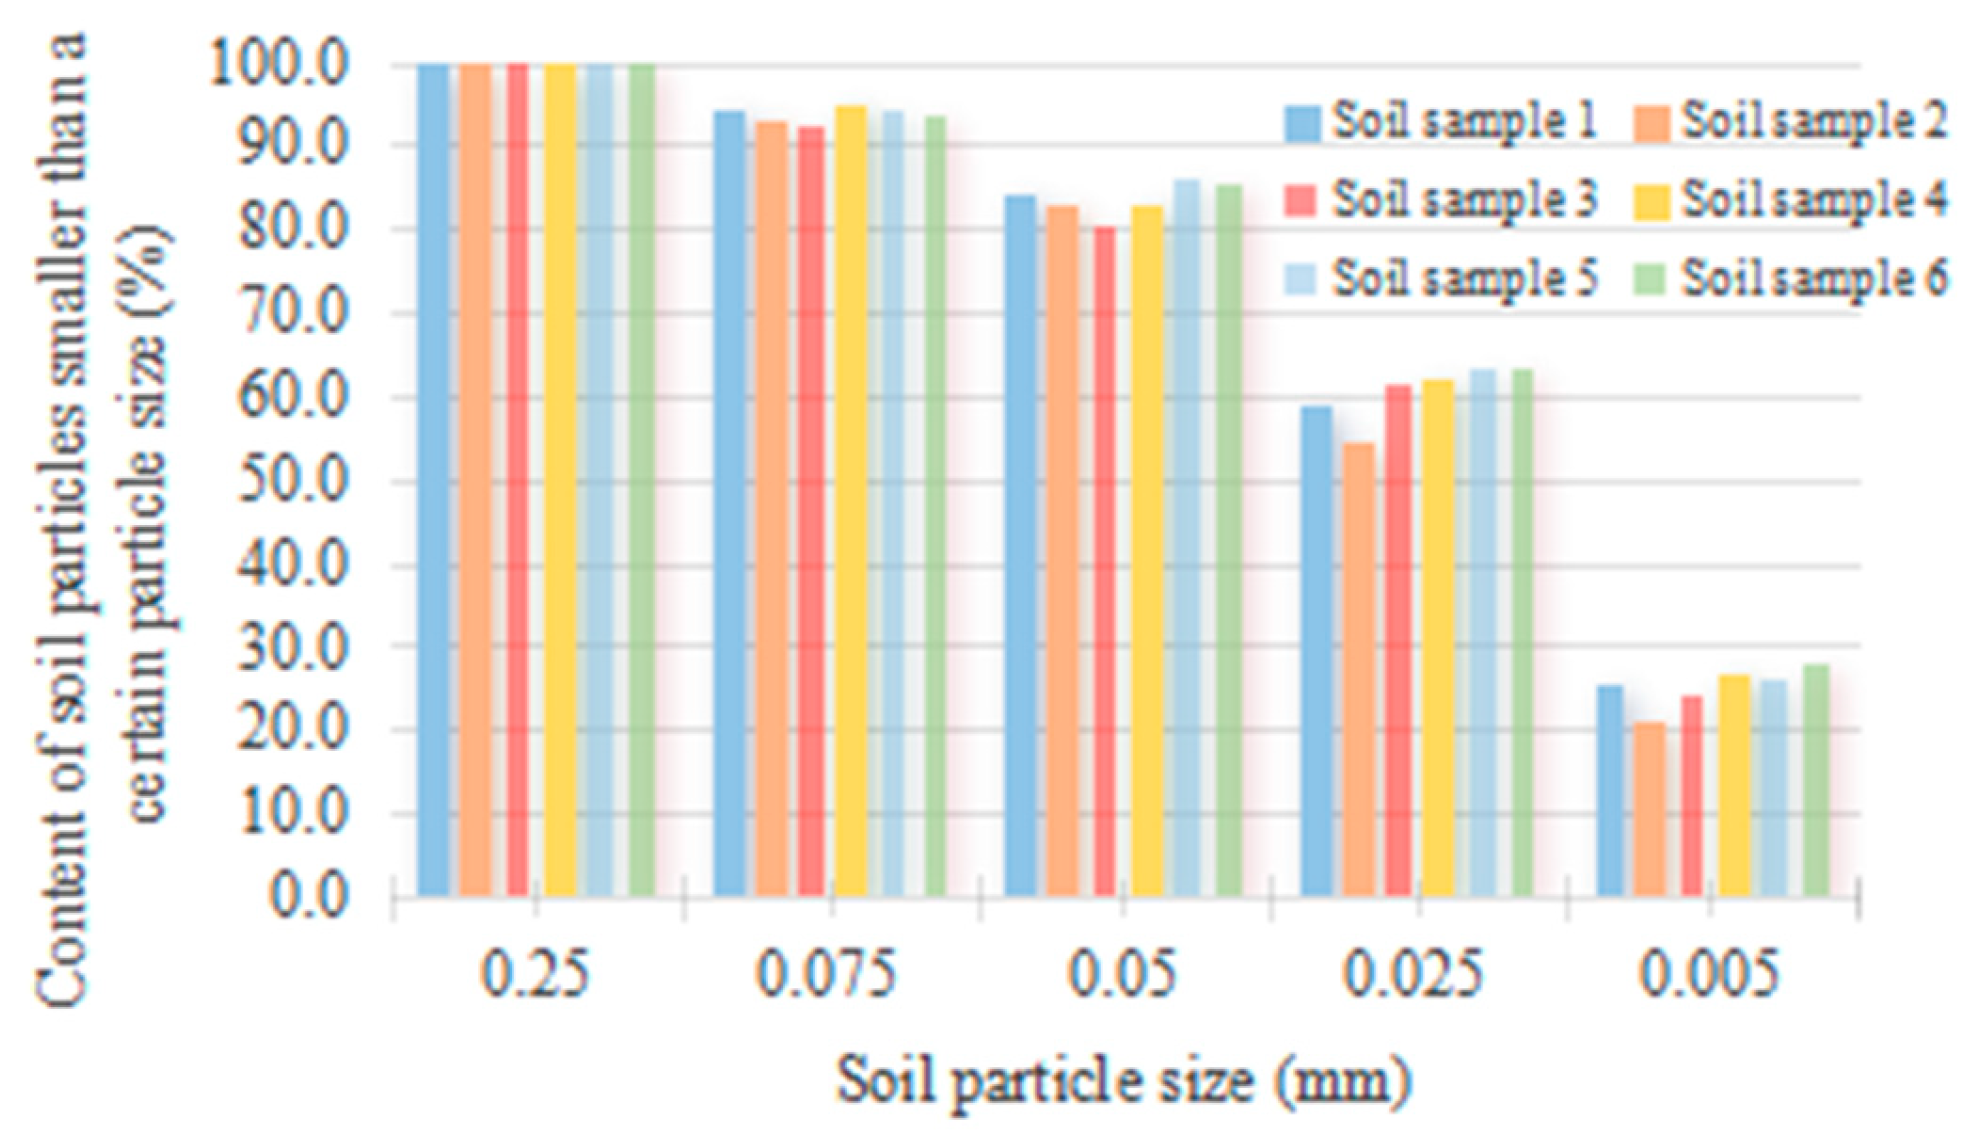
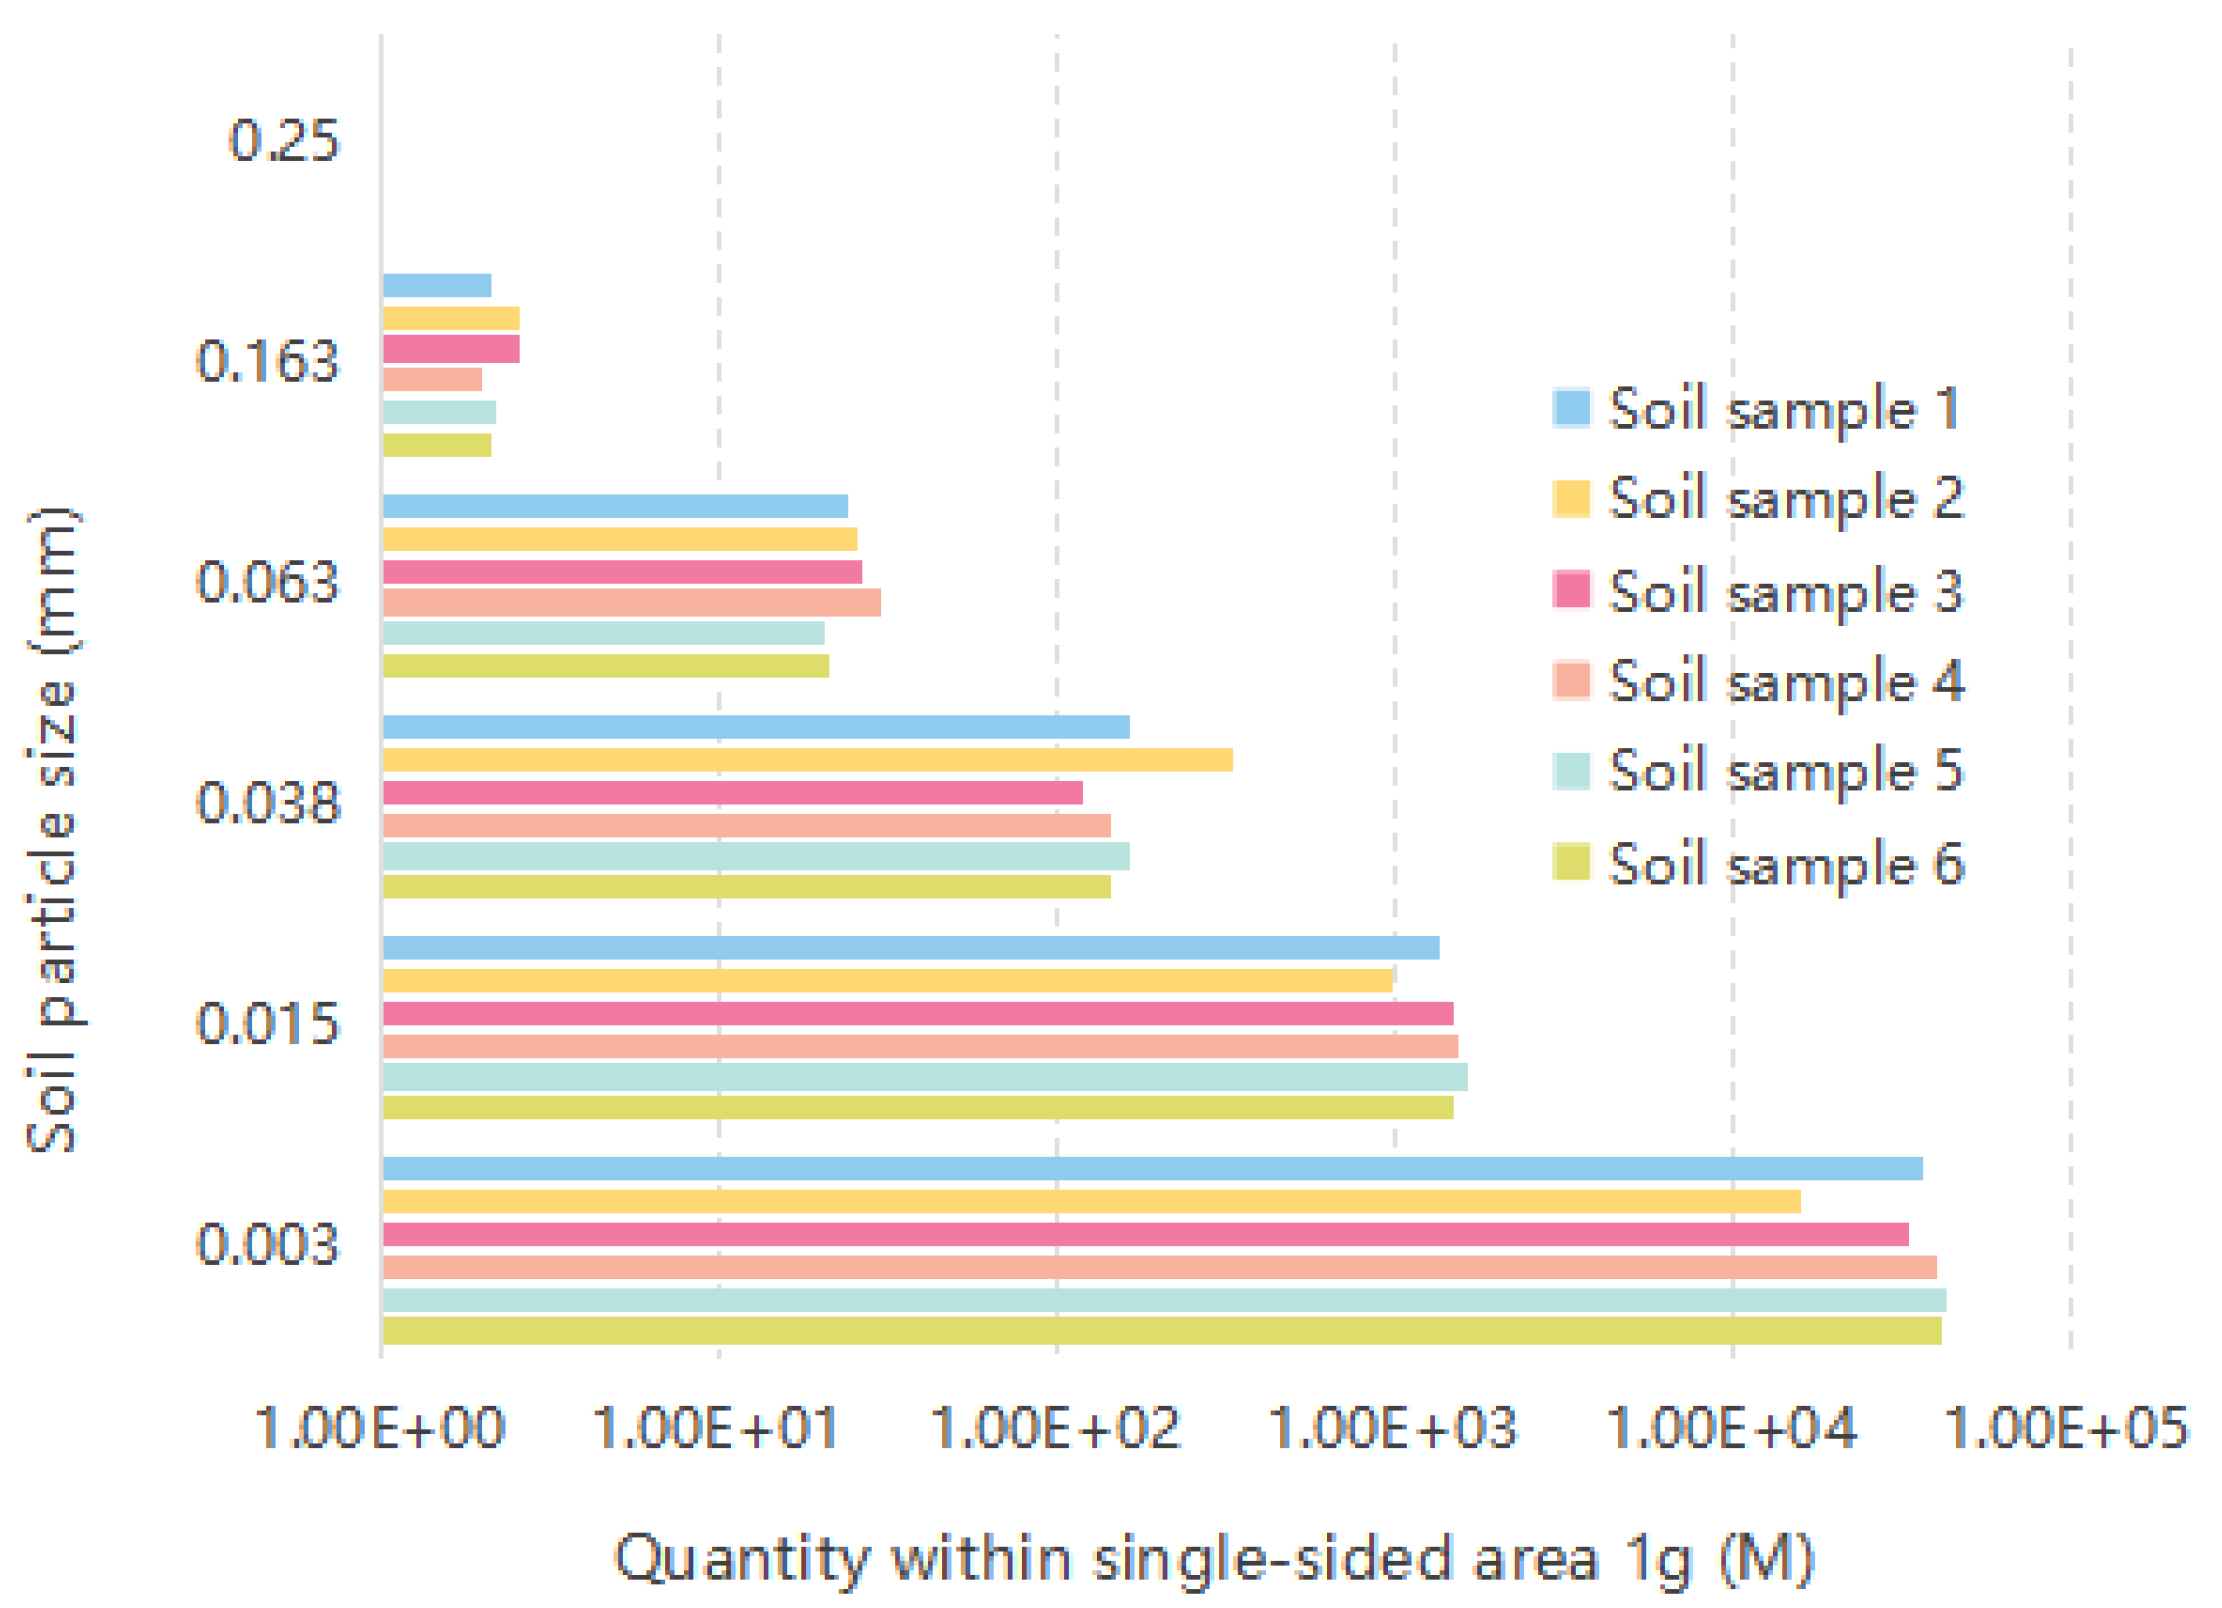
- Particle size analysis test
3. Analysis of Experimental Results
3.1. Analysis of the Dynamic Process of Buoyancy Under Instantaneous Water Supply Conditions
3.2. Calculation of the Reduction Factor Under Hydrostatic Conditions
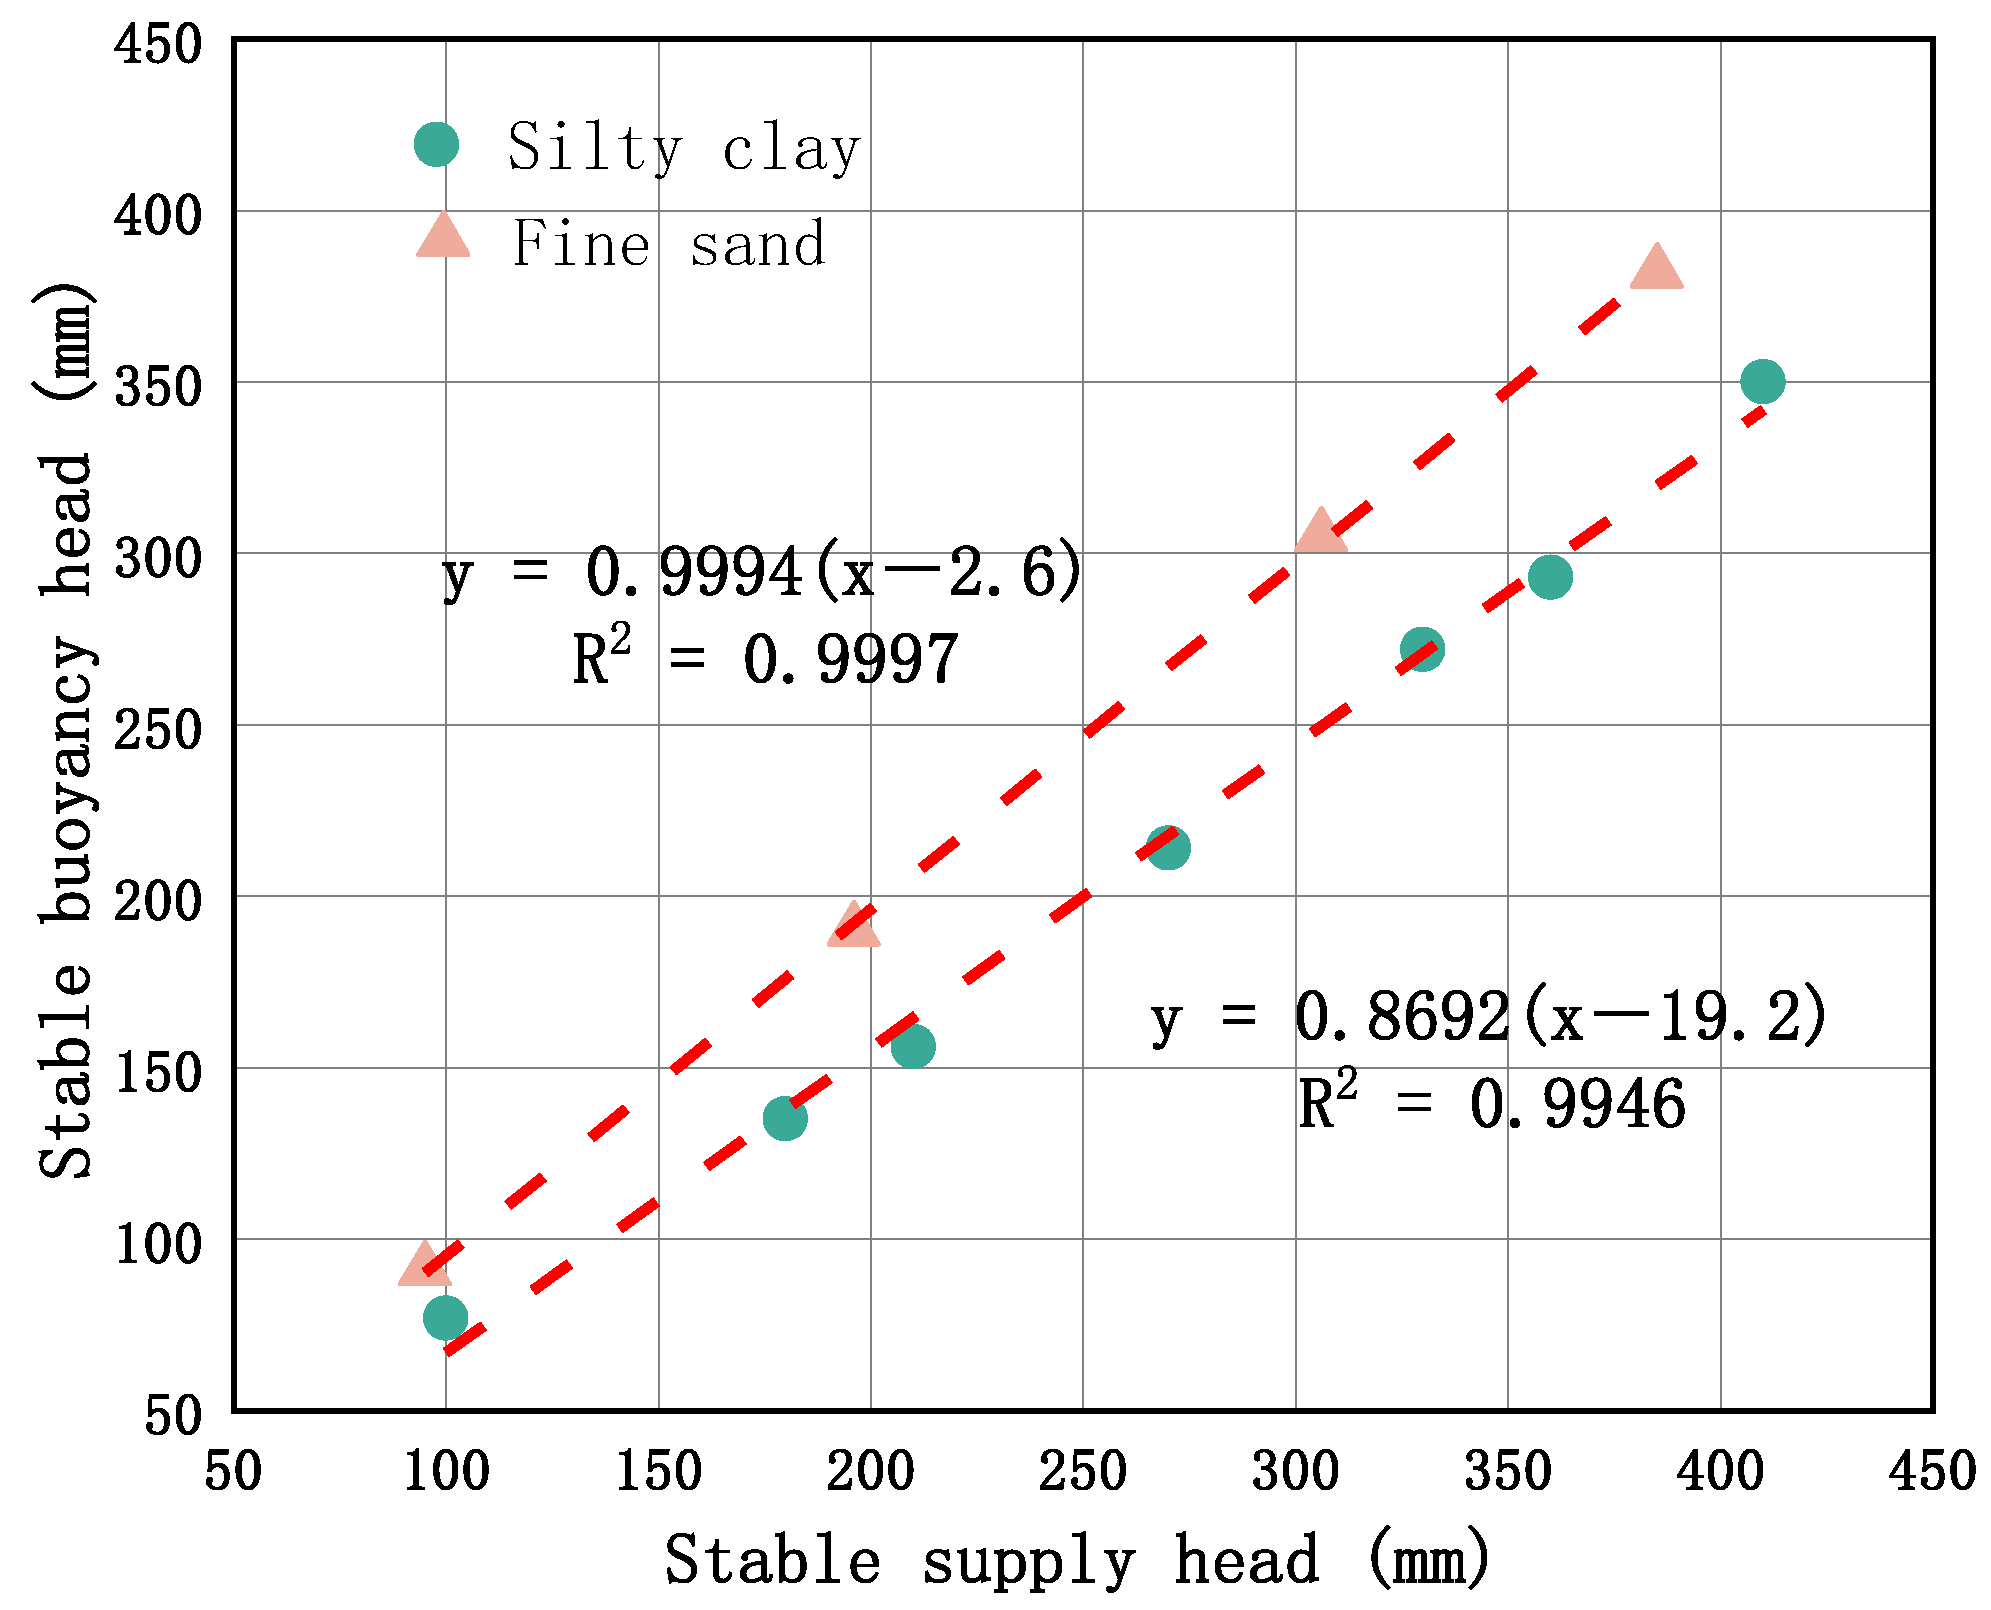
3.3. Analysis of the Linear Relationship Between the Stable Supply Head and the Buoyancy Head
4. Theoretical Derivation of the Reduction Slope
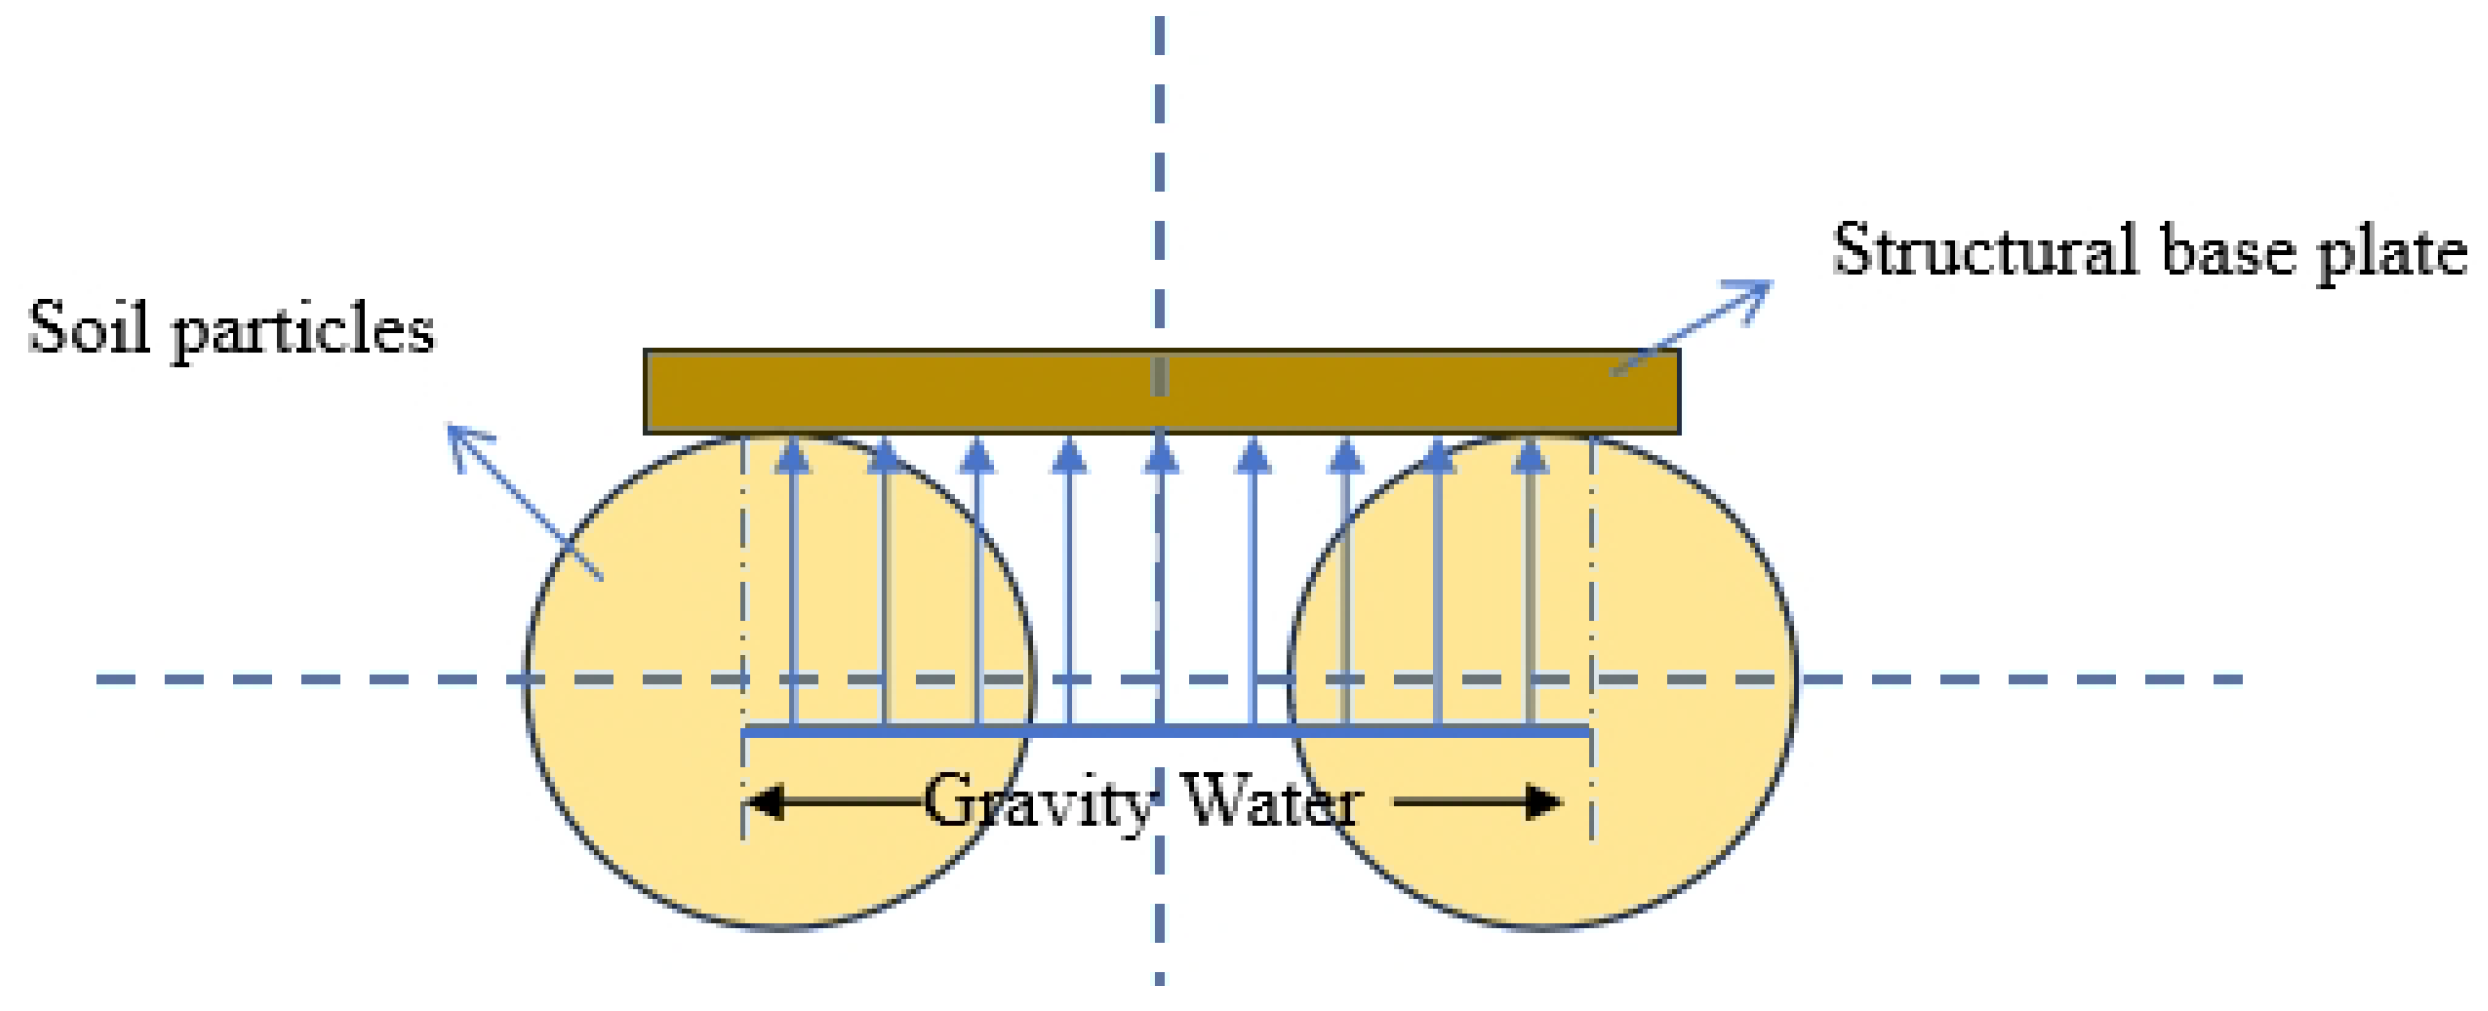
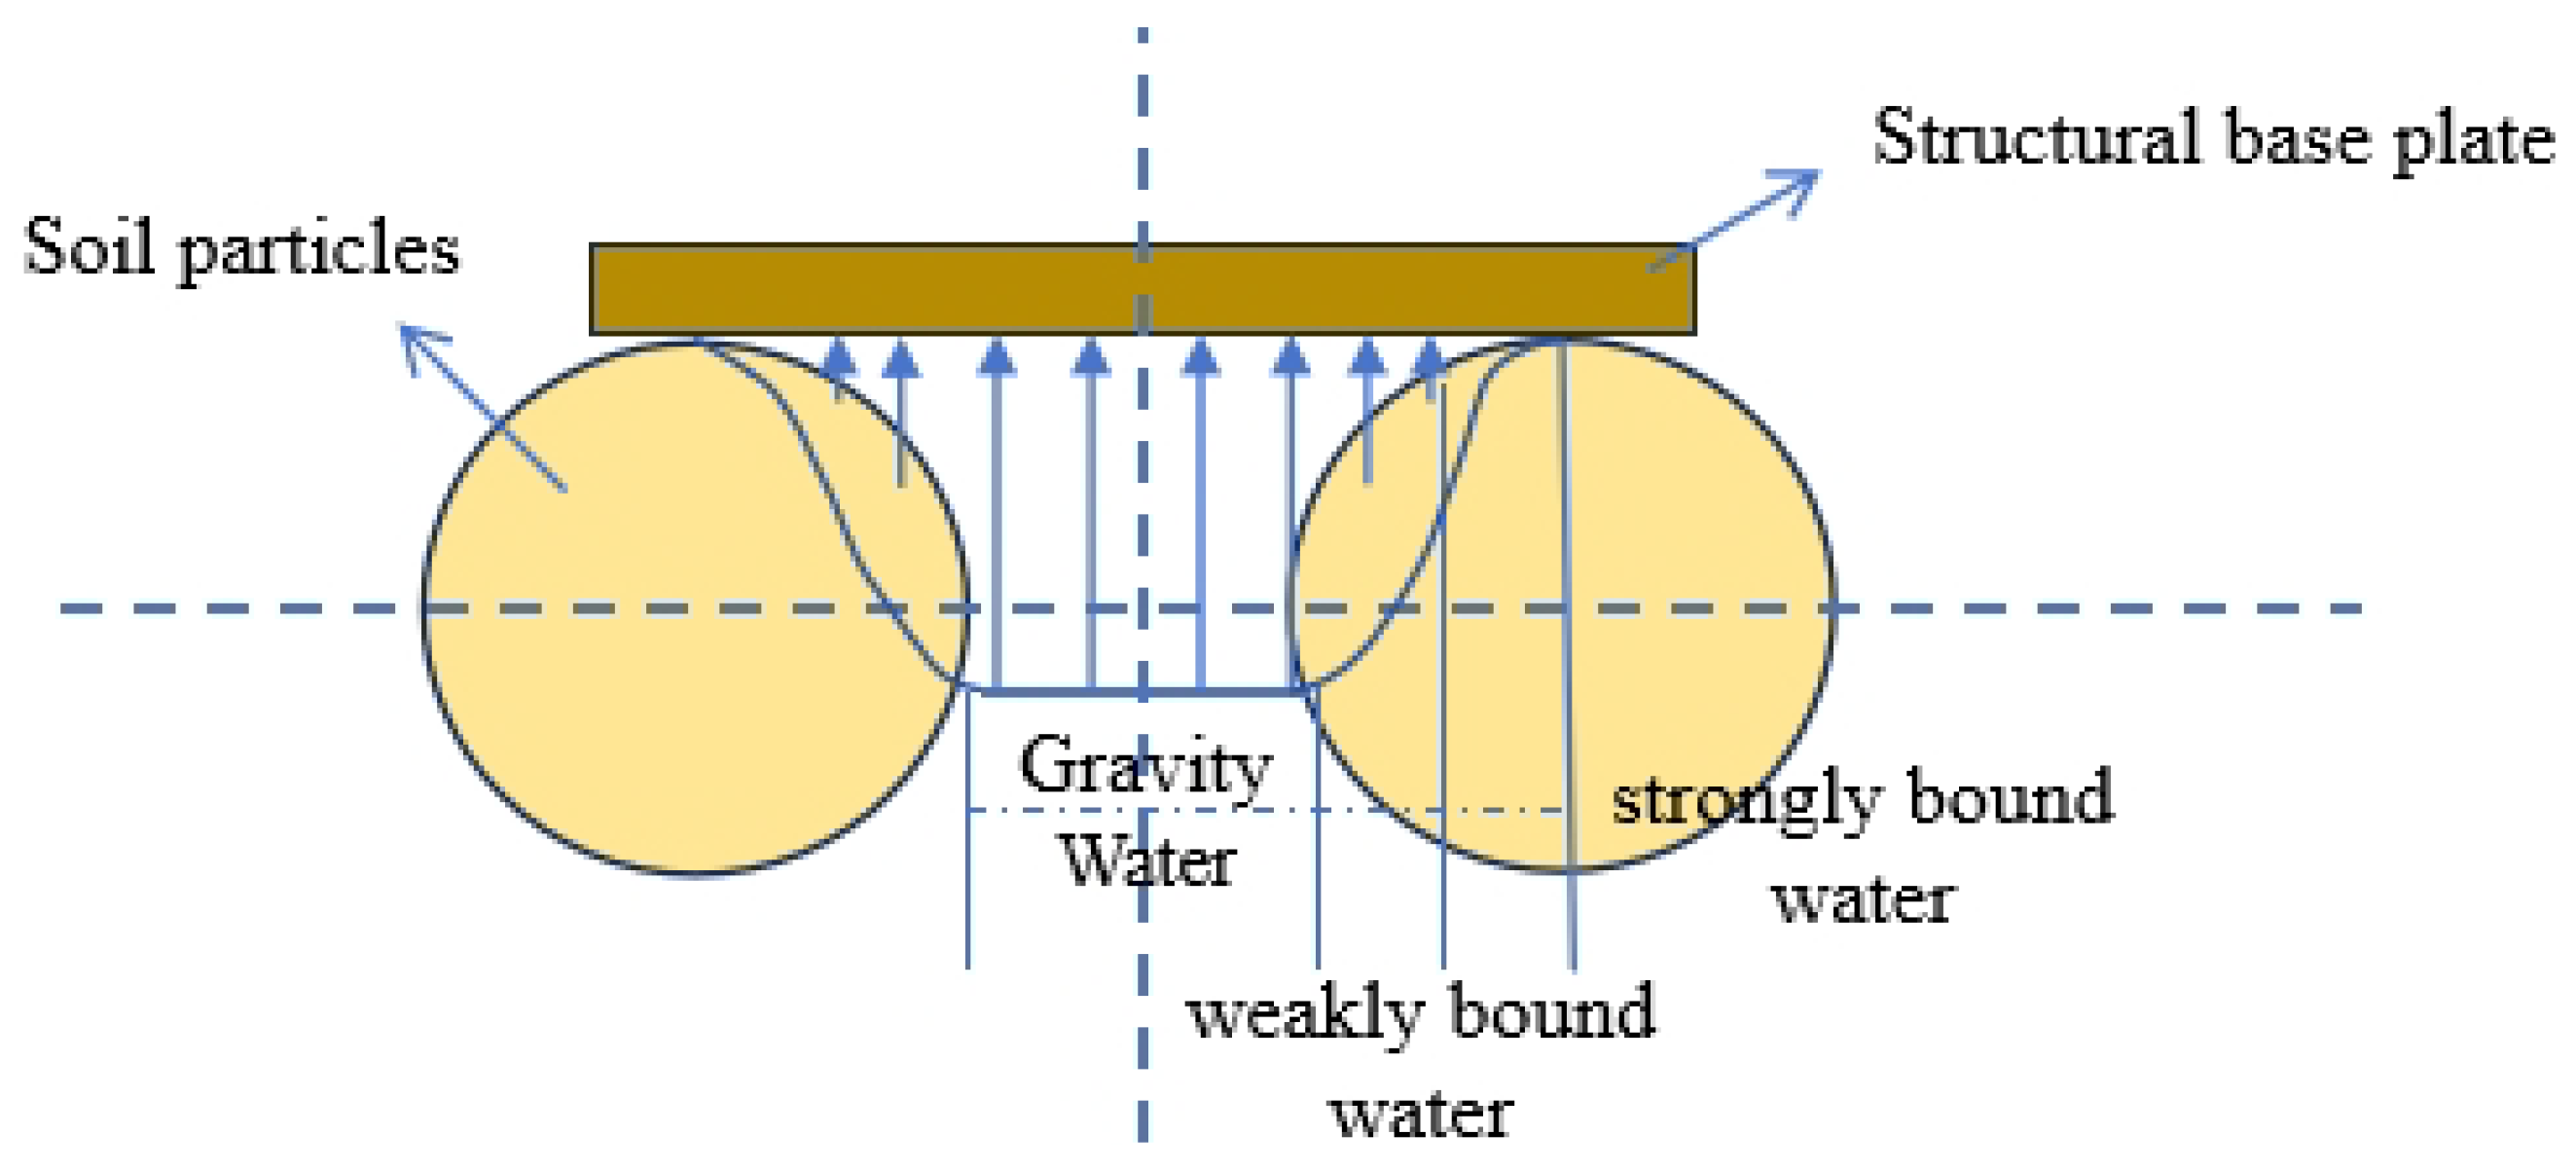
4.1. Theoretical Explanation
4.2. Theoretical Assumptions
4.3. Formula Derivation
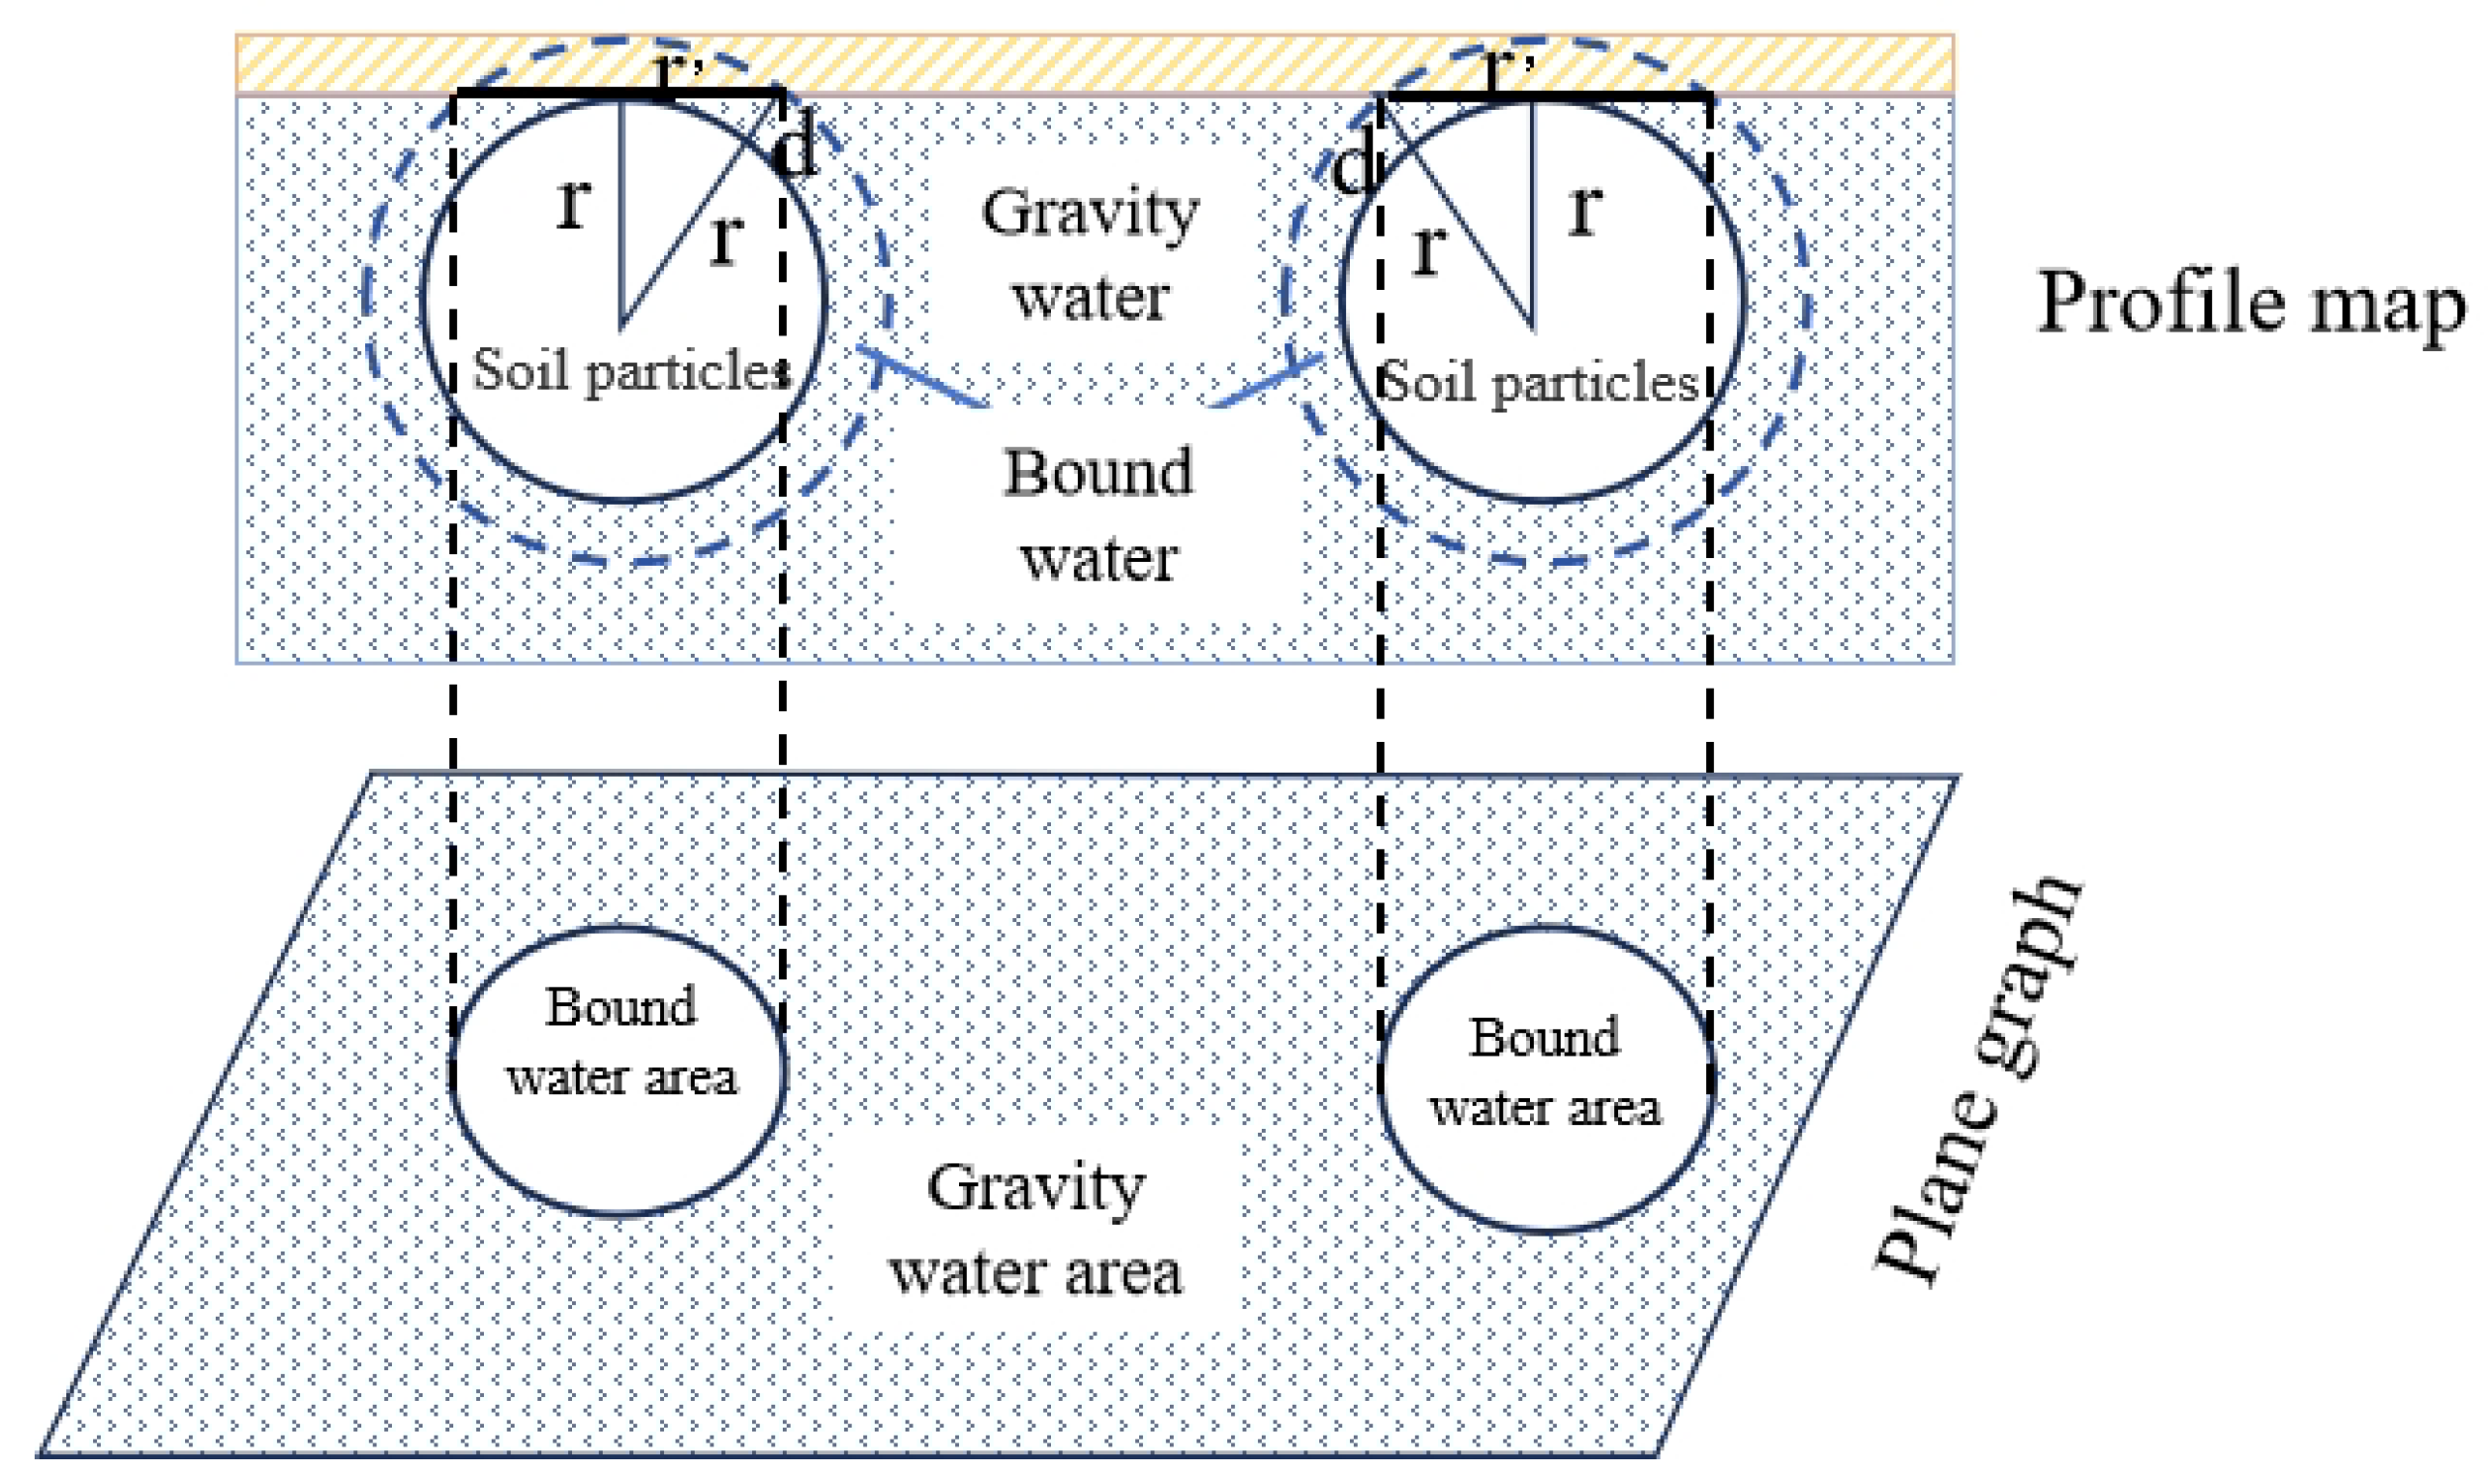
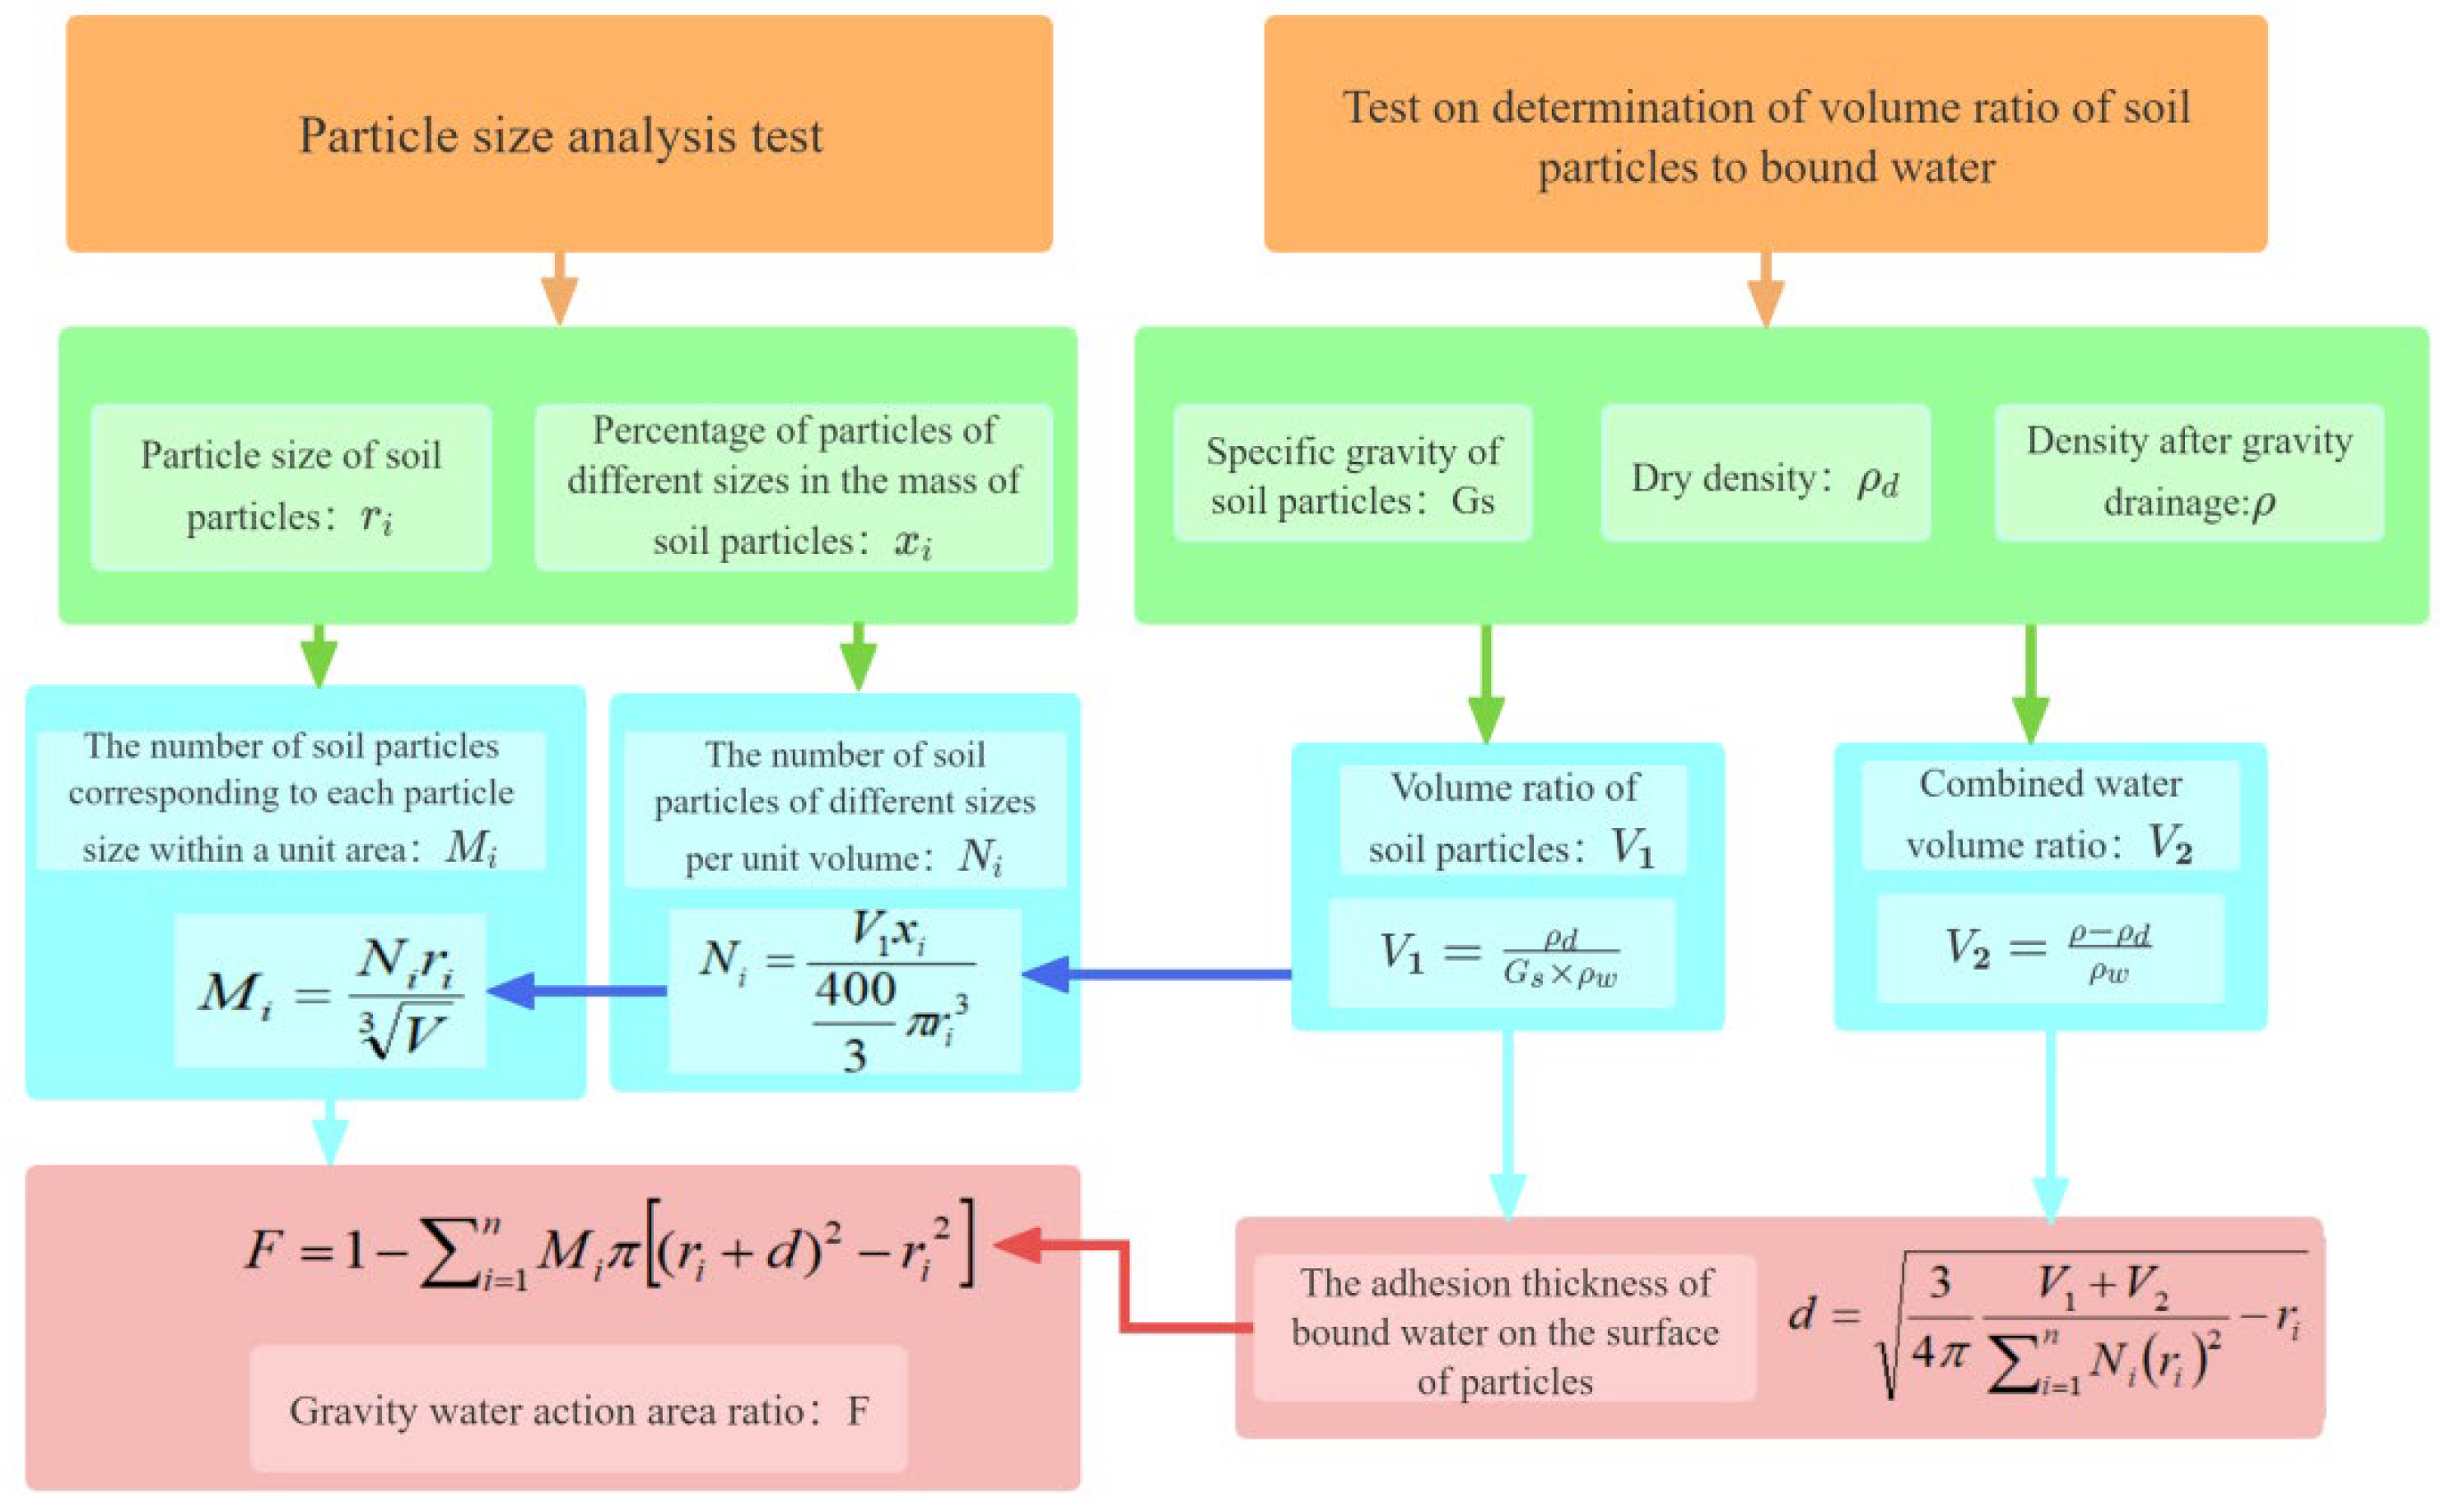
- (1)
- The number of particles of each size per unit area is equal to the number of particles within the thickness of a single particle per unit volume. The calculation formulas are as follows:
- (2)
- Assuming that bound water covers the particle surface uniformly with a constant thickness, the sum of the volumes of all spheres formed by bound water and soil particles is equal to the sum of the volumes of the soil particles and bound water measured in the experiment. Based on this relationship, the adhesion thickness can be calculated as follows:
- (3)
- The contact area ratio of gravity water is calculated as follows:
5. Test Validation of the Reduction Slope
5.1. Verification Process
5.2. Error Analysis
6. Conclusions
- ①
- Through laboratory buoyancy observation tests, the reduction slope of the buoyancy head in comparison with the supply head in the silty clay layer was 0.8629. The phenomenon of the reduction slope in groundwater buoyancy in saturated clay was discovered and confirmed.
- ②
- Using geotechnical test data, the theoretical basis for the buoyancy reduction slope was derived, demonstrating that the reduction slope is theoretically equal to the contact area ratio of gravity water. Its test value (0.7684) is less than the reduction slope (0.8629) obtained from the continuous buoyancy measurement tests, with a percentage difference of 10.9%. Although there is a difference between and the measured reduction slope of buoyancy, the discrepancy is not significant. Finally, the main reasons for the differences between the reduction slope and the gravity water contact area ratio were analyzed.
- ③
- Based on the theory that the interparticle pore water pressure distribution tends to attenuate from the pore center to the soil particle surface, this study provides a method for measuring the reduction slope, thereby offering a scientific method for addressing buoyancy challenges in underground engineering projects.
Author Contributions
Funding
Data Availability Statement
Acknowledgments
Conflicts of Interest
References
- Bikçe, M.; Örnek, M.; Cansız, Ö.F. The effect of buoyancy force on structural damage: A case study. Eng. Fail. Anal. 2018, 92, 553–565. [Google Scholar] [CrossRef]
- Jia, Y.; Fei, Y.; Wu, G.; Wang, H.; Ouyang, B.; Yuan, Z. Analysis and Processing on Up-floating Arch Accident of a Basement Structure. Constr. Technol. 2016, 45, 48–52. [Google Scholar]
- Barbot, A.; Lopes, J.B.; Soares, A.A. Relating water and energy by experimenting with urban water cycle, desalination of sea water and ARCHIMEDES’ law. In Proceedings of the 6th International Conference of Technology, Education and Development (INTED), Valencia, Spain, 5–7 March 2012. [Google Scholar]
- Kang, W.; Feng, Y.; Liu, C.; Blumenfeld, R. Archimedes’ law explains penetration of solids into granular media. Nat. Commun. 2018, 9, 1101. [Google Scholar] [CrossRef] [PubMed]
- Dos Santos, F.C.; Santos, W.M.S.; Berbat, S.D. An analysis of floating bodies and the principle of Archimedes. Rev. Bras. Ensino Fis. 2007, 29, 295–298. [Google Scholar]
- Zhang, Z. Groundwater and Building Foundation Engineering; China Architecture and Building Press: Beijing, China, 2001. [Google Scholar]
- Shen, X.; Zhou, H.; Wang, J. Groundwater and Structural Buoyancy Resistance; China Architecture and Building Press: Beijing, China, 2013. [Google Scholar]
- Li, G.X.; Wu, J.M. Calculation of uplift pressure on underground construction and effective stress principle in clay. J. Geotech. Eng. Tech. 2003, 2, 63–66. [Google Scholar]
- Zhang, D. Experimental study on anti-floating model of underground structure. Master’s Thesis, Shanghai Jiao Tong University, Shanghai, China, 2007. [Google Scholar]
- Li, C. Reasonable value of water level for building anti-floating design. Eng. Investig. 2014, 42, 49–54. [Google Scholar]
- Cui, Y.; Cui, J.; Wu, S. Buoyancy model test of underground structure. Spec. Struct. 1999, 41, 34–37. [Google Scholar]
- Zhang, D.; Chen, L. Experiment on the computing method of anti-floating in underground structures. Sichuan Build. Sci. Res. 2008, 34, 105–108. [Google Scholar]
- Xiang, K.; Zhou, S.; Zhan, C. Model Test Study of Buoyancy on Shallow Underground Structure. J. Tongji Univ. (Nat. Sci.) 2010, 38, 346–352+357. [Google Scholar]
- Huang, Z. Analysis of Ground Water’s Uplift Pressure on Underground Construction. Geotech. Eng. Technol. 2002, 5, 273–274+283. [Google Scholar]
- Song, L.; Mei, G.; Zai, J. Model test of foundation anti-floating on clay foundation. Eng. Investig. 2008, 06, 26–30. [Google Scholar]
- Song, L.; Wang, Y.; Fu, L.; Mei, G. Test and analysis on buoyancy of underground structure in soft clay. Rock Soil Mech. 2018, 39, 753–758. [Google Scholar]
- Zhou, P. Groundwater Uplift Mechanism Study Under Complex Urbn Environment; China University of Geosciences: Beijing, China, 2006. [Google Scholar]
- Zhang, Q.; Ouyang, L.; Wang, Z.; Liu, H.; Zhang, Y. Buoyancy Reduction Coefficients for Underground Silos in Sand and Clay. Indian Geotech. J. 2018, 49, 216–223. [Google Scholar] [CrossRef]
- Fang, Y. Discussion on pore water pressure and related problems in soil based on hydraulic pressure ratio. Geotech. Eng. Community 2007, 05, 21–26. [Google Scholar]
- Mei, G.; Song, L.; Zai, J.M. Experimental study on reduction of groundwater buoyancy. Chin. J. Geotech. Eng. 2009, 31, 1476–1480. [Google Scholar]
- Zhou, J.K.; Lin, C.H.; Chen, C.; Zhao, X.Y. Reduction of Groundwater Buoyancy on the Basement in Weak-Permeable/Impervious Foundations. Adv. Civ. Eng. 2019, 7826513. [Google Scholar] [CrossRef]
- Song, L.; Kang, X.; Mei, G. Buoyancy force on shallow foundations in clayey soil: An experimental investigation based on the “Half Interval Search”. Ocean. Eng. 2017, 129, 637–641. [Google Scholar] [CrossRef]
- Zhang, Z.; Cao, P.; Jia, M. Centrifugal model test of pore water pressure in soft clay. In Proceedings of the GeoShanghai 2018 International Conference: Fundamentals of Soil Behaviours, Shanghai, China, 28–30 May 2018. [Google Scholar]
- Lu, Q.; Ren, Z.; Yang, J.; Mei, G. Experimental study of porepressure transfer law and reduction of groundwater buoyancy in clay. Ind. Build. 2019, 49, 126–131. [Google Scholar]
- Yang, S.; Feng, X.; Zhang, C. Soft Soil Theory and Engineering; Geological Publishing House: Beijing, China, 2000. [Google Scholar]
- Wang, D.; Zhang, R.; Shi, Y.; Xu, S.; Yu, Q.; Liang, X. Fundamentals of Hydrogeology; Geological Publishing House: Beijing, China, 1995. [Google Scholar]
| Stage | (mm) | (mm) | Reduction Factor |
|---|---|---|---|
| 1 | 95 | 91 | 0.96 |
| 2 | 196 | 190 | 0.97 |
| 3 | 306 | 305 | 1.00 |
| 4 | 385 | 382 | 0.99 |
| Stage | (mm) | (mm) | Reduction Factor |
|---|---|---|---|
| 1 | 100 | 77 | 0.77 |
| 2 | 180 | 135 | 0.75 |
| 3 | 210 | 156 | 0.74 |
| 4 | 270 | 214 | 0.79 |
| 5 | 330 | 272 | 0.82 |
| 6 | 360 | 293 | 0.81 |
| 7 | 410 | 350 | 0.85 |
| Sample No. | Pore Volume Distribution (%) | |||
|---|---|---|---|---|
| >10 μm | 10–1.0 μm | 1.0–0.1 μm | <0.1 μm | |
| 1 | 7.11 | 8.75 | 70.16 | 13.98 |
| 2 | 0.15 | 11.31 | 74.90 | 13.64 |
| 3 | 15.47 | 13.54 | 39.43 | 31.56 |
| 4 | 14.30 | 10.23 | 41.11 | 34.37 |
| Sample No. | ρ (g/cm3) | ρd (g/cm3) | GS | V1 | V2 |
|---|---|---|---|---|---|
| 1 | 1.63 | 1.32 | 2.74 | 0.48 | 0.31 |
| 2 | 1.65 | 1.37 | 2.74 | 0.50 | 0.28 |
| 3 | 1.52 | 1.25 | 2.74 | 0.46 | 0.27 |
| 4 | 1.68 | 1.40 | 2.74 | 0.51 | 0.28 |
| 5 | 1.69 | 1.44 | 2.74 | 0.53 | 0.25 |
| 6 | 1.66 | 1.34 | 2.74 | 0.49 | 0.32 |
| Average | 1.64 | 1.35 | 2.74 | 0.49 | 0.29 |
| Dispersion coefficient | 0.04 | 0.05 | 0.00 | 0.02 | 0.02 |
| Sample No. | Particle Size Composition | (mm) | (mm−2) | (mm) | |
|---|---|---|---|---|---|
| 1 | 0.25~0.075 | 0.163 | 2.08 | 5.72 × 10⁻⁴ | 0.7448 |
| 0.075~0.05 | 0.063 | 2.39 × 101 | |||
| 0.05~0.025 | 0.038 | 1.65 × 10² | |||
| 0.025~0.005 | 0.015 | 1.37 × 10³ | |||
| <0.005 | 0.003 | 3.67 × 10⁴ | |||
| 2 | 0.25~0.075 | 0.163 | 2.53 | 5.90 × 10⁻⁴ | 0.7612 |
| 0.075~0.05 | 0.063 | 2.57 × 101 | |||
| 0.05~0.025 | 0.038 | 1.92 × 10² | |||
| 0.025~0.005 | 0.015 | 1.43 × 10³ | |||
| <0.005 | 0.003 | 3.15 × 10⁴ | |||
| 3 | 0.25~0.075 | 0.163 | 2.56 | 5.40 × 10⁻⁴ | 0.7754 |
| 0.075~0.05 | 0.063 | 2.63 × 101 | |||
| 0.05~0.025 | 0.038 | 1.18 × 10² | |||
| 0.025~0.005 | 0.015 | 1.47 × 10³ | |||
| <0.005 | 0.003 | 3.39 × 10⁴ | |||
| 4 | 0.25~0.075 | 0.163 | 1.96 | 4.90 × 10⁻⁴ | 0.7623 |
| 0.075~0.05 | 0.063 | 3.04 × 101 | |||
| 0.05~0.025 | 0.038 | 1.43 × 10² | |||
| 0.025~0.005 | 0.015 | 1.53 × 10³ | |||
| <0.005 | 0.003 | 4.12 × 10⁴ | |||
| 5 | 0.25~0.075 | 0.163 | 2.19 | 4.24 × 10⁻⁴ | 0.7888 |
| 0.075~0.05 | 0.063 | 2.07 × 101 | |||
| 0.05~0.025 | 0.038 | 1.66 × 10² | |||
| 0.025~0.005 | 0.015 | 1.66 × 10³ | |||
| <0.005 | 0.003 | 4.28 × 10⁴ | |||
| 6 | 0.25~0.075 | 0.163 | 2.13 | 4.60 × 10⁻⁴ | 0.7779 |
| 0.075~0.05 | 0.063 | 2.09 × 101 | |||
| 0.05~0.025 | 0.038 | 1.46 × 10² | |||
| 0.025~0.005 | 0.015 | 1.48 × 10³ | |||
| <0.005 | 0.003 | 4.18 × 10⁴ | |||
| Average value | - | - | - | 5.53 × 10⁻⁴ | 0.7684 |
| Dispersion coefficient | - | - | - | 0.00 | 0.01 |
Disclaimer/Publisher’s Note: The statements, opinions and data contained in all publications are solely those of the individual author(s) and contributor(s) and not of MDPI and/or the editor(s). MDPI and/or the editor(s) disclaim responsibility for any injury to people or property resulting from any ideas, methods, instructions or products referred to in the content. |
© 2025 by the authors. Licensee MDPI, Basel, Switzerland. This article is an open access article distributed under the terms and conditions of the Creative Commons Attribution (CC BY) license (https://creativecommons.org/licenses/by/4.0/).
Share and Cite
Gao, T.; Xu, Y.; Zhou, X.; Wang, Y.; Liu, H. Experimental and Theoretical Evaluation of Buoyancy Reduction in Saturated Clay Soils. Water 2025, 17, 1832. https://doi.org/10.3390/w17121832
Gao T, Xu Y, Zhou X, Wang Y, Liu H. Experimental and Theoretical Evaluation of Buoyancy Reduction in Saturated Clay Soils. Water. 2025; 17(12):1832. https://doi.org/10.3390/w17121832
Chicago/Turabian StyleGao, Tao, Yongliang Xu, Xiaomin Zhou, Yubo Wang, and Hongyan Liu. 2025. "Experimental and Theoretical Evaluation of Buoyancy Reduction in Saturated Clay Soils" Water 17, no. 12: 1832. https://doi.org/10.3390/w17121832
APA StyleGao, T., Xu, Y., Zhou, X., Wang, Y., & Liu, H. (2025). Experimental and Theoretical Evaluation of Buoyancy Reduction in Saturated Clay Soils. Water, 17(12), 1832. https://doi.org/10.3390/w17121832