Article

Analysis of Precipitation Variation Characteristics in Typical Chinese Regions Within the Indian Ocean and Pacific Monsoon Convergence Zone

1
Huaihua Flood and Drought Disaster Prevention Affairs Center, Huaihua 418000, China
2
Huaihua Water Resources Affairs Center, Huaihua 418000, China
3
Huaihua River and Lake Affairs Center, Huaihua 418300, China
4
Huitong County Water Resources Bureau, Huaihua 418300, China
5
Faculty of Electric Power Engineering, Kunming University of Science and Technology, Kunming 650500, China
*
Author to whom correspondence should be addressed.
Water 2025, 17(12), 1812; https://doi.org/10.3390/w17121812
Submission received: 6 May 2025 / Revised: 12 June 2025 / Accepted: 13 June 2025 / Published: 17 June 2025
(This article belongs to the Special Issue Remote Sensing of Spatial-Temporal Variation in Surface Water)

Abstract

:
With climate warming, the global precipitation patterns have undergone significant changes, which will profoundly impact flood–drought disaster regimes and socioeconomic development in key regions of human activity worldwide. The convergence zone of the Indian Ocean monsoon and Pacific monsoon in China covers most of the middle and lower reaches of the Yangtze River (MLRYR), which is located in the transitional area of the second and third steps of China’s terrain. Changes in precipitation patterns in this region will significantly impact flood and drought control in the MLRYR, as well as the socioeconomic development of the MLRYR Economic Belt. In this study, Huaihua area in China was selected as the study area to study the characteristics of regional precipitation change, and to analyze the evolution in the trends in annual precipitation, extreme precipitation events, and their spatiotemporal distribution, so as to provide a reference for the study of precipitation change patterns in the intersection zone. This study utilizes precipitation data from meteorological stations and the China Meteorological Forcing Dataset (CMFD) reanalysis data for the period 1979–2023 in Huaihua region. The spatiotemporal variation in precipitation in the study area was analyzed by using linear regression, the Mann–Kendall trend test, the moving average method, the Mann–Kendall–Sneyers test, wavelet analysis, and R/S analysis. The results demonstrate the following: (1) The annual precipitation in the study area is on the rise as a whole, the climate tendency rate is 9 mm/10 a, and the precipitation fluctuates greatly, showing an alternating change of “dry–wet–dry–wet”. (2) Wavelet analysis reveals that there are 28-year, 9-year, and 4-year main cycles in annual precipitation, and the precipitation patterns at different timescales are different. (3) The results of R/S analysis show that the future precipitation trend will continue to increase, with a strong long-term memory. (4) Extreme precipitation events generally show an upward trend, indicating that their intensity and frequency have increased. (5) Spatial distribution analysis shows that the precipitation in the study area is mainly concentrated in the northeast and south of Jingzhou and Tongdao, and the precipitation level in the west is lower. The comprehensive analysis shows that the annual precipitation in the study area is on the rise and has a certain periodic precipitation law. The spatial distribution is greatly affected by other factors and the distribution is uneven. Extreme precipitation events show an increasing trend, which may lead to increased flood risk in the region and downstream areas. In the future, it is necessary to strengthen countermeasures to reduce the impact of changes in precipitation patterns on local and downstream economic and social activities.

1. Introduction

Precipitation constitutes the fundamental recharge mechanism for terrestrial water systems, functioning as a critical component of global hydrological and energy cycles. It mediates bi-directional mass–energy exchange between terrestrial systems and the atmosphere. Precipitation’s spatiotemporal variability governs global water resource disparities and acts as the primary driver of drought–flood cycles and associated hydrological extremes [1,2,3]. Climate systems are intricately linked to anthropogenic activities, with escalating global warming driving heightened spatiotemporal variability in precipitation patterns, manifesting through intensified drought severity, elevated extreme precipitation (EP) frequency, and alternating flood–drought cycles, thereby profoundly affecting water resource availability, ecosystem resilience, and socioeconomic sustainability [4,5,6].
In recent decades, hydroclimatic patterns have exhibited marked transformations across global regions, with these alterations projected to endure under ongoing climatic shifts [7]. Between 2011 and 2020, the average temperature of the Earth’s surface was 1.09 °C warmer than that during the late 19th century (pre-industrial period). Global warming is occurring at a significant rate, faster than at any time in the past two thousand years, resulting in more frequent and severe extreme weather events such as heavy precipitation and drought [8]. Global climate warming has led to increased atmospheric temperatures, which in turn increase the content of water vapor in the atmosphere, resulting in a significant intensification of EP within global monsoon systems [9,10]. Along with global warming, the precipitation in the arid areas of the world exhibits an increasing trend, while the precipitation in humid areas exhibits a decreasing trend [11,12]. Moreover, a statistically significant positive correlation exists between precipitation variability and temperature changes. Precipitation in the United States, Canada, and the United Kingdom has shown an increasing trend [13,14,15]. In contrast, precipitation in Spain and the Philippines has shown a declining trend [16,17]. Additionally, the precipitation pattern in China has changed significantly [18]. Studies by Wang and Zhai [19], Li et al. [20], and Ren et al. [21] on modern precipitation trends in China reveal that annual precipitation has decreased in central, northern, south-central northeastern, and southwestern regions, while increases have been more pronounced in the lower Yangtze River basin, southeastern coastal areas, the Tibetan Plateau, and northwestern regions. Cai et al. [22] and Zhang et al. [23] conducted studies on the spatiotemporal evolution of precipitation in the source region of the Yangtze River and the Yellow River Basin, respectively. Studies have shown that under a warming climate in China, precipitation and EP are significantly increasing; that is, for each 1 °C increase in surface temperature, the rates of increase in precipitation and EP are 9.7% and 22.6%, respectively [24,25]. Given the inherent uncertainties in precipitation regime dynamics and their regional differences, investigating spatiotemporal characteristics of precipitation variability and EP regimes across different regions has emerged as a fundamental research frontier in global climate change science.
Climate change has become a major challenge to the sustainable development of districts. It can not only directly threaten the living environment of human beings, but also have a significant and far-reaching impact on the pattern of flood–drought disasters and socioeconomic development in a region [26,27]. It is noteworthy that global warming has significantly altered flood–drought patterns, increased socioeconomic vulnerability, and imposed greater costs for achieving sustainable development. These impacts have already exerted substantial effects on China and will continue to do so, posing severe threats to both natural ecosystems and socioeconomic development [28]. Climate change impacts have intensified extreme event frequency, with eastern China emerging as a high-exposure zone for population centers and economic hubs, the southwestern region, Loess Plateau, agro-pastoral transition zones, and Songnen Plain constituting high-vulnerability areas for natural ecosystem integrity, and the middle and lower reaches of the Yangtze River (MLRYR) and northwestern oases representing critical risk zones for agricultural production security [29]. Along with climate change, the future trends in central China are projected to feature temperature increases, precipitation intensification, and amplified climate uncertainties, with drought–flood extremes projected to intensify in both frequency and magnitude, particularly in central-eastern Guanzhong, where drought frequency exceeds regional norms and water resource stress is particularly acute, posing substantial challenges to regional socioeconomic sustainability [30]. Consequently, research on the impacts of climate change on regional socioeconomic development, particularly the driving mechanisms and socioeconomic effects of extreme climate events such as floods and droughts, holds significant theoretical and practical importance for scientifically formulating regional sustainable development plans and enhancing disaster risk response capabilities.
The Yangtze River Economic Belt, spanning China’s eastern, central, and western regions, represents a national strategic priority under the “Three Major Strategies” framework, functioning as a globally significant inland economic corridor, regional coordination hub, and integrated development zone connecting coastal, riparian, and borderland systems, with the middle and lower Yangtze basin constituting both the economic belt’s core and a strategic nexus between Yangtze River development and the Belt and Road Initiative, where regional economic resilience serves as a critical driver of national economic growth and development sustainability. Meanwhile, the MLRYR basin is one of China’s most prone to floods and the most vulnerable areas, with a flood vulnerability coefficient between 0.508 and 0.727 (where 0 indicates no loss and 1 indicates total loss) [31,32]. In the past 50 years, the intensity and frequency of EP events in China have increased, and have significant interannual and interdecadal variation characteristics. There are obvious regional and seasonal differences in the trend of change, while the Yangtze River and the southern part of the region have a higher frequency of occurrence and a stronger intensity [33,34]. Therefore, global warming has changed the difference in land and sea thermal properties, which in turn affects large-scale circulation patterns such as the Antarctic Oscillation, the Arctic Oscillation, and the Indian summer monsoon. The delay of the East Asian summer monsoon circulation and the deviation in the water vapor transport path have a comprehensive and significant impact on the MLRYR.
The area where the Indian Ocean and the Pacific monsoon converge in the Northern Hemisphere in summer is between 0° N–32.5° N and 97.5° E–142.5° E. The convergence area has obvious intraseasonal variation characteristics, which are affected by the combination of the two monsoons. The spatiotemporal distribution of precipitation in this area is extremely uneven; coupled with the role of the West Pacific subtropical high pressure and other atmospheric circulation, the EP distribution pattern is very complex [35]. On the spatial scale, there are significant differences in climate and environment in different regions of the intersection area due to geographical location and terrain differences, resulting in complex precipitation variation characteristics [36]. In view of this, there is an urgent need to use high-resolution gridded precipitation data combined with measured precipitation data to systematically analyze the spatiotemporal patterns of precipitation in the intersection area, in order to provide a reference for future medium- and long-term water resource scheduling, flood control measures, and economic and social development planning in the region.
Prior analyses of precipitation patterns depended heavily on traditional gauge-based measurements, such as daily rainfall records [37,38]. Given the sparse spatial distribution of meteorological stations across Huaihua area and temporal discontinuities in observational records, traditional station-based observations face limitations in comprehensively resolving precipitation’s spatiotemporal characteristics, especially within complex terrain environments [39]. However, the more comprehensive and continuous high-resolution reanalysis of meteorological precipitation data from the China Regional Surface Meteorological Factor Dataset (CMFD) launched by the Institute of Tibetan Plateau Research, Chinese Academy of Sciences, makes up for these deficiencies [40,41]. Ren et al. [42] and Yu Li et al. [43] conducted detailed evaluations of the performance of CMFD reanalysis data in capturing EP events and assessing overall precipitation accuracy, through comprehensive comparisons with other satellite-based precipitation datasets in the Beijing region. Their research results demonstrate that the CMFD shows better performance compared to other data products when daily precipitation exceeds 50 mm. Moreover, the CMFD is characterized by lower RMSE and higher CC values at both daily and annual temporal scales, which demonstrates its superior capabilities in precipitation estimation. Furthermore, studies have demonstrated that the CMFD exhibits strong capability in capturing EP over the Qinghai–Tibet Plateau [44], with higher accuracy in precipitation estimation compared to other datasets such as CHIRPS, ERA5-Land, and PERSIANN-CCS-CDR [45,46].
Therefore, to comprehensively understand the precipitation variation characteristics in the China region of the Indian Ocean monsoon and Pacific Ocean monsoon convergence zone under global warming, we selected Huaihua, China, which is sensitive to climate change in the convergence zone, as the study area. Based on the daily precipitation data of 11 stations and reanalysis meteorological data, the CMFD from 1979 to 2023 and nine extreme precipitation indices (EPIs) were used to analyze the spatiotemporal pattern of precipitation in Huaihua. This study provides scientific support for ecological conservation, the prevention and control of environmental disasters of meteorological origin, and the formulation of economic and social development plans in the ecotone, and also provides a reference for the study of the response of EP events to global warming.

2. Study Area and Data
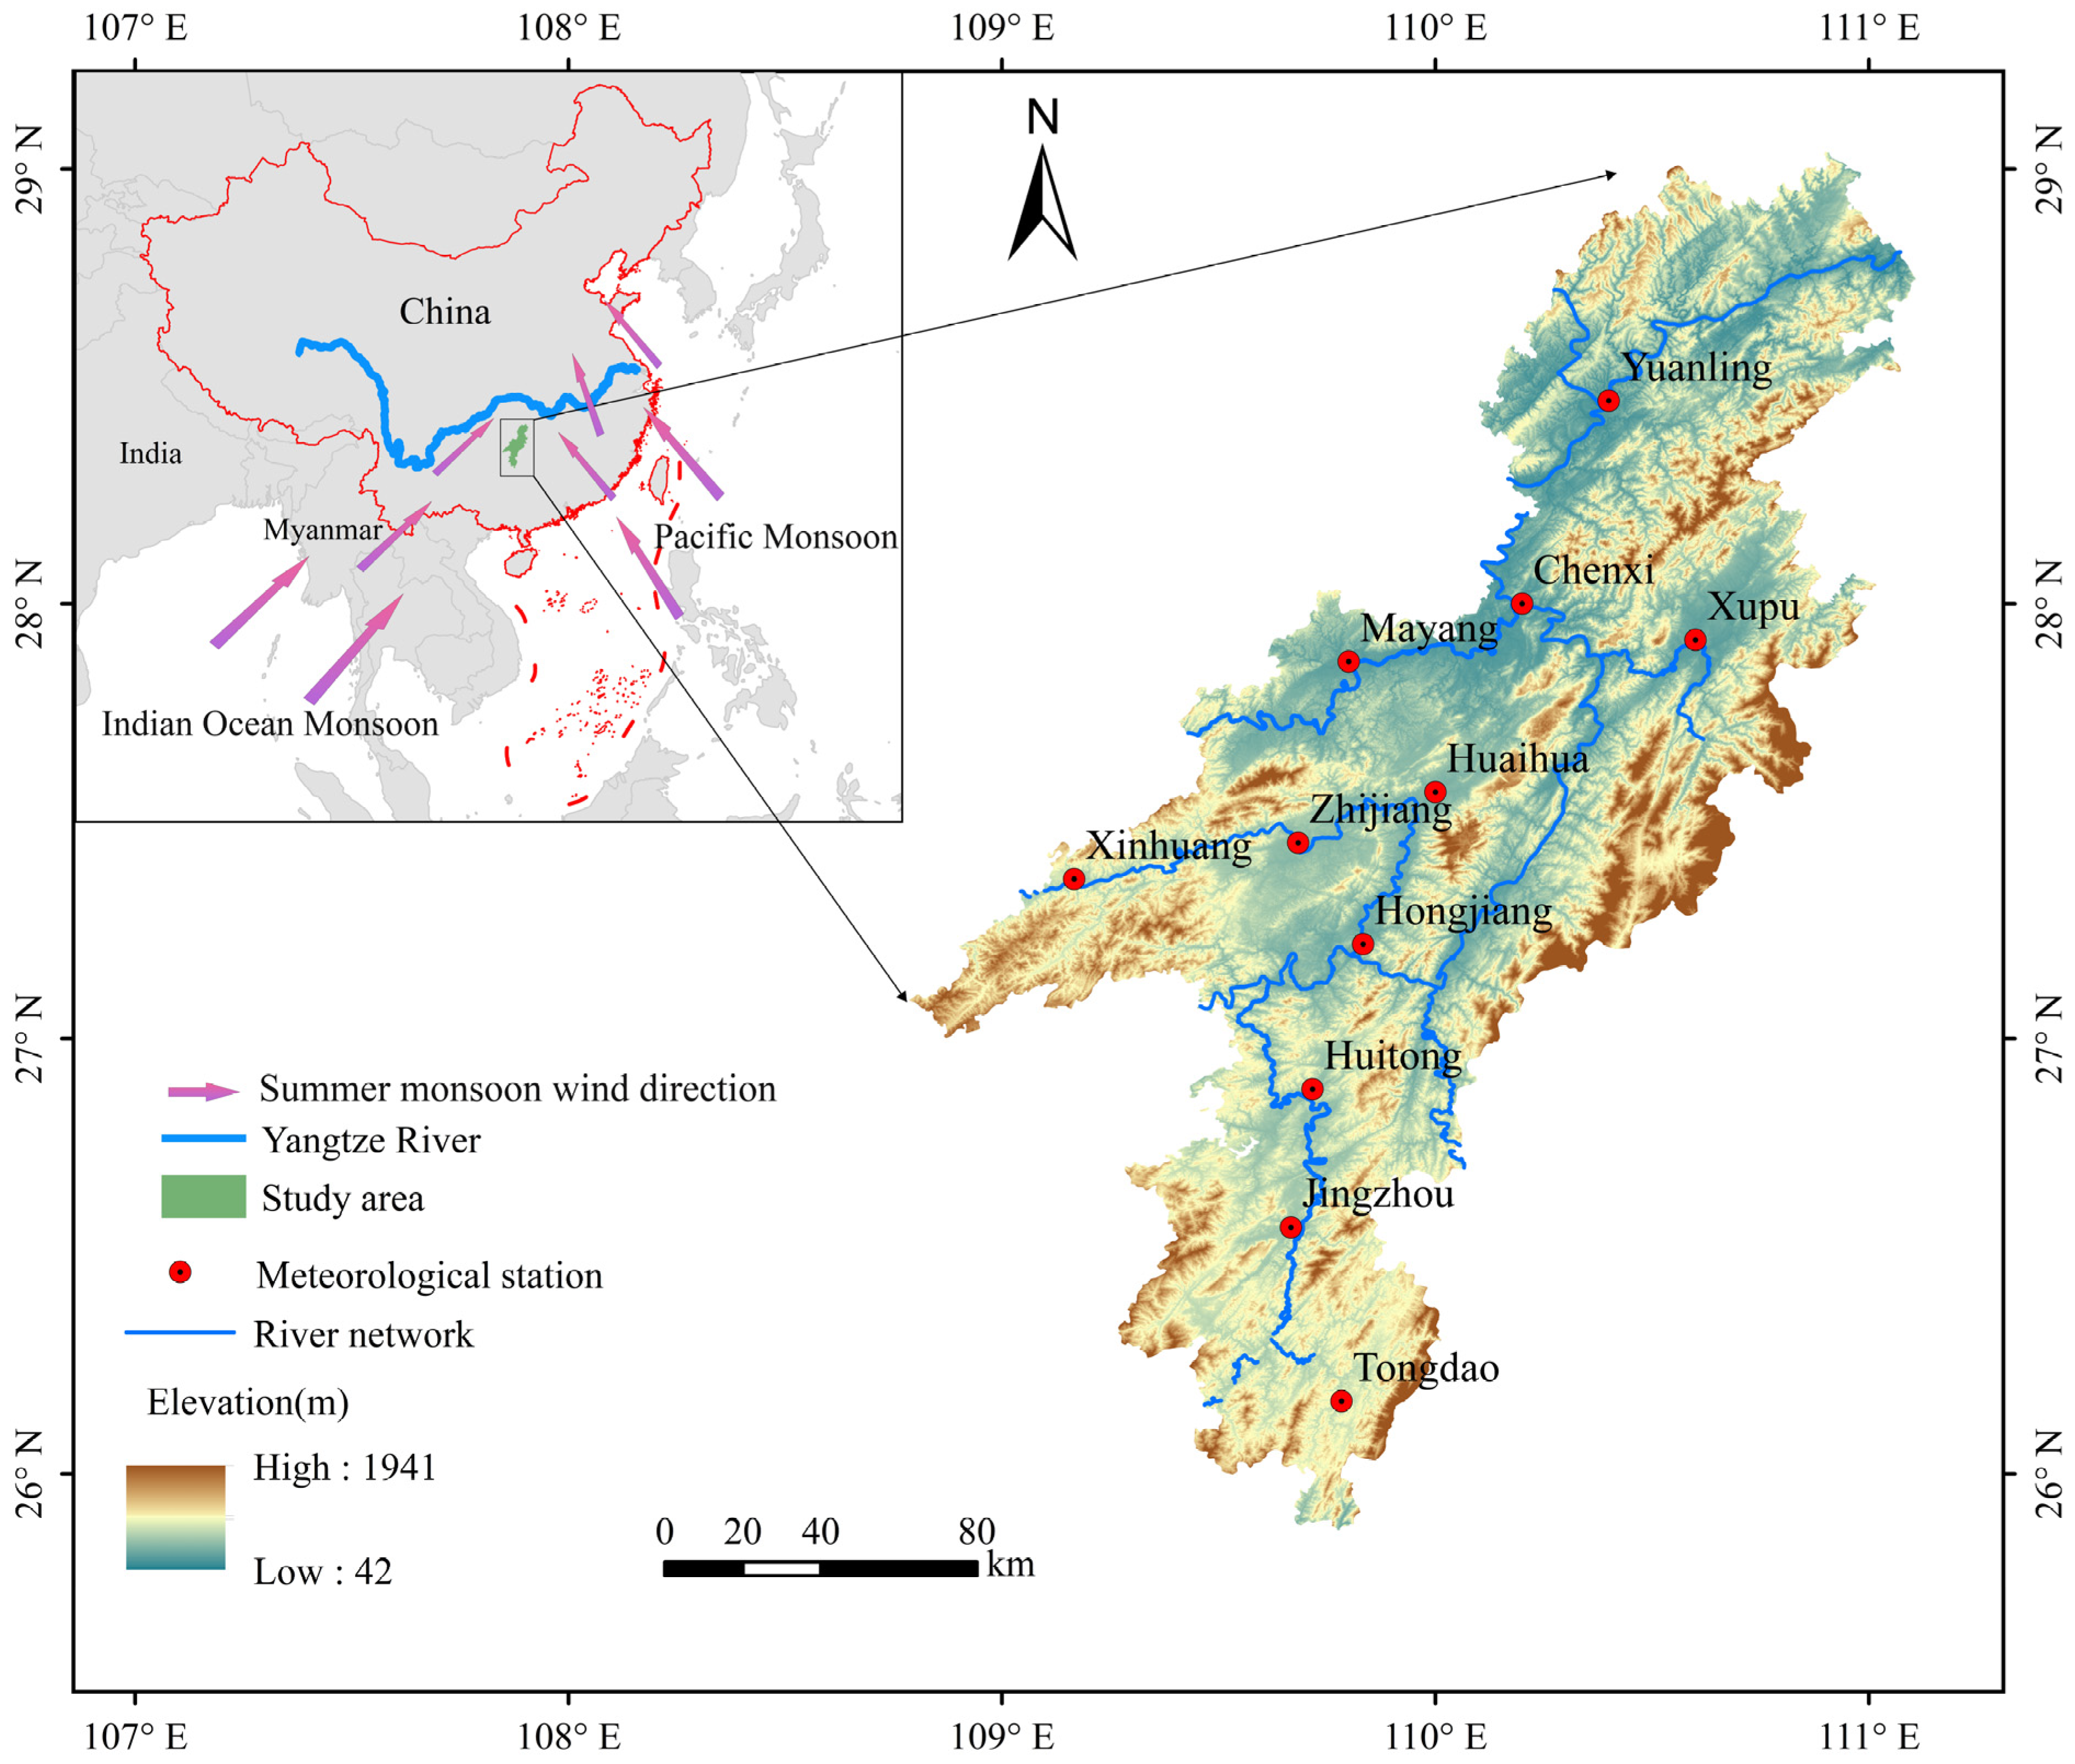
2.1. Study Area

The study area, Huaihua region, is located in the intersection zone of the Indian Ocean monsoon and the Pacific monsoon. It is in the southwest of Hunan Province of China, with a range of 25°52′ N–29°01′ N and 108°47′ E–111°06′ E (Figure 1). It belongs to the Yuanjiang River Basin, the second largest river system of Dongting Lake in the Yangtze River Basin, with an area of 27,600 km2. As an important water conservation area in the MLRYR, Huaihua has significant ecological vulnerability. Its precipitation variation characteristics have an important impact on the flood and drought disaster pattern and economic development in the MLRYR, and it is an important area for climate change response [47]. The study area exhibits complex topography with a diverse landscape, featuring Xuefeng Mountain in the southeast, with an elevation of more than 1000 m in the middle section and an elevation of 1934 m at the main peak; Wuling Mountain in the northwest, with the highest altitude of 1736.5 m and the lowest of 218.2 m; and the Lingnan Mountain Range in the south, with an average altitude of about 1000 m, representing a typical hilly–mountainous region. In terms of climate, it belongs to the subtropical monsoon humid climate, with a diverse microclimate and large vertical difference, with an altitude difference of 1899 m [48]. The region has abundant hydropower resources [49]. Given its unique climatic regime, geographical setting, and topographic characteristics, the region exhibits high vulnerability to recurrent natural hazards, posing substantial risks to local ecosystem integrity, agricultural productivity, and socioeconomic sustainability.

2.2. Data Sources

The ground meteorological data for this study, with the daily scale, come from the National Meteorological Information Center of China Meteorological Data Network (http://data.cma.cn/, accessed on 20 October 2024). The time series range of the dataset is from 1979 to 2023. However, due to historical or other factors, some stations exhibit data gaps. Rigorous data screening was conducted to ensure data integrity and consistency. The screening criteria were as follows: (1) excluding stations with discontinuous records caused by relocation, (2) excluding stations exhibiting missing measurements for ≥3 consecutive days, and (3) applying spatial interpolation using adjacent station data to fill gaps where there were missing measurements ≤2 days. Following these screening procedures, data from 11 ground-based meteorological stations within the study area were ultimately selected, spanning a 45-year period. These stations are evenly distributed, providing robust representation of the climatic characteristics of the study area. With long-term observational records and rigorous quality control, the dataset ensures high integrity and reliability. The spatial distribution of the stations is illustrated in Figure 1.
This study employs the high-resolution China Meteorological Forcing Dataset (CMFD, 0.1° × 0.1° grid) to accurately characterize spatial precipitation variability. The CMFD is developed by the Institute of Tibetan Plateau Research, Chinese Academy of Sciences, and is available through the National Tibetan Plateau Data Center (https://data.tpdc.ac.cn/, accessed on 22 October 2024). This comprehensive reanalysis dataset integrates Princeton reanalysis data, GLDAS data, GEWEX-SRB radiation data, and TRMM precipitation data, combined with the conventional meteorological observation data of the China Meteorological Administration. The original data consist of meteorological observation data, reanalysis data, and satellite remote sensing data. Non-physical range values have been deleted, and ANU-Spline statistical interpolation is kept [50,51]. The accuracy is between those of the observation data of the Meteorological Bureau and the satellite remote sensing data, which is better than the accuracy of the existing reanalysis data in the world.

3. Methods

3.1. Trend Analysis of Precipitation Time Series

3.1.1. Linear Regression Method

Linear regression is generally a process of modeling the relationship between one or more dependent variables and independent variables by means of the least square function involved in the linear regression equation. This function is generally a linear combination of one or more regression coefficient models, which can predict the range of corresponding values based on the values of various factors within a certain confidence level, determine the significance of variables among multiple predictors, and estimate prediction accuracy based on given values of the forecast variables. In this paper, the one-dimensional linear regression method is used to analyze the trend in annual precipitation and EPIs. The specific calculation formula is as follows:
y = a + b t
where y is the annual precipitation and EPI; t is the time series; a and b can be estimated by the least squares method; a is the regression constant; and b is the regression coefficient (i.e., the linear trend term). A value of b > 0 indicates that annual precipitation and EPIs are increasing with time t, and b < 0 indicates that annual precipitation and EPIs are decreasing with time t. The product b × 10 represents the change in annual precipitation and EPIs per decade, known as the climate tendency rate.

3.1.2. Mann–Kendall Trend Test

Trend analysis, which serves as an essential statistical methodology for time series research, is frequently employed to identify and quantify systematic trends in meteorological variables over extended long-term temporal sequences. The available trend testing methodologies mainly consist of parametric statistical tests and non-parametric statistical tests. Among these various testing approaches, non-parametric tests have been demonstrated to be more effective in identifying and characterizing trends within time series data, primarily because they do not require any assumptions regarding the underlying data distribution. The most commonly used non-parametric tests include the Onyutha test, Spearman’s rho test, and the Mann–Kendall test. The Mann–Kendall trend test was initially proposed by Mann and Kendall and has been recommended by the World Meteorological Organization (WMO) for meteorological research [52,53,54]. It is widely applied in the statistical analysis and detection of trends in hydrological time series. In this paper, the Mann–Kendall test was used for trend analysis of precipitation and EPIs. The specific methodology is as follows:
The test statistic for the Mann–Kendall test is
S = i = 1 n 1 j = i + 1 n sgn x j x i
sgn x j x i = 1 x j x i > 0 0 x j x i = 0 1   x j x i < 0
The standardized test statistic for the Mann–Kendall test is
Z = S 1 V a r ( S )         S > 0               0           S = 0 S + 1 V a r ( S ) S < 0
V a r S = n n 1 2 n + 5 18
n is the number of the time series, and xi and xj denote the sample data values. The standardized statistic Z is greater than 0, indicating that the sequence is on the rise; z is less than 0, indicating a downward trend in the sequence. The larger the |Z| is, the more significant the trend is. If |Z| > Z1−α/2, the series passes the significance level test, indicating a statistically significant trend. In this study, the significance level (α) is set to 0.05, with the corresponding Z1−α/2 = 1.96.

3.1.3. Moving Average Method

Let the annual precipitation series for the study area be denoted as X = (X1, X2, …, Xn). A 5-point moving average method is applied to calculate the 5-year moving average of the precipitation series, resulting in a smoothed series, Y = (Y1, Y2, …, Yi):
Y i = 1 5 X i + X i + 1 + X i + 2 + X i + 3 + X i + 4
where n is the length of the precipitation series, i = 1, 2, …, n − 4.

3.1.4. Cumulative Anomaly Method

Cumulative anomaly is a commonly used method to intuitively judge the trend of change from a curve. For the precipitation series x, the cumulative anomaly of i at a certain time is
y i = i = 1 n x i x ¯ ( i = 1 , 2 , , n )
x ¯ = 1 n i = 1 n x i
The cumulative anomalies at n moments are all calculated, and the cumulative anomaly curve can be drawn for trend analysis. When x ¯ is greater than 0, it indicates that it is in a wet year; when x ¯ is less than 0, it indicates that it is in a dry year.

3.2. Mann–Kendall–Sneyers Test (MKS)

Abrupt climate change refers to a discontinuous phenomenon occurring in the variation process of meteorological elements, while the MKS test is an important method recommended by international meteorological organizations [55], widely used for analyzing trends and mutation points in meteorological elements, and has been extensively applied to analyze trend variations in time series of precipitation, temperature, runoff, and other elements.
Methodological Principle: For a time series X1, X2, …, Xn with n samples, construct an ordered sequence:
S k = i = 1 k R i k = 1 , 2 , , n
R i = 1             X i > X j 0             e l s e
where the sequence Sk represents the cumulative count of instances where the value at time i exceeds the value at time j, and Ri is the number of element values at time i greater than the number of element values at time j.
Define the test statistic UFk:
U F k = S k E S k V a r ( S k ) k = 1 , 2 , , n
where E(Sk) and Var(Sk) represent the mean and variance of the cumulative count Sk, respectively. When the sample values X1, X2, …, Xn are independent and identically distributed from a continuous distribution, E(Sk) and Var(Sk) can be calculated using the following formulas:
E S k = k ( k 1 ) 4 2 k n
V a r ( S k ) = k ( k 1 ) ( 2 k + 5 ) 72         2 k n
UFk is a sequence of test statistics calculated from the time series x1, x2, …, xn. By reversing the UFk sequence, the UBk sequence is obtained. The curves of UFk and UBk are then plotted. Typically, the significance level is α = 0.05, and the critical value is U0.05 = ±1.96. When the value of UFk > 0, it indicates that the sequence is on the rise, and vice versa. If the values of UFk and UBk exceed the critical value range, a time region of abrupt change is identified. Furthermore, if the UFk and UBk curves intersect within the critical lines, the time point corresponding to the intersection is considered the onset of the abrupt change.

3.3. Wavelet Analysis

Wavelet analysis exhibits multi-resolution analysis capabilities, allowing simultaneous signal characterization in temporal and spectral domains. This method demonstrates superior localization properties across both domains, providing enhanced capabilities for signal extraction and periodic feature identification [56]. In this paper, Morlet wavelet analysis is used to research the cycle changes in annual precipitation and EP.
The wavelet transform function for the time series is defined as
W f a , b = a 0.5 + f t ψ t b a d t
where Wf(a,b) represents the wavelet coefficients; a is the scale factor, which determines the width of the wavelet; b is the translation factor, reflecting the positional shift of the wavelet; and the symbol “*” denotes the complex conjugate function. The variance of the continuous wavelet transform is given by
V a r ( a ) = + W f ( a , b ) 2 d b
The periodic transformation law of annual precipitation and EP at different timescales can be analyzed using the real part contour map of wavelet transform coefficients. Additionally, the wavelet variance spectrum provides identification of dominant periodicities within the precipitation time series.

3.4. R/S Analysis

The R/S analysis method, or rescaled range analysis, was developed by H.E. Hurst in the Nile dam project, and is usually used to analyze time series [57]. A random time series is defined as ξ(t), where t = 1, 2, …, n. For any positive integer τ ≥ 1, the mean series ξτ is defined as
ξ τ = 1 τ i = 1 τ ξ t , τ = 1 , 2 , , n
The cumulative deviation sequence X(t,τ) is defined as
X t , τ = k = 1 t ξ k ξ τ , t = 1 , 2 , , τ
The range series Rτ is defined as
R τ = max X t , τ min X t , τ , τ = 1 , 2 , , n
The standard deviation series Sτ is defined as
S τ = 1 τ i = 1 τ ξ t ξ τ 2
ln R τ S τ = H ln a + H ln τ
where, a is the statistical constant, and H is the Hurst exponent. If 0 < H < 0.5, it shows that the trend of the time series is reversed, with smaller H values corresponding to stronger anti-persistence. If H = 0.5, the time series is characterized by independent increments. If 0.5 < H < 1, this trend of the time series is continuous, and the greater the H value, the stronger the continuity.

3.5. Kriging Interpolation Method

Kriging interpolation, a geostatistical method based on variational function theory and structural analysis, provides unbiased optimal estimation of regionalized variables within finite areas, accurately characterizing spatial distribution patterns. In this study based on the ArcGIS 10.6 platform, it is used to generate spatial interpolation of multi-year average precipitation and multi-year average EPIs from 11 stations distributed across the study area.

3.6. Definition and Calculation of EPIs

During 1998–2001, the World Meteorological Organization (WMO) proposed a diagnostic method based on daily precipitation extreme climate indices at its climate change monitoring conference, which included 11 EPIs. These indices are characterized by weak extremes, low noise, and strong significance [58]. The methodology has established a standardized framework for quantitative analysis of extreme climate events in subsequent studies. Moreover, these climate indices have been extensively implemented in extreme climate change research. This study selects nine of these EPIs to investigate the characteristics of EP (Table 1). The CDD primarily reflects extreme drought conditions, while the CWD and R10 also characterize moderate drought to some extent. The R20 mainly reflects the total annual precipitation. In contrast, RX1, RX5, SDII, R95P, and R99P primarily focus on extreme heavy precipitation characteristics.

4. Results

4.1. Temporal Variation Patterns of Precipitation

4.1.1. Trend Analysis

Figure 1 demonstrates the relatively even spatial distribution of meteorological stations across the study area. Consequently, the arithmetic mean method was employed to estimate areal precipitation for the study area. Based on the previously described moving average formula, 5-year moving averages and cumulative anomalies of annual precipitation were calculated for the study area during the period 1979 to 2023, with the results presented in Figure 2.
The time series of annual areal precipitation exhibits an overall upward trend, with a climate tendency rate of 9 mm/10 a (Figure 2a). The study area exhibits a mean annual precipitation of 1403.82 mm. The annual precipitation series and its moving average distribution curve exhibit significant fluctuations, with the maximum annual precipitation of 1806.57 mm occurring in 2020 and the minimum of 1030.88 mm recorded in 2011.
Years with precipitation below the multi-year average are classified as “relatively dry years”, while those with precipitation above the multi-year average are classified as “relatively wet years”. As shown in Figure 2b, there are 23 relatively dry years, accounting for 51% of the total, and 22 relatively wet years, accounting for 49%. The numbers of relatively dry and relatively wet years differ by only one year, with both categories evenly distributed above and below the zero line. Between 1979 and 2023, annual precipitation has generally alternated in a “dry–wet–dry–wet” pattern.

4.1.2. Mann–Kendall–Sneyers Test (MKS) Analysis

The MKS test was employed to analyze the mutation characteristics of mean annual precipitation in the study area during the period 1979–2023 (Figure 3). As illustrated in Figure 3, UFk and UBk represent two sequence curves. When the value of UFk exceeds the critical lines (Z = ±1.96), it indicates a statistically significant upward or downward trend in the series. The period beyond the critical lines represents the time frame of abrupt change. Cumulative precipitation anomaly analysis has been adopted as a diagnostic tool for objective validation of precipitation transition years in different time intervals (Figure 2b).
As clearly demonstrated in Figure 3, the UFk statistic values for annual precipitation in the study area are consistently greater than 0 throughout the periods of 1990–2008, 2010, and 2014–2023. This indicates that annual precipitation gives an upward trend in this range. Regarding the remaining years within the study period, the UFk statistic values for annual precipitation consistently remain below 0, which clearly demonstrates the existence of a pronounced downward trend in precipitation patterns throughout these specific periods. Since the UFk curve does not exceed the significance level line (α = 0.05) over the entire period, it indicates that the trend in annual precipitation for the study area is not statistically significant. In the range of the 0.05 significance level, by analyzing the intersection of UFk and UBk, the precipitation was initially selected for 1989, 2002, and 2011. Combined with the cumulative anomaly curve, the significant change in precipitation is obvious, and led to the sudden changes in precipitation in 1989, 2002, 2011, and 2021.

4.1.3. Periodicity Analysis

The annual precipitation in the study area was analyzed using the Morlet wavelet transform to investigate the future trends of precipitation changes in the coming years. The contour map of the real part of the wavelet transform coefficients for annual precipitation is shown in Figure 4. Regions with positive values correspond to years with relatively abundant precipitation, while regions with negative values indicate years with relatively scarce precipitation. Zero values represent precipitation levels close to the multi-year average. As illustrated in Figure 4, three statistically significant cycles in annual precipitation variability have been identified: 3–6 years, 8–11 years, and 20–32 years. Among these, the 8–11 year and 20–32 year cycles exhibit pronounced and spatially coherent wet–dry precipitation patterns, with their respective central scales identified at 9 years and 28 years. In addition, the 3–6 year cycle demonstrates relatively apparent wet–dry variability, albeit with less coherent alternations.
Wavelet variance is defined as the integral of the energy function across various temporal scales, which quantifies the perturbation intensity of hydrological variables at each temporal scale. The local maxima of wavelet variance correspond to timescales of 28 years, 9 years, and 4 years (Figure 5). The comprehensive wavelet analysis reveals that the precipitation series exhibits three dominant cycles: 28 years, 9 years, and 4 years. The maximum peak corresponds to the 28 year period, identified as the primary periodicity. The secondary and tertiary peaks correspond to the 9 year and 4 year periods, representing the second and third dominant cycles, respectively.
Furthermore, the temporal evolution of the real part coefficients derived from wavelet transform analysis of annual precipitation has been systematically constructed for the 28 year, 9 year, and 4 year timescales (Figure 6). Positive wavelet coefficients correspond to years with relatively abundant precipitation, negative coefficients indicate years with relatively scarce precipitation, and zero values represent transition points (Figure 6). The precipitation time series at the 28 year timescale demonstrates distinct wet–dry oscillation patterns that are well-aligned with its characteristic periodicity (Figure 6). In contrast, the precipitation variability at both the 9 year and 4 year timescales reveals pronounced dry–wet oscillation cycles that are synchronized with their respective periodic characteristics. At the 28 year timescale, the annual precipitation exhibits six wet–dry alternations, followed by a relatively dry phase. At the 9 year timescale, the annual precipitation exhibits 15 dry–wet alternations, also followed by a relatively dry phase. At the 4 year timescale, the annual precipitation exhibits 33 dry–wet alternations, indicating a future trend consistent with the patterns observed at the 28 year and 9 year timescales.
In summary, the annual precipitation is characterized by multi-timescale changes, with differences in timescales, and the periods of abundance and depletion in which precipitation occurs are not entirely consistent, and the corresponding mutation points are also different. Wet or dry phases at larger timescales encompass the wet and dry phases observed at smaller timescales. In the wet and dry period on a large timescale, its overall characteristics are composed of nested fluctuation sequences on a small timescale. On the contrary, normal precipitation events on a larger timescale often appear as precipitation processes with significant mutation characteristics when focusing on smaller timescale analysis. Therefore, the wet–dry variability in interannual precipitation in the study area is closely associated with the selection of temporal scales.

4.1.4. Future Trend Analysis

The rescaled range (R/S) analysis was employed to analyze the trend in annual precipitation in the study area from 1979 to 2023. The relationship between ln(Rτ/Sτ) and ln(τ) was plotted (Figure 7) and fitted linearly. The Hurst index (H) calculated from the R/S analysis is 0.65, which is consistent with the results of the linear fitting. Since H is greater than 0.5, the long-term memory is strong, indicating a persistent trend. The change in the trend of the average annual precipitation in the future is consistent with the past trend, and will continue to increase in the future.

4.1.5. Temporal Variation Characteristics of EP

(1) Analysis of Interannual Variation Trends. The interannual variation trends of EP in the study area during 1979–2023 are presented in Figure 8. Overall, EP shows an upward trend. With the exception of the consecutive dry days (CDD) and consecutive wet days (CWD) indices, all indices show varying degrees of increase, with CWD changing significantly at the significance level of 0.05. Specifically, consecutive dry days (CDD) and consecutive wet days (CWD) show decreasing trends at rates of −1.4 days/10 a and −0.3 days/10 a, respectively. The decline in CDD is more pronounced, indicating a slight decrease in dry days. The simple daily intensity index (SDII) shows a slightly increasing trend of 0.03 mm/10 a, though this trend is not statistically significant. The maximum SDII value of 11.43 mm/day was recorded in 2004, while the minimum value of 6.89 mm/day was recorded in 2023. The numbers of heavy precipitation days with more than 10 mm (R10) and 20 mm (R20) show increasing trends of 0.9 days/10 a and 0.3 days/10 a, respectively, with both indices reaching their maximum values in 2020. The maximum 1 day precipitation (RX1), maximum 5 day precipitation (RX5), very wet day precipitation (R95P), and extreme wet day precipitation (R99P) all show increasing trends, with rates of 1.4 mm/decade, 6.5 mm/10 a, 4.6 mm/10 a, and 3.8 mm/10 a, respectively. All indices reached their maximum values in 1996, indicating an intensification of heavy and EP events in the region. Overall, the study area has experienced a reduction in dry days, and the total precipitation, precipitation days, and strong precipitation increased.
Based on the 5 year moving average curve, consecutive dry days (CDD) showed a pronounced downward trend from 1990 to 1998, followed by fluctuating changes thereafter. In contrast, consecutive wet days (CWD) and the simple daily intensity index (SDII) remained relatively stable. Among the four indices representing EP—maximum 1 day precipitation (RX1), maximum 5 day precipitation (RX5), very wet day precipitation (R95P), and extreme wet day precipitation (R99P)—the variation in very wet day precipitation (R95P) exhibits the most pronounced fluctuations. Meanwhile, between the two indices representing precipitation frequency—light rain days (R10) and moderate rain days (R20)—moderate rain days (R20) exhibit a slightly more significant trend.
(2) Analysis of Decadal Variation Trends. Table 2 shows the decadal variations in EP in the study area during 1979–2023. As can be seen from Figure 8 and Table 2, CDD exhibit a fluctuating downward trend over the entire study period, with a trough in early October in the 21st century. Further, CWD demonstrates a declining trend from the 1980s to the 2010–2019 decade. However, a significant upward shift occurred in the 2020–2023 period, with CWD values reaching 13.25 days. Since the 1980s, R10 has shown a fluctuating upward trend, peaking during the 2020–2023 period. Similarly, R20, RX1, RX5, R95P, and R99P have exhibited consistent upward trends since the 1980s, with peaks occurring in the 1990s and the 2010–2019 decade, forming a bimodal pattern of the time series. This suggests that annual precipitation is primarily impacted by moderate rainfall days and EP. The SDII showed an upward trend from 1979 to 2000, followed by a downward trend after 2000, with a peak observed in the 1990s. Overall, EP exhibits generally consistent variation trends across both decadal and interannual timescales.
In summary, EP in the study area shows an overall increasing trend, while extreme drought shows a declining trend. Extreme heavy precipitation has intensified, with most EP events resulting from single-day heavy or extreme rainfall, as well as consecutive precipitation events.
(3) Mutation Characteristics of EP. Figure 9 and Table 3 present the results of the MKS test for the EPIs in the study area from 1979 to 2023. CDD underwent a mutation in 1990, with their trend shifting from a decrease to an increase and then back to a decrease. The mutation in CWD occurred around 1980, and after the mutation, the UFk curve began to exceed the 0.05 significance level from 1984, indicating that the decline trend after the mutation was more obvious than that before the mutation. R10, which reflects the number of annual rain days with light rain or above, exhibits mutations in 1990 and 2002. After the first mutation, the trend shifted from a decrease to an increase, while after the second mutation, the trend shifted from an increase to a decrease. R20 underwent a mutation in 1988 and exhibits an overall upward trend. RX1, RX5, R95p, and R99p reflect changes in EP. All four indices exhibit a single mutation point, occurring in 1992, 1989, 1985, and 1984, respectively. After the mutations, the UFk curves for all four indices exceed the 0.05 significance level, indicating a more pronounced upward trend after the mutations. Overall, these indices exhibit an upward trend. SDII, which primarily reflects precipitation intensity, underwent a mutation in 1985 and shows an overall upward trend.
(4) Periodic Characteristics of EP. Figure 10 illustrates the wavelet periodicities of nine EPIs for the study area during 1979–2023. CDD exhibits three periodic variations: 4–10 years, 12–18 years, and 20–32 years. CWD exhibits periodic variations of 4–10 years and 20–32 years. R10 exhibits three periodic variations: 4–10 years, 12–20 years, and 20–32 years. R20 exhibits periodic variations of 4–10 years and 20–32 years. RX1 exhibits periodic variations of 10–20 years and 20–32 years. SDII shows a periodic variation of 20–32 years. RX5, R95p, and R99p share similar periodicities, with variations of 10–16 years and 24–32 years. Thus, it can be concluded that the EPIs in the study area—CDD, CWD, R10, R20, RX1, and SDII—all exhibit periodic variations of 20–32 years. Additionally, CDD, CWD, R10, and R20 show periodic variations of 4–10 years. From Figure 11, we observe that the primary periodicity of CWD is 27 years, while the primary periodicity of CDD, R10, R20, RX1, and RX5 is 28 years. For SDII, R95p, and R99p, the primary periodicity is 29 years. Additionally, RX1, RX5, R95p, and R99p exhibit a secondary periodicity of 13 years.

4.2. Spatial Variation Patterns of Precipitation

4.2.1. Spatial Distribution Characteristics of Annual Precipitation

The Kriging interpolation was used to spatially interpolate the mean annual precipitation for each 9 year period in order to study the spatial distribution of mean annual precipitation (Figure 12). The spatial distribution of the 9 year average annual precipitation in the study area from 1979 to 2023 indicates that precipitation is primarily concentrated in the northeastern part of the study area and the southern regions of Jingzhou and Tongdao, while the western part receives less rainfall (Figure 12). Specifically, Xupu County in the northeast experiences relatively high multi-year precipitation, generally exceeding 1470 mm, whereas Xinhuang County in the west has the lowest multi-year precipitation, remaining around 1100 mm. The spatial distribution map of mean annual precipitation from 2015 to 2023 (Figure 11e) shows that the mean annual precipitation in the study area during these nine years has significantly increased compared to previous periods, which is consistent with the conclusion that the trend coefficient of total precipitation in the study area is greater than 0, as derived from Figure 2a.

4.2.2. Spatial Variation Characteristics of EPIs

The Kriging interpolation method was used to analyze the spatial distribution characteristics of EP by spatial interpolation of the average value of EPI of each station during the whole study period (Figure 13). EP in the study area exhibits significant spatial heterogeneity. Specifically, the indices R10, R20, RX1, RX5, SDII, R95P, and R99P range from 35.4 to 41.4 days, 16.6 to 20.7 days, 81.9 to 122.3 mm, 137.7 to 203.7 mm, 10.8 to 13.7 mm/day, 645 to 826.1 mm, and 245.5 to 334.1 mm, respectively. High-value areas are predominantly concentrated in the northeastern part of the study area and the southern regions of Jingzhou and Tongdao, while the western part remains a stable low-value zone. Among the drought indices, the CDD ranges from 25.1 to 26.2 days, with its peak in the central region and a gradient decrease towards the south and northeast. In contrast, the CWD ranges from 7 to 8.7 days, showing a decline from south to north. The western region exhibits spatial stability in both indices.
Through the MK trend test and multiple linear regression analysis of the EPI of 11 meteorological stations in the study area, the trend characteristics of EP in the study area are understood (Figure 13). Figure 14 presents the statistical results of trend changes in EPIs at these meteorological stations. Among the drought characteristic indices, CDD shows a decreasing trend at all stations, while CWD exhibits an increasing trend at 72.7% of the stations. The EPIs showed that R20, RX1, and R95P exhibited an upward trend at 72.7% of the stations, while R95P showed a significant decrease at Tongdao station. The spatial evolution patterns of these indices were similar. The rising trend of R10 accounted for 90.9%, with Chenxi station showing a significant increase, while Tongdao station exhibited the only negative trend. Among the EP intensity indicators, stations exhibiting a rising trend in RX5 and SDII accounted for 81.8%, and R99P stations also showed a rising trend in a similar proportion. Notably, the R99P at Mayang and Huitong stations increased significantly, while the Channel station showed a significant downward trend again. Notably, the Tongdao station exhibited abnormal trends across all three indicators—R10, R95P, and R99P—suggesting a unique climate regulation mechanism.

5. Discussion

The spatiotemporal evolution characteristics of EP in the convergence zone of the Indian Ocean monsoon and Pacific monsoon are closely related to atmospheric circulation and water vapor transport. From the late 1970s to the 1990s, the “anticyclonic–cyclonic–anticyclonic” water vapor transport anomaly from Inner Mongolia to the Caspian Sea to North China moved southward as a whole. In the 21st century, the atmospheric circulation over East Asia is abnormal, and the atmospheric circulation in the MLRYR is dominated by upward motion, resulting in an overall upward trend of EPIs. In the summer of the year following the central El Niño event, the evaporation in the western and central Pacific was abnormally enhanced, the subtropical high anomaly was westward and northward, and the anticyclonic circulation in the northwest Pacific (WNPAC) was also northward. WNPAC mainly strengthened the East Asian summer monsoon (EASM), enhanced its net water vapor budget, and increased precipitation in the convergence zone [59,60].
(1)
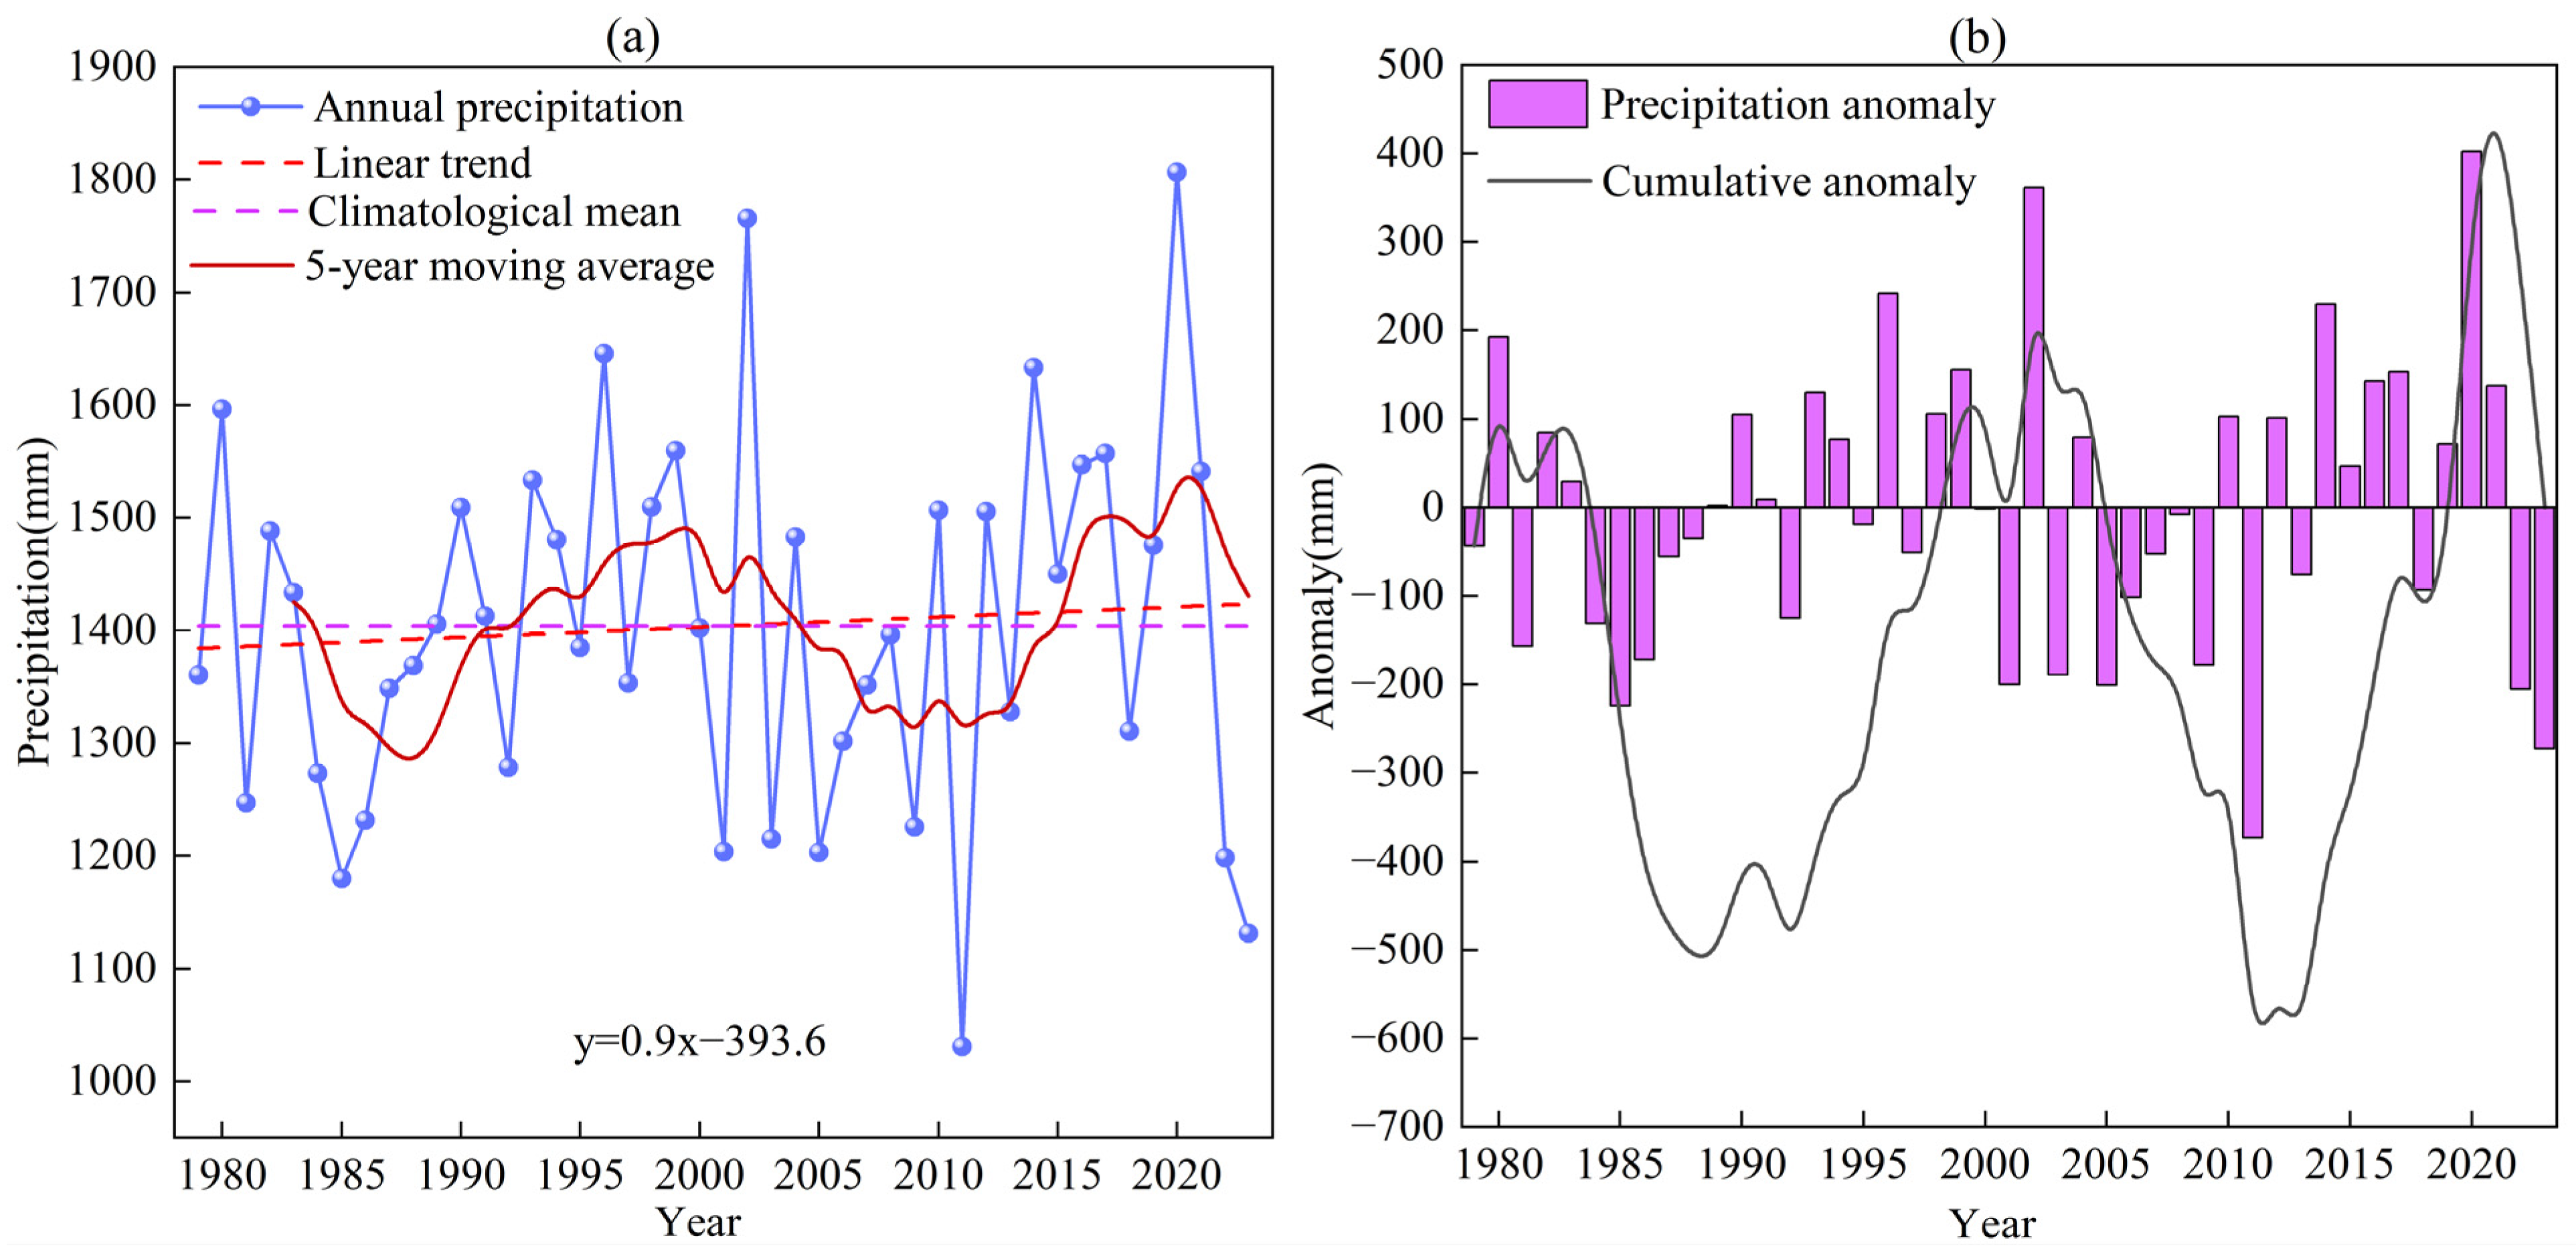
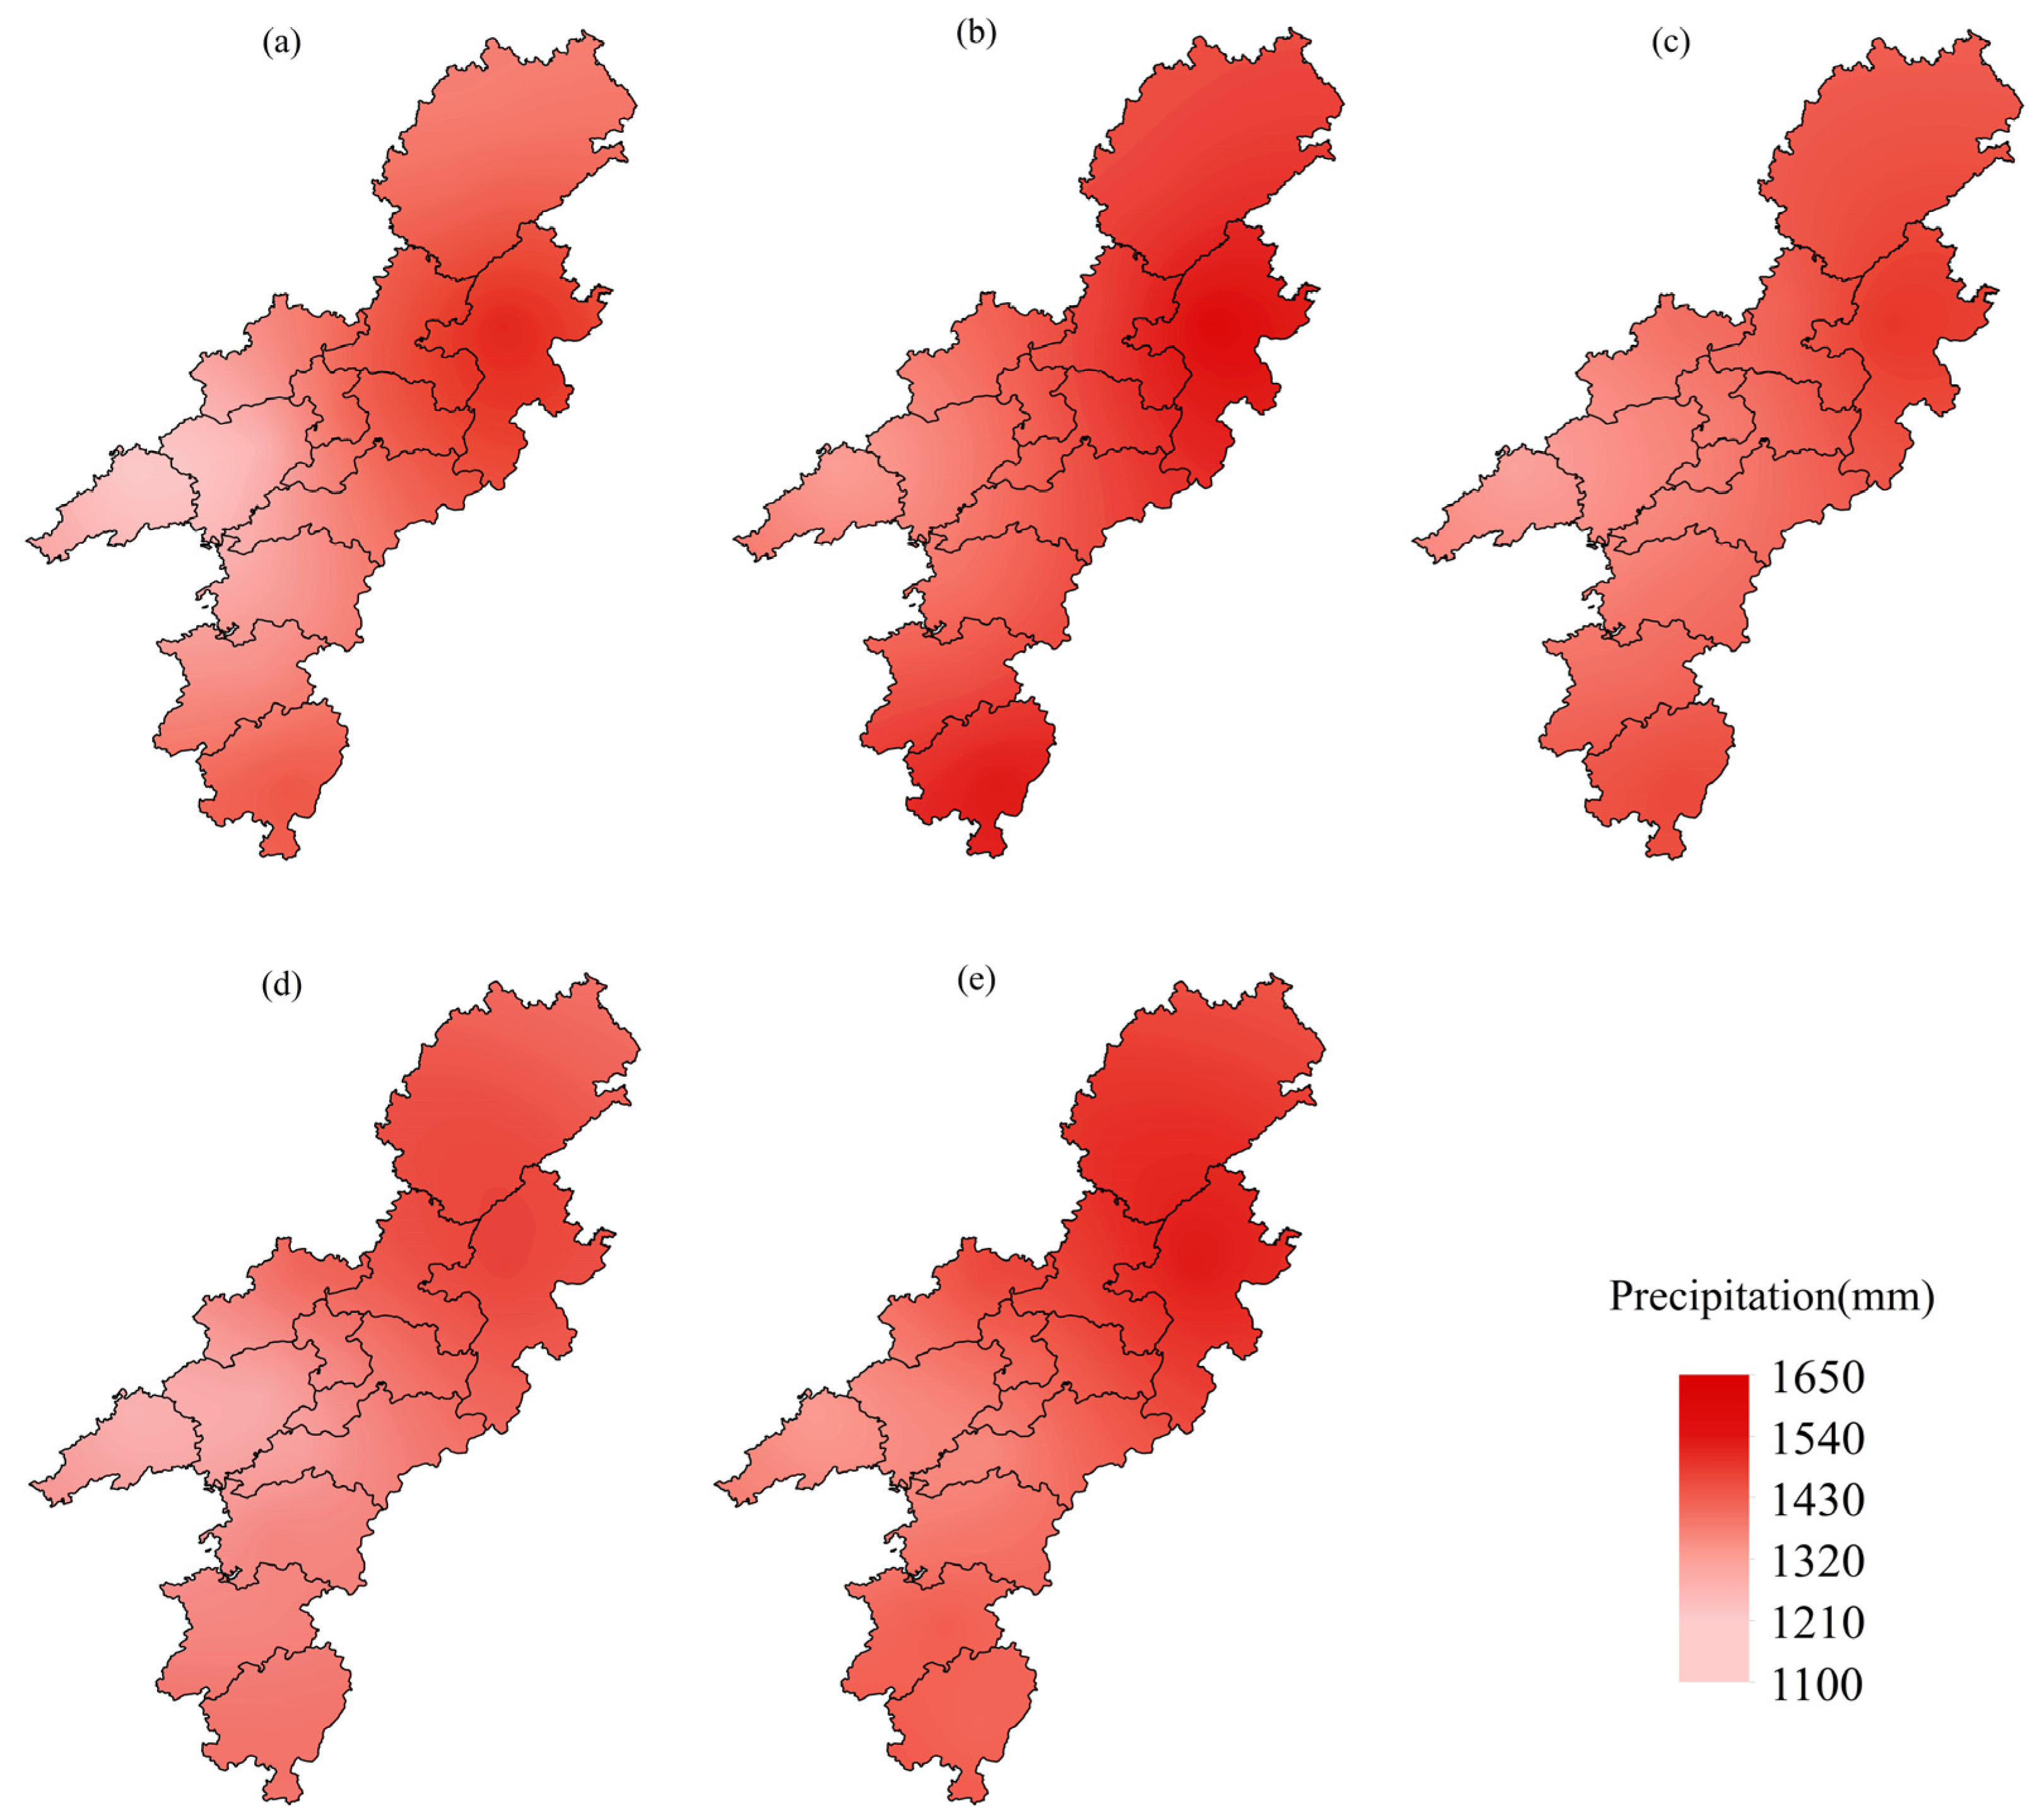
From the overall characteristics of precipitation in the study area, the precipitation in the past 45 years has shown an overall upward trend, and the climate tendency rate is 9 mm/10 a, reflecting the increasing trend in precipitation under the background of global climate change and monsoon convergence. The annual precipitation fluctuates greatly from 1979 to 2023, and the interannual variation is more significant. Since the study area is an important tributary of the MLRYR, the increasing trend in annual precipitation will lead to an increase in annual precipitation in the MLRYR, which is consistent with the research results [61]. According to the analysis of moving averages and cumulative anomalies, annual precipitation exhibits an alternating pattern of “dry–wet–dry–wet” over time. The spatial distribution of annual precipitation shows a tendency for more precipitation in the northeast and Jingzhou and Tongtong in the south, and less in the west, which is related to its special topography and climatic zones [62].
(2)
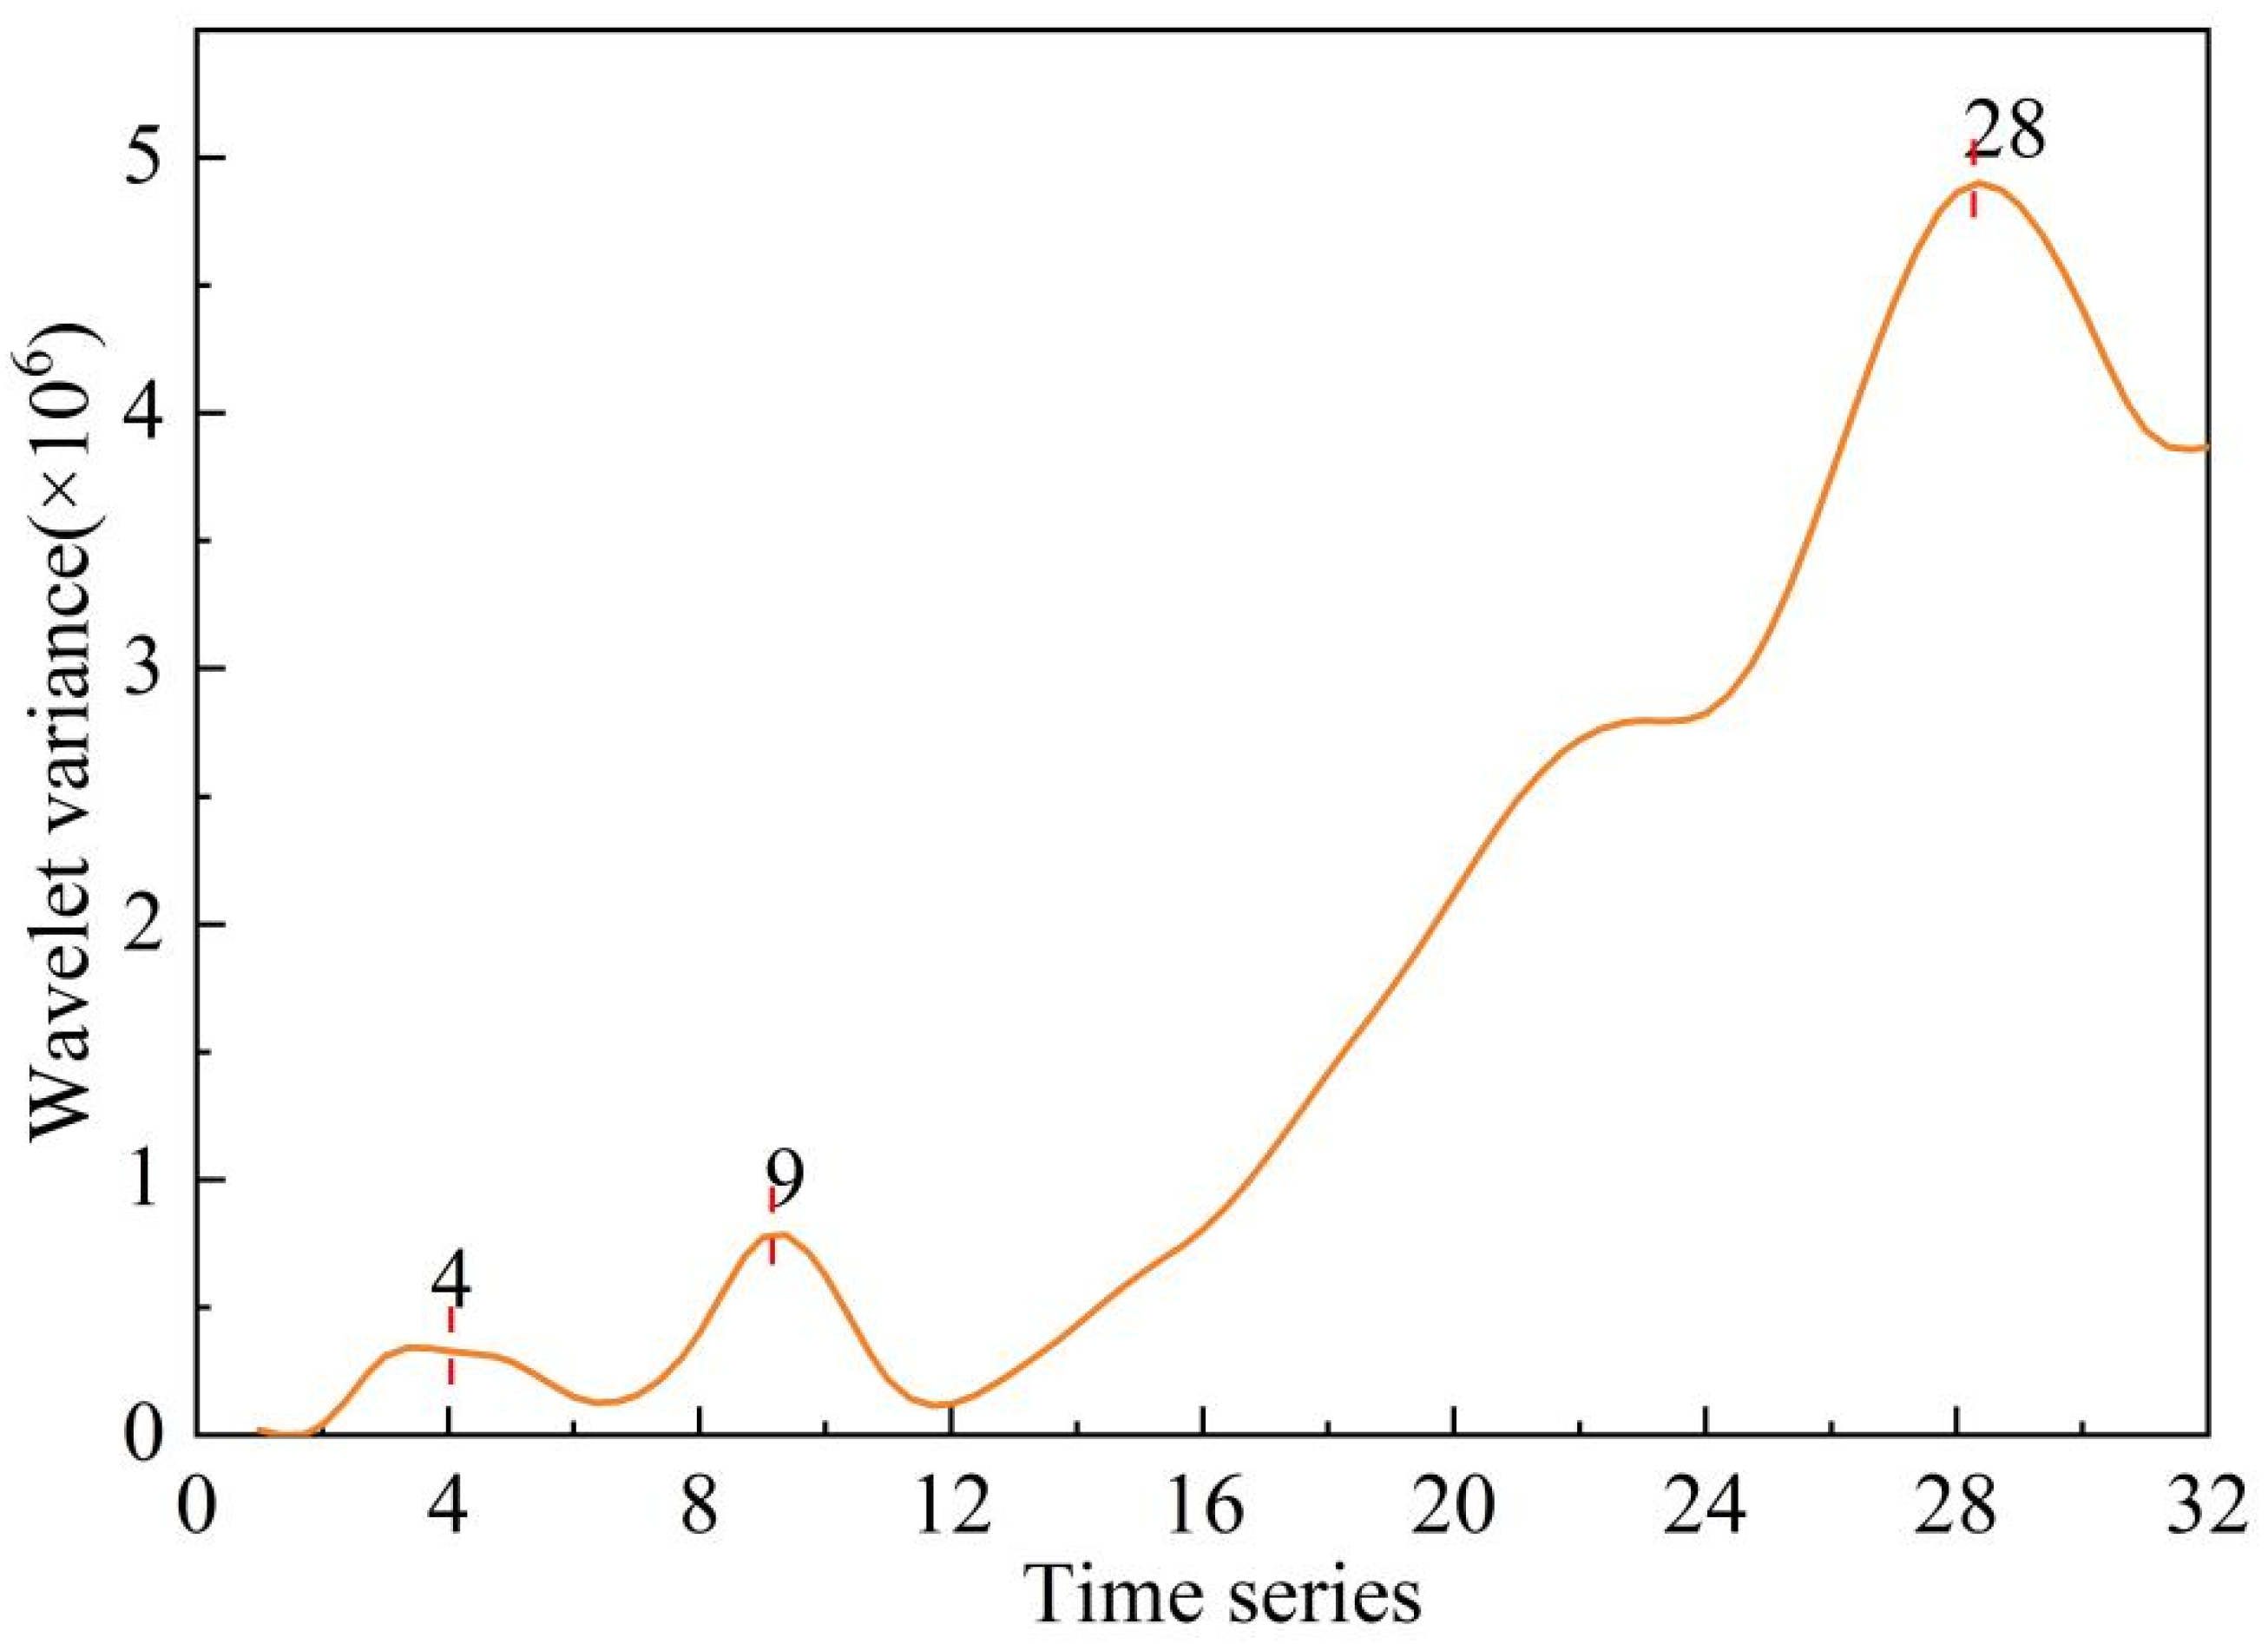
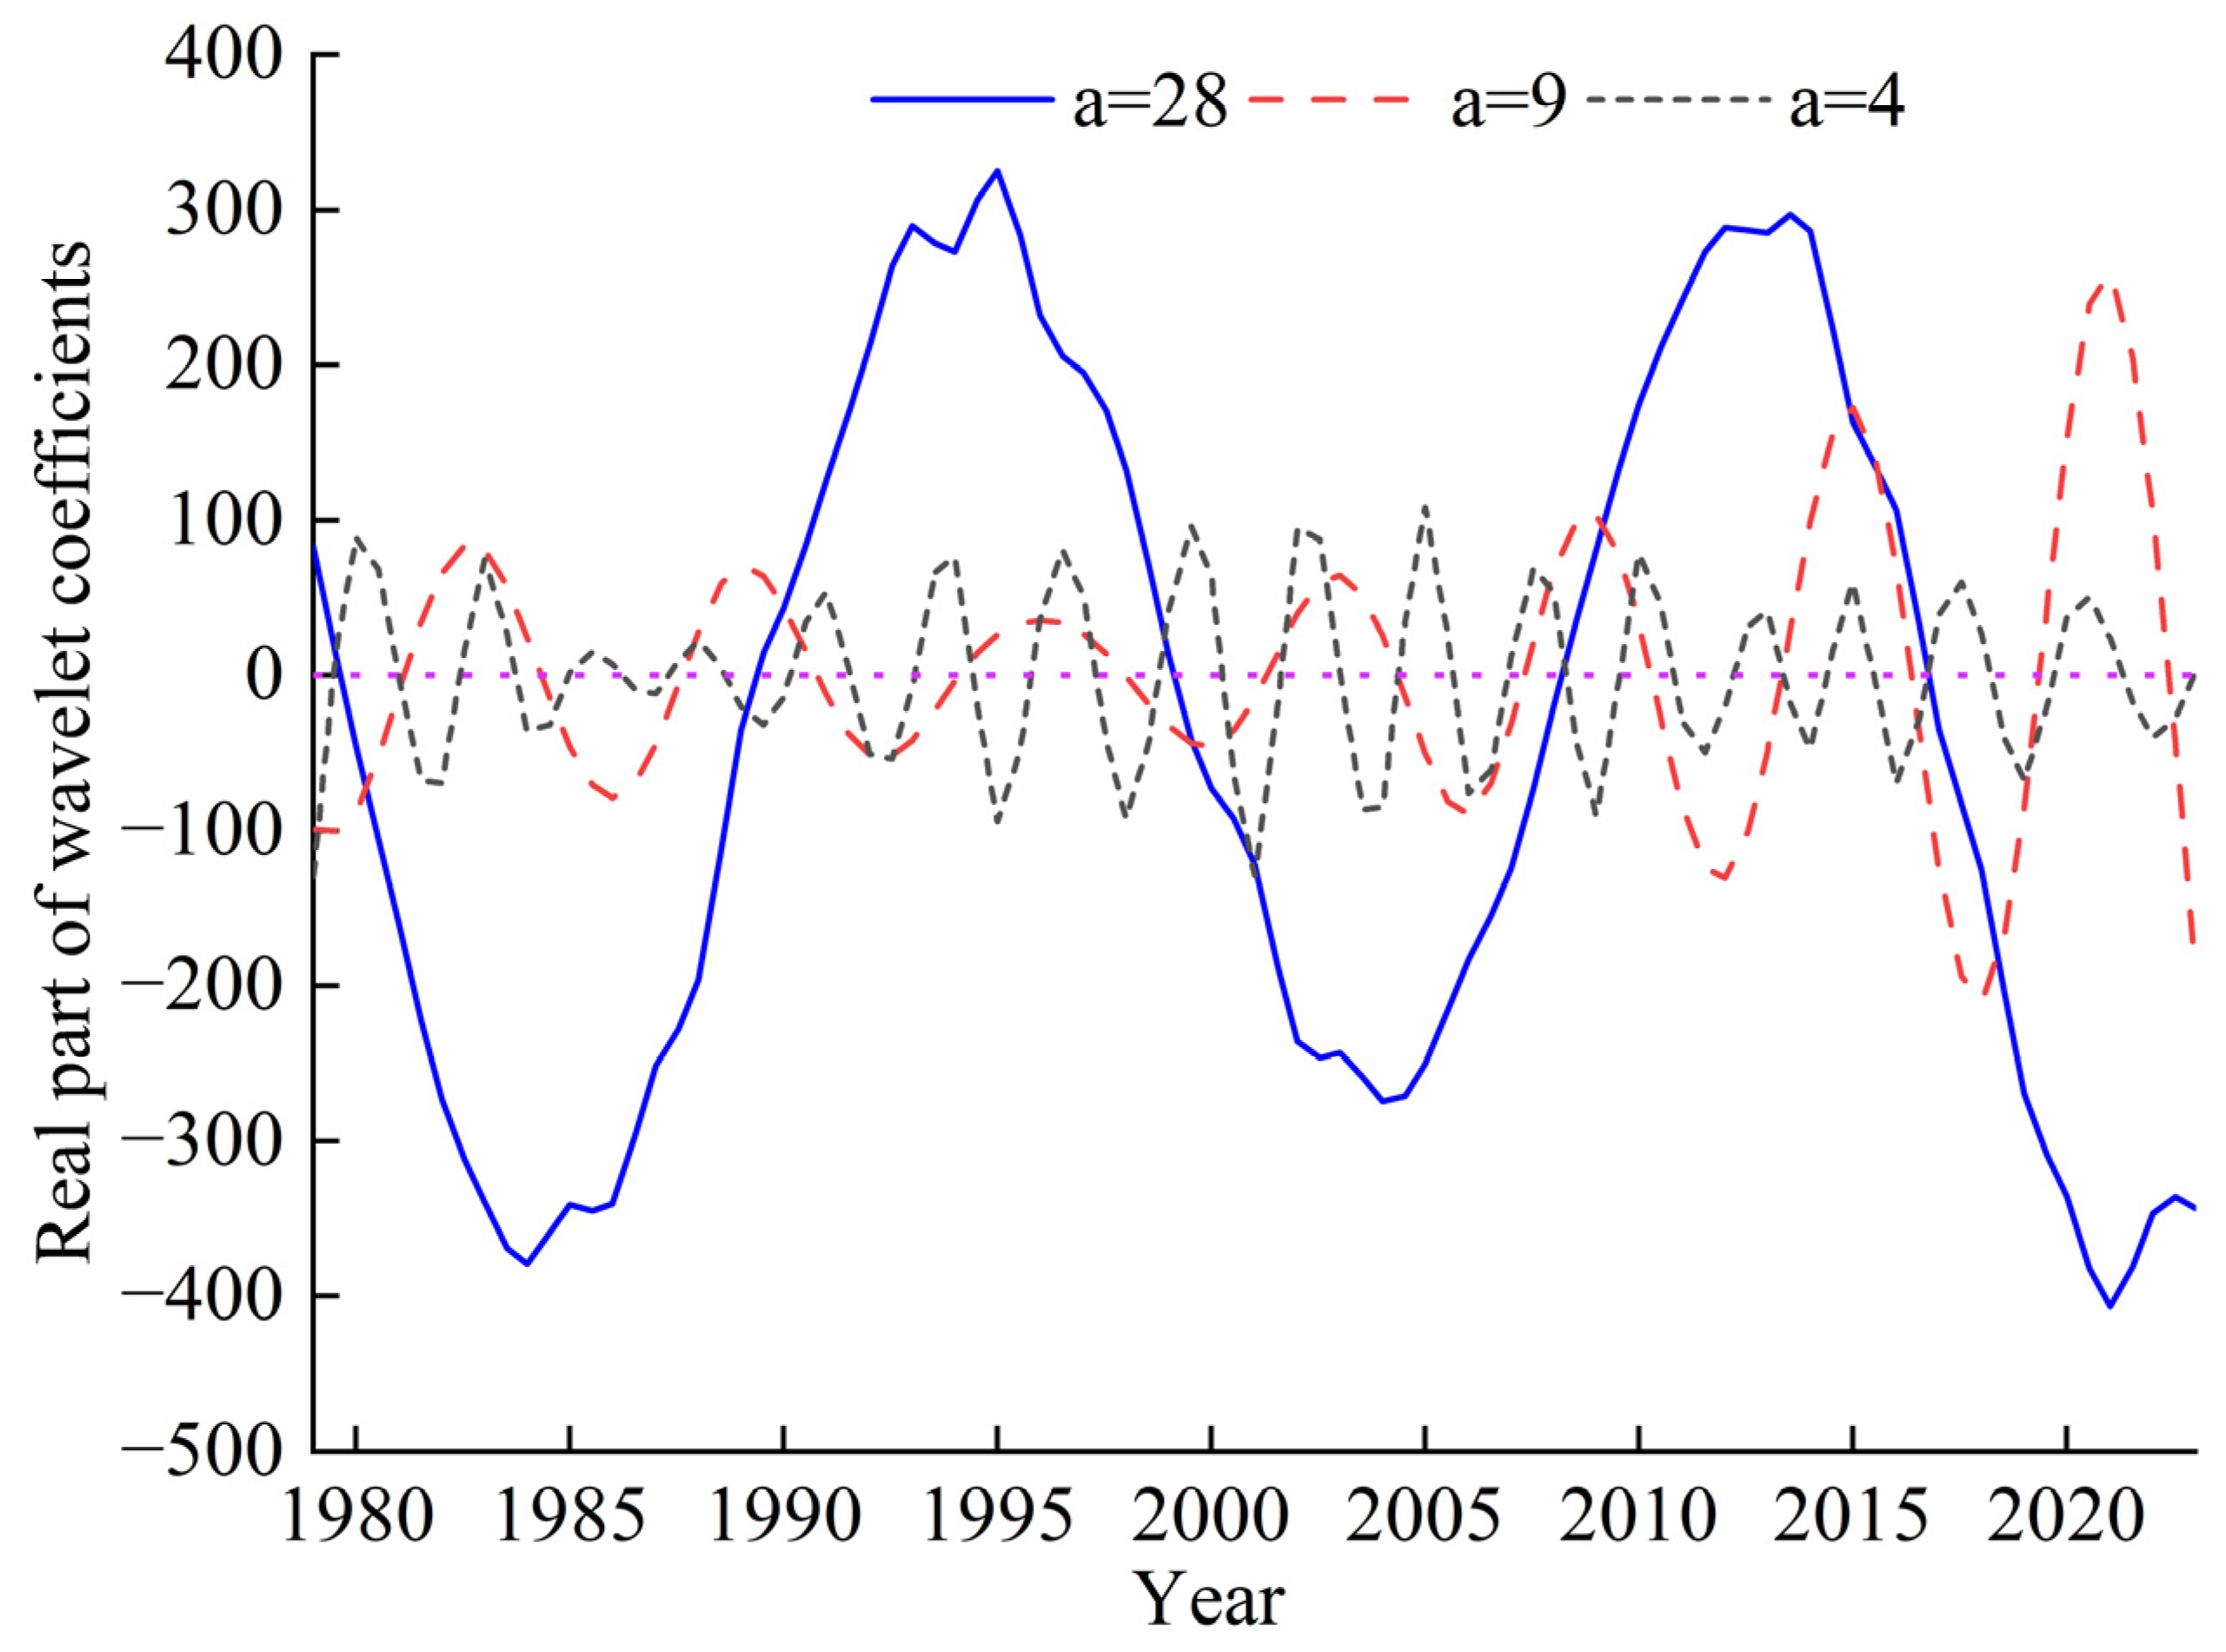
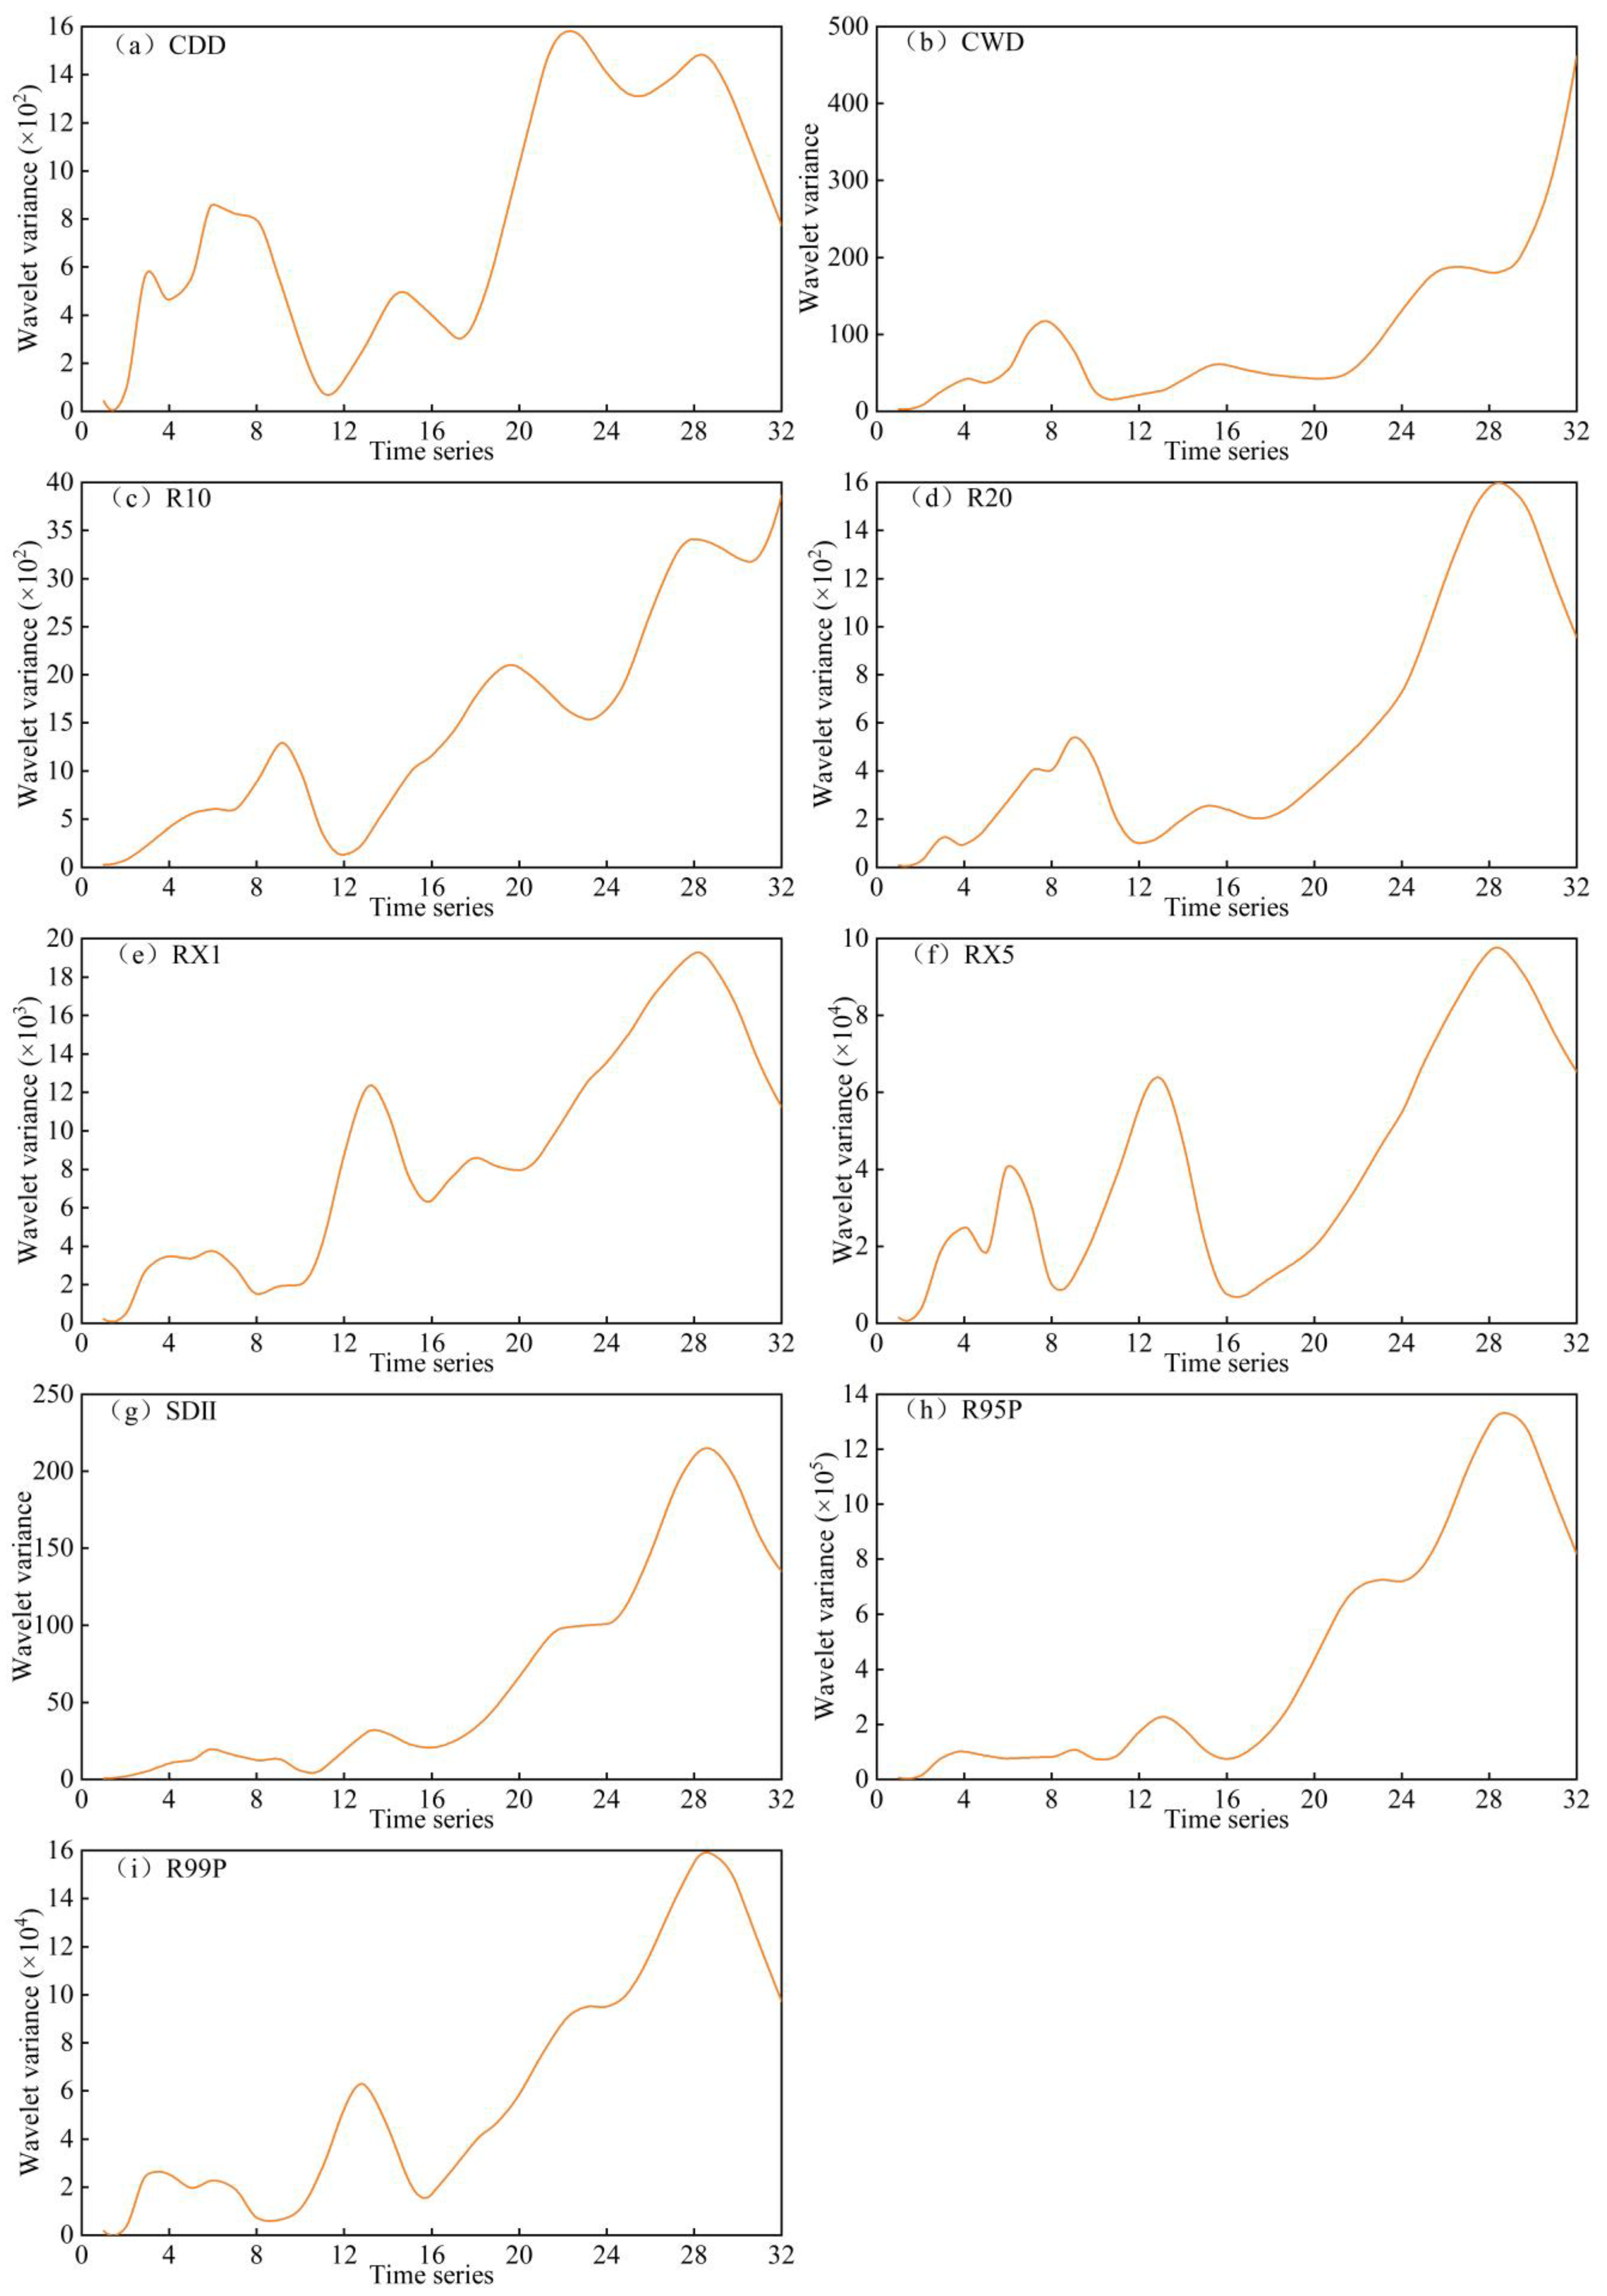
In terms of the decadal characteristics of precipitation in the study area, annual precipitation exhibits significant periodic variations, particularly at the primary timescales of 9 and 28 years. Within these cycles, precipitation has undergone pronounced wet and dry fluctuations, with the start and end points of these cycles showing strong intrinsic regularity.
(3)
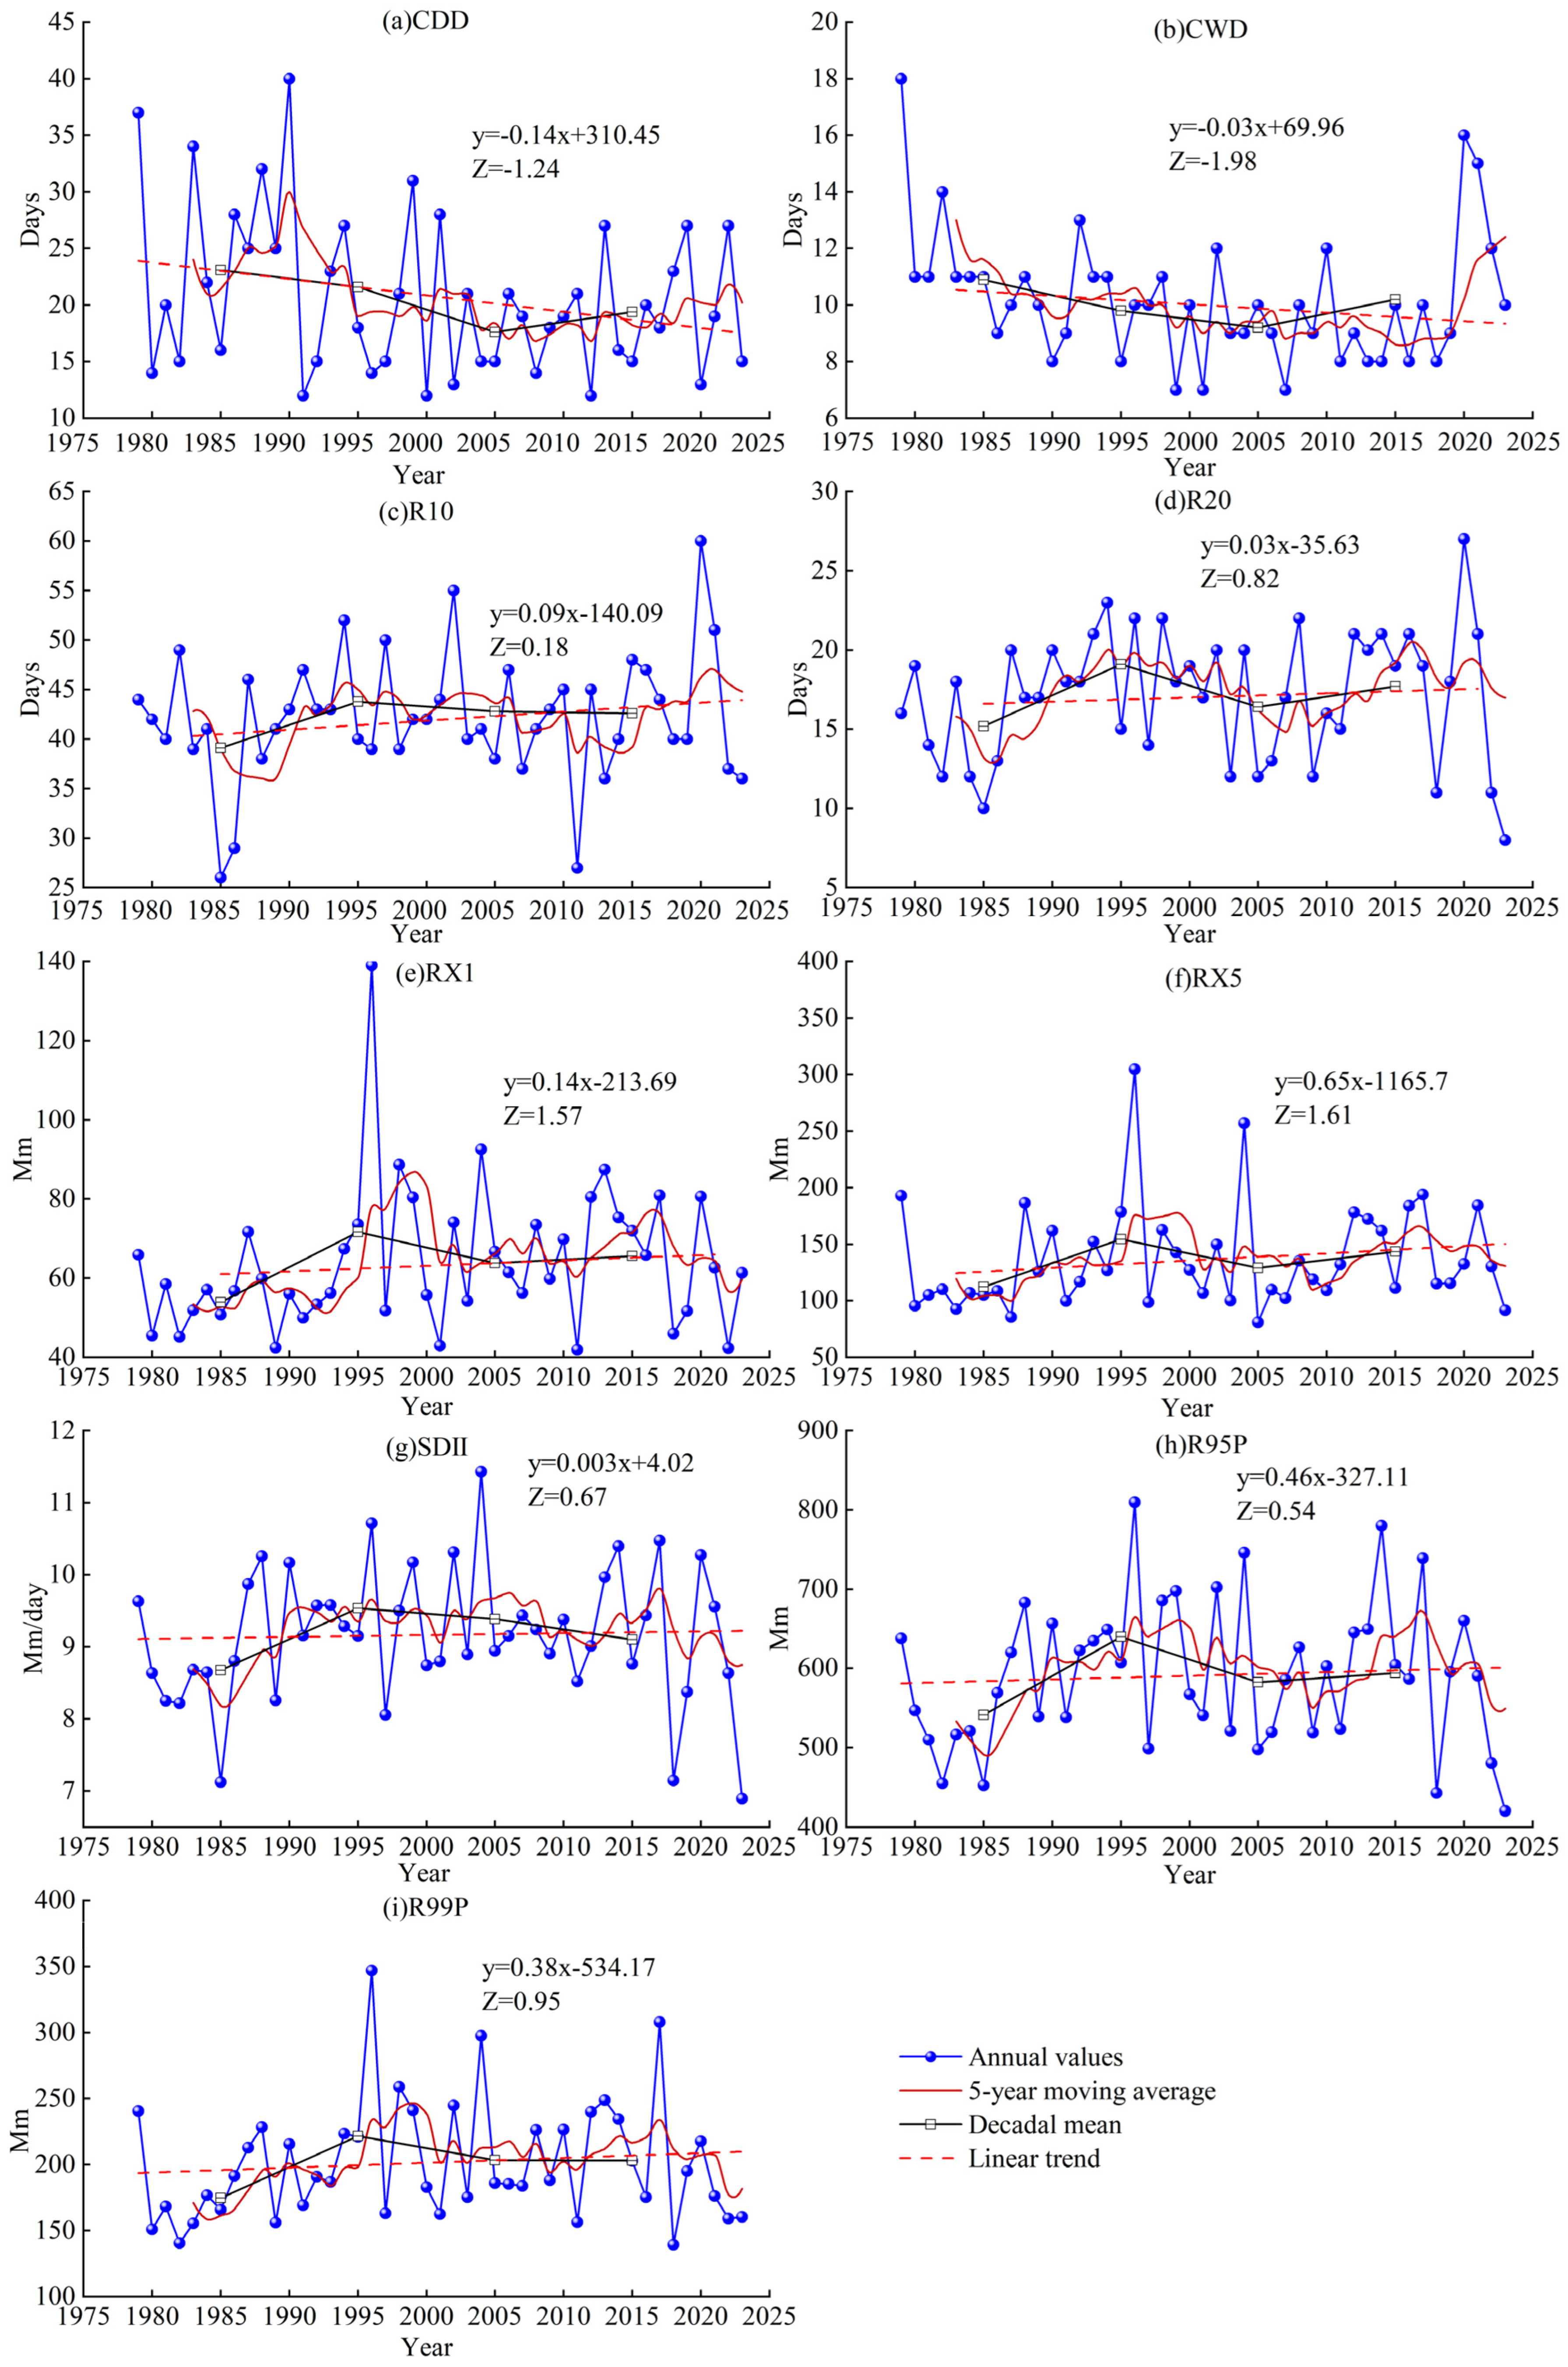
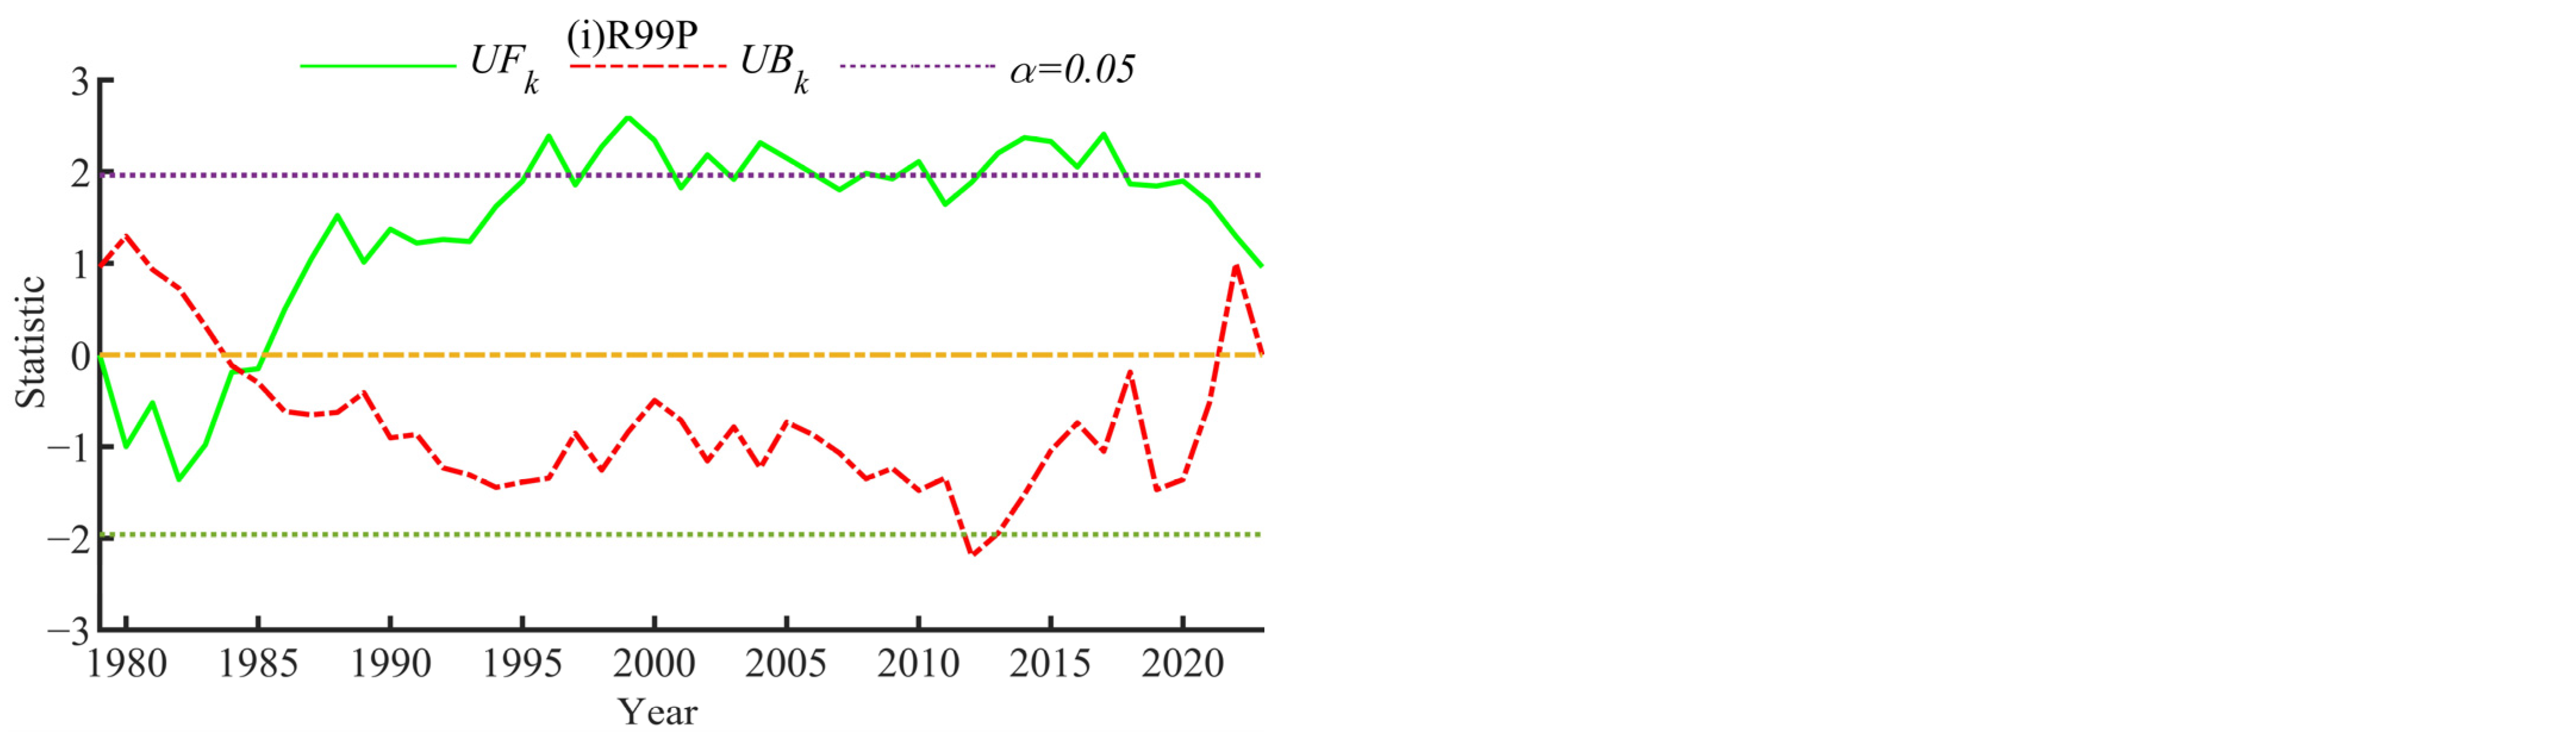
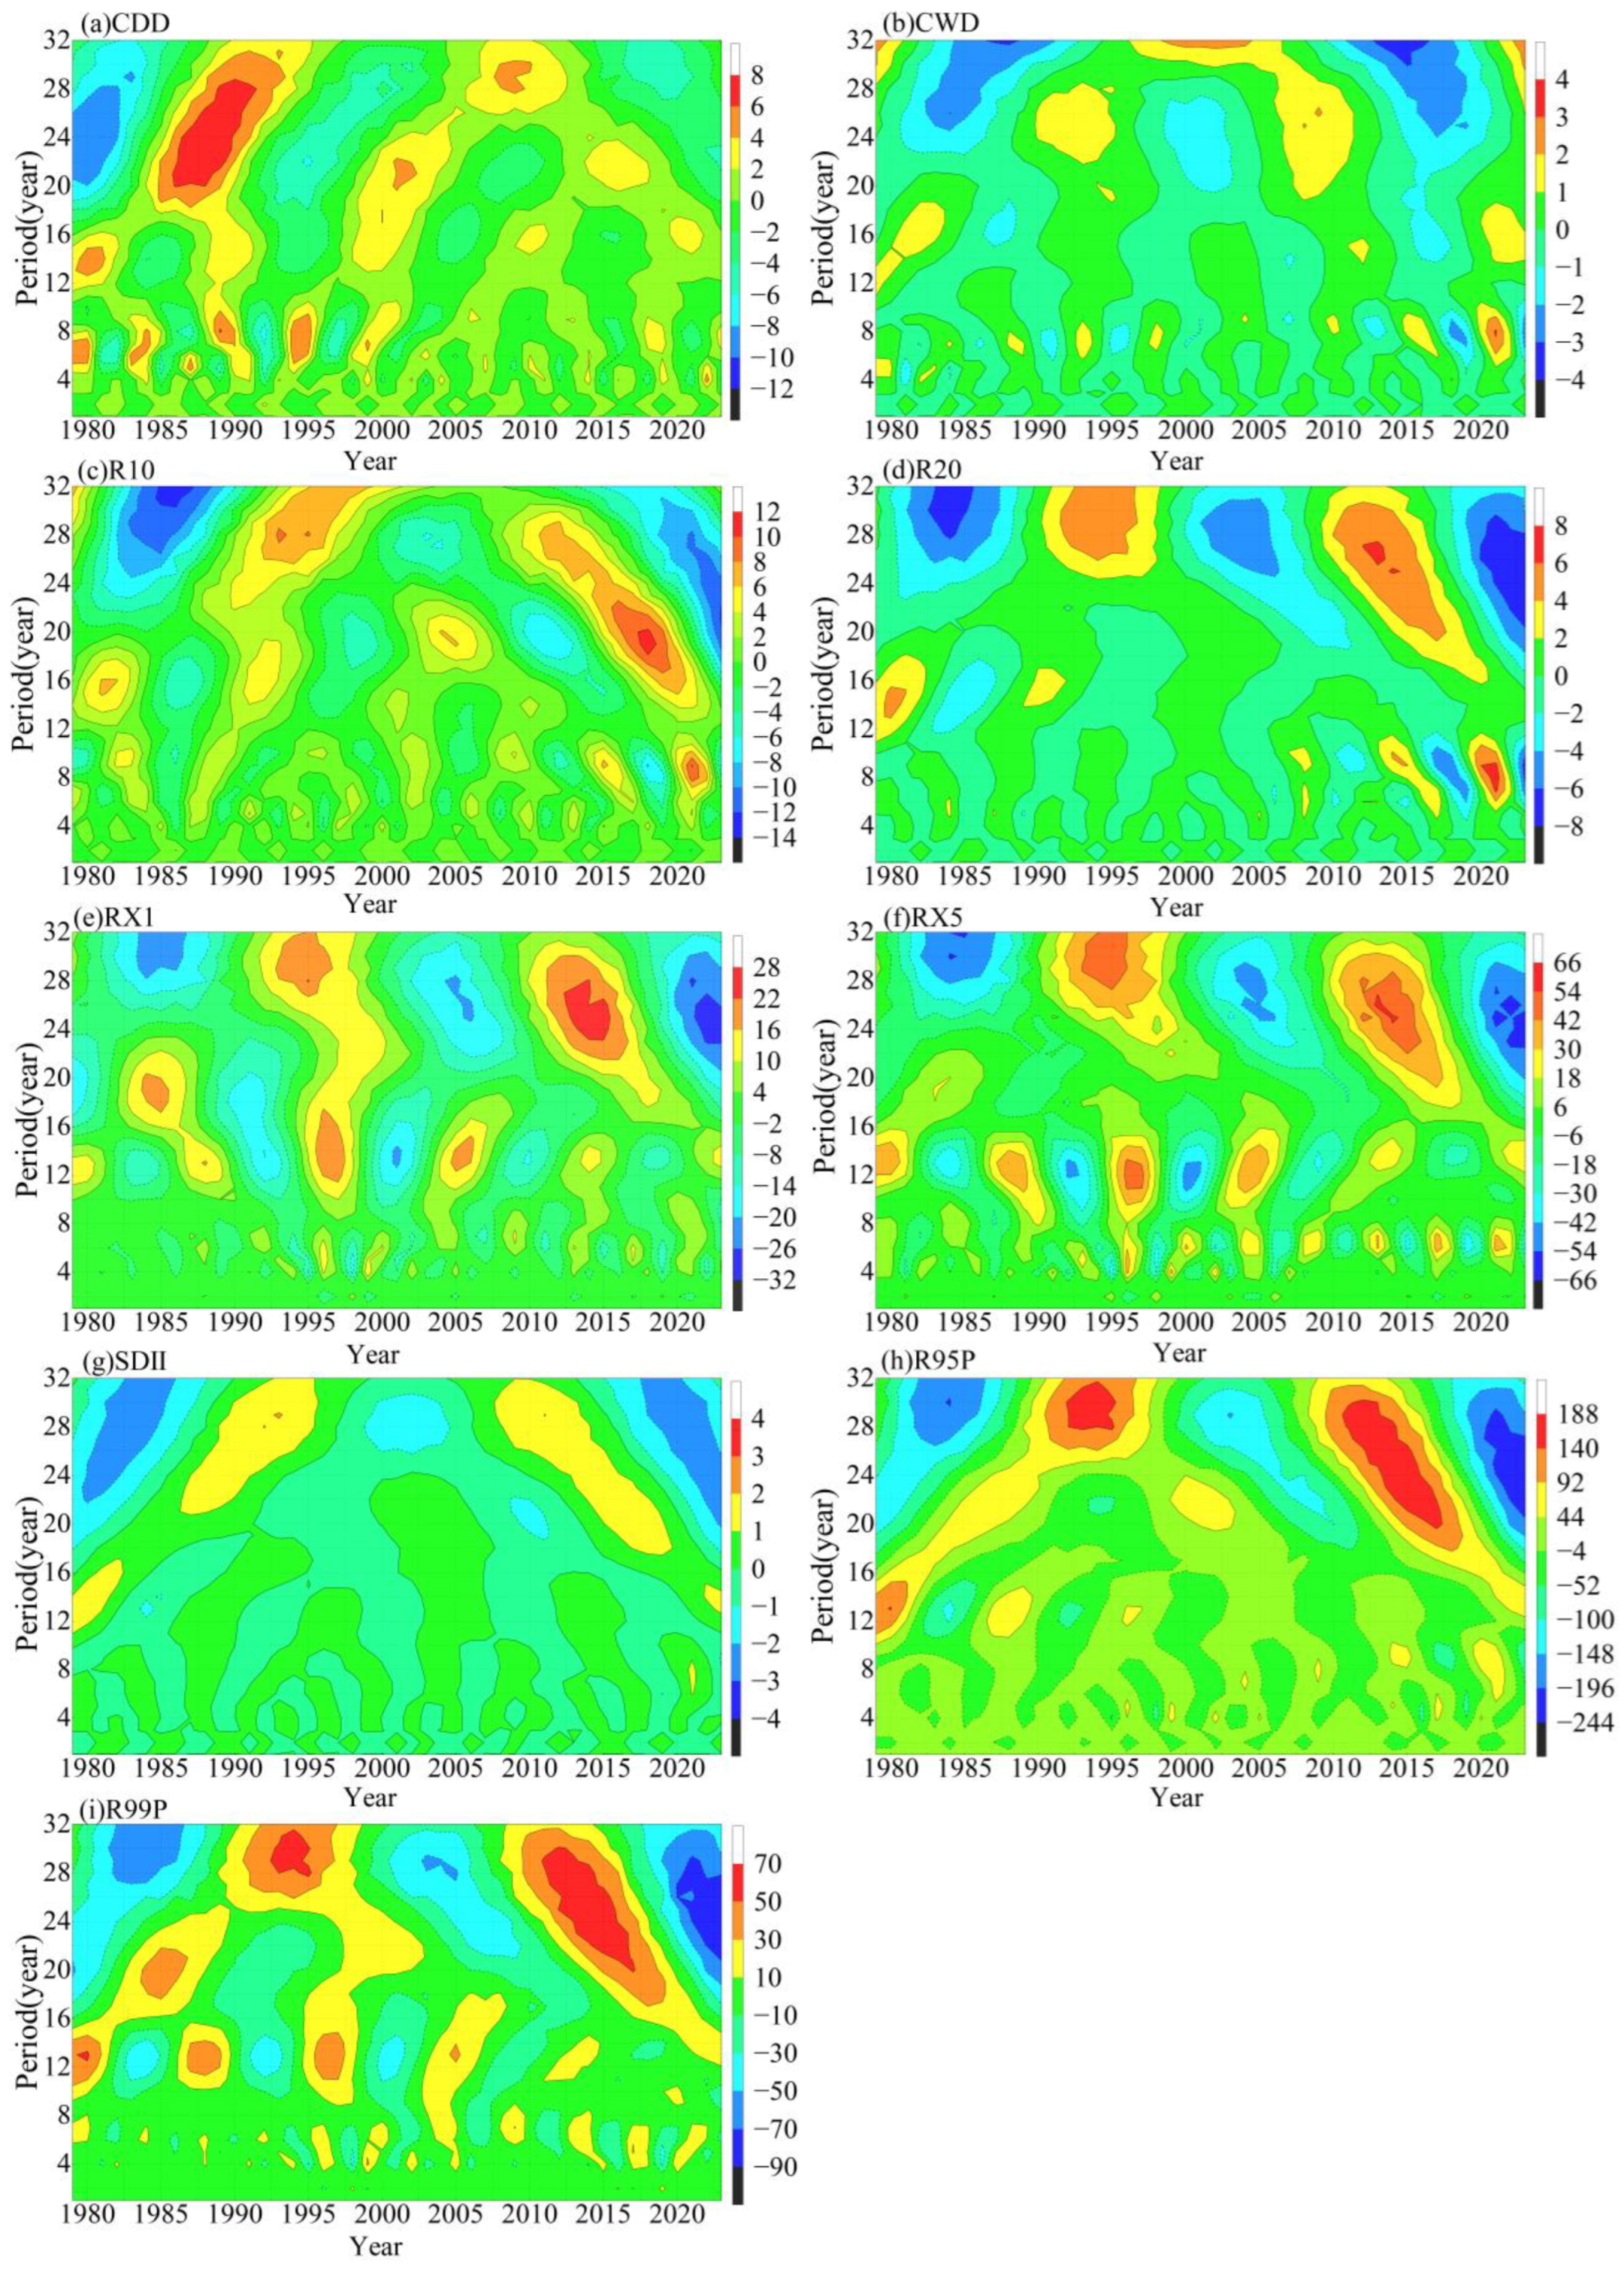
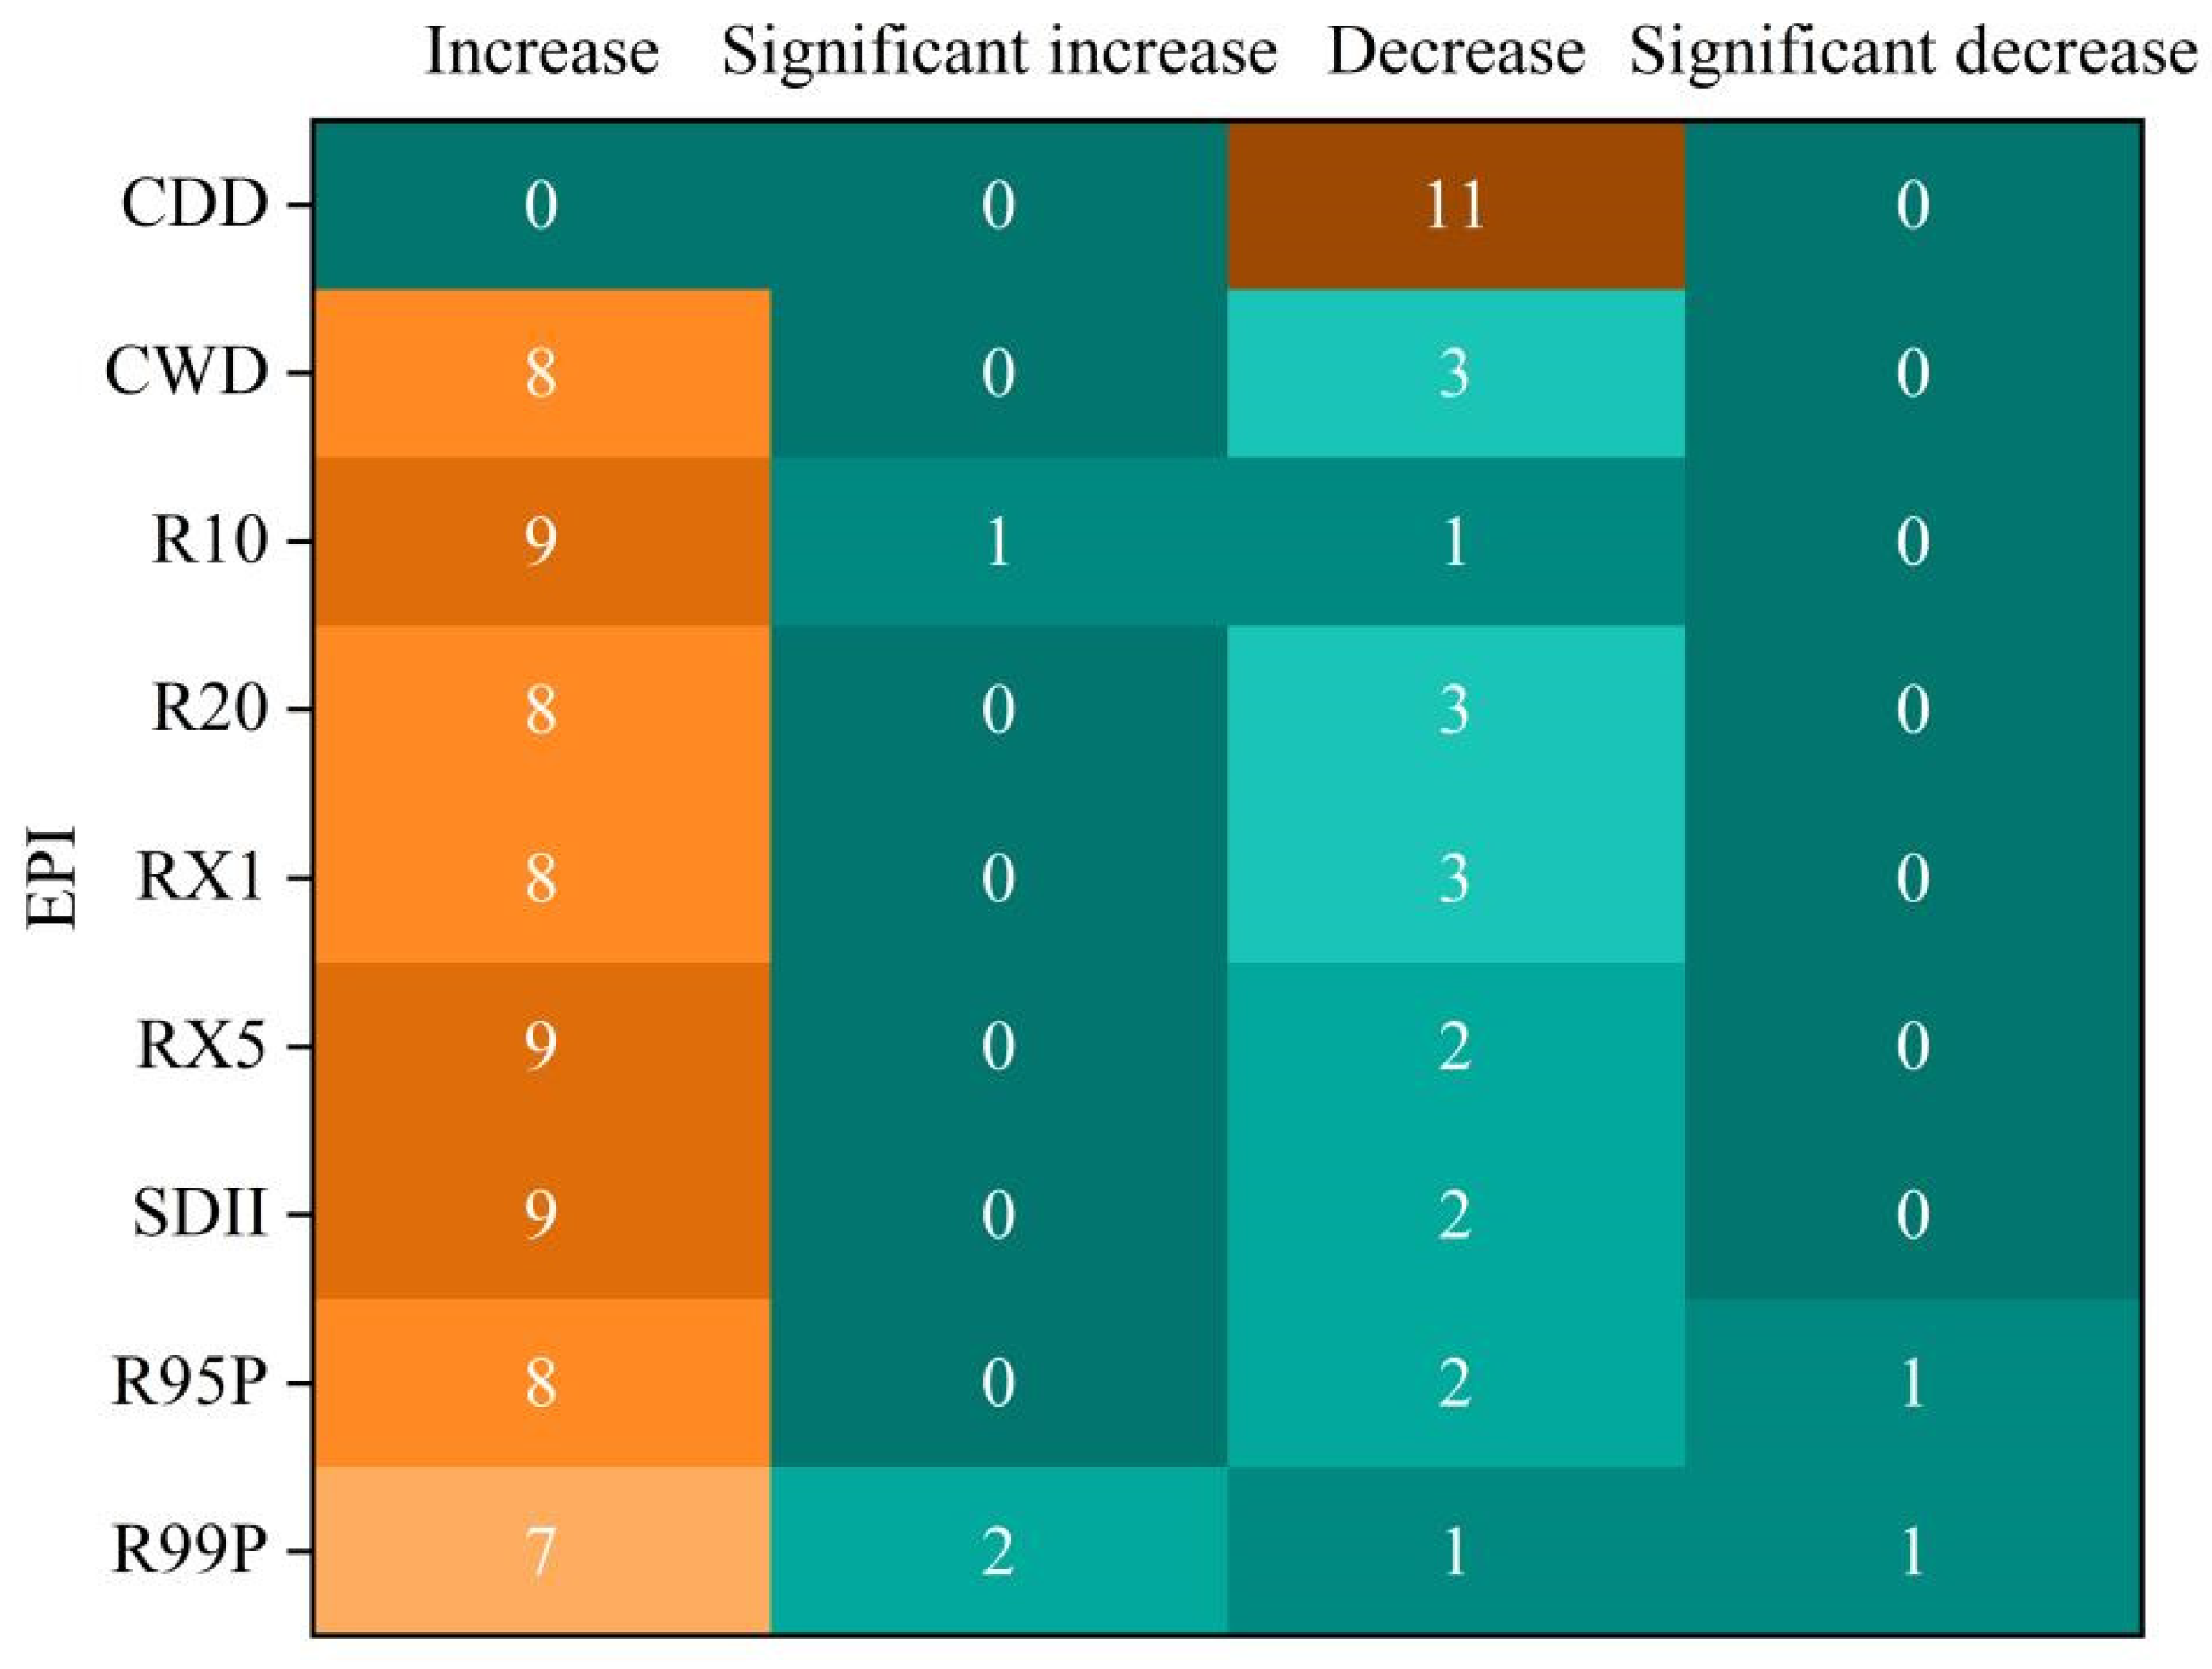
Regarding the temporal variations of EPIs in the study area, all indices exhibited an upward trend during the period 1979–2023, except for CDD and CWD. These findings are consistent with the results of Zou et al. [63] for the middle and lower reaches of the Yangtze River. Because the movement of the southwest climate front is consistent with the direction of Wuling Mountain, the area where the north and south climate fronts intersect overlaps with the distribution of Wuling Mountain, and the summer monsoon index shows significant control of and influence on the EP in the study area, resulting in significant increases in the intensity and duration of some EP events, especially in the frequency of heavy precipitation and extremely heavy precipitation [64]. Most EPIs underwent abrupt changes around 1990. CWD exhibited a significant decreasing trend, while R10, R20, RX1, RX5, R95P, and R99P showed non-significant increasing trends. Most EPIs exhibit periodic oscillations, with the oscillations of the nine indices tending to occur at low-frequency scales (around 28 years). This implies that from 1979 to 2023, the frequency of “increase–decrease” changes in each EPI has been relatively low. Studies have shown that [65] during 1970–2018, each EPI in the MLRYR exhibited frequent “increase–decrease” changes, which significantly differ from the findings of this research, which may be due to the inconsistency of the results caused by regional and local differences.
(4)
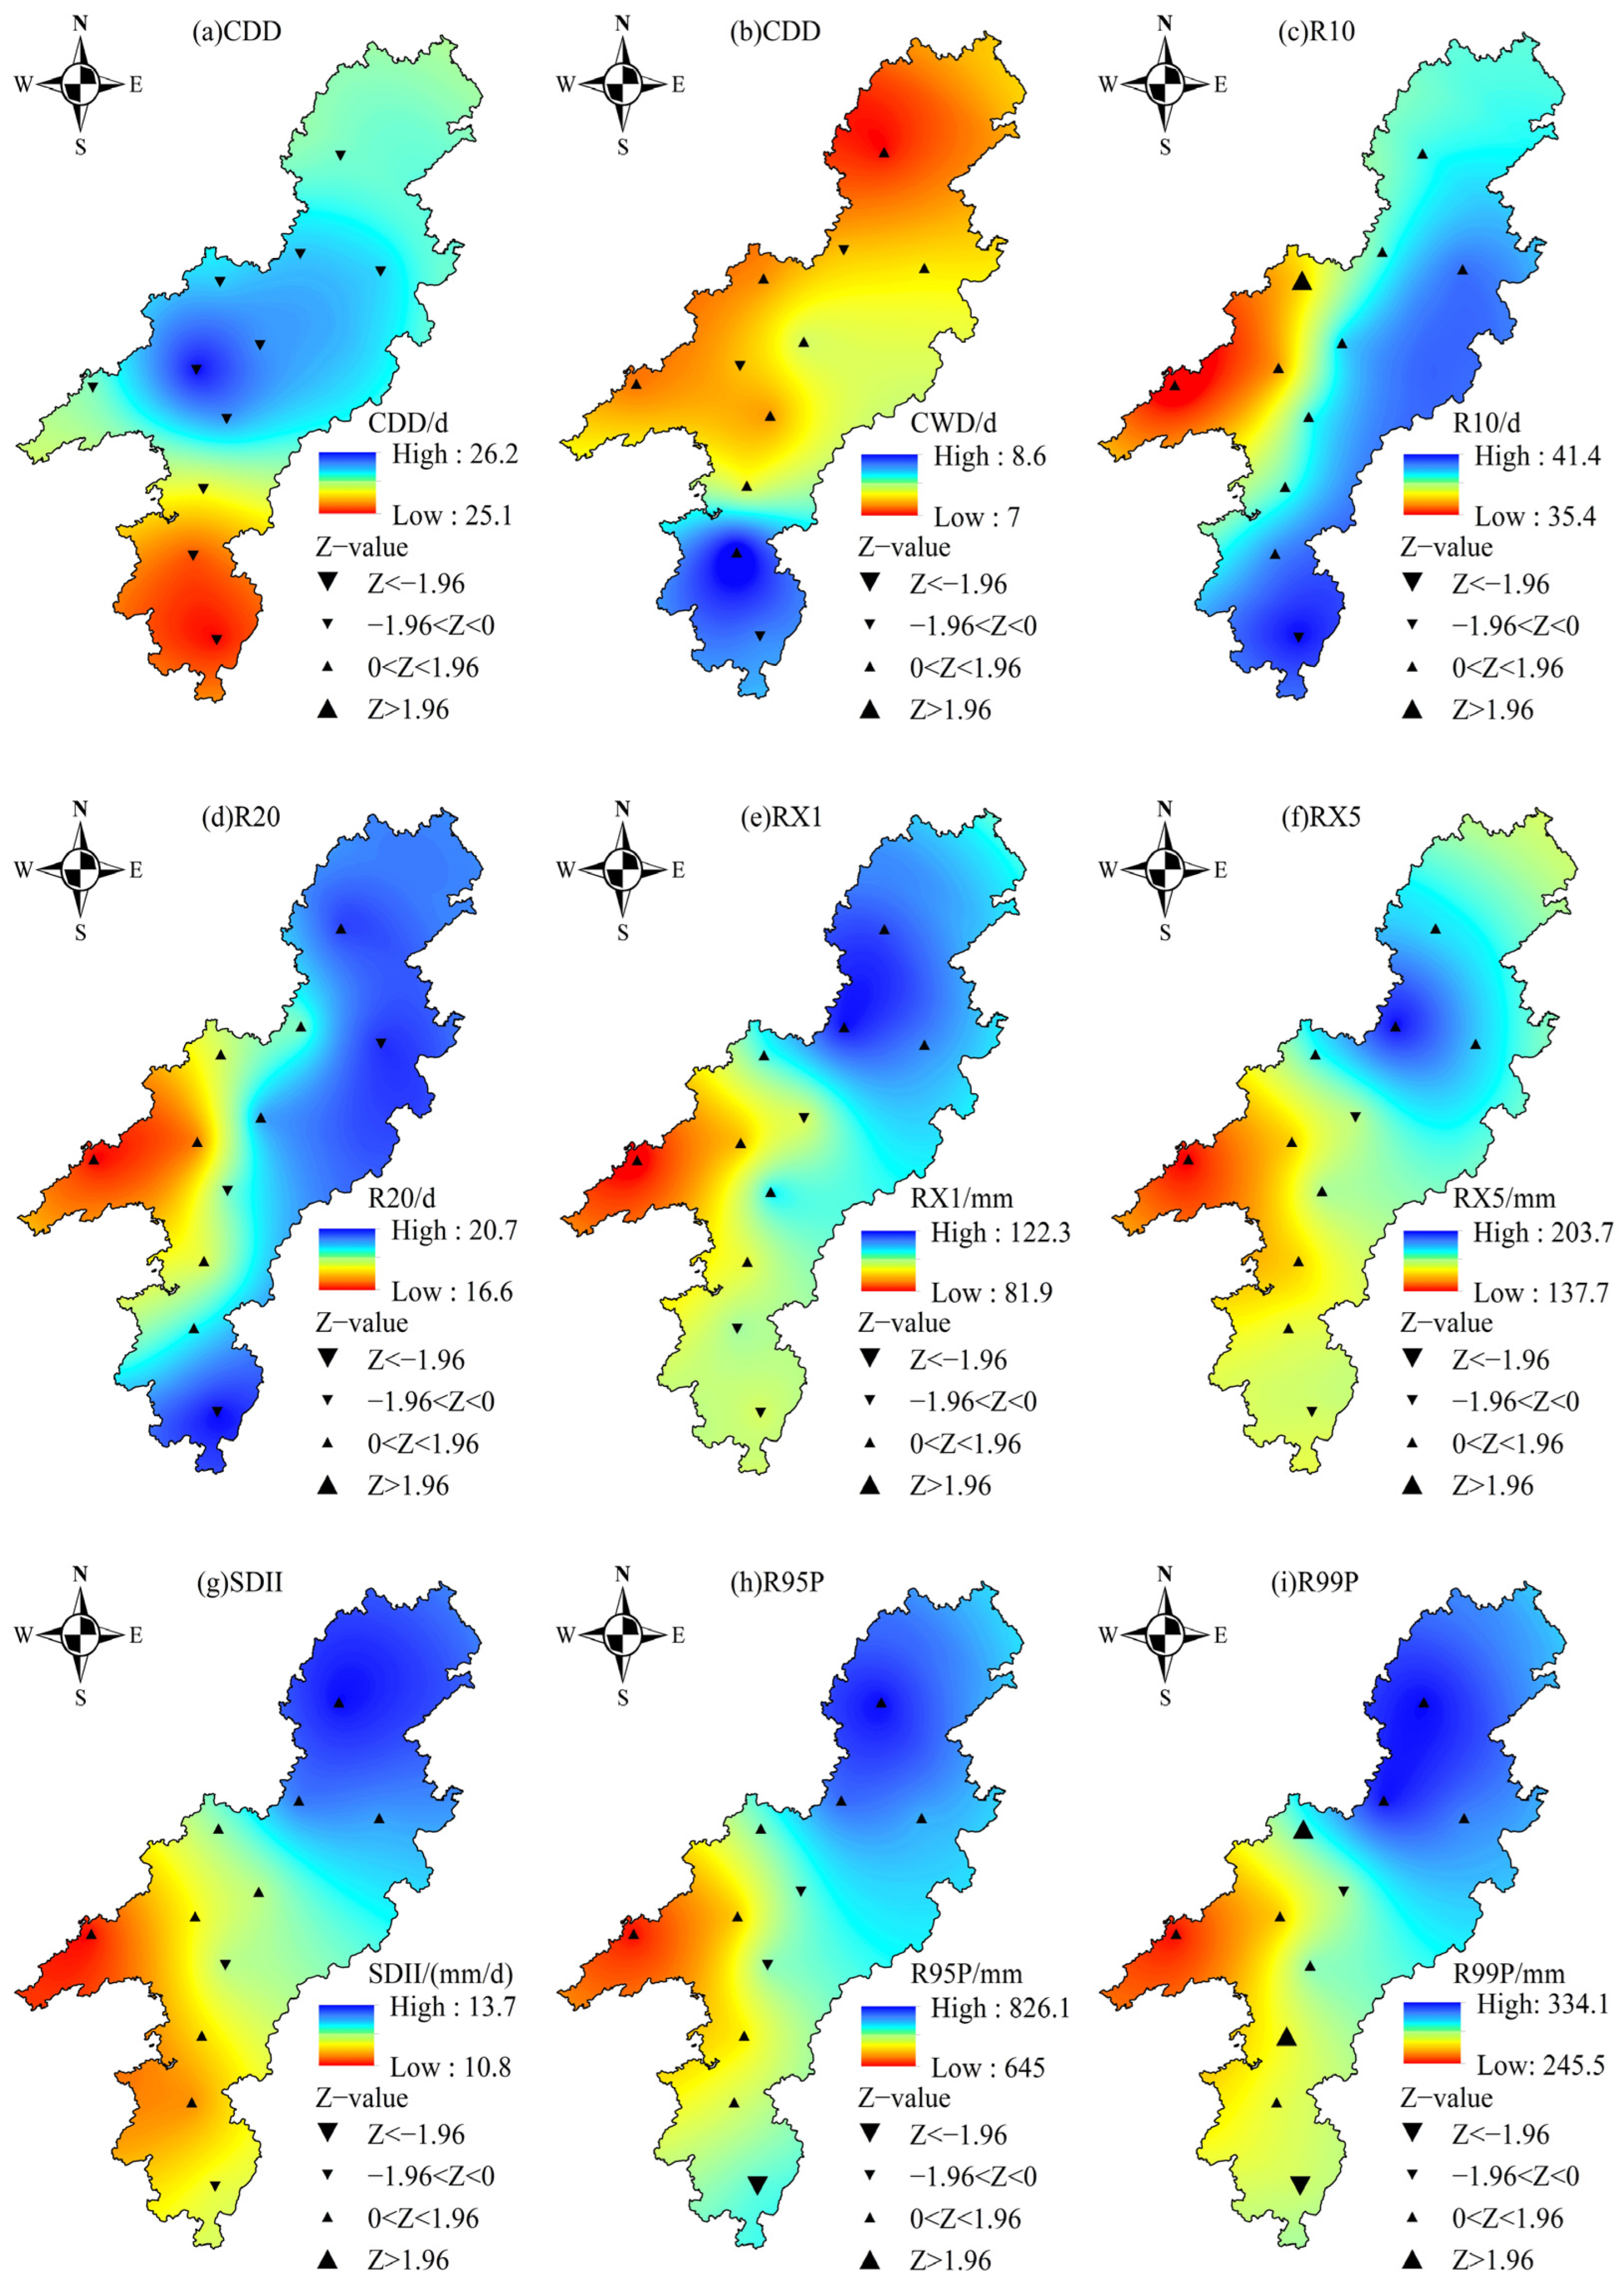
The spatial variations in EPIs in the study area indicate that indices such as R10, R20, RX1, and RX5 are more concentrated in the northeastern and southern regions, exhibiting stronger EP characteristics, while the western region remains relatively stable. EP events in the study area showed an opposite trend, exacerbating the uneven distribution of precipitation [66]. This phenomenon may be attributed to the complex interactions among geographical features, urbanization, and the climate system [67].
In summary, this study reveals the spatiotemporal variation characteristics of precipitation in the study area, especially the increasing trend of EP events, which provides an important reference for flood control, water resource management, and economic and social development planning in the convergence zone. It is worth noting that the impact of climate change and monsoon convergence on the economy and society of the convergence zone is significantly multidimensional and complex. The frequent occurrence of extreme climate events not only threatens infrastructure security, but also may lead to chain reactions such as increased ecological vulnerability, fluctuations in agricultural production, and increased public health risks, which have a profound impact on the MLRYR. In spite of this, future studies may consider incorporating more meteorological datasets, which may provide a more detailed description of the characteristics of precipitation changes in the convergence zone and provide more accurate support for climate change adaptation strategies in the convergence zone.

6. Conclusions

This study utilized precipitation data from meteorological stations and the CMFD reanalysis dataset for the study area from 1979 to 2023. The spatiotemporal variation characteristics of precipitation in the study area were analyzed by linear regression, the M-K trend test, the moving average, the Mann–Kendall–Sneyers test, wavelet analysis, and R/S analysis. The following conclusions are drawn:
(1)
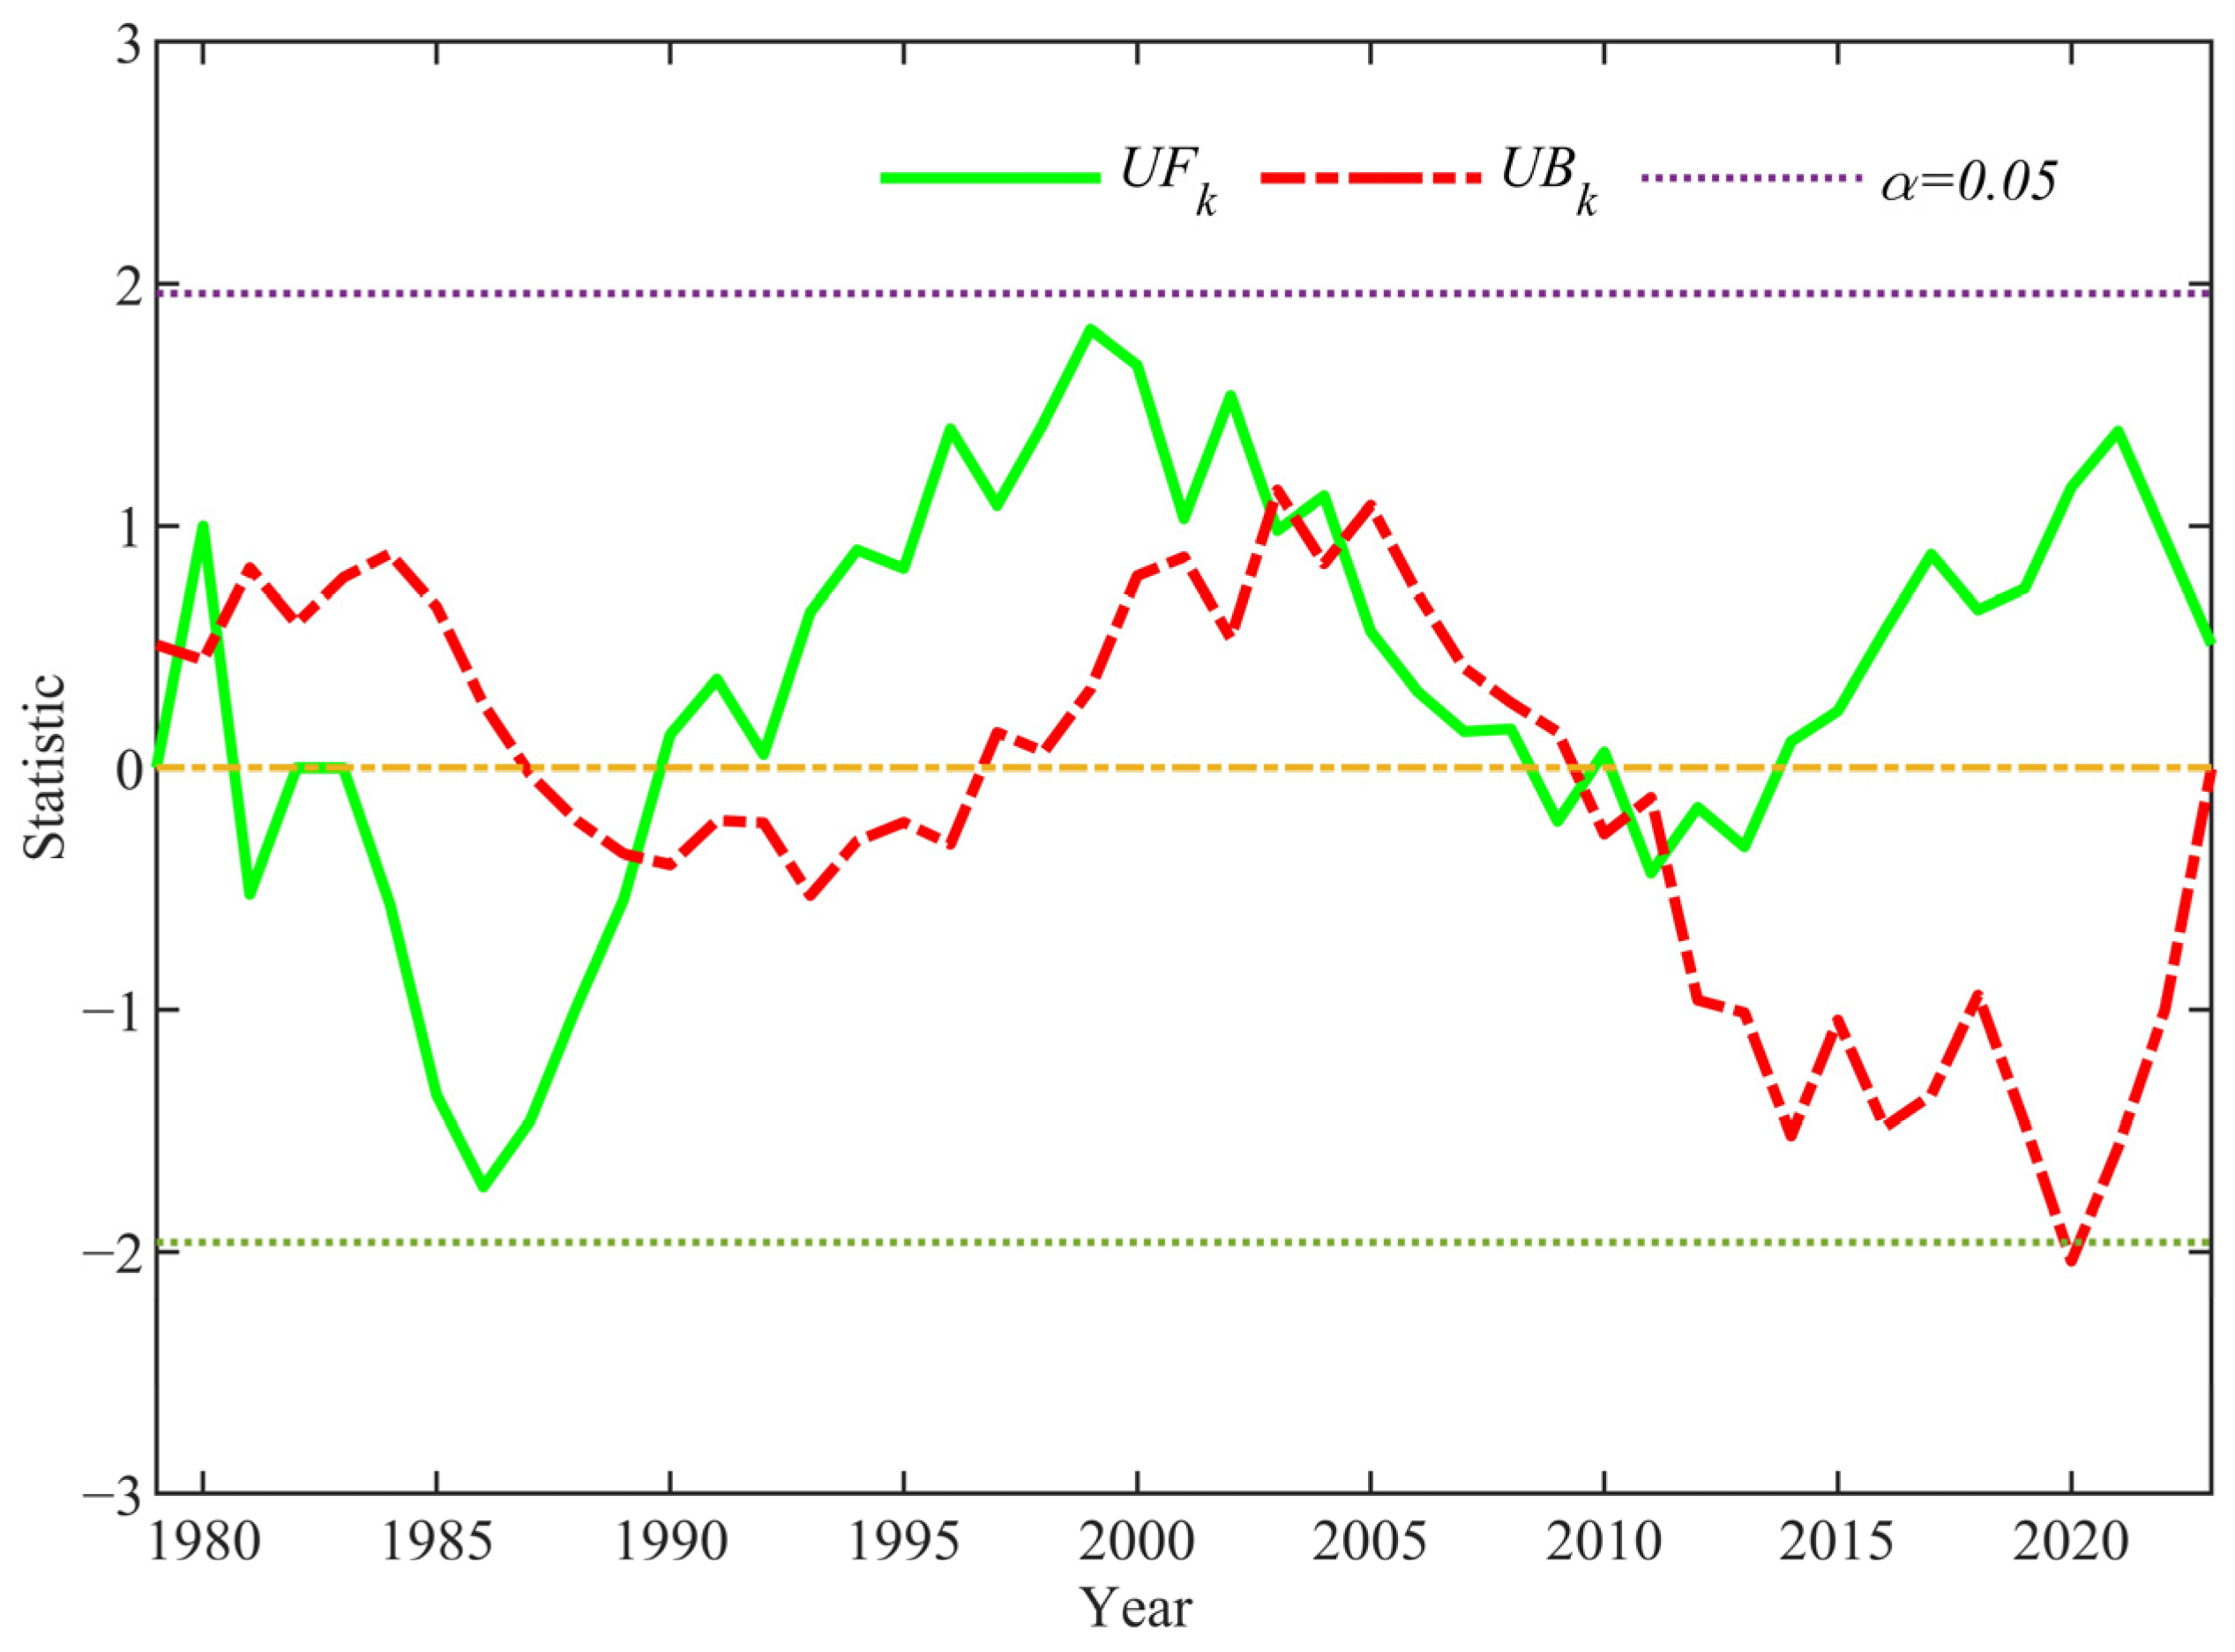
The annual precipitation for the study area exhibits an overall upward trend, with a climatic tendency rate of 9 mm/10 a. Moreover, wetter and drier years alternate, exhibiting significant periodic variations. The Mann–Kendall abrupt change detection reveals that the change in annual precipitation is not statistically significant. Although trend changes occurred during specific periods, the overall variation did not reach statistical significance.
(2)
Wavelet analysis reveals that the dominant cycles of annual precipitation are 28, 9, and 4 years, with distinct precipitation patterns observed at different timescales. Wet and dry periods at larger timescales influence variations at shorter timescales. Simultaneously, the R/S analysis results indicate that future precipitation trends will continue to rise, demonstrating strong long-term memory.
(3)
The EPIs in the study area exhibit an overall upward trend, particularly the maximum 1 day precipitation (RX1), maximum 5 day precipitation (RX5), heavy precipitation (R95P), and extreme heavy precipitation (R99P), all of which demonstrate increasing trends. The extreme drought index (CDD) and the consecutive wet days index (CWD) exhibit decreasing trends, indicating a reduction in the frequency of drought events and an increase in the occurrence of extreme heavy precipitation events.
(4)
Spatial distribution analysis reveals significant spatial heterogeneity in precipitation across the study area, with higher precipitation amounts in the northeastern part and the southern regions of Jingzhou and Tongdao, while lower amounts are observed in the western region. The spatial distribution of EP events also exhibits a similar pattern, with greater precipitation intensity in the northeastern and southern regions, whereas the western region experiences relatively lower intensity.

Author Contributions

Conceptualization, J.W. and L.Z.; methodology, D.L.; software, X.T.; validation, J.W., B.C., C.L., and H.Z.; formal analysis, C.L.; investigation, J.W. and H.P.; resources, L.Z. and H.P.; data curation, H.Z.; writing—original draft preparation, J.W.; writing—review and editing, L.Z.; visualization, D.L.; supervision, X.T. and B.C. All authors have read and agreed to the published version of the manuscript.

Funding

This research was funded by the National Natural Science Foundation of China (Grant No. 52164009), the Applied Basic Research Key Project of Yunnan Province (Grant No. 202401AS070058), and the Belt and Road Special Foundation of The National Key Laboratory of Water Disaster Prevention (Grant No. 2022490411).

Data Availability Statement

Data are contained within the article.

Conflicts of Interest

The authors declare no conflicts of interest.

References

  1. Brunsell, N.A. A multiscale information theory approach to assess spatial–temporal variability of daily precipitation. J. Hydrol. 2010, 385, 165–172. [Google Scholar] [CrossRef]
  2. Zhang, A.; Zhao, X. Changes of precipitation pattern in China: 1961–2010. Theor. Appl. Climatol. 2022, 148, 1005–1019. [Google Scholar] [CrossRef]
  3. Kumar, A.; Singh, O. Unraveling the variability and geoclimatic drivers of daily precipitation concentration over a Western Himalayan Province of India. Environ. Monit. Assess. 2025, 197, 20. [Google Scholar] [CrossRef] [PubMed]
  4. Qin, D.H. Climate change science and sustainable development. Prog. Geogr. 2014, 33, 874–883. [Google Scholar]
  5. Chen, X.; Wang, L.; Niu, Z.; Zhang, M.; Li, J. The effects of projected climate change and extreme climate on maize and rice in the Yangtze River Basin, China. Agric. For. Meteorol. 2020, 282, 107867. [Google Scholar] [CrossRef]
  6. Li, J.Q.; Chen, S.Y. An analysis of precipitation spatiotemporal characteristics in Xijiang River Basin based on ESMD. China Rural. Water Hydropower 2021, 6, 61–68. [Google Scholar]
  7. Li, Z.; Li, X.; Wang, Y.; Quiring, S.M. Impact of climate change on precipitation patterns in Houston, Texas, USA. Anthropocene 2019, 25, 100193. [Google Scholar] [CrossRef]
  8. IPCC. Climate Change 2021: The Physical Science Basis. In Contribution of Working Group I to the Sixth Assessment Report of the Intergovernmental Panel on Climate Change; Cambridge University Press: Cambridge, UK; New York, NY, USA, 2023; pp. 423–552. [Google Scholar]
  9. Hu, X.H.; Zuo, D.P. Variation analysis on the characteristics of stormflood in Yuehe River basin, Shaannan mountain area. China Flood Drought Manag. 2022, 32, 82–88. [Google Scholar]
  10. Zhang, W.; Zhou, T. Significant increases in extreme precipitation and the associations with global warming over the global land monsoon regions. J. Clim. 2019, 32, 8465–8488. [Google Scholar] [CrossRef]
  11. Greve, P.; Orlowsky, B.; Mueller, B.; Sheffield, J.; Reichstein, M.; Seneviratne, S.I. Global assessment of trends in wetting and drying over land. Nat. Geosci. 2014, 7, 716–721. [Google Scholar] [CrossRef]
  12. Donat, M.G.; Lowry, A.L.; Alexander, L.V.; O’Gorman, P.A.; Maher, N. More extreme precipitation in the world’s dry and wet regions. Nat. Clim. Change 2016, 6, 508–513. [Google Scholar] [CrossRef]
  13. Karl, T.R.; Knight, R.W. Secular Trends of Precipitation Amount, Frequency, and Intensity in the United States. Bull. Am. Meteorol. Soc. 1998, 79, 231–242. [Google Scholar] [CrossRef]
  14. Zhang, X.; Vincent, L.A.; Hogg, W.D.; Niitsoo, A. Temperature and precipitation trends in Canada during the 20th century. Atmos. Ocean. 2000, 38, 395–429. [Google Scholar] [CrossRef]
  15. Cotterill, D.; Stott, P.; Christidis, N.; Kendon, E. Increase in the frequency of extreme daily precipitation in the United Kingdom in autumn. Weather. Clim. Extrem. 2021, 33, 100340. [Google Scholar] [CrossRef]
  16. Romero, R.; Guijarro, J.A.; Ramis, C.; Alonso, S. A 30-year (1964–1993) daily rainfall data base for the Spanish Mediterranean regions: First exploratory study. Int. J. Climatol. 1998, 18, 541–560. [Google Scholar] [CrossRef]
  17. Cruz, F.T.; Narisma, G.T.; Villafuerte, M.Q., II; Chua, K.C.; Olaguera, L.M. A climatological analysis of the southwest monsoon rainfall in the Philippines. Atmos. Res. 2013, 122, 609–616. [Google Scholar] [CrossRef]
  18. Li, F.; Zhang, M.J.; Li, X.F.; Wang, B.L.; Wang, S.J.; Wang, Q. Variation characteristics of different-level precipitation in Ningxia of Southwest China in 1962–2011. Chin. J. Ecol. 2013, 32, 2154. [Google Scholar]
  19. Wang, X.L.; Zhai, P.M. Changes in in China’s precipitation in various categories during 1957~2004. J. Trop. Meteorol. 2008, 24, 459–466. [Google Scholar]
  20. Li, Q.; Peng, J.; Shen, Y. Development of China homogenized monthly precipitation dataset during 1900–2009. J. Geogr. Sci. 2012, 22, 579–593. [Google Scholar] [CrossRef]
  21. Ren, G.Y.; Ren, Y.Y.; Zhan, Y.J.; Sun, X.B.; Liu, Y.J.; Chen, Y.; Wang, T. Spatial and temporal patterns of precipitation variability over mainland China: II: Recent trends. Adv. Water Sci. 2015, 26, 451–465. [Google Scholar]
  22. Cai, Y.Q.; Li, W.H.; Yu, X.Z.; Li, Q.J. Temporal and Spatial Evolution of Precipitation in the Headwaters of the Yangtze River. J. Yangtze River Sci. Res. Inst. 2022, 39, 28–35. [Google Scholar]
  23. Zhang, J.P.; Zhang, H. Spatio-temporal variation characteristics of precipitation in the Yellow River Basin. China Rural. Water Hydropower 2022, 3, 60–68. [Google Scholar]
  24. Sun, J.; Ao, J. Changes in precipitation and extreme precipitation in a warming environment in China. Chin. Sci. Bull. 2013, 58, 1395–1401. [Google Scholar] [CrossRef]
  25. Han, J.; Zhang, R.; Guo, B.; Han, B.; Xu, T.; Guo, Q. Long-Term Variation Patterns of Precipitations Driven by Climate Change in China from 1901 to 2022. Sustainability 2024, 16, 7283. [Google Scholar] [CrossRef]
  26. Lu, S.; Bai, X.; Zhang, X.; Li, W.; Tang, Y. The impact of climate change on the sustainable development of regional economy. J. Clean. Prod. 2019, 233, 1387–1395. [Google Scholar] [CrossRef]
  27. Kalogiannidis, S.; Kalfas, D.; Papaevangelou, O.; Chatzitheodoridis, F.; Katsetsiadou, K.; Lekkas, E. Integration of Climate Change Strategies into Policy and Planning for Regional Development: A Case Study of Greece. Land 2024, 13, 268. [Google Scholar] [CrossRef]
  28. Lv, X.D. Climate change has serious implications for the economic and social development of the country. Impact Sci. Soc. 2010, 1, 41–45. [Google Scholar]
  29. Wu, S.H. Research progress in climate change impact, risk, and adaptation: An interpretation of Part 2 of China’s Fourth National Assessment Report on Climate Change. China Popul. Resour. Environ. 2023, 33, 80–86. [Google Scholar]
  30. Dong, S.C.; Tao, S.; Yang, W.Z.; Li, Z.H.; Li, Y. The impacts of climate change on urban agglomeration in central and westernregion of China. J. Arid. Land. Res. Environ. 2011, 25, 72–76. [Google Scholar]
  31. Zhang, X.N.; Luo, J.; Chen, L.; Li, H. Zoning of Chinese flood hazard risk. J. Hydraul. Eng. 2000, 3, 3–9. [Google Scholar]
  32. Jiang, T.; Shi, Y.F. Global climatic waring, the Yangtze floods and potential loss. Adv. Earth Sci. 2003, 18, 277–284. [Google Scholar]
  33. Chen, H.S.; Fan, S.D.; Zhang, H.X. Seasonal Differences of Variation Characteristics of Extreme Precipitation Events over China in the Last 50 Years. Trans. Atmo Sci. 2009, 32, 744–751. [Google Scholar]
  34. Gao, T.; Xie, L.A. Study on progress of the trends and physical causes of extreme precipitation in China during the last 50 years. Adv. Earth Sci. 2014, 29, 577–589. [Google Scholar]
  35. Gao, J.; Li, H.H.; Yao, P.; He, D.M.; Nian, A.B. Study on the water vapor convergence area and its spatial differentiation between the Indian Ocean and the Pacific Ocean in summer in the Northern Hemisphere. Progr. Nat. Sci. 2009, 19, 302–309. [Google Scholar]
  36. Li, X.J.; Zhu, B.Q. Interaction Between the Westerlies and Asian Monsoons in the Middle Latitudes of China: Review and Prospect. Atmosphere 2024, 15, 274. [Google Scholar] [CrossRef]
  37. Lin, Y.; Zhao, C. Trends of precipitation of different intensity in China. Acta Sci. Nat. Univ. Pekin. 2009, 45, 995–1002. [Google Scholar]
  38. Yang, X.L.; Ding, W.K.; Guo, L.M. Analysis on the basic characteristics of precipitation in the East Hexi Corridor. Arid. Zone Res. 2010, 27, 663–668. [Google Scholar]
  39. Xu, M.; Tan, Y.; Shi, C.; Xing, Y.; Shang, M.; Wu, J.; Yang, Y.; Du, J.; Bai, L. Spatiotemporal Patterns of Typhoon-Induced Extreme Precipitation in Hainan Island, China, 2000–2020, Using Satellite-Derived Precipitation Data. Atmosphere 2024, 15, 891. [Google Scholar] [CrossRef]
  40. Wang, L.J.; Zhang, X.N.; Fang, Y.H.; Xia, D.Z. Applicability Assessment of China Meteorological Forcing Dataset in Upper Yangtze River Basin. Water Power 2017, 43, 18–22. [Google Scholar]
  41. Huang, Q.; Wang, R.M.; Xiang, J.Y.; Qin, G.H. Spatial and Temporal Applicability of Three Precipitation Products in the Yalong River Basin. J. China Hydrol. 2020, 40, 14–21. [Google Scholar]
  42. Ren, M.; Xu, Z.; Pang, B.; Liu, W.; Liu, J.; Du, L.; Wang, R. Assessment of satellite-derived precipitation products for the Beijing region. Remote Sens. 2018, 10, 1914. [Google Scholar] [CrossRef]
  43. Li, Y.; Pang, B.; Ren, M.; Shi, S.; Peng, D.; Zhu, Z.; Zuo, D. Evaluation of performance of three satellite-derived precipitation products in capturing extreme precipitation events over Beijing, China. Remote Sens. 2022, 14, 2698. [Google Scholar] [CrossRef]
  44. He, Q.; Yang, J.; Chen, H.; Liu, J.; Ji, Q.; Wang, Y.; Tang, F. Evaluation of extreme precipitation based on three long-term gridded products over the Qinghai-Tibet Plateau. Remote Sens. 2021, 13, 3010. [Google Scholar] [CrossRef]
  45. Zhang, L.; Gao, L.; Chen, J.; Zhao, L.; Zhao, J.; Qiao, Y.; Shi, J. Comprehensive evaluation of mainstream gridded precipitation datasets in the cold season across the Tibetan Plateau. J. Hydrol. Reg. Stud. 2022, 43, 101186. [Google Scholar] [CrossRef]
  46. Wen, T.T.; Guo, Y.X.; Dong, S.R.; Dong, Y.Z.; Lai, X.L. Assessment of CRU, ERA5, CMFD grid precipitation data for the Tibetan Plateau from 1979 to 2017. Arid. Zone Res. 2022, 39, 684–697. [Google Scholar]
  47. Luo, B.L.; Zhang, C.; Lin, H. Characteristics of Climatic Changes and Catastrophe of Extreme Precipitation in Hunan in Recent 40 Years. Meteorol. Mon. 2008, 34, 80–85. [Google Scholar]
  48. Zhang, K.; Li, X.L.; Zhang, Q.J.; Li, L.; Pei, W.X. Temporal and Spatial Variation Characteristics of Temperature and Precipitation GIS in Huaihua City During 1981–2010. Guizhou Agri. Sci. 2014, 42, 107–111. [Google Scholar]
  49. Pu, H.Z. Exploration and practice of mountain flood disaster prevention in Huaihua City, Hunan Province. China Flood Drought Manag. 2023, 33, 64–67. [Google Scholar]
  50. He, J.; Yang, K.; Tang, W.; Lu, H.; Qin, J.; Chen, Y.; Li, X. The first high-resolution meteorological forcing dataset for land process studies over China. Sci. Data 2020, 7, 25. [Google Scholar] [CrossRef]
  51. Yang, K.; He, J.; Tang, W.; Qin, J.; Cheng, C.C. On downward shortwave and longwave radiations over high altitude regions: Observation and modeling in the Tibetan Plateau. Agric. For. Meteorol. 2010, 150, 38–46. [Google Scholar] [CrossRef]
  52. Mann, H.B. Non-parametric test against trend. Econometrica 1945, 13, 245–259. [Google Scholar] [CrossRef]
  53. Kendall, M.G. Rank Correlation Methods; Oxford University Press: Oxford, UK, 1948. [Google Scholar]
  54. Kumar, V.; Jain, S.K. Trends in seasonal and annual rainfall and rainy days in Kashmir Valley in the last century. Quatern Int. 2010, 212, 64–69. [Google Scholar] [CrossRef]
  55. Han, G. Analysis on Climate Change of the Qinghai-Tibet Plateau in the Recent 50 Years. Master’s Thesis, Chengdu University of Technology, Chengdu, China, 2012. [Google Scholar]
  56. Khan, A.; Hassan, D.; Raza, S.M.M.; Amjad, M.; Mian, K. Applications of wavelet transform in climatic time series: A case study of Gilgit-Baltistan, Pakistan. Int. J. Environ. Sci. Technol. 2025. [Google Scholar] [CrossRef]
  57. Makarava, N.; Menz, S.; Theves, M.; Huisinga, W.; Beta, C.; Holschneider, M. Quantifying the degree of persistence in random amoeboid motion based on the Hurst exponent of fractional Brownian motion. Phys. Rev. E 2014, 90, 42703. [Google Scholar] [CrossRef]
  58. Karl, T.R.; Nicholls, N.; Ghazi, A. Clivar/GCOS/WMO workshop on indices and indicators for climate extremes workshop summary. Clim. Change 1999, 42, 3–7. [Google Scholar] [CrossRef]
  59. Wu, P.; Ding, Y.H.; Liu, Y.J. A new study of EI Nino impacts on summertime water vapor transport and rainfall in China. Acta Meteorol. Sin. 2017, 75, 371–383. [Google Scholar]
  60. Chang, C.P.; Zhang, Y.; Li, T. Interannual and interdecadal variations of the East Asian summer monsoon and tropical Pacific SSTs. Part II: Meridional structure of the monsoon. J. Clim. 2000, 13, 4326–4340. [Google Scholar] [CrossRef]
  61. Zhang, S.; Ren, G.; Zhan, Y.; Zhang, C.; Ren, Y. Extreme precipitation changes over the Yangtze River Basin in 1901–2020. Clim. Res. 2023, 90, 59–76. [Google Scholar] [CrossRef]
  62. Liu, N.; Jiang, W.; Huang, L.; Li, Y.; Zhang, C.; Xiao, X.; Huang, Y. Evolution of Sustainable Water Resource Utilization in Hunan Province, China. Water 2022, 14, 2477. [Google Scholar] [CrossRef]
  63. Zou, L.; Xia, J.; Zhang, Y. Spatial-temporal Characteristics of Extreme Precipitation in the Middle and Lower Reaches of the Yangtze River. Resour. Environ. Yangtze Basin 2021, 30, 1264–1274. [Google Scholar]
  64. Chen, A.; He, X.; Guan, H.; Cai, Y. Trends and periodicity of daily temperature and precipitation extremes during 1960–2013 in Hunan Province, central south China. Theor. Appl. Climatol. 2018, 132, 71–88. [Google Scholar] [CrossRef]
  65. Wu, S.; Hu, Z.; Wang, Z.; Cao, S.; Yang, Y.; Qu, X.; Zhao, W. Spatiotemporal variations in extreme precipitation on the middle and lower reaches of the Yangtze River Basin (1970–2018). Quatern Int. 2021, 592, 80–96. [Google Scholar] [CrossRef]
  66. Yang, J.; Huang, Y.; Li, G.; Li, Y. Changes of extreme precipitation in the middle and lower reaches of the Yangtze River and their correlation with atmospheric circulation. Front. Earth Sci. 2023, 11, 1162220. [Google Scholar] [CrossRef]
  67. Wu, L.; Ye, A.; Wang, Y.; Li, Q.; Zhan, S. Urbanization influence on changes of extreme precipitation in mainland China. Glob. Planet. Change 2025, 246, 104720. [Google Scholar] [CrossRef]
Figure 1. Spatial distribution of meteorological stations in the study area.
Water 17 01812 g001
Figure 2. The variation trend in average annual precipitation for the study area during 1979–2023. (a) Interannual variability in precipitation, (b) interannual variability in precipitation anomalies.
Water 17 01812 g002
Figure 3. Mann–Kendall mutation test method statistical curves for average annual rainfall in the study area from 1979 to 2023.
Water 17 01812 g003
Figure 4. Contour plot of the real part of the wavelet coefficients.
Water 17 01812 g004
Figure 5. Wavelet variance plot of annual mean precipitation series in the study area.
Water 17 01812 g005
Figure 6. The process of variation in the real part of the wavelet coefficients of the annual mean precipitation series at different scales.
Water 17 01812 g006
Figure 7. R/S analysis of mean annual precipitation in the study area from 1979 to 2023.
Water 17 01812 g007
Figure 8. Temporal trends of EP in the study area from 1979 to 2023 (including annual and interdecadal trends).
Water 17 01812 g008
Figure 9. Mann–Kendall mutation test curves for EPI time series.
Water 17 01812 g009aWater 17 01812 g009b
Figure 10. Contour map of the real part of wavelet coefficients for EPIs (1979–2023).
Water 17 01812 g010
Figure 11. Wavelet variance plot for EPIs in the study area (1979–2023).
Water 17 01812 g011
Figure 12. Spatial distribution of average annual precipitation per 9 years in the study area from 1979 to 2023: (a) 1979–1987, (b) 1988–1996, (c) 1997–2005, (d) 2006–2014, (e) 2015–2023.
Water 17 01812 g012
Figure 13. Spatial distribution of EPIs and their trends in the study area.
Water 17 01812 g013
Figure 14. Spatial distribution of trends in EPIs.
Water 17 01812 g014
Table 1. Definitions of EPIs.
IndexIndicator NameDefinitionsUnits
CDDConsecutive dry daysMaximum number of consecutive days with daily precipitation < 1 mm in a yeardays
CWDConsecutive wet daysNumber of consecutive days with daily precipitation ≥ 1 mm in a yeardays
R10Number of heavy precipitation daysAnnual count of days with daily precipitation ≥ 10 mmdays
R20Number of very heavy precipitation daysAnnual count of days with daily precipitation ≥ 20 mmdays
RX1Max 1-day precipitationMaximum 1 day precipitation amount in a yearmm
RX5Max 5-day precipitationMaximum consecutive 5 day precipitation amount in a yearmm
SDIISimple daily intensity indexRatio of annual total precipitation to the number of wet days (daily precipitation ≥ 1 mm)mm/days
R95PPrecipitation amount for very wet daysTotal precipitation from days exceeding the 95th percentile threshold (calculated from long-term daily precipitation series) in a yearmm
R99PPrecipitation amount for extremely wet daysTotal precipitation from days exceeding the 99th percentile threshold (calculated from long-term daily precipitation series) in a yearmm
Table 2. EPIs for different interdecadal periods.
Decade20th Century21st Century
1980s1990s2000~20092010~2020
CDD23.121.617.619.4
CWD10.99.89.210.2
R1039.143.842.842.6
R2015.219.116.417.7
RX153.9771.6863.7365.62
RX5112.21154.67128.88143.74
SDII8.679.539.389.06
R95P541.26640582.61594.31
R99P174.67221.68203.24202.87
Table 3. Years of abrupt change in EPIs.
IndexCDDCWDR10R20RX1RX5SDIIR95PR99P
Mutation years199019801990
2002
198819921989198519851984
Disclaimer/Publisher’s Note: The statements, opinions and data contained in all publications are solely those of the individual author(s) and contributor(s) and not of MDPI and/or the editor(s). MDPI and/or the editor(s) disclaim responsibility for any injury to people or property resulting from any ideas, methods, instructions or products referred to in the content.

