

Evaluation of X-Band Radar for Flash Flood Modeling in Guangrun River Basin

Abstract
1. Introduction
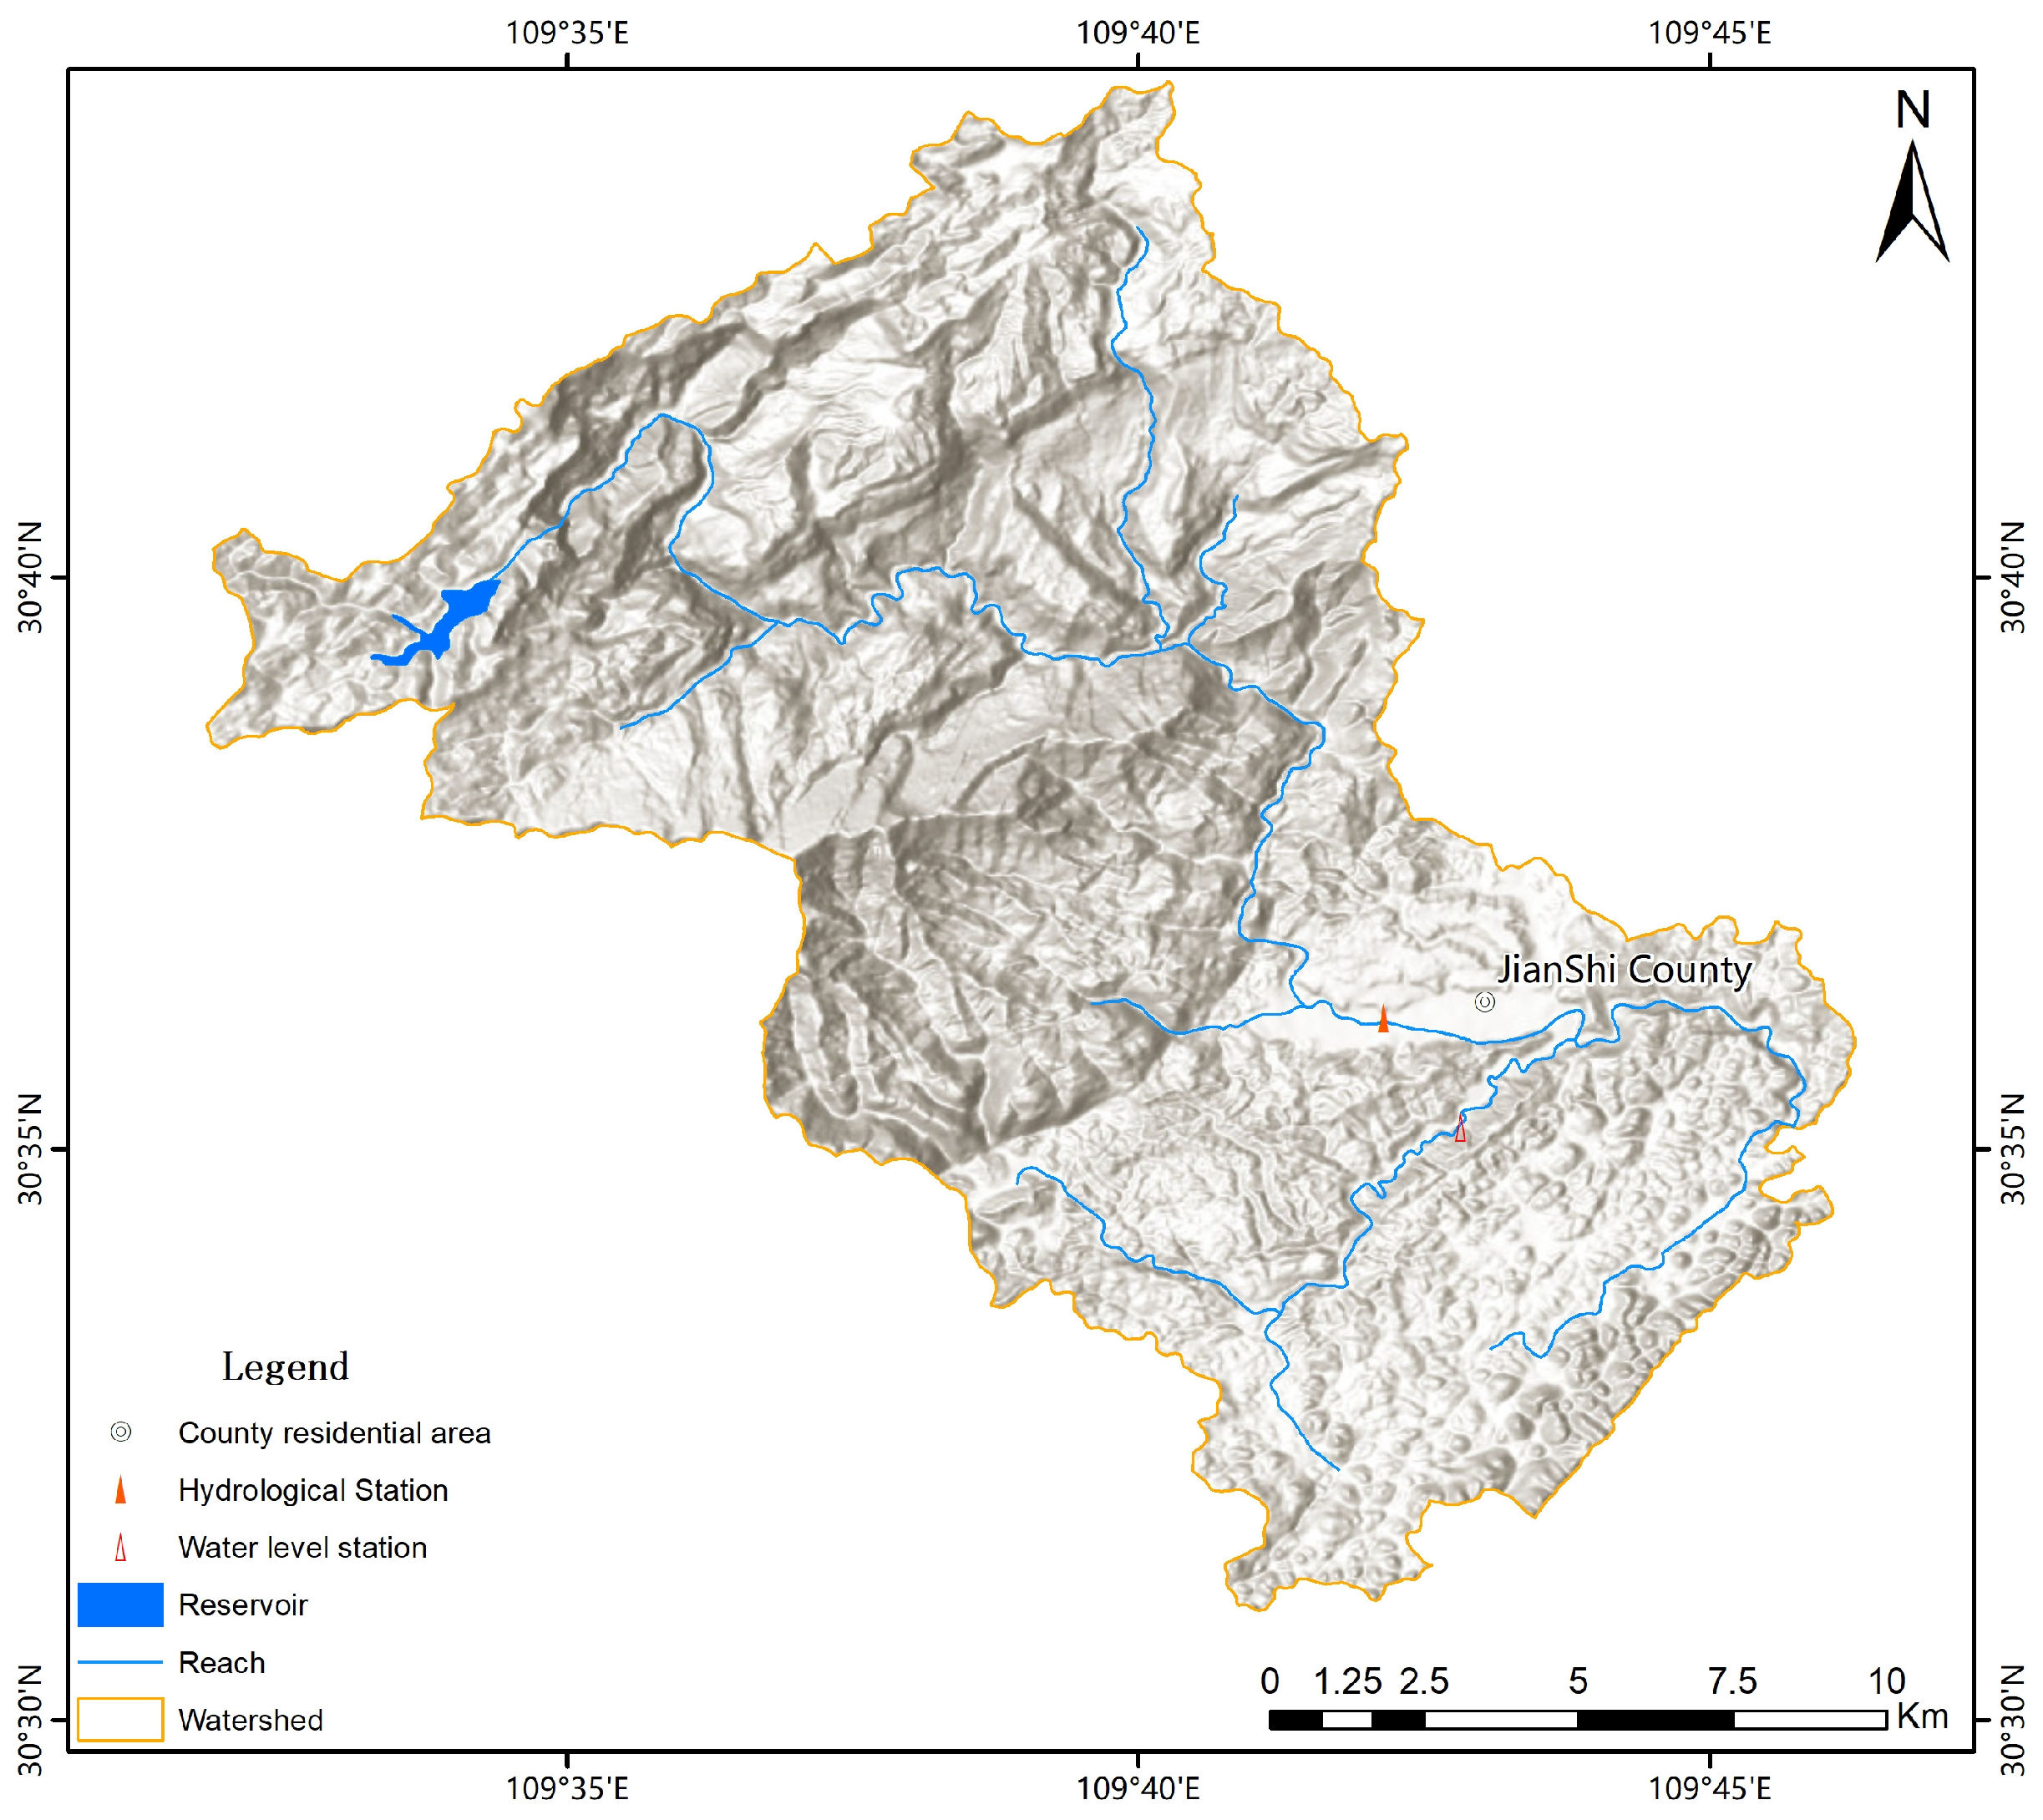
2. Study Area
3. Materials and Methods
3.1. Data and Sources
3.2. Attenuation Correction
3.3. Spatio-Temporal Dynamic Z–R Radar Rainfall Inversion
- (1)
- Convective kernel identification. Based on the single-radar body-scan data, the identification of flow cores is realized in polar coordinates. The convective nuclei in the area of heavy precipitation are accurately identified by setting different criteria (e.g., reflectivity factor, vertical layer water content, etc.).
- (2)
- Convective area identification. After identifying the convective nuclei, the entire convective zone is identified using the method of area growth. The accurate identification of the convective zone is ensured by comprehensively judging multiple physical quantities (e.g., combined reflectivity, maximum reflectivity height, vertical gradient of reflectivity, etc.).
- (3)
- Identification of laminar cloud bright zones. After identifying the entire convective cloud area, bright band identification is performed for the stratiform cloud precipitation area. The regional growth method is used to accurately identify the regions affected by the bright bands and avoid overestimation of the stratiform cloud precipitation area.
- (4)
- Inversion formula selection. According to the identification of strong precipitation areas and non-strong precipitation areas, different Z–R relations are used to invert the rainfall, which can effectively improve the accuracy of rainfall inversion. Among them, the stratiform cloud formula is Z = 200I1.6 and the convective cloud formula is Z = 300I1.4, where, Z is the radar reflection factor (unit: mm3/m6) and I is the rainfall intensity (mm/h).
3.4. Chinese Flash Flood Hydrologic Modeling Approach
3.4.1. Introduction to China’s Flash Flood Hydrological Modeling
3.4.2. Flash Flood Hydrological Modeling
3.5. Approaches to Hydrodynamic Modeling
3.6. Assessment Methodology
3.6.1. X-Band Radar Rainfall Inversion Accuracy Assessment
- (1)
- Relative error (RE)
- (2)
- The root mean square error (RMSE) is calculated as follows:
3.6.2. Flood Forecast Accuracy Assessment
4. Results
4.1. Flash Flood Events
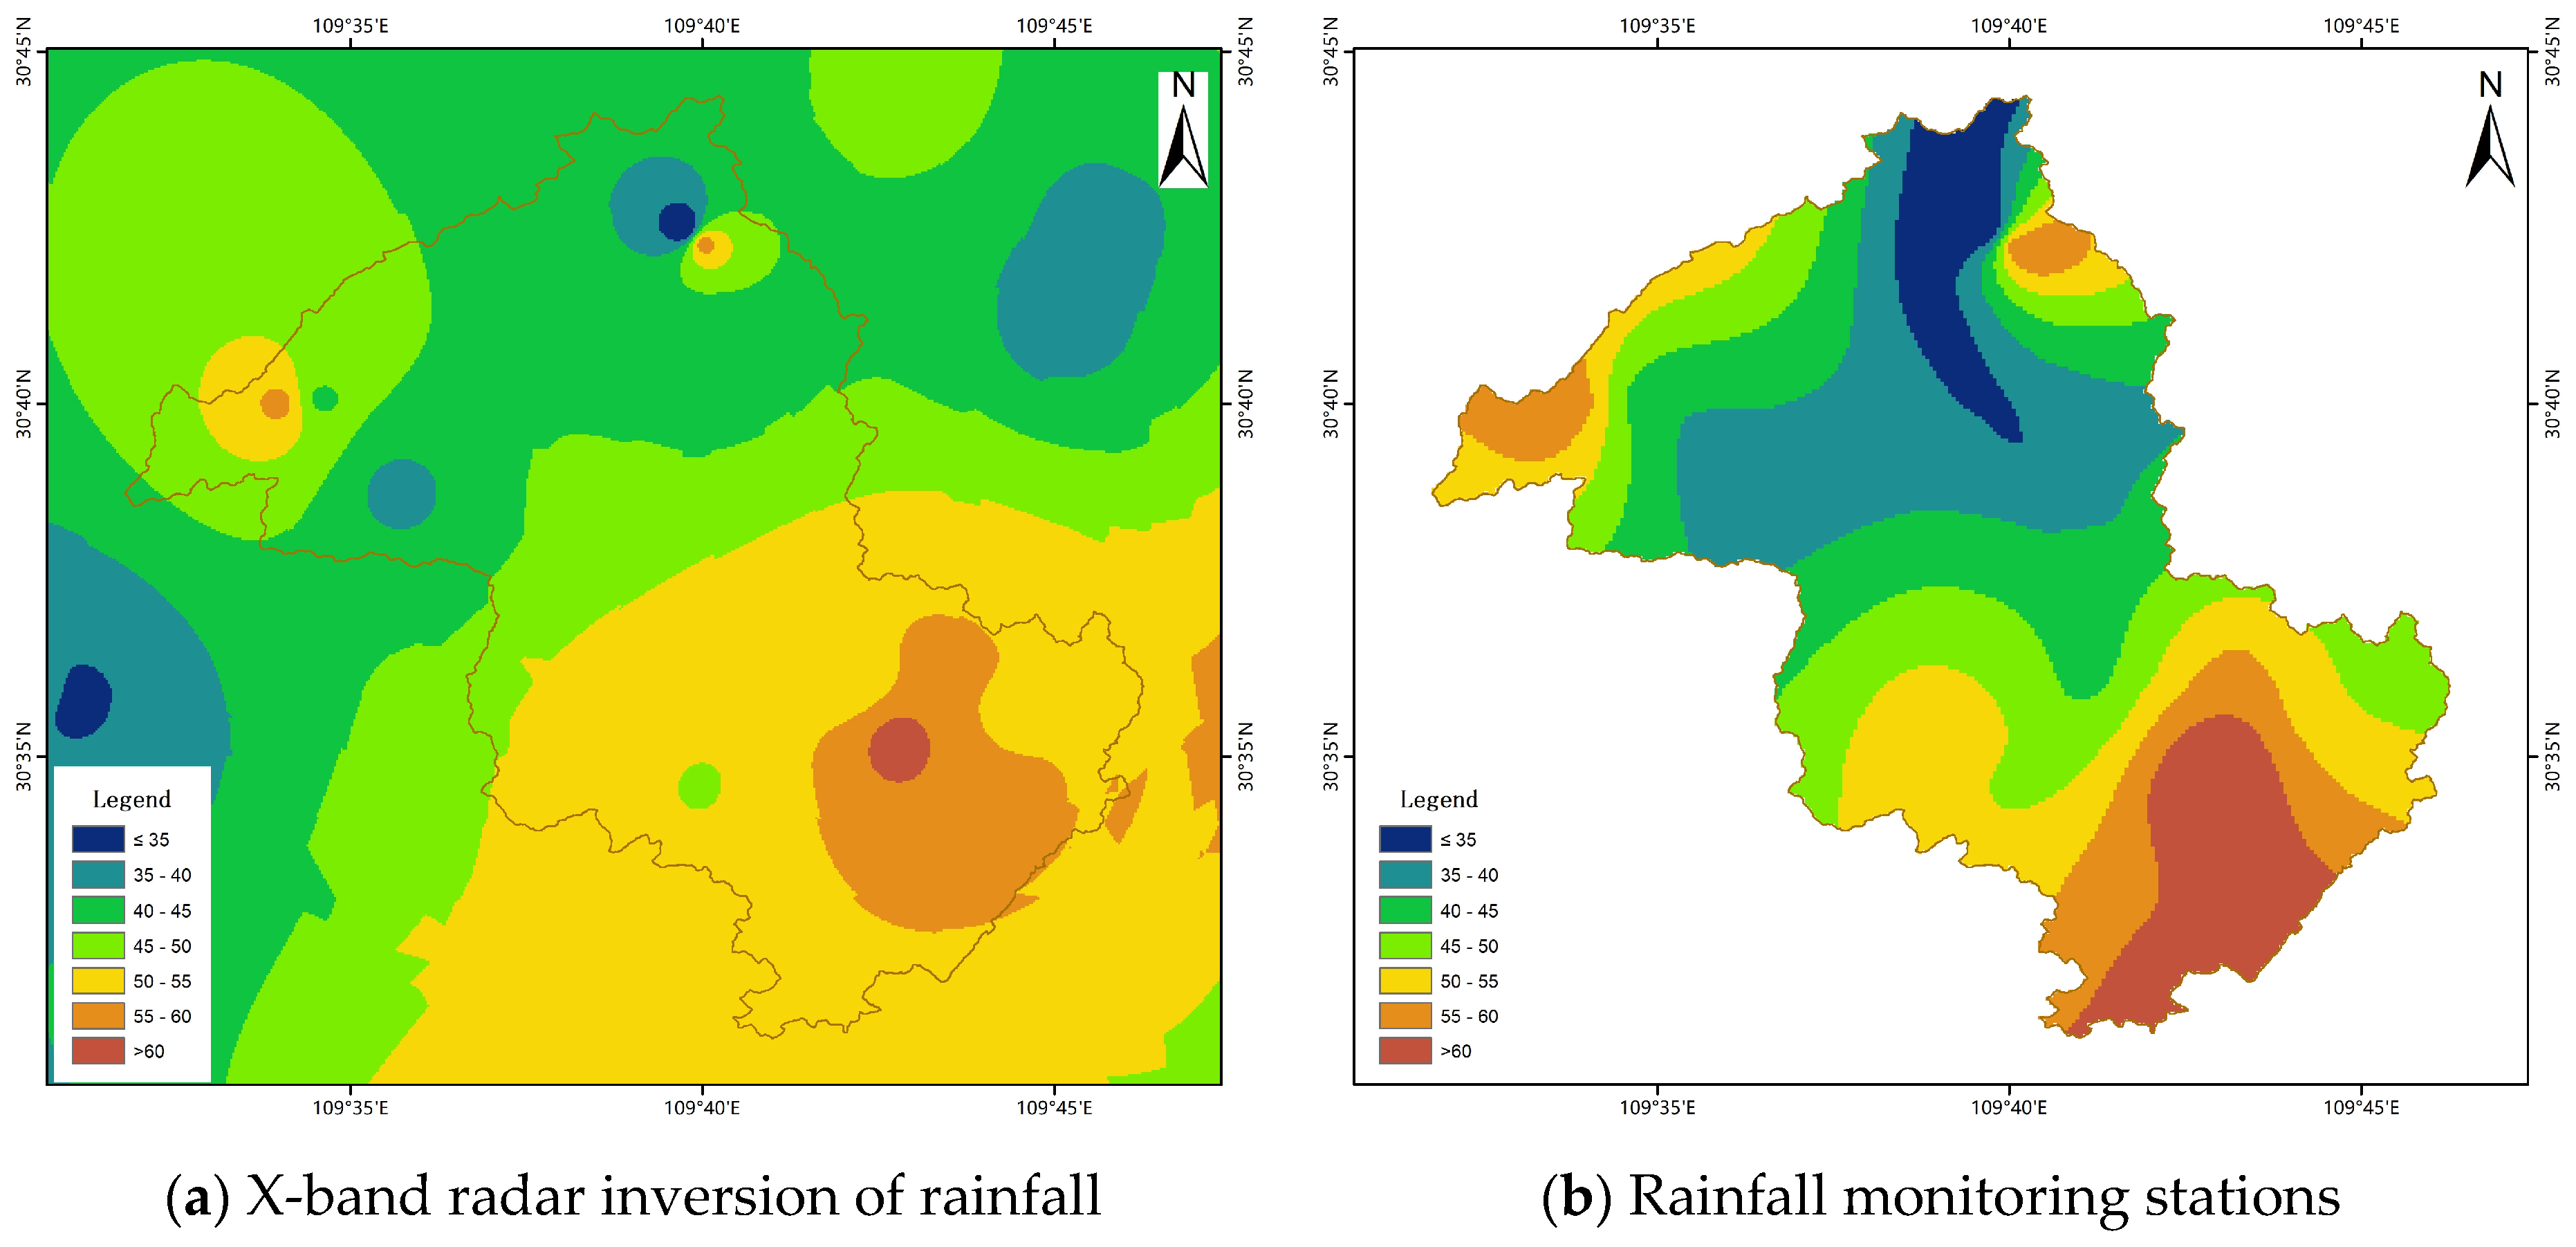
4.2. Rainfall Inversion Based on X-Band Radar
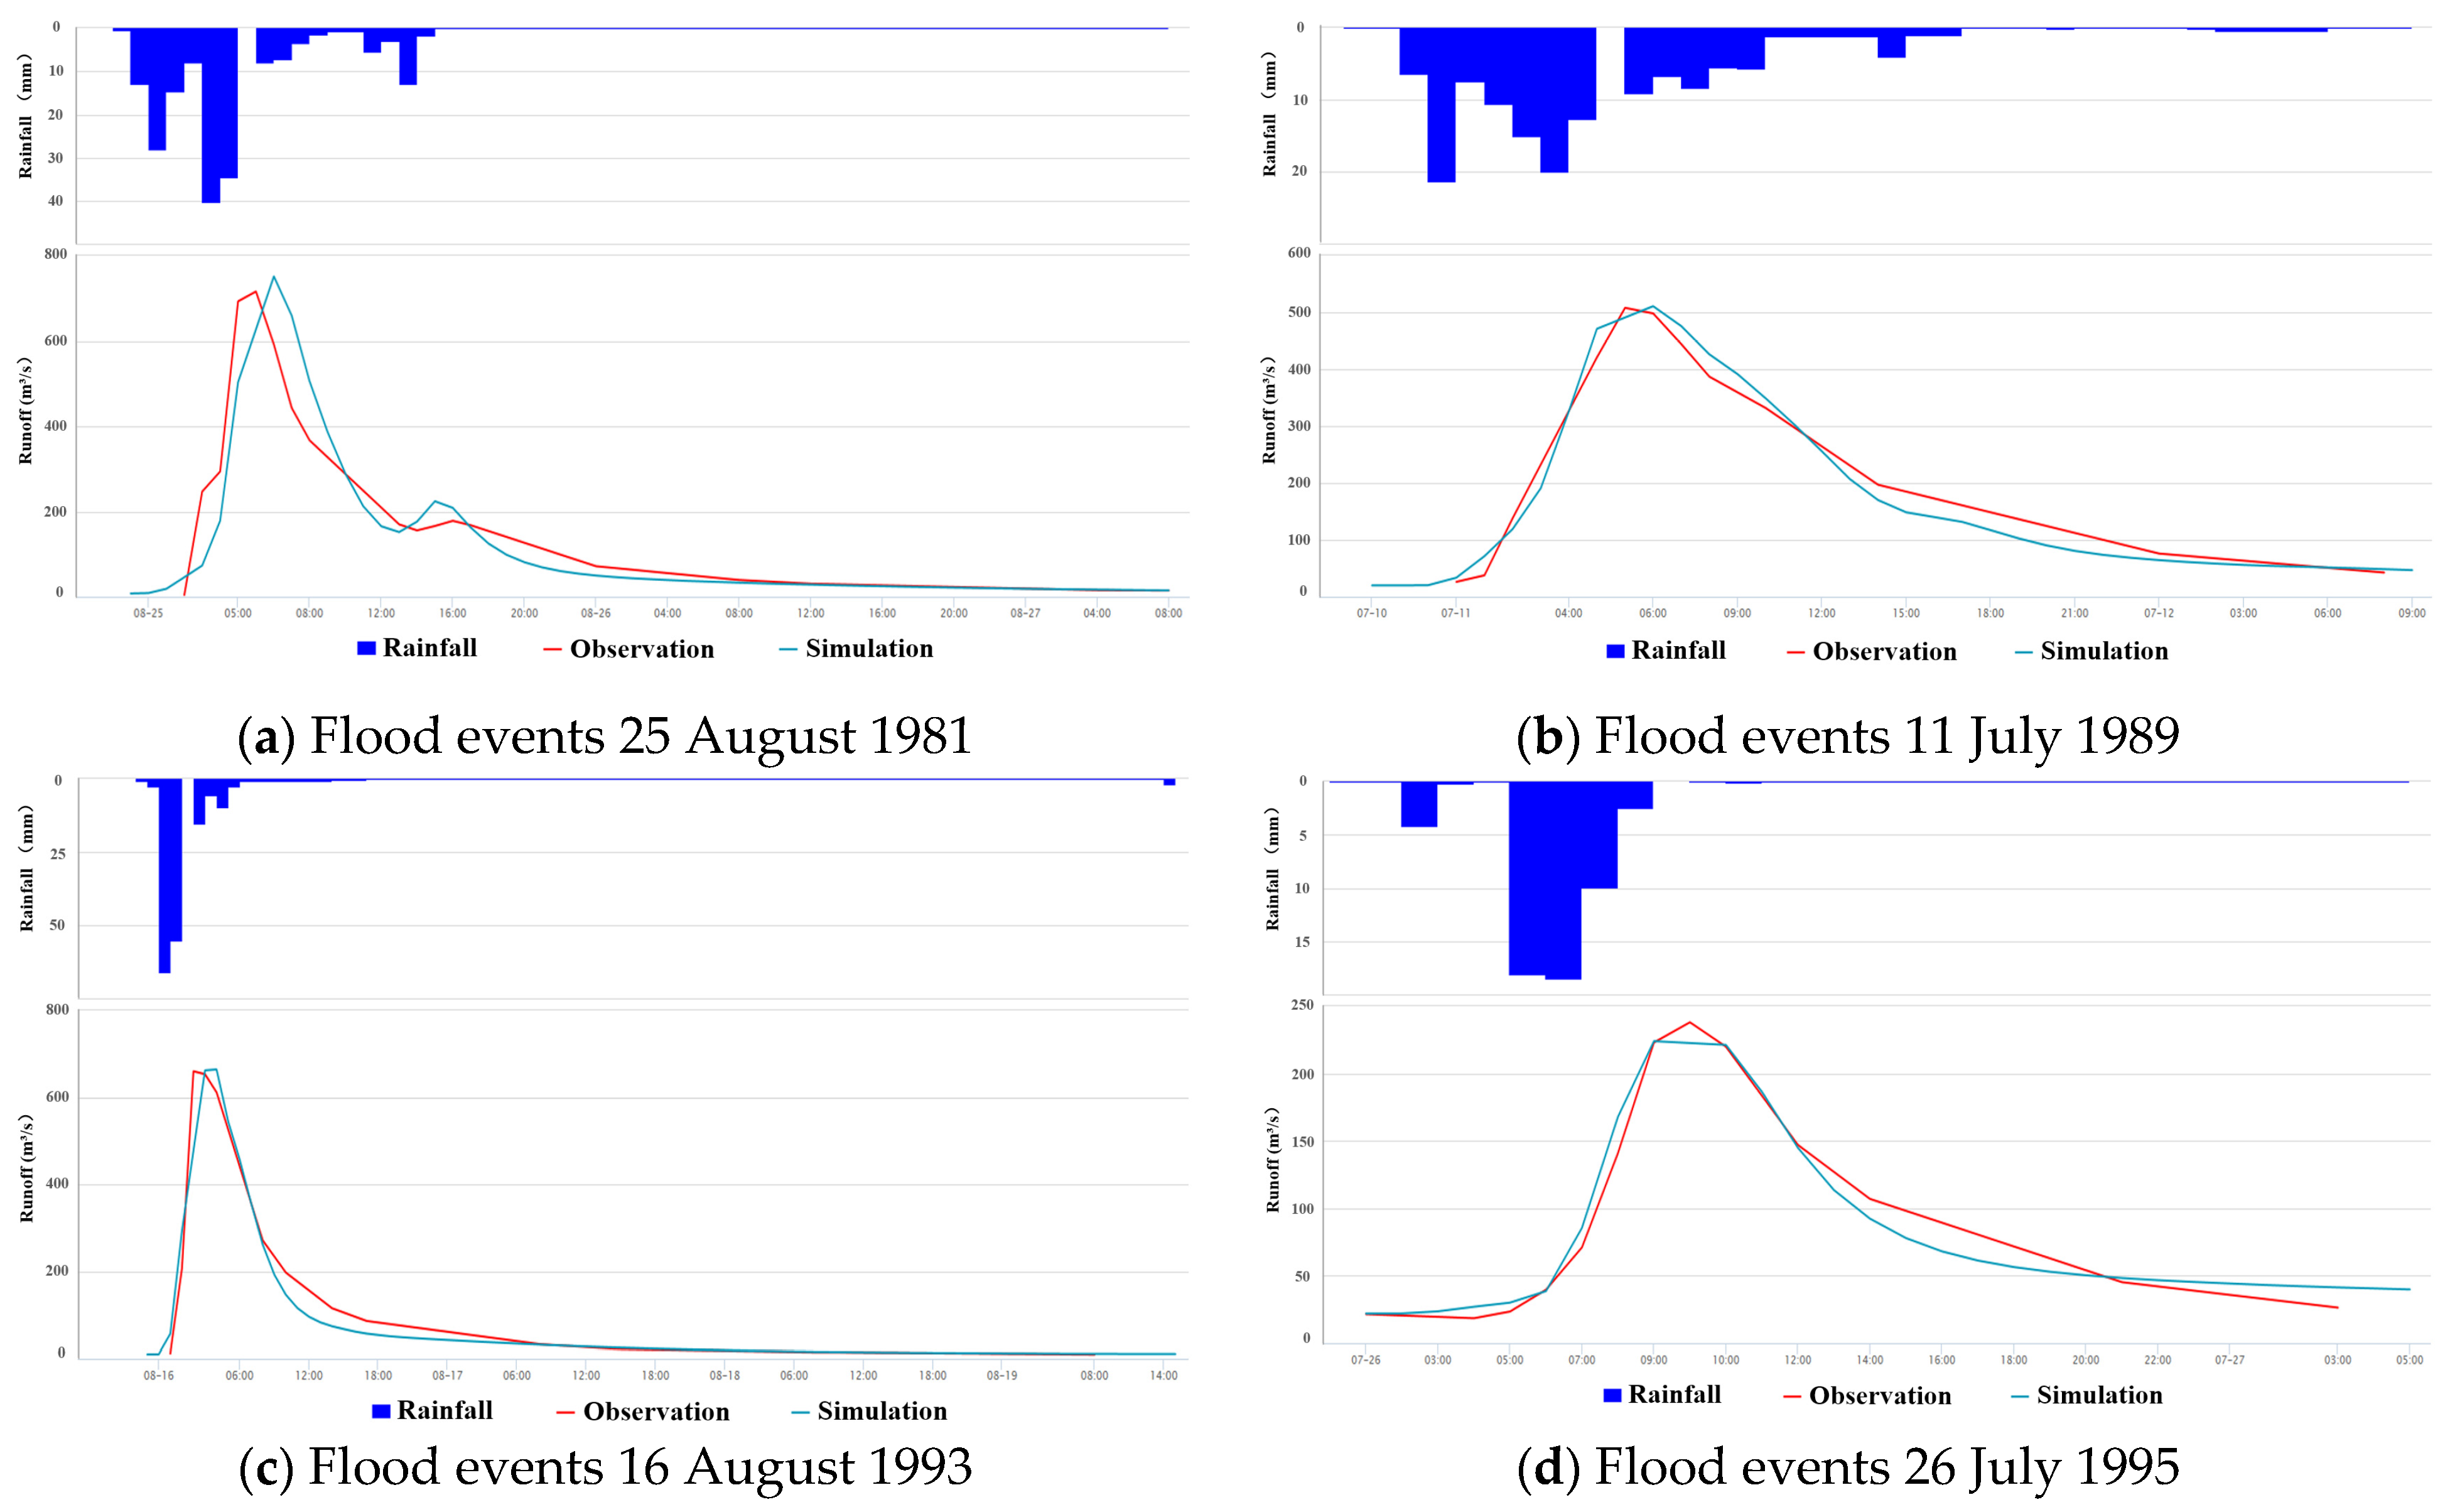
4.3. Comparison of Flash Flood Process Simulation Results
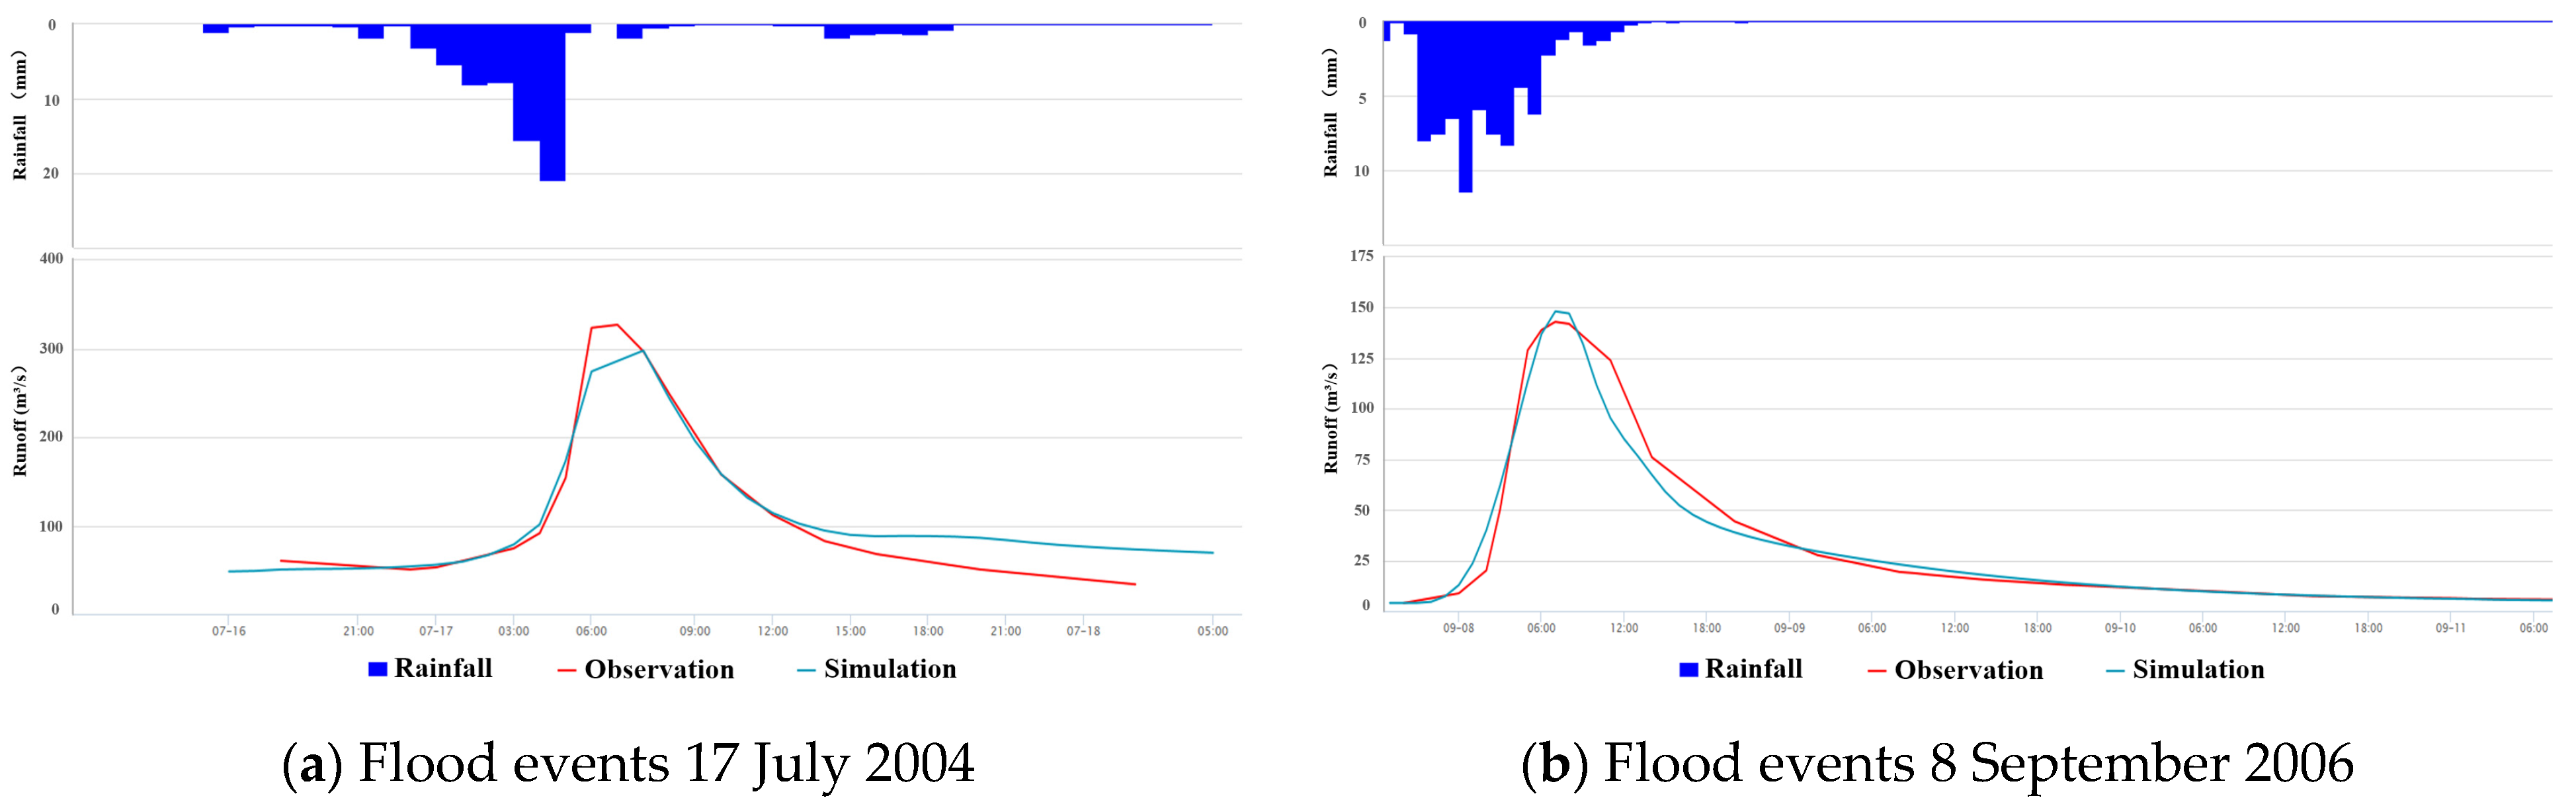
4.3.1. Model Construction and Calibration
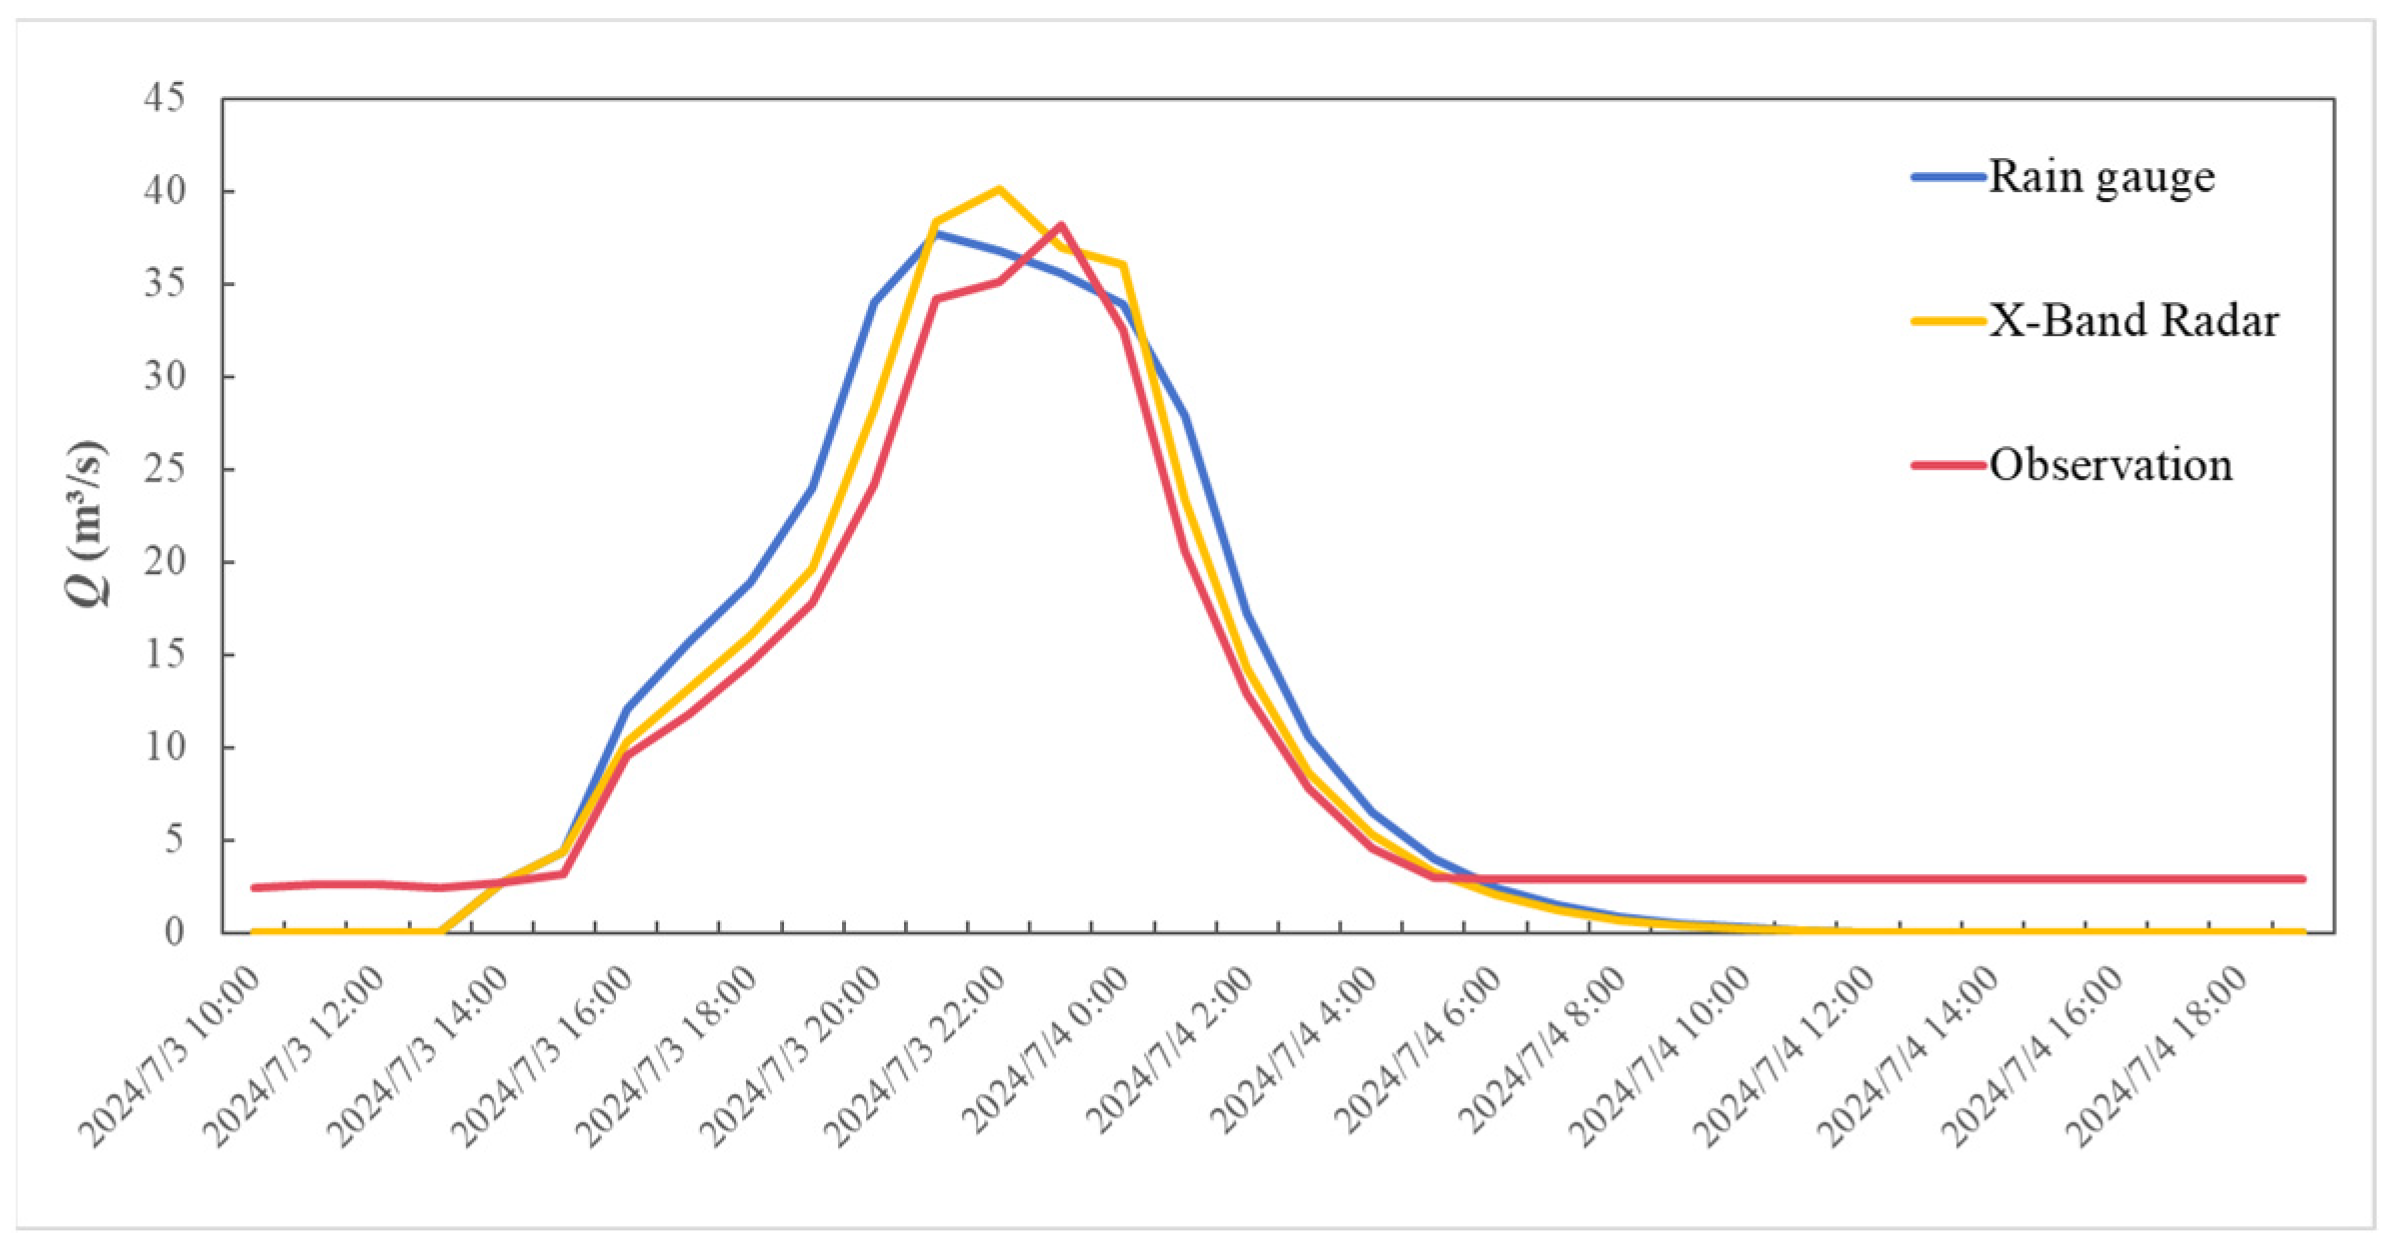
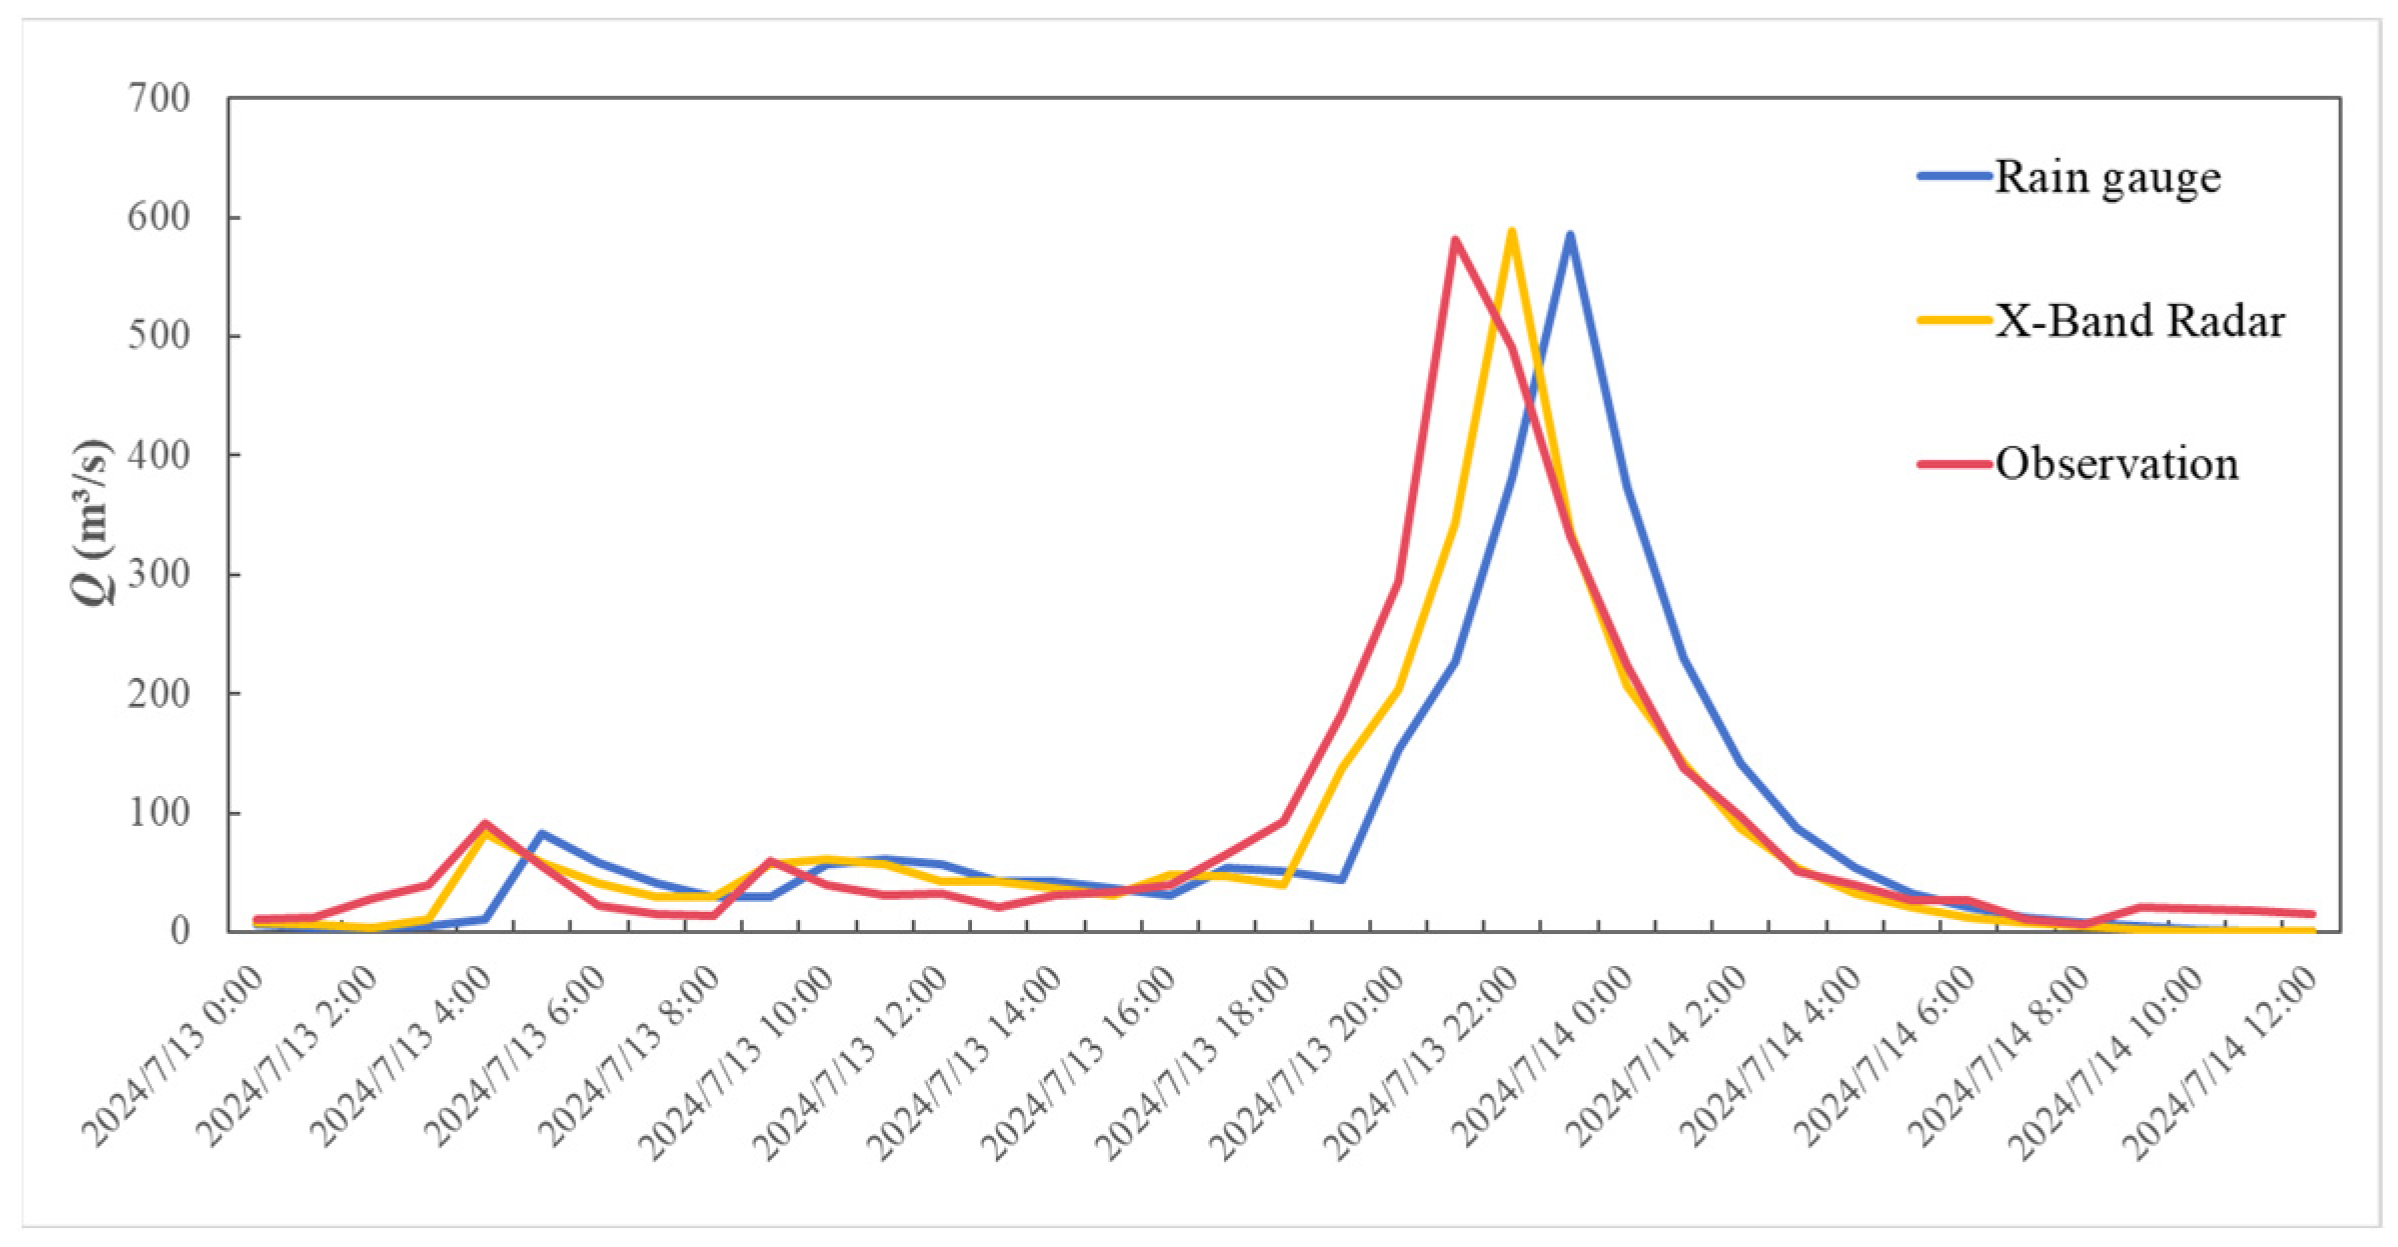
4.3.2. Simulation of Flooding Processes Based on X-Band Radar Inversion and Measured Rainfall at Rainfall Stations
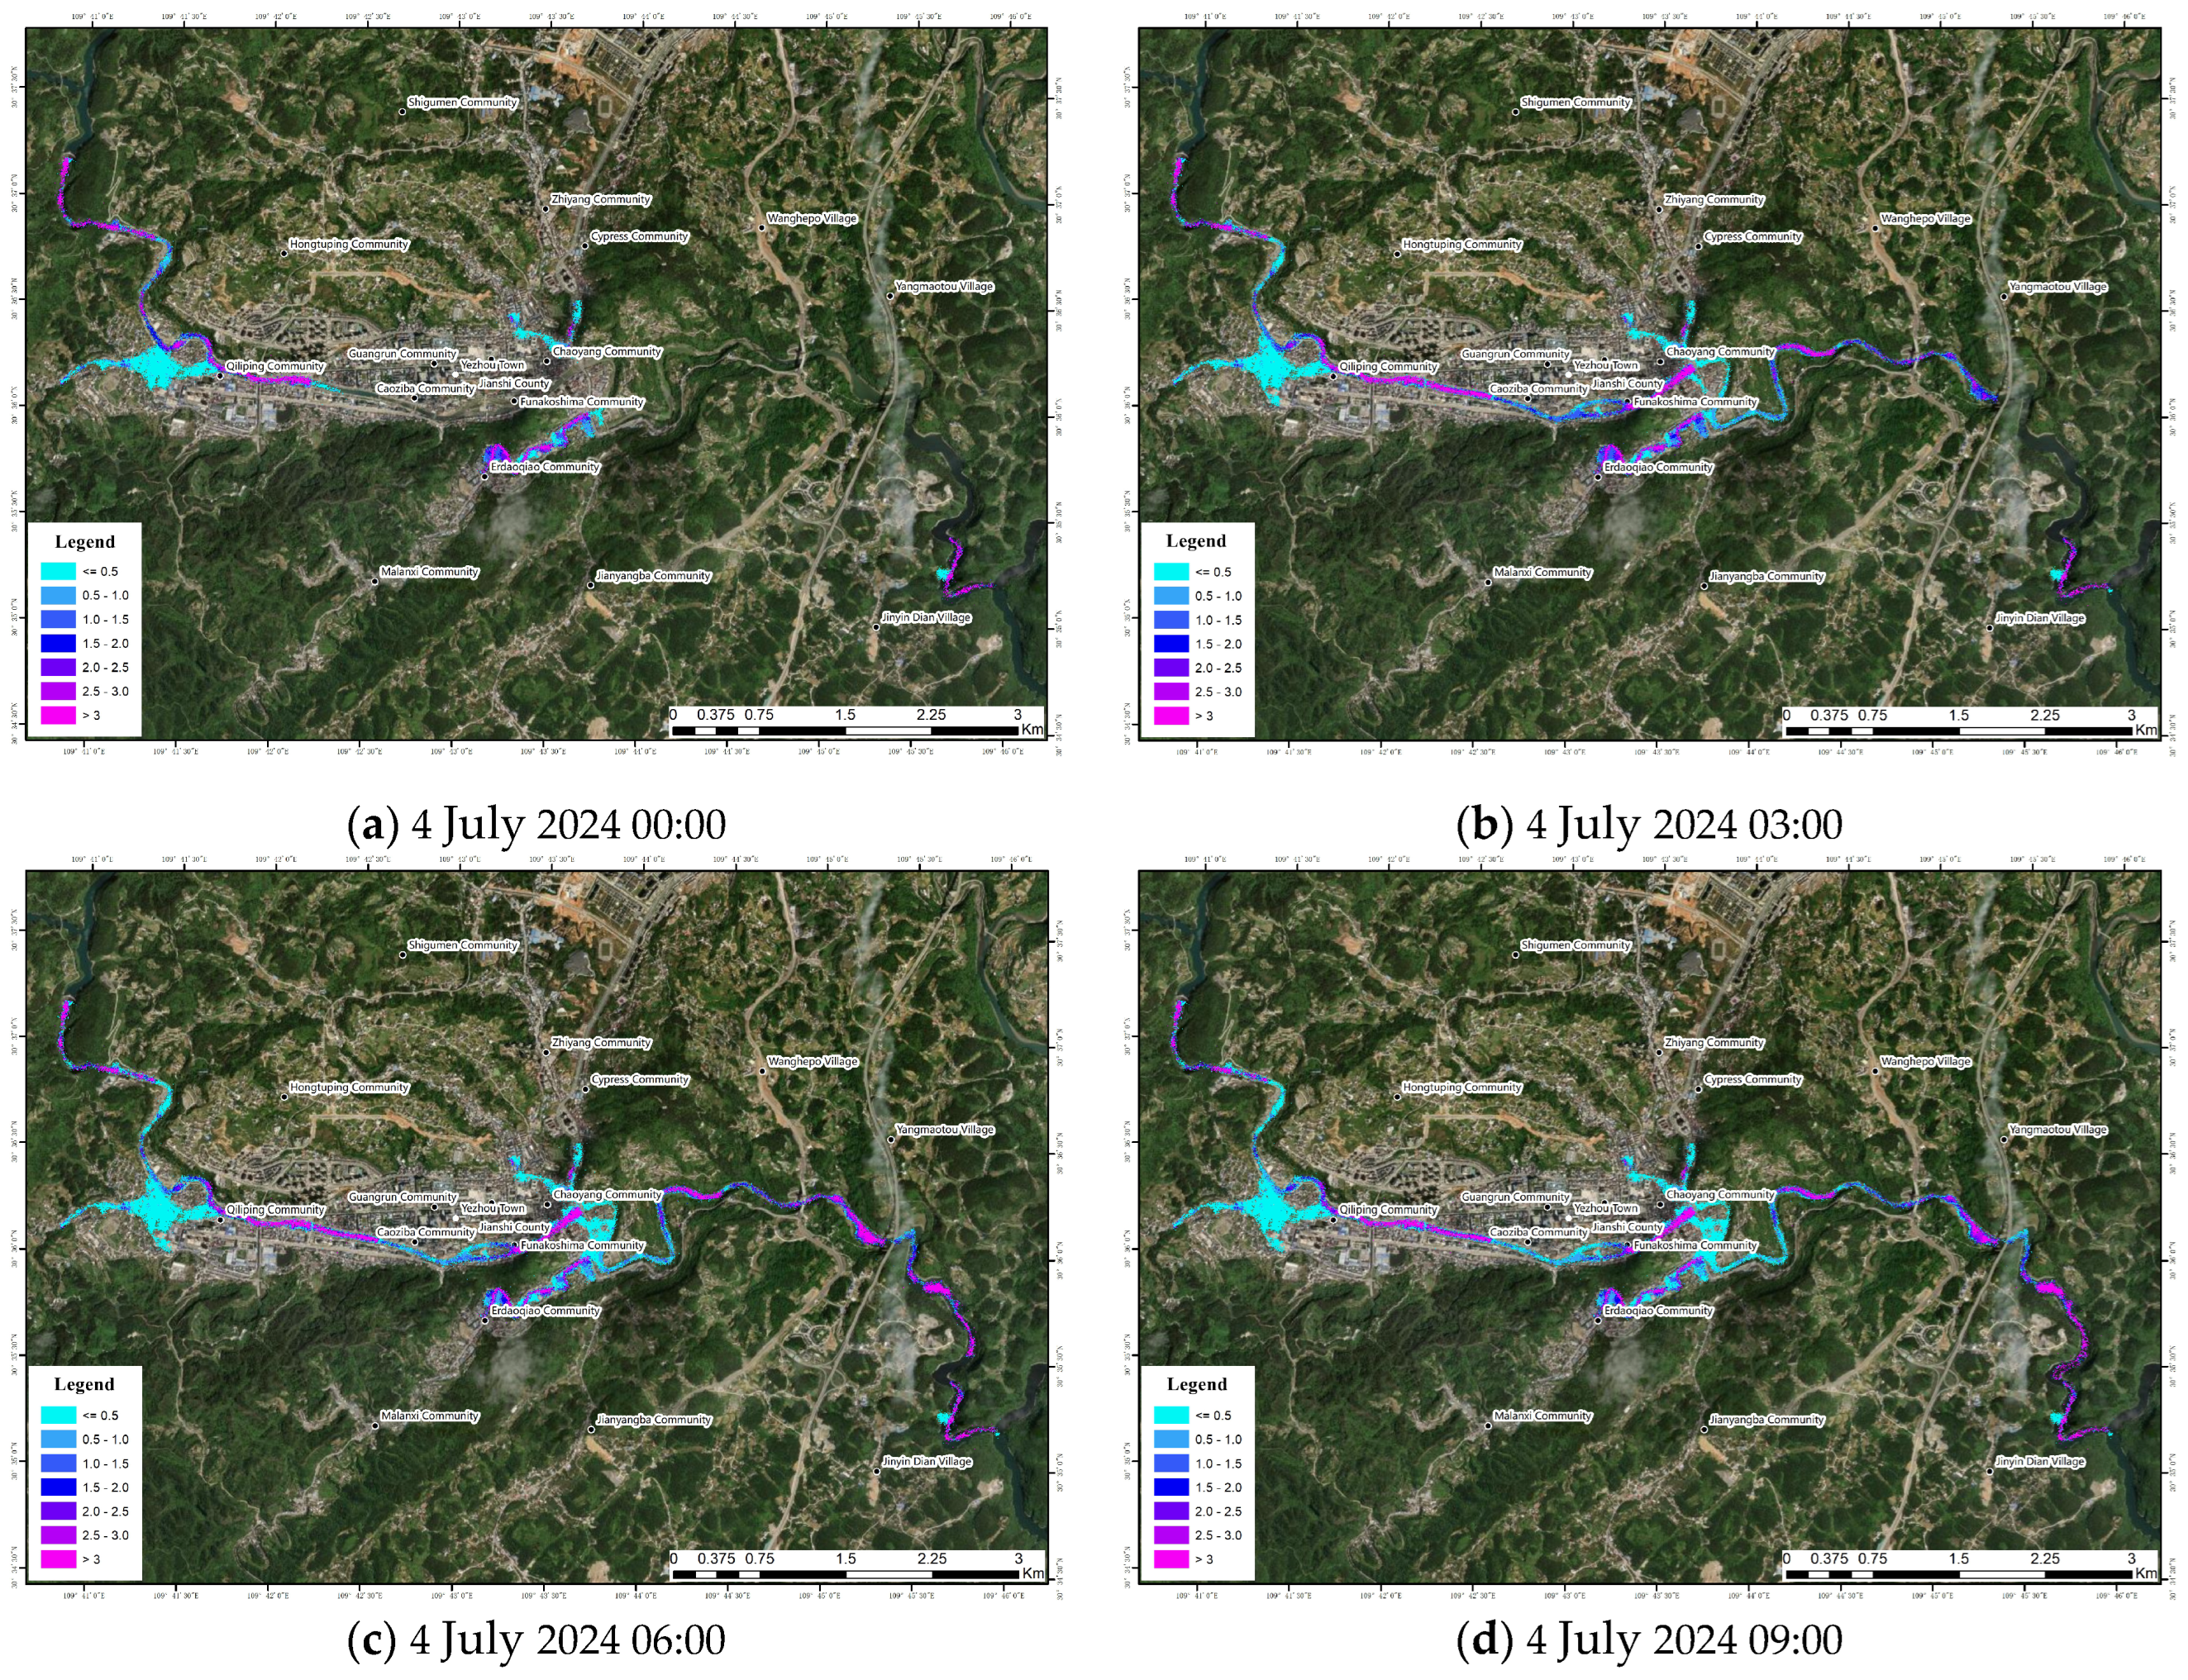
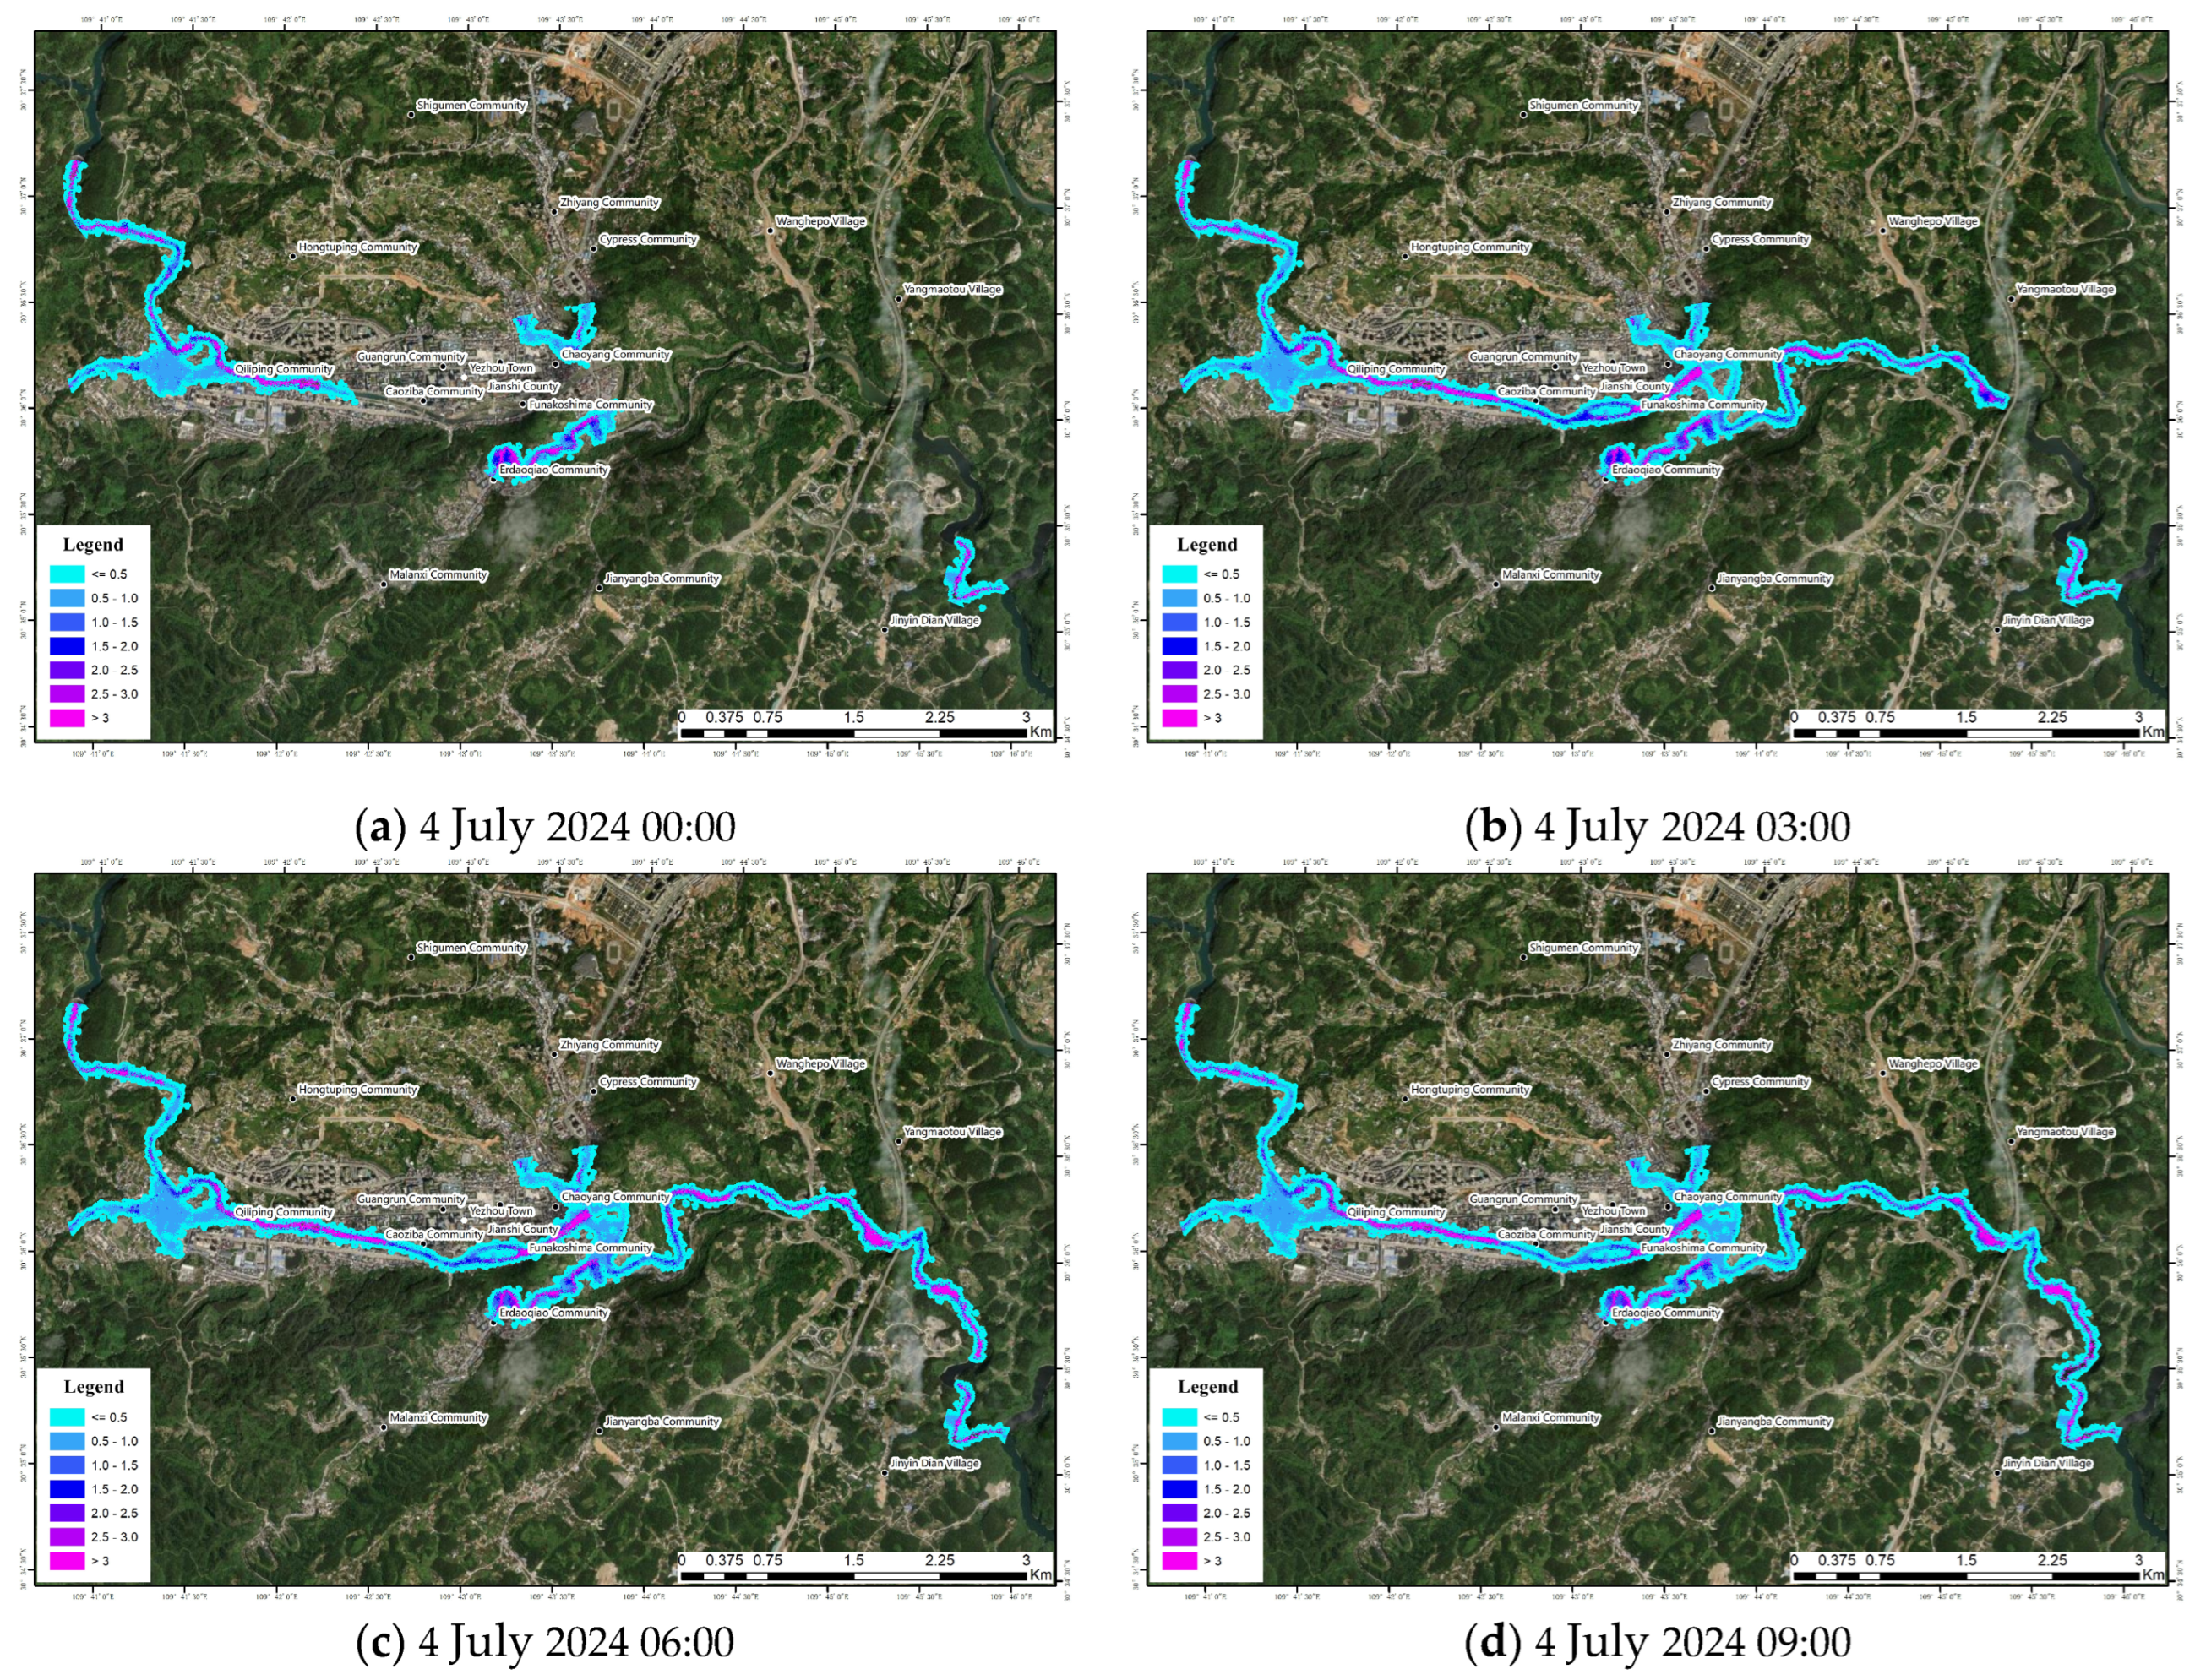
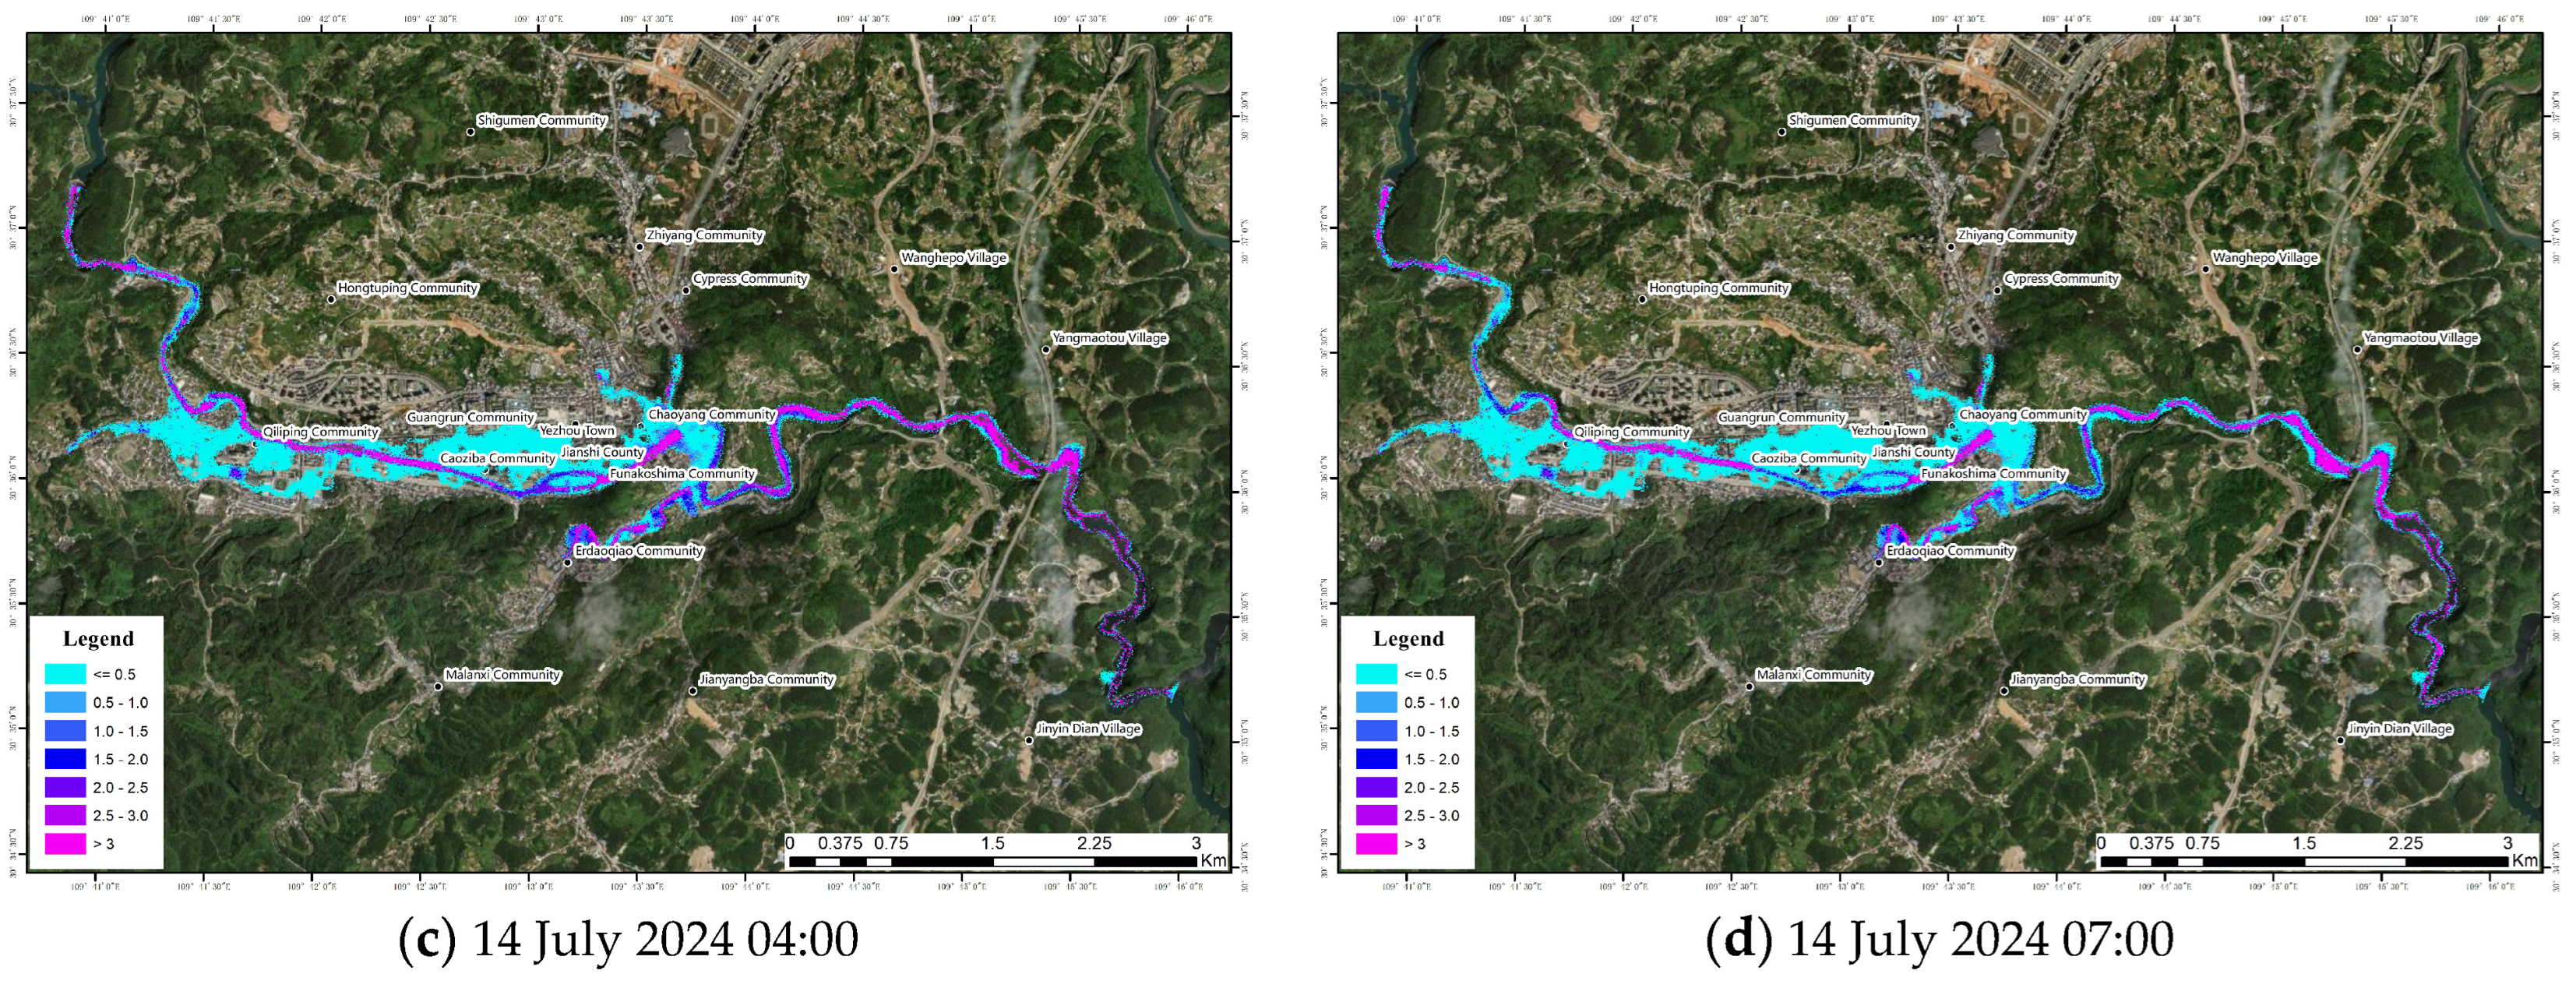
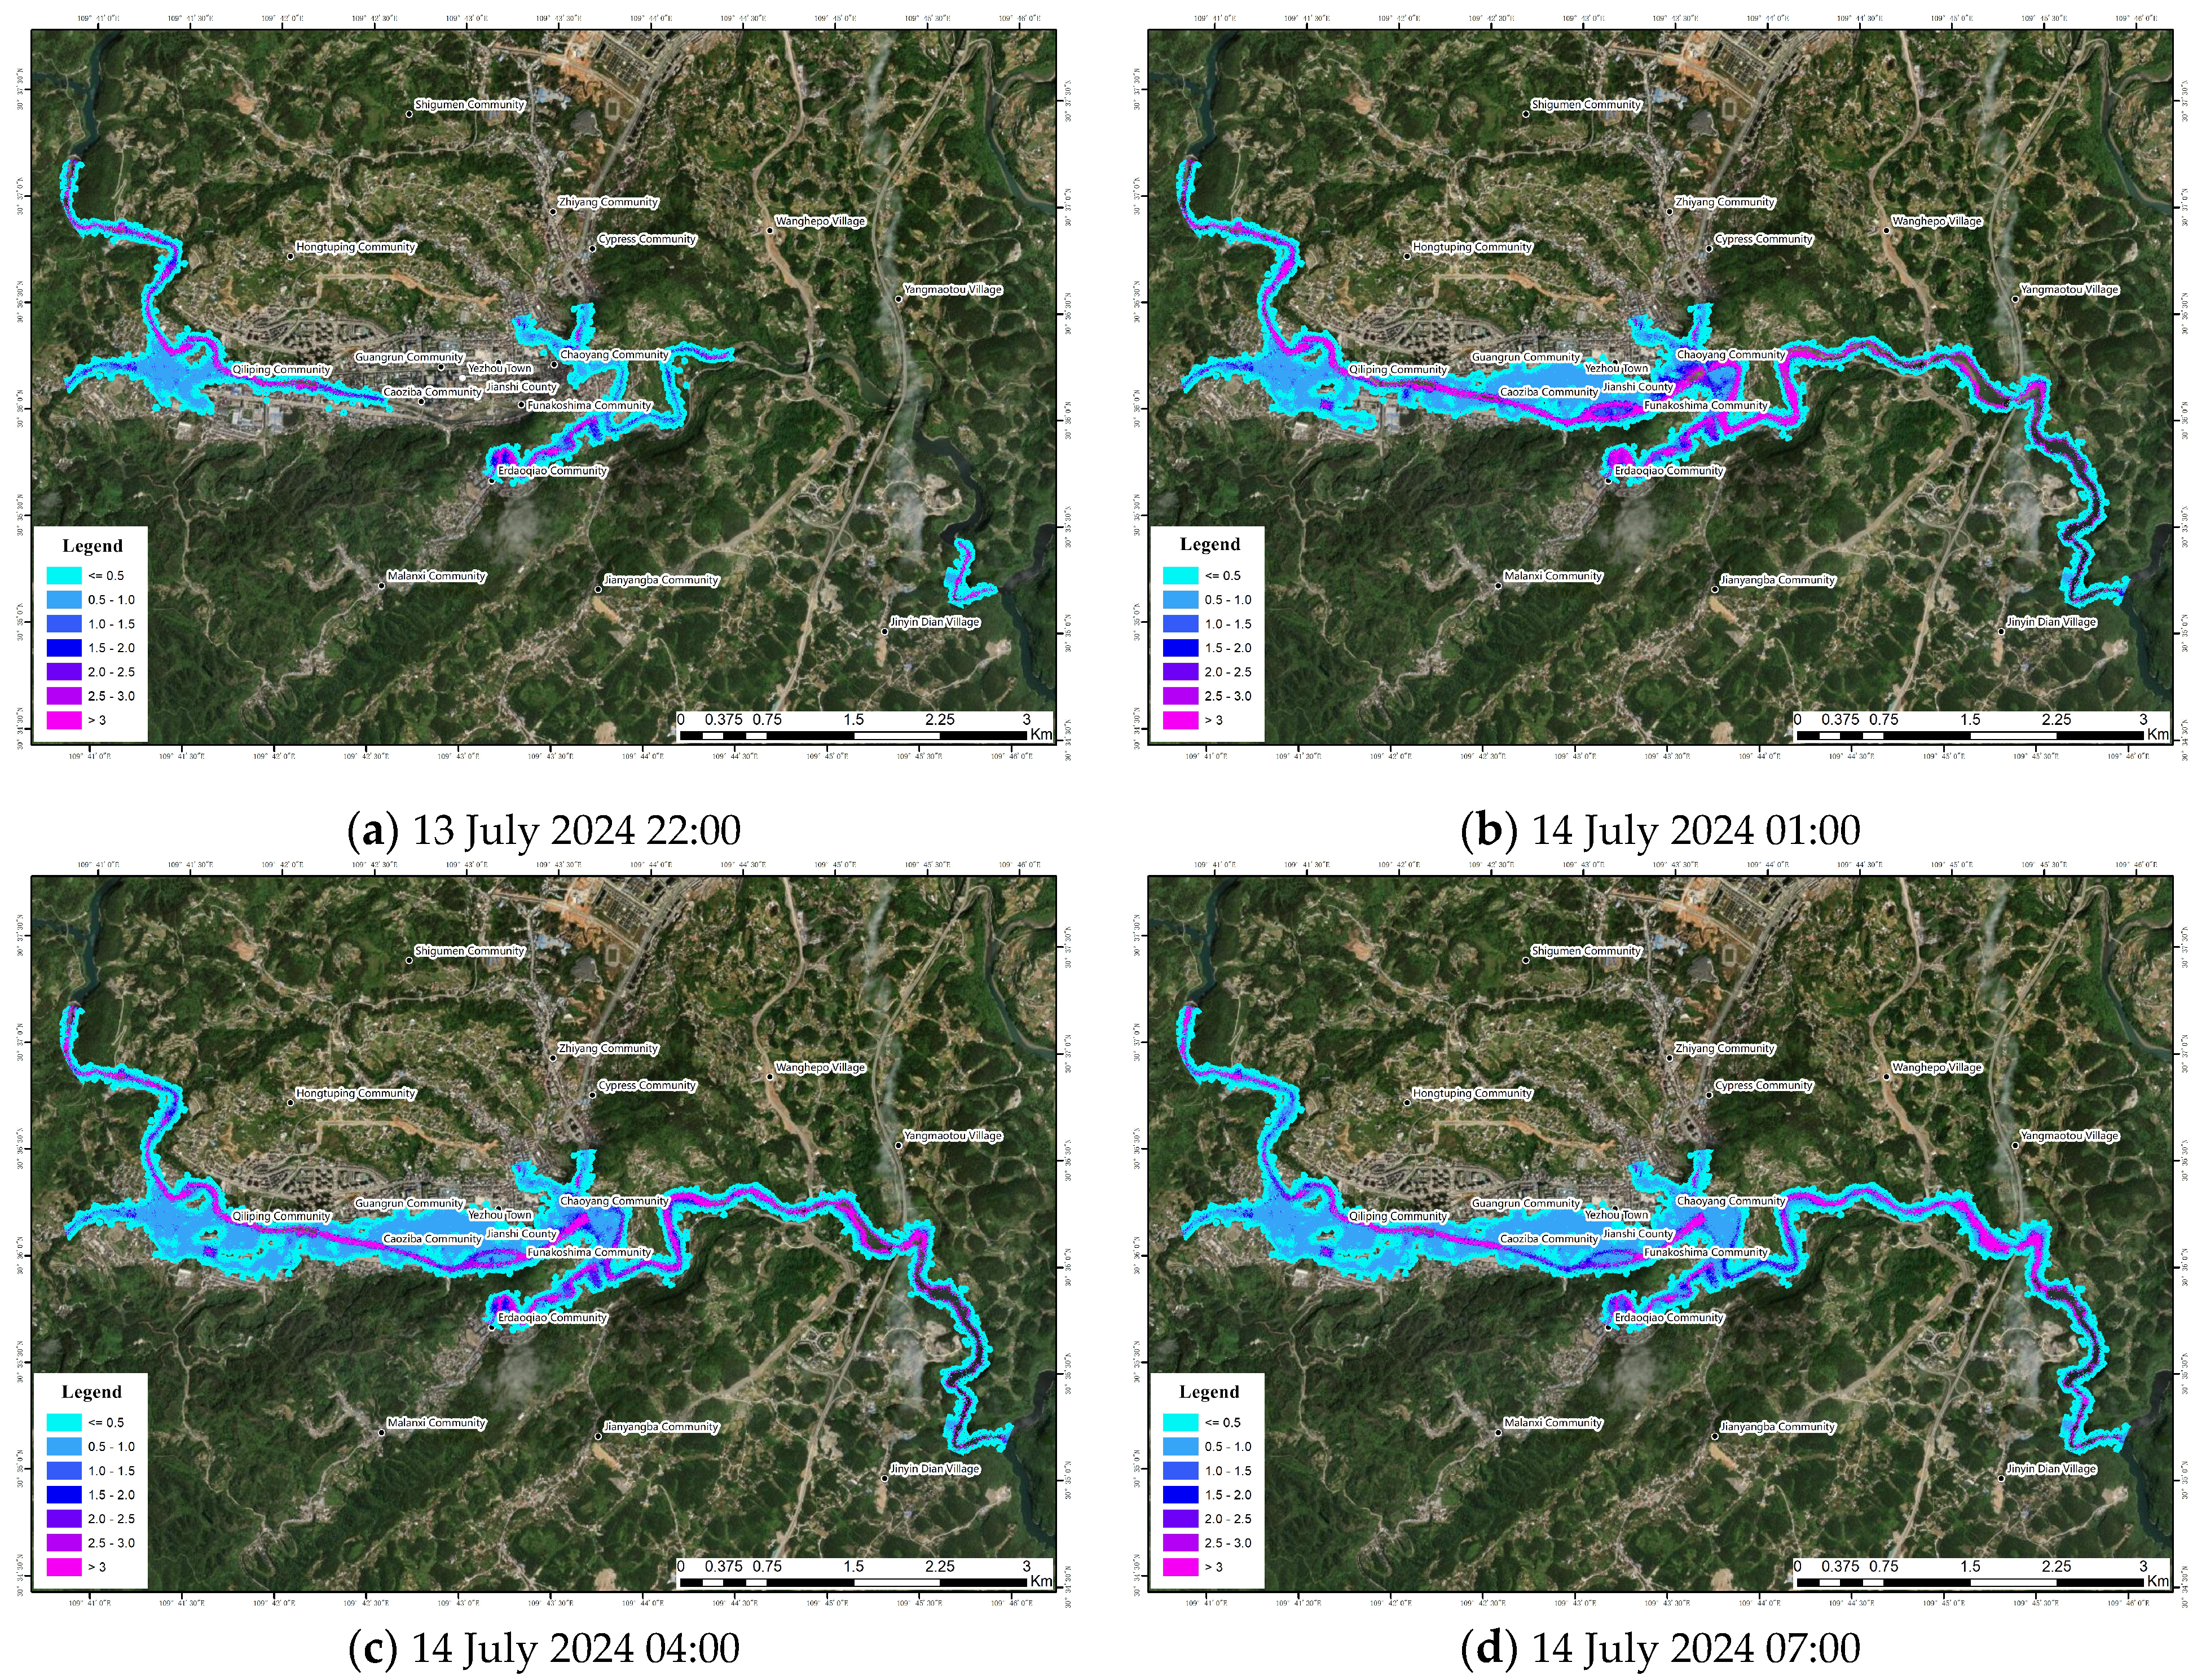
4.4. Comparison of Flood Inundation Results
5. Discussion
6. Conclusions
- (1)
- The cumulative rainfall from the X-band radar inversion and the surface cumulative rainfall measured at the rainfall station show a high match in rainfall level and spatial distribution, indicating that the X-band rainfall radar has a better ability to monitor the rainfall process and is able to show the spatial and temporal distribution of rainfall in the basin.
- (2)
- Comparing the simulation results of the distributed hydrological model based on X-band radar inversion rainfall and measured rainfall, the results of the former are better than the latter in terms of the relative error of runoff depth, error of peak flow, error in time of peak occurrence, and NSE. This indicates that the X-band radar inversion of rainfall data has a higher accuracy and reliability in flood simulation.
- (3)
- A two-dimensional hydrodynamic model based on FASFLOOD is used to simulate the flood inundation of 3 July 2024 and 13 July 2024. The research shows that the simulation results based on X-band radar inversion and the rainfall measured by rainfall stations are consistent regarding the process of rising and falling water and the trend of submergence range, and radar data has more advantages in capturing the spatial distribution of rainfall, which provides more reliable technical support for flood warning.
Author Contributions
Funding
Data Availability Statement
Acknowledgments
Conflicts of Interest
References
- Jiang, L.; Chen, J. How Do Climate Adaptation Policy Tools Influence Urban Resilience? An Analysis Based on Systematic Review. Urban Dev. Stud. 2024, 31, 108–119. [Google Scholar]
- Zou, J.; Duan, C.; Chen, B.; Wang, H. Assessment of waterlogging resilience in Beijing based on quantification of economic losses under climate change. Water Resour. Prot. 2024, 40, 85–94. [Google Scholar] [CrossRef]
- Li, C.; Wang, Z.; Zhang, Y. Application of radar technology in hydrometry. Water Resour. Informatiz. 2020, 4, 42–48. [Google Scholar] [CrossRef]
- Li, Z.; Xiao, H.; Yao, Z.; Feng, L. Retrieval of Raindrop Size Distribution by X-Band Dual-Polarization Radar. Clim. Environ. Res. 2015, 20, 285–295. [Google Scholar] [CrossRef]
- Li, X.; Zhou, Y.; Xiao, H.; Wu, W.; Zhai, L. Research on the Evolution Characteristics of Hydrometeors in a Thunderstorm Cell with X-Band Dual-Polarimetric Radar. Chin. J. Atmos. Sci. 2017, 41, 1246–1263. [Google Scholar] [CrossRef]
- Liu, Y.; Xiao, H.; Yao, Z.; Feng, L. Analyses of hydrometeor identification based on X-band polarimetric radar. Clim. Environ. Res. 2012, 17, 925. [Google Scholar] [CrossRef]
- Brotzge, J.A.; Droegemeier, K.; McLaughlin, D.J. Collaborative adaptive sensing of the atmosphere: New radar system for improving analysis and forecasting of surface weather conditions. Transp. Res. Rec. 2006, 1948, 144–151. [Google Scholar] [CrossRef]
- Tokyo Amesh. Bureau of Sewerage of Tokyo Metropolitan Government [EB/OL]. 28 May 2013. Available online: https://www.gesui.metro.tokyo.lg.jp (accessed on 1 January 2025).
- Van de Beek, C.Z.; Leijnse, H.; Stricker, J.N.M.; Uijlenhoet, R.; Russchenberg, H.W.J. Performance of High-Resolution X-Band Radar for rainfall measurement in the Netherlands. Hydrol. Earth Syst. Sci. Discuss. 2009, 6, 6035–6085. [Google Scholar] [CrossRef]
- Liu, C.; Liu, Q.; Tian, J.; Liu, Y.; Wang, Y.; Wang, C. Application of X-band full polarization frequency modulated continuous wave precipitation radar in flash flood forecasting and early warning. China Flood Drought Manag. 2020, 30, 48–53. [Google Scholar] [CrossRef]
- Gao, S.; Su, J.; Zhang, G.; Cao, M.; Ren, D. Accuracy assessment of rainfall radar-Based precipitation estimation in Xi’an, China. J. Shaanxi Meteorol. 2023, 6, 20–25. [Google Scholar] [CrossRef]
- Liu, X.; Wang, F.; Wu, Y.; Xiong, Z.; Wang, S.; Liu, W. Application of X-band rainfall radar system in precipitation monitoring at poyang lake. Yangtze River 2024, 55, 79–85. [Google Scholar] [CrossRef]
- Looper, J.P.; Vieux, B.E. An assessment of distributed flash flood forecasting accuracy using radar and rain gauge input for a physics-based distributed hydrologic model. J. Hydrol. 2012, 412, 114–132. [Google Scholar] [CrossRef]
- Kong, J.; Xu, Z.; Shu, Y.; Wang, X. Flash flood simulation and disaster warning leading time analysis based on data from rainfall radar and ground rain gauges. China Flood Drought Manag. 2024, 34, 27–31+44. [Google Scholar] [CrossRef]
- Hu, Y.; Chen, Y.; Gao, Y.; Peng, T. Simulation Study of Typical Flash Floods based on Radar-Estimated Rainfall and WRF-Hydro Model. Plateau Meteorol. 2024, 43, 254–263. [Google Scholar] [CrossRef]
- Paz, I.; Tchiguirinskaia, I.; Schertzer, D. Rain gauge networks’ limitations and the implications to hydrological modelling highlighted with a X-band radar. J. Hydrol. 2020, 583, 124615. [Google Scholar] [CrossRef]
- Meng, L.; Zhang, Y.; Guo, J.; Fang, Q.; He, Y.; Wei, Y.; Liu, Y. Research on the Construction and Application of the Small Watershed Four Pre platform in Jianshi County, Hubei province. In Proceedings of the 2023 (11th) China Water Resources Informatization Technology Forum, Qingdao, China, 30 July–1 August 2023; pp. 424–436. [Google Scholar] [CrossRef]
- Guangrun River Emergency “Nanyang Practice” Work Plan[R]. Jianshi County Branch of the Enshi State Bureau of Ecology and Environment. 2021. Available online: http://www.hbjs.gov.cn/xxgk/dfbmptlj/xz/sthjjjsxfj/FDZDGKNR/GYSYJS/TFGGSJ/202111/P020211124368506270644.pdf (accessed on 24 November 2021).
- Tian, J.; Chu, Z.; Liu, H.; Zhang, Y.; Zhang, Y. Construction and application of the X-Band precipitation radar system for mountain torrent disaster mitigation in the eastern helan mountain region. In Proceedings of the 2024 Annual Academic Conference on Disaster Risk Reduction, Fuzhou, China, 25–28 October 2024; pp. 165–178. [Google Scholar] [CrossRef]
- Zhai, X.; Guo, L.; Liu, R.; Zhang, Y.; Liu, C. Development and Application of China Flash Flood Hydrological Model: Case Study in Small and Medium-sized Catchments of Anhui Province. J. Basic Sci. Eng. 2020, 28, 1018–1036. [Google Scholar] [CrossRef]
- Zhai, X.; Guo, L.; Liu, R.; Zhang, Y. Rainfall threshold determination for flash flood warning in mountainous catchments with consideration of antecedent soil moisture and rainfall pattern. Nat. Hazards 2018, 94, 605–625. [Google Scholar] [CrossRef]
- Zhai, X.; Guo, L.; Liu, R.; Zhang, Y.; Wang, Y. Impact assessment of antecedent soil moisture conditions and rain fall variability on flash flood warning index at catchment scale. Geogr. Res. 2019, 38, 2957–2965. [Google Scholar] [CrossRef]
- Wang, X.; Guo, L.; Zhai, X.; Liu, R.; Liu, C. Flood frequency analysis in small and medium-sized catchments based on China Flash Flood hydrological(CNFF)model. China Flood Drought Manag. 2022, 32, 31–35. [Google Scholar] [CrossRef]
- Wang, W.; Lin, W.; Wang, F.; Bi, W.; Zhang, D.; Chai, F. Numerical simulation study on the evolution of floods in the Gongquxi Storage and Retention Area—A case study in the Haihe “23·7” Basin-wide extreme flood. China Flood Drought Manag. 2023, 33, 45–49+66. [Google Scholar] [CrossRef]
- Lin, W.; Wang, F.; Bao, C.; Wang, W.; Zhang, D.; Fang, Z.; Shen, N.; Bi, W. FEDE application for flood management under modern matrix management in reservoirs—A case study in Hengshan Reservoir of Yixing City, Jiangsu Province. China Flood Drought Manag. 2024, 34, 73–79. [Google Scholar] [CrossRef]
- Huang, Q. Integrated analysis and empirical validation of typical rainstorm-induced mountain torrent disasters in small watersheds. China Flood Drought Manag. 2025, 1–7. [Google Scholar] [CrossRef]
- Smith, L.S.; Liang, Q. Towards a generalised GPU/CPU shallow-flow modelling tool. Comput. Fluids 2013, 88, 334–343. [Google Scholar] [CrossRef]
- Hou, J.; Simons, F.; Mahgoub, M.; Hinkelmann, R. A robust well-balanced model on unstructured grids for shallow water flows with wetting and drying over complex topography. Comput. Methods Appl. Mech. Eng. 2013, 257, 126–149. [Google Scholar] [CrossRef]
- Hou, J.; Liang, Q.; Zhang, H.; Hinkelmann, R. An efficient unstructured MUSCL scheme for solving the 2D shallow water equations. Environ. Model. Softw. 2015, 66, 131–152. [Google Scholar] [CrossRef]
- Mi, J.; Tian, J.; Xue, H.; Qiu, Q.; Liu, R. Evaluation of the application of radar rainfall measurement and nowcasting from the hydrological per-spective of small and medium basins. Sci. Technol. Eng. 2022, 22, 10247–10254. [Google Scholar]
- Cheng, D.; Liu, R.; Zhai, X.; Zhao, Y.; Liu, X. Real-time dynamie analysis of flash flood warning indicatorsbased on China Flash Flood Hydrological Model. J. China Inst. Water Resour. Hydropower Res. 2023, 21, 444–454. [Google Scholar] [CrossRef]
- Niu, R.; Tang, Y.; Wei, G.; Tang, W. Automatic Monitoring System of Area Rainfall based on Rain Radar. Water Resour. Informatiz. 2015, 33–36. [Google Scholar] [CrossRef]
- Yang, C.; Feng, L.; Tao, R.; Dong, X. Analysis on rainfall observation accuracy by radar and its application. Yangtze River 2014, 45, 36–39. [Google Scholar] [CrossRef]
- Yuan, W.; Yang, Y.; Zhao, X.; Guo, J.; Hu, S. Application progress of rainfall monitoring and forecasting techniques in flood control and disaster reduction. Yangtze River 2024, 55, 8–14+22. [Google Scholar] [CrossRef]
- Liu, Y.; Ma, J.; Chen, M.; Shi, Z. Study on Differences and Fusion Mosaic Methods of Parameters Between S-Band and X-Band Weather Radars. Meteorol. Mon. 2024, 50, 488–498. [Google Scholar] [CrossRef]
- Wu, J.; Dong, W.; Zhang, Y.; Chen, Y.; Xu, H.; Chen, X. Application of multi-source rainfall data in the flash flood forecast of Guanshan River Basin. Eng. J. Wuhan Univ. 2021, 54, 72–81. [Google Scholar] [CrossRef]


| Rainfall Event | RE (%) | Spatial Scale RMSE | Temporal Scale RMSE |
|---|---|---|---|
| 3 July 2024 | 3.58 | 0.26 | 0.31 |
| 13 July 2024 | 4.23 | 0.28 | 0.37 |
| Parameters | Meaning | Parameter Value | Parameter Value Lower Limit | Parameter Value Upper Limit |
|---|---|---|---|---|
| B | Storage Capacity Distribution Curve Exponent | 0.2 | 0 | 1 |
| IMP | Impervious Area Proportion | 0.01 | 0 | 1 |
| WUM | Upper Layer Soil Water Storage Capacity | 20 | 1 | 20 |
| WLM | Lower Layer Soil Water Storage Capacity | 60 | 6 | 90 |
| WDM | Deep Layer Soil Water Storage Capacity | 40 | 20 | 100 |
| EX | Free Water Storage Capacity Curve Exponent | 1.2 | 1 | 2 |
| SM | Free Water Reservoir Capacity | 25 | 0 | 50 |
| KS | Interflow Daily Outflow Coefficient | 0.5 | 0.1 | 1 |
| KG | Groundwater Daily Outflow Coefficient | 0.2 | 0 | 10 |
| KKS | Interflow Daily Recession Coefficient | 0.1 | 0 | 1 |
| KKG | Groundwater Daily Recession Coefficient | 0.1 | 0 | 1 |
| Rainfall Event | Relative Error of Runoff Depth (%) | Relative Error of Peak Flow (%) | Time Error of Peak Occurrence (h) | NSE | ||||
|---|---|---|---|---|---|---|---|---|
| Rainfall Stations | X-Band Radar | Rainfall Stations | X-Band Radar | Rainfall Stations | X-Band Radar | Rainfall Stations | X-Band Radar | |
| 3 July 2024 | 11.9 | 4.3 | 5.0 | 1.2 | 2 | 1 | 0.90 | 0.96 |
| 13 July 2024 | 7.0 | 13.8 | 1.2 | 0.9 | 2 | 1 | 0.54 | 0.86 |
Disclaimer/Publisher’s Note: The statements, opinions and data contained in all publications are solely those of the individual author(s) and contributor(s) and not of MDPI and/or the editor(s). MDPI and/or the editor(s) disclaim responsibility for any injury to people or property resulting from any ideas, methods, instructions or products referred to in the content. |
© 2025 by the authors. Licensee MDPI, Basel, Switzerland. This article is an open access article distributed under the terms and conditions of the Creative Commons Attribution (CC BY) license (https://creativecommons.org/licenses/by/4.0/).
Share and Cite
Xiong, Y.; Meng, L.; Tian, J.; Zhang, Y. Evaluation of X-Band Radar for Flash Flood Modeling in Guangrun River Basin. Water 2025, 17, 1811. https://doi.org/10.3390/w17121811
Xiong Y, Meng L, Tian J, Zhang Y. Evaluation of X-Band Radar for Flash Flood Modeling in Guangrun River Basin. Water. 2025; 17(12):1811. https://doi.org/10.3390/w17121811
Chicago/Turabian StyleXiong, Yan, Lingsheng Meng, Jiyang Tian, and Yuefen Zhang. 2025. "Evaluation of X-Band Radar for Flash Flood Modeling in Guangrun River Basin" Water 17, no. 12: 1811. https://doi.org/10.3390/w17121811
APA StyleXiong, Y., Meng, L., Tian, J., & Zhang, Y. (2025). Evaluation of X-Band Radar for Flash Flood Modeling in Guangrun River Basin. Water, 17(12), 1811. https://doi.org/10.3390/w17121811