1. Introduction
Irrigation plays a pivotal role in ensuring efficient agricultural practices, directly impacting crop yield and water conservation. Traditional sprinkler systems often face challenges in achieving optimal water distribution, leading to inefficiencies in both water use and energy consumption. Effective irrigation requires precise application of water at the right time and amount, which can be measured using metrics such as application depth and the water distribution uniformity coefficient [
1].
Researchers such as DeBoer et al. [
1] and Kohl et al. [
2] have discussed the significance of droplet size in determining distribution patterns. Key factors influencing performance include nozzle size [
3], operating pressure [
4], sprinkler spacing [
5], riser height [
6], and field topography [
7]. Environmental conditions, including wind speed and direction, further influence system efficiency, as shown by Hua et al. [
8].
Uniformity of irrigation is crucial and poor distribution can lead to crop stress, increased energy consumption, and higher operational costs [
9]. Methods such as auxiliary nozzles [
10], distributive needles [
11], and non-circular nozzles [
12] have been proposed to enhance spray characteristics. However, as noted by Karmeli [
13], their performance tends to decline under low-pressure conditions.
To address these challenges, recent research has focused on low-pressure sprinkler systems operating below 100 kPa for water and energy conservation [
14]. Nevertheless, these systems often exhibit uneven distribution and limited spray range [
15,
16]. Zhu et al. [
17] and Zhang et al. [
18] demonstrated that traditional sprinklers operating under low pressure suffer from concentrated water jets, leaving the front and midstream areas under-irrigated.
To overcome these limitations, the Spiral Fluidic Sprinkler (SFS), developed at Jiangsu University, has been introduced. This device leverages a passive spiral fluidic mechanism to generate oscillatory spray without moving parts, allowing for uniform water application even under low pressure. Unlike traditional systems, the SFS operates on the principle of dynamic spiral flow, improving spray coverage and droplet distribution [
19,
20,
21,
22,
23].
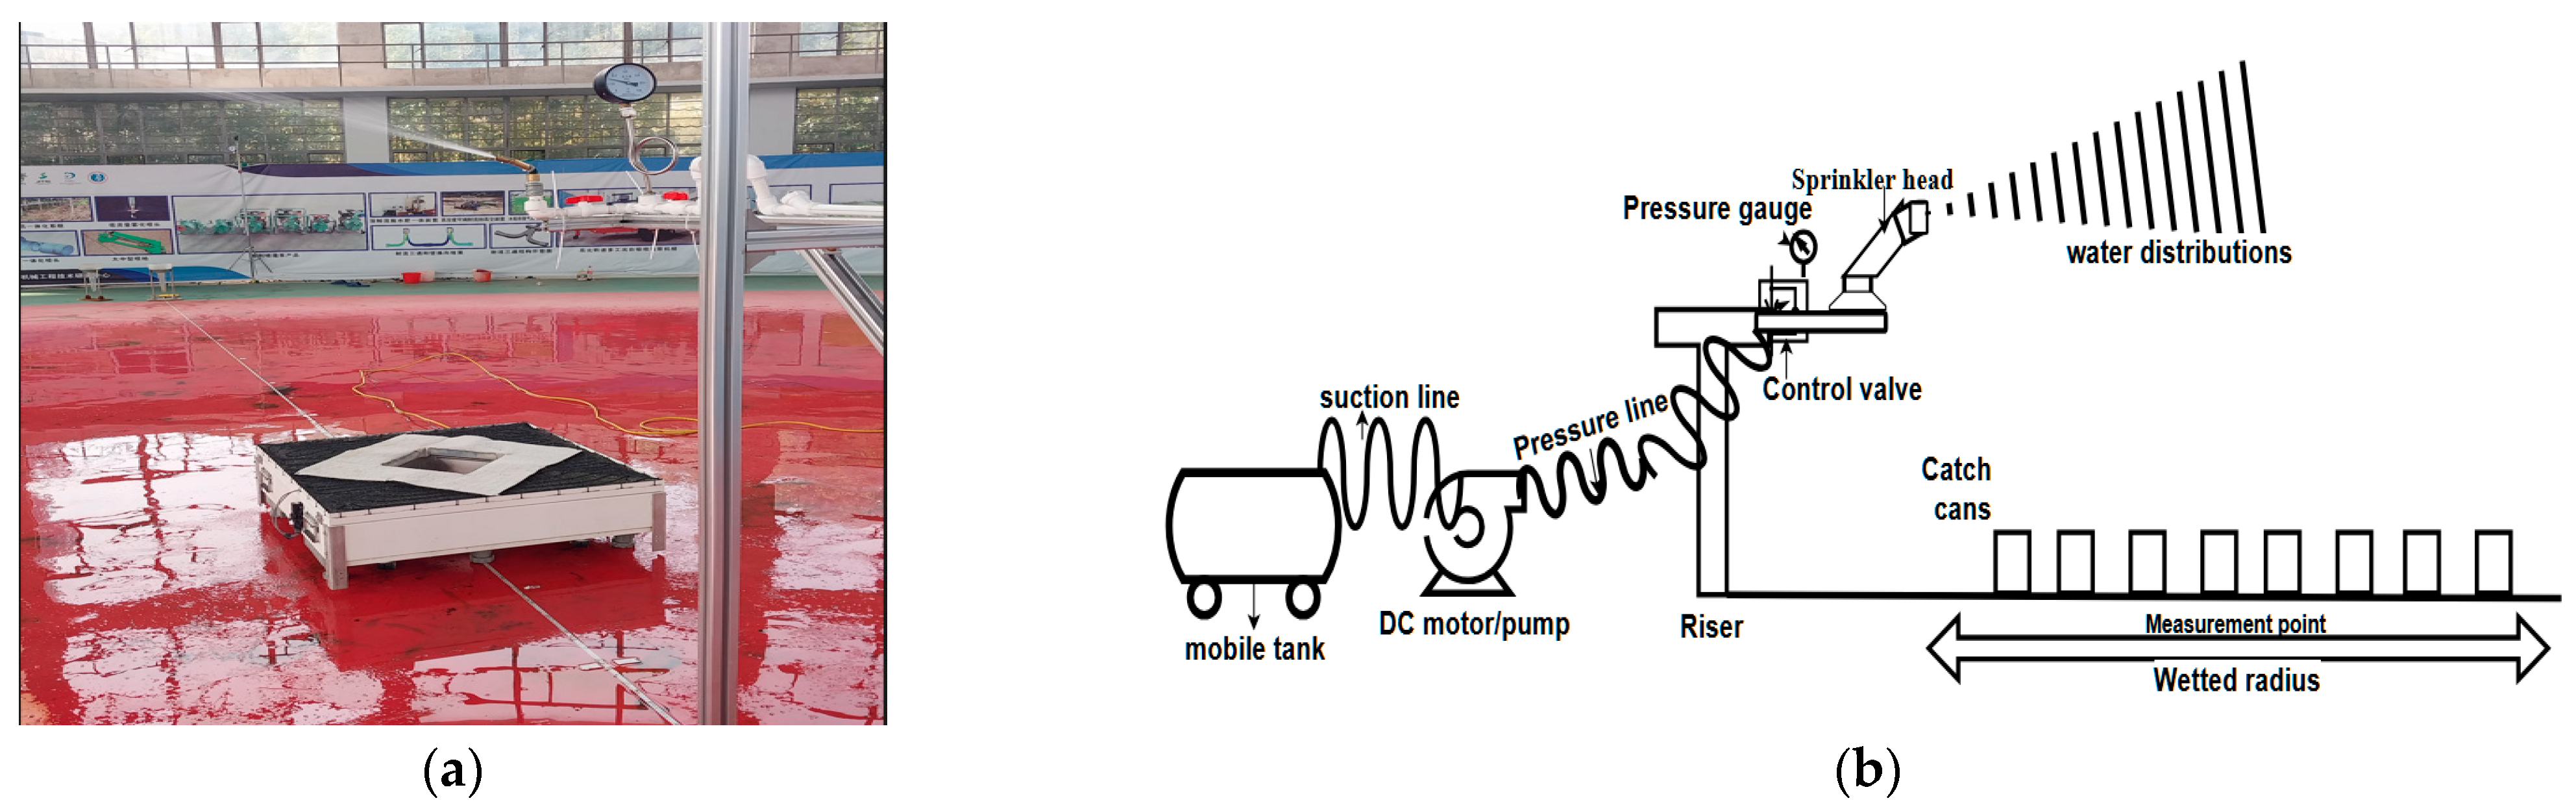
Indoor testing was conducted to eliminate environmental noise such as wind and terrain variability, ensuring consistency and repeatability in measuring hydraulic performance. The novelty of this study lies in evaluating a sprinkler system that uses spiral fluidics to achieve dynamic, low-pressure spray; an approach that is scarcely explored in the irrigation literature [
24].
The primary objective of this study is to evaluate the hydraulic performance of the SFS under various nozzle sizes (3, 4, and 5 mm) and operating pressures (100–250 kPa). These nozzle sizes and pressure ranges were selected to encompass both small-scale precision irrigation and large-scale agricultural applications. This research will assess key parameters such as water distribution uniformity, droplet size characteristics, and kinetic energy, aiming to identify optimal configurations for efficient low-pressure irrigation. This study hypothesizes that the Spiral Fluidic Sprinkler (SFS) will outperform conventional sprinklers in terms of water distribution uniformity, particularly under low-pressure operating conditions, making it a promising solution for sustainable and energy-efficient irrigation systems.
3. Results and Discussion
3.1. Spray Range for Nozzle Sizes
The measurements of the spray ranges were repeated three times, and the averages were recorded. The spray ranges for different nozzle sizes are listed in
Table 2. Different nozzle sizes resulted in variations in sprinkler ranges under the same operating pressure. The radius of throw increased as the nozzle size increased for all pressures. The lowest radius of throw was achieved when the sprinkler was operated at a pressure of 100 kPa, while the maximum radius of throw was obtained when it was operated at a pressure of 250 kPa. However, there was no appreciable variation in the radius of throw between 250 and 150 kPa.
With the rising cost of electrical energy consumed by a pump, managing the operating pressure at a lower level of 150 kPa ensures more controlled water distribution, preventing over-irrigation, reducing water wastage, and improving energy efficiency, ultimately lowering operating costs. With a pressure of 250 kPa, the spray range from the 5 mm nozzle was largest, with a value of 7.7 m, possibly due to a smaller surface area for the interruption of jet flow, leaving it undisturbed for a sufficient period within the irrigation to maintain a large spray range.
With an increase in pressure, the standard deviations were 2.6%, 2.4%, 2.5%, and 2.8% for 100, 150, 200, and 250 kPa, respectively. To determine whether the variations in spray range across pressures were statistically significant, an ANOVA test was conducted. The analysis resulted in an F-statistic of 1.15 and a p-value of 0.386. Since the p-value is greater than 0.05, the differences in spray range across pressures are not statistically significant. This indicates that while variations exist, they do not differ significantly in a statistical sense, implying that moderate pressures such as 150 kPa can provide sufficient spray range without the need for higher operating pressures, thus optimizing energy consumption and water use efficiency.
This aligns with previous research on the relationship between nozzle sizes and spray range [
24,
25]. In terms of the discharge equation, multiple studies have concluded that the discharge exponent is independent of pressure for a specific nozzle diameter and that the discharge exponent remains constant at 0.5 [
27]. In this study, the discharge exponent was assumed to be equal to 0.5. The equation allowed for the calculation of the flow rate considering each pressure and nozzle diameter, as presented in
Table 2. The discharge coefficient remained fairly unchanged across the pressure ranges for each nozzle size used in this study. This means that the discharge coefficient was independent of the working pressure, which aligns with similar findings previously reported [
28].
Smaller nozzles (3 mm) typically deliver lower discharge and application rates, which may contribute to improved uniformity. However, they may not be sufficient to meet the water requirements of larger fields. Medium-sized nozzles (4 mm) offer a balanced performance, providing higher discharge across most pressures, making them well suited for medium-to-large fields. Larger nozzles (5 mm) perform optimally at moderate pressures, making them suitable for larger fields. However, at high pressures, they may pose a risk of over-irrigation in certain areas. The study revealed that the 4 mm nozzle provides an optimal balance between uniformity and water conservation at moderate pressures (150 kPa), making it suitable for medium-sized fields.
3.2. Water Distribution Patterns for Different Nozzle Sizes at Four Operating Pressures
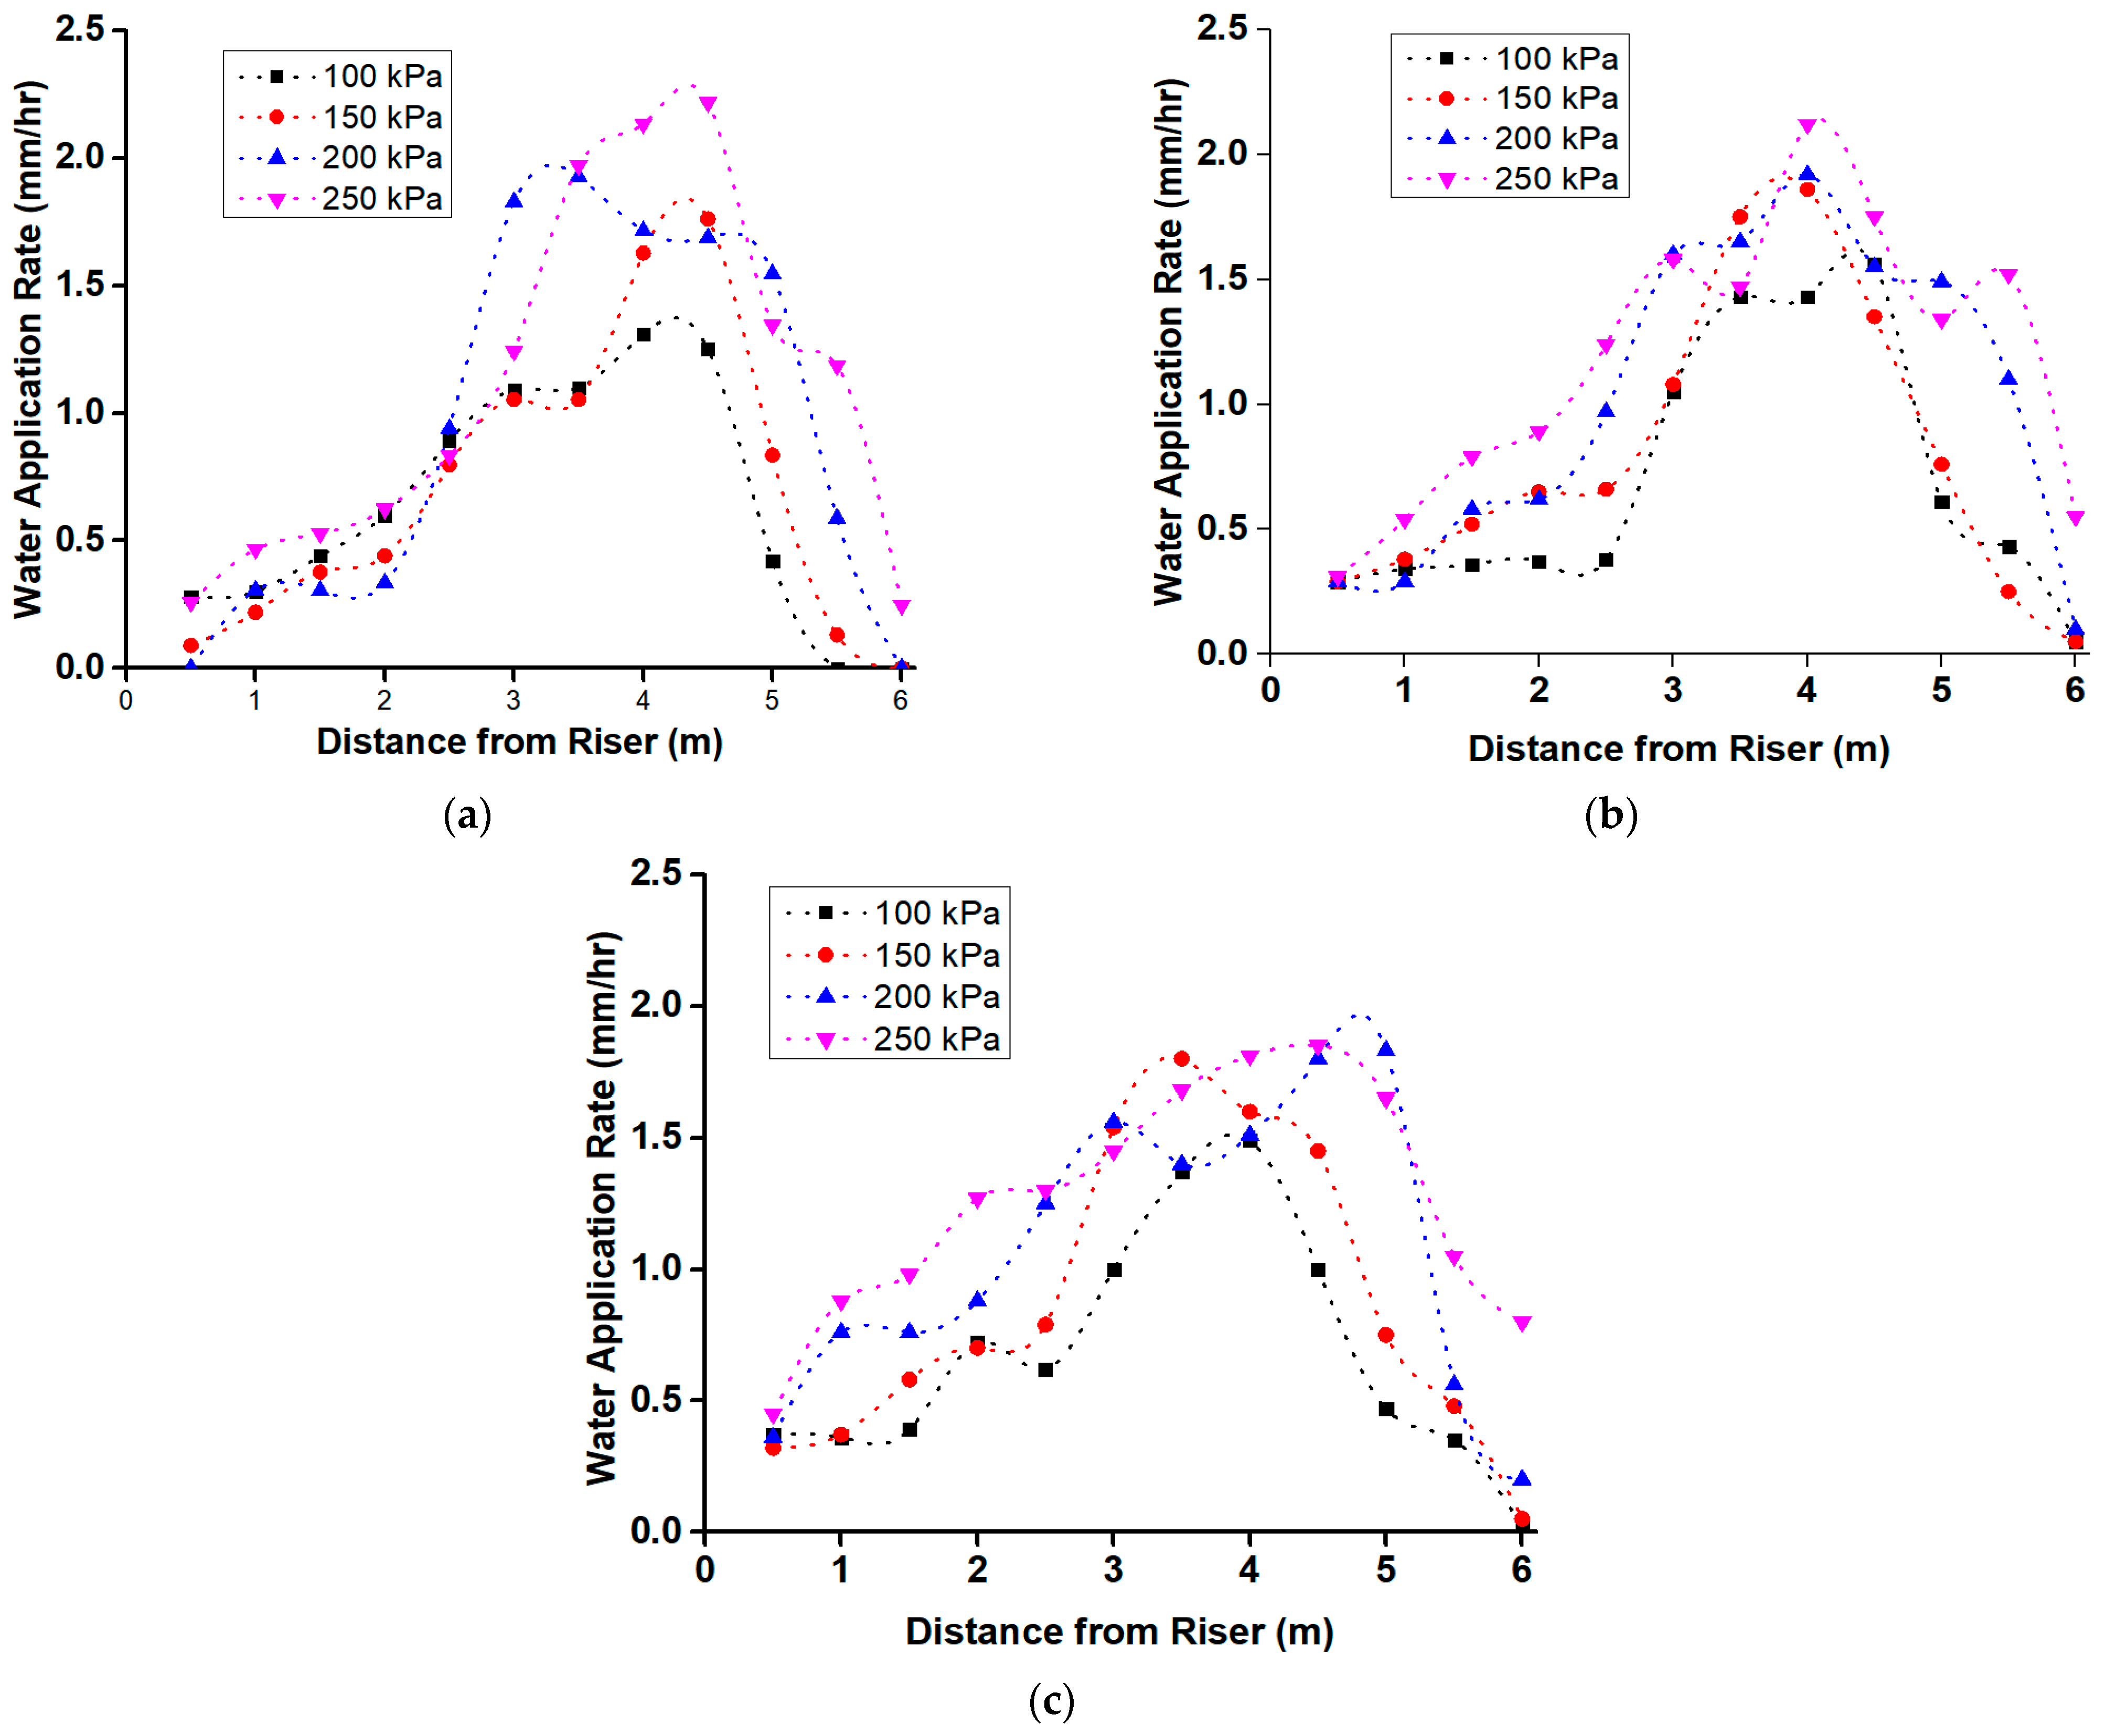
Figure 3a–c shows the water distribution for different nozzle sizes at varying operating pressures. The study revealed that the application rate increased with the sprinkler’s distance from the riser until reaching a peak, after which it declined for all pressures (100, 150, 200, and 250 kPa). The water application rate followed a similar trend across all nozzle sizes, with values rising as pressure increased until they reached a maximum, after which a decline was observed. This indicates that higher pressures enhance application rates, with peak values occurring at mid-range distances before tapering off.
For the 3 mm nozzle, water application rates varied between 0.25 and 2.22 mm/h, with the highest values recorded at 250 kPa. The peak application rate for each pressure occurred at 4.5 m: 1.25 mm/h at 100 kPa, 1.76 mm/h at 150 kPa, 1.69 mm/h at 200 kPa, and 2.22 mm/h at 250 kPa. The 4 mm nozzle followed a similar trend, with the highest application rate being 2.12 mm/h at 250 kPa, while the 5 mm nozzle exhibited the most consistent application rates across higher pressures, with values peaking at 1.85 mm/h at 250 kPa.
Water distribution profiles for different pressures exhibited a bell-shaped pattern across all nozzle sizes, with spray intensity and range varying based on pressure settings. Larger nozzles, such as 4 mm and 5 mm, produced higher average application rates due to increased discharge. However, spray intensity near the sprinkler was lower compared to that provided by smaller nozzles, as the water was distributed over a larger area. This trade-off suggests that larger nozzles improve coverage but reduce localized application near the sprinkler [
29]. Conversely, smaller nozzles resulted in more concentrated water application near the sprinkler due to increased jet breakup, forming a finer, localized spray pattern. While pressure influenced application rates, its impact was secondary to nozzle diameter, aligning with previous studies on sprinkler water distribution [
30].
Error analysis revealed variations in application rates across pressures and nozzle sizes, with the highest fluctuations occurring beyond 4.5 m. Standard deviation calculations indicated that the 3 mm nozzle had the highest fluctuations, particularly at 200 and 250 kPa, where the distribution became inconsistent at extended distances. This can be attributed to turbulence effects and non-uniform jet breakup, which led to spray dispersion. The 5 mm nozzle exhibited lower application rate variations, demonstrating better stability at higher pressures due to its larger orifice size, which reduced sensitivity to minor pressure changes. The error bars also highlighted the impact of nozzle size and pressure on uniformity, with the largest errors recorded for the 3 mm nozzle at high pressures. This suggests that smaller nozzles may not maintain stable application rates under high-pressure conditions. In contrast, mid-range pressures (150 kPa) with the 4 mm nozzle resulted in the lowest error margins, making it the most suitable choice for achieving uniform irrigation. The observed trends in application rate and distribution uniformity can be partly attributed to nozzle-induced turbulence and pressure-related discharge stability. For instance, at higher pressures (200–250 kPa), the increased velocity of water through smaller nozzles such as the 3 mm nozzle likely induced high levels of turbulence and spray instability, resulting in excessive jet breakup and non-uniform droplet dispersion. This behavior aligns with the findings of Zhang et al. [
18] and Liu et al. [
14], who reported that fine droplets formed under high shear conditions are prone to wind drift and spatial variability.
Conversely, the 5 mm nozzle showed greater discharge stability, producing coarser droplets with lower susceptibility to aerodynamic drag, consistent with previous findings [
31,
32,
33,
34,
35] that larger nozzle orifices reduce the fragmentation of the water jet. However, the trade-off includes potential over-application in peripheral regions due to a broader and more forceful spray. Notably, the dynamic spiral flow mechanism of the SFS introduces a novel effect oscillatory lateral spray movement, which was absent in earlier fluidic systems. This oscillation enhances radial coverage but introduces localized variation in kinetic energy, as shown in [
36,
37], thereby balancing droplet size consistency with spray reach.
These findings underscore the importance of coupled hydraulic–aerodynamic interactions in sprinkler performance. The SFS’s passive spiral flow enables energy redistribution without mechanical rotation, which is particularly advantageous under low-pressure conditions. This represents a novel contribution to the current body of knowledge, as previous studies [
38,
39], have largely focused on static jet or mechanically rotating systems.
These results have significant implications for agricultural irrigation, particularly in improving water-use efficiency and system design. The error analysis indicates that smaller nozzles operated at high pressures may result in non-uniform distribution, increasing the likelihood of water runoff and irrigation inefficiency. In contrast, the 4 mm nozzle at 150 kPa exhibited more stable application rates with minimal variation, making it suitable for precision irrigation. Larger nozzles, such as the 5 mm nozzle operated at 200–250 kPa, delivered consistent application rates across wider areas, benefiting crops requiring broad coverage. These findings suggest that optimizing nozzle–pressure combinations can enhance crop yield potential, reduce water losses, and support sustainable irrigation practices. As such, irrigation engineers and practitioners should select nozzle sizes and pressures based on crop requirements, field conditions, and system goals. The 4 mm nozzle at 150 kPa emerges as the most balanced configuration, offering uniform water distribution and minimal error, while the 5 mm nozzle at higher pressures may be ideal for larger fields where coverage is prioritized.
3.3. Simulated CUs
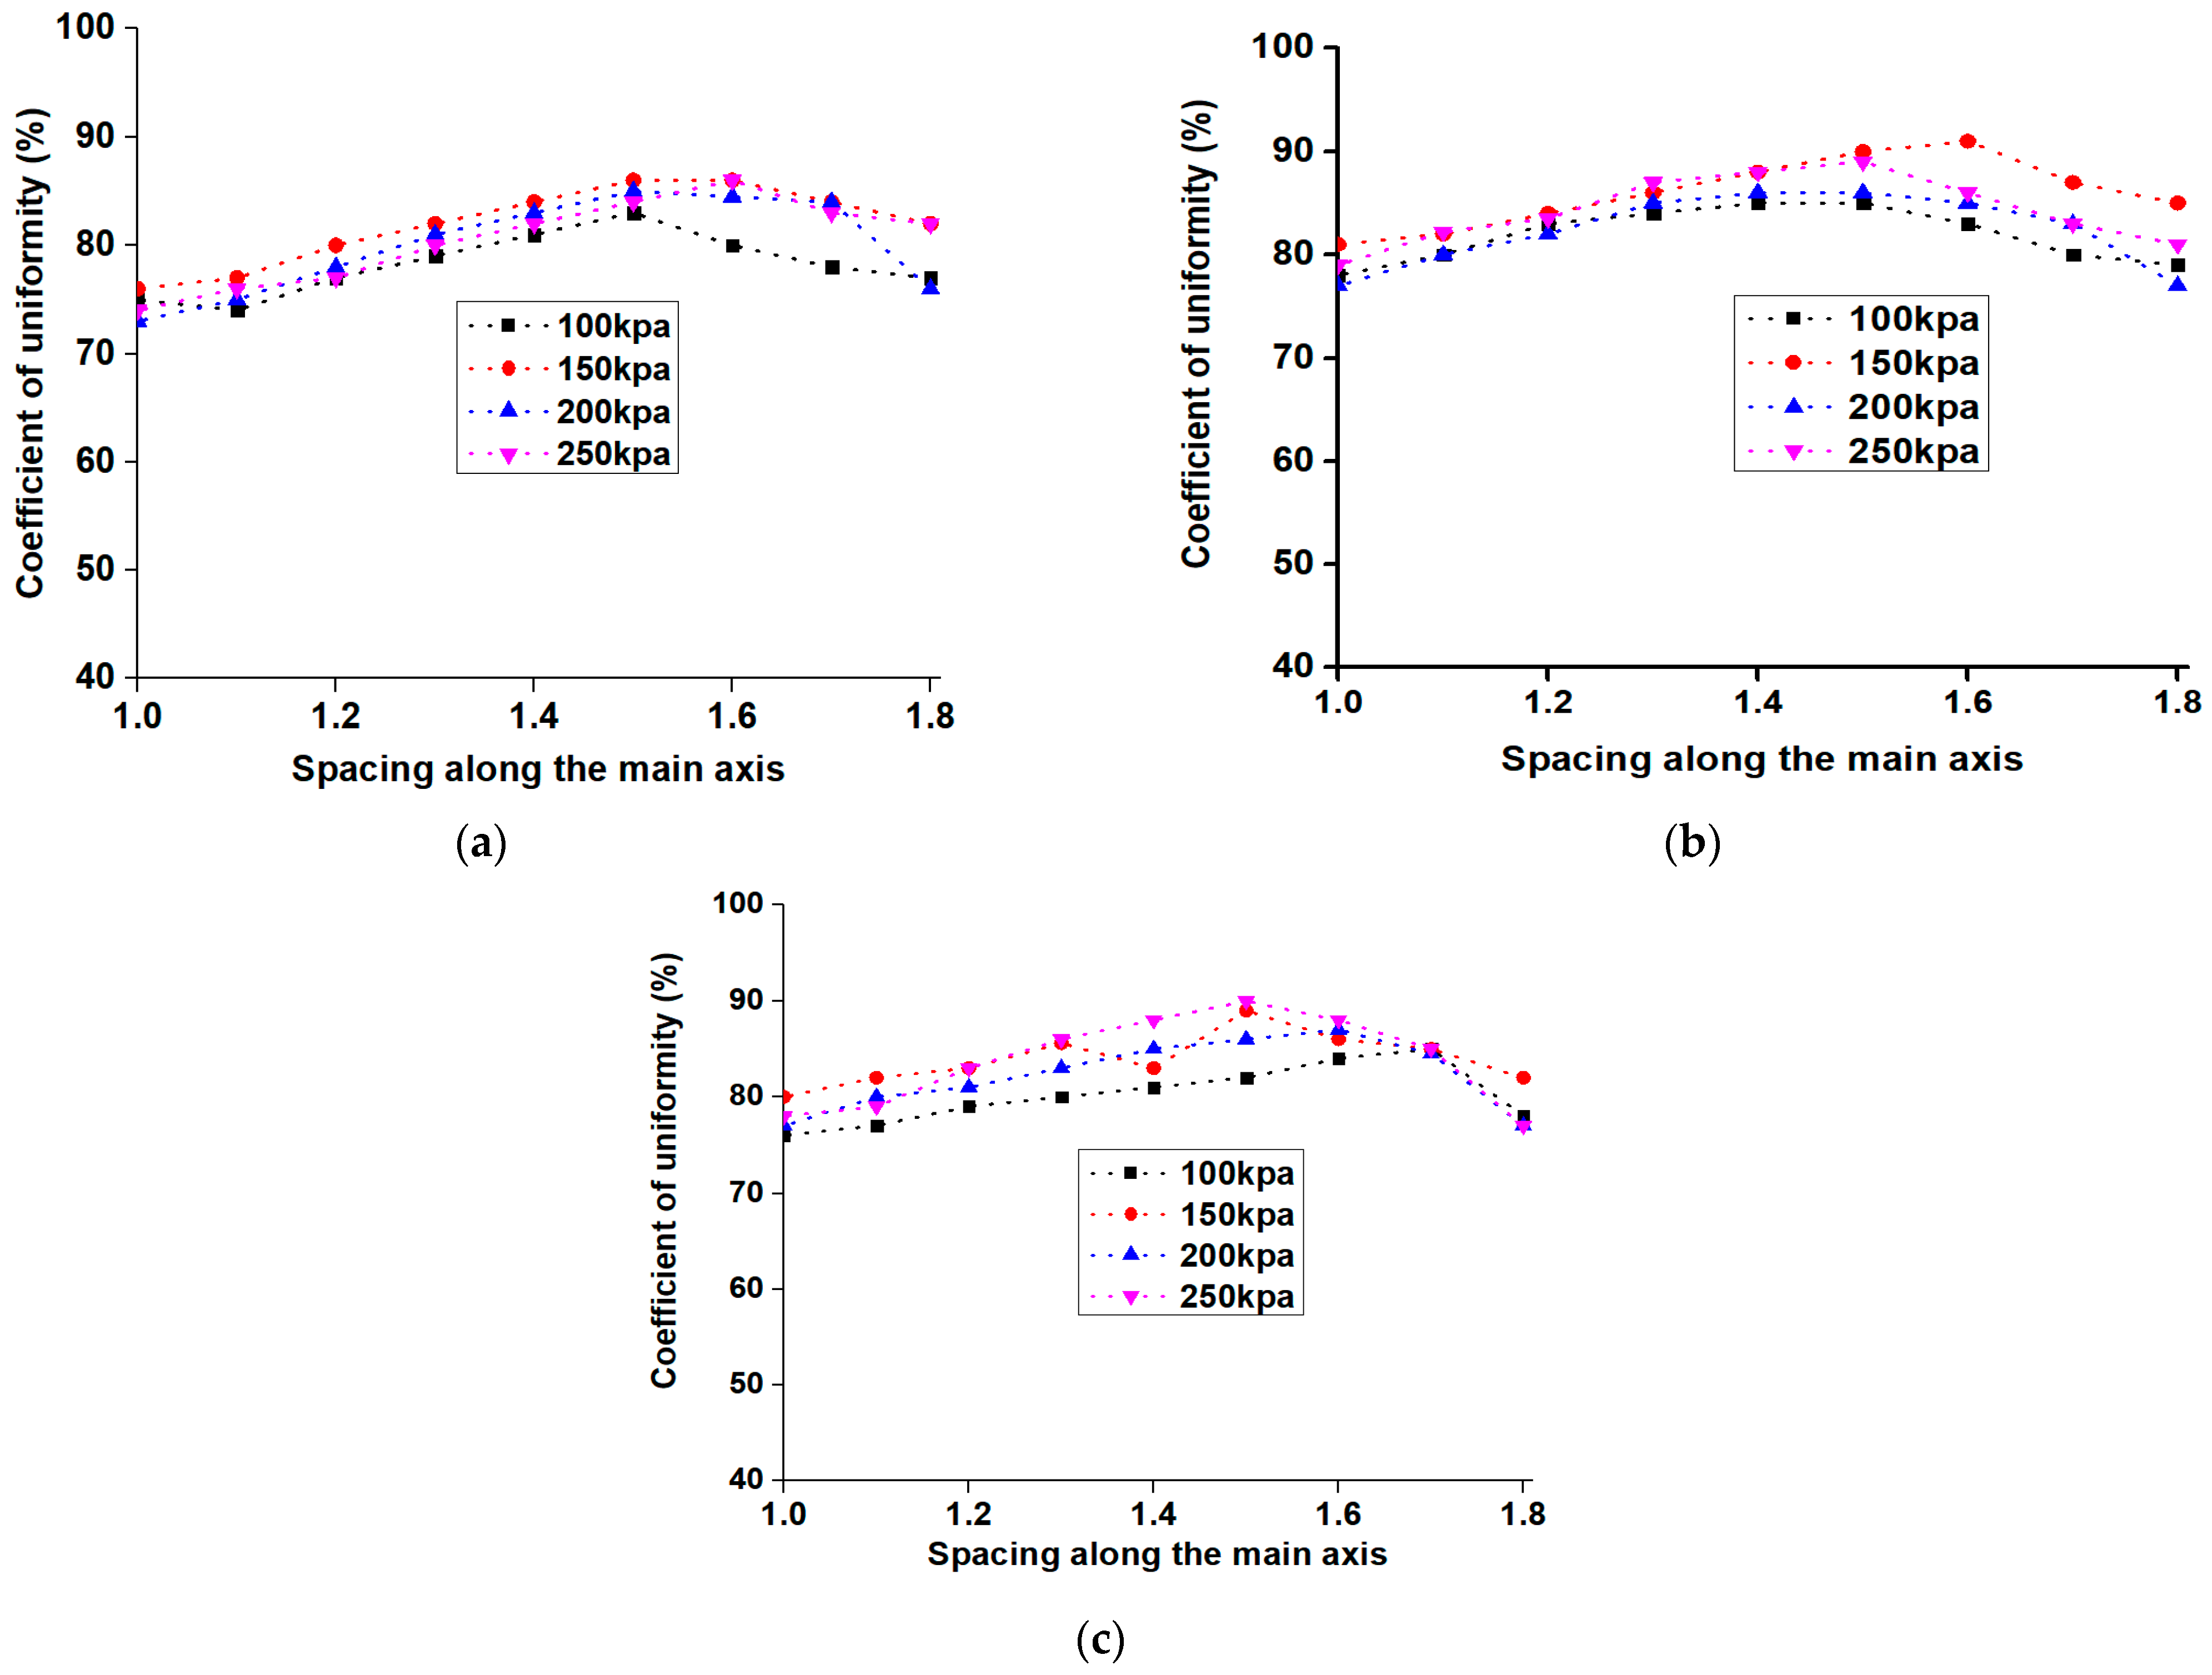
The study used rectangular spacing for lateral wetted radius multipliers of 1.0, 1.1, 1.2, 1.3, 1.4, 1.5, 1.6, 1.7, and 1.8 for all nozzle sizes.
Figure 4 illustrates the relationships between the simulated CU and spacing along the vertical and horizontal axes. As the distance from the sprinkler increased, the CU also increased until it reached the maximum and then decreased for all the pressures and nozzles. For example, the simulated CUs from the 4 mm nozzle showed an increase in spray range, reaching 77% at R to 1.3R (200 kPa) and 79% at R to 87% at 1.3R (250 kPa). The uniformities increased from 1 to 1.3R spacing for the various pressures, averaging 79.67% and 81.57%, respectively. Comparatively, the simulated CUs from the 5 mm nozzle increased from 77% to 83%, respectively. The uniformities increased from 77% at R to 83% at 1.3R (200 kPa) and from 78% at R to 86% at 1.3R (250 kPa). A comparison of the coefficient of variation (CV) showed that at 200 kPa, the 5 mm nozzle had a minimum value of 8.63%, while the 4 mm nozzle had a higher value of 12.4%. The 4 mm nozzle size exhibits a higher CV, indicating a more inconsistent distribution of water across the catchment points. In contrast, the 5 mm nozzle size demonstrates better uniformity in water distribution, as reflected by its lower coefficient of variation. Based on the t-test, the difference in the CVs for the 4 mm nozzle under 200 kPa and 250 kPa is statistically significant (
p < 0.05). This confirms that the water distribution is significantly more variable under 250 kPa pressure compared to 200 kPa pressure.
On the other hand, the simulated CUs from 3 mm at 200 kPa were only slightly lower than those below 250 kPa. More water was applied near the sprinkler as a result of the flow becoming less uniform due to the understanding that the water pressure and spray pattern typically cause the water to fall more densely near the sprinkler head. As the distance from the sprinkler increases, the water droplets tend to spread out, leading to a decrease in water intensity. This serves as more evidence that the 3 mm nozzle performs better in low-pressure environments. Using a 3 mm nozzle device as an example, the CUs rose with an average value of 79.8% (150 kPa) from 76% at R to 84% at 1.4R. The CUs showed a modest increase, with pressure increasing with spacing. This is in line with the general tendency of higher pressure observed in the sprinkler atomization effect. On the other hand, the simulated CUs from C2 at 200 kPa were only slightly lower than those at 250 kPa.
The observed trends can be attributed to the interaction of sprinkler spacing, nozzle characteristics, and operating pressures. At smaller spacings, the coefficient of uniformity (CU) is lower due to inadequate overlap of spray patterns, leading to inconsistencies in water distribution. However, as the spacing increases, the overlap between adjacent sprinkler patterns improves, and the CU increases, reaching an optimal value at spacings of approximately 1.3R to 1.4R. Beyond this point, further increases in spacing result in reduced overlap, causing a decline in CU. The study revealed that the 5 mm nozzle showed better performance at lower pressures, likely due to their ability to maintain a more consistent spray pattern and compensate for the effects of reduced pressure. Conversely, we found out that smaller nozzles, such as the 3 mm nozzle, exhibit higher sensitivity to pressure variations, which affects their uniformity.
In real agricultural settings, soil type, topography, and wind conditions could influence water distribution patterns. For example, sandy soils, which have higher infiltration rates, might require closer spacing and higher CU to prevent water loss. Conversely, clay soils may tolerate wider spacing but demand adjustments in pressure to avoid runoff. The study indicates that larger nozzles, such as the 5 mm nozzle, perform better at lower pressures due to their ability to maintain a stable spray pattern, making them more suitable for fields with limited water pressure availability. Smaller nozzles, like the 3 mm nozzle, show greater sensitivity to pressure variations, affecting uniformity, particularly in high-wind environments where finer droplets are more prone to drift.
3.4. Droplet Size Distributions
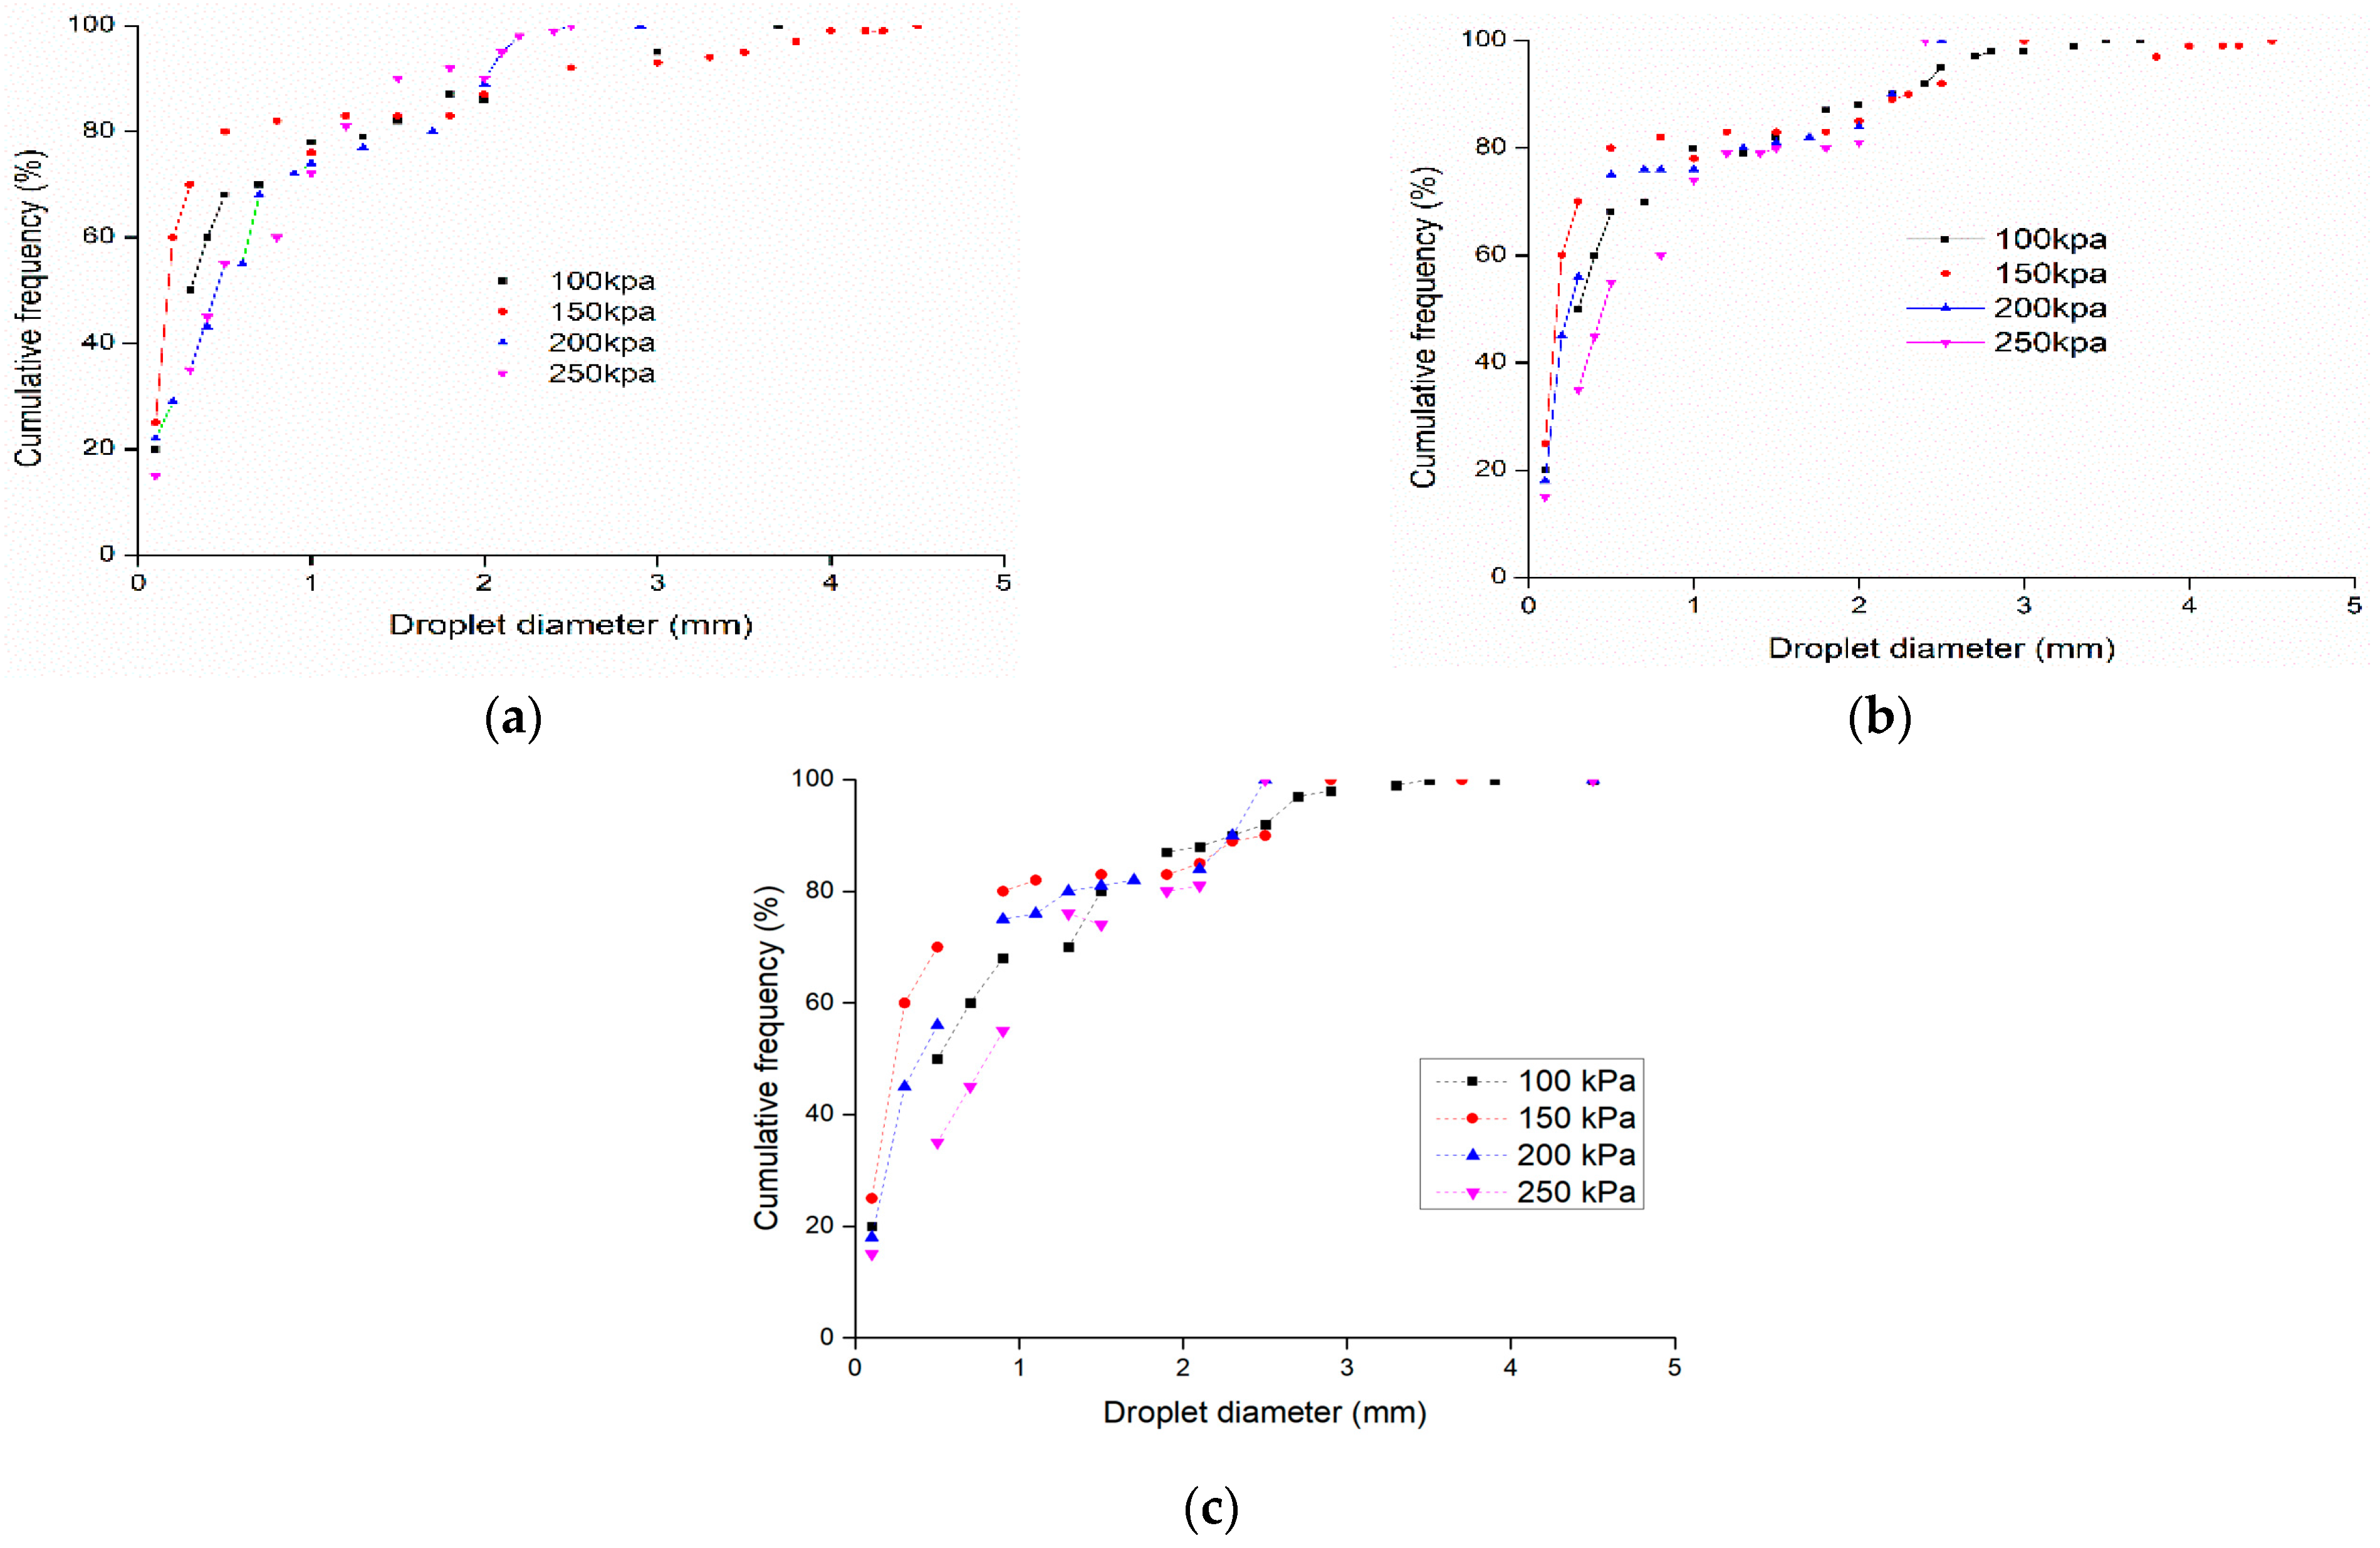
Findings of droplet size distribution were obtained at the edge of the spray range using the 2DVD technique. The weighted cumulative frequency represents the cumulative specific gravity value between the weighted full diameter of the spray and droplets smaller than one diameter. As the droplets rose in a radial direction, those with the biggest diameters fell at the terminal point.
Figure 5 displays the cumulative droplet diameter frequencies as a function of droplet diameter from three nozzle sizes under 100 kPa, 150 kPa, 200 kPa, and 250 kPa. The study revealed that the smallest droplets were visible at the sprinkler range boundaries, and the droplets’ sizes varied greatly. The average size of 3 mm nozzle droplets varied from 0.1 to 4.0 mm. The droplets under 1 mm showed a cumulative frequency of 84%, 91%, and 70% at pressures of 150, 200, and 250 kPa. Under 2 mm, the percentages were 91%, 92%, and 81%; and under 3 mm, they were 96%, 94%, and 92%. The mean diameters of the 4 mm nozzle droplets ranged from 0 to 3.8 mm. Cumulative frequencies of drops below 1 mm were found to be 77%, 80%, and 82%; drops under 2 mm had frequencies of 84%, 92%, and 90%; and drops under 3 mm had frequencies of 90%, 95%, and 96%. The study revealed minor differences in droplet diameters, especially between 200 and 250 kPa. One potential explanation is that the jet flow broke up into smaller droplets near the sprinkler at higher working pressures. These smaller droplets tended to cluster near the sprinkler and showed minimal variations in size as the pressure rose [
31]. The nozzle size of 4 mm had the largest droplet size at 1.55 mm, while the 3 mm nozzle had the narrowest droplet size range, reaching a maximum of 1.44 mm. In comparison, the 5 mm nozzle generally produced droplet sizes ranging from 0.1 to 4 mm. Under pressures of 100 kPa, 150 kPa, and 200 kPa, the droplets under 1 mm had a cumulative frequency of 86, 84, and 80%; under 2 mm, 95%, 90%, and 90%; under 3 mm, 97%, 98%, and 96%; and under 4 mm, 100% as shown in (
Figure 5). Because of the momentum loss, nozzles with smaller outlet diameters created finer droplets that tended to cover a smaller region. The increase in the nozzle’s outlet diameter resulted in insufficient disruption of the jet, leading to larger droplet sizes. This indicates that changes in the nozzle outlet diameter had a significant impact on droplet diameter, consistent with the overall trend. The ballistic model simplifies the actual situation for modeling purposes by assuming a fixed droplet size at any distance from the sprinkler. This supports the theory that droplet formation continues constantly along the jet’s path [
32].
3.5. Statistical Analyses of Droplet Diameter
The statistical analyses of droplet diameters obtained for different nozzle sizes and operating pressures are presented in
Table 3. The volumetric mean diameter, median diameter, standard deviation, and coefficient of variation were examined to evaluate the effects of nozzle size and pressure on droplet distribution. The results indicate that as operating pressure increased, the mean droplet diameter generally decreased across all nozzle sizes. This trend can be attributed to the higher kinetic energy at elevated pressures, leading to finer droplet formation due to increased jet breakup.
The standard deviations of droplet diameter ranged between 0.18 mm and 0.42 mm across different pressures and nozzle sizes, indicating variations in droplet formation consistency. The coefficient of variation, which describes the relative dispersion of droplet sizes, ranged from 76% to 134%, with an overall mean of 96%. A lower coefficient of variation is desirable, as it implies more uniform droplet distribution, which contributes to consistent water application. Smaller nozzles, such as the 3 mm nozzle, exhibited the highest coefficient of variation at 107%, suggesting a greater degree of irregularity in droplet size distribution. Medium-sized nozzles (4 mm) had an average coefficient of variation of 84%, indicating more stable and uniform droplet formation. Larger nozzles (5 mm) exhibited moderate variability, with a coefficient of variation averaging 92%, and showed increasing variability at lower pressures. These findings highlight the role of nozzle size in determining the uniformity of irrigation application, where smaller nozzles may cause uneven water distribution, while medium-to-large nozzles perform better at higher pressures.
A one-way analysis of variance (ANOVA) was conducted to determine whether the observed differences in droplet diameters were statistically significant. The results showed that both nozzle size and operating pressure had a significant impact on droplet diameter, with p-values of less than 0.001 and 0.002, respectively. The significant effect of nozzle size on droplet diameter was expected, as larger nozzles allow higher water discharge, resulting in larger droplets. Conversely, higher pressures led to smaller droplets due to increased shear forces breaking the water jet into finer particles.
A post hoc Tukey test further revealed specific differences between nozzle–pressure combinations. The 3 mm and 5 mm nozzles exhibited significant differences in droplet size at all pressure levels, confirming that nozzle diameter has a dominant influence on droplet formation. The differences between 4 mm and 5 mm nozzles were also significant at pressures of 200 and 250 kPa, indicating that the effect of pressure becomes more pronounced at higher levels. Additionally, no significant difference in droplet size was found between 100 kPa and 150 kPa for the 3 mm nozzle, suggesting that lower pressures in smaller nozzles do not significantly alter droplet size.
Regression analysis was used to quantify the relationship between droplet diameter, nozzle size, and operating pressure. The model demonstrated a strong correlation, with an R2 value of 0.87, suggesting that nozzle size and pressure are key determinants of droplet diameter. The regression results confirmed that increasing pressure leads to a reduction in droplet size, with nozzle size having a direct positive relationship with droplet diameter. These findings align with previous studies that have established the role of hydraulic energy in determining droplet breakup and size distribution.
The implications of these statistical findings are crucial for optimizing irrigation efficiency. Higher variability in droplet size, as observed with smaller nozzles, may result in uneven water infiltration, potentially leading to localized over-irrigation or under-irrigation. Medium-sized nozzles, particularly the 4 mm nozzle, demonstrated a balance between droplet uniformity and water conservation, making them more suitable for controlled irrigation at moderate pressures. At high pressures, while larger nozzles maintain a more stable droplet diameter, the risk of over-application increases. The results suggest that using the 4 mm nozzle at 150 kPa provides the best balance between uniformity and efficiency, optimizing water application while minimizing energy consumption.
The statistical significance of the results reinforces the importance of selecting appropriate nozzle sizes and pressures to enhance irrigation performance. The findings highlight the role of pressure regulation in reducing water losses due to excessive fragmentation of droplets at high pressures and the necessity of optimizing nozzle selection based on field size and irrigation requirements. The study confirms that nozzle and pressure variations must be carefully managed to ensure efficient water distribution while preventing over-irrigation, improving overall irrigation system performance.
These results provide robust statistical evidence that nozzle size and operating pressure significantly influence droplet diameter distribution in sprinkler irrigation. The findings offer practical recommendations for irrigation management, particularly for improving water-use efficiency through the appropriate selection of nozzle and pressure settings.
At a given distance from the sprinkler, the average droplet sizes generated by the sprinkler system were relatively uniform across different nozzle sizes. The smallest droplet sizes were produced by the 3 mm nozzle, which fell below the minimum recommended droplet diameter. The droplet size decreased from 0.6 mm to 0.3 mm as pressure increased, leading to higher susceptibility to evaporation and wind drift losses. This trend is consistent with previous studies [
33,
34,
35,
36,
37], which indicate that finer droplets are more prone to atmospheric dispersion under field conditions.
Despite this, the 4 mm nozzle produced larger droplet sizes compared to the 3 mm nozzle, as the reduction in maximum droplet diameter was more pronounced than the rate of decrease in the minimum droplet size. This suggests that, while the 3 mm nozzle may lead to greater water loss due to fine mist formation, the 4 mm nozzle offers a more balanced distribution of droplet sizes. The 5 mm nozzle exhibited the highest droplet sizes across all operating pressures, indicating its potential effectiveness in minimizing evaporation and wind drift losses while ensuring adequate water delivery to the soil. This characteristic makes the 5 mm nozzle more suitable for field applications where water conservation and reduced wind dispersion are critical, while also preventing excessive soil compaction or damage caused by large droplets.
A summary of droplet sizes for 10% (d
10), 50% (d
50), and 90% (d
90) percentiles at different operating pressures is presented in
Table 4. The d
10 values, representing the smallest 10% of droplets, indicate a general trend of reduction in droplet size with increasing pressure. The median droplet size (d
50) also decreased with increasing pressure, particularly for the 3 mm and 4 mm nozzles. The d
90 values, representing the largest 10% of droplets, were highest for the 3 mm nozzle at 100 and 250 kPa, but remained more stable for the 4 mm and 5 mm nozzles, further reinforcing the suitability of larger nozzles in reducing evaporation losses and improving application efficiency. These results highlight the importance of selecting appropriate nozzle sizes and operating pressures based on environmental conditions and irrigation objectives. For applications where water conservation is a priority, the 5 mm nozzle appears to be the most effective in reducing droplet loss due to evaporation and wind drift, while maintaining an adequate distribution of droplet sizes to prevent soil erosion.
3.6. Distribution of the Kinetic Energy of the Water Droplets
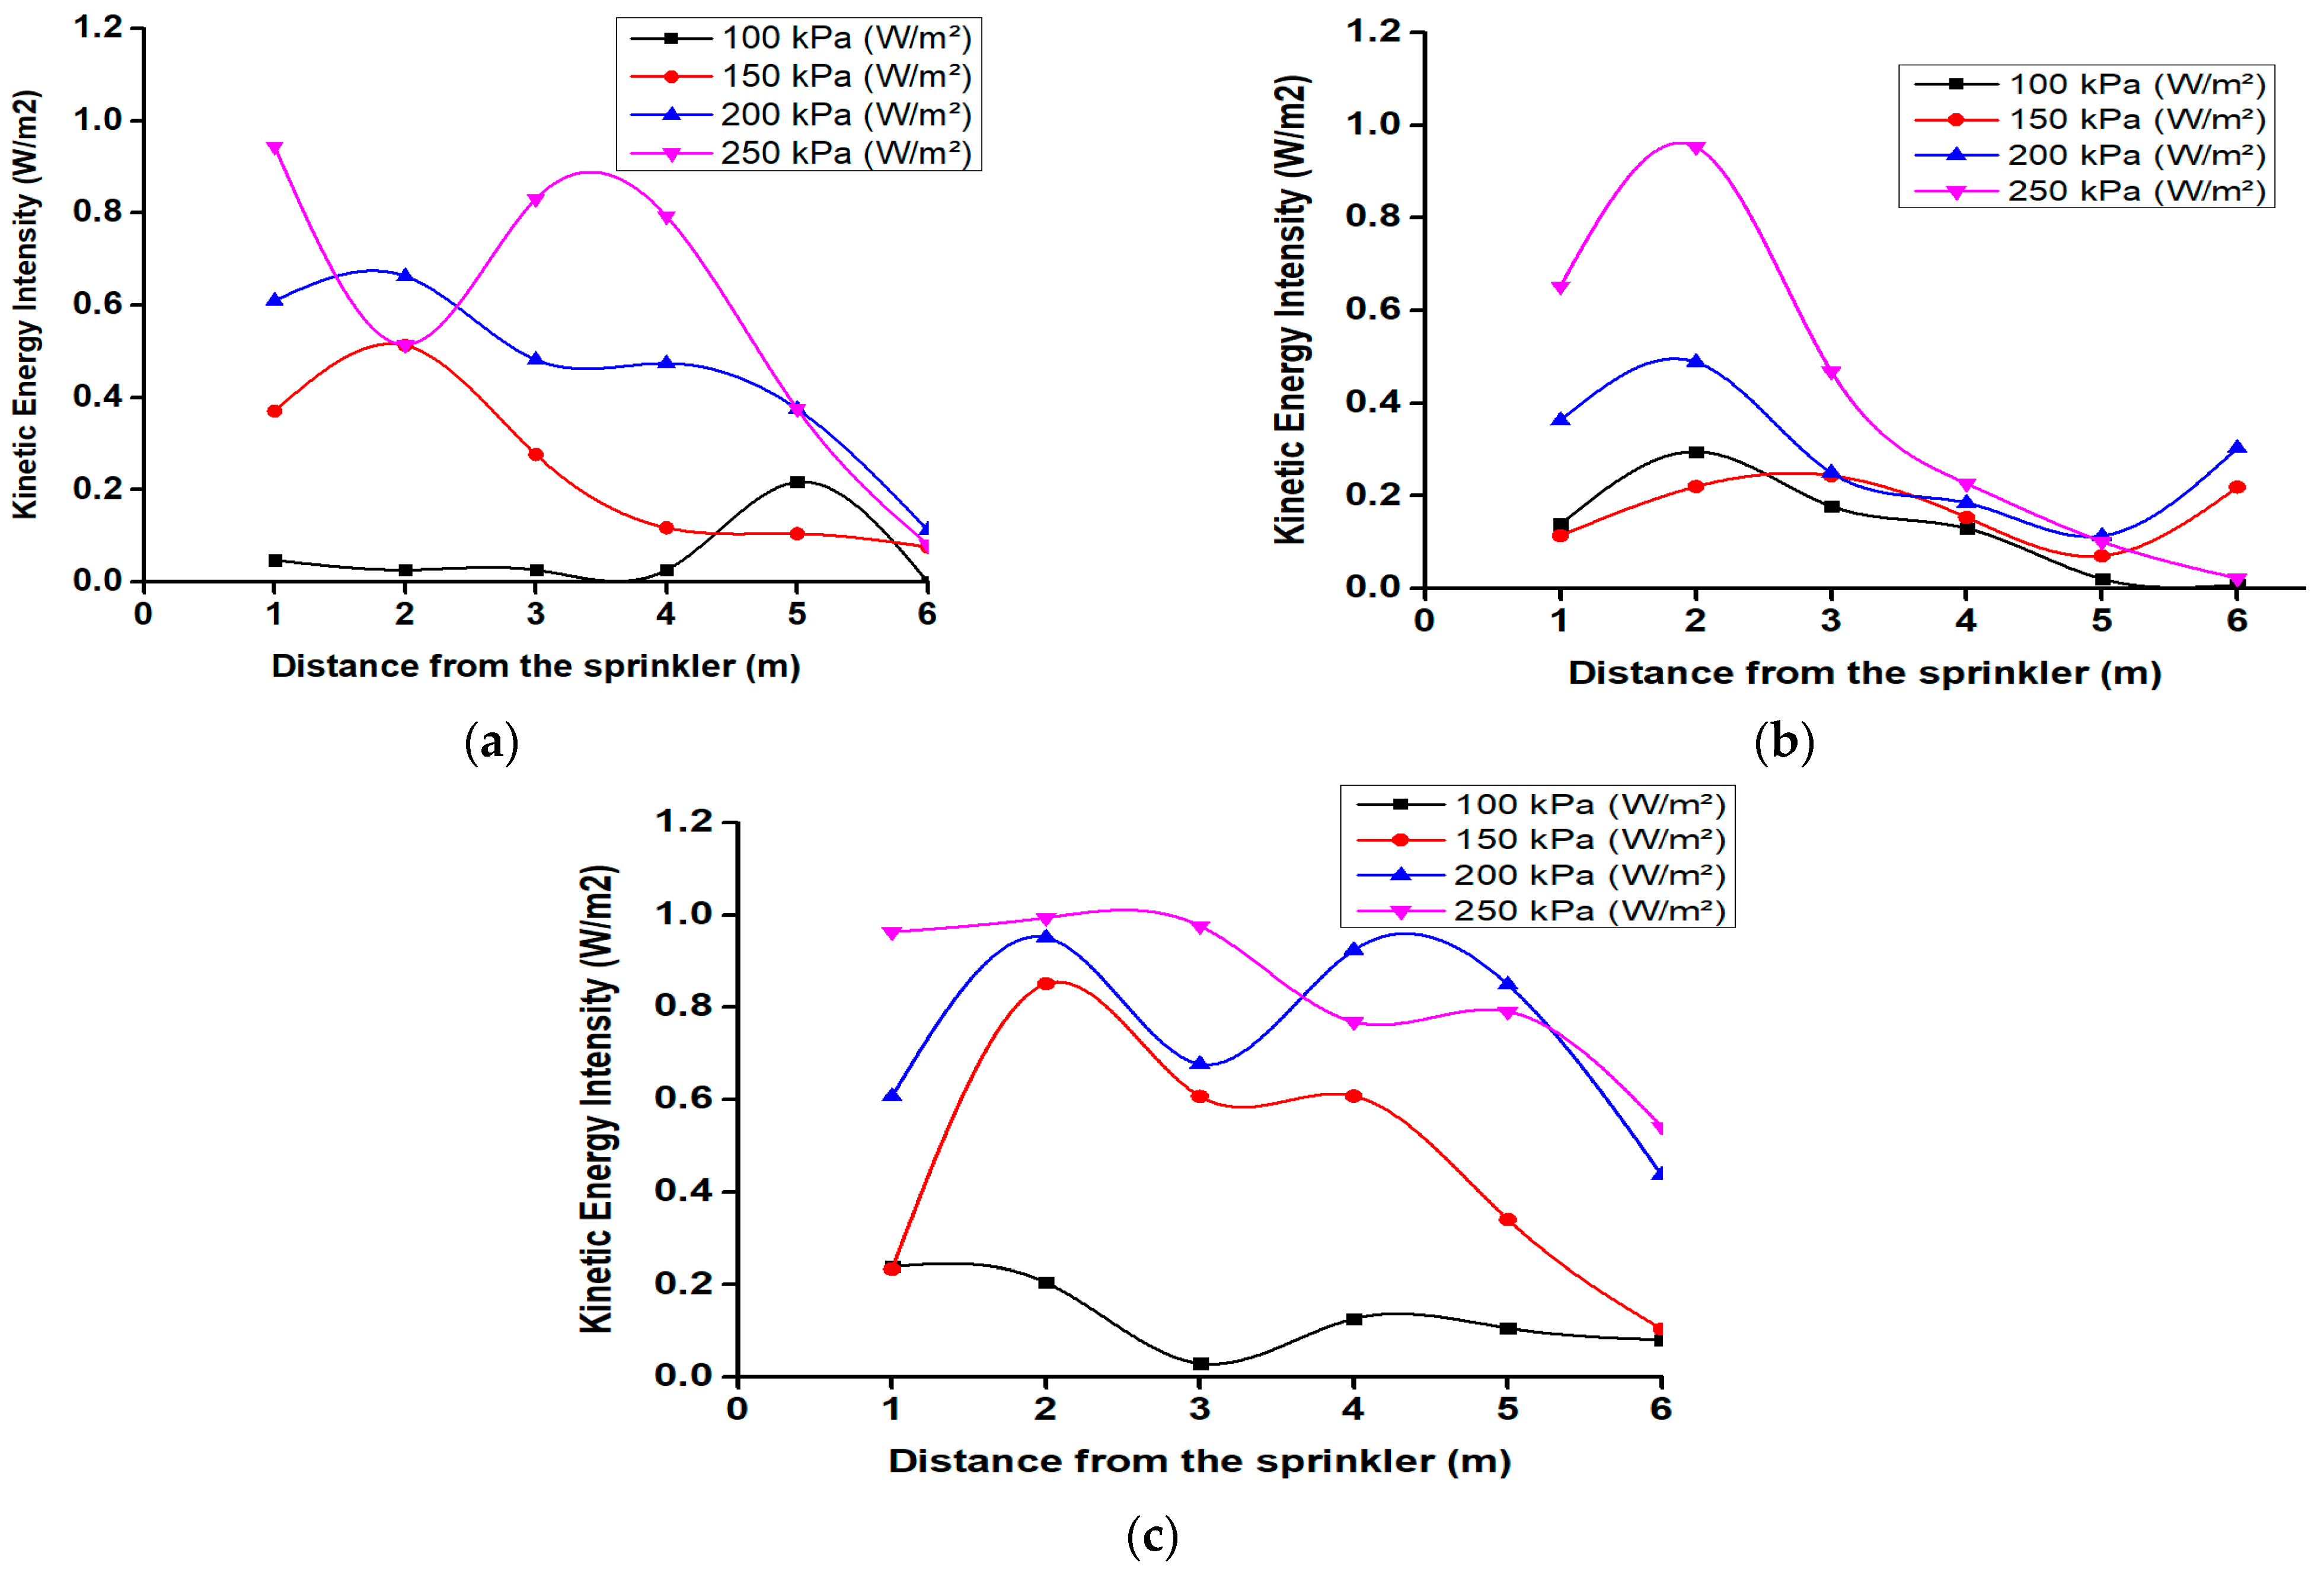
Figure 6 shows the kinetic energy intensity of water droplets generated by different nozzle sizes under varying pressures and distances from the riser was analyzed for a fluidic sprinkler system. The results demonstrate the effect of working pressure on droplet velocity, momentum distribution, and spray efficiency. The highest kinetic energy intensity was observed at 250 kPa, whereas lower pressures, specifically 100 kPa and 150 kPa, exhibited more stable distributions with fewer fluctuations.
For the 3 mm nozzle, the kinetic energy values varied across different pressures, indicating that droplet momentum is influenced by the interaction between jet breakup forces and aerodynamic resistance. At 100 kPa, the kinetic energy intensity ranged from 0.03 × 10⁻³ to 0.42 × 10⁻³ W/mm2. The droplets formed at this pressure were larger due to reduced breakup forces, resulting in slower velocities and lower energy transfer. At 150 kPa, the kinetic energy intensity increased, with a peak value of 0.51 × 10⁻³ W/m2, indicating a momentary increase in droplet velocity. However, most values remained lower, suggesting that droplet fragmentation led to energy dissipation at certain points. At 200 kPa, kinetic energy values ranged between 0.11 × 10⁻³ and 0.66 × 10⁻³ W/m2, demonstrating an increase in droplet velocity due to higher pressure. However, excessive droplet breakup at this stage resulted in smaller droplets, leading to reduced energy intensity. At 250 kPa, the highest kinetic energy intensity recorded was 0.94 × 10⁻³ W/m2, indicating a significant increase in droplet momentum and velocity. Nevertheless, some values, such as 0.08 × 10⁻³ W/m2, dropped significantly, likely due to excessive fragmentation and energy loss associated with fine mist formation. Kinetic energy intensity decreased as droplets traveled farther from the riser, particularly under lower-pressure conditions. At higher pressures between 200 and 250 kPa, increased momentum allowed droplets to travel greater distances while retaining significant energy. For the 3 mm nozzle, the peak droplet kinetic energy intensity at 100, 150, 200, and 250 kPa was 0.42 × 10⁻³ W/m2, 0.51 × 10⁻³ W/m2, 0.66 × 10⁻³ W/m2, and 0.94 × 10⁻³ W/m2, respectively, with intensity increasing by 21.4%, 29.4%, and 42.4% per incremental pressure increase compared to 100 kPa.
For the 4 mm nozzle, the kinetic energy intensity of droplets was assessed under varying pressures and distances from the riser, illustrating the influence of working pressure on droplet velocity, energy retention, and spray coverage. At 100 kPa, kinetic energy intensity values ranged from 0.008 × 10⁻³ to 0.30 × 10⁻³ W/m2. The larger droplet sizes at this pressure resulted in lower velocities and reduced energy transfer. At 150 kPa, kinetic energy values increased, with a peak value of 0.22 × 10⁻³ W/m2, indicating improved droplet velocity and distribution. At 200 kPa, the kinetic energy values ranged between 0.11 × 10⁻³ and 0.49 × 10⁻³ W/m2, demonstrating a more balanced energy distribution that enhanced spray uniformity. At 250 kPa, the highest kinetic energy intensity recorded was 0.95 × 10⁻³ W/m2, reflecting increased droplet momentum and velocity. However, some values, such as 0.02 × 10⁻³ W/m2, were significantly lower, suggesting energy loss due to excessive jet breakup and mist formation. As observed with the 3 mm nozzle, kinetic energy intensity declined as droplets moved farther from the riser, particularly under lower-pressure conditions. At higher pressures of 200 to 250 kPa, increased droplet momentum allowed for extended travel distances with significant energy retention.
For the 5 mm nozzle, the kinetic energy intensity of droplets was analyzed under varying pressures and distances from the riser. The results highlight the influence of working pressure on droplet velocity, energy retention, and overall spray performance. At 100 kPa, kinetic energy intensity values ranged from 0.00 × 10⁻³ to 0.22 × 10⁻³ W/m2, indicating larger droplets with reduced velocity due to lower pressure. At 150 kPa, kinetic energy values increased, with a peak of 0.51 × 10⁻³ W/m2, suggesting improved droplet velocity and distribution. At 200 kPa, kinetic energy values ranged between 0.11 × 10⁻³ and 0.66 × 10⁻³ W/m2, demonstrating a balanced energy distribution that enhanced spray uniformity. At 250 kPa, the highest kinetic energy intensity recorded was 0.94 × 10⁻³ W/m2, reflecting increased droplet momentum and velocity. However, some values, such as 0.08 × 10⁻³ W/m2, were significantly lower, indicating energy dissipation due to excessive jet breakup and mist formation. As with the other nozzle sizes, kinetic energy intensity declined as droplets moved farther from the riser, particularly under lower-pressure conditions. At higher pressures of 200 to 250 kPa, increased momentum allowed for greater travel distances while maintaining substantial energy retention.
These findings suggest that for agricultural applications, pressures between 100 and 150 kPa are suitable for precision irrigation of delicate crops, as the lower kinetic energy of the droplets minimizes soil displacement and runoff, reducing water wastage. At 200 kPa, the balance between coverage and kinetic energy ensures uniform water distribution, optimizing irrigation efficiency for row crops. At 250 kPa, the increased kinetic energy enhances droplet penetration, which is beneficial for large-scale field irrigation. However, the risk of excessive evaporation and spray drift increases, leading to potential water loss if not carefully managed.
The selection of an appropriate nozzle and pressure setting plays a critical role in reducing water consumption and energy usage in irrigation systems. The 3 mm nozzle exhibits the highest kinetic energy intensity at 250 kPa (0.94 × 10⁻³ W/m2), producing the fastest-moving droplets. However, at lower pressures (100–150 kPa), it maintains stable energy levels, making it suitable for water-efficient irrigation with minimal losses. The 4 mm nozzle provides a more balanced distribution of kinetic energy, particularly at moderate pressures (150–200 kPa), ensuring efficient water application while maintaining energy conservation. The 5 mm nozzle, although capable of delivering high energy at 250 kPa (0.94 × 10⁻³ W/m2), also demonstrates significant energy dissipation due to droplet breakup, potentially leading to water loss through mist formation.
Overall, the 4 mm nozzle at 150–200 kPa offers the best balance between kinetic energy intensity, spray uniformity, and water efficiency, making it the most suitable choice for sustainable irrigation practices. By optimizing nozzle selection and working pressures, energy consumption in pressurized irrigation systems can be minimized, contributing to water conservation efforts and sustainable agricultural development.


