
The Characteristics and Source Contribution Analysis of Nutrients in Water Bodies of Small Watersheds in the Pearl River Delta


Abstract
1. Introduction
2. Study Area and Methods
2.1. Overview of the Study Area
2.2. Research Methods
2.2.1. Sampling Methods
2.2.2. Indicator Measurement Methods
2.3. Data Treatments
2.3.1. Cluster Analysis (CA)
2.3.2. Principal Component Analysis/Factor Analysis (PCA/FA)
2.3.3. Absolute Principal Component Scores-Multiple Linear Regression Model (APCS-MLR)
2.3.4. Eutrophication Assessment Method
3. Results and Analysis
3.1. Temporal and Spatial Variations in Water Quality Characteristics of the Watershed
3.2. Temporal and Spatial Factor Analysis and Pollution Source Indentification of the Watershed
3.2.1. Data Standardization and Correlation Testing
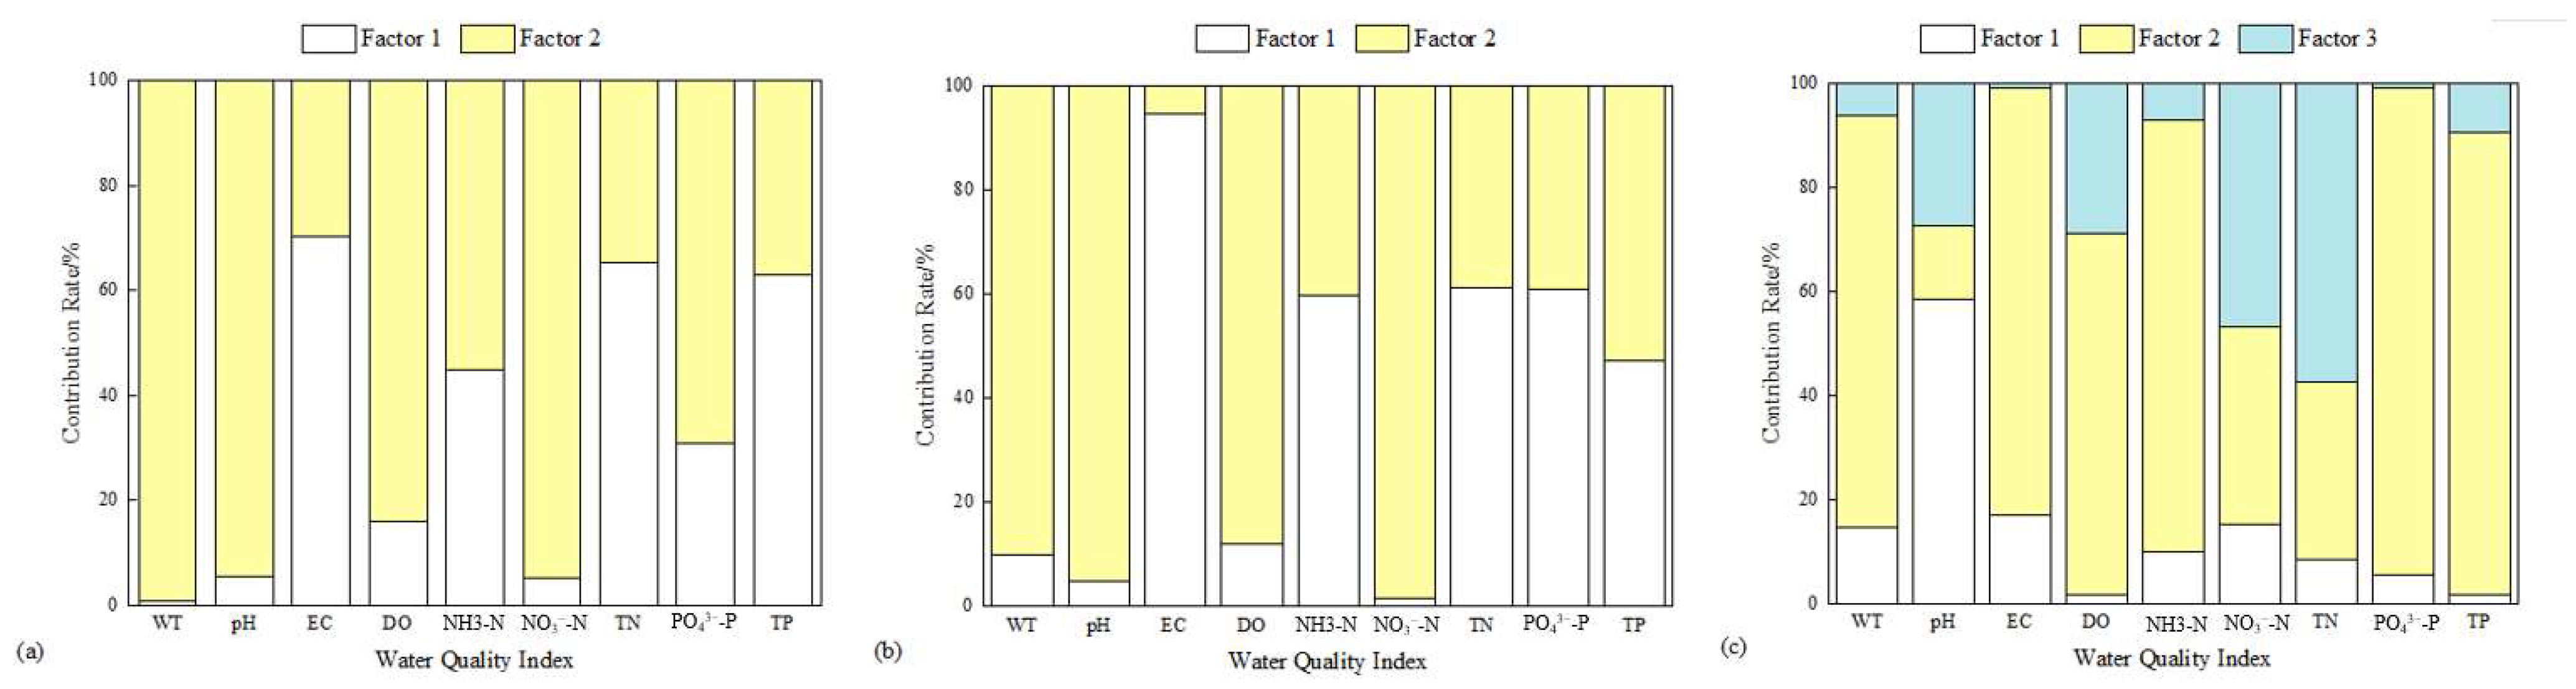
3.2.2. Temporal Factor Analysis and Pollution Source Identification
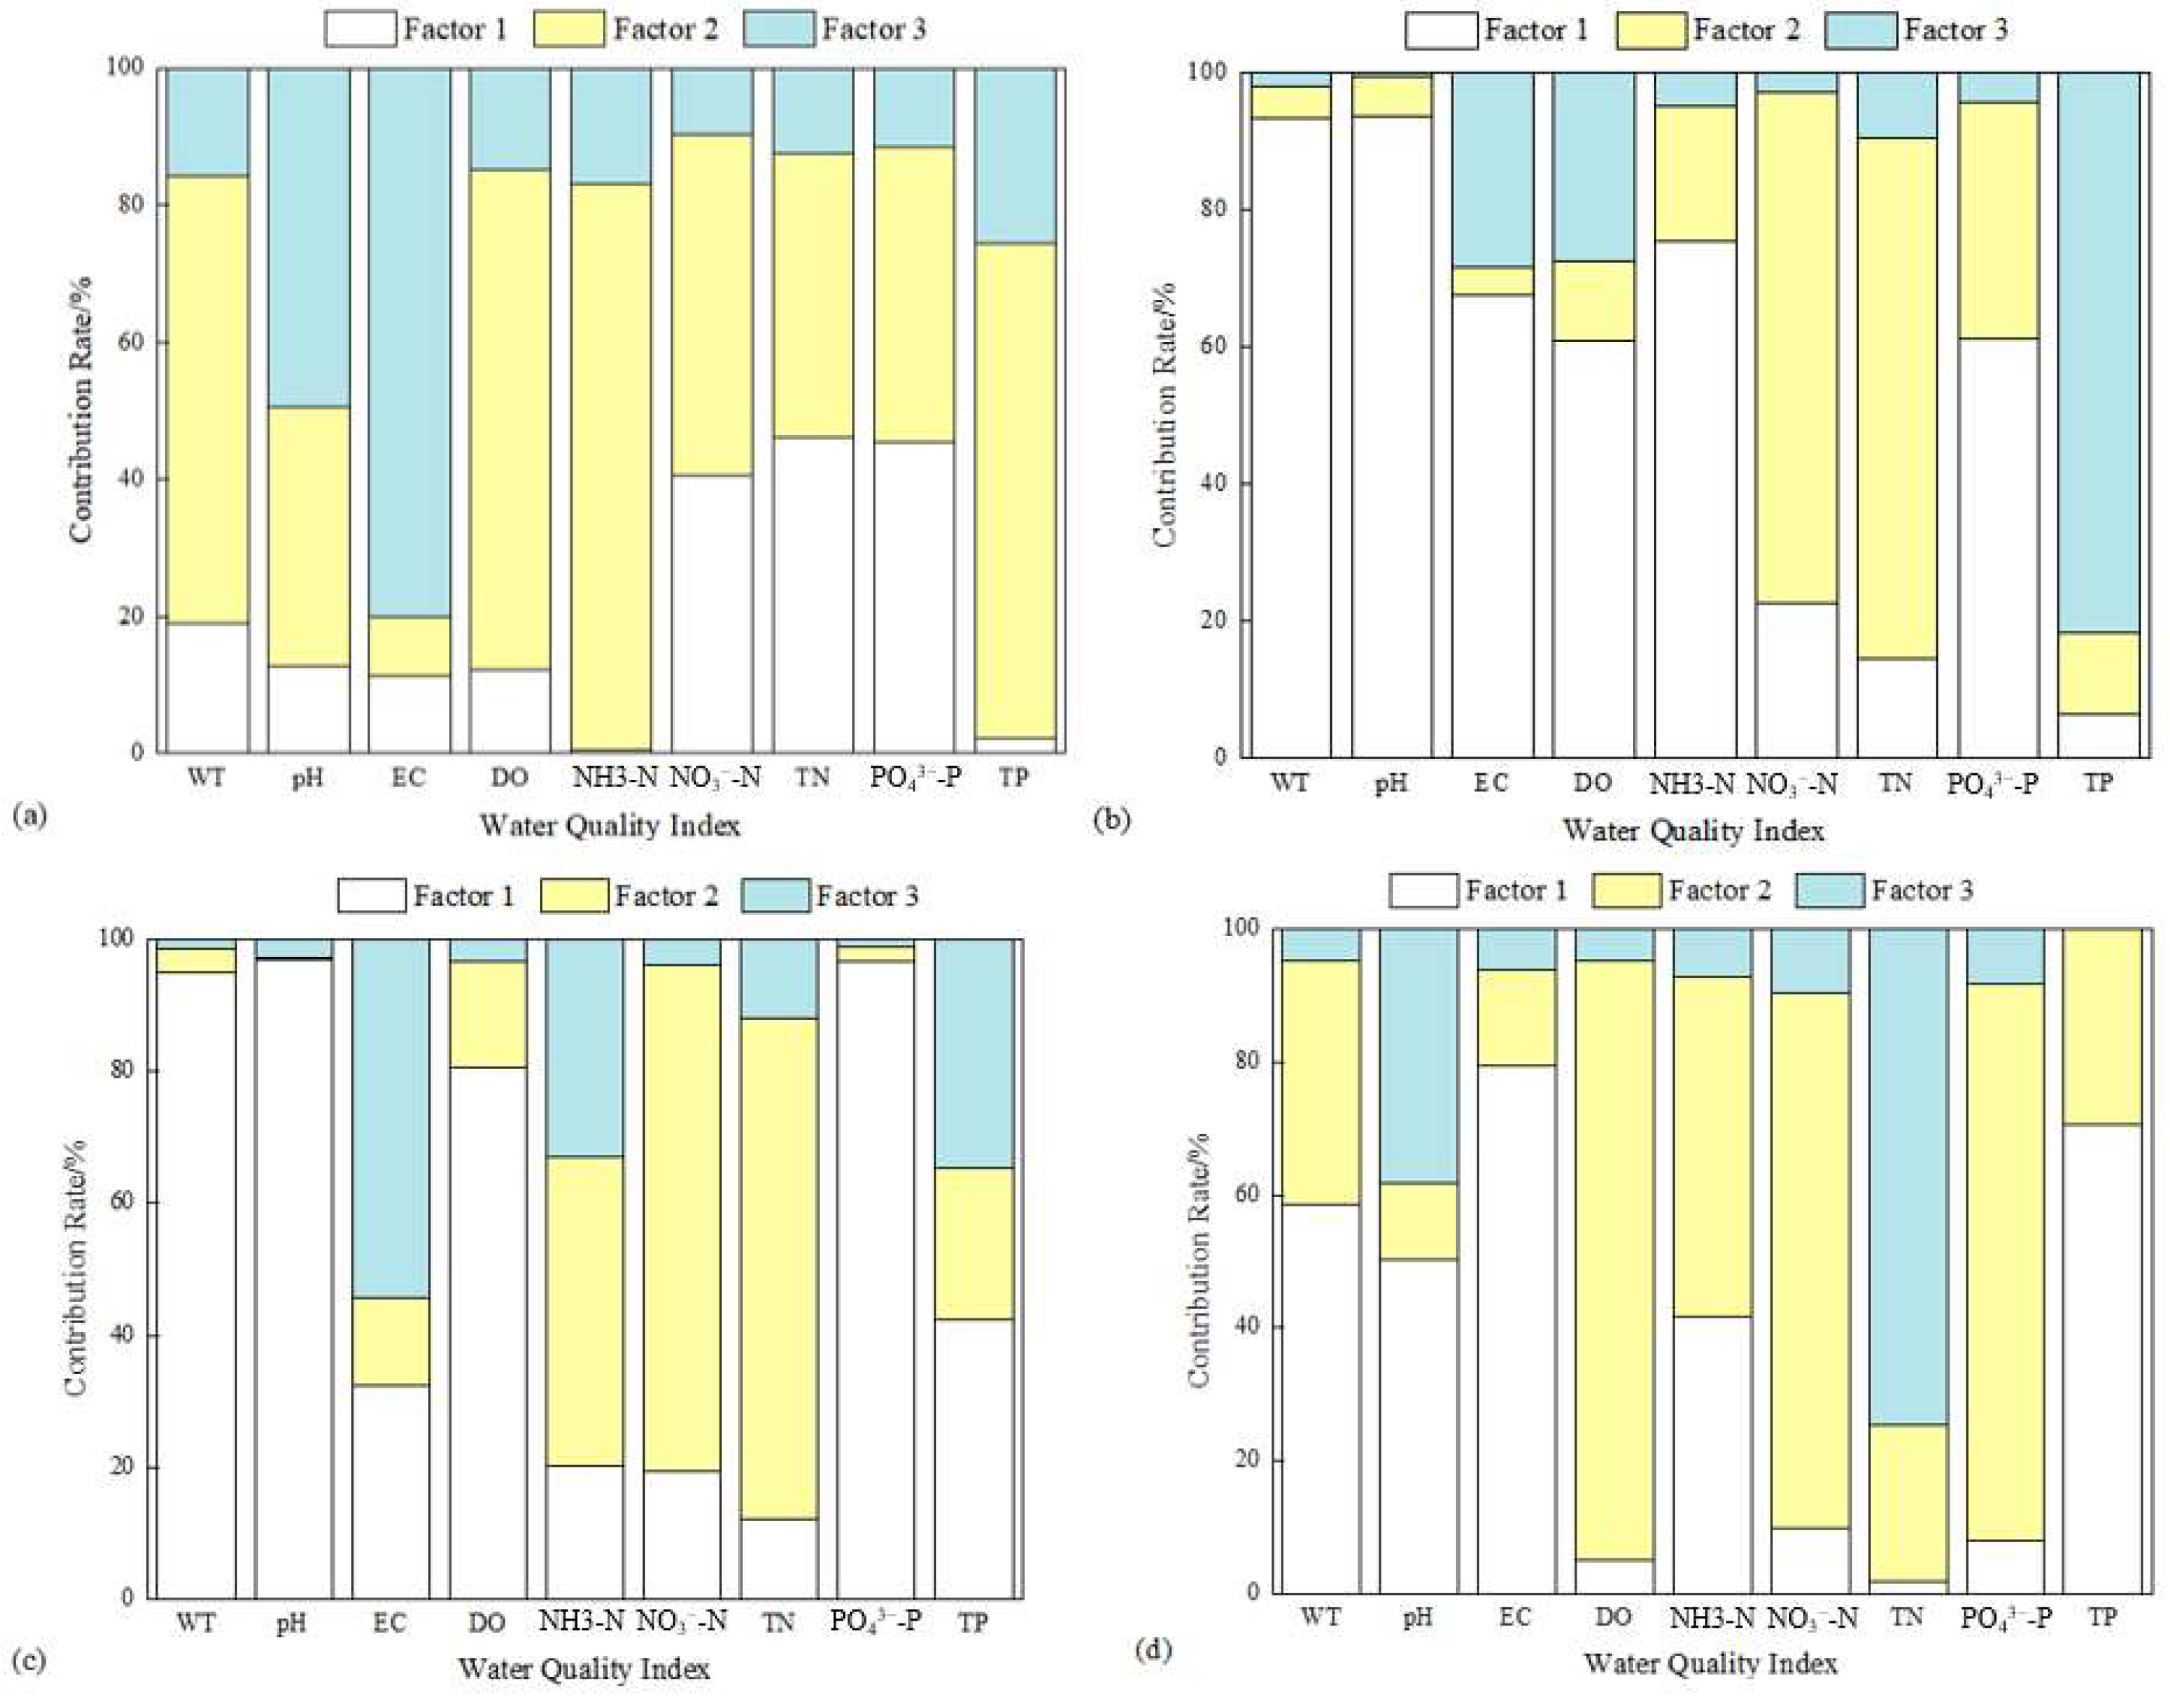
3.2.3. Spatial Factor Analysis and Pollution Source Identification
3.2.4. The Contribution Analysis of Pollution Source
3.3. Evaluation of Eutrophication Pollution of the Watershed
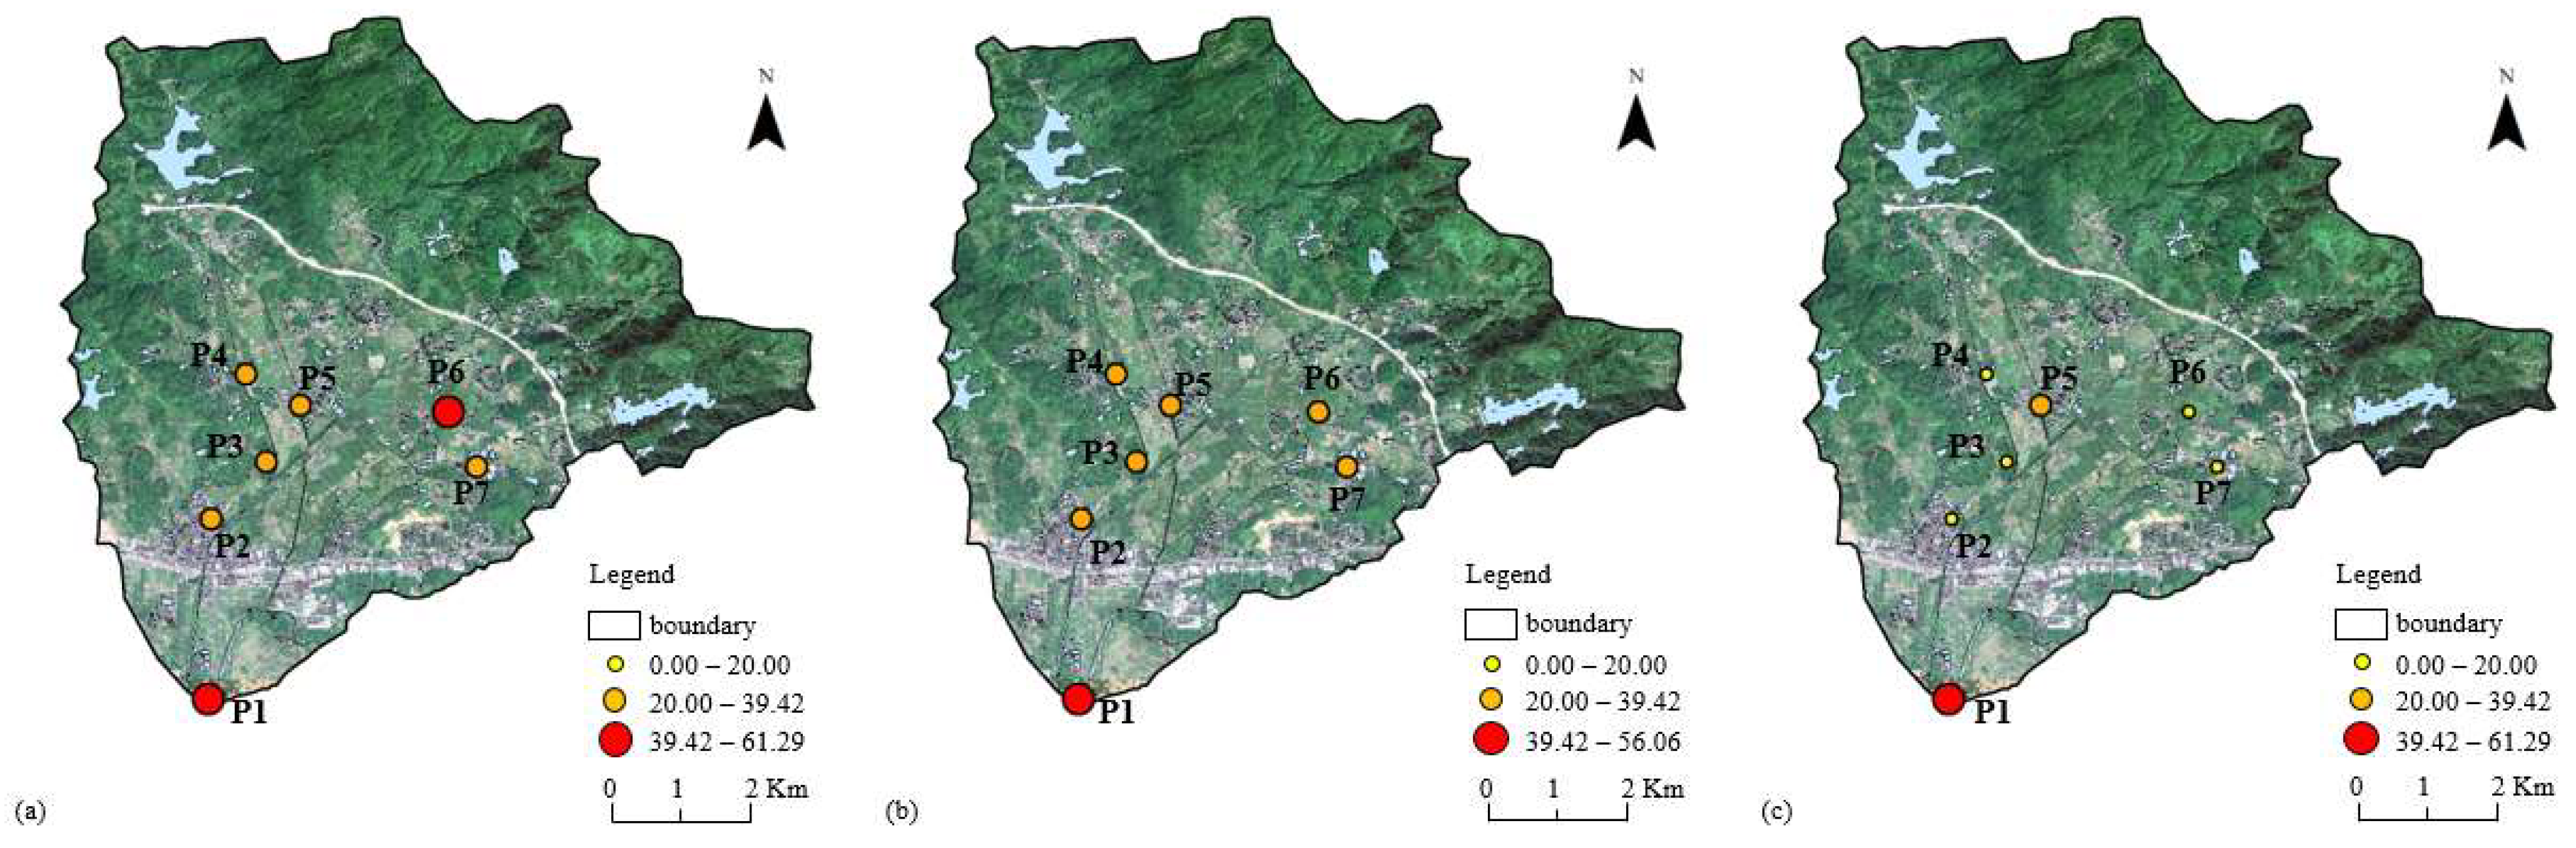
3.3.1. Temporal and Spatial Distribution Characteristics of Eutrophication
3.3.2. Spatial and Longitudinal Variation Characteristics of Watershed Eutrophication
4. Discussion
5. Conclusions
- (1)
- Seasonal Water Quality Variations: In the Zhucun watershed (South China), water quality is best during the wet season (April to September) due to dilution from high runoff, with ammonia nitrogen as the main pollutant. The worst water quality occurs in the normal season (March, October–November), dominated by ammonia nitrogen and phosphate from organic pollution. The dry season (December to February) shows poor quality due to phosphate and total phosphorus, linked to eutrophication.
- (2)
- Spatial Water Quality Differences: Upstream areas have the best water quality, affected mainly by farming and livestock pollution. Midstream regions face agricultural and livestock pollution, while downstream areas suffer the worst quality due to organic pollution, eutrophication, and biochemical contamination. Ponds are primarily impacted by organic pollution and human activity.
- (3)
- Pollution Sources and Management Needs: Pollution in the Zhucun watershed is concentrated in densely populated midstream and downstream zones, highlighting sewage discharge issues. Given rapid rural urbanization, targeted pollution control measures are needed.
Author Contributions
Funding
Data Availability Statement
Acknowledgments
Conflicts of Interest
Abbreviations
| PRD | The Pearl River Delta Region |
| PCA/FA | Principal Component Analysis/Factor Analysis |
| APCS-MLR | Absolute Principal Component Scores-Multiple Linear Regression |
| EI | Eutrophication Index |
| WT | Water Temperature |
| EC | Electrical Conductivity |
| NH4+ | Ammonium |
| NH3-N | Ammonia Nitrogen |
| NO3−-N | Nitrate Nitrogen |
| TN | Total Nitrogen |
| PO43−-P | Phosphates |
| DO | Dissolved Oxygen |
| pH | Power of Hydrogen |
| TP | Total Phosphorus |
| CV | Coefficient of Variation |
| MIN | Minimum Value |
| MAX | Maximum Value |
| AVG | Average Value |
References
- Niu, X.H. The Rural Urbanization Process Assessment of the ERHAI Basin Based on GIS. Master’s Thesis, The Southwest Forestry University, Kunming, China, 2019. [Google Scholar] [CrossRef]
- Ma, Q.; Lu, X.; Guo, M.M. Study on eco-economic value evaluation and compensation from the perspective of small watershed: A case study of Zhuanghe city in Liaoning province. J. Nat. Resour. 2022, 37, 2884–2897. [Google Scholar] [CrossRef]
- Xiao, F.; Liu, D. Investigation and reflection on the construction of water ecological civilization in the Pearl River Delta region. Water Conserv. Dev. Res. 2014, 14, 15–18. [Google Scholar] [CrossRef]
- Wu, M.Y.; Zhang, X.Y.; Li, W.Y.; Liang, X.Y. Environmental pollution status in the Pearl River Delta region in the context of Guangdong-Hong Kong-Macao Greater Bay Area. Mod. Commer. 2019, 13, 83–84. [Google Scholar] [CrossRef]
- Carpenter, S.R.; Caraco, N.F.; Correll, D.L.; Howarth, R.W.; Sharpley, A.N.; Smith, V.H. Nonpoint pollution of surface waters with phosphorus and nitrogen. Ecol. Appl. 1998, 8, 559–568. [Google Scholar] [CrossRef]
- Dodds, W.K.; Bouska, W.W.; Eitzmann, J.L.; Pilger, T.J.; Pitts, K.L.; Riley, A.J.; Schloesser, J.T.; Thornbrugh, D.J. Eutrophication of US Freshwaters: Analysis of Potential Economic Damages. Environ. Sci. Technol. 2009, 43, 12–19. [Google Scholar] [CrossRef]
- Liu, J.; Li, S.; Ouyang, Z.; Tam, C.; Chen, X. Ecological and socioeconomic effects of China’s policies for ecosystem services. Proc. Natl. Acad. Sci. USA 2008, 105, 9477–9482. [Google Scholar] [CrossRef]
- Chen, J.M.; Zheng, G.H. Inner river pollution status and control strategies in a town in Pearl River Delta. Environ. Eng. 2016, 34, 262–265. [Google Scholar]
- Long, Y.X.; Zhang, Y.H.; Lu, J.W.; Liu, X.H.; Xu, M.; Zhou, J. Analysis on Water Quality Tendency and Its Causes in Pearl River Delta Region. Environ. Impact Assess. 2018, 40, 30–33. [Google Scholar] [CrossRef]
- Huang, G.F.; He, B.; Xie, Z.Y.; Liu, J.; Wang, A.H.; Liao, T.; Wang, B.J.; Hao, B.B. Impacts of agricultural pollution on water environment and its spatial differentiation pattern in Guangdong Province. J. Ecol. Environ. 2023, 32, 2207. [Google Scholar] [CrossRef]
- Chen, W.; He, B.; Nover, D.; Lu, H.; Liu, J.; Sun, W.; Chen, W. Farm ponds in southern China: Challenges and solutions for conserving a neglected wetland ecosystem. Sci. Total. Environ. 2019, 659, 1322–1334. [Google Scholar] [CrossRef]
- Zhang, Y.L.; Liu, X.N.; Zhao, Y.; Cheng, J. The Disappearance and Reduction process of ponds in rapid urbanization area: Tianhe district, Guangzhou City as a case. J. Ecol. Environ. 2014, 23, 244–251. [Google Scholar] [CrossRef]
- Hillbricht-Ilkowska, A.; Pieczyńska, E. Nutrient Dynamics and Retention in Land/Water Ecotones of Lowland, Temperate Lakes and Rivers; Springer: Dordrecht, The Netherlands, 1993. [Google Scholar]
- Qu, M.K.; Li, W.D.; Zhang, C.R.; Huang, B.; Hu, W.Y. Source apportionment of Soil heavy metal Cd based on the combination of receptor model and geostatistics. Chin. Environ. Sci. 2013, 33, 854–860. [Google Scholar]
- Meng, L.; Zuo, R.; Wang, J.S.; Yang, J.; Teng, Y.G.; Zhai, Y.Y.; Shi, R. Quantitative source apportionment of groundwater pollution based on PCA-APCS-MLR. Chin. Environ. Sci. 2017, 37, 3773–3786. [Google Scholar]
- Du, M.; Chen, X.W.; Wang, Y. Evaluation of water pollution characters in Chanba river based on multivariate statistical analysis. J. North China Univ. Water Resour. Electr. Power. 2017, 38, 88–92. [Google Scholar]
- Du, Z.P.; Wang, M.J.; Yan, C.A.; Gao, W. Pollution source apportionment of Lake Dianchi based on absolute principal component score-multiple liner regression. J. Environ. Sci. 2020, 40, 1130–1137. [Google Scholar] [CrossRef]
- GB 3838-2002; Environmental Quality Standards for Surface Water. Ministry of Ecology and Environment: Beijing, China, 2002. Available online: https://wzq1.mee.gov.cn/ywgz/fgbz/bz/bzwb/shjbh/shjzlbz/200206/t20020601_66497.shtml (accessed on 1 January 2025).
- Banerjee, S.; Helgason, B.; Wang, L.; Winsley, T.; Ferrari, B.C.; Siciliano, S.D. Legacy effects of soil moisture on microbial community structure and N2O emissions. Soil Biol. Biochem. 2016, 95, 40–50. [Google Scholar] [CrossRef]
- Huang, F.; Wang, X.; Lou, L.; Zhou, Z.; Wu, J. Spatial variation and source apportionment of water pollution in Qiantang River (China) using statistical techniques. Water Res. 2010, 44, 1562–1572. [Google Scholar] [CrossRef]
- Kaiser, H.F. An index of factorial simplicity. Psychometrika 1974, 39, 31–36. [Google Scholar] [CrossRef]
- Thurston, G.D.; Spengler, J.D. A quantitative assessment of source contributions to inhalable particulate matter pollution in metropolitan Boston. Atmos. Environ. 1985, 19, 9–25. [Google Scholar] [CrossRef]
- Haji Gholizadeh, M.; Melesse, A.M.; Reddi, L. Water quality assessment and apportionment of pollution sources using APCS-MLR and PMF receptor modeling techniques in three major rivers of South Florida. Sci. Total. Environ. 2016, 566–567, 1552–1567. [Google Scholar] [CrossRef]
- Li, Z.Y.; Wang, J.Y.; Guo, C. A universal index formula for eutrophic evaluation using a logarithmic power function. J. Environ. Sci. 2010, 30, 664–672. [Google Scholar] [CrossRef]
- Song, X.F.; Liu, X.C.; Xia, J.; Yu, J.J.; Tang, C.Y. Relationship between surface water and groundwater transformation in Huasha River Basin based on environmental isotope technology. Sci. China 2007, 1, 102–110. [Google Scholar]
- Hou, Z.S.; Sun, L.; Wang, X.M.; Wang, S.P. Analysis of Chinese emergency events on fishery water pollution. Chin. Fish. Econ. 2010, 28, 99–107. [Google Scholar]
- Liu, M.; Chen, K.; Sun, S.Y.; Gu, X.Z.; Gao, R.P.; Jiang, H.Q. The water quality variation tendency of Reservoir Daxi and the cause analysis for the water pollution. J. Environ. Sci. 2017, 37, 2514–2523. [Google Scholar] [CrossRef]


| Number | Perimeter/m | Area/m2 | Location | Management Situation |
|---|---|---|---|---|
| P01 | 213.56 ± 5.64 | 3091.03 ± 23.36 | Downstream (113.6967, 23.2557) | Raising ducks and fish in enclosed ponds, with residential areas directly discharging domestic sewage into them. |
| P02 | 262.68 ± 3.21 | 3264.06 ± 2.42 | Midstream (g113.6966, 23.2793) | Raising chickens, ducks, and fish, with residential areas and road. Standing water drainage included. |
| P03 | 176.93 ± 0.24 | 1435.70 ± 10.66 | Midstream (113.7040, 23.2868) | Fish farming, with agricultural planting areas surrounding the site, and lychee trees planted around the perimeter. |
| P04 | 292.76 ± 0.90 | 5878.50 ± 33.84 | (g113.7009, 23.2991) is a coordinate point in the midstream sector. | The farm raises chickens, ducks, cattle, sheep, and fish, surrounded by farmland. |
| P05 | 96.14 ± 0.71 | 558.76 ± 3.59 | Midstream (g113.7084, 23.2942) | Raising ducks and fish, residential areas, with domestic sewage directly discharged. |
| P06 | 348.31 ± 1.30 | 5103.03 ± 52.13 | Midstream (g113.7281, 23.2932) | Fish farming, surrounded by ponds, farmland, and banana trees, with water hyacinths covering the water surface. |
| P07 | 240.10 ± 1.10 | 2478.83 ± 15.52 | Midstream (g113.7314, 23.2860) | Fish farming, surrounded by farmland and residential areas, with upstream drainage from farmland and a paper mill. |
| Water Quality Monitoring Indicators | Unit | Instrument and Equipments |
|---|---|---|
| WT | °C | YSI (YSI Inc., Yellow Springs, OH, USA) |
| pH | - | |
| EC | μS/cm | |
| DO | mg/L | |
| NH3-N | mg/L | Smartchem 200 [19] (Westco Scientific Instruments, Brookfield, CT, USA) |
| NO3--N | mg/L | |
| TN | mg/L | |
| PO43−-P | mg/L | |
| TP | mg/L |
| Period | Value | pH | EC/ (μS/cm) | Water Quality Index Concentration/(mg/L) | |||||
|---|---|---|---|---|---|---|---|---|---|
| DO | TN | NH3-N | NO3−-N | TP | PO43−-P | ||||
| Whole year | MIN | 6.69 | 45.10 | 0.86 | ND | ND | ND | ND | ND |
| MAX | 13.24 | 840.70 | 15.94 | 12.41 | 12.80 | 2.97 | 2.94 | 0.95 | |
| AVG | 8.79 | 175.68 | 6.90 | 1.58 | 0.74 | 0.61 | 0.19 | 0.07 | |
| CV | 0.10 | 0.22 | 0.28 | 0.69 | 0.78 | 0.76 | 0.66 | 0.84 | |
| Wet season | MIN | 6.69 | 45.10 | 0.86 | 0.09 | ND | ND | ND | ND |
| MAX | 12.78 | 710.83 | 15.79 | 10.94 | 6.39 | 2.31 | 0.82 | 0.61 | |
| AVG | 8.50 | 162.08 | 6.24 | 1.51 | 0.70 | 0.66 | 0.17 | 0.06 | |
| CV | 0.07 | 0.20 | 0.23 | 0.65 | 0.67 | 0.60 | 0.54 | 0.75 | |
| Normal season | MIN | 6.82 | 51.90 | 1.39 | 0.42 | 0.01 | ND | ND | ND |
| MAX | 13.24 | 764.20 | 15.94 | 12.41 | 12.80 | 2.97 | 2.94 | 0.51 | |
| AVG | 8.83 | 187.76 | 6.85 | 2.25 | 0.92 | 0.65 | 0.25 | 0.06 | |
| CV | 0.13 | 0.19 | 0.24 | 0.39 | 0.67 | 0.72 | 0.65 | 0.65 | |
| Dry season | MIN | 7.93 | 54.70 | 1.84 | ND | ND | ND | - | - |
| MAX | 13.15 | 840.70 | 15.54 | 10.42 | 4.69 | 2.60 | - | - | |
| AVG | 9.32 | 190.78 | 8.28 | 1.05 | 0.64 | 0.48 | 0.21 | 0.12 | |
| CV | 0.09 | 0.16 | 0.16 | 0.71 | 0.57 | 0.81 | - | - | |
| The KMO Measure of Sampling Adequacy | 0.797 | |
|---|---|---|
| Test value χ2 | 1522.691 | |
| Bartlett’s sphericity test | Degrees of freedom (df) | 136 |
| Significance Level Sig | 0 | |
| Indicators | Wet Season | Normal Season | Dry Season | ||||
|---|---|---|---|---|---|---|---|
| Factor 1 | Factor 2 | Factor 1 | Factor 2 | Factor 1 | Factor 2 | Factor 3 | |
| WT | −0.02 | 0.90 | −0.28 | 0.81 | 0.10 | −0.73 | 0.24 |
| pH | −0.13 | 0.87 | −0.14 | 0.86 | −0.26 | −0.02 | 0.82 |
| EC | 0.89 | 0.14 | 0.81 | −0.01 | 0.28 | 0.68 | −0.02 |
| DO | −0.39 | 0.78 | −0.36 | 0.83 | −0.50 | −0.19 | 0.73 |
| NH3-N | 0.71 | −0.33 | 0.89 | −0.19 | 0.78 | 0.55 | −0.02 |
| NO3−-N | 0.11 | −0.80 | −0.04 | −0.73 | −0.08 | 0.48 | −0.63 |
| TN | 0.93 | −0.19 | 0.96 | −0.19 | 0.71 | 0.57 | −0.14 |
| PO43−-P | 0.63 | −0.53 | 0.92 | −0.18 | 0.89 | −0.11 | −0.29 |
| TP | 0.92 | −0.20 | 0.45 | −0.16 | 0.94 | 0.04 | −0.21 |
| Eigenvalue | 4.77 | 2.11 | 4.50 | 1.89 | 4.36 | 1.45 | 1.12 |
| Variance Contribution Rate/% | 39.73 | 36.72 | 40.37 | 30.62 | 35.57 | 21.22 | 20.14 |
| Cumulative Contribution Rate/% | 39.73 | 76.45 | 40.37 | 70.99 | 35.57 | 56.79 | 76.93 |
| Water Indicator | G1 | G2 | G3 | G4 | ||||||||
|---|---|---|---|---|---|---|---|---|---|---|---|---|
| Factor 1 | Factor 2 | Factor 3 | Factor 1 | Factor 2 | Factor 3 | Factor 1 | Factor 2 | Factor 3 | Factor 1 | Factor 2 | Factor 3 | |
| WT | 0.81 | −0.26 | 0.15 | −0.05 | −0.80 | −0.18 | −0.06 | −0.96 | −0.25 | −0.03 | −0.11 | 0.97 |
| pH | −0.78 | −0.34 | −0.13 | −0.09 | 0.92 | 0.06 | −0.09 | 0.97 | 0.08 | −0.40 | 0.78 | 0.25 |
| EC | 0.02 | 0.78 | 0.33 | 0.62 | 0.51 | 0.22 | 0.10 | 0.62 | −0.71 | 0.91 | −0.26 | −0.10 |
| DO | −0.83 | −0.28 | −0.15 | −0.42 | 0.73 | −0.16 | −0.59 | 0.04 | −0.03 | −0.35 | 0.85 | −0.23 |
| NH3—N | 0.27 | 0.29 | 0.75 | 0.91 | −0.17 | 0.03 | 0.97 | 0.00 | 0.13 | 0.76 | −0.04 | −0.38 |
| NO3−-N | 0.37 | 0.78 | −0.32 | 0.29 | −0.17 | −0.70 | −0.82 | −0.46 | −0.16 | 0.21 | 0.85 | −0.13 |
| TN | 0.52 | 0.63 | 0.31 | 0.95 | −0.15 | −0.11 | 0.87 | −0.10 | 0.06 | 0.97 | −0.14 | 0.05 |
| PO43−-P | −0.06 | 0.68 | 0.49 | 0.01 | 0.07 | 0.91 | 0.24 | 0.36 | 0.88 | 0.93 | −0.09 | 0.01 |
| TP | 0.13 | 0.03 | 0.64 | 0.39 | −0.07 | 0.88 | 0.13 | 0.14 | 0.97 | 0.92 | −0.04 | 0.05 |
| Eigenvalue | 3.87 | 1.52 | 1.07 | 2.87 | 2.56 | 1.69 | 3.54 | 2.31 | 1.90 | 4.75 | 1.93 | 1.09 |
| Variance Contribution Rate/% | 27.27 | 26.93 | 17.54 | 28.15 | 26.40 | 24.52 | 31.27 | 29.09 | 25.81 | 48.71 | 24.03 | 13.67 |
| Cumulative Contribution Rate/% | 27.27 | 54.21 | 71.75 | 28.15 | 54.55 | 79.07 | 31.27 | 60.35 | 86.16 | 48.71 | 72.73 | 86.40 |
| Periods/Groups | Sections/Period | The Proportion of Various Water Quality Eutrophication Grades to the Whole (%) | ||||
|---|---|---|---|---|---|---|
| Oligotrophic | Mesotrophic | Eutrophic | Hypertrophic | Extremely Hypertrophic | ||
| Wet season | All sections | 0 | 34.3 | 65.7 | 0 | 0 |
| Normal season | All sections | 0 | 48.6 | 37.1 | 14.3 | 0 |
| Dry season | All sections | 5.7 | 45.7 | 45.7 | 2.9 | 0 |
| G1 | Wet season | 0 | 41.2 | 58.8 | 0 | 0 |
| Normal season | 0 | 64.7 | 35.3 | 0 | 0 | |
| Dry season | 0 | 64.7 | 35.5 | 0 | 0 | |
| G2 | Wet season | 0 | 0 | 100 | 0 | 0 |
| Normal season | 0 | 0 | 50 | 50 | 0 | |
| Dry season | 0 | 12.5 | 87.5 | 0 | 0 | |
| G3 | Wet season | 0 | 0 | 100 | 0 | 0 |
| Normal season | 0 | 0 | 66.7 | 33.3 | 0 | |
| Dry season | 0 | 0 | 66.7 | 33.3 | 0 | |
| G4 | Wet season | 0 | 71.4 | 28.6 | 0 | 0 |
| Normal season | 0 | 85.7 | 14.3 | 0 | 0 | |
| Dry season | 28.6 | 57.1 | 14.3 | 0 | 0 | |
Disclaimer/Publisher’s Note: The statements, opinions and data contained in all publications are solely those of the individual author(s) and contributor(s) and not of MDPI and/or the editor(s). MDPI and/or the editor(s) disclaim responsibility for any injury to people or property resulting from any ideas, methods, instructions or products referred to in the content. |
© 2025 by the authors. Licensee MDPI, Basel, Switzerland. This article is an open access article distributed under the terms and conditions of the Creative Commons Attribution (CC BY) license (https://creativecommons.org/licenses/by/4.0/).
Share and Cite
Wang, Y.; Xiao, Q.; He, B.; Razafindrabe, B.H.N. The Characteristics and Source Contribution Analysis of Nutrients in Water Bodies of Small Watersheds in the Pearl River Delta. Water 2025, 17, 1739. https://doi.org/10.3390/w17121739
Wang Y, Xiao Q, He B, Razafindrabe BHN. The Characteristics and Source Contribution Analysis of Nutrients in Water Bodies of Small Watersheds in the Pearl River Delta. Water. 2025; 17(12):1739. https://doi.org/10.3390/w17121739
Chicago/Turabian StyleWang, Yi, Qian Xiao, Bin He, and Bam Haja Nirina Razafindrabe. 2025. "The Characteristics and Source Contribution Analysis of Nutrients in Water Bodies of Small Watersheds in the Pearl River Delta" Water 17, no. 12: 1739. https://doi.org/10.3390/w17121739
APA StyleWang, Y., Xiao, Q., He, B., & Razafindrabe, B. H. N. (2025). The Characteristics and Source Contribution Analysis of Nutrients in Water Bodies of Small Watersheds in the Pearl River Delta. Water, 17(12), 1739. https://doi.org/10.3390/w17121739