Next Article in Journal
Divergent Response of Blue Carbon Components and Microbial Communities in Sediments to Different Shellfish Zones of Geligang, Liaodong Bay, China
Previous Article in Journal
Application of COMSOL Multiphysics Model in Studying Effects of Straw Addition on Dewatering Performance of Residual Sludge During Freeze–Thaw Cycles
Previous Article in Special Issue
Modeling Dependence Structures in Hydrodynamic Landslide Deformation via Hierarchical Archimedean Copula Framework: Case Study of the Donglinxin Landslide
 
 
Due to scheduled maintenance work on our database systems, there may be short service disruptions on this website between 10:00 and 11:00 CEST on June 14th.
Article

Non-Negligible Influence of Gravel Content in Slip Zone Soil: From Creep Characteristics to Landslide Response Patterns

1
China Yangtze Power Co., Ltd., Yichang 443002, China
2
Hubei Technology Innovation Center for Smart Hydropower, Wuhan 430000, China
3
Badong National Observation and Research Station of Geohazards, China University of Geosciences, Wuhan 430074, China
*
Author to whom correspondence should be addressed.
Water 2025, 17(12), 1726; https://doi.org/10.3390/w17121726
Submission received: 25 April 2025 / Revised: 3 June 2025 / Accepted: 5 June 2025 / Published: 7 June 2025

Abstract

:
The creep mechanical behavior of the slip zone soil is distinctive and assumes a vital role in the identification and prediction of landslide evolution, but the rock content and structure dictate its creep properties. This study examines the Outang landslide in the reservoir region of middle Yangtze River, where the slip zone soil shows considerable variability in particle size distribution, with gravel content varying between 35% and 55%. To investigate the creep characteristics of the slip zone soil, large-scale direct shear creep tests were conducted, focusing on the variations in peak strength and long-term strength under different gravel content conditions. PFC3D numerical simulations were subsequently performed to elucidate the internal mechanisms connecting gravel content, microstructure, and macroscopic mechanical strength. A three-dimensional continuous-discrete coupled model was built to investigate the influence of gravel content on landslide deformation features, accounting for fluctuations in gravel content. The numerical findings indicate that gravel content markedly affects the displacement and deformation characteristics of the landslide. As the gravel concentration rises, landslide displacement progressively diminishes, with elevated gravel content enhancing the structural integrity of the landslide mass. This study underscores gravel content as a pivotal element in landslide deformation and reinforces its significance in assessing landslide stability and forecasting.

1. Introduction

Landslides, among the most prevalent geological hazards globally, provide a significant risk to human life, property, and the integrity of large engineering projects due to their abrupt occurrence and intricate catastrophic mechanisms [1]. Colluvial landslides, prevalent along riverbanks and in mountainous or hilly terrains, have emerged as a primary concern for disaster mitigation in locations such as reservoir areas and transportation routes [2,3]. Such landslide consists mostly of loose deposits resulting from collapses, slope wash, or alluvial processes, and their material composition is notably heterogeneous. In the reservoir area of middle Yangtze River in China, about 65% of the more than 4300 identified landslides are colluvial. The commonly noted “soil-rock structural effect” in these landslides typically results in differential seepage pressures during fluctuations in reservoir water levels [4], rendering them a significant and complex subject in contemporary research on the disaster mechanisms of reservoir landslides.
Understanding the creep mechanism of landslides is crucial in researching their disaster mechanisms and predicting future occurrences. This process involves geotechnical deformation that increases over time under long-term loading, which leads to material strength degradation and structural changes [5]. The slip zone, as the core structure controlling landslide disasters, directly influences the formation mechanism and dynamic development process of landslides through the evolution of its physical and mechanical properties [6]. Typically, the slip zone is formed by weak interlayers, which are interconnected through geological processes. The mineral composition, structural characteristics, and mechanical response of these weak interlayers are critical intrinsic factors that control the creep behavior of landslides.
Some studies have shown that the particle gradation characteristics of slip zone soils have a decisive impact on their strength and creep properties. Li and Zhang [7] found that the particle size and distribution of slip zone soils exhibit fractal characteristics, with micro-deformation features such as soil dilatancy, shear zone thickness, and crack morphology closely related to their macroscopic mechanical parameters, which elucidate the intrinsic causes of slope instability. Lu et al. [8] revealed the influence of the fractal dimension of slip zone soil particles on both the microscopic (porosity, microstructure parameters, etc.) and macroscopic (stress-strain, shear strength, etc.) properties of the soil, indicating that the fractal dimension can serve as an indicator for characterizing the spatial variability of the slip zone. Jim and Julien [9] confirmed the substantial regulatory influence of particle size distribution reconstruction on residual strength, and Wang et al. [10] demonstrated the pore water pressure differentiation caused by gradation differences through loess-silica sand mixed experiments. Additional research has demonstrated that the rheological properties of materials are influenced by the content of fine-grained components in a dual manner. Jeong et al. [11,12] conducted a comparison of tests on iron tailings and La Valette soil and discovered that a mere 5% change in clay and silt content could result in a change in the magnitude of the creep rate. Hungr et al. [13] systematically demonstrated the nonlinear relationship between clay mineral content and rheological parameters, while Parsons et al. [14] noted that the rheological model of sand-clay mixtures undergoes a Bingham plastic transition with changing proportions. Within this research framework, there remains a significant gap in the study of the mechanism by which particle size distribution affects the creep behavior of slip zone soils, particularly for complex, large-sized gravel-containing slip zone soils. The dynamic relationship between particle distribution and creep behavior still needs to be further elucidated.
Material composition and structure are key indicators determining the physical and mechanical properties of soils; therefore, gravel content often significantly affects the mechanical properties of the slip zone. From a macroscopic perspective, the residual internal friction angle of the slip zone soil is intricately linked to the proportions of gravel and fine particles. The phenomenon intensifies with an increase in gravel content and decreases with a rise in fine particle concentration [15,16,17]. Additionally, the block-stone effect in soil-rock mixtures during shearing causes the shear band to become wider, thicker, and more tortuous, leading to a macroscopic increase in the specimen’s internal friction angle. Conversely, as gravel content rises, the proportion of cohesive soil diminishes, resulting in a slight reduction in the specimen’s macroscopic cohesion [18,19]. Moreover, it has been established that parameters including geotechnical composition, soil structure, porosity and gravel morphology substantially influence the mechanical properties of the soil [20,21,22,23,24,25,26,27]. These studies have preliminarily revealed the complex interactions between the microstructure and macroscopic mechanical properties of the slip zone, providing important insights into the creep mechanism and sliding mechanisms of the slip zone. However, the existing research still lacks systematic understanding of the dynamic coupling between macro- and micro-mechanisms in gravel-bearing slip zones. Moreover, despite existing studies focusing on the influence of soil composition and structure on the mechanical properties of slip zones, relatively few studies have addressed the specific effects of soil particles, especially regarding the correlation between slip zone structure and landslide mechanical behaviors. Numerous uncertainties persist concerning the influence of various particle compositions and ratios on the efficacy of the slip zone. This research gap is crucial for advancing the exploration and precise prediction of landslide mechanisms, highlighting the need of examining the impact of soil particle properties on the mechanical behavior and creep mechanisms of the slip zone.
In addition to testing and observation methods, numerical simulation has been well acknowledged in studying the micro-mechanisms of soils. By establishing mathematical models and utilizing high-performance computers for simulations, researchers are able to analyze in detail the structure and behavior of soils at the microscopic scale. For example, the Discrete Element Method (DEM) has been frequently adopted to simulate the interactions between individual soil particles, thereby revealing the origins of the macroscopic mechanical properties of soils. Yang et al. [28] using PFC3D for particle mechanics simulations and discovered that the stress of soil-rock mixtures with varying gravel concentrations changed, with the formation of a coarse particle skeleton significantly influencing the stress features of the mixture. Li and Wang [29] introduced a three-dimensional discrete element mechanical model grounded in the statistical principles governing the internal structure of soil-rock mixes, employing this model to simulate creep behavior across varying soil-rock mixture ratios, rock dimensions, and configurations. Tan et al. [30] investigated the anisotropic deformation of the slip zone and elucidated the emergence and progression of cracks in the in-situ soil, effectively utilizing PFC numerical simulations. These simulation studies have offered robust tools and references for a more profound comprehension of creep behavior. Consequently, numerical modeling is a crucial method for elucidating the micro-mechanisms of soils and serves as a reliable instrument for addressing intricate geological and engineering challenges.
This study examines the substantial colluvial landslides in the reservoir region of middle Yangtze River, with particular emphasis on the gravelly slip zones. A large-scale direct shear rheological test apparatus is utilized to conduct direct shear creep tests on slip zone soils with varying gravel concentrations, while numerical simulations are employed to investigate the mechanical properties of the test at the microscopic level. To further confirm the influence of gravel concentration on macro-scale landslides, numerical coupling models using varying gravel contents are developed to examine landslide progression. The research findings will elucidate the evolutionary traits of large-scale landslides.

2. Materials and Methods

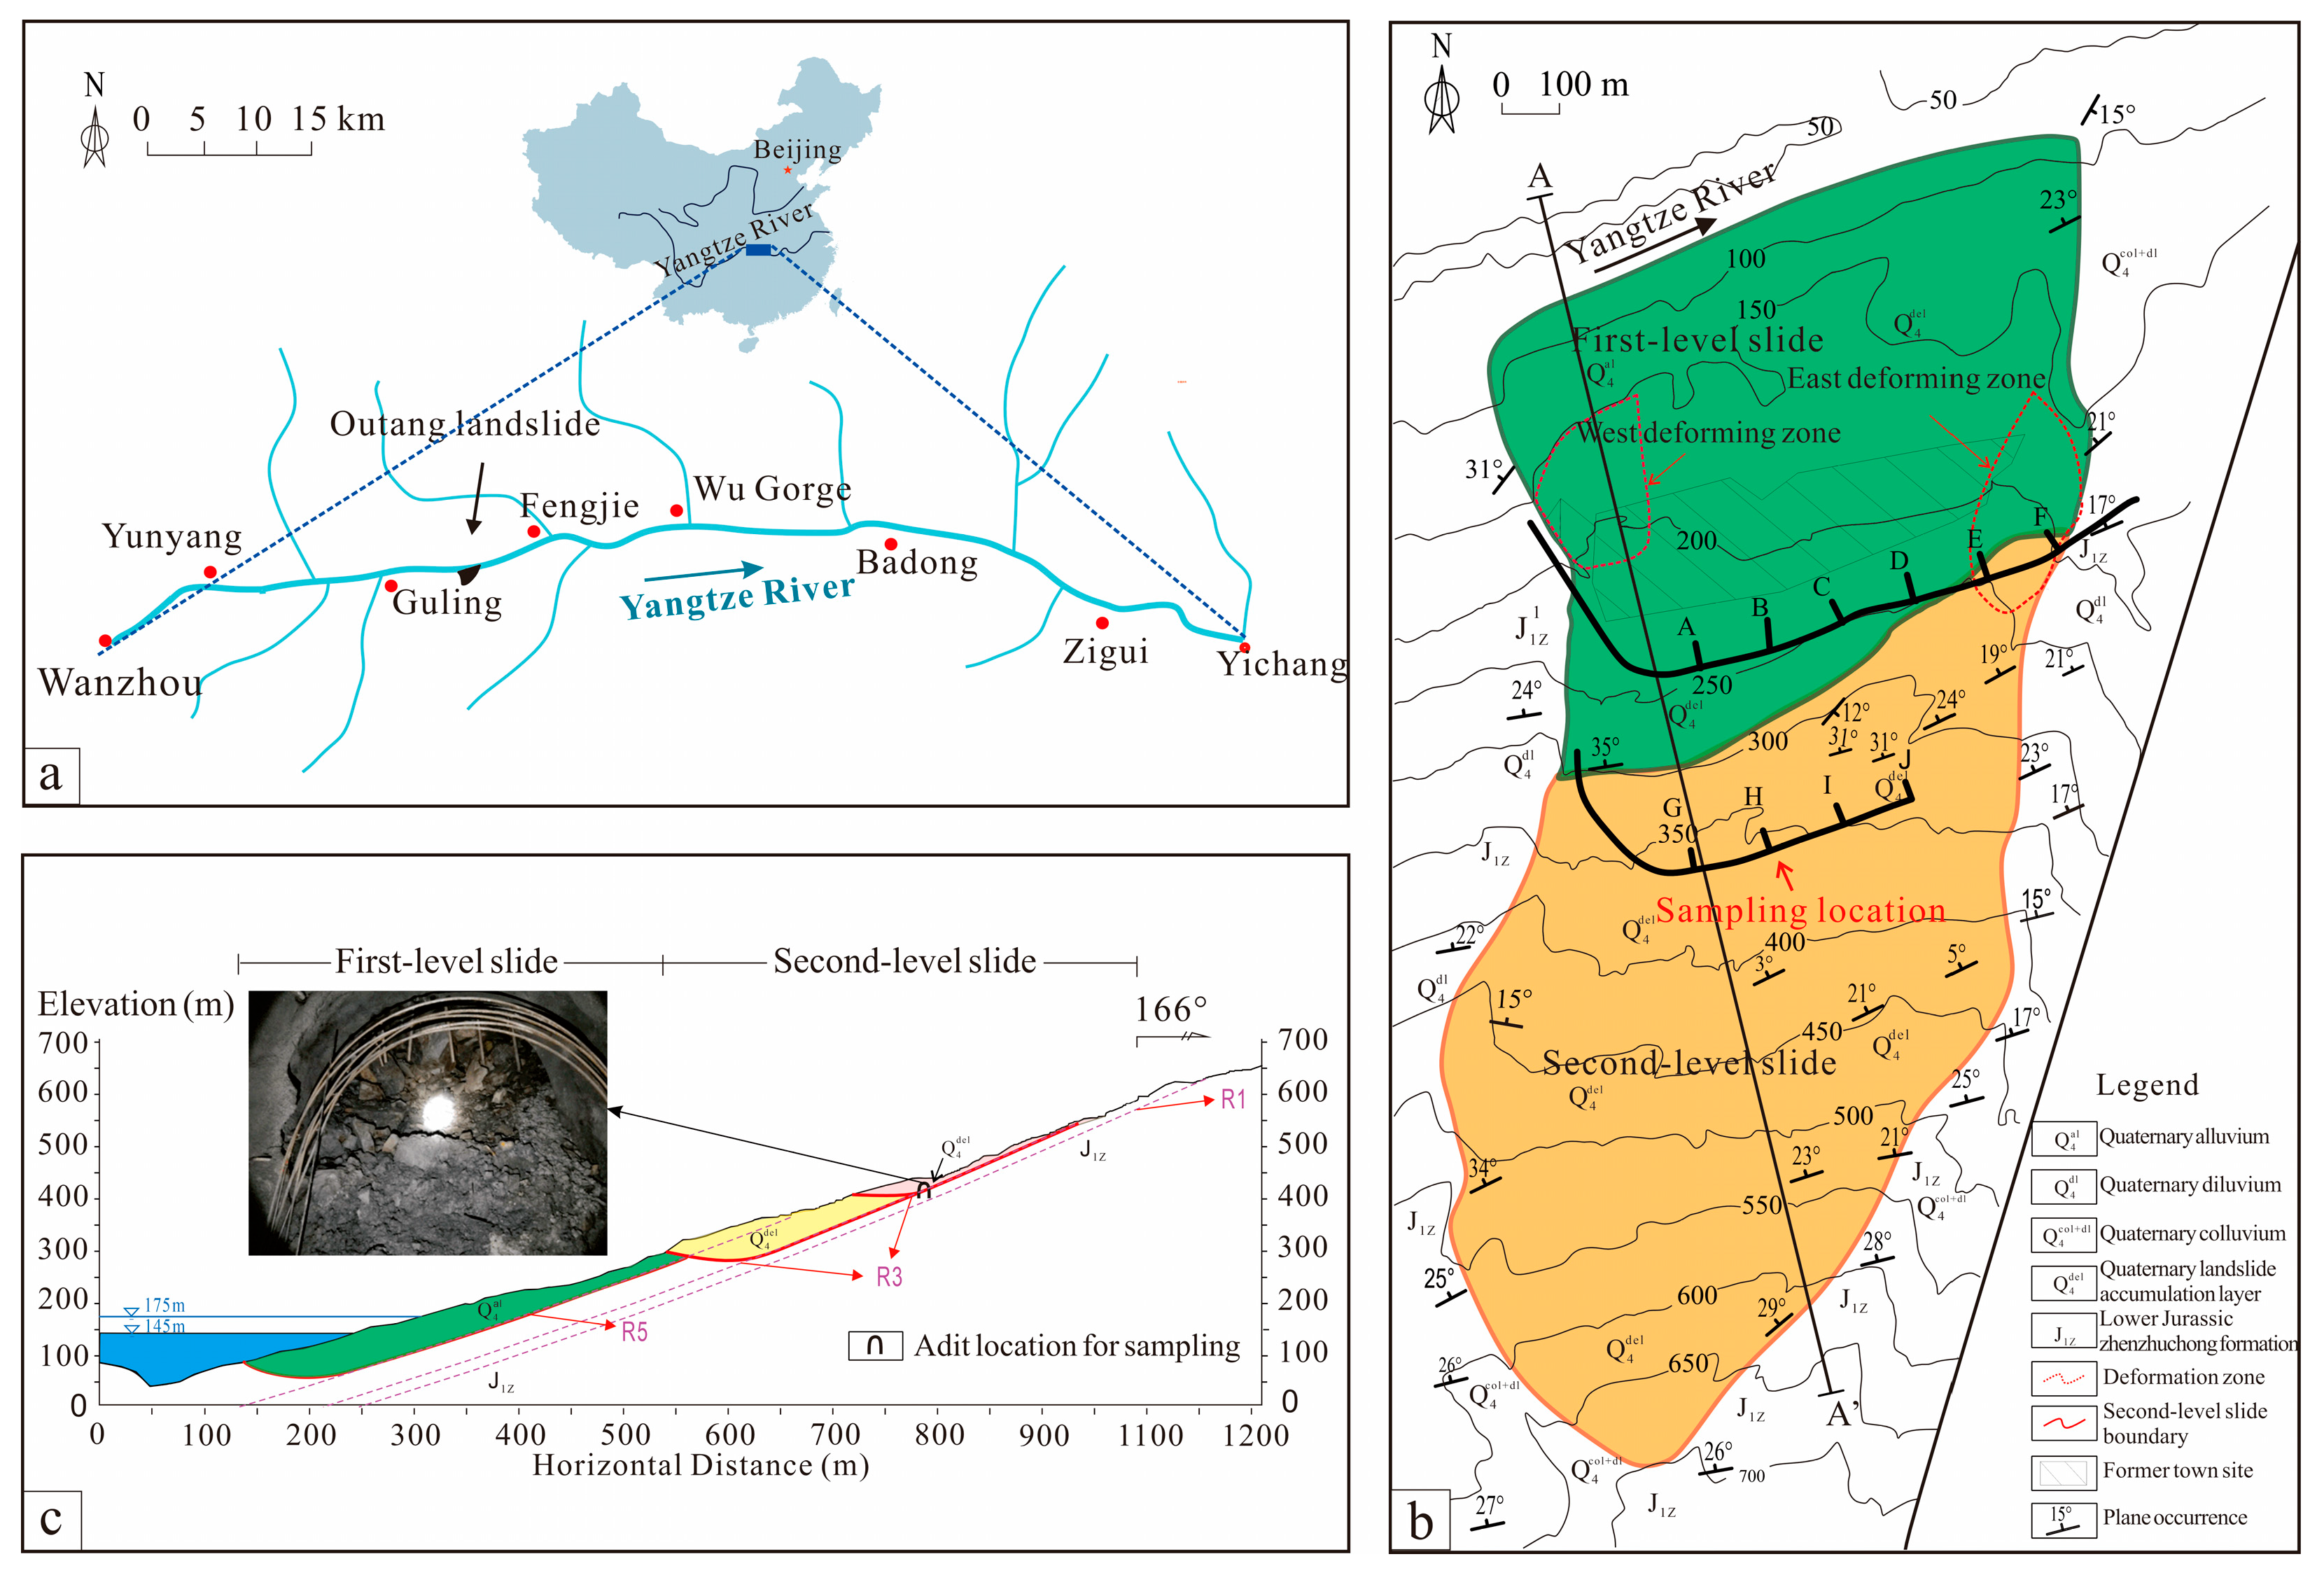
2.1. Landslide Overview

The Outang landslide is located in Fengjie County, middle Yangtze River area (longitude 109.35025°E, latitude 30.96301°N), as shown in Figure 1a. Tectonically, it is situated on the southeastern flank of the Guling anticline, forming a giant ancient landslide with a complex genesis and structure, with a volume of approximately 8.95 × 10³ m3. The planar shape of the landslide is a slanted, inverted ancient bell shape (Figure 1b). The Outang landslide has multiple sliding surfaces formed during different stages (Figure 1c), and the dip direction of the landslide rock layers is nearly the same as the slope direction, with the frontal shear exit located below the Yangtze River water level, showing an anti-buckling shape. The landslide is approximately 1990 m in length and 890 m in width, with its thickness ranging from 2.8 to 128 m. The rear edge is at an elevation of 705 m.
The landslide mass consists mainly of silty clay interlayered with gravel (Q4del) and fractured rock (Q4del). The slip zone is dominated by gray-black carbonaceous shale with a complex structure. It contains five weak interlayers (numbered R1 to R5 from bottom to top, Figure 1c) distributed within the middle and lower parts of the Jurassic zhenzhuchong formation (J1Z). These weak interlayers control the multi-stage sliding of the Outang landslide. The base is mainly composed of gray medium-thick sandstone, locally interspersed with carbonaceous shale or claystone.
The landslide is experiencing constant deformation due to rainfall and variations in the water levels of the reservoir. Since September 2009, when deformation was first noted at the leading edge of the landslide, deformation activities have intensified, with the highest displacement recorded from 2011 to the present surpassing 752 mm. Once the Outang landslide suffers overall instability, it will pose a threat to the safety of the main navigation channel of the Yangtze River. The secondary surges generated by the landslide could imperil the lives and property of citizens in Fengjie, Yunyang, and Wushan counties, as well as the safety of waterways, with disastrous results.

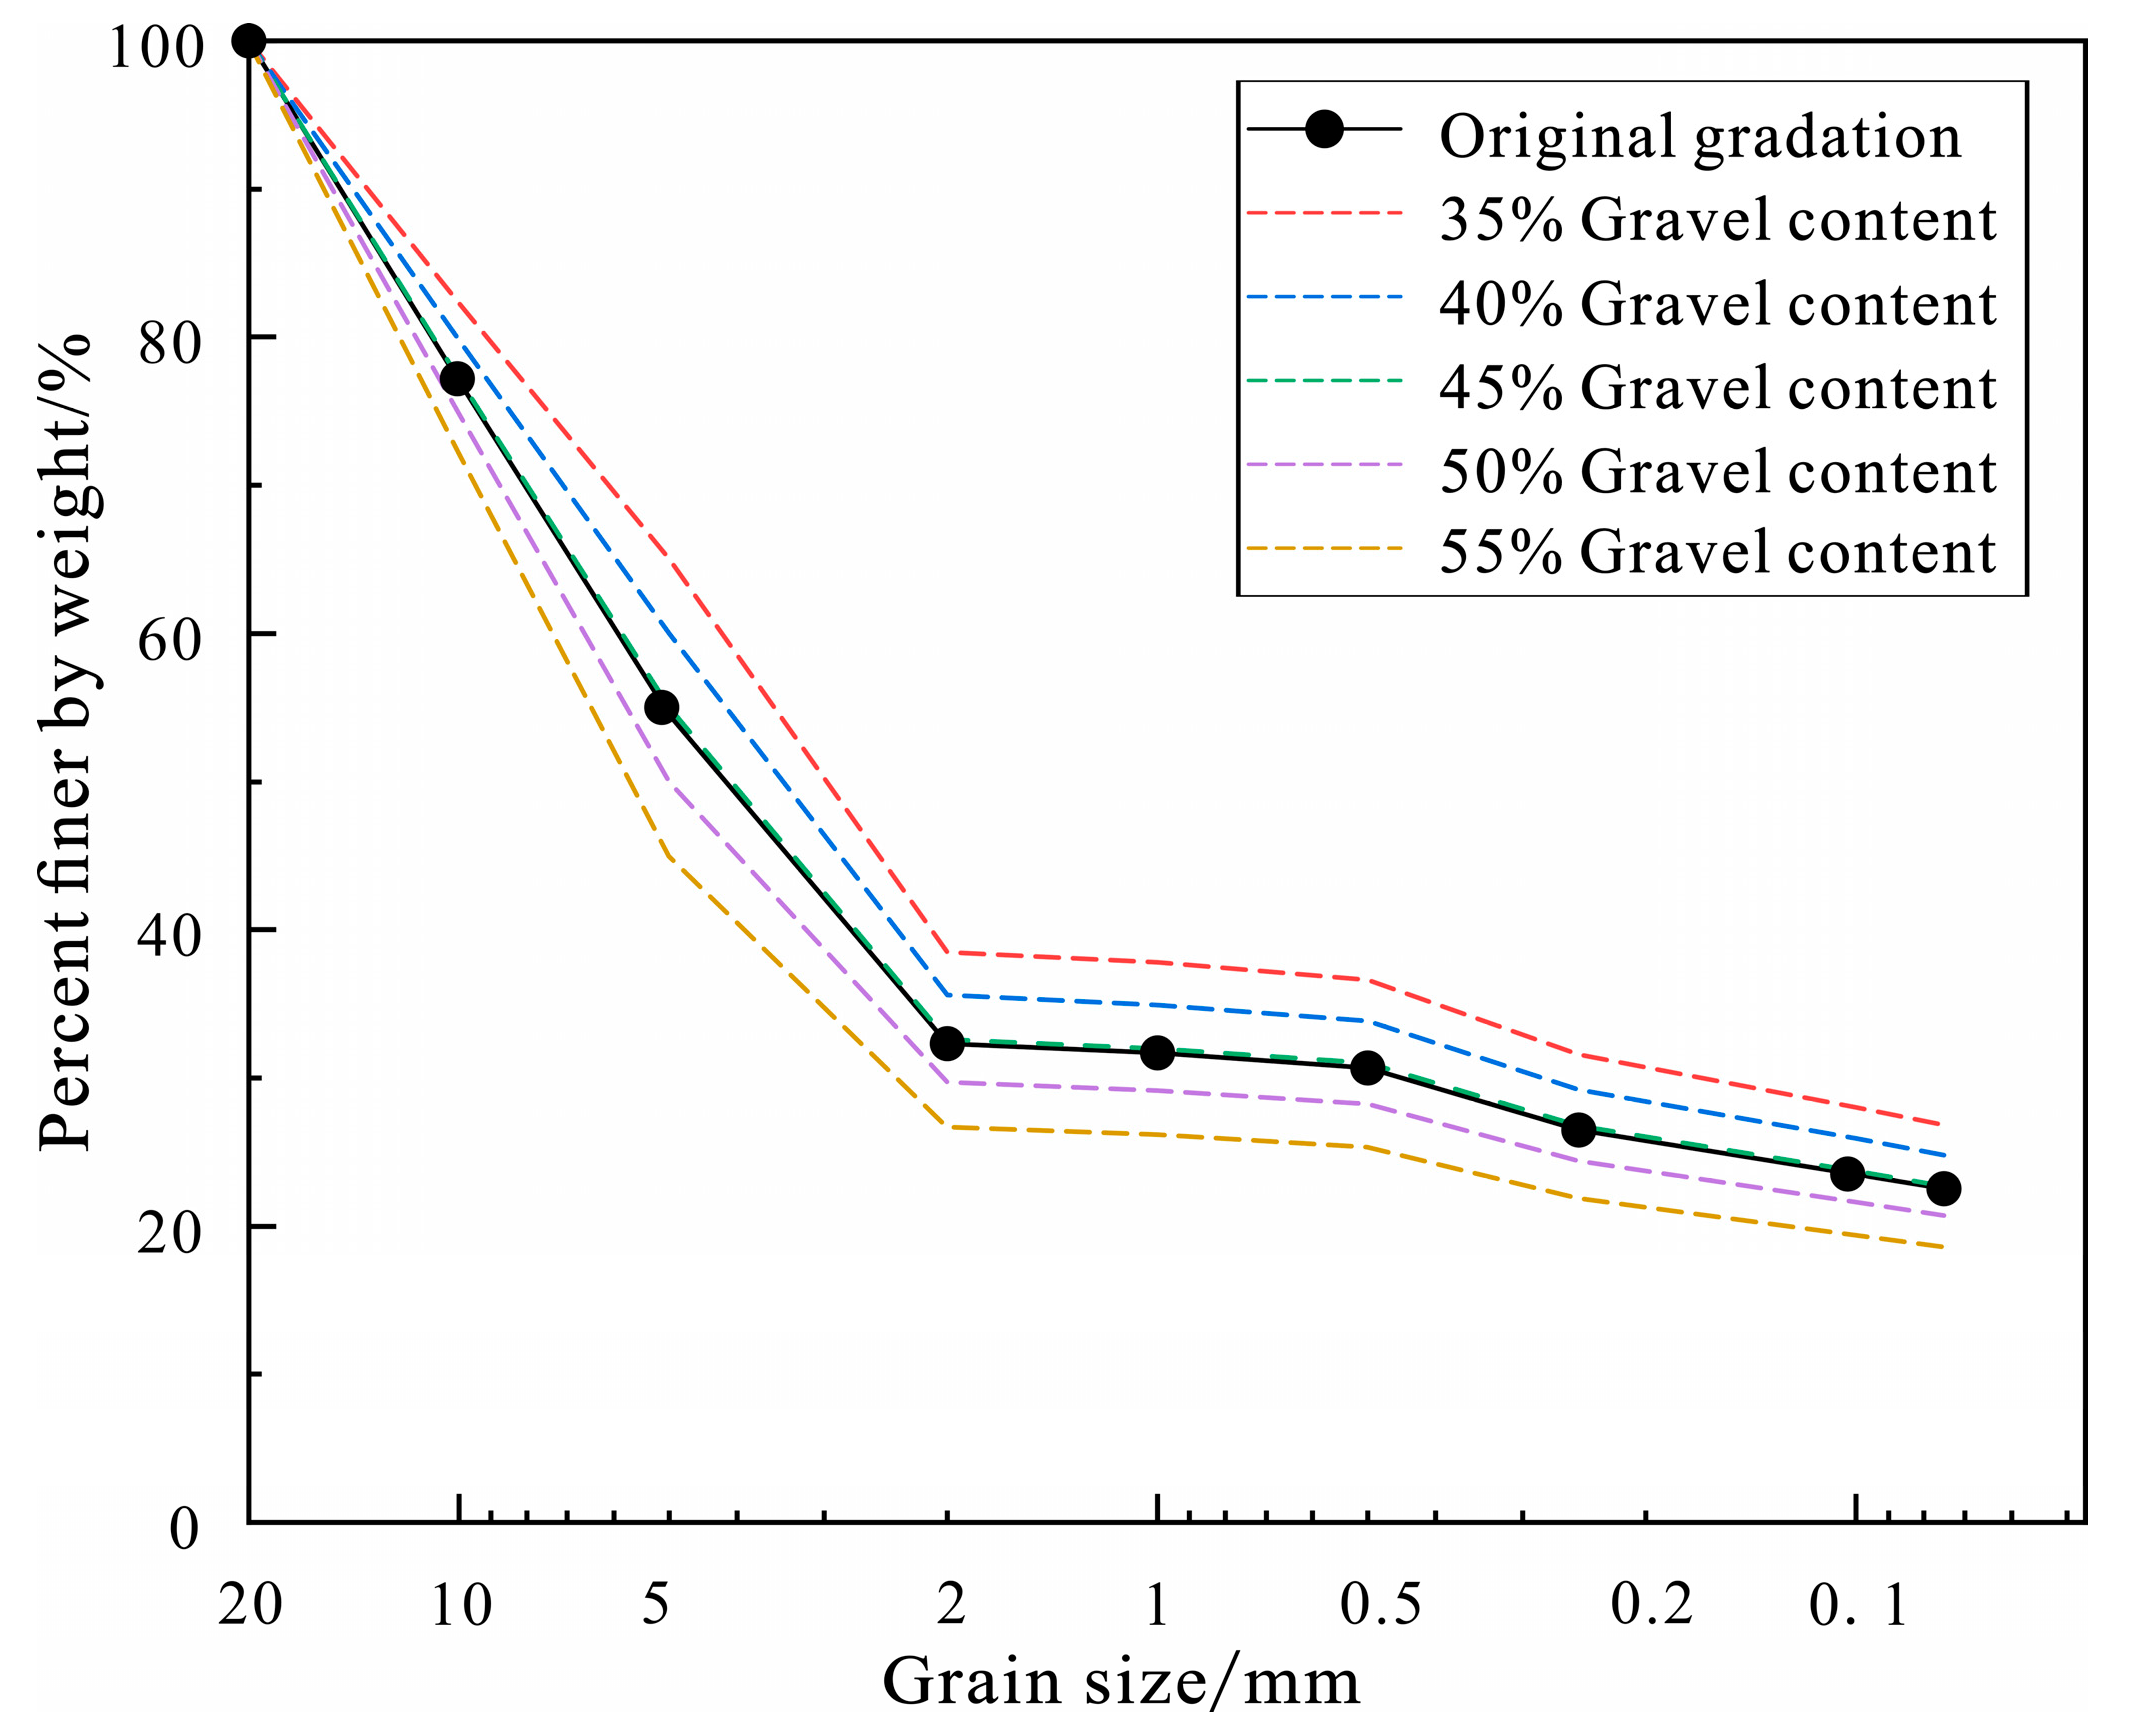
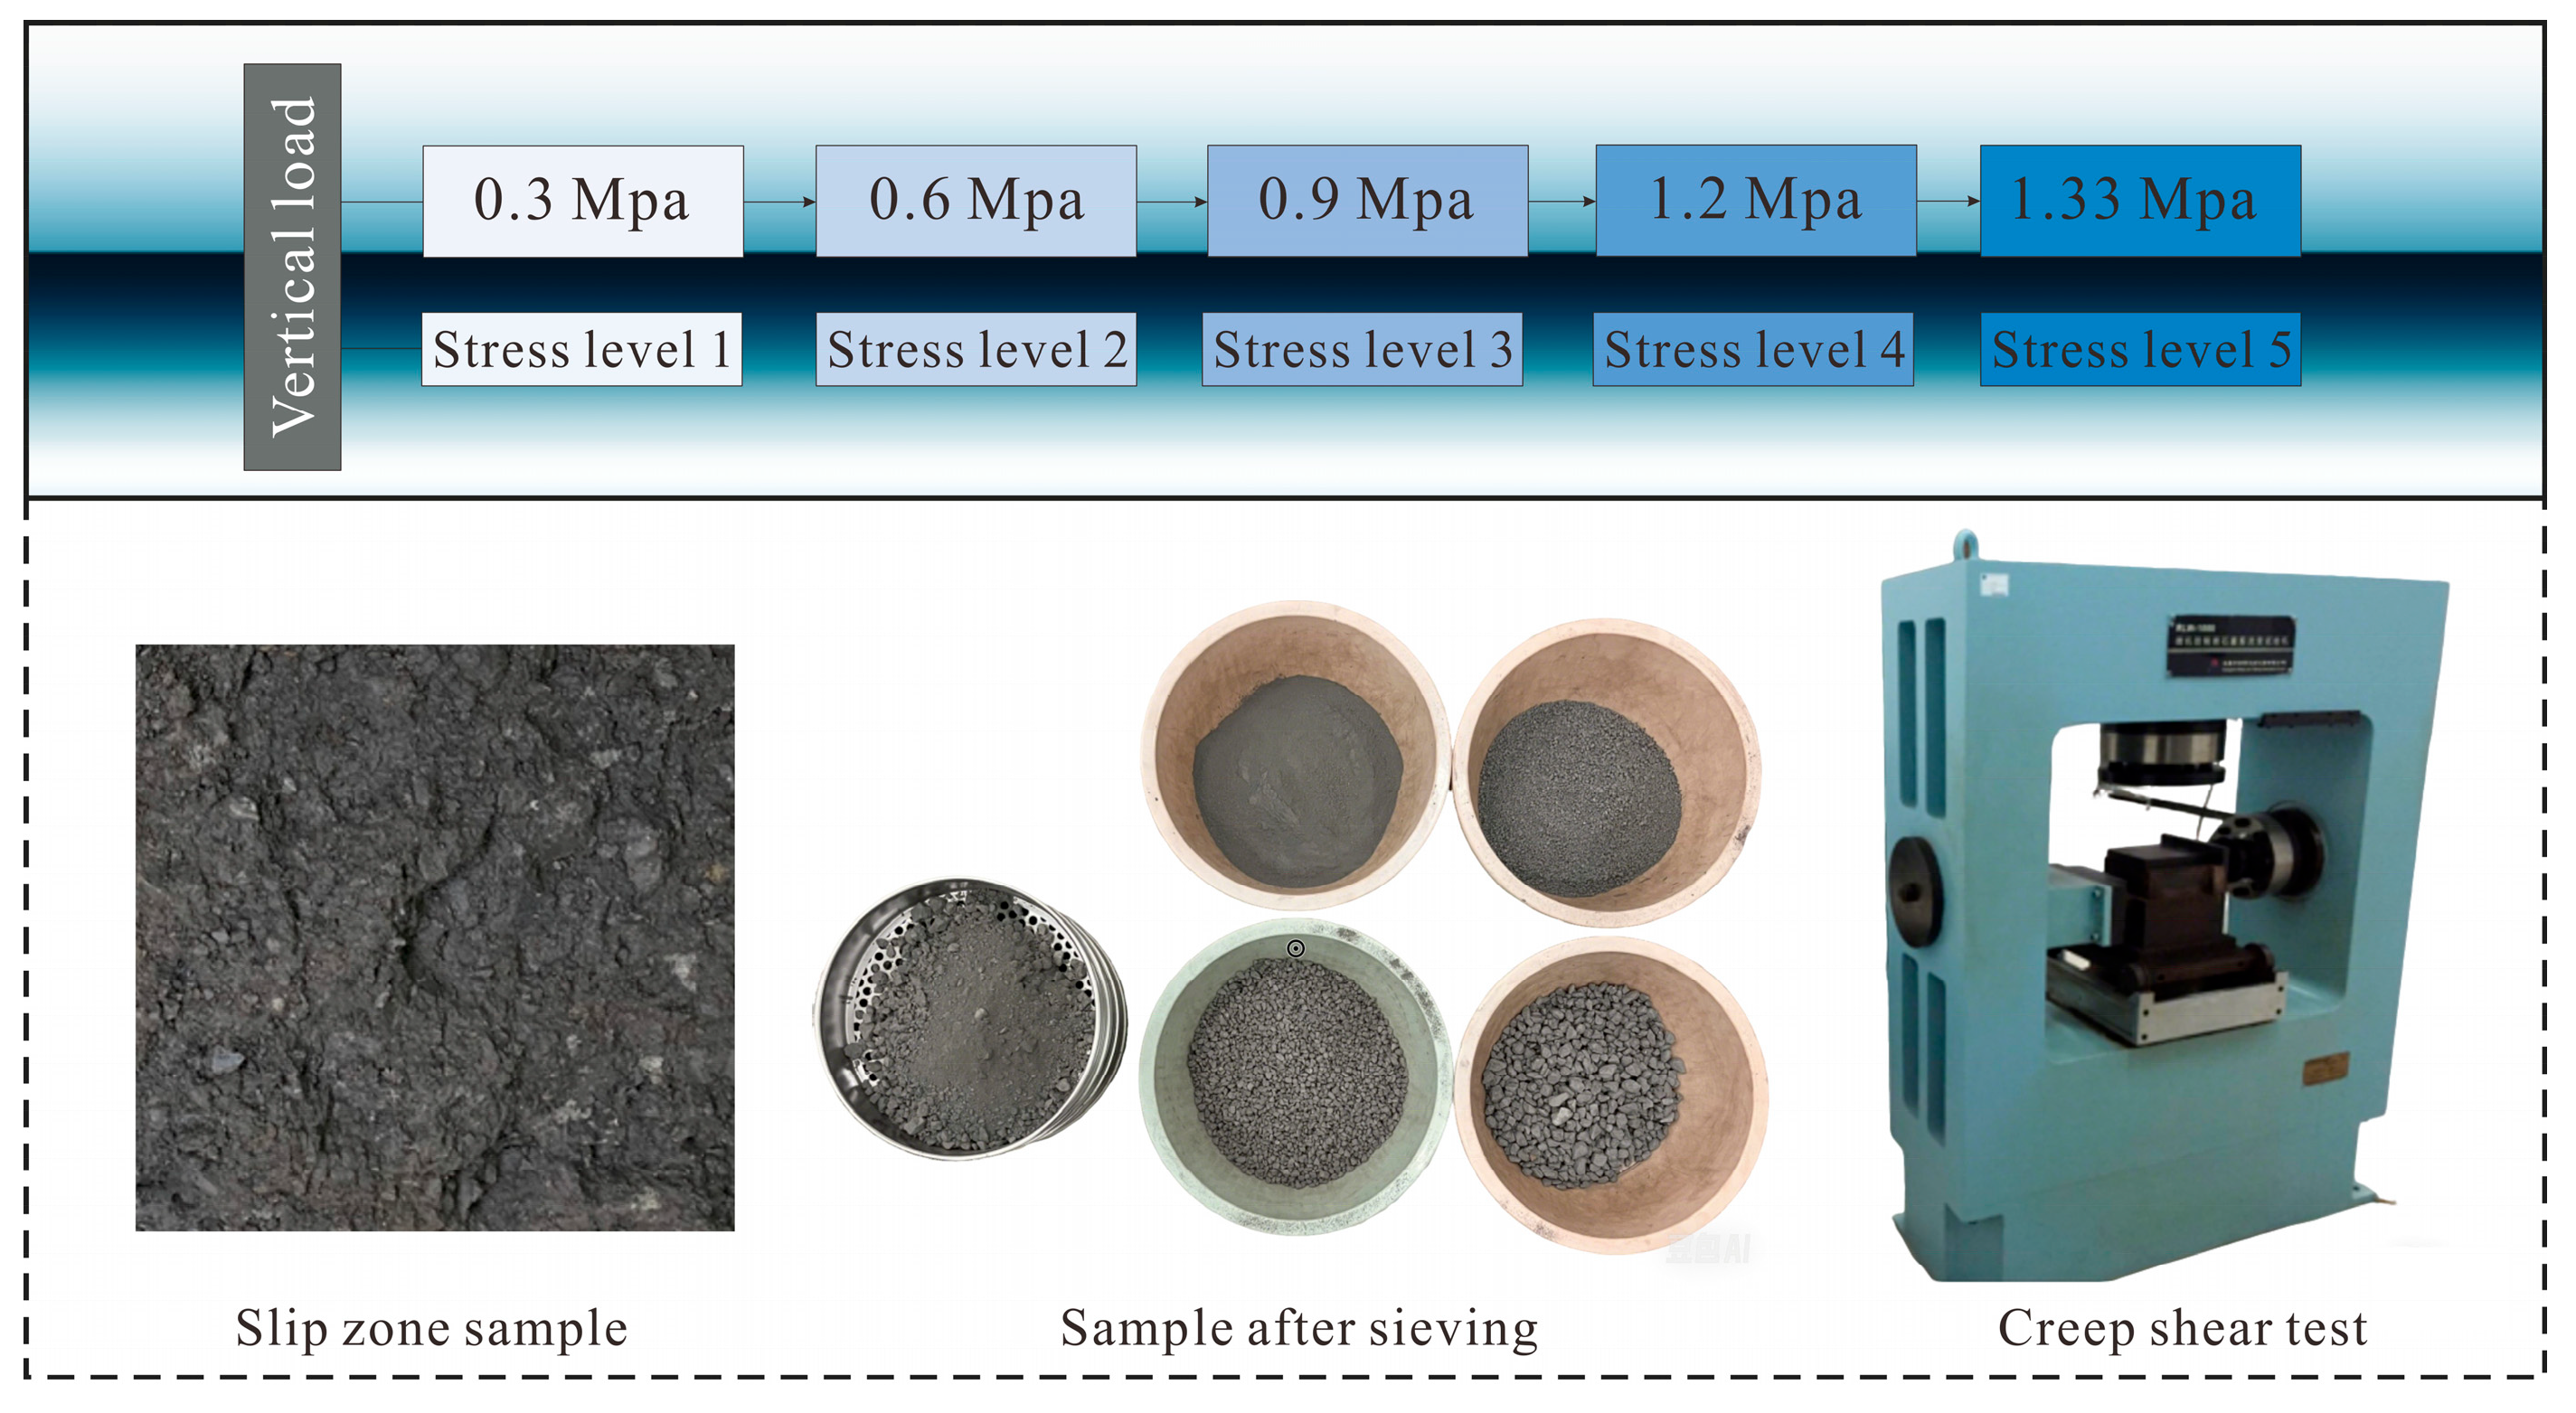
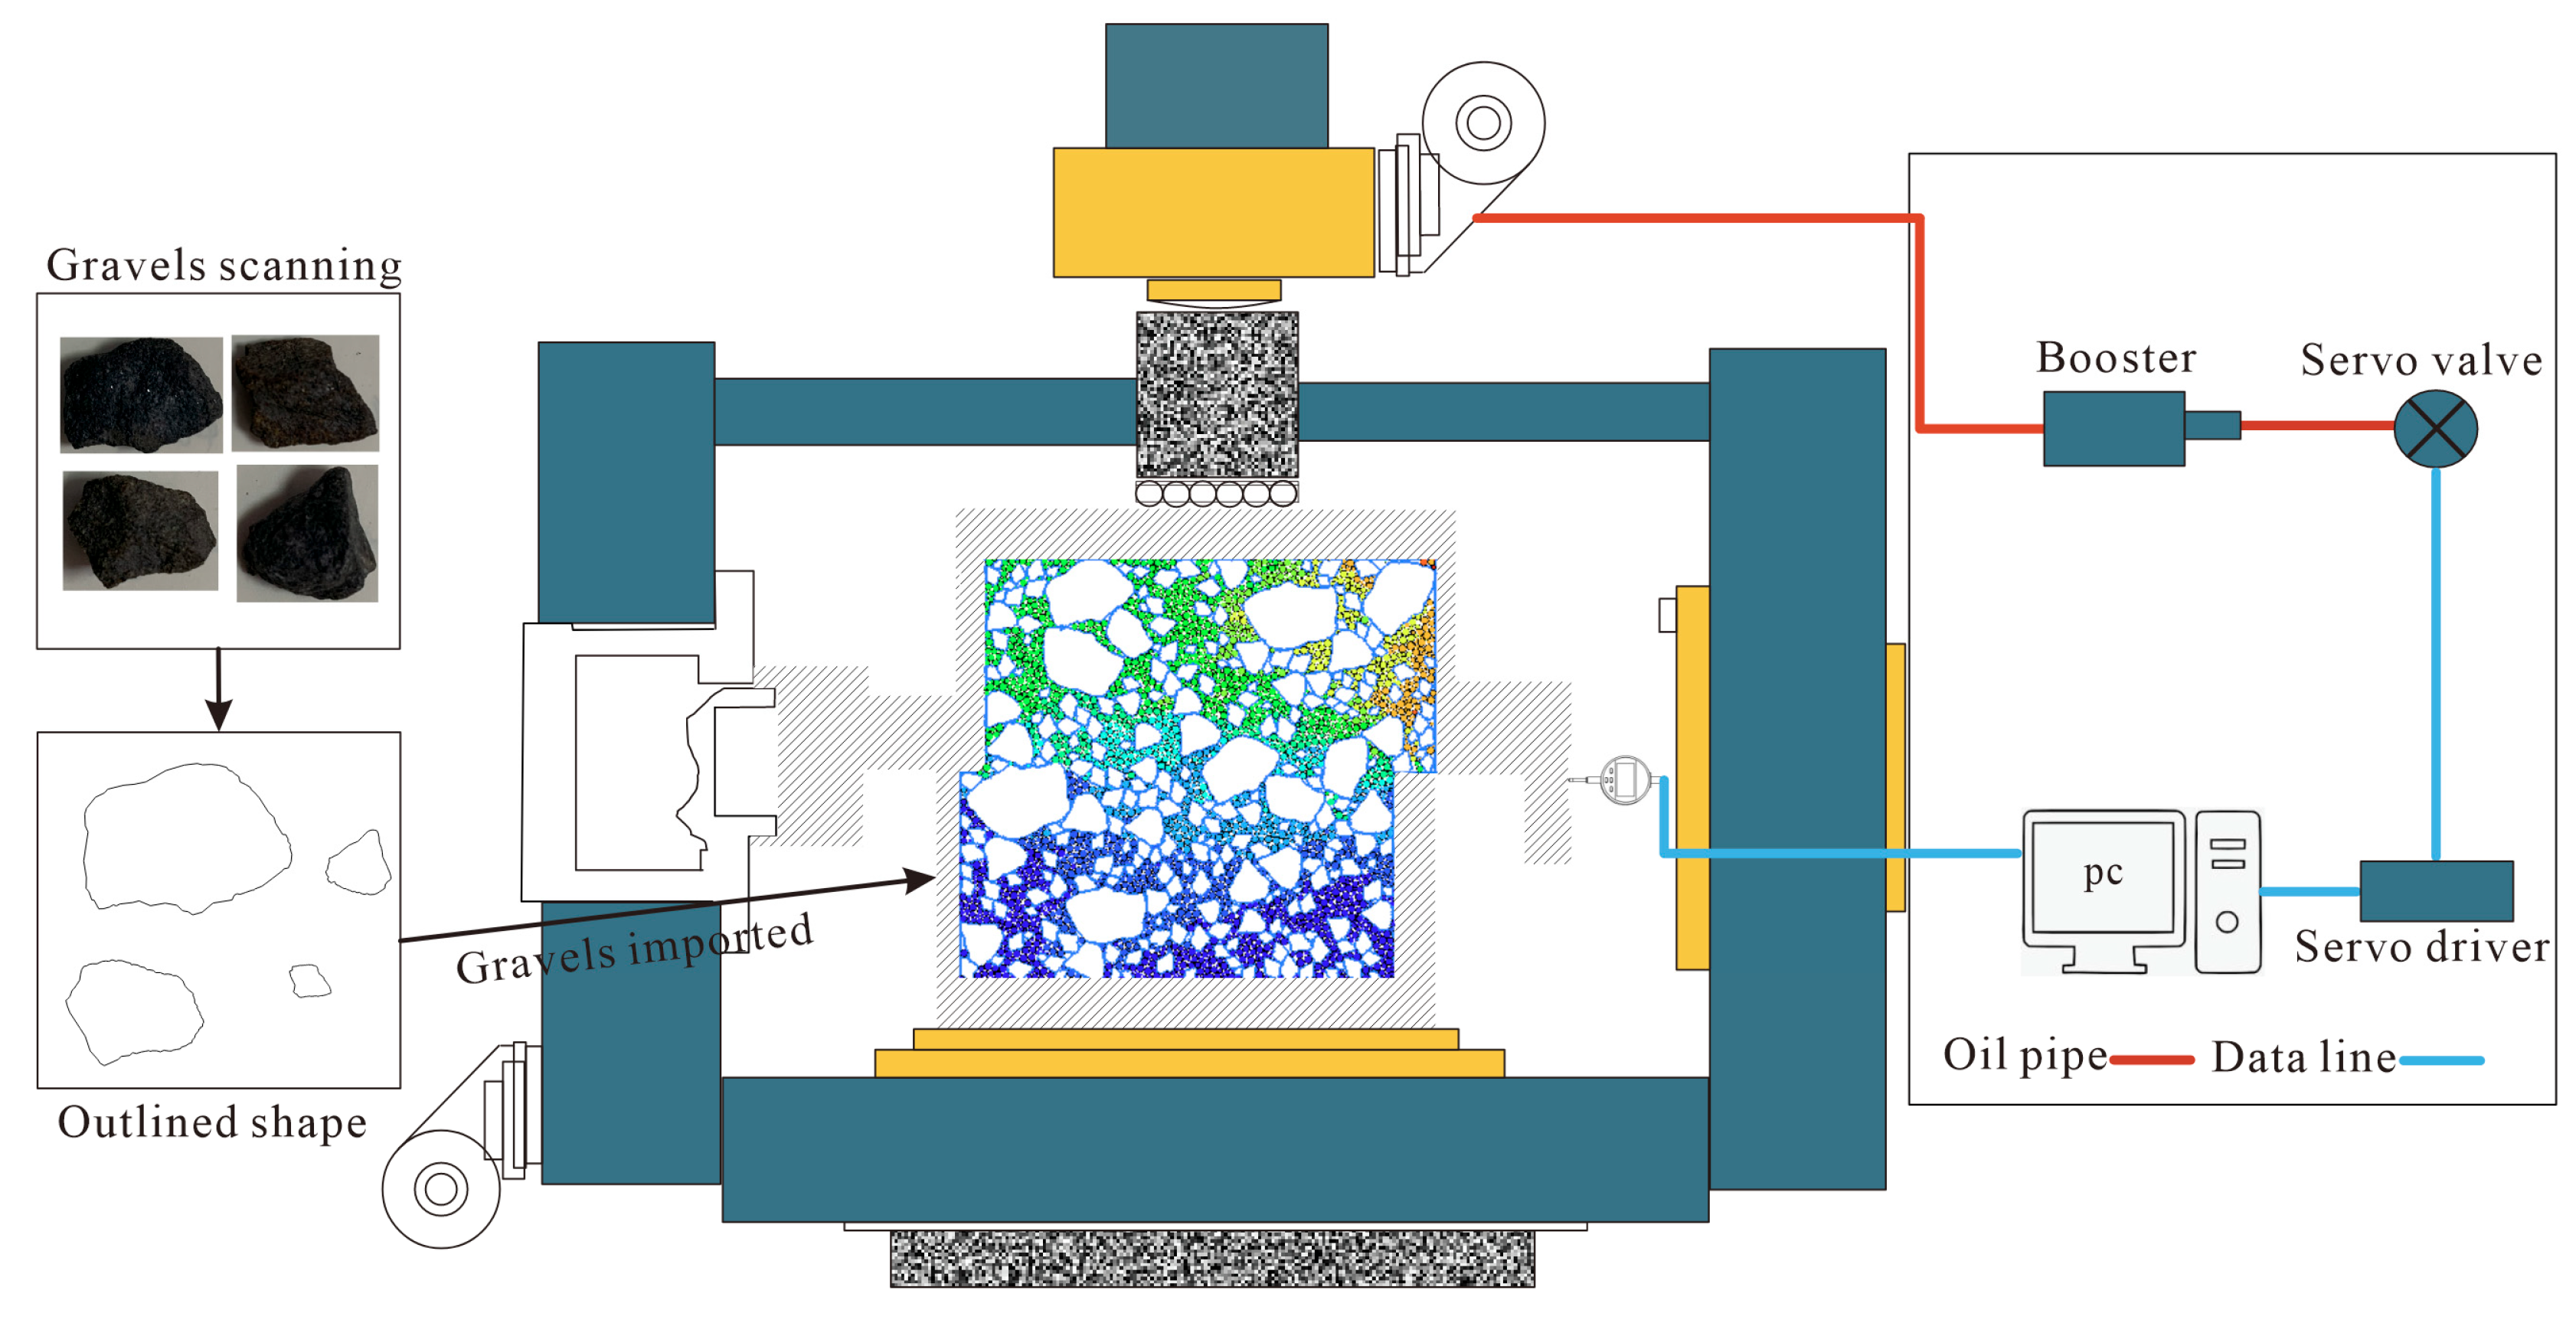
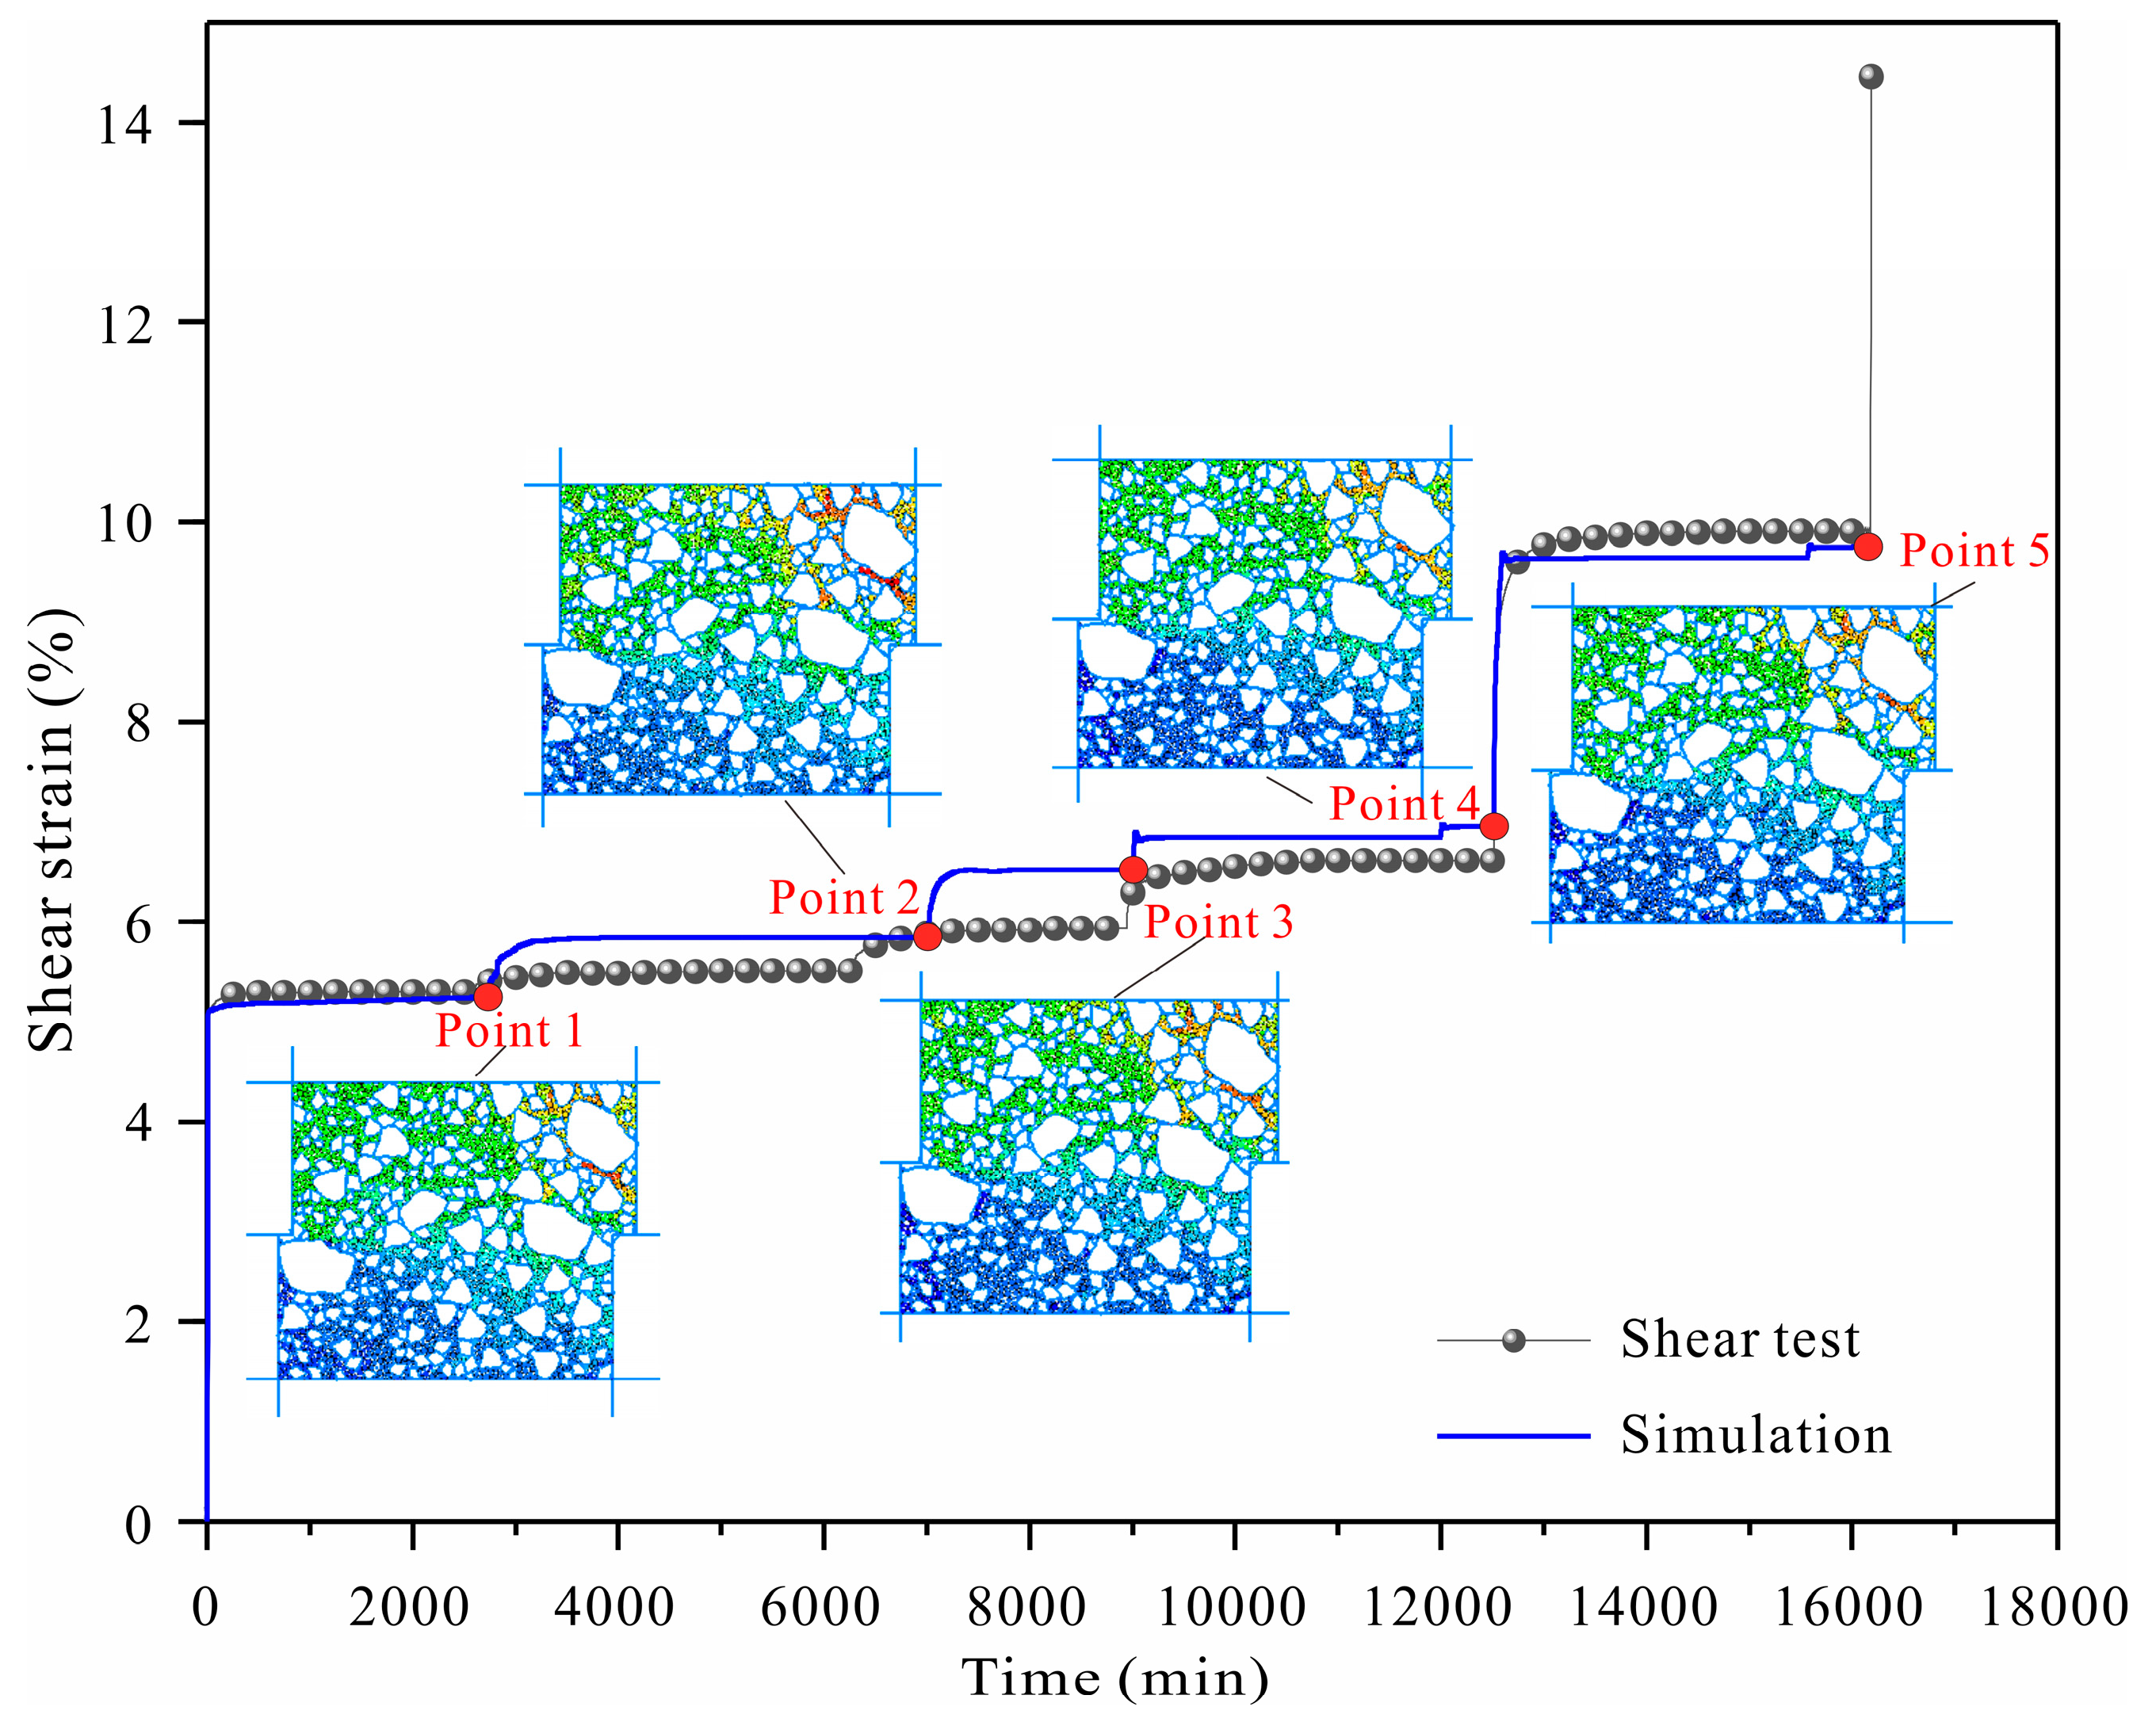
2.2. The Large-Scale Direct Shear Creep Tests

The slip zone soil samples used in this study were collected from the H-branch tunnel face of the Outang landslide test hole. The tunnel is located in the S3 slip zone of the secondary landslide (Figure 1c), with a vertical surface elevation of approximately 360 m. The slip zone soil is composed of carbonaceous shale, gray-black in color, with an average measured density of 2.24 g/cm3 and a natural water content of 11%. Five sets of soil samples, with sizes of 200 mm × 200 mm × 200 mm, were prepared with gravel content of 35%, 40%, 45%, 50%, and 55%, respectively. The water content of the samples was maintained at the natural water content. According to the existing research results and classification system, the division of soil and gravel materials is mainly based on the particle size standard. In the Geotechnical Test Procedure for Highway (JTG E40-2007), particles with a particle size larger than 2 mm are clearly defined as “gravel”. However, in engineering practice and scientific research, based on the standardization of equipment needs and ease of operation, 5 mm has gradually become the common demarcation between soil and gravel in soil-gravel mixtures [31,32]. Therefore, in this study, 5 mm was taken as the boundary between soil and gravel, where particles between 5 mm and 20 mm were defined as “gravel” and those smaller than 5 mm were defined as “soil.” Based on this definition, particle size distribution curves for the five typical soil-gravel mixtures were obtained (Figure 2).
Due to resource and time constraints during the initial study phase, the current research failed to conduct replicate experiments for each gravel content level. As a result, each group of creep tests included only a single sample. To fully simulate the in-situ stress state of the slip zone soil, the overlying soil pressure on the slip zone was targeted. Stepwise consolidation was applied to gradually increase the normal stress, ensuring the sample was sufficiently consolidated. According to geological survey data and tunnel distribution in the Outang landslide area, the sampling depth of the slip zone soil was found to be 60.5 m, resulting in an overlying pressure of 1328 kPa. Therefore, the consolidation stresses were selected as 300 kPa, 600 kPa, 900 kPa, 1200 kPa, and 1328 kPa, representing five levels of consolidation loading (Figure 3). The first four levels of consolidation pressure were maintained for 2 to 3 h, while the final level was consolidated for 24 h, in accordance with the guidelines specified in ASTM-D2435 for adjusting consolidation durations based on soil characteristics, such as permeability and stress levels. Following consolidation, the peak shear strength (τn) of the slip zone soil samples with varying gravel contents was assessed using large direct shear tests, as per ASTM-D3080. The peak shear stress was identified from the shear stress-displacement curve if a distinct peak was present; otherwise, the shear stress at 10% relative lateral displacement (20 mm for 200 mm specimens) was adopted. The applied shear stresses for the tests were established as 0.5τn, 0.625τn, 0.75τn, 0.875τn, and 1τn, corresponding to gravel contents of 30%, 40%, 45%, 50%, and 55%, respectively. Under sustained normal load, the initial shear stress was applied, and the creep displacement was measured at 60-s intervals until the shear displacement reached stabilization. The shear stress was subsequently elevated to the next level, and the procedure persisted until sample failure occurred. A flowchart of the testing procedure is shown in Figure 3. The subsequent shear stress level was applied when the cumulative creep strain within 24 h was less than 5‰ [33].

3. Results

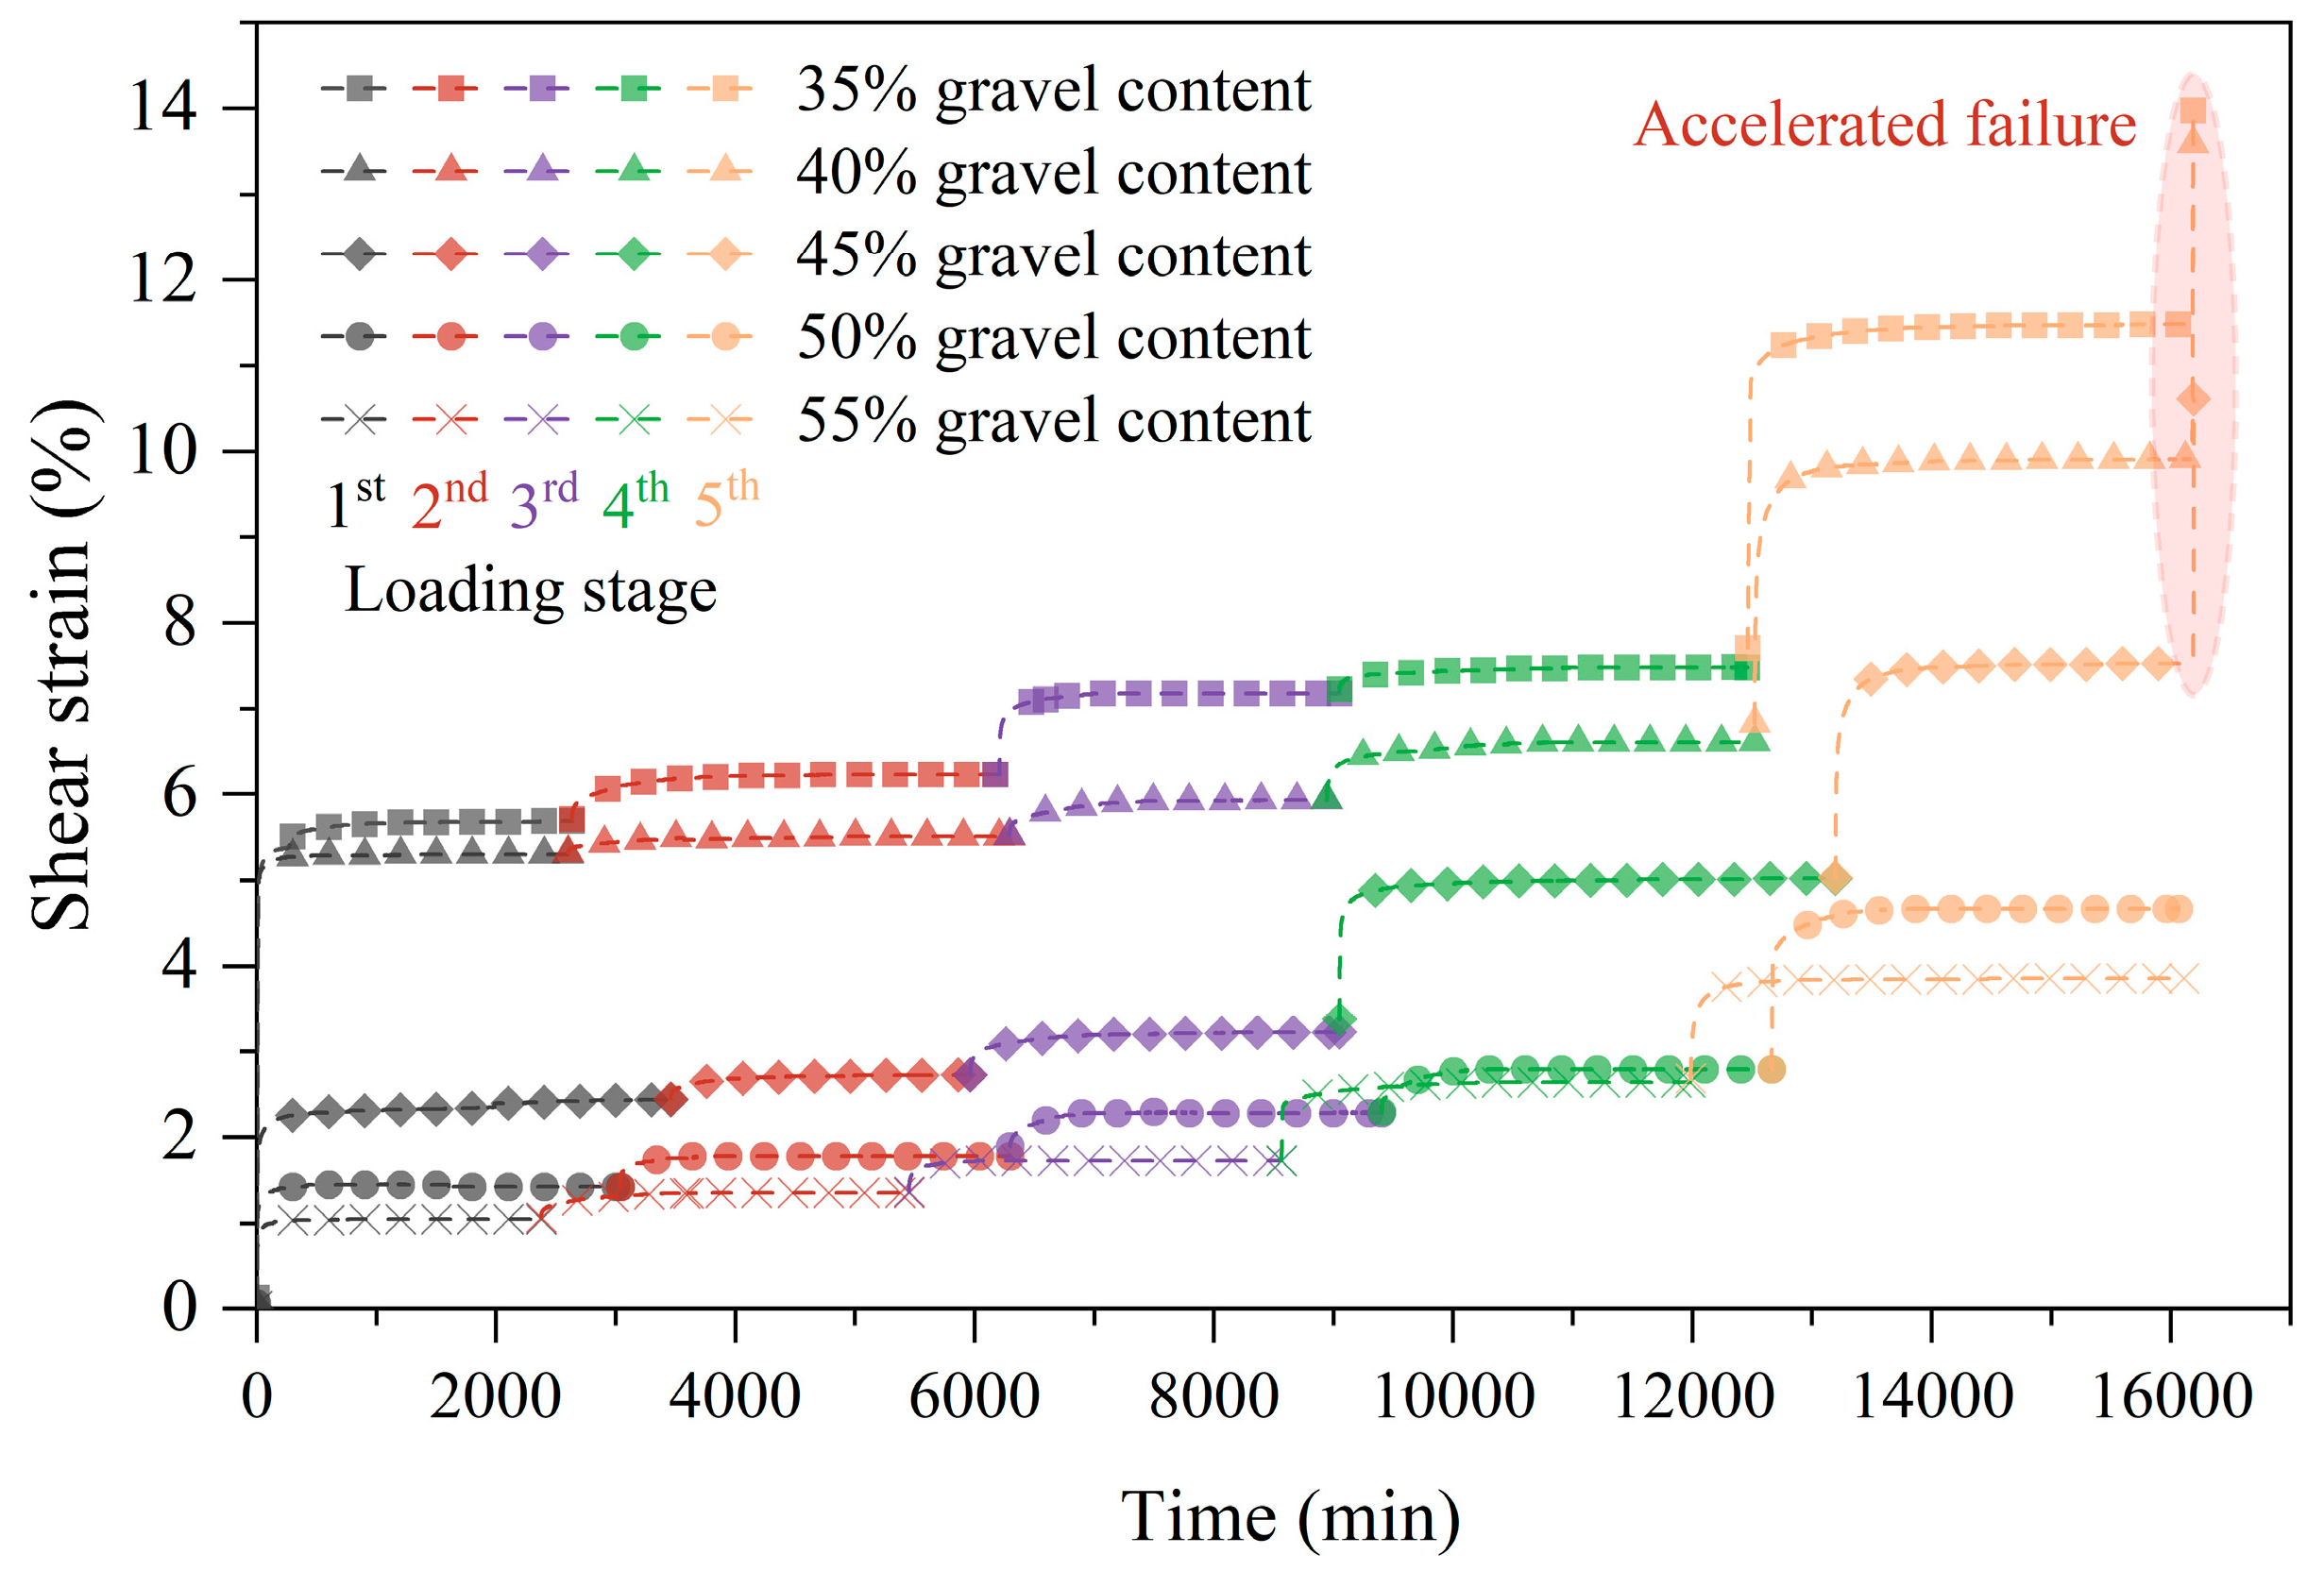
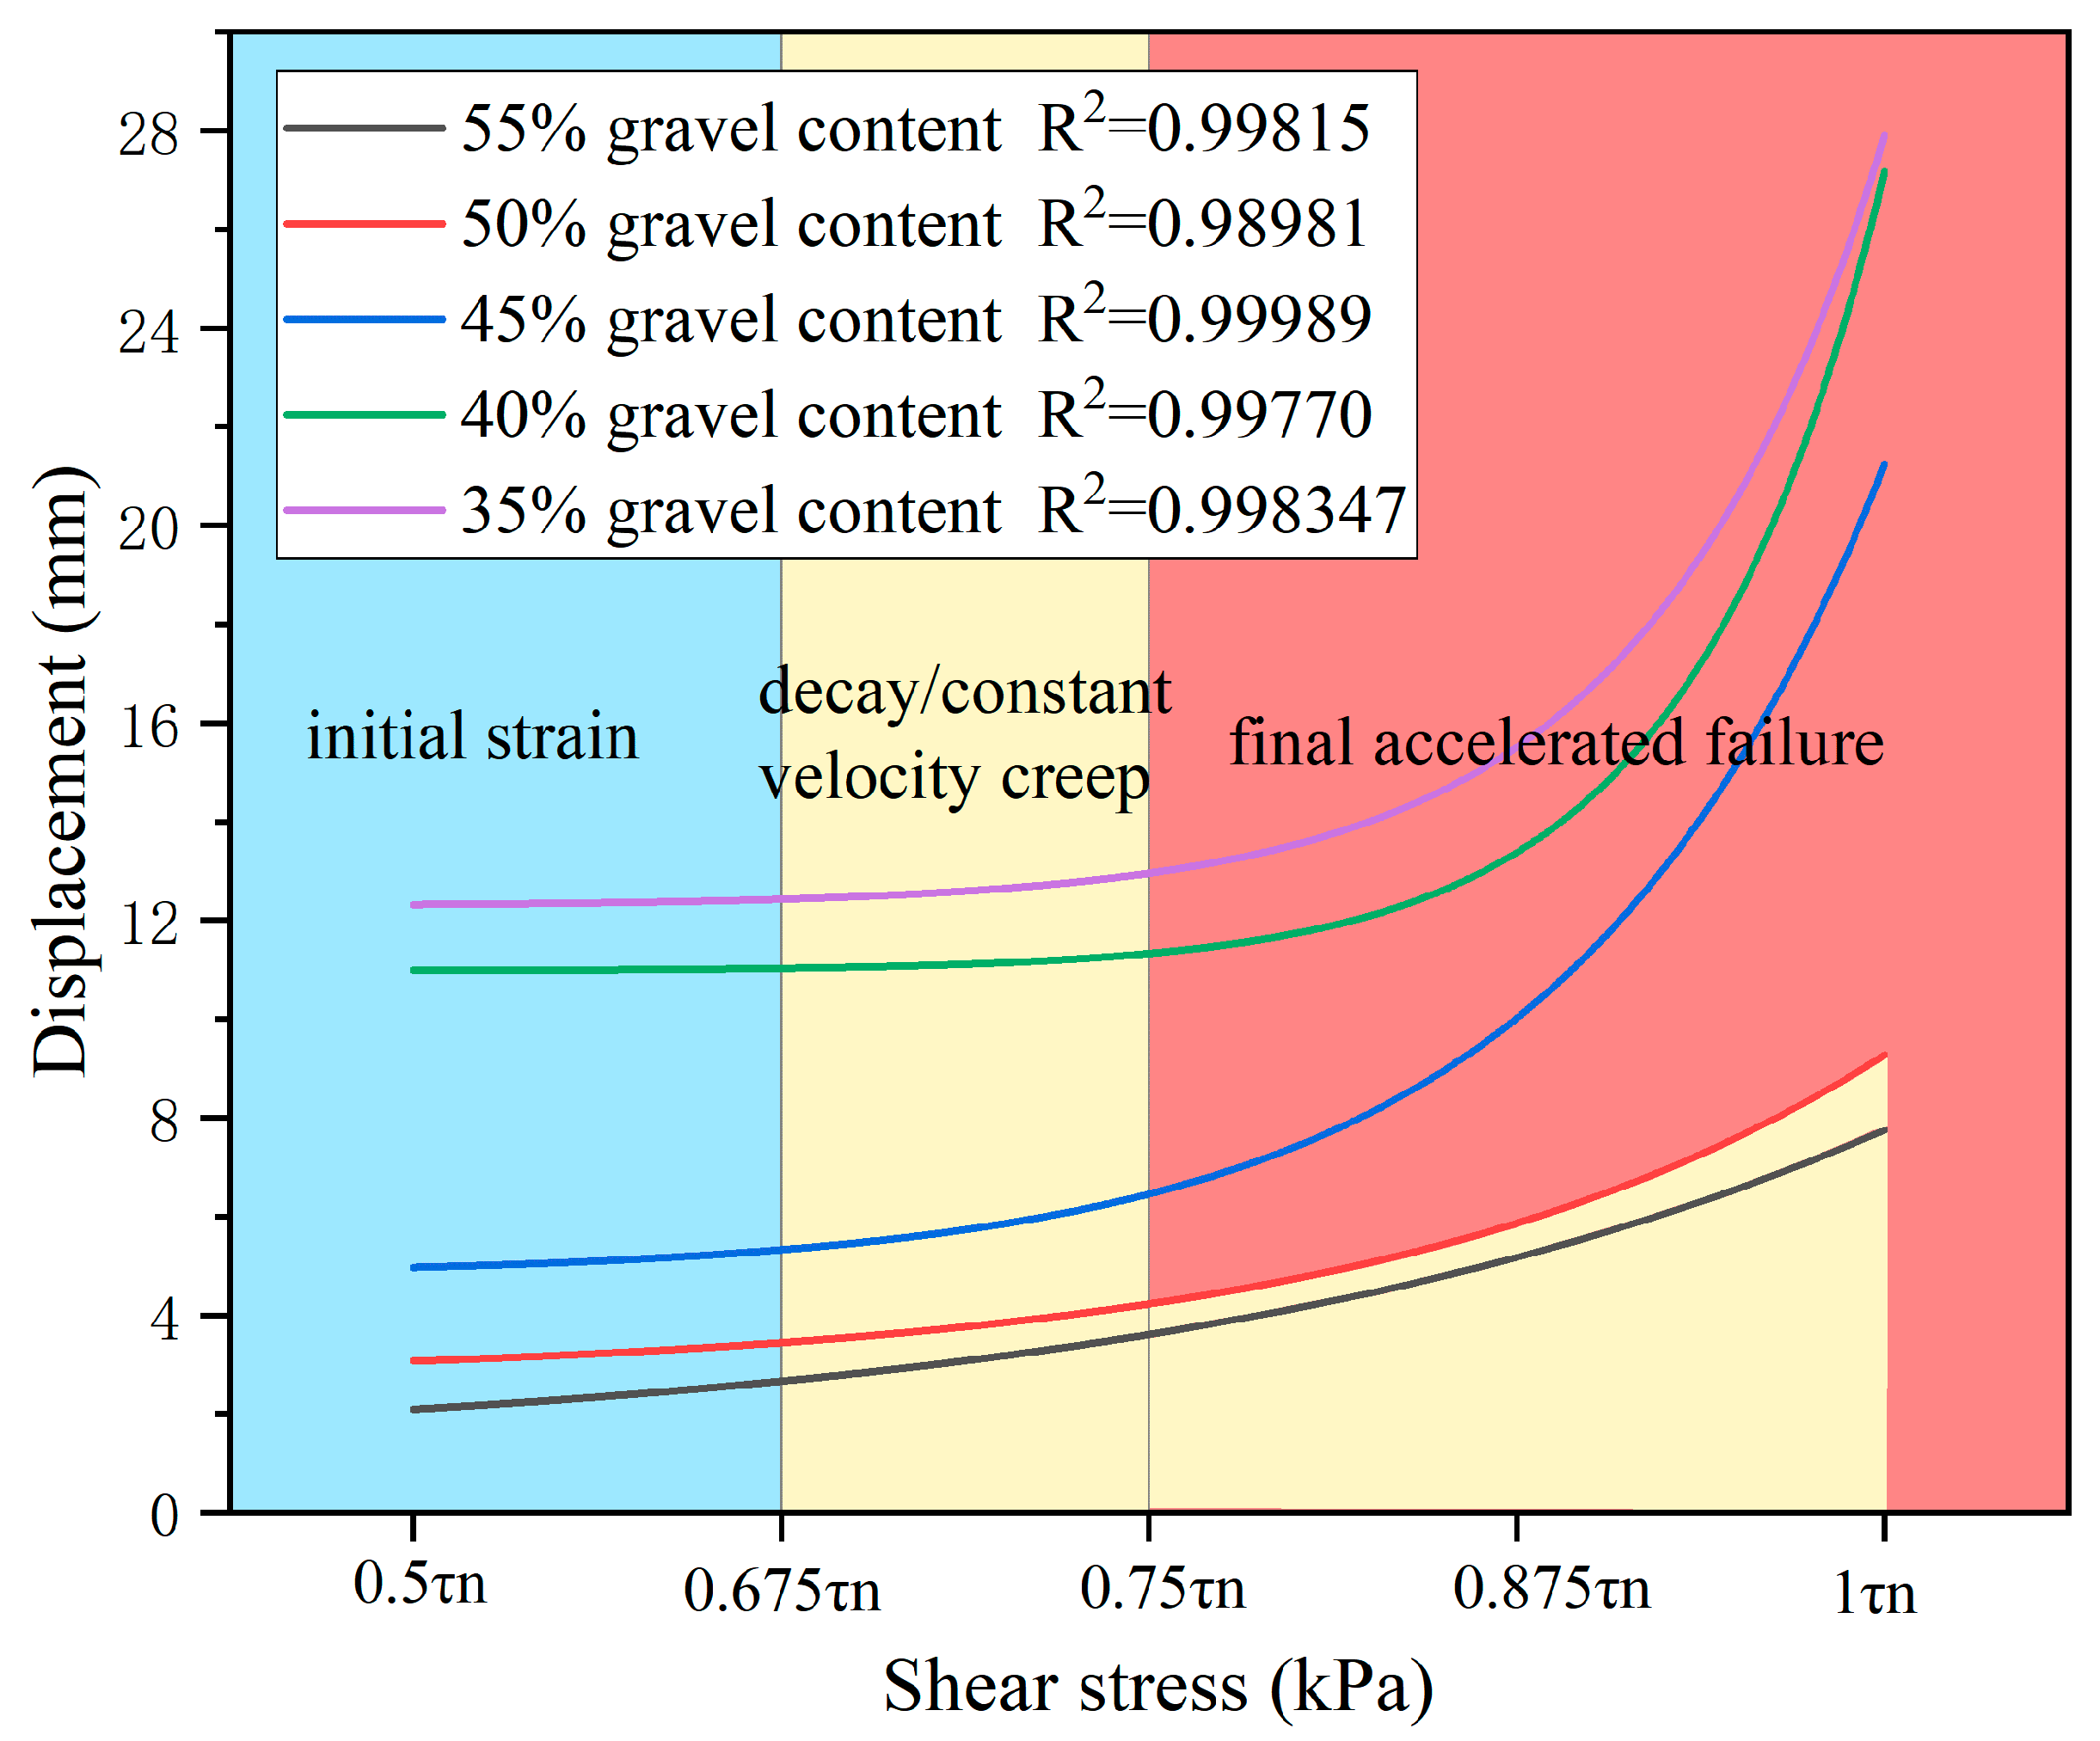
3.1. Deforming Characteristics

Figure 4 illustrates the shear strain-time curves of slip zone soil under varying gravel content conditions; Figure 5 illustrates the displacement-shear force curves of slip-zone soils with different rock contents. All creep curves comprise the initial stage, decay creep stage, and constant velocity creep stage, although certain curves may lack the acceleration creep stage. As summarized in Table 1, the creep characteristics of slip zone soil under varying gravel content circumstances demonstrate that the creep behavior exhibits multi-stage evolution features, with failure modes closely associated with the gravel content. Specifically, when the gravel content is 35%, the first shear stress level triggers a significant initial strain of 5.69%. The strain increments then sharply decreases at load levels 2 to 4 (0.54%, 0.95%, 0.37%), but a sudden increase in strain increments occurs at the 5th load level (6.43%), leading to accelerated failure. As the gravel content increases to 40%, the initial strain decreases slightly to 5.30%, and the strains from load levels 2 to 5 show an increasing trend (0.21%, 0.42%, 0.69%, 7.34%), ultimately resulting in accelerated failure at the 5th load level. When the gravel content increases further to 45%, the initial strain decreases significantly to 2.45%, and the strain increments at the subsequent four levels gradually expand (0.29%, 0.48%, 1.81%, 5.57%), with accelerated failure again occurring at the 5th level. Notably, when the gravel content increases to 50% and 55%, the samples only experience the initial stage, decay creep, and constant velocity creep stages, with no accelerated failure observed.
The test results show that under different gravel content conditions, the creep behavior of the soil-gravel mixture exhibits multi-stage features driven by stepwise loading and there is a clear cut-off value for the trend of increasing strength of soil-rock mixtures [34]. when gravel content ≤ 45%, the creep behavior shows significant initial strain, decay/constant velocity creep, and final accelerated failure (as seen in the 35% gravel content case at the 5th level). However, when gravel content ≥50%, a stable force chain network forms with the gravel skeleton, and creep stagnates in the constant velocity stage without triggering accelerated failure [35,36,37]. This critical threshold (45%-50%) marks a shift in the material’s mechanical behavior from “soil-dominated progressive damage” to “gravel-dominated energy dissipation,” indicating that soil-gravel mixtures with gravel content exceeding 50% have better creep stability. This threshold aligns with findings from prior granular mixture studies: Polito et al. [38] identified a threshold sand content (TSC) in sand-gravel mixtures for mechanical behavior transition between gravel- and sand-dominated states; Liu et al. [39] reported a 44.1% critical gravel content for modulus enhancement via skeleton formation in high-plasticity soil-gravel mixtures, validated by CT scans; Jiang et al. [40] observed gravel content thresholds of 40% and 80% in residual soil-gravel mixtures, where shear strength transitioned from matrix-dominated to skeleton-supported.

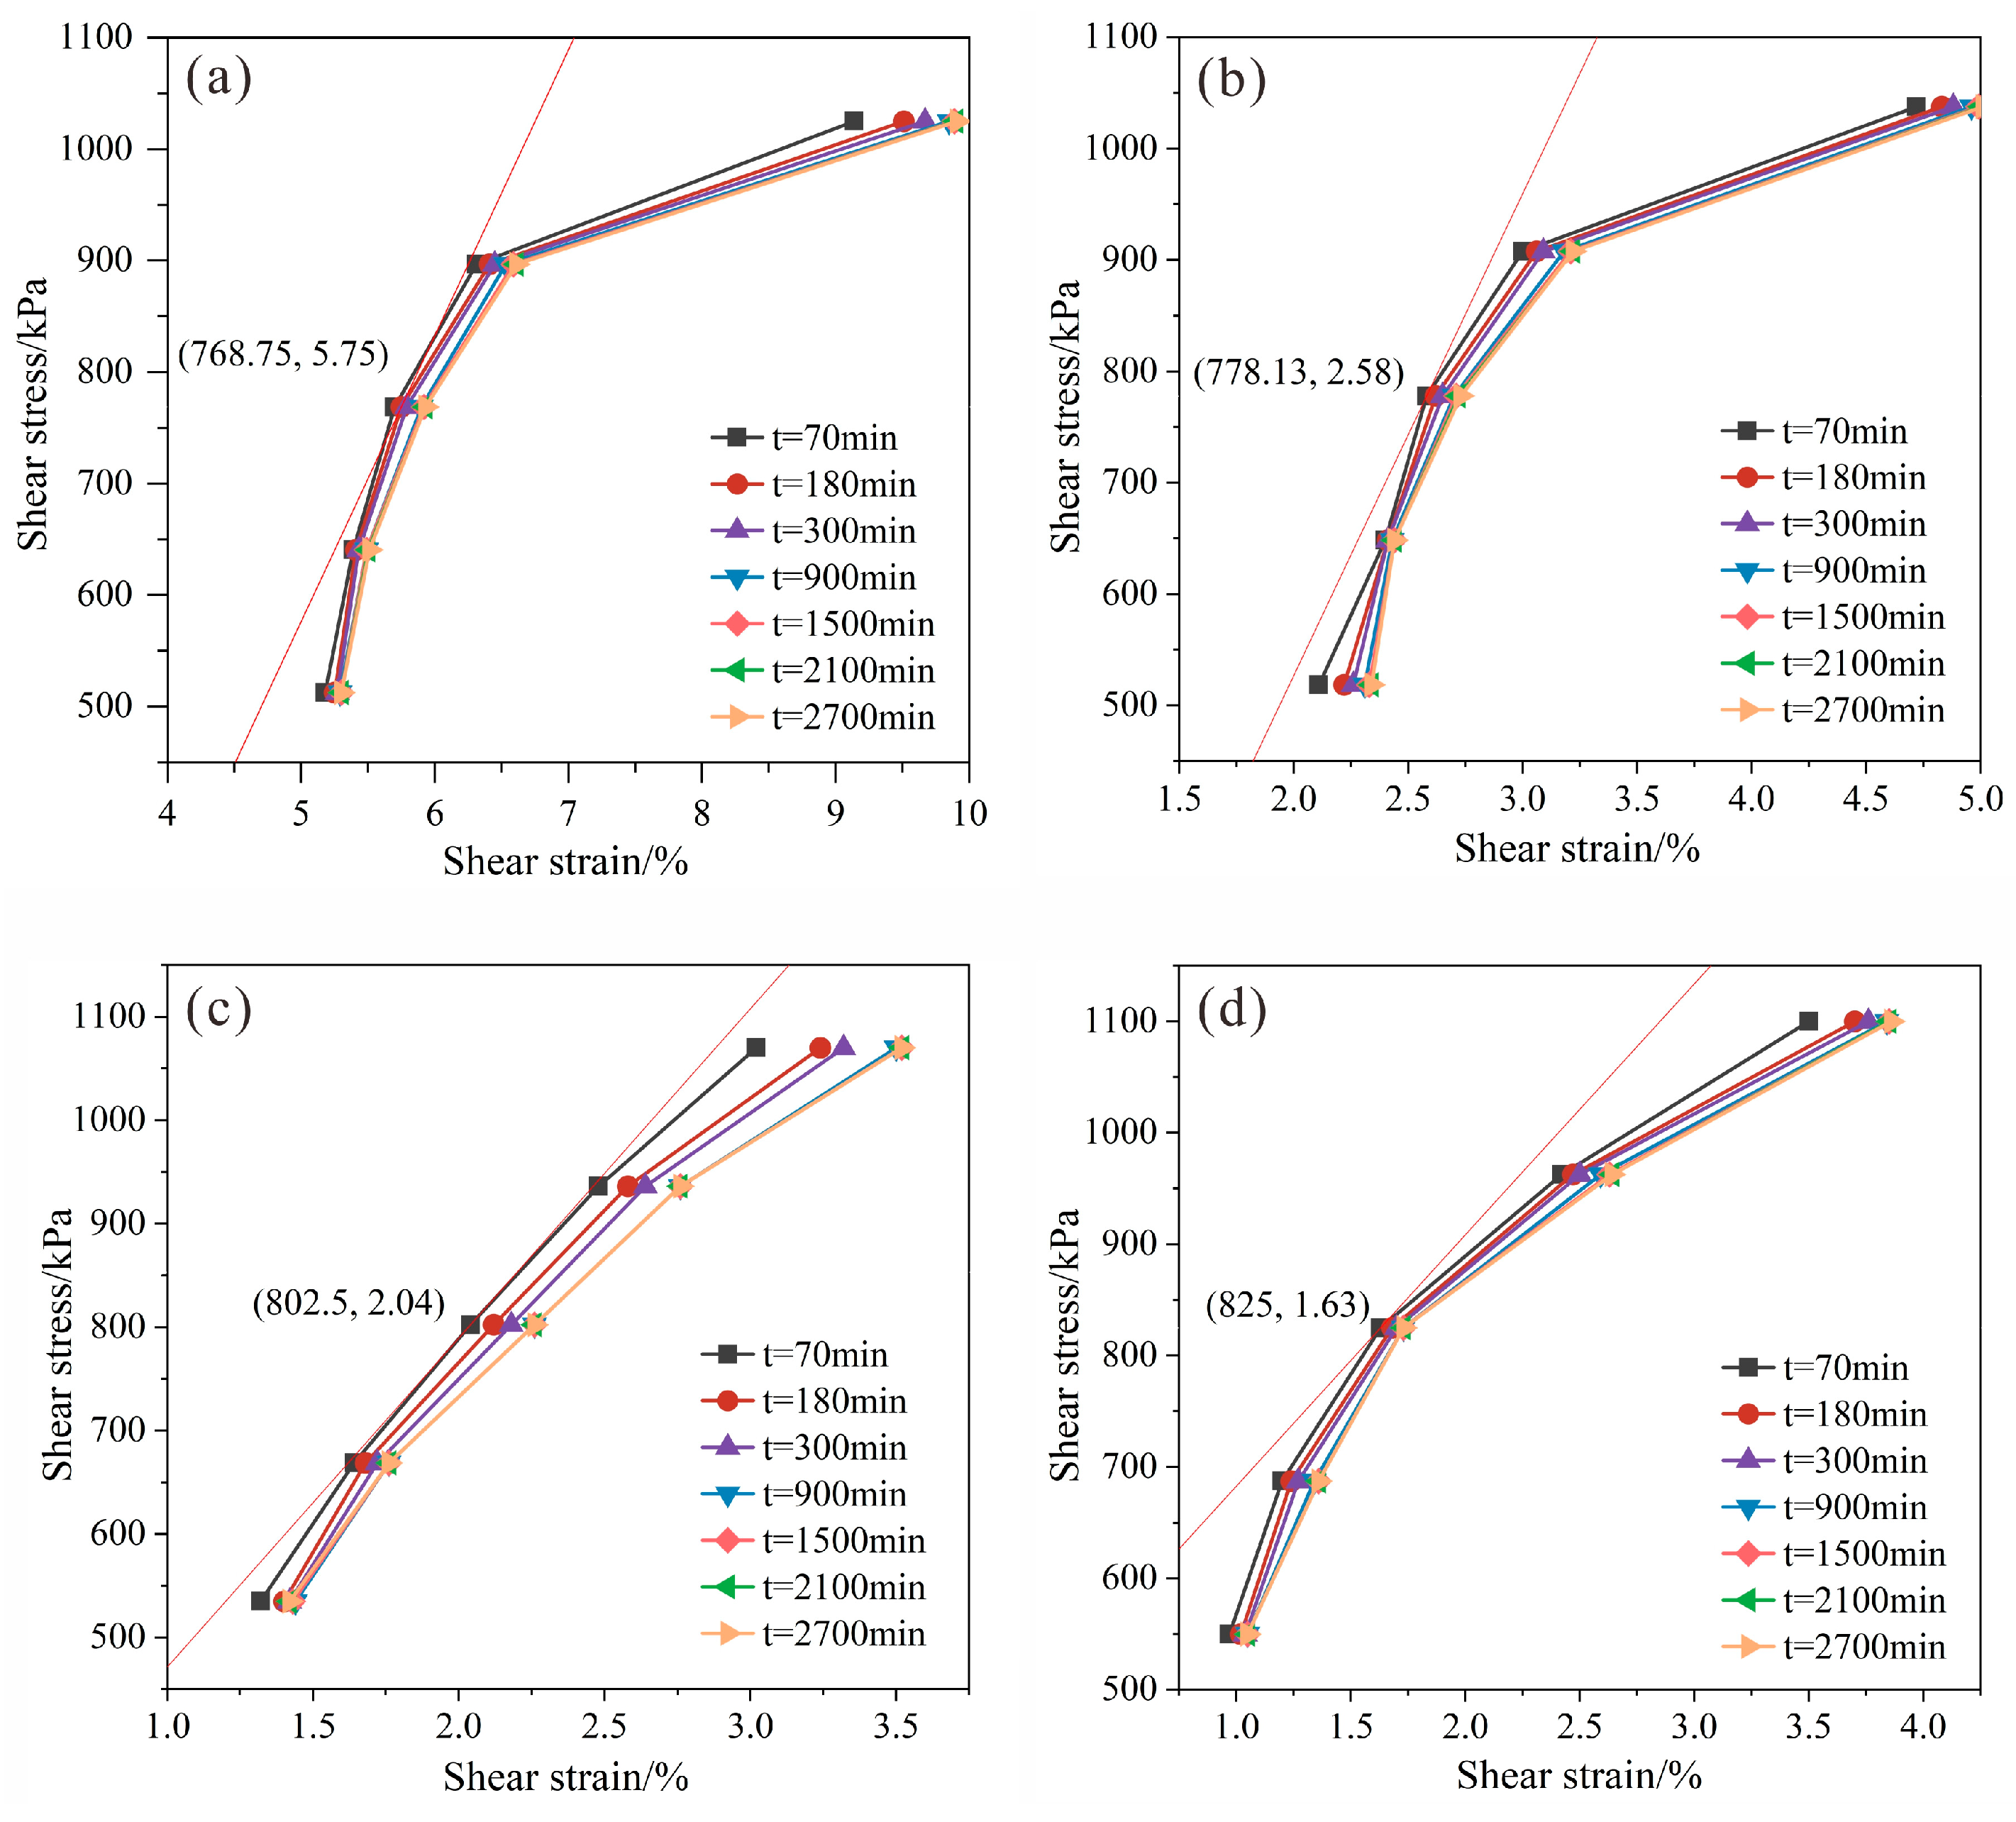
3.2. Stress–Strain Characteristics During Creep

The stress-strain curves at constant time were obtained by extracting the creep strain and axial stress data at the same time for different stress levels, converting the time-dependent mechanical behavior into a static map. The curve clearly quantifies the transition from elastic deformation to viscoplastic deformation and identifies the critical stress threshold for the transition from stable creep to unstable creep. Based on the creep test results, the strain and axial stress at different stress levels were used to derive the stress-strain curves at constant time, as shown in Figure 6.
The results demonstrate that in the stress-strain curve at a constant period for λ = 0.40, the early phase has a distinct linear growth characteristic, signifying that the slip zone soil acts elastically during the initial loading phase. The intrinsic particle connections of the soil remain intact, and the deformation is entirely reversible. As stress escalates, the sample progressively nears its yield threshold. The yield points for samples with varying gravel concentrations (λ = 0.40, 0.45, 0.50, 0.55) are 768.75 kPa, 778.13 kPa, 802.5 kPa, and 825 kPa, respectively, after which the material transitions into the nonlinear growth phase. Beyond the yield point, the strain of the slip zone soil ceases to grow proportionally to the stress, signifying that the material has transitioned into the plastic deformation phase, wherein permanent deformation transpires.

3.3. Long-Term Strength

The long-term strength of slip zone soil denotes the minimal strength value of the soil subjected to prolonged loading. As the duration of external loading extends, the strength of the slip zone soil progressively diminishes. As the loading duration approaches infinity, the strength attains its minimal value, signifying the crucial stress threshold at which the soil shifts from stable creep to unstable creep. The inflection point approach applied to the stress-strain curves at constant time revealed the long-term strengths of slip zone soil with varying gravel contents in the Outang landslide to be 768.75 kPa, 778.13 kPa, 802.5 kPa, and 825 kPa, as seen in Figure 7a. This suggests that an increase in gravel concentration correlates with enhanced long-term strength of the slip zone soil. The rise in gravel content may enhance soil structure, hence improving its shear resistance. Figure 7b illustrates the correlation between peak strength and gravel content within the slip zone. The long-term strength is around 25.5% lower than the peak level. This indicates that prolonged loading leads to a steady decline in the strength of slip zone soil, illustrating the detrimental impact of soil structure throughout the extended creep process.

4. Insights into Micro-Scale Mechanism Using DEM
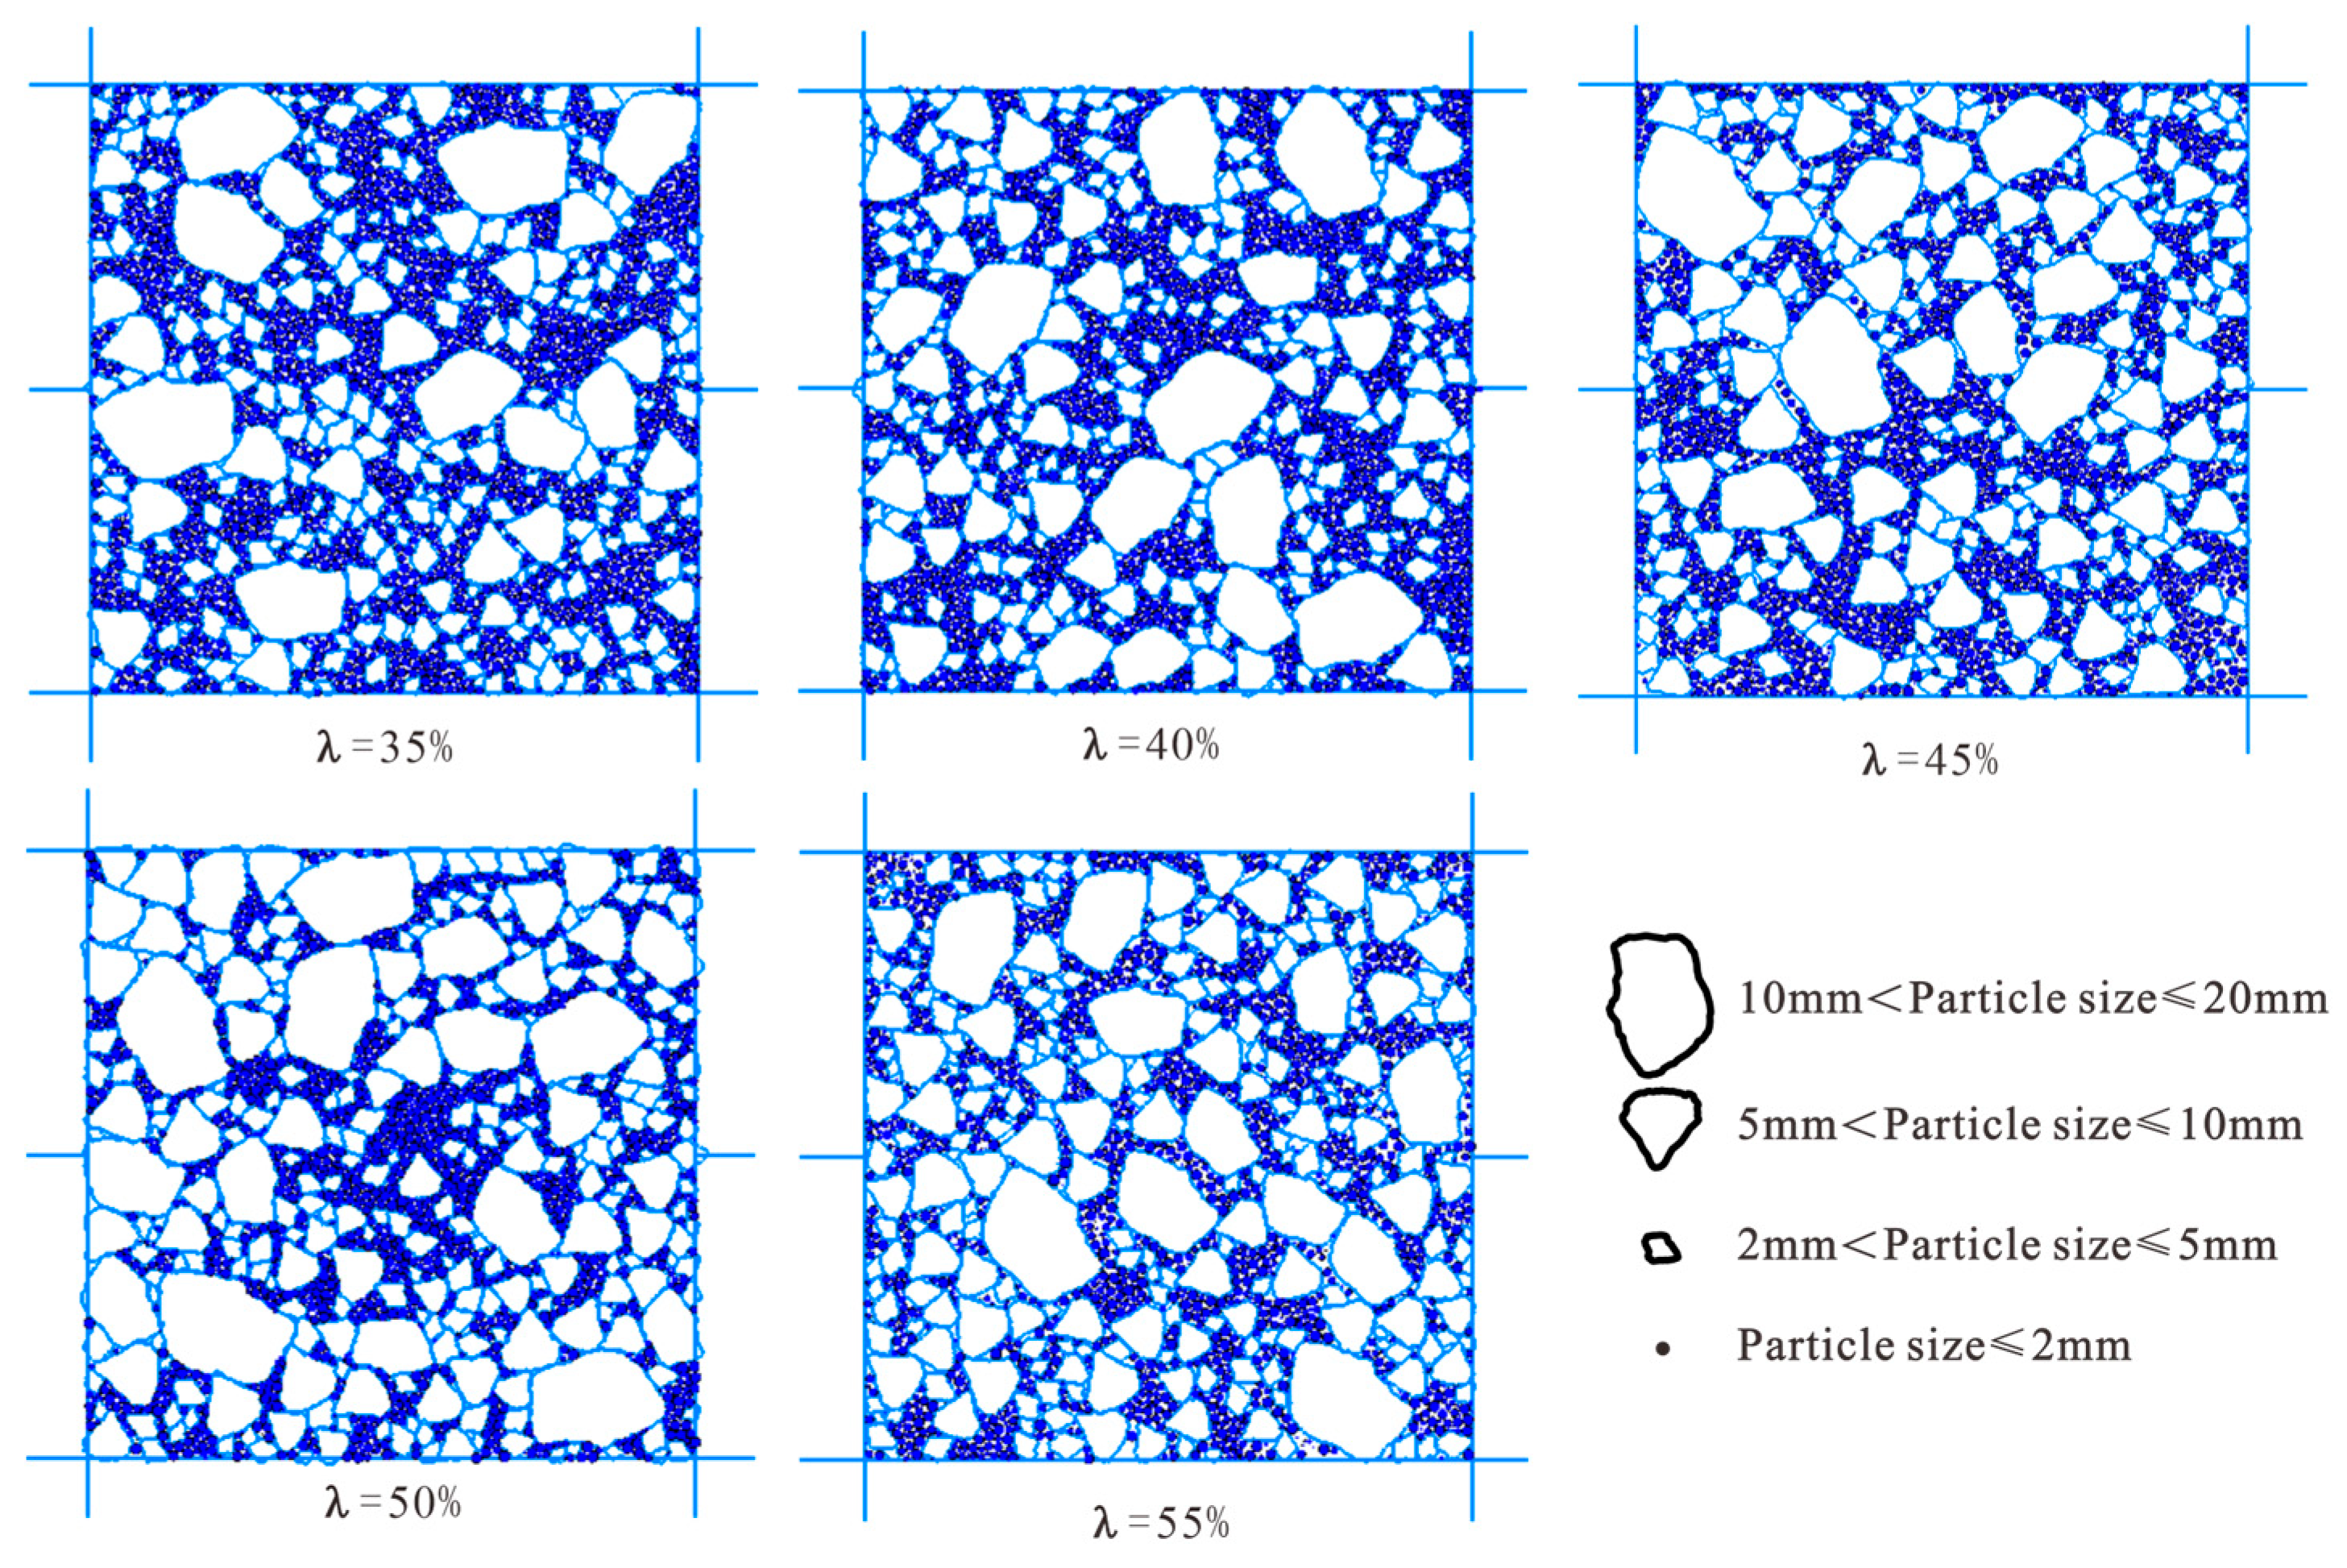
4.1. Modelling

In this simulative study, a numerical model based on the Discrete Element Method (DEM) was constructed, taking into account factors such as macro experimental dimensions, particle size, and shape. The model consists of the shear box, gravel particles, and the bonds between particles. The boundaries of the model are defined using six walls, with the top and bottom boundaries representing the preloading servo, and the left and right boundaries representing the shear servo. A two-dimensional model was used in the simulation, with dimensions set to 200 mm (height) × 200 mm (width) according to the actual dimensions of the direct shear apparatus. In the simulation, gravel particles were scanned from images and imported into PFC software for processing. Normal stress of 1328 kPa was applied using the servo system, and graded shear stresses were applied through the left and right servos. The Burgers model, consisting of elastic, plastic, and viscous elements, was selected as the constitutive model due to its efficacy in simulating instantaneous shear, decay creep, and stable creep behaviors.

4.2. Parameter Calibration

The macro-mechanical behavior of slip zone soil in the simulation is dictated by the particles and their interactions. Nonetheless, the microscopic input properties of the model are frequently challenging to acquire directly. Consequently, these essential microscopic characteristics must be calibrated and established by a methodical trial-and-error approach that integrates physical properties, empirical values, and sensitivity analysis. Specifically, particle density was set to 2240 kg/m3 to match measured natural density; the effective modulus (E∗), was initially estimated from the elastic modulus of creep test curves, scaled by an empirical factor; and the stiffness ratio (kn/ks) was calibrated using an empirical relationship with Poisson’s ratio [41]. Sensitivity analysis identified critical parameters, such as μ, E*, and kn/ks, which were iteratively adjusted based on their influence mechanisms, such as E* controlling elastic modulus slope and μ governing shear strength [42], until the model’s macro-mechanical responses aligned with laboratory test results. This study calibrated the micro parameters of the model components using this method (refer to Table 2). Figure 8 illustrates the numerical simulation models for gravel contents ranging from 35% to 55%. The loading procedure mirrored the laboratory testing, maintaining constant normal tension during each loading phase while applying graded shear stress and documenting shear displacements. Figure 9 illustrates the procedure for creating gravel particles and modeling.

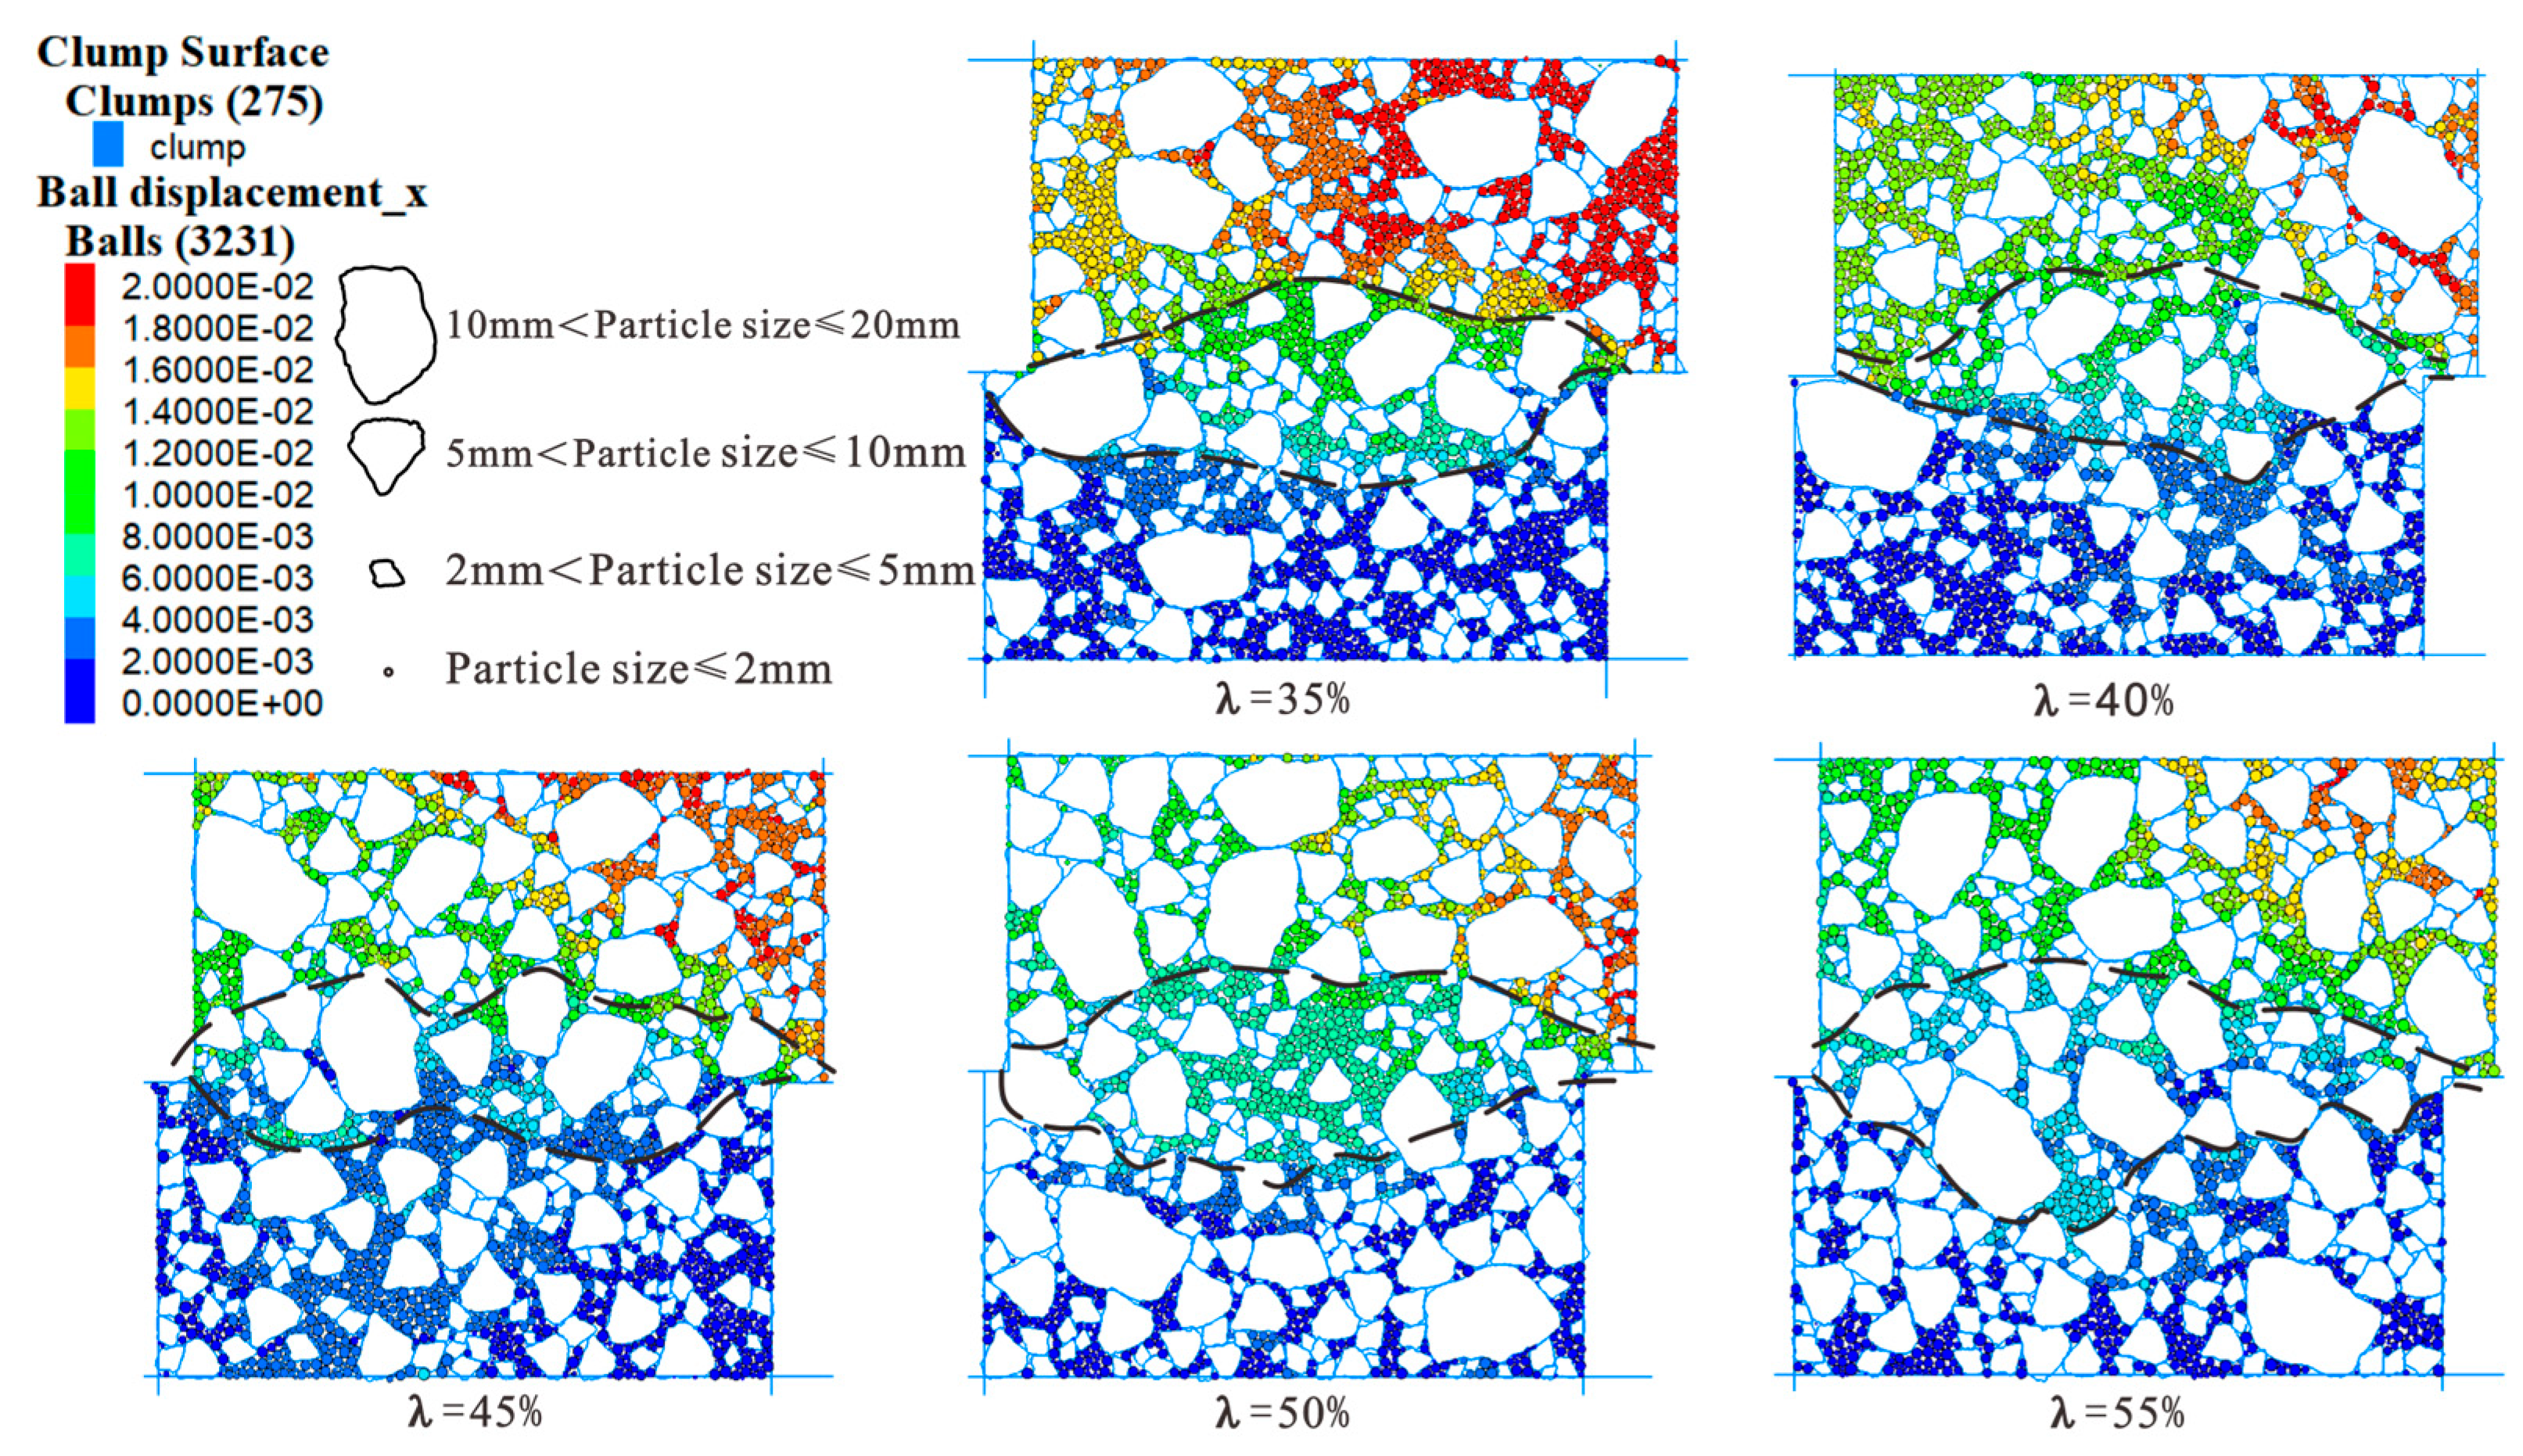
4.3. Simulative Results

Figure 10 depicts the comparison between the direct shear creep test curve and the modeling results for a gravel content of 40%. The numerical simulation (depicted by gray dots) reveals displacements of 5.24 mm, 5.84 mm, 6.51 mm, 6.84 mm, and 9.64 mm across five loading stages, which closely correspond with the laboratory test results (5.3 mm, 5.51 mm, 5.93 mm, 6.61 mm, 9.92 mm), demonstrating a robust association. Thus, discrete element-based numerical simulations can accurately emulate direct shear creep testing for slip zone soil including gravel, providing a deeper insight into the mechanisms via which gravel content affects creep behavior. Considering that the gravel content in the shear zone may affect the sample’s creep behavior during the direct shear test, two random simulations were conducted on samples with identical gravel content to quantitatively assess the impact of gravel distribution in the shear zone on creep behavior. Figure 11 compares the creep displacement curves from two simulations using a 40% gravel concentration. The gravel distribution within the shear zone markedly affects creep displacement, as seen by notable differences in the creep displacement-time curves. Nevertheless, these disparities are quite minor compared to the primary effect of gravel content on creep qualities, indicating that while local gravel distribution affects creep behavior, the overall gravel content is the main factor influencing creep characteristics.
Figure 12 illustrates the x-displacement distribution of slip zone soil and soil-gravel mixture samples at varying gravel contents throughout the simulation testing. The level of displacement is denoted by color variations, with blue signifying lower displacement and red signifying higher displacement. The displacement distribution of slip zone soil samples with varying gravel concentrations is analogous. A comprehensive investigation of the shear zone particles indicates that an increase in gravel content correlates with a progressive rise in the quantity of gravel particles within the shear zone. As the gravel content increases, the influence of large gravel particles on adjacent particles becomes more significant, resulting in an expansion of the disturbed shear zone region, as illustrated in the picture. Larger particle sizes substantially influence adjacent particles. The microscopic study in Figure 12 indicates that with an increase in gravel content, the gravel particles assume a more pivotal role, serving as a framework that enhances the stiffness and strength of the sample. The particles in the bottom shear box are displaced by the applied stresses, and as the gravel content increases, the displacement becomes more significant. The findings demonstrate that the creep characteristics of slip zone soil are intricately linked to the gravel content.

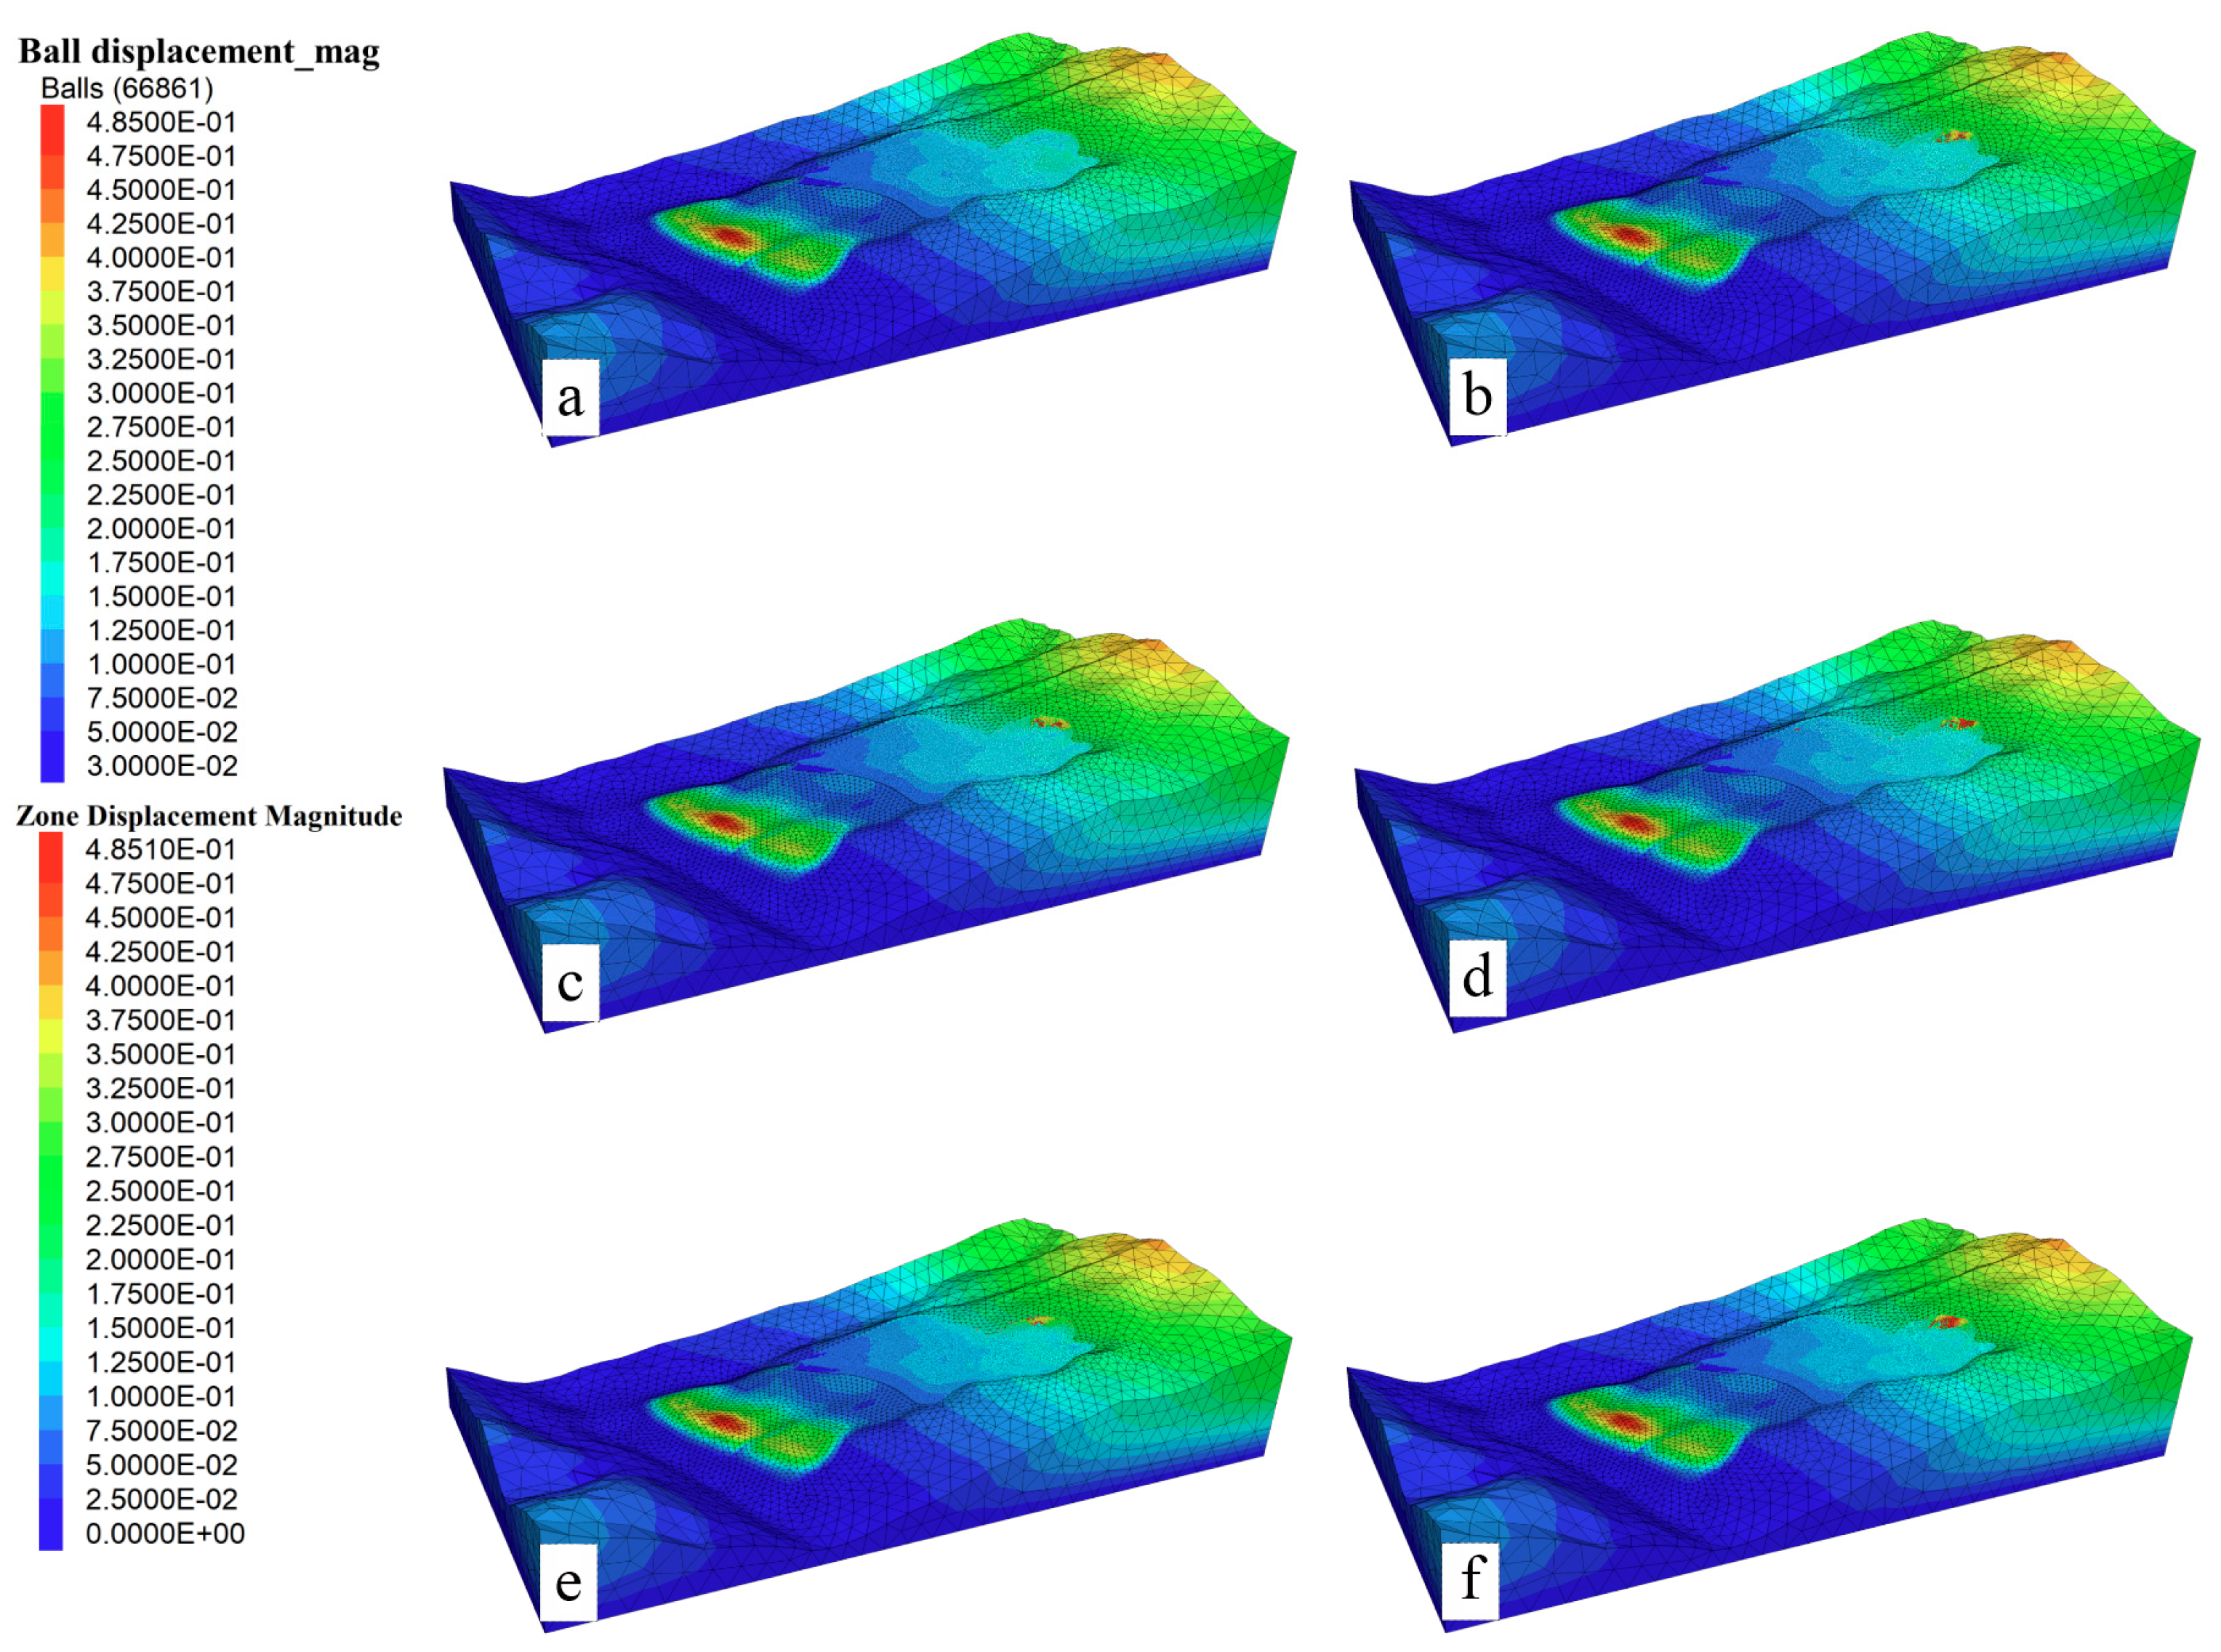
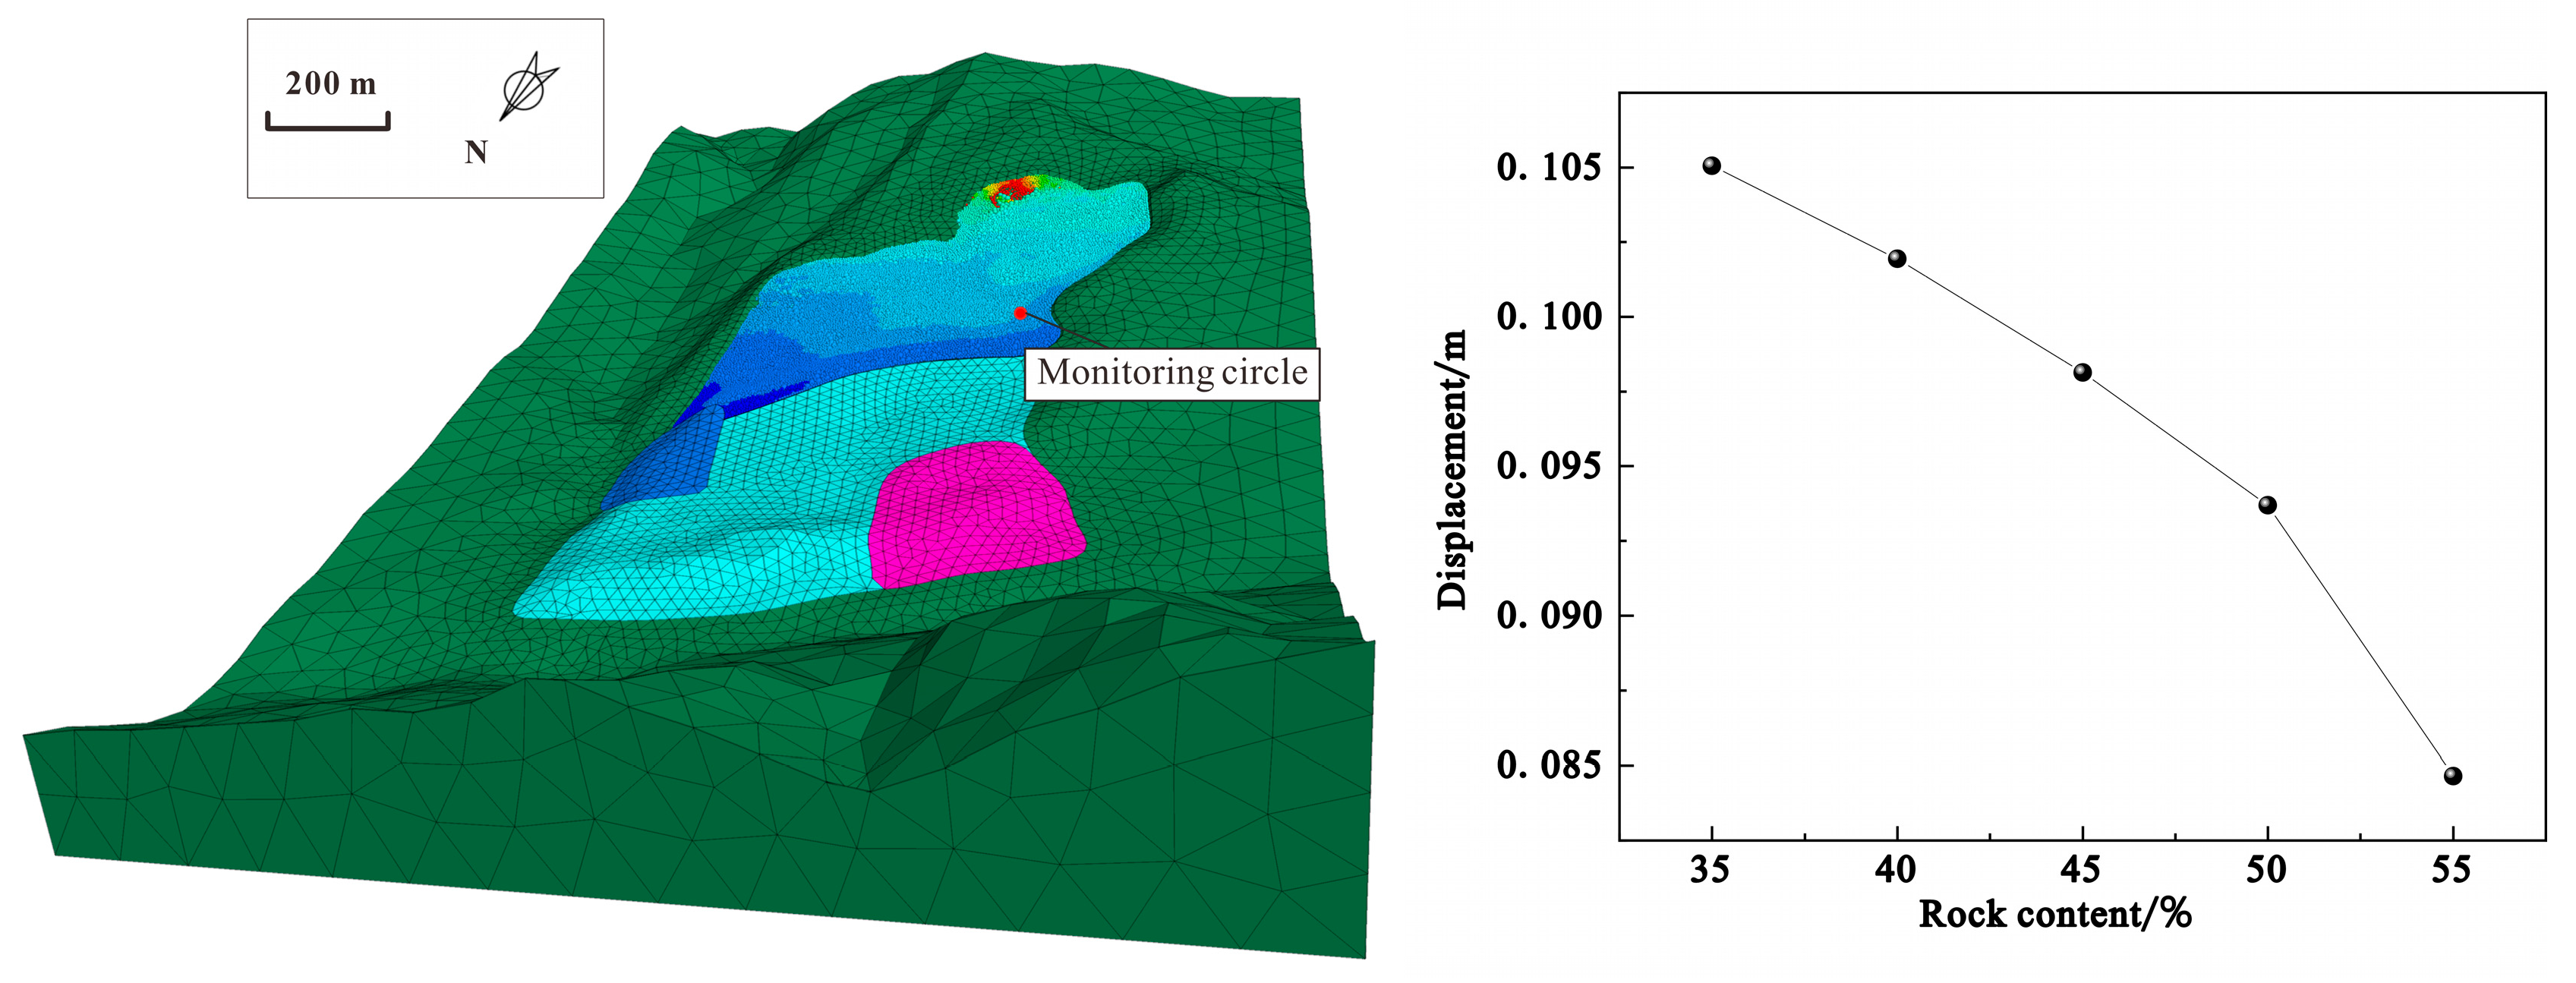
5. Landslide Deforming Characteristics

The deformation characteristics and evolution mechanisms of landslides are intricately linked to the material properties of the sliding zone [43,44]. To assess the influence of gravel content on displacement at the landslide scale, this study further examines the deformation evolution of landslides under varying gravel content conditions. Given the magnitude of the Outang Giant Landslide and constraints in computational performance, a coupling method of discrete and finite elements is employed for modeling and numerical simulation. The secondary slip region of the Outang Landslide, where the sampling points are situated, is designated as the discrete element simulation area, while the sliding bed and sliding mass are represented using finite elements. The modeling process is illustrated in Figure 13.
This study delineates a 3D computational area based on the geological structure of the Outang Landslide, extending from the northern bank of the Yangtze River to the upper boundary of Shizibaoya, with a longitudinal span of approximately 3600 m and a transverse width of around 2000 m, situated at an elevation of roughly 850 m. A three-dimensional finite difference grid model is constructed utilizing FLAC3D software, while PFC3D is employed for the discrete element simulation of the secondary sliding region. To conduct a comprehensive analysis of the deformation progression of the landslide inside the slip zone, the 3D geological model of the landslide is delineated into three components: the finite element sliding body, the discrete element sliding body, and the sliding bedrock. Upon loading the model, iterative computations are employed to equilibrate the ground stress, hence ensuring mechanical stability and the precision and dependability of the simulation outcomes. Specifically, the bedrock, east-west deformation zones, and primary landslide mass in FLAC3D are modeled as linear elastic continua governed by the Mohr-Coulomb failure criterion, with fixed basal and lateral boundaries and free surface deformation under gravitational loading.
Dynamic coupling between the FLAC3D continuous domain and PFC3D discrete domain is established via wall-zone interfaces. At each computational timestep, nodal velocities within the FLAC3D grid are updated under applied loads and transmitted to the endpoints of PFC3D boundary walls, ensuring displacement continuity at the interface. Concurrently, contact forces arising from PFC3D particle interactions are mapped back to the FLAC3D grid as equivalent nodal forces using the principle of virtual work, maintaining stress equilibrium across the coupled boundary. This iterative data exchange, governed by Newton’s second law for discrete particles and the principle of virtual displacements for finite elements, ensures computational consistency between the two domains, enabling a synergistic macro-meso scale analysis of the landslide’s mechanical behavior [45].
Preliminary investigations indicate that the first-level landslide sliding body is divided into 4 layers: loose fill soil (Q4ml), silty clay mixed with rubble (Q4del), block gravel soil (Q4del), and fractured rock body (Q4del); the second-level landslide primarily consists of fractured rock bodies, with a shallow distribution of silty clay mixed with rubble. The mechanical parameters used in the simulation are based on exploration data, as detailed in Table 3.
Figure 14 illustrates the displacement contour maps for the secondary sliding body of the Outang landslide at various gravel contents. The contour maps (a, b, c, d, e, f) depict the control group (no gravel) and gravel contents of 35%, 40%, 45%, 50%, and 55%, respectively. Under changing gravel content conditions, the secondary landslide body exhibits differing degrees of displacement, with the concentrated zones accordingly altering. At reduced gravel concentrations, the displacement is generally more extensive and homogeneous. The maximum displacement of the control group’s secondary sliding mass appears in the middle of the sliding mass (Figure 14a). When the gravel content is 35~45%, the maximum displacement is distributed at the trailing edge of the sliding mass but is relatively scattered, and the displacement range expands with the increase of gravel content (Figure 14b–d). conversely, at elevated gravel concentrations (50%, 55%), the displacement is concentrated in specific areas at the trailing edge of the landslide. Moreover, the displacement range and magnitude at a gravel content of 50% are significantly smaller than those at 45%, which may be due to the role of the gravel skeleton, confirming the critical threshold (45–50%) mentioned earlier.
A displacement monitoring circle was established adjacent to the sampling tunnel, and the displacement data of the circle under varying gravel content conditions is presented (refer to Figure 15). The findings indicate that as gravel content increases, displacement exhibits a consistently decreasing trend, signifying that gravel content significantly influences landslide deformation. This alteration is likely attributable to the rise in gravel content, which bolsters the structural stability within the sliding mass, thereby effectively diminishing the overall displacement.
Additionally, the total displacement of the landslide is analyzed to investigate the influence of gravel content on deformation. Figure 16 distinctly illustrates the displacement boundary characteristics of landslides with varying gravel contents. As gravel content increases, the 0.1-m displacement boundary shifts southward, opposing the direction of the sliding mass. This observation indicates that higher gravel content correlates with reduced displacement of the secondary landslide, thereby significantly enhancing the overall stability of the landslide.
The analysis of contact force distribution under different gravel content conditions (Figure 17) shows a certain regularity. Overall, the contact force distribution within the landslide increases from the surface to the interior, showing a certain consistency. Specifically:
a. At 35% gravel content, the number of contact points reaches 303,480, the highest among all models. However, the internal contact forces are relatively low, indicating that gravity is mainly borne by the soil, with a more uniform distribution of contact forces. Notably, localized force concentrations are observed at the soil-gravel and gravel-gravel interfaces.
b. At 40% gravel content, the number of contact points decreases to 284,149, but the overall contact force increases. At this point, part of the gravity is borne by the block structure, and the contact forces between soil and gravel, as well as between gravel and gravel, are enhanced. Localized stress concentration areas and their peak values mainly occur in the gravel concentration areas.
c. As the gravel content increases to 45%, 50%, and 55%, the number of contact points decreases to 266,724, 247,641, and 268,668, respectively. As gravel content increases, the overall contact force gradually strengthens, with the stress concentration areas mainly in the middle of the model. Notably, at 50% gravel content, gravel shows a significant role in bearing the landslide’s gravity, while at 55% gravel content, the gravel framework becomes the main structure bearing the gravity.
Therefore, the gravel content markedly influences the distribution of contact forces and stress transmission pathways in the landslide, offering crucial evidence for the analysis of landslide deformation mechanisms. The gravel content influences the soil’s structure, strength, and displacement properties, consequently affecting the deformation behavior of landslides. In the engineering practices, gravel content can be quickly obtained through the sieving meth-od, which can be used to optimize numerical model parameters, classify landslide risk zones, and calibrate early warning thresholds.

6. Conclusions

This study examined the influence of gravel content on the creep behavior of slip zone soil from the Outang landslide through large-scale direct shear creep tests. Creep curves with different gravel contents were derived from laboratory trials. A geometric model was subsequently developed based on the characteristic morphology of gravel and experimental parameters. Creep simulations were conducted using the PFC3D platform to investigate the effect of gravel content on the creep behavior of specimens. A linked continuum-discrete numerical model of the secondary landslide body has been developed. Coupled simulations utilizing PFC3D and FLAC3D were conducted to investigate the influence of gravel content on the displacement and deformation characteristics of the Outang landslide. The subsequent conclusions were derived:
(1)
Gravel content has a significant impact on the creep behavior and strength of slip zone soil. Direct shear creep tests showed that increasing gravel content leads to an enhancement in both the peak shear strength and long-term strength of the slip zone soil. Furthermore, the evolution of the creep curve under different shear stress conditions is closely related to the gravel content.
(2)
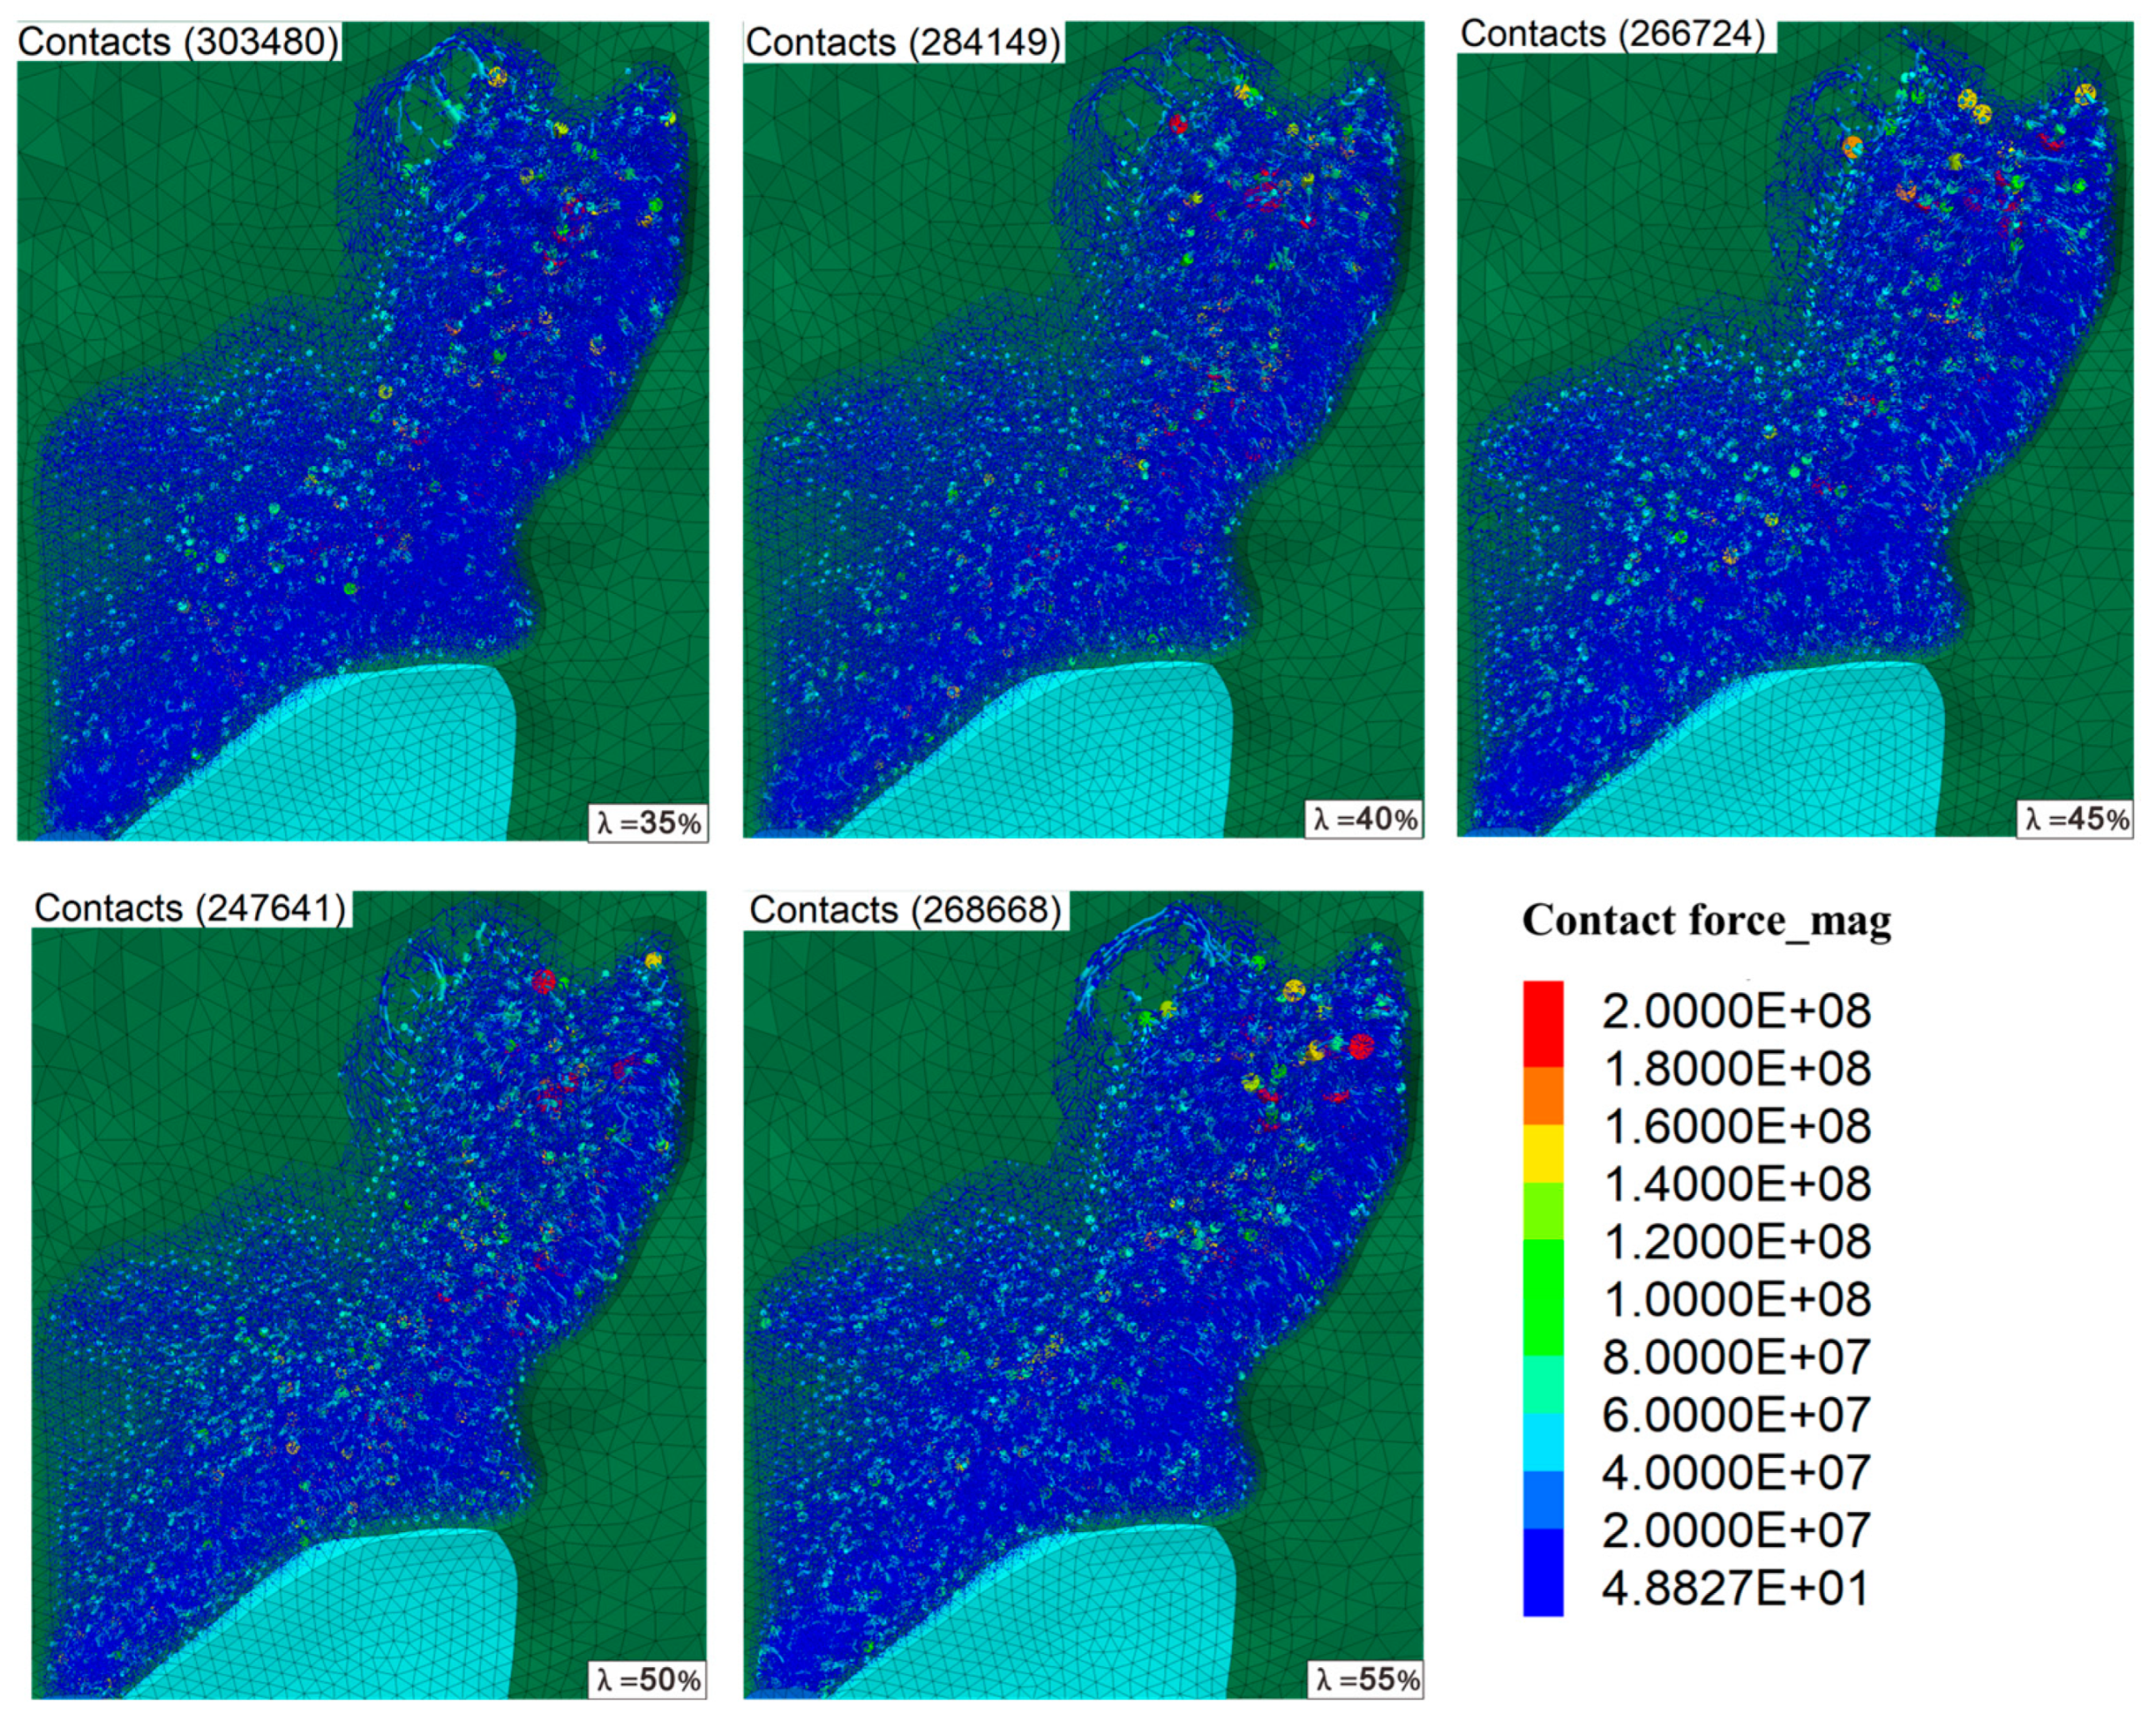
Distribution and role of gravel within the specimen significantly affect its creep characteristics. Although the gravel in the slip zone does influence the creep displacement, the overall difference in gravel content has a more pronounced effect on the creep behavior of the sample. PFC3D simulations revealed that at approximately 50% gravel content, gravel forms a skeletal structure within the specimen, significantly enhancing its stiffness and strength.
(3)
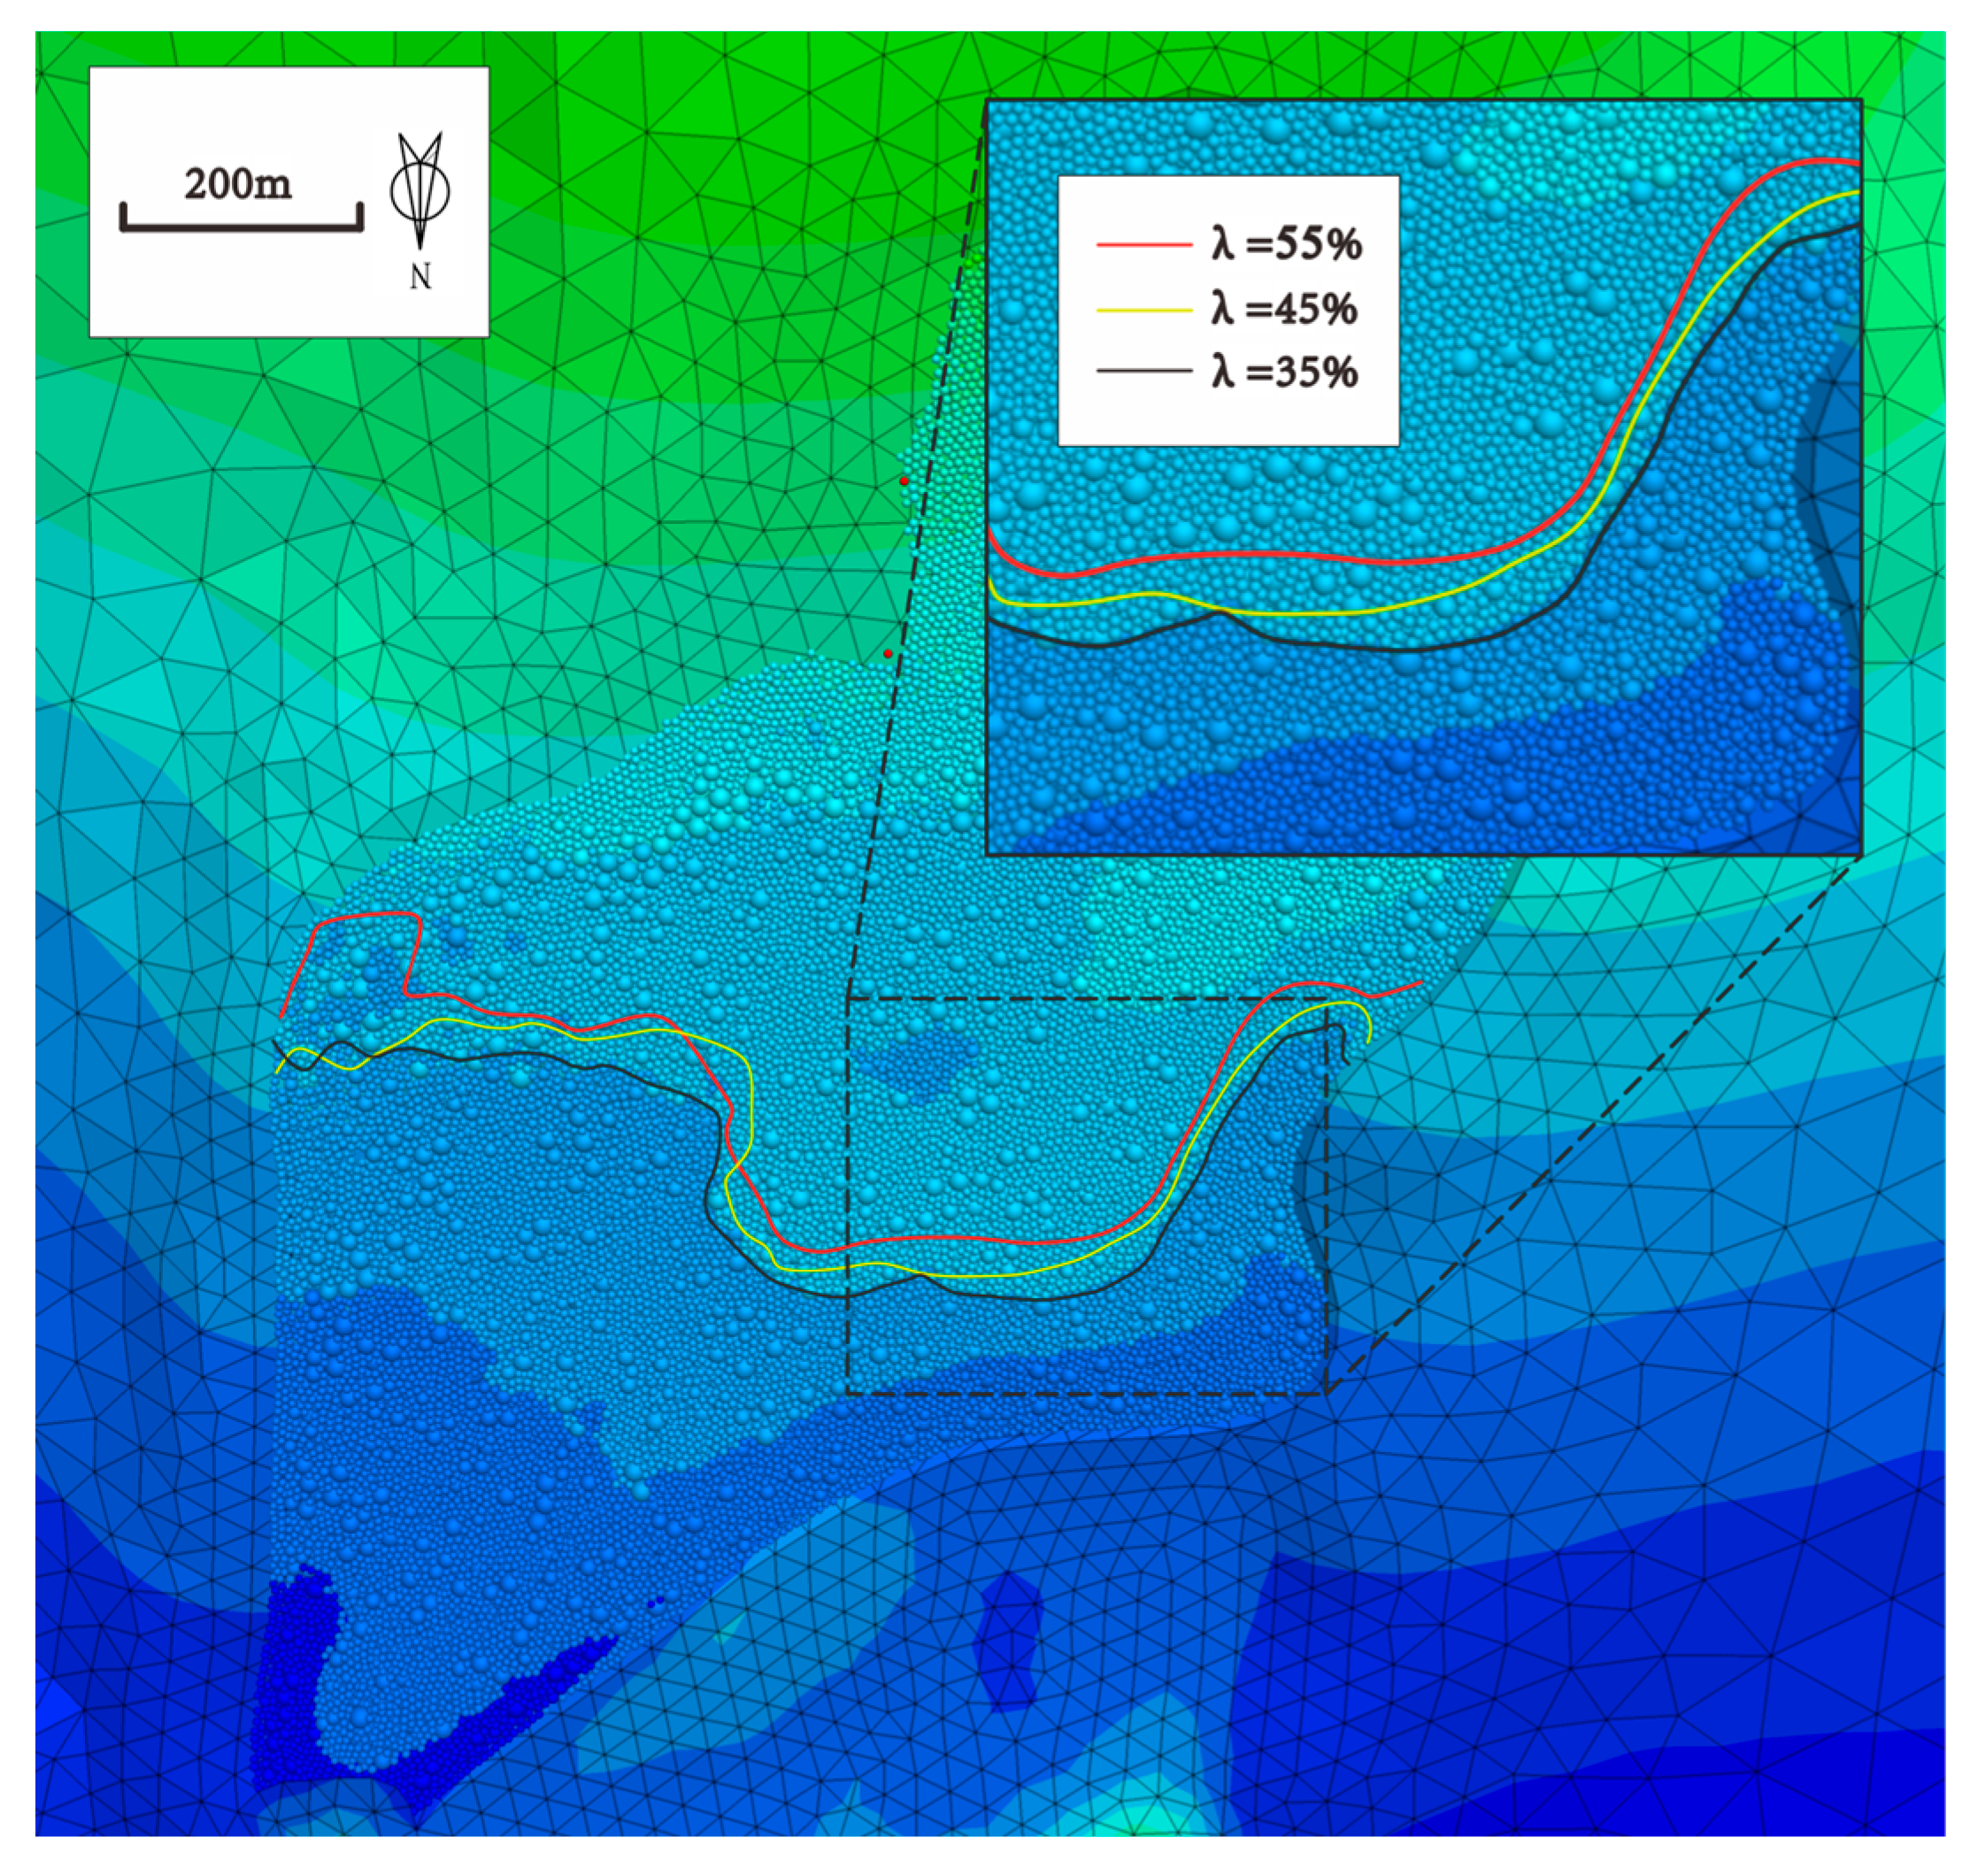
Gravel content significantly influences the displacement characteristics and structural stability of landslides. Coupled PFC3D/FLAC3D simulations showed that the higher the gravel content, the smaller the displacement of the landslide. Under higher gravel content conditions, the structural stability of the landslide body is significantly improved. This study provides a scientific basis for landslide risk assessment and the formulation of prevention measures.

Author Contributions

Conceptualization, Q.T. and B.X.; methodology, B.X.; software, X.Z.; validation, S.D., X.D. and L.Y.; formal analysis, B.P.; investigation, X.Z.; resources, Q.T.; data curation, J.Y.; writing—original draft preparation, B.X.; writing—review and editing, Q.T.; visualization, X.Z.; supervision, S.D.; project administration, B.X.; funding acquisition, B.X. All authors have read and agreed to the published version of the manuscript.

Funding

This research was funded by the China Yangtze Power Co., Ltd. (No. Z152402046) and the Three Gorges Innovation and Development Joint Fund of Hubei Province (No. 2024AFD358).

Data Availability Statement

The data that support the findings of this study are available from the corresponding author upon reasonable request.

Acknowledgments

We would like to express our gratitude to China University of Geosciences for providing necessary scientific research conditions during the course of this research.

Conflicts of Interest

Authors Bo Xu, Jin Yuan, Shun Dong, Xuhuang Du and Longwei Yang were employed by the company China Yangtze Power Co., Ltd. The remaining authors declare that the research was conducted in the absence of any commercial or financial relationships that could be construed as a potential conflict of interest.

References

  1. Fidan, S.; Tanyaş, H.; Akbaş, A.; Lombardo, L.; Petley, D.N.; Görüm, T. Understanding fatal landslides at global scales: A summary of topographic, climatic, and anthropogenic perspectives. Nat. Hazards 2024, 120, 6437–6455. [Google Scholar] [CrossRef]
  2. Yang, L.; Wang, Y.; Liao, C.K. Revealing the characteristics and type of chair-shaped landslides considering the reservoir water effect in the Three Gorges Reservoir Area, China. Bull. Eng. Geol. Environ. 2024, 83, 155. [Google Scholar] [CrossRef]
  3. Li, C.; Fu, Z.; Wang, Y.; Tang, H.; Yan, J.; Gong, W.; Criss, R.E. Susceptibility of reservoir-induced landslides and strategies for increasing the slope stability in the Three Gorges Reservoir Area: Zigui Basin as an example. Eng. Geol. 2019, 261, 10527. [Google Scholar] [CrossRef]
  4. Jian, W.; Xu, Q.; Yang, H.; Wang, F. Mechanism and failure process of Qianjiangping landslide in the Three Gorges Reservoir, China. Environ. Earth Sci. 2014, 72, 2999–3013. [Google Scholar] [CrossRef]
  5. Cui, D.; Chen, Q.; Hu, X.; Dai, M.; Liao, M.; Wang, J. Investigation of the creep characteristics of sliding zone soils of reservoir landslides under reservoir water level fluctuations: A case study of the Huangtupo landslide. Landslides 2025, 22, 1241–1255. [Google Scholar] [CrossRef]
  6. Tang, H.M.; Li, C.D.; Gong, W.P.; Zou, Z.X.; Zhang, Y.Q.; Zhang, S.; Zhang, J.R. Fundamental attribute and research approach of landslide evolution. Earth Sci. 2022, 47, 4596–4608. [Google Scholar]
  7. Li, Z.; Zhang, H. Influence of particle-size distribution on shear characteristics of slip zone soil and its mesoscopic mechanism. Alex. Eng. J. 2023, 67, 375–396. [Google Scholar] [CrossRef]
  8. Lu, S.; Tang, H.; Zhang, Y.; Gong, W.; Wang, L. Effects of the particle-size distribution on the micro and macro behavior of soils: Fractal dimension as an indicator of the spatial variability of a slip zone in a landslide. Bull. Eng. Geol. Environ. 2018, 77, 665–677. [Google Scholar] [CrossRef]
  9. O’Brien, J.; Julien, P. Laboratory analysis of mudflow properties. J. Hydraul. Eng. 1988, 114, 877–887. [Google Scholar] [CrossRef]
  10. Wang, G.; Sassa, K. Factors affecting rainfall-induced flowslides in laboratory flume tests. Geotechnique 2001, 51, 587–599. [Google Scholar] [CrossRef]
  11. Jeong, S. Grain size dependent rheology on the mobility of debris flows. Geosci. J. 2010, 14, 359–369. [Google Scholar] [CrossRef]
  12. Jeong, S.; Locat, J.; Leroueil, S.; Malet, J.P. Rheological properties of fine-grained sediment: The roles of texture and mineralogy. Can. Geotech. J. 2010, 47, 1085–1100. [Google Scholar] [CrossRef]
  13. Hungr, O.; Leroueil, S.; Picarelli, L. The Varnes classification of landslide types, an update. Landslides 2014, 11, 167–194. [Google Scholar] [CrossRef]
  14. Parsons, J.D.; Whipple, K.X.; Simoni, A. Experimental study of the grain-flow, fluid-mud transition in debris flows. J. Geol. 2001, 109, 427–447. [Google Scholar] [CrossRef]
  15. Wen, B.P.; Aydin, A.; Duzgoren-Aydin, N.S.; Li, Y.R.; Chen, H.Y.; Xiao, S.D. Residual strength of slip zones of large landslides in the Three Gorges area, China. Eng. Geol. 2007, 93, 82–98. [Google Scholar] [CrossRef]
  16. Ren, S.S.; Zhang, Y.S.; Xu, N.X.; Wu, R.A. Mesoscopic response mechanism of residual strength and shear surface roughness of gravelly sliding zone soil. Chin. J. Geotech. Eng. 2021, 43, 1473–1482. [Google Scholar]
  17. Ren, S.S.; Zhang, Y.S.; Xu, N.X.; Wu, R.A.; Liu, X.Y. Reactivation initiation strength of gravelly sliding zone soil. Rock Soil Mech. 2021, 42, 863–873. [Google Scholar]
  18. Xu, W.J.; Wang, S. Three-dimensional numerical direct shear test study on meso-mechanics of soil-rock mixtures based on real block morphology. Chin. J. Rock Mech. Eng. 2016, 35, 2152–2160. [Google Scholar]
  19. Li, Z.; Hua, J.; Yin, P.; Zhang, H. Shear failure analysis of slip zone soil with different coarse particle shapes: Visualized shear test and PIV technology. Eng. Fail. Anal. 2024, 162, 108345. [Google Scholar] [CrossRef]
  20. He, Y.; Cui, P.; Liao, C.; Zhang, B.; Zhao, Y. Micromorphology of landslide soil: Case study on the Jibazi landslide in Yunyang in the Three Gorges Region. China J. Mt. Sci. 2006, 3, 147–157. [Google Scholar] [CrossRef]
  21. Gao, W.; Gao, W.; Hu, R.; Xu, P.F.; Xia, J.G. Microtremor survey and stability analysis of a soil-rock mixture landslide: A case study in Baidian town, China. Landslides 2018, 15, 1951–1961. [Google Scholar] [CrossRef]
  22. Iverson, R.M.; Reid, M.E.; Iverson, N.-R.; LaHusen, R.G.; Logan, M.; Mann, J.E.; Brien, D.L. Acute sensitivity of landslide rates to initial soil porosity. Science 2000, 290, 513–516. [Google Scholar] [CrossRef] [PubMed]
  23. Yerro, A.; Alonso, E.-E.; Pinyol, N.-M. Run-out of landslides in brittle soils. Comput. Geotech. 2016, 80, 427–439. [Google Scholar] [CrossRef]
  24. He, Y.; Yu, Z.-P.; Zhang, Z.; Chen, B.; Zhang, K.N. Effects of rainfall on mechanical behaviors of residual-soil landslide. Front. Earth Sci. 2022, 10, 925636. [Google Scholar] [CrossRef]
  25. Liu, F.Y.; Zheng, Q.T.; Wang, J.; Ying, M.J. Effects of particle shape on shear behaviors of interface between coarse-grained soil and geogrid. J. Mater. Civ. Eng. 2021, 43, 48–56. [Google Scholar]
  26. Wu, M.M.; Zhou, F.; Wang, J.F. DEM modeling of mini-triaxial test on soil-rock mixture considering particle shape effect. Comput. Geotech. 2023, 153, 105110. [Google Scholar] [CrossRef]
  27. Yao, Y.S.; Li, J.; Ni, J.J.; Liang, C.H.; Zhang, A.S. Effects of gravel content and shape on shear behaviour of soil-rock mixture: Experiment and DEM modelling. Comput. Geotech. 2022, 141, 104476. [Google Scholar] [CrossRef]
  28. Yang, B.; Yang, J.; Chang, Z.; Gan, H.Y.; Song, E.X. 3-D granular simulation for compressibility of soil-aggregate mixture. Rock Soil Mech. 2010, 31, 645–1650. [Google Scholar]
  29. Li, S.; Wang, Y. Stochastic model and numerical simulation of uniaxial loading test for rock and soil blending by 3D-DEM. Chin. J. Geotech. Eng. 2004, 26, 172–177. [Google Scholar]
  30. Tan, Q.; Huang, M.; Tang, H.; Zou, Z.; Li, C.; Huang, L.; Zhou, X. Insight into the anisotropic deformation of landslide sliding zone soil containing directional cracks based on in situ triaxial creep test and numerical simulation. Eng. Geol. 2022, 311, 106898. [Google Scholar] [CrossRef]
  31. Wang, H.R.; Huang, H.J.; Liu, F.Y.; Zhang, Z.J.; Qu, Y. Model test and numerical analysis of slope rainfall infiltration considering gravel shape. J. Civ. Environ. Eng. 2025, 1–11. [Google Scholar]
  32. Liu, F.Y.; Kong, J.J.; Yao, J.M. Effects of stone content and compaction degree on interface shear characteristics of geogrid-soil-rock mixtures. Chin. J. Geotech. Eng. 2023, 45, 903–911. [Google Scholar]
  33. He, S.J.; Wang, Z.L.; Qu, J.A.; Shen, L.F.; Ding, Z.D. Direct shear creep characteristics and long-term strength experimental study of Kunming peat soil. China Civ. Eng. J. 2019, 52, 16–22. [Google Scholar]
  34. Cui, K.; Su, L. Influence of coarse particle content on shear strength of mixed soil in western Sichuan. J. Southwest Jiaotong Univ. 2019, 54, 778–785. [Google Scholar]
  35. Tang, J.Y.; Xu, D.S.; Liu, H.B. Effect of stone content on shear characteristics of soil-rock mixture. Rock Soil Mech. 2018, 39, 93–102. [Google Scholar]
  36. Xu, W.J.; Hu, R.L.; Tan, R.J.; Zeng, R.Y.; Yu, H.Q. Field experimental study on soil-rock mixture at the right bank of Longpan in Hutiaoxia Gorge. Chin. J. Rock Mech. Eng. 2006, 6, 1270–1277. [Google Scholar]
  37. Xu, W.J.; Hu, R.L.; Tan, R.J. Some geomechanical properties of soil-rock mixtures in the Tiger-Leaping Gorge area, China. Geotechnique 2007, 57, 255–264. [Google Scholar] [CrossRef]
  38. Polito, C.P.; Grossman, J.A.; Eldridge, C.; Krawulski, K.; Reils, W.; Shebel, G. Threshold sand content and the behavior of sandgravel mixtures. In Proceedings of the Geo-Congress, Los Angeles, CA, USA, 9–12 March 2023; pp. 293–301. [Google Scholar]
  39. Liu, C.; Ren, T.Z.; Zhang, R.; Gao, Q.F.; Zheng, J.L. Influence of gradation on resilient modulus of high plasticity soil-gravel mixture. Adv. Civ. Eng. 2020, 1, 8887628. [Google Scholar] [CrossRef]
  40. Jiang, Z.S.; Gou, Z.L. Analysis of the influence of stone content in residual slope soil-gravel mixtures of the Nairobi-Malaba Railway on shear strength. Subgrade Eng. 2020, 1, 49–54. [Google Scholar]
  41. Yoon, J. Application of experimental design and optimization to PFC model calibration in uniaxial compression simulation. Int. J. Rock Mech. Min. Sci. 2007, 44, 871–889. [Google Scholar] [CrossRef]
  42. Carr, M.J.; Roessler, T.; Robinson, P.W.; Otto, H.; Richter, C.; Katterfeld, A.; Wheeler, C.A. Calibration procedure of discrete element method (DEM) parameters for wet and sticky bulk materials. Powder Technol. 2023, 429, 118919. [Google Scholar] [CrossRef]
  43. Tan, Q.; Tang, H.; Fan, L.; Xiong, C.; Fan, Z.; Zhao, M.; Zou, Z. In situ triaxial creep test for investigating deformational properties of gravelly sliding zone soil: Example of the Huangtupo 1# landslide, China. Landslides 2018, 15, 2499–2508. [Google Scholar]
  44. Tang, H.; Wasowski, J.; Juang, C.H. Geohazards in the Three Gorges Reservoir Area, China–lessons learned from decades of research. Eng. Geol. 2019, 261, 105267. [Google Scholar] [CrossRef]
  45. Li, D.D.; Hu, H.R.; Xiao, M. Tunnel excavation and bolt support particle flow model based on PFC-FLAC discretecontinuous coupling analysis. Eng. J. Wuhan Univ. 2024, 57, 286–294. [Google Scholar]
Figure 1. Location of the Outang landslide and the A-A’ profile.
Water 17 01726 g001
Figure 2. Original and test gradation of the slip zone soil.
Water 17 01726 g002
Figure 3. Procedures for creep shear tests.
Water 17 01726 g003
Figure 4. Creep curves of slip zone soil under different gravel contents.
Water 17 01726 g004
Figure 5. The displacement-shear force curves of slip-zone soils with different rock contents.
Water 17 01726 g005
Figure 6. Stress-strain isochronous curves of slip zone soils with different gravel contents (λ). (a) λ = 0.40; (b) λ = 0.45; (c) λ = 0.50; (d) λ = 0.55.
Water 17 01726 g006
Figure 7. Relationship between long-term strength, peak strength, and gravel content for the slip zone soil.
Water 17 01726 g007
Figure 8. Numerical models with different gravel contents (white particles represent rigid gravels).
Water 17 01726 g008
Figure 9. Gravel particle generation and modeling process.
Water 17 01726 g009
Figure 10. Comparison of the laboratory shear creep test and numerical simulation results at 40% gravel content.
Water 17 01726 g010
Figure 11. Comparison of creep displacement curves from two simulations using a 40% gravel concentration.
Water 17 01726 g011
Figure 12. Patterns and amount of displacement and shear zone disturbances in samples with varying gravel contents during the simulation testing.
Water 17 01726 g012
Figure 13. PFC-FLAC Coupling Modeling Process: (a). Grid division, (b). Numerical model after secondary landslide removal, (c). Coupled model with discrete elements replacing the secondary landslide.
Water 17 01726 g013
Figure 14. Displacement contours of outang landslide secondary body under different gravel contents. (a). Control group; (b). λ = 35%; (c). λ = 40%; (d). λ = 45%; (e). λ = 50%; (f). λ = 55%.
Water 17 01726 g014
Figure 15. Monitoring circle (left) and displacement under different gravel contents (right) for the secondary Outang landslide.
Water 17 01726 g015
Figure 16. Displacement boundaries at 0.1 m for Outang landslide’s secondary body under graded gravel.
Water 17 01726 g016
Figure 17. Contact force distribution of the second-level landslide mass under graded gravel contents.
Water 17 01726 g017
Table 1. Creep behavior stages and deformation characteristics under varying gravel contents.
Gravel Content (%)Primary Stage Strain (%)Secondary Stage Strain (%)Tertiary Stage Strain (%)Creep Beheavior
1st Loading2nd–4th Loading5th Loading
355.696.237.187.5513.98Large initial strain; small increments during decay stage; rapid transition to accelerated creep at the 5th load level
405.305.515.936.6113.95Slightly reduced initial strain; slow increase in increments during decay stage; accelerated failure at the 5th load level
452.452.743.225.0310.60Significantly decreased initial strain; increasing increments during decay stage; accelerated failure at the 5th load level
--2nd–5th loading--
501.321.732.282.794.67NoneSmall initial strain; smooth transition between decay and constant velocity stages; no accelerated failure
551.051.371.732.643.86NoneMinuscule initial strain; gentle creep process without acceleration
Table 2. Simulative parameters of particles and the shear test.
ParameterValue
Particle parameters
Density (kg/m3)2240
Effective modulus (E*/Gpa)0.2
Normal - Shear stiffness ratio (kn/ks)1.5
Friction coefficient μ0.5
Test parameters
Effective modulus (E*/Gpa)0.2
Normal - Shear stiffness ratio (kn/ks)1.5
Normal stress (kPa)1328
Shear stress (kPa)Graded loading
Table 3. Physical parameters for numerical simulation.
Simulated MaterialUnit Weight (kN/m3)Cohesion (kPa)Friction Angle (°)Elastic Modulus (MPa)Poisson’s Ratio
Bedrock26.7830041.71.88×1040.19
First-level landslide20.12820.52000.15
Second-level landslide21.835.126.4200
East deformation zone20.445.915.6200
Western deformation zone20.445.915.6200
Disclaimer/Publisher’s Note: The statements, opinions and data contained in all publications are solely those of the individual author(s) and contributor(s) and not of MDPI and/or the editor(s). MDPI and/or the editor(s) disclaim responsibility for any injury to people or property resulting from any ideas, methods, instructions or products referred to in the content.

