Article

Synergistic Ozone-Ultrasonication Pretreatment for Enhanced Algal Bioresource Recovery: Optimization and Detoxification

1
School of Environmental Science and Engineering, Suzhou University of Science and Technology, Suzhou 215009, China
2
Jiangsu Province Engineering Research Center of Water Resilient Cities, Suzhou 215009, China
*
Author to whom correspondence should be addressed.
Water 2025, 17(11), 1614; https://doi.org/10.3390/w17111614
Submission received: 3 April 2025 / Revised: 21 May 2025 / Accepted: 22 May 2025 / Published: 26 May 2025
(This article belongs to the Special Issue Microalgae Control and Utilization: Challenges and Perspectives)

Abstract

:
Although algae possess a high capacity for carbon sequestration, the recalcitrant multilayered cell wall structure and residual microcystin toxicity associated with Microcystis aeruginosa significantly hinder the efficient recovery of algal biomass resources. This study developed a synergistic ozone-ultrasonication (O3-US) pretreatment strategy, systematically comparing its cell-disruption efficacy with standalone O3 or US, using harvested algal biomass from natural aquatic systems dominated by Microcystis aeruginosa. The synergistic effects revealed were: (1) O3-mediated oxidation of extracellular polymeric substances and cell wall matrices, (2) the release of ultrasound-induced cavitation-enhancing intracellular components, and (3) an improvement in the O3 mass transfer by hydrodynamic shear forces. Through response surface methodology optimization, the O3-US process achieved maximal performance at 0.14 gO3/gTSS, with a 4 W/mL ultrasonic intensity, and a 20 min duration. Remarkably, the released protein was 289.2 mg/gTSS, which was 4.3-fold and 1.9-fold, respectively, more than that released in O3 pretreatment and US pretreatment, while the polysaccharide was 87.5 mg/gTSS, increased by 2.4-fold and 3.1-fold respectively, compared to O3 alone and US alone. The released solubilized chemical oxygen demand (SCOD) was 1037.1 mg/gTSS, increased by 43.3% and 216.1%, respectively, relative to O3 alone and US alone. DNA quantification further validated the synergistic cell disruption caused by O3-US. Fluorescence excitation-emission matrix (EEM) spectroscopy identified biodegradable aromatic proteins (Regions I-II) and soluble microbial byproducts (Region IV) as dominant organic fractions, demonstrating enhanced bioavailability. The hybrid process reduced energy consumption by 33.3% in ultrasonic intensity and 60% in duration versus US alone, while achieving 94.5% microcystin-LR (MC-LR) degradation, which showed a 96.6% risk reduction compared to ultrasonic treatment. This work establishes an efficient, low-energy, and safe pretreatment technology for algal resource recovery, synergistically enhancing intracellular resource release while mitigating cyanotoxin hazards in algal biomass valorization.

Graphical Abstract

1. Introduction

Algae have emerged as a pivotal bioresource for the sustainable production of high-value compounds, including biofuels, proteins, polyunsaturated fatty acids, and bioactive pigments, owing to their rapid growth rates and carbon-neutral lifecycle [1]. However, the recalcitrant multilayered cell walls of algae, composed of cellulose, hemicellulose, peptidoglycan (in the case of cyanobacteria), and glycoproteins, act as barriers to intracellular component extraction, necessitating efficient cell-disruption technology as the critical first step in downstream valorization processes [2].
Physical and chemical treatments, such as thermal treatments [3], ultrasonication [4], high-pressure homogenization treatments [5], acid/alkaline treatments [6,7], and chemical oxidation [8], are typically employed to release intracellular biomass. Unlike thermal treatments, which compromise product quality [9], ultrasonication achieves efficient cell disruption via cavitation effects without significantly raising the bulk temperature. In contrast to acid/alkaline treatments that rely on harsh chemicals [10], ultrasonic processing eliminates secondary pollution risks. Notably, ultrasonication has garnered substantial research interest due to its chemical-free operation and ability to generate localized high-pressure zones that effectively cause ruptures of Microcystis (Cyanobacteria) cell structures. Additionally, unlike high-pressure homogenization, ultrasonication produces in situ hydroxyl radicals (•OH), thereby improving subsequent ozone oxidation efficiency [11]. This technique establishes a unique reaction environment unattainable under conventional conditions [12]. Passos et al. [13] demonstrated that ultrasonic pretreatment of filamentous alga Hydrodictyon reticulatum, a Chlorophyta (eukaryotic alga), increased soluble chemical oxygen demand (COD) from 250 mg/L to 1000 mg/L at an energy input of 2500 J/mL. However, ultrasonic treatment has been demonstrated to be highly energy consuming and relatively ineffective for Chlorella pyrenoidosa (C.pyrenoidosa) and some other algae. An ultrasonic treatment at 35 kHz and 0.043 W/mL for 60 s only achieved a 7.9% cell disruption rate in C.pyrenoidosa [14]. To address these limitations, emerging hybrid strategies combine ultrasonication with chemical treatments to synergistically enhance disruption efficiency. This dual approach utilizes chemical agents for cell wall permeabilization while applying an ultrasound for precise mechanical disruption, optimizing both energy efficiency and product recovery. In lipid extraction, Hui et al. [15] demonstrated this synergy, achieving a 25.05 ± 0.92% crude lipid yield using ultrasound-assisted ethanol-2-MeTHF extraction. Similarly, our prior work [16] obtained a 360.42 mg/gTSS protein release from C. pyrenoidosa through ultrasonic-alkaline treatment. The hybrid strategy also shows promise in microbial control, as evidenced by Ren et al. [9], where ultrasound-enhanced slightly acidic electrolyzed water (SAEW) penetration significantly improved Listeria monocytogenes biofilm eradication through synergistic cavitation effects.
Ozone oxidation has gained prominence as an effective strategy for algal biomass valorization. Leveraging its well-established application in water treatment, ozone disrupts cellular integrity through three primary mechanisms: (1) enhancing membrane permeability, (2) promoting intracellular component release, and (3) degrading refractory organics [17]. Studies by Cardena et al. [18] and Pranowo et al. [19] corroborate its efficacy, demonstrating improved cell disruption, methane yield, and organic-matter mineralization. Moreover, ozone’s dual function—cyanotoxin degradation (e.g., microcystin-LR) and enhanced carbon assimilation—renders it a versatile solution for algal treatment [20,21,22]. However, its practical adoption faces challenges, including slow kinetics and limited intracellular penetration due to mass transfer constraints [23]. Overcoming these barriers, particularly in achieving simultaneous cell disruption and detoxification, remains a critical research priority [24].
The integration of ultrasonication with ozone (O3-US) offers a transformative synergy. Ultrasonic cavitation generates localized microjets and shockwaves (>100 MPa) that physically disrupt cell membranes while enhancing ozone mass transfer via microbubble dispersion [25]. Concurrently, ozone pretreatment oxidizes EPS layers and selectively cleaves unsaturated bonds in cell wall polymers, exposing structural vulnerabilities for targeted ultrasonic attack [26]. This combination has demonstrated efficacy in sludge disruption: for example, a 54% reduction in excess sludge production in the SBR system [27]. When applied to microalgal (in particular, Cyanobacteria) systems, O3-US not only enhances soluble organic release, but also neutralizes MC-LR through hydroxyl radical pathways, addressing bioavailability and biosafety challenges [28]. For instance, O3-US achieved 100% inactivation of M. aeruginosa in 20 min [29]. The recovery rate of lipids and carbohydrates from mixed algal consortia reached 59% and 81% of the total lipids and carbohydrates, respectively [30]. Though these studies have shown promising results of O3-US, reactivity and consequent optimal conditions toward species with different cell structures and physiological characteristics needs to be determined for in specific applications.
In freshwater ecosystems, excessive algal proliferation, particularly cyanobacterial blooms dominated by toxin-producing species like M. aeruginosa, not only poses severe environmental and public health risks, but also affects the reutilization process. For example, algal biomass harvested from Taihu Lake, China’s third-largest freshwater lake, is typically subjected to harvest followed by energy-intensive disposal methods (e.g., incineration, landfilling) or reutilization [31]. However, microcystin-LR (MC-LR) poses a potential risk for reutilization of such kinds of waste [32]. These practices incur high economic and carbon costs while failing to degrade intracellular MC-LR, which persist through conventional treatments and limit downstream utilization [33].
This study systematically investigates the feasibility of O3-US treatment for enhancing resource recovery from Microcystis aeruginosa-dominated algal blooms. The integrated O3-US pretreatment strategy synergistically combines chemical oxidation and physical disruption to overcome limitations of standalone technologies. This approach achieves: (1) enhanced microalgal cell wall disruption, (2) controlled release of intracellular organics, and (3) innovative toxin degradation—advancing beyond conventional pretreatment’s narrow focus on resource recovery to incorporate critical biosafety functions. Specifically addressing Microcystis aeruginosa recovery challenges, we developed an energy-efficient, safe, and economically viable protocol for natural bloom remediation, establishing a sustainable pathway for algal resource utilization that balances processing efficiency with environmental safety.

2. Materials and Methods

2.1. Materials and Reagents

The algal consortium used in this study, collected from Taihu Lake in Suzhou, Jiangsu Province, China, was authenticated by the Institute of Hydrobiology at the Chinese Academy of Sciences as a mixed community dominated by Microcystis aeruginosa (M. aeruginosa), comprising 91% of the total biomass. The algae were concentrated by 200—mesh sieve filtration and subsequently stored at 4 °C. The main physicochemical properties of the algae concentrates are shown in Table 1. Concentrated algae were diluted to 10.0 gTSS/L with ultrapure water before performing the experiments. This resulting mixture was referred to as the algae suspension.
Unless otherwise stated, all chemicals used were of analytical grade and purchased from Sinopharm Chemical Reagent Co., Ltd., Shanghai, China, without additional purification. Solutions were prepared with ultrapure water.

2.2. Experiments

Using an algae suspension without any treatment as the control group, ultrasonication (US), ozonation (O3), and ozonation-ultrasonication hybrid (O3-US) treatments were conducted to evaluate the cell disruption performance. An ultrasonic processor with a frequency of 20 kHz (Scientz-IID, Ningbo Scientz Biotechnology Co., Ltd., Ningbo, China) and an ozone generator (COM-AD-02, Anseros, Anshan, China) were used to supply ultrasonic treatments and ozone, respectively. For the US treatments, the ultrasonic processor power levels were set at 200 W, 400 W, and 600 W, with programmable on/off cycles (at 2 s intervals). A 100 mL algae suspension in a beaker in a water bath, to keep temperature constant, underwent US at 4 min, 10 min, 20 min, 40 min, 60 min, and 100 min through the working cycle, generating effective ultrasonic times of 2 min, 5 min, 10 min, 20 min, 30 min, and 50 min, respectively.
Ozonation was performed with an ozone generator. Generated ozone was dispersed into a 100 mL reaction bottle containing an algae suspension with a sand core. During the reaction, the aeration flow rate was kept at 0.5 L/min. The ozone dose was obtained at the reaction durations of 2 min, 5 min, 7 min, 10 min, 15 min, 20 min, and 30 min. The ozone concentration in the algal suspension was monitored by the iodometric method [34]. Immediately following each treatment, samples were taken to test proteins, polysaccharides, microcystin-LR (MC-LR), soluble chemical oxygen demand (SCOD), Excitation-Emission Matrix Fluorescence Spectroscopy (EEMs), and DNA. Additionally, samples were prepared for subsequent drying procedures.
For O3-US, the samples after ozonation with an ozone dose of 0.14 gO3/gTSS were immediately subjected to ultrasonication to investigate the combined effect of ozone and ultrasound on algal cell disruption. The power density and reaction time used were the same with the US process.
In order to determine the effect of various operating parameters such as the ozone dose, ultrasound intensity, and ultrasound duration on the intracellular matters release, a Box-Behnken design with three factors and three levels was used to design a second-order polynomial model between the response variables and the process parameters and to optimize the optimum condition. Ultrasonic time (A = X1, min), Sound intensity (B = X2, W/mL), and Ozone dose (C = X3, g/gTSS) were the controllable process parameters (independent variables) studied, while DDSCOD was chosen as the response variables. The coded and actual levels of the process parameters used in the experiment are given in Table 2.
The quadratic response surface model fitted Equation (1):
Y = β 0 + i = 1 k β i X i + i = 1 k β i i X i i + i = 1 k j = i + 1 k β i j X i j
where Y is the response; X1, X2, …, Xk are the process parameters; β0 is the model constant coefficient; βi is the linear coefficient; βii is the quadratic coefficient; βij is the interaction coefficient of variables i and j; and k is equal to the number of the tested factors.
Additionally, Analysis of Variance (ANOVA) was performed to evaluate the adjustment of the model with regard to the regression coefficients, the p-values of the regressions, and the lack of fit. Optimum conditions were established using RSM through three-dimensional graphs of the responses. Further, the optimal conditions were validated and confirmed.

2.3. Analytical Methods

2.3.1. Fluorescence EEMs Spectra

Analysis of dissolved organic matter components used Excitation-Emission Matrix Fluorescence Spectroscopy (EEMs) [35]. After cell disruption, the samples were first pretreated by centrifugation (11,000 rpm, 10 min) following a 0.22 μm membrane filtration to remove excess impurities (algal debris). Then, to avoid internal filtration effects during EEMs testing, all samples were diluted equally, to a sufficient degree (50 times dilution) to ensure that the absorbance at 254 nm of the sample to be tested was <0.3 [16]. The excitation and emission wavelengths were in ranges of 200 nm~400 nm and 250 nm~500 nm, respectively, with f 2- nm intervals.

2.3.2. Scanning Electron Microscopy

Changes in the structure of algal cells after cell disruption by different pretreatments were detected by scanning electron microscopy (SEM). The samples were centrifuged at 5000 rpm for 10 min, and the resulting precipitates were washed with 0.1 M phosphate buffered saline (pH 6.8) after pouring out the supernatant. They were then fixed in 2.5% glutaraldehyde at 4 °C overnight. The precipitate was again washed several times with a phosphate buffer and subsequently dehydrated with a gradient of 30%, 50%, 70%, 80%, 90%, 95% and 100% ethanol. The dehydrated samples were dried overnight in a vacuum-freeze dryer. The dried samples were gold-coated by cathodic spraying. Finally, the samples were observed and photographed under a scanning electron microscope.

2.3.3. Other Analysis Methods

Relevant water quality indicators in this experiment, total solids (TS), total suspended solids (TSS), and volatile suspended solids (VSS), were measured according to the gravimetric analysis specified in Standard Methods for the Examination of Water and Wastewater (SMWW) [36]. The pH value was measured using a portable pH meter (PHBJ-260 F, Shanghai Leici Co., Ltd., Shanghai, China). Two forms of COD, TCOD, and SCOD (after filtration through 0.45 μm) were determined by the semi-automated colorimetric method at 600 nm with a Cary 60 spectrophotometer (Agilent Technologies Inc., Santa Clara, CA, USA). The released protein and polysaccharides were determined by the Bradford method [37] and Anthron method [38]. Released DNA was analyzed by the diphenylamine method [39]. The degree of algal cell disruption was calculated by the following Equation (2):
D D S C O D % = S C O D t S C O D 0 T C O D S C O D 0 × 100 %
where SCODt is the SCOD concentration of algal suspension at time t (mg/L), SCOD0 is the SCOD concentration of the initial algal suspension (mg/L), and TCOD is the total COD concentration of the initial algal suspension (mg/L).
Ozone concentration was determined by the iodometric method [34] and calculated by Equation (3). The determined ozone doses were 0.028 gO3/gTSS, 0.07 gO3/gTSS, 0.098 gO3/gTSS, 0.14 gO3/gTSS, 0.21 gO3/gTSS, 0.28 gO3/gTSS, and 0.42 gO3/gTSS respectively.
d O 3 = Q g × t × C O 3 1000 × V × T S S
where dO3 is the ozone dose (g/gTSS), Qg is the ventilation flow (L/min), t is the reaction time (min), CO3 is the ozone concentration in the algal suspension at time t (g/m3), V is the volume of algae suspension (L), and TSS is the total suspended solid in the algae suspension (g/L).
MC-LR concentration was determined by a time-resolved fluorescence immunoassay (TRFIA) using an enzyme immunoassay (ELISA) kit developed by the Institute of Hydrobiology at the Chinese Academy of Sciences in Wuhan, China [40]. This method is recommended by the National Standard of the People’s Republic of China GB/T 20466-2006.
In this study, all experiments were conducted in triplicate with data presented as mean values. Response Surface Methodology (RSM) analysis was performed using Design Expert 13 software (Stat-Ease, Inc., Minneapolis, MN, USA), with model adequacy verified through ANOVA including Fisher’s F-test and lack-of-fit. First-order kinetic models for protein and SCOD release were fitted using nonlinear regression analysis in OriginPro 2024 (OriginLab Corporation, Northampton, MA, USA). Error bars in graphical representations indicate standard deviation intervals based on triplicate measurements.

3. Result and Discussion

3.1. Study of Solubilization of Algal Polymers with Different Pretreatment

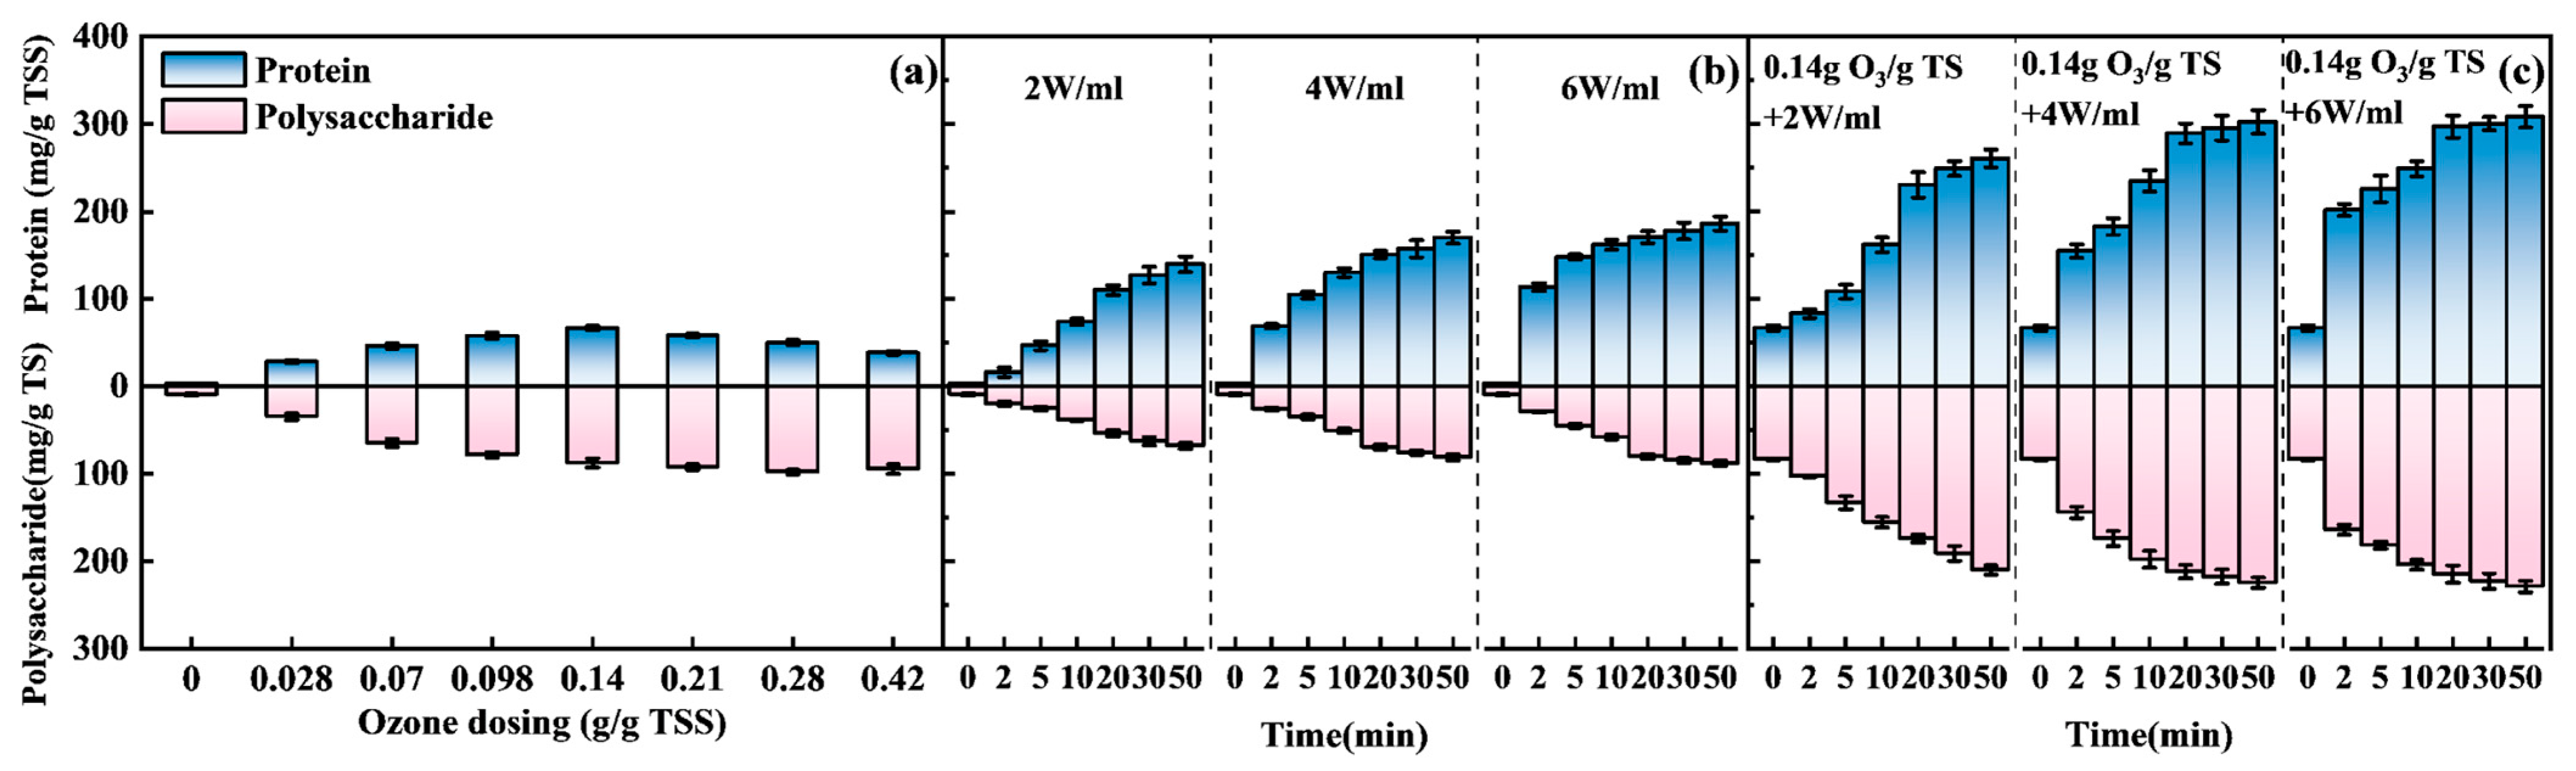
3.1.1. Release Properties of Proteins and Polysaccharides

Proteins and polysaccharides constitute two fundamental components of algal organic matter, predominantly distributed within algal extracellular polymers (EPS) and the interior of the cells; so, released proteins and polysaccharides can be used as an important indicator of algae cell disruption.
Ozonation pretreatment exhibited a bell-shaped dose-response relationship for protein and polysaccharide release, characterized by a critical optimal dose (0.14 gO3/gTSS) that maximized intracellular substance release while minimizing subsequent oxidation losses (Figure 1a). At this optimal dose, ozonation released 66.6 mg/gTSS of protein (a 21.5-fold increase over the control group) and 87.5 mg/gTSS of polysaccharide (a 9.6-fold increase over the control group), reflecting an efficient disruption of the EPS and cell wall structures. The bell-shape release is attributed to the release of intracellular polymer substances (IPS) by attacking the cell itself and the subsequent oxidation of the released IPS. Besides, the activity of protein is higher than that of polysaccharides toward ozone, resulting in a significantly faster oxidation rate, which is also demonstrated in the literature [41].
Ultrasonication (US) pretreatment significantly increased the release of both proteins and polysaccharides from algal suspensions over time, gradually reaching a plateau at all settings of ultrasonic intensity (Figure 1b). With increased ultrasonic intensity from 2 to 6 W/mL, proteins elevated in concentration from 109.9 to 170.6 mg/gTSS in 20 min, representing a 35.5-fold to 55.0-fold increase over the untreated control (3.10 mg/gTSS), while polysaccharide concentrations increased from 53.2 mg/gTSS (5.9-fold) to 79.9 mg/gTSS (8.7-fold) in the first 20 min, gradually reaching a maximum in the range of 67.9 mg/gTSS to 87.8 mg/gTSS after the reaction. The dissolution of proteins is more pronounced due to the disruptive effect of ultrasonication, which not only damages the microbial cell membrane but also facilitates the release of proteins from microbial flocs, transforming them from a particulate state into a dissolved form [42].
The algae suspension using ozonation followed by ultrasonication with ozone residue (O3-US) was studied, considering that ozone-induced cell disruption may be further enhanced by ultrasonication, while ozonation first minimizes the opportunity of intracellular matter mineralization. The results showed a O3-US treatment significantly amplified the release of proteins and polysaccharides (Figure 1c). Initial exposure to O3 (0.14 gO3/gTSS) achieved 66.6 mg/gTSS and 87.5 mg/gTSS of protein and polysaccharide, respectively. Similar to the US process, O3-US quickly released protein and polysaccharide in the first 20 min and then reached a plateau at all ultrasonic densities. Increasing the intensity to 6 W/mL induced only marginal gains (2.7% for proteins, 1.3% for polysaccharides), despite a 50% increase in energy input, indicating an energy-economic threshold. Compared with individual O3 and US at an ultrasonic density of 4 W/mL, the protein release was 4.3 times and 1.9 times greater, respectively, while the released polysaccharides were 2.4 times and 3.1 times greater, respectively. Critically, the combined O3-US yield exceeded the sum of individual treatments by 30% for proteins and 40% for polysaccharides, a statistically significant synergistic effect, confirming non-additive interactions [43]. These phenomena demonstrated that there was a synergistic effect on intracellular release caused by O3-US treatment. The maximum release can be achieved in a short reaction time and at a lower ultrasonic density. The synergistic effect was induced by two factors. Firstly, initial ozonation makes the algal cell sensitive to the chemical and mechanical attack [44]. Secondly, ultrasonication enhances the mass transfer of ozone and facilitates continuous chemical attacks on the cell structures, thereby amplifying the overall cell disruption effect [25].

3.1.2. SCOD Release Characteristics

The soluble chemical oxygen demand (SCOD) and, consequently, the degree of algal cell disruption (DDSCOD) in O3, US, and O3-US treatments are shown in Figure 2 and Figure 3. Figure 2a shows that the production rate of SCOD follows a rapid stage and subsequent slow stage. The SCOD increased linearly from 64.7 to 328.1 mg/g TSS at the dose in the range of 0.028 gO3/gTSS to 0.14 gO3/gTSS, while the SCOD in the solution slowly increased to 416.5 mg/g TSS. The variation of DDSCOD followed a similar pattern, but the largest DDSCOD value observed was only 24.4%. The value of specific SCOD production versus the initial ozone concentration (Figure 2b) shows that the ozone utilization was almost the same below the dose of 0.14 gO3/gTSS, while continuously decreasing with a larger dose, indicating that there was a critical dose for both the algal cell disruption and the following oxidation of the produced SCOD. Specifically, the released intracellular polymer substances compete with ozone with for algal cells, resulting in the oxidation of organic matter [45].
Ultrasonication (US) pretreatment significantly enhanced SCOD release from algae, with sound intensity and treatment duration exhibiting dose-dependent effects (Figure 3a). SCOD concentrations increased rapidly during the initial 20 min of treatment across all tested intensities (2–6 W/mL), indicating immediate cell disruption and IPS release. At 20 min, SCOD levels reached 12.9, 16.0, and 20.1 times higher than controls for 2, 4, and 6 W/mL treatments, respectively, with DDSCOD of 35.2%, 44.6%, and 56.6%.
Above 20 min, SCOD accumulation slowed markedly; extending treatment to 50 min yielded only 7.9–21.9% incremental gains. In the range of sound intensity from 2 W/mL to 6 W/mL, the degree of disrupting algal cells by cavitation effect and mechanical action was enhanced with the increase of sound intensity (Figure 3b). These results confirm ultrasonication’s efficacy in enhancing soluble organic matter extraction, though optimization of intensity and duration was critical to avoid energy over-consumption [46].
The O3-US pretreatment markedly improved SCOD release and DDSCOD, exhibiting clear kinetics and intensity-dependent responses (Figure 3c,d). Initial ozonation (0.14 gO3/gTSS) achieved 328.1 mg/gTSS SCOD and 18.6% DDSCOD, indicating preliminary cell wall permeabilization. Subsequent ultrasonication dramatically enhanced these effects, with SCOD increasing by 1.8-, 2.6-, and 2.9-fold (at 2, 4, and 6 W/mL, respectively) within 5 min compared to ozonation alone, corresponding to DDSCOD values of 36.1%, 53.8%, and 60.9% (Figure 3c). Prolonging treatment to 20 min further elevated SCOD by 45.8% (2 W/mL), 20.0% (4 W/mL), and 12.4% (6 W/mL), with DDSCOD reaching 55.3%, 65.2%, and 68.8%, respectively, demonstrating progressive cell disruption. Beyond 20 min, SCOD improvements diminished (3.7–9.8% increase at 50 min), with final DDSCOD plateauing at 60.8%, 69.7%, and 71.5%, likely due to intracellular component retention and cellular debris aggregation [47]. Furthermore, when the ultrasonic density was between 2–4 W/mL within the treatment time of 20 min, the SCOD concentration of O3-US was 2.5–24.2% higher than the sum of the individual O3 and US treatments, reflecting the synergistic effect of ozone and ultrasonication, as well as the balance between cell disruption and degradation. This synergy arises from two possible mechanisms: (1) ultrasonication generates transient cavitation bubbles, whose collapse produces hydroxyl radicals (•OH) and extreme localized conditions, disrupting algal cell walls and amplifying oxidative reactions [48]; (2) mechanical shear forces fragment ozone into micro-bubbles, increasing gas-liquid interfacial area and mass transfer efficiency, thereby accelerating oxidative degradation [49].

3.1.3. Dynamic Analysis of Algal Cell Disruption Using a O3-US Pretreatment

Cell disruption typically follows a first-order kinetic model proposed by Hetherington et al. [50] in their 1971 experiment on protein release from yeast cells. Therefore, a similar first-order kinetic model was used to describe the release behavior of proteins and SCOD from algal cells after disruption during ultrasound treatment, as detailed in the following Equations (4) and (5).
1 R m R t = exp K p t
1 F m F t = exp K c t
In this context, Rm denotes the maximum protein-release value (mg/g TSS), while Rt represents the protein-release value at time t (mg/g TSS). The protein-release rate constant is Kp (min−1). Additionally, Fm signifies the maximum SCOD-release value (mg/g TSS), and Ft indicates the SCOD-release value at time t (mg/g TSS). The SCOD-release rate constant is Kc (min−1).
Figure 4 shows the kinetic fitting curves of protein and SCOD fit well with the data obtained from the O3-US cell-disruption experiments. Under different operating parameters, the protein-release rate constant Kp and the maximum release value Rm, as well as the SCOD-release rate constant Kc and the maximum release value Fm, are presented in Table 3.
Increasing the ultrasonic density in O3-US pretreatments enhanced both protein and SCOD-release rates, with a maximum achieved at 0.14 g O3/g TSS combined with 6 W/mL (Table 3). The release rate of protein and SCOD more than doubled when the energy density was increased from 2 W/mL to 4 W/mL (0.06 to 0.13 min⁻¹ and 0.12 to 0.25 min⁻¹). The protein and SCOD maximum release value increased by 10.9% and 22.5%, respectively. Further escalation to 6 W/mL yielded marginal gains: the protein and SCOD maxima rose by only 2.2% and 4.5%, respectively, despite a 50% increase in energy input. This nonlinear efficiency gain underscored an energy-economic threshold near 4 W/mL, beyond which cell disruption efficiency plateaus due to cavitation saturation and microbubble shielding effects.

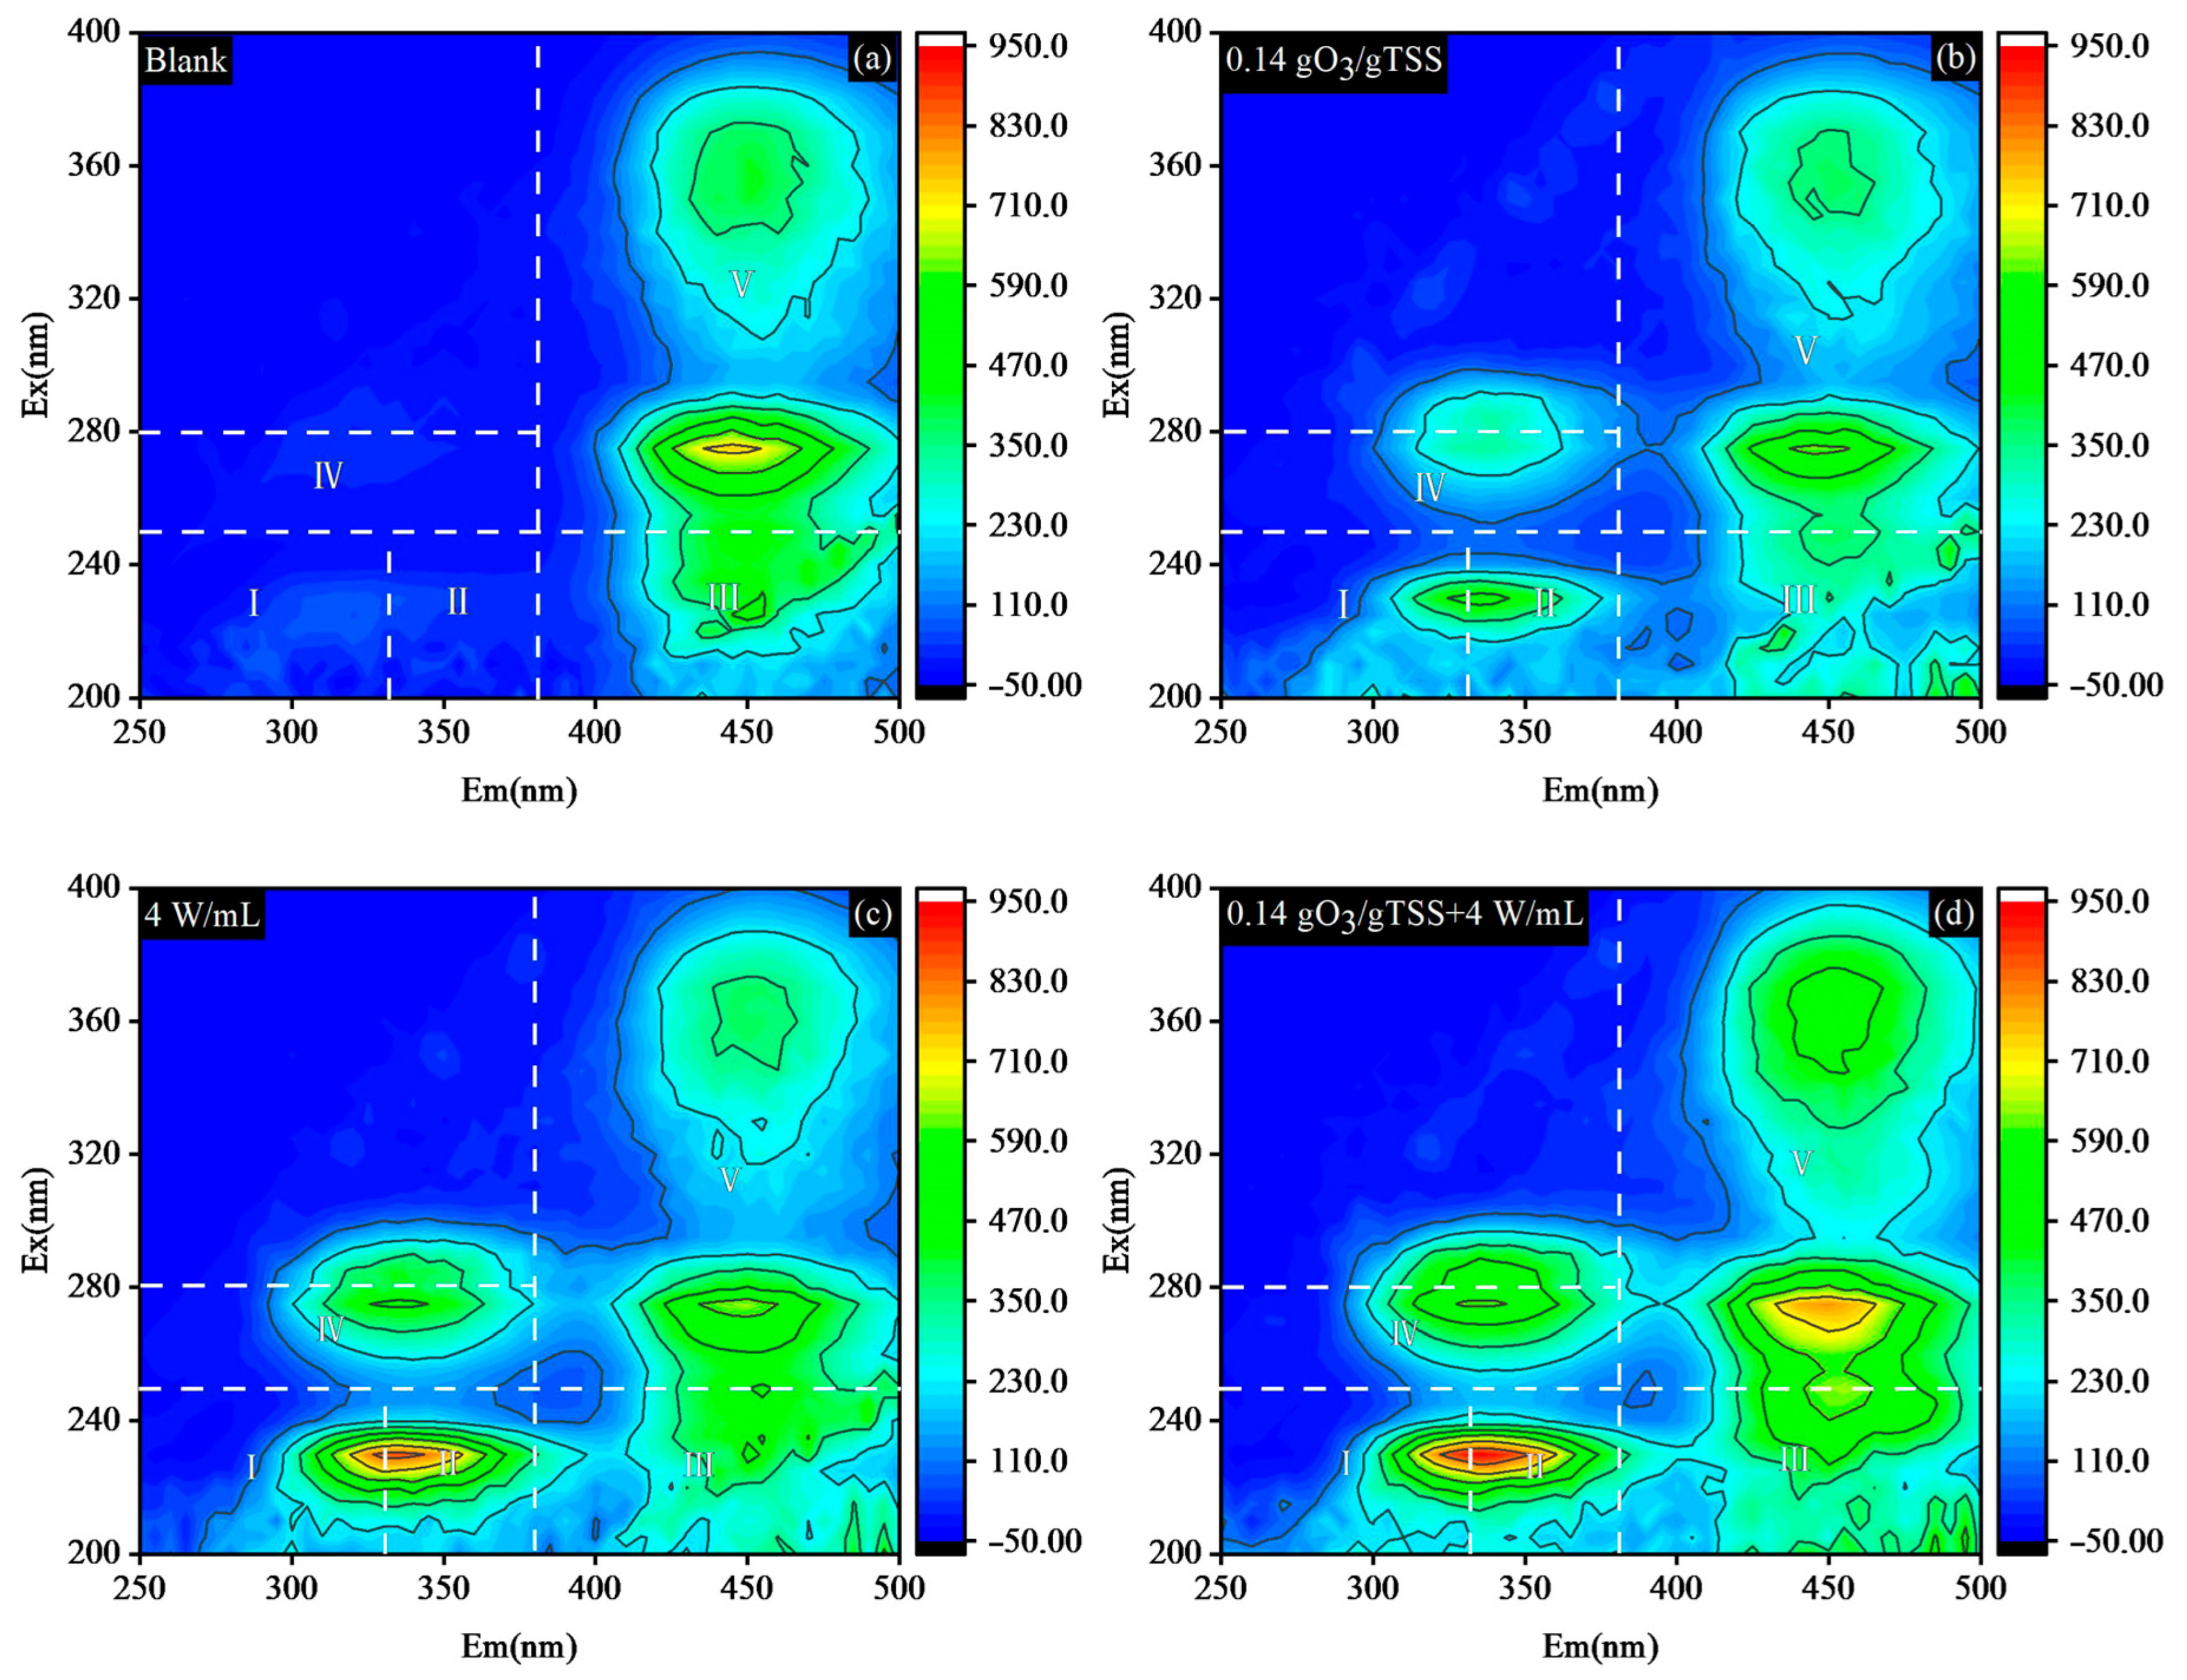
3.1.4. EEMs Spectrometry Analysis

Excitation-Emission Matrix Fluorescence Spectroscopy (EEMs) was employed to characterize released organics, categorizing them into five regions based on the fluorescence regional integration (FRI) method [51]: aromatic proteins (AP) (region I, Ex/Em: 220–250 nm/280–330 nm; region II, Ex/Em: 200–250 nm/330–380 nm), which are susceptible to microbial decomposition; fulvic acid-like (FA-like) substances (region III, Ex/Em: 200–250 nm/380–500 nm), which are non-biodegradable organics; the soluble microbial by-products (SMPs), including tyrosine-, tryptophan-, and protein-like substances (region IV, Ex/Em: 250–280 nm/200–380 nm) with good biodegradability; and finally the humic acid-like (HA-like) substances (region V, Ex/Em: 250–400 nm/380–500 nm), which are not readily biodegradable. Yu et al. [52] employed a similar EEM zoning pattern to characterize the composition of algal extracellular substances (AESs) and to analyze how ultrasound degradation of AESs can alleviate their impact on algal growth and metabolism.
In untreated algal biomass, the organics were primarily comprised of HA-like substances (region V) and minor FA-like compounds (region III), as shown in Figure 5a. Pretreatments markedly altered EEM profiles. Within an O3 pretreatment, distinct peaks emerged in regions I, II, and IV in Figure 5b, which indicates a release of tyrosine-like proteins and soluble microbial metabolites into the solution, thereby enhancing the solution’s bioavailability. Concurrently, the amounts of HA-like substances and FA-like substances were degraded. After the US, maximized fluorescence was observed in regions I and II. After O3-US pretreatment, the fluorescence intensity in regions I, II, and IV increased. Most of these substances were AP and SMPs, which are crucial organic components of EPS and microbial metabolites. These substances have already shown their effectiveness in promoting the biochemical hydrolysis process [53]. Additionally, SMPs, either in the free state or in the form of peptides, are highly biodegradable [54]. The results show that O3-US treatment enhances the release of IPS and improves bioavailability, which is advantageous for subsequent utilization, such as promoting fermentation processes.

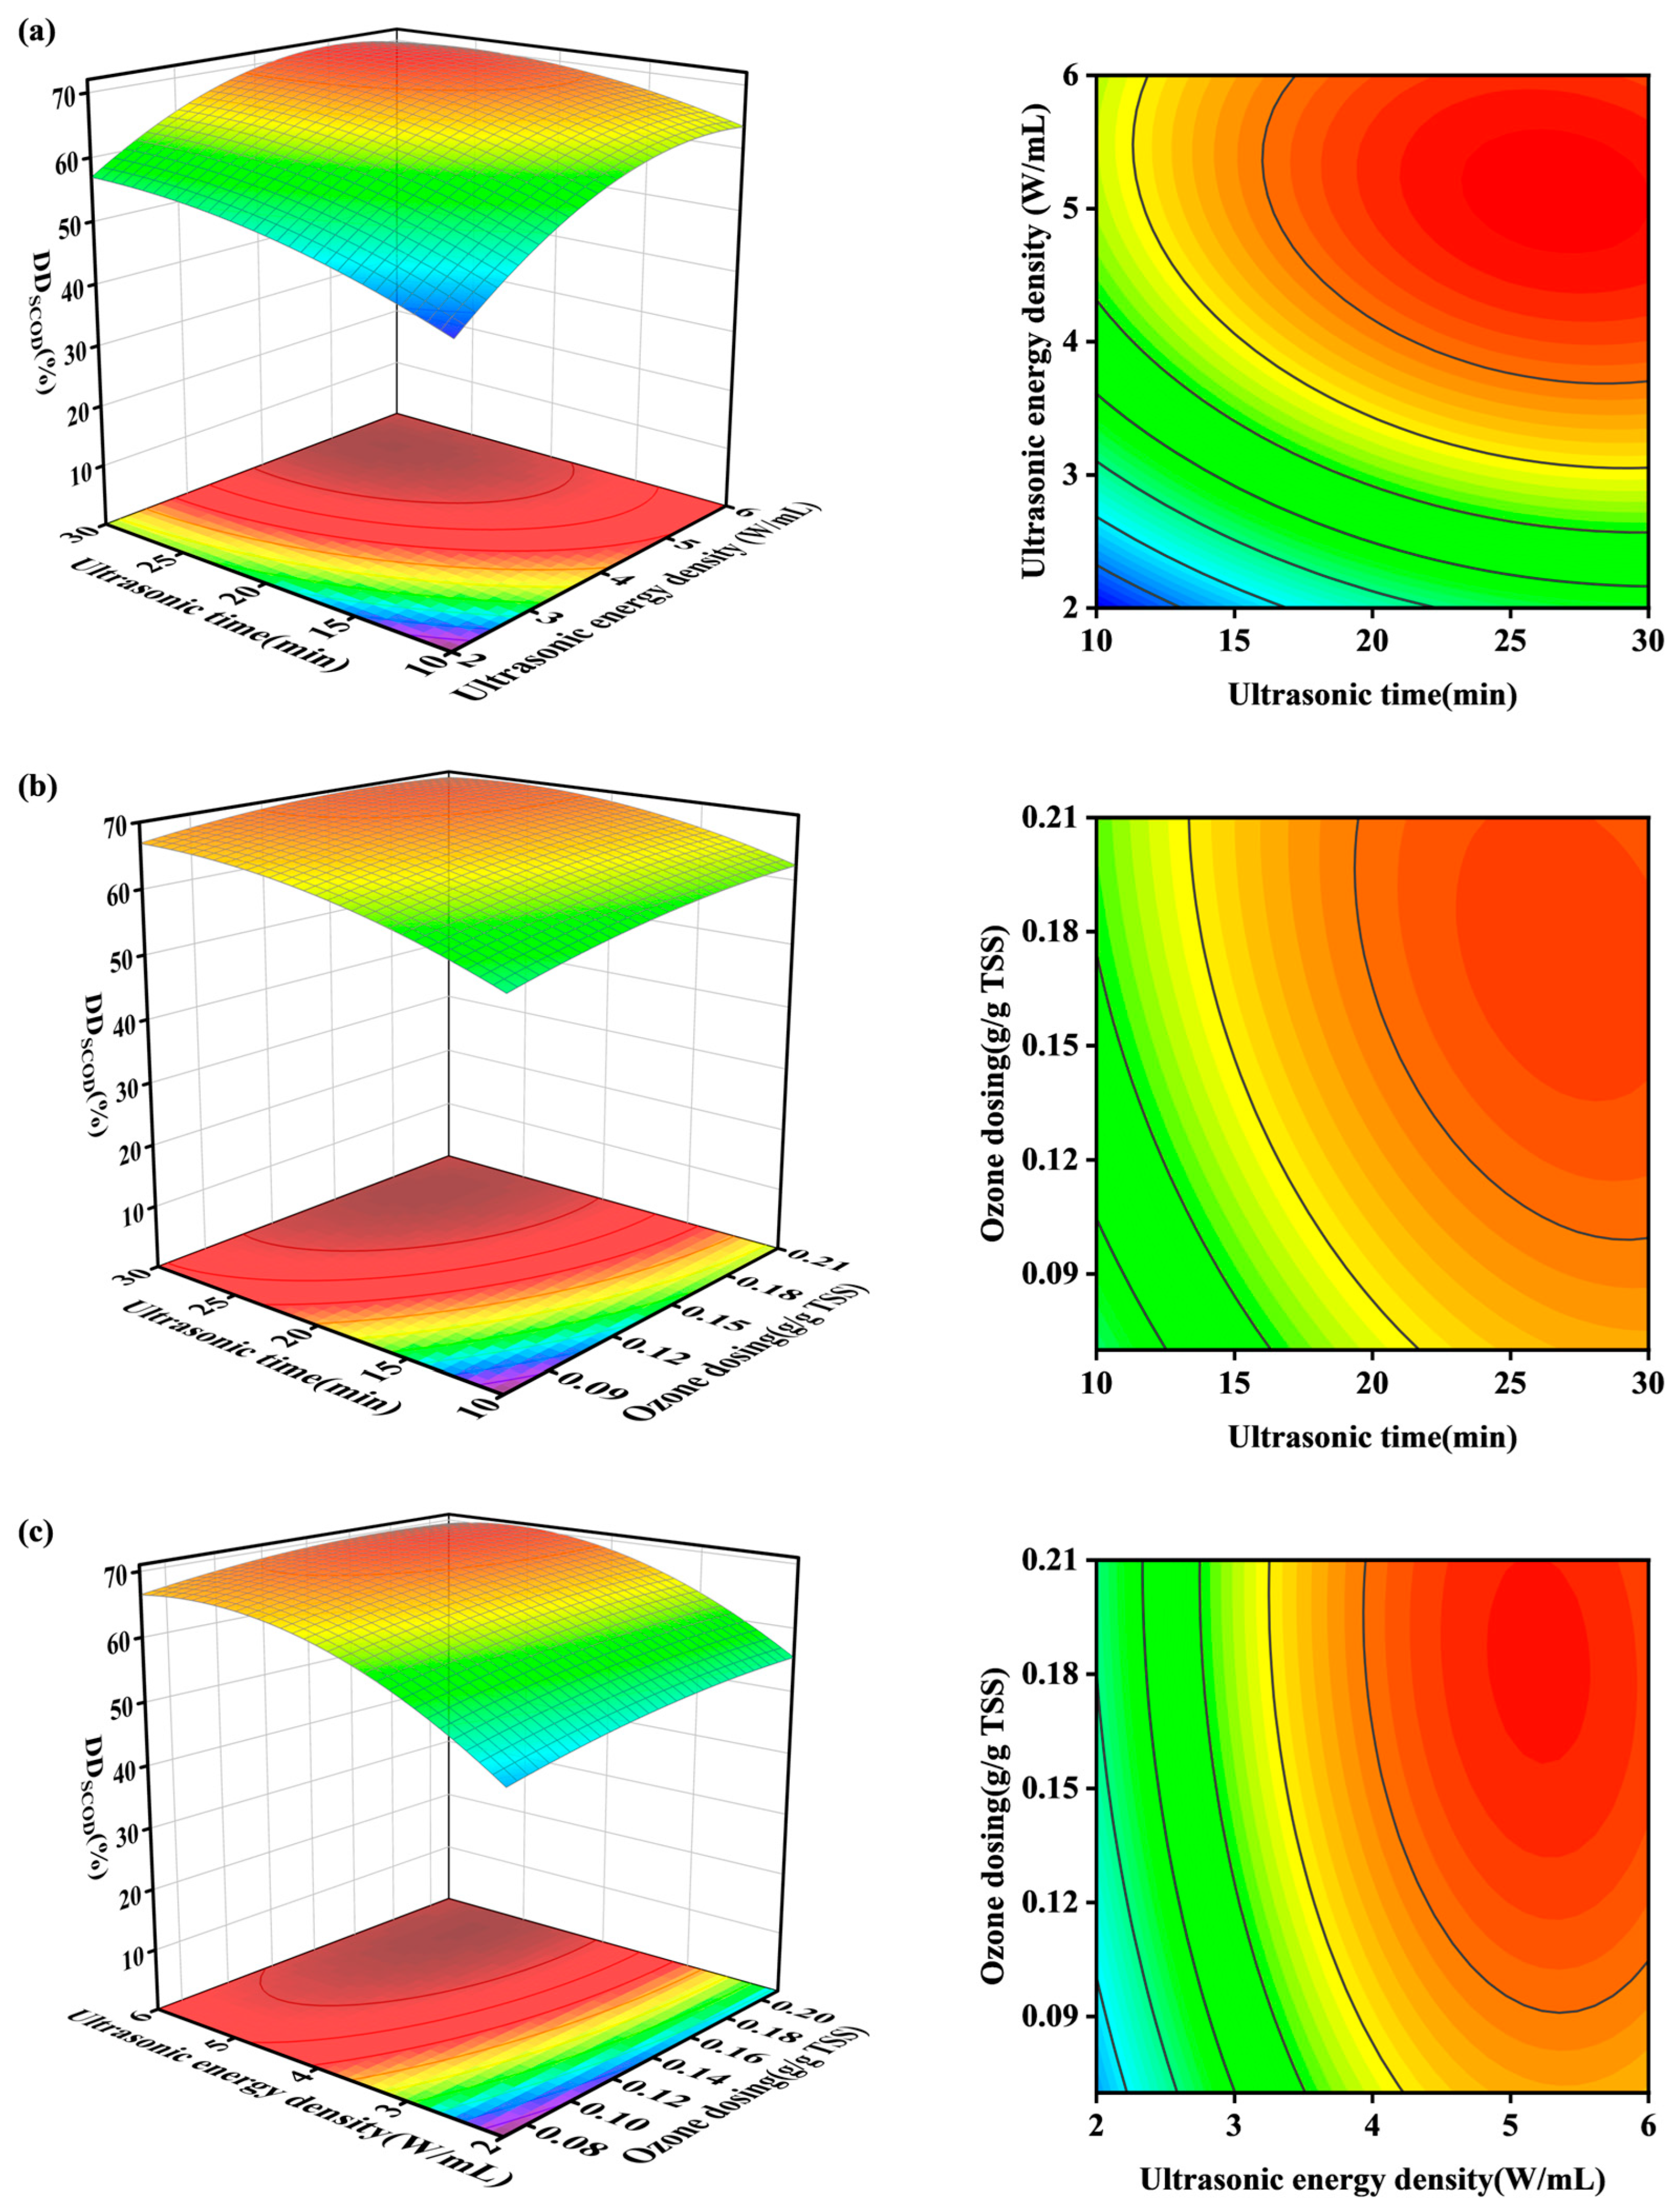
3.2. Optimization of Parameters for Combined O3-US Treatment

To achieve the maximum release of IPS from the algae suspension, the key factors influencing the degree of disruption of algae cells during the O3-US treatment were identified. Ultrasonic density, ozone dose, and ultrasonic time were optimized by response-surface analysis.
Based on these variables, a Box-Behnken response-surface optimization experiment with three factors and three levels was designed through Design Expert 13 software. The disruption degree, represented by DDSCOD, was selected as the response index for parameter optimization. The detailed experimental results are presented in Table 4.
A regression was fitted to the experimental data in Table 4, and the following quadratic polynomial regression equation was obtained:
Y = 65.46 + 3.70A + 8.02B + 3.07C − 2.12AB − 1.85AC − 0.6375BC − 0.9017A2 − 4.97B2 − 0.3317C2
Analysis of Variance (ANOVA) was then employed to assess the validity of this regression equation, and the results are presented in Table 5. The F-test, along with its corresponding p-value (significance level), is commonly utilized to evaluate whether the regression model and its factors have a significant impact on the response values [55]. The model F-values exceeded 197.35, and very low p-values (<0.0001) indicated that all models were significant. Additionally, the lack-of-fit term was not significant (F = 3.11, p = 0.1510 > 0.05), showing agreement between the experimental data and any predicted response value. This indicated that the model diagnostics were appropriate. The R2 value for the regression model is 0.9945, and the adjusted R2 (RAdj2) is 0.9874, which indicates that the model was well-fitted; only 1.3% of the total variability could not be explained by the model.
Figure 6 shows the 3D response surface and contour plots of the model equations fitted to the data. It shows the relationship between the factors and helps determine the optimum level of each factor for maximum response. Figure 6a illustrates the interaction between ultrasonic times and ultrasonic density on DDSCOD. The increase in ultrasonic time and ultrasonic density significantly enhanced the DDSCOD. Under low ultrasonic-density conditions (≤4 W/mL), DDSCOD exhibited rapid growth, but the rate of increase gradually plateaued as ultrasonic density exceeded 6 W/mL. Experimental results demonstrated that, at a fixed ultrasonic time of 30 min, elevating ultrasonic density from 4 W/mL to 6 W/mL yielded only a marginal 1.9% improvement in DDSCOD. A similar diminishing return was observed with extended ultrasonic time. To optimize energy efficiency, it is critical to select a lower ultrasonic density (2–4 W/mL) and a shorter ultrasonic time (10–20 min).
The interaction between ultrasonic time and ozone dose exhibited significant synergistic effects on DDSCOD (Figure 6b). DDSCOD increased with both parameters, but the rate of increase gradually slowed. This nonlinear behavior likely stems from competitive oxidation mechanisms: excessive ozone reacted with proteins and polysaccharides released during initial disruption, leading to nonproductive degradation rather than further cell disruption.
The contour density (Figure 6c) confirms the ultrasonic density’s primacy over ozone dose, and the effect of cell disruption almost stopped increasing when ultrasonic density exceeded 4 W/mL. Moreover, keeping the ultrasonication conditions the same, ozone dose contributed little to the growth of DDSCOD after it reached the threshold value of 0.14 gO3/gTSS. Besides, excessive ultrasonic density could be detrimental to the lifetime of the ultrasonic probe. Therefore, blindly prolonging the ultrasonic time or increasing the ultrasonic density and ozone dose will not cause the algae disruption indefinitely, but rather increase the operation cost of the treatment process. The above results indicate that the effect of the interaction on DDSCOD was, in descending order: ultrasonic time and ultrasonic density > ultrasonic time and ozone dose > ultrasonic density and ozone dose.
The regression equation was well fitted to the response surface experiment for DDSCOD, considering the energy consumption of ultrasonication and the degradation of released organic matter by excessive ozone doses. The optimal cell disruption parameters obtained from the response-surface analysis were an ultrasonic time of 23.89 min, ultrasonic density of 3.78 W/mL, and ozone dose of 0.143 gO3/gTSS, predictively achieving a DDSCOD of 66.3%. Experimental validation under practical conditions (0.14 gO3/gTSS, 4 W/mL, 20 min) achieved a 65.2% DDSCOD, a slight deviation (1.1%) from predictions. Triplicate testing showed <1.2% variability, confirming model robustness for practical application.

3.3. Disruption of Algal Cell Structure by Different Pretreatments

3.3.1. Algae Morphology Before and After Pretreatment

SEM images of algae cells were taken after different pretreatment reactions. Untreated cells (control, Figure 7a) exhibited pristine structural integrity, with smooth surfaces and uniform spherical morphology. O3 pretreatment (Figure 7b) showed significant shriveling, implying that ozone was able to oxidize algal cell wall structures. In contrast, the integrity of the cell was destroyed after US alone (Figure 7c), with lots of fragments. O3-US pretreatment (Figure 7d) caused the most significant damage to algal cells, with more severe cell fragmentation, which resulted in a rough and loose structure.

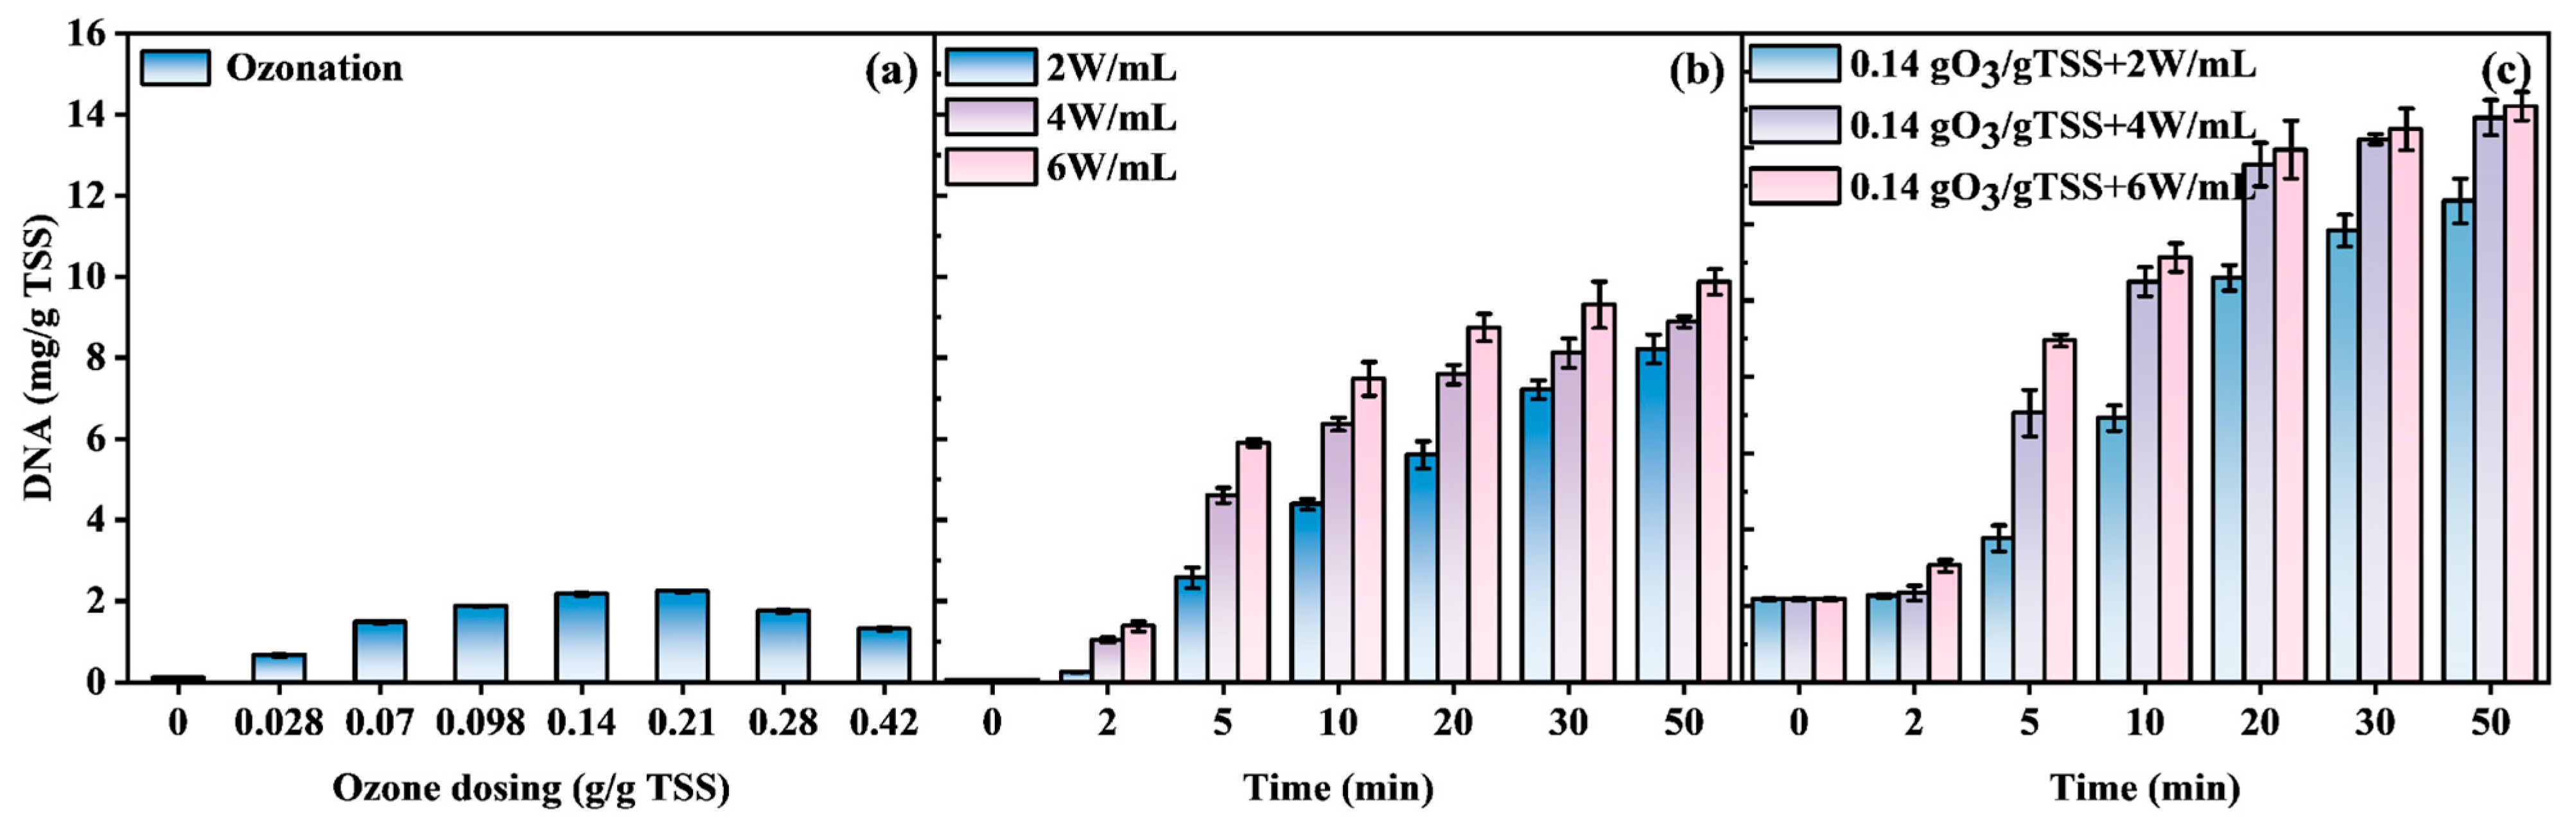
3.3.2. DNA Release Characteristics

Extracellular DNA quantification served as a robust indicator of cellular integrity loss during pretreatment processes. Extracellular DNA in untreated samples measured 0.1 mg/gTSS, which may be due to cells aging and apoptosis, resulting in the release of small amounts of intracellular DNA into the supernatant. Figure 8a shows DNA release exhibited a bell shape, depending on the ozone dose in the O3 pretreatment. A maximum DNA concentration of 2.2 mg/g TSS occurred at 0.21 gO3/gTSS, whereas the DNA concentration began to decrease when the ozone dose continued to increase, which was due to the fact that the degradation of DNA was greater than the release at an ozone dose of 0.21 gO3/ gTSS and above.
Figure 8b demonstrates the change in DNA concentration for the US pretreatment. The DNA concentration of algae treated with different ultrasonic intensities all increased with the ultrasonic time, and the DNA concentration increased to 2.6 mg/gTSS, 4.6 mg/gTSS, and 5.9 mg/gTSS at 5 min of treatment at ultrasonic intensities of 2 W/mL, 4 W/mL, and 6 W/mL, respectively, achieving the values of 5.6 mg/gTSS, 7.6 mg/gTSS, and 8.7 mg/gTSS after 20 min of treatment, respectively. Compared with the control group, the US pretreatment significantly increased the release of DNA, possibly attributed to prolonged shear stress and •OH radical attacks on cell walls [56].
The variation of DNA concentrations in the O3-US pretreatment is shown in Figure 8c; they increased and then leveled off with the increase of ultrasonic time. Under an ultrasonic density of 2 W/mL, 4 W/mL, and 6 W/mL, the DNA concentrations after 5 min were detected to be 3.8 mg/g TSS, 7.1 mg/g TSS, and 9.0 mg/gTSS, respectively, which showed an improvement of 45.7%, 53.3%, and 51.7%, respectively, compared with US alone, and were 1.7 times, 3.3 times, and 4.1 times that of O3 pretreatment alone, respectively. Continuing the treatment until 20 min, the DNA concentration increased to 10.6 mg/gTSS, 13.6 mg/gTSS, and 14.0 mg/gTSS, respectively. The results indicate that O3-US pretreatment intensifies the disruption of cyanobacterial cell integrity. Under the synergistic effect of ultrasonication, ozone’s oxidative capacity is markedly enhanced, generating a greater abundance of highly reactive free radicals capable of penetrating cellular membranes. This process induces oxidative stress within the cells, leading to structural damage and the extensive release of intracellular DNA due to compromised cellular protection.

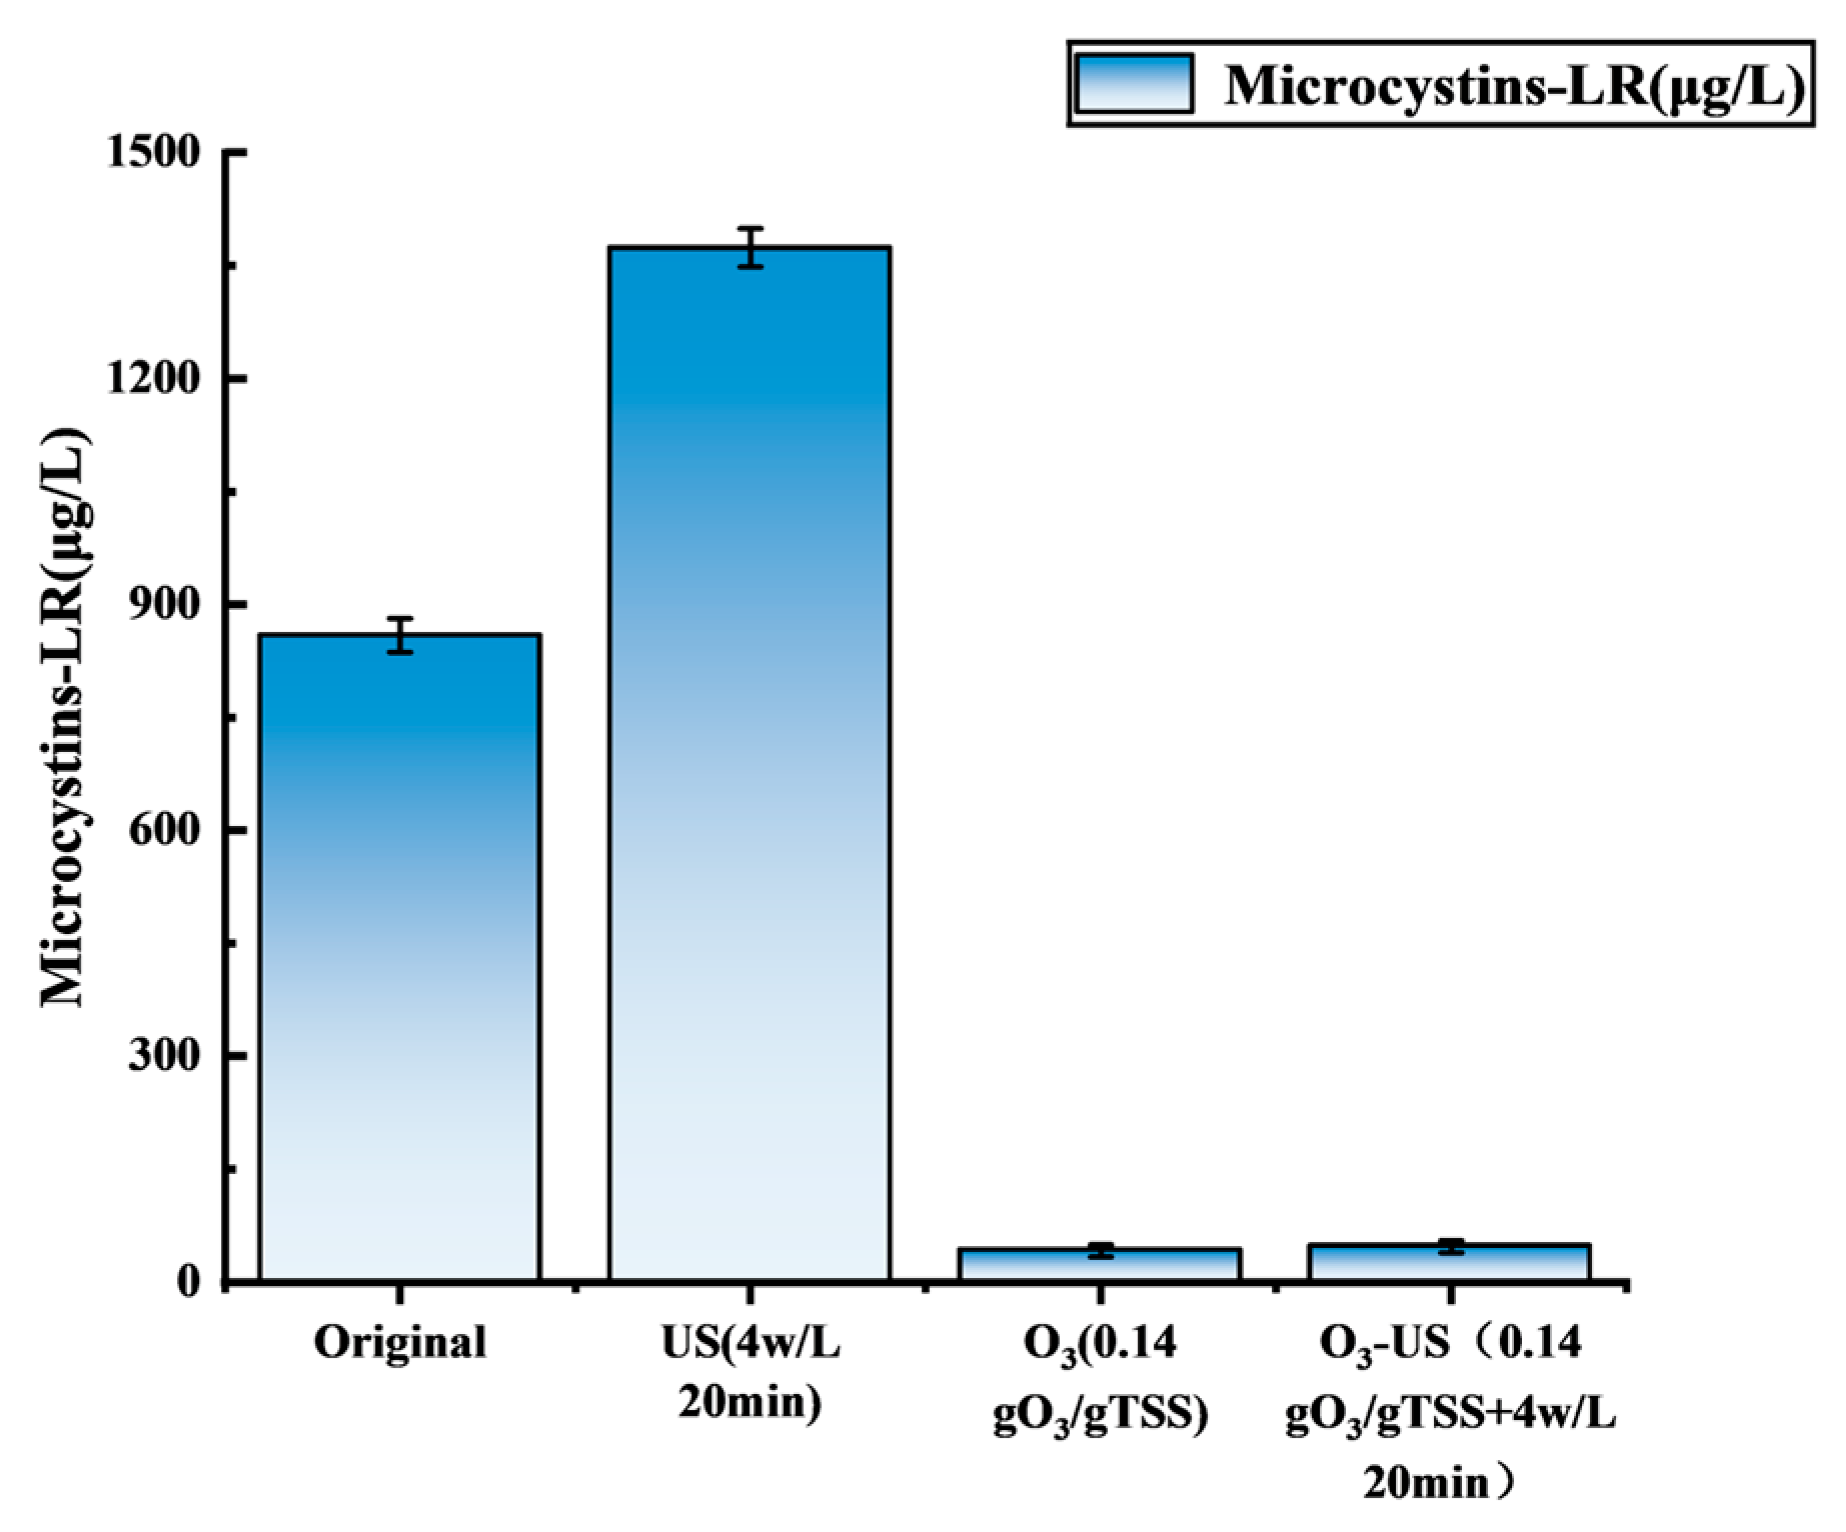
3.4. Other Risk Factors: Behavior of MC-LR in Different Pretreatment Processes

Microcystin-LR (MC-LR), a hepatotoxic cyclic peptide primarily localized within algal cells, requires careful monitoring during biomass processing. Figure 9 demonstrates that US alone induced structural disintegration of algal cells, triggering substantial release of intracellular constituents, including MC-LR, into the aqueous phase. Quantitative analysis revealed a 60.0% increase in extracellular MC-LR concentration compared to the untreated control, consistent with previous reports documenting ultrasonication-enhanced liberation of toxins [57]. Ozonation (0.14 g O3/g TSS) achieved a 95.2% MC-LR removal relative to the control, attributed to ozone’s strong oxidative capacity toward unsaturated bonds in organic compounds [58]. The O3-US pretreatment exhibited a synergistic efficacy, exhibiting a 94.5% MC-LR removal and 96.6% reduction relative to US-only treatments. These findings conclusively establish the dual advantage of O3-US pretreatment, as simultaneous cell disruption and chemical detoxification.

4. Conclusions

This study demonstrates that the synergistic ozone-ultrasonication (O3-US) pretreatment effectively overcomes the dual challenges of algal biomass valorization: recalcitrant cell wall barriers and residual cyanotoxin risks. Two key advancements were achieved:
  • Synergistic disruption mechanism: The integration of ozone oxidation targeting EPS and cell wall polymers with ultrasonication treatment—inducing cavitation-driven mechanical disruption—significantly enhances the release of intracellular resources. Optimized conditions (0.14 gO3/gTSS, 4 W/mL, 20 min) achieved a protein content of 289.2 mg/g TSS, representing 4.3-fold and 1.9-fold increases compared to standalone O3 and US treatment, respectively. Additionally, polysaccharide content reached 87.5 mg/g TSS, corresponding to 2.4-fold and 3.1-fold enhancements over singular treatments, achieving 65.2% cell disruption efficiency. Fluorescence EEM spectroscopy further confirmed that biodegradable organic compounds predominate post-treatment, ensuring compatibility with subsequent downstream processes.
  • Detoxification and energy efficiency: The synchronized degradation of MC-LR achieved a removal efficiency of 94.5%, representing a 96.6% reduction in risk compared to US alone, thereby addressing biosafety concerns. Additionally, this integrated approach reduced ultrasonic intensity by 33.3% and lowered treatment duration by 60% relative to systems employing US-only treatments.
The O3-US pretreatment system emerges as an energy-efficient and effective approach for algal biomass processing, simultaneously achieving cell disruption and toxin degradation. Although laboratory-scale results are encouraging, scaling considerations must address: (1) ozone-production economics through dose optimization, and (2) equipment maintenance via improved system design and cleaning protocols. The method’s synergistic potential with conventional anaerobic digestion processes enhances both biogas production and operational safety, aligning with circular bioeconomy principles. Key research priorities include: pilot-scale verification, comprehensive techno-economic analysis, downstream process integration, and fundamental studies of ozone-ultrasound synergies. This integrated pretreatment strategy represents a sustainable platform for algal biorefining, combining operational efficiency with environmental safety.

Author Contributions

Conceptualization, T.H. and J.Y.; methodology, Y.Z.; software, X.Z.; validation, Y.Z., J.L. and X.Z.; formal analysis, B.W.; investigation, Y.Z., J.L.; resources, T.H.; data curation, Y.Z. and J.Z.; writing—original draft preparation, Y.Z.; writing—review and editing, T.H. and J.Y.; visualization, B.W.; supervision, J.Y. and J.Z.; project administration, T.H.; funding acquisition, T.H. and J.Y. All authors have read and agreed to the published version of the manuscript.

Funding

This research was funded by National Natural Science Foundation of China, grant number 52070137, and Suzhou Social Development Science and Technology Innovation Project from Suzhou Science and Technology Bureau, number SS202107.

Data Availability Statement

Data is contained within the article. The data is in figures and tables for the main text.

Conflicts of Interest

The authors declare no conflicts of interest.

References

  1. Lima, G.M.; Teixeira, P.C.; Teixeira, C.M.; Filócomo, D.; Lage, C.L. Influence of spectral light quality on the pigment concentrations and biomass productivity of Arthrospira platensis. Algal Res. 2018, 31, 157–166. [Google Scholar] [CrossRef]
  2. Pandit, S.; Sharma, M.; Banerjee, S.; Nayak, B.K.; Das, D.; Khilari, S.; Prasad, R. Pretreatment of cyanobacterial biomass for the production of biofuel in microbial fuel cells. Bioresour. Technol. 2023, 370, 128505. [Google Scholar] [CrossRef]
  3. Marsolek, M.D.; Kendall, E.; Thompson, P.L.; Shuman, T.R. Thermal pretreatment of algae for anaerobic digestion. Bioresour. Technol. 2014, 151, 373–377. [Google Scholar] [CrossRef] [PubMed]
  4. Kurokawa, M.; King, P.M.; Wu, X.; Joyce, E.M.; Mason, T.J.; Yamamoto, K. Effect of sonication frequency on the disruption of algae. Ultrason. Sonochem. 2016, 31, 157–162. [Google Scholar] [CrossRef]
  5. Zhao, M.; Xu, J.; Xue, H.; Li, C.; Liu, H.; Gu, S.; Miao, H.; Ruan, W. Improving hydrogen recovery from anaerobic co-digestion of algae and food waste by high-pressure homogenisation pre-treatment. Environ. Chem. Lett. 2021, 19, 3497–3504. [Google Scholar] [CrossRef]
  6. Sivagurunathan, P.; Kumar, G.; Mudhoo, A.; Rene, E.R.; Saratale, G.D.; Kobayashi, T.; Xu, K.; Kim, S.-H.; Kim, D.-H. Fermentative hydrogen production using lignocellulose biomass: An overview of pre-treatment methods, inhibitor effects and detoxification experiences. Renew. Sustain. Energy Rev. 2017, 77, 28–42. [Google Scholar] [CrossRef]
  7. Sivagurunathan, P.; Kumar, G.; Kobayashi, T.; Xu, K.; Kim, S.-H. Effects of various dilute acid pretreatments on the biochemical hydrogen production potential of marine macroalgal biomass. Int. J. Hydrogen Energy 2017, 42, 27600–27606. [Google Scholar] [CrossRef]
  8. Sulfahri; Mushlihah, S.; Langford, A.; Tassakka, A.C.M.A. Ozonolysis as an effective pretreatment strategy for bioethanol production from marine algae. Bioenergy Res. 2020, 13, 1269–1279. [Google Scholar] [CrossRef]
  9. Ren, H.; Quan, Y.; Liu, S.; Hao, J. Effectiveness of ultrasound (US) and slightly acidic electrolyzed water (SAEW) treatments for removing Listeria monocytogenes biofilms. Ultrason. Sonochem. 2025, 112, 107190. [Google Scholar] [CrossRef]
  10. Phong, W.N.; Show, P.L.; Le, C.F.; Tao, Y.; Chang, J.-S.; Ling, T.C. Improving cell disruption efficiency to facilitate protein release from microalgae using chemical and mechanical integrated method. Biochem. Eng. J. 2018, 135, 83–90. [Google Scholar] [CrossRef]
  11. Lee, S.; Anwer, H.; Park, J.W. Oxidative power loss control in ozonation: Nanobubble and ultrasonic cavitation. J. Hazard. Mater. 2023, 455, 131530. [Google Scholar] [CrossRef] [PubMed]
  12. Wang, C.; Xia, H.; Xu, Y.; Lu, Z.; Pei, Q.; Dai, L.; Zhang, L. Efficient recovery of valuable metals from low-grade zinc residue by ultrasonic strengthening. Chem. Eng. Process.-Process Intensif. 2025, 211, 110240. [Google Scholar] [CrossRef]
  13. Passos, F.; Uggetti, E.; Carrère, H.; Ferrer, I. Pretreatment of microalgae to improve biogas production: A review. Bioresour. Technol. 2014, 172, 403–412. [Google Scholar] [CrossRef] [PubMed]
  14. Duan, Z.; Tan, X.; Li, N. Ultrasonic selectivity on depressing photosynthesis of cyanobacteria and green algae probed by chlorophyll-a fluorescence transient. Water Sci. Technol. 2017, 76, 2085–2094. [Google Scholar] [CrossRef] [PubMed]
  15. Hui, G.T.; Meng, T.K.; Kassim, M.A. Green ultrasonication-assisted extraction of microalgae Chlorella sp. for polysaturated fatty acid (PUFA) rich lipid extract using alternative solvent mixture. Bioprocess Biosyst. Eng. 2023, 46, 1499–1512. [Google Scholar] [CrossRef]
  16. Zhang, L.; Yang, J.; Wu, B.; Liu, J.; Xu, X.; Wu, W.; Zhuang, J.; Li, H.; Huang, T. Enhanced VFAs production from microalgal hydrolytic acidification with ultrasonic-alkali pretreatment. Algal Res. 2023, 71, 103056. [Google Scholar] [CrossRef]
  17. Wan, C.; Huang, S.; Li, M.; Zhang, L.; Yuan, Y.; Zhao, X.; Wu, C. Towards zero excess sludge discharge with built-in ozonation for wastewater biological treatment. Sci. Total Environ. 2024, 926, 171798. [Google Scholar] [CrossRef] [PubMed]
  18. Cardeña, R.; Moreno, G.; Bakonyi, P.; Buitrón, G. Enhancement of methane production from various microalgae cultures via novel ozonation pretreatment. Chem. Eng. J. 2017, 307, 948–954. [Google Scholar] [CrossRef]
  19. Pranowo, R.; Lee, D.; Liu, J.; Chang, J.S. Effect of O3 and O3/H2O2 on algae harvesting using chitosan. Water Sci. Technol. 2013, 67, 1294–1301. [Google Scholar] [CrossRef]
  20. Chang, J.; Chen, Z.-l.; Wang, Z.; Kang, J.; Chen, Q.; Yuan, L.; Shen, J.-M. Oxidation of microcystin-LR in water by ozone combined with UV radiation: The removal and degradation pathway. Chem. Eng. J. 2015, 276, 97–105. [Google Scholar] [CrossRef]
  21. Tuncay, S.; Akcakaya, M.; Icgen, B. Ozonation of sewage sludge prior to anaerobic digestion led to Methanosaeta dominated biomethanation. Fuel 2022, 313, 122690. [Google Scholar] [CrossRef]
  22. Dytczak, M.A.; Londry, K.L.; Siegrist, H.; Oleszkiewicz, J.A. Ozonation reduces sludge production and improves denitrification. Water Res. 2007, 41, 543–550. [Google Scholar] [CrossRef]
  23. Koundle, P.; Nirmalkar, N.; Momotko, M.; Boczkaj, G. Ozone nanobubble technology as a novel AOPs for pollutants degradation under high salinity conditions. Water Res. 2024, 263, 122148. [Google Scholar] [CrossRef] [PubMed]
  24. Wang, J.; Zhang, J.; Cheng, G.; Shangguan, Y.; Yang, G.; Liu, X. Feasibility and mechanism of removing Microcystis aeruginosa and degrading microcystin-LR by dielectric barrier discharge plasma. Chemosphere 2024, 352, 141436. [Google Scholar] [CrossRef]
  25. Wu, Z.; Abramova, A.; Nikonov, R.; Cravotto, G. Sonozonation (sonication/ozonation) for the degradation of organic contaminants–A review. Ultrason. Sonochem. 2020, 68, 105195. [Google Scholar] [CrossRef] [PubMed]
  26. Meng, L.; Xi, J.; Yeung, M. Degradation of extracellular polymeric substances (EPS) extracted from activated sludge by low-concentration ozonation. Chemosphere 2016, 147, 248–255. [Google Scholar] [CrossRef] [PubMed]
  27. Parandoush, S.; Mokhtarani, N. Reducing excess sludge volume in sequencing batch reactor by integrating ultrasonic waves and ozonation. J. Environ. Manag. 2022, 317, 115405. [Google Scholar] [CrossRef]
  28. AlAfifi, F.; Jasim, S.; Mohseni, M. Microcystin-LR Removal by Ozone (O3) and Vacuum-UV (VUV): The Effect of Chloride Ions. Ozone Sci. Eng. 2024, 46, 86–98. [Google Scholar] [CrossRef]
  29. Keris-Sen, U.D.; Sen, U.; Gurol, M.D. Combined effect of ozone and ultrasound on disruption of microalgal cells. Sep. Sci. Technol. 2019, 54, 1853–1861. [Google Scholar] [CrossRef]
  30. Gonzalez-Balderas, R.; Velasquez-Orta, S.; Ledesma, M.O. Biorefinery process intensification by ultrasound and ozone for phosphorus and biocompounds recovery from microalgae. Chem. Eng. Process.-Process Intensif. 2020, 153, 107951. [Google Scholar] [CrossRef]
  31. Zhang, M.; Li, R.; Cao, L.; Shi, J.; Liu, H.; Huang, Y.; Shen, Q. Algal sludge from Taihu Lake can be utilized to create novel PGPR-containing bio-organic fertilizers. J. Environ. Manag. 2014, 132, 230–236. [Google Scholar] [CrossRef] [PubMed]
  32. Wang, J.; Cheng, G.; Zhang, J.; Lu, M.; Shangguan, Y.; Liu, X. Mechanism of dielectric barrier discharge plasma coupled with calcium peroxide to improve the quantity and quality of short chain fatty acids in anaerobic fermentation of cyanobacteria. Chem. Eng. J. 2023, 455, 140618. [Google Scholar] [CrossRef]
  33. Rastogi, R.P.; Sinha, R.P.; Incharoensakdi, A. The cyanotoxin-microcystins: Current overview. Rev. Environ. Sci. Bio/Technol. 2014, 13, 215–249. [Google Scholar] [CrossRef]
  34. Shechter, H. Spectrophotometric method for determination of ozone in aqueous solutions. Water Res. 1973, 7, 729–739. [Google Scholar] [CrossRef]
  35. Li, L.; Wang, Y.; Zhang, W.; Yu, S.; Wang, X.; Gao, N. New advances in fluorescence excitation-emission matrix spectroscopy for the characterization of dissolved organic matter in drinking water treatment: A review. Chem. Eng. J. 2020, 381, 122676. [Google Scholar] [CrossRef]
  36. Rice, E.W.; Bridgewater, L.; American Public Health Association. Standard Methods for the Examination of Water and Wastewater; American Public Health Association: Washington, DC, USA, 2012; Volume 10. [Google Scholar]
  37. Bradford, M.M. A rapid and sensitive method for the quantitation of microgram quantities of protein utilizing the principle of protein-dye binding. Anal. Biochem. 1976, 72, 248–254. [Google Scholar] [CrossRef]
  38. Nasirpour, N.; Ravanshad, O.; Mousavi, S.M. Ultrasonic-assisted acid and ionic liquid hydrolysis of microalgae for bioethanol production. Biomass Convers. Biorefin. 2023, 13, 16001–16014. [Google Scholar] [CrossRef]
  39. Giles, K.W.; Myers, A. An Improved Diphenylamine Method for the Estimation of Deoxyribonucleic Acid. Nature 1965, 206, 93. [Google Scholar] [CrossRef]
  40. Lei, L.-M.; Wu, Y.-S.; Gan, N.-Q.; Song, L.-R. An ELISA-like time-resolved fluorescence immunoassay for microcystin detection. Clin. Chim. Acta 2004, 348, 177–180. [Google Scholar] [CrossRef]
  41. Baig, Z.T.; Meng, L.; Saingam, P.; Xi, J. Ozonation and depolymerization of extracellular polymeric substances (EPS) extracted from a biofilter treating gaseous toluene. Polymers 2018, 10, 763. [Google Scholar] [CrossRef]
  42. Yu, G.-H.; He, P.-J.; Shao, L.-M.; Zhu, Y.-S. Extracellular proteins, polysaccharides and enzymes impact on sludge aerobic digestion after ultrasonic pretreatment. Water Res. 2008, 42, 1925–1934. [Google Scholar] [CrossRef] [PubMed]
  43. González-Balderas, R.M.; Velásquez-Orta, S.B.; Valdez-Vazquez, I.; Orta Ledesma, M.T. Intensified recovery of lipids, proteins, and carbohydrates from wastewater-grown microalgae Desmodesmus sp. by using ultrasound or ozone. Ultrason. Sonochem. 2020, 62, 104852. [Google Scholar] [CrossRef] [PubMed]
  44. Keris-Sen, U.D.; Gurol, M.D. Using ozone for microalgal cell disruption to improve enzymatic saccharification of cellular carbohydrates. Biomass Bioenergy 2017, 105, 59–65. [Google Scholar] [CrossRef]
  45. Mahmoodi, M.; Pishbin, E. Ozone-based advanced oxidation processes in water treatment: Recent advances, challenges, and perspective. Environ. Sci. Pollut. Res. 2025, 32, 3531–3570. [Google Scholar] [CrossRef]
  46. Wicker, R.J.; Kumar, G.; Khan, E.; Bhatnagar, A. Emergent green technologies for cost-effective valorization of microalgal biomass to renewable fuel products under a biorefinery scheme. Chem. Eng. J. 2021, 415, 128932. [Google Scholar] [CrossRef]
  47. Zhao, F.; Wang, Z.; Huang, H. Physical cell disruption technologies for intracellular compound extraction from microorganisms. Processes 2024, 12, 2059. [Google Scholar] [CrossRef]
  48. Brezhneva, N.; Dezhkunov, N.V.; Ulasevich, S.A.; Skorb, E.V. Characterization of transient cavitation activity during sonochemical modification of magnesium particles. Ultrason. Sonochem. 2021, 70, 105315. [Google Scholar] [CrossRef]
  49. Wang, B.; Xiong, X.; Shui, Y.; Huang, Z.; Tian, K. A systematic study of enhanced ozone mass transfer for ultrasonic-assisted PTFE hollow fiber membrane aeration process. Chem. Eng. J. 2019, 357, 678–688. [Google Scholar] [CrossRef]
  50. Halim, R.; Rupasinghe, T.W.; Tull, D.L.; Webley, P.A. Mechanical cell disruption for lipid extraction from microalgal biomass. Bioresour. Technol. 2013, 140, 53–63. [Google Scholar] [CrossRef]
  51. Chen, W.; Westerhoff, P.; Leenheer, J.A.; Booksh, K. Fluorescence Excitation−Emission Matrix Regional Integration to Quantify Spectra for Dissolved Organic Matter. Environ. Sci. Technol. 2003, 37, 5701–5710. [Google Scholar] [CrossRef]
  52. Yu, Z.; Pei, H.; Hou, Q.; Nie, C.; Zhang, L.; Yang, Z.; Wang, X. The effects of algal extracellular substances on algal growth, metabolism and long-term medium recycle, and inhibition alleviation through ultrasonication. Bioresour. Technol. 2018, 267, 192–200. [Google Scholar] [CrossRef] [PubMed]
  53. Duan, L.; Tian, Z.; Song, Y.; Jiang, W.; Tian, Y.; Li, S. Influence of solids retention time on membrane fouling: Characterization of extracellular polymeric substances and soluble microbial products. Biofouling 2015, 31, 181–191. [Google Scholar] [CrossRef] [PubMed]
  54. He, X.-S.; Xi, B.-D.; Wei, Z.-M.; Jiang, Y.-H.; Yang, Y.; An, D.; Cao, J.-L.; Liu, H.-L. Fluorescence excitation–emission matrix spectroscopy with regional integration analysis for characterizing composition and transformation of dissolved organic matter in landfill leachates. J. Hazard. Mater. 2011, 190, 293–299. [Google Scholar] [CrossRef]
  55. Zhang, W.; Lin, Y.; Zhang, Q.; Wang, X.; Wu, D.; Kong, H. Optimisation of simultaneous saccharification and fermentation of wheat straw for ethanol production. Fuel 2013, 112, 331–337. [Google Scholar] [CrossRef]
  56. Li, L.; Li, Z.; Song, K.; Gu, Y.; Gao, X. Improving methane production from algal sludge based anaerobic digestion by co-pretreatment with ultrasound and zero-valent iron. J. Clean. Prod. 2020, 255, 120214. [Google Scholar] [CrossRef]
  57. Geada, P.; Loureiro, L.; Teixeira, J.A.; Vasconcelos, V.; Vicente, A.A.; Fernandes, B.D. Evaluation of disruption/permeabilization methodologies for Microcystis aeruginosa as alternatives to obtain high yields of microcystin release. Algal Res. 2019, 42, 101611. [Google Scholar] [CrossRef]
  58. Lim, S.; Shi, J.L.; von Gunten, U.; McCurry, D.L. Ozonation of organic compounds in water and wastewater: A critical review. Water Res. 2022, 213, 118053. [Google Scholar] [CrossRef]
Figure 1. Effect of O3 (a), US (b), and O3-US (c) on the production of proteins and polysaccharides in the algae suspension.
Water 17 01614 g001
Figure 2. The effect of ozone dose on production of SCOD and consequent DDSCOD (a); and the ozone utilization rate, as specific SCOD production versus the initial ozone concentration (b) in the algae suspension.
Water 17 01614 g002
Figure 3. Production of SCOD by US (a,b) and O3-US (c,d), and consequent DDSCOD.
Water 17 01614 g003
Figure 4. Kinetic fitting of protein (a) and SCOD (b) release in O3-US experiments.
Water 17 01614 g004
Figure 5. The excitation–emission matrices of the algae suspension under different pretreatment conditions: blank (a), O3 (b), US (c), and O3-US (d).
Water 17 01614 g005
Figure 6. Response surface and contour plot for the interaction of ultrasonic time and ultrasonic density (a), ultrasonic time and ozone dose (b), ultrasonic density and ozone dose (c).
Water 17 01614 g006
Figure 7. SEM morphology of algae under different pretreatment conditions: control (a), O3 (b), US (c) and O3-US (d). Bars = 10 μm.
Water 17 01614 g007
Figure 8. Effects of different pretreatments on DNA in the algae supernatant (O3 (a), US (b), O3-US (c)).
Water 17 01614 g008
Figure 9. Concentration of algal toxins after different pretreatments.
Water 17 01614 g009
Table 1. Main physicochemical properties of the algal concentrate.
ParametersAverage
pH6.2
TS (Total Solid) (%)1.7
TSS (Total Suspended Solids) (g/L)17.4
VSS/TSS0.9
TCOD (Total Chemical Oxygen Demand) (mg/gTSS)1567.7
SCOD (Soluble Chemical Oxygen Demand) (mg/gTSS)45.2
Soluble Protein (mg/gTSS)3.1
Soluble Polysaccharides (mg/gTSS)9.2
Table 2. Response surface analysis factors and levels.
VariablesCodedMax & Min Levels
−101
Ultrasonic time (min)A102030
Sound intensity (W/mL)B246
Ozone dose (g/gTSS)C0.070.140.21
Table 3. Estimated constant Kp, Rm, and R2 statistical values for protein release and estimated constant Kc, Fm, and R2 statistical values for SCOD release in O3-US experiments.
ParametersKp
/(min−1)
Rm
/(mg/g TSS)
R2 StatisticalKc
/(min−1)
Fc
/(mg/g TSS)
R2 Statistical
0.14 g O3/g TSS + 2 W/mL0.06193211.10.9930.11532605.40.996
0.14 g O3/g TSS + 4 W/mL0.1383234.20.9920.25452741.40.995
0.14 g O3/g TSS + 6 W/mL0.15835239.20.9920.35847775.00.996
Table 4. Response-surface analysis design and experimental results.
Process GroupA: Ultrasonic Time
/(min)
B: Ultrasonic Density
/(W/mL)
C: Ozone Dose
/(g/g TSS)
DDSCOD
/(%)
12020.2156.0
22060.2169.9
33060.1469.7
41020.1445.1
52040.1465.2
62040.1464.9
73040.2169.2
82040.1465.1
92060.0765.6
101060.1466.2
112040.1465.2
123020.1457.3
133040.0767.2
142020.0749.1
152040.1465.3
161040.0755.6
171040.2166.0
Table 5. Regression model analysis of variance.
SourceSum of SquaresdfMean SquareF-Valuep-Value
Model844.90993.88197.35<0.0001
A109.821109.82230.86<0.0001
B514.561514.561081.72<0.0001
C75.52175.52158.76<0.0001
AB18.02118.0237.880.0005
AC13.73113.7328.860.0010
BC1.6311.633.420.1070
A23.4213.427.200.0314
B2104.081104.08218.79<0.0001
C20.463410.46340.97420.3565
Residual3.3370.4757
Lack of fit2.3330.77683.110.1510
Pure Error0.999540.2499
Cor Total848.2316
Disclaimer/Publisher’s Note: The statements, opinions and data contained in all publications are solely those of the individual author(s) and contributor(s) and not of MDPI and/or the editor(s). MDPI and/or the editor(s) disclaim responsibility for any injury to people or property resulting from any ideas, methods, instructions or products referred to in the content.

