Article

Photocatalytic Degradation Study of Paroxetine with g-C3N4 Prepared Using Different Precursors in Lab- and Pilot-Scale Conditions

by
Sotirios Sioulas
,
Christos Lykos
,
Ioannis Konstantinou
* and
Triantafyllos Albanis
*
Department of Chemistry, University of Ioannina, 45110 Ioannina, Greece
*
Authors to whom correspondence should be addressed.
Water 2025, 17(11), 1609; https://doi.org/10.3390/w17111609
Submission received: 27 March 2025 / Revised: 12 May 2025 / Accepted: 22 May 2025 / Published: 26 May 2025

Abstract

:
The degradation of pharmaceuticals in wastewater treatment plants (WWTPs), particularly the antidepressant Paroxetine (PXT), is a growing concern because their insufficient removal leads to their release in the aquatic environment, causing toxic effects on aquatic organisms. This study investigates g-C3N4 materials synthesized from urea, melamine, and thiourea, including thermally exfoliated variants, as potential photocatalysts for removing PXT from water and secondary-treated hospital wastewater (HWW). Comparative photocatalytic experiments under simulated solar radiation indicated that g-C3N4 prepared by urea (CN-U) and its thermally exfoliated form [CN-U(exf.)] were highly effective (100% removal in 45 min) depending on the degradation rate constants (0.036 and 0.085 min−1 in U.P. water, respectively), with the latter achieving the fastest PXT degradation at 200 mg/L (k = 0.112 min−1). The study also analyzed mineralization and transformation products (TPs) using liquid chromatography–high-resolution mass spectrometry (LC–HR-MS-Orbitrap) and assessed their ecotoxicity with ECOSAR (Version 2.2) software. Additionally, toxicity decreased following the photocatalytic processes, as revealed by the Microtox bioassay. Overall, CN-U and especially CN-U(exf.) show promise as eco-friendly photocatalysts for pharmaceutical removal from wastewater (WW).

Graphical Abstract

1. Introduction

Pharmaceuticals (Pharmaceutical Active Compounds—PhACs) and Personal Care Products (PCPs) are a large category of pollutants that enter the environment. Due to their widespread consumption and incomplete removal in urban and hospital WWTPs, their inflow into the environment is continuous, resulting in being detected even at high concentrations and characterized as “pseudo-persistent” pollutants. The most detectable PhACs in the environmental water bodies belong to the categories of antibiotics, psychotropic drugs, lipid regulators corticoids, and analgesics [1,2,3]. Their occurrence constitutes a threat to aquatic flora and fauna such as crustaceans, microalgae, fish, etc., even at deficient concentrations (μg/L to ng/L) due to the toxicity exerted by the parent compounds or their metabolites [4,5,6].
PXT (Figure S1), a Selective Serotonin Reuptake Inhibitor (SSRI), belongs to the antidepressant drug family and is used to treat clinical depression but also other types of compulsive disorders or dysfunctions of the human body such as chronic pain, eating disorders, etc. It has been clinically administered since the early 1990s [7,8,9]. Regarding the removal of PΧΤ in WWTPs, biological treatment is ineffective for high removal rates, as worldwide monitoring studies have reported PXT’s presence in the effluents [3,5,6,10,11,12,13]. Furthermore, Duarte et al. 2019 [14] mentioned that due to physicochemical characteristics and lipophilic nature, PXT can be adsorbed to the activated sludge, thus avoiding degradation by the microbial population.
In recent years, advanced oxidation processes (AOPs) have been widely and increasingly used to address water pollution as a single technique or combined with conventional methods such as biological treatment. Their low cost, environmental friendliness, and effectiveness make them robust techniques. Their characteristic feature is the in situ production of highly active chemical species (•OH, •O2, ROO•, etc.), which directly “attack” organic pollutants to degrade or even to mineralize them [15,16,17]. In this way, secondary pollution is also avoided, which occurs when techniques such as membrane filtration are used and where pollutants are transferred without degradation [18].
Among the most widely used AOPs, heterogeneous photocatalysis is widely studied, with TiO2 being the most tested catalyst, which is commonly used as a reference photocatalyst [19,20]. g-C3N4, an n-type semiconductor, represents a new-generation photocatalyst. Structurally, sp2-hybridized carbon and nitrogen atoms contribute to a two-dimensional polymer whose polymeric layers consist of s-triazine and tris-s-triazine units. Ideally, g-C3N4 has a molecular ratio of C/N = 3/4 [21,22,23]. Thermal polycondensation is usually conducted for its facile synthesis using various N-rich precursors (i.e., urea, melamine, thiourea). Characteristics such as thermal and chemical stability, low cost, insolubility in common solvents, non-toxicity, visible-light activation due to the small energy band gap (2.7 eV), and quantum yield even five times greater than TiO2 make g-C3N4 a promising photocatalyst [24,25,26]. Unfortunately, it is a photocatalyst that also faces limitations such as low specific surface area, rapid recombination of electron–hole pairs, and absorption in a small area of the visible light spectrum [26,27,28]. One simple and effective technique for enhancing the photocatalytic properties of g-C3N4 involves thermal exfoliation of the bulk g-C3N4. In this approach, the bulk g-C3N4 is heated further to weaken the Van der Waals interactions between the layers, forming 2D nanosheets. These nanosheets exhibit improved stability, quantum efficiency, water solubility, and enhanced electrochemiluminescent and photoelectrochemical properties. In addition, it is reported that these nanosheets pose a higher separation of the produced charges and plenty of active sites for pollutant degradation, while the charge migration routes to their surface are short. Thermal exfoliation occurs at temperatures of 500–600 °C and is environmentally friendly as it avoids using toxic solvents as in liquid exfoliation. Furthermore, it is low in cost and has high photocatalytic performance. However, it should be noted that depending on the precursor of the g-C3N4, the produced exfoliated materials do not have primarily similar physical and chemical properties [28,29,30,31,32].
Although g-C3N4 and its complex photocatalysts have been tested quite a bit in the degradation of organic pollutants on a laboratory scale, there are not many reports, to the author’s knowledge, on its use in pilot- or large-scale water purification applications [33,34,35,36,37]. To date, for large-scale photocatalytic applications, Concentrating Parabolic Collectors (CPCs) have demonstrated the best performance in the effective organic pollutants’ removal from water and ease of their installation due to some of their favorable characteristics, such as the parabolic geometry, the absence of tracking systems, and the operation ability in cloudy periods [38,39,40,41].
Considering all the above, this study presents the photolytic and photocatalytic degradation of the antidepressant drug PXT using g-C3N4 as the photocatalyst. The lab-scale experiments were conducted in ultrapure water and using simulated solar radiation, while for pilot-scale experiments, a CPC reactor (Figure S3) that contained secondary-treated HWW was irradiated with natural solar light. Specifically, PXT’s photocatalytic degradation and mineralization with g-C3N4 is studied for the first time, reinforcing the existing literature for photocatalytic pharmaceuticals’ removal by applying g-C3N4 in two different concentrations. In addition, TPs formed during the photolytic and photocatalytic processes were detected by ultra-high-resolution mass spectrometry, the ECOSAR software (Version 2.2) was used for estimating their ecotoxicity, while the TEST software (Version 5.1.2) for calculating the theoretical values for mutagenicity, bioconcentration factor, and developmental toxicity.

2. Materials and Methods

All the reagents, experimental procedures, and methods are provided in detail in the Supplementary Material. In summary, regarding the experimental procedures, the photolytic and photocatalytic degradation of PXT was conducted on a lab scale using a g-C3N4 catalyst prepared from the three different precursors and their exfoliated forms under simulated solar radiation and with substrates: U.P. Water and HWW. Correspondingly, on a pilot scale, experiments were performed on the photocatalytic degradation of PXT at environmentally relevant concentrations, utilizing HWW as a substrate with the two best-performing photocatalysts under natural sunlight (CPC reactor) and under UVA radiation (in-lab pilot reactor). The experimental procedures are summarized in a flowchart (Figure S2), which can be found in the Supplementary Material.

3. Results

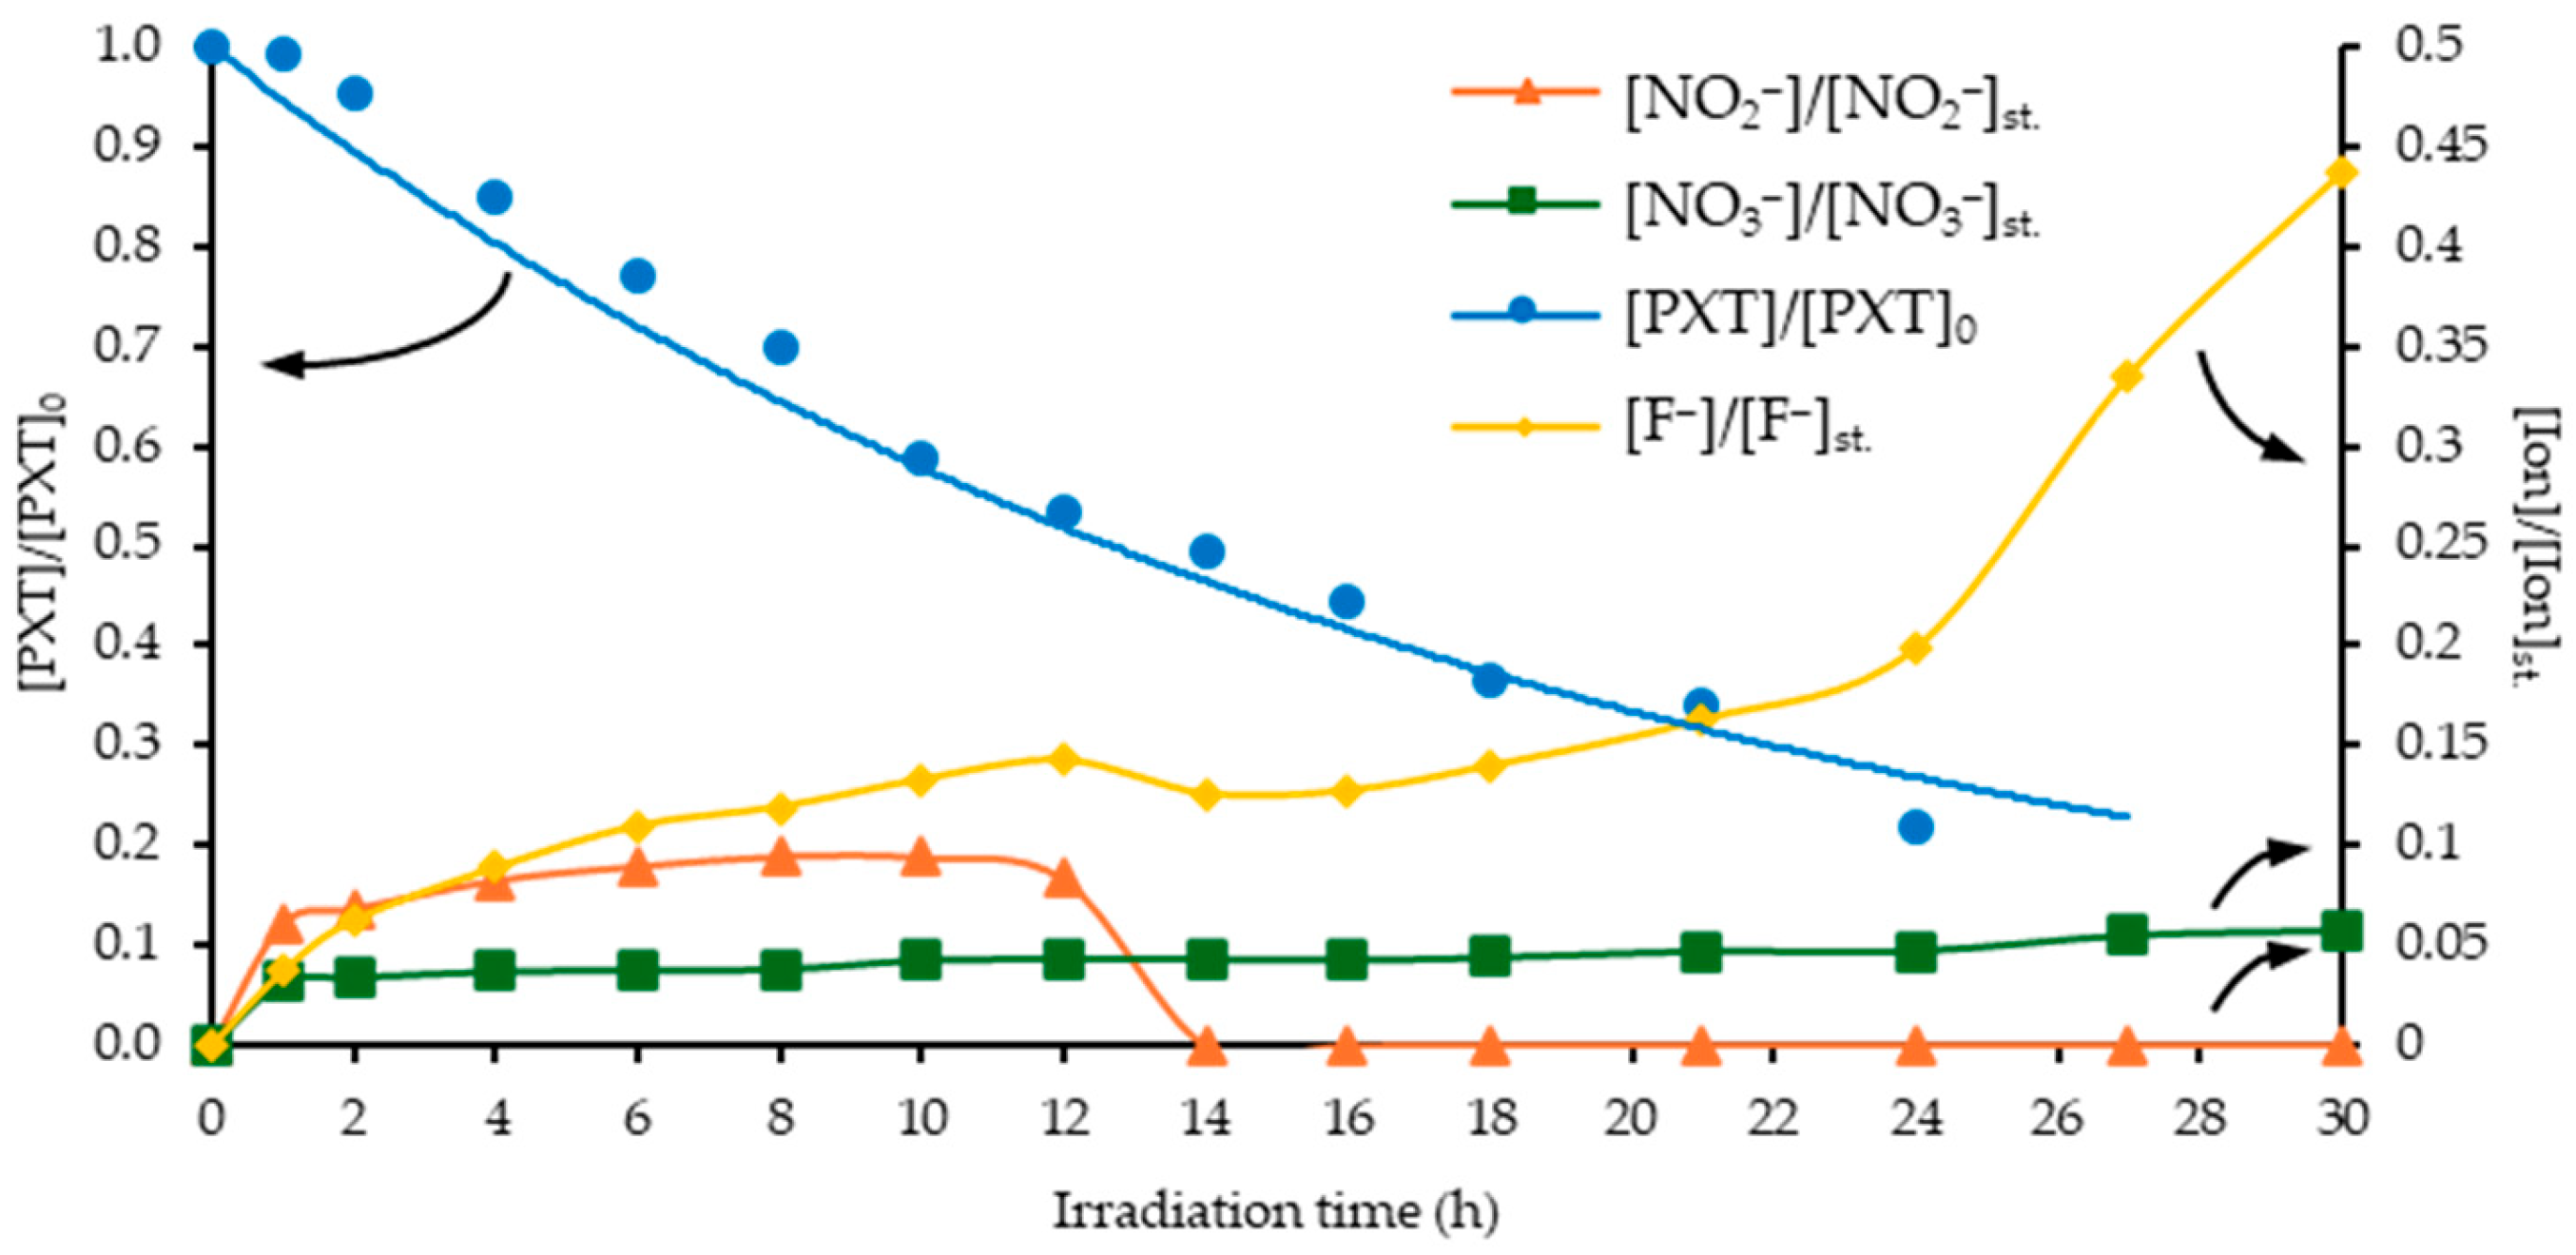
3.1. Preliminary Study of PXT’s Photolytic Degradation and Its Degree of Mineralization (Lab-Scale Experiments)

At first, PXT’s hydrolytic degradation was studied as a control experiment. After 50 days, PXT’s concentration (5 mg/L) remains stable under dark conditions in an ultrapure-water, lab-prepared solution at room temperature. By studying the photolytic degradation of PXT (5 mg/L) with simulated solar radiation, it is observed that the complete removal was reached after 27 h (Figure 1) following the pseudo-first-order kinetics (R2 = 0.9906, kapp = 0.055 h−1) and half-life of t1/2 = 12.60 h. Moreover, the degree of mineralization during the process was studied by determining the concentration evolution of total organic carbon (TOC) and F, NO2, and NO3 anions since PXT contains nitrogen and fluorine atoms in its molecule. The maximum anion concentrations that can be stoichiometrically derived from the complete oxidation of PXT (5 mg/L) are for [F]st = 0.288 mg/L, for [NO2]st = 0.698 mg/L and [NO3]st = 0.941 mg/L.
TOC showed no significant changes in its concentration, demonstrating phototransformation of PXT but not mineralization. Initially, observing the evolution kinetics of F (Figure 1), its production is constantly increasing, which indicates a detachment from the PXT molecule. After 6 h of irradiation, its concentration corresponds to 11% of the stoichiometrically available fluorine. Then, the production rate increased at a lower rate, resulting in 14% of the stoichiometric concentration after 18 h. However, a second abrupt step occurred till the end of the irradiation period studied (30 h), corresponding to 44% of the stoichiometric fluorine concentration. This condition can be explained by the formation of transformation products through fluorine substitution or detachment from the benzene ring.
Regarding the evolution kinetics of NO2, a sharp increase is observed from the first hour of irradiation, with its concentration corresponding to 12% of the stoichiometrically available nitrogen increasing gradually till eight hours, when it becomes 19%. Then, the NO2 concentration decreases slightly in the next 4 h (12 h of irradiation) and is not further detected after the 14 h experiment. In contrast to NO2, NO3 shows a lower release step after 1 h of irradiation corresponding to 6% of the stoichiometrically available nitrogen. Thereafter, its concentration increases at a slow rate, reaching approximately 12% of total nitrogen after 30 h of irradiation. The nitrite and nitrate anions are produced from the opening of the piperidine ring moiety through oxidation, while nitrite oxidation to nitrates occurred also during the irradiation period.

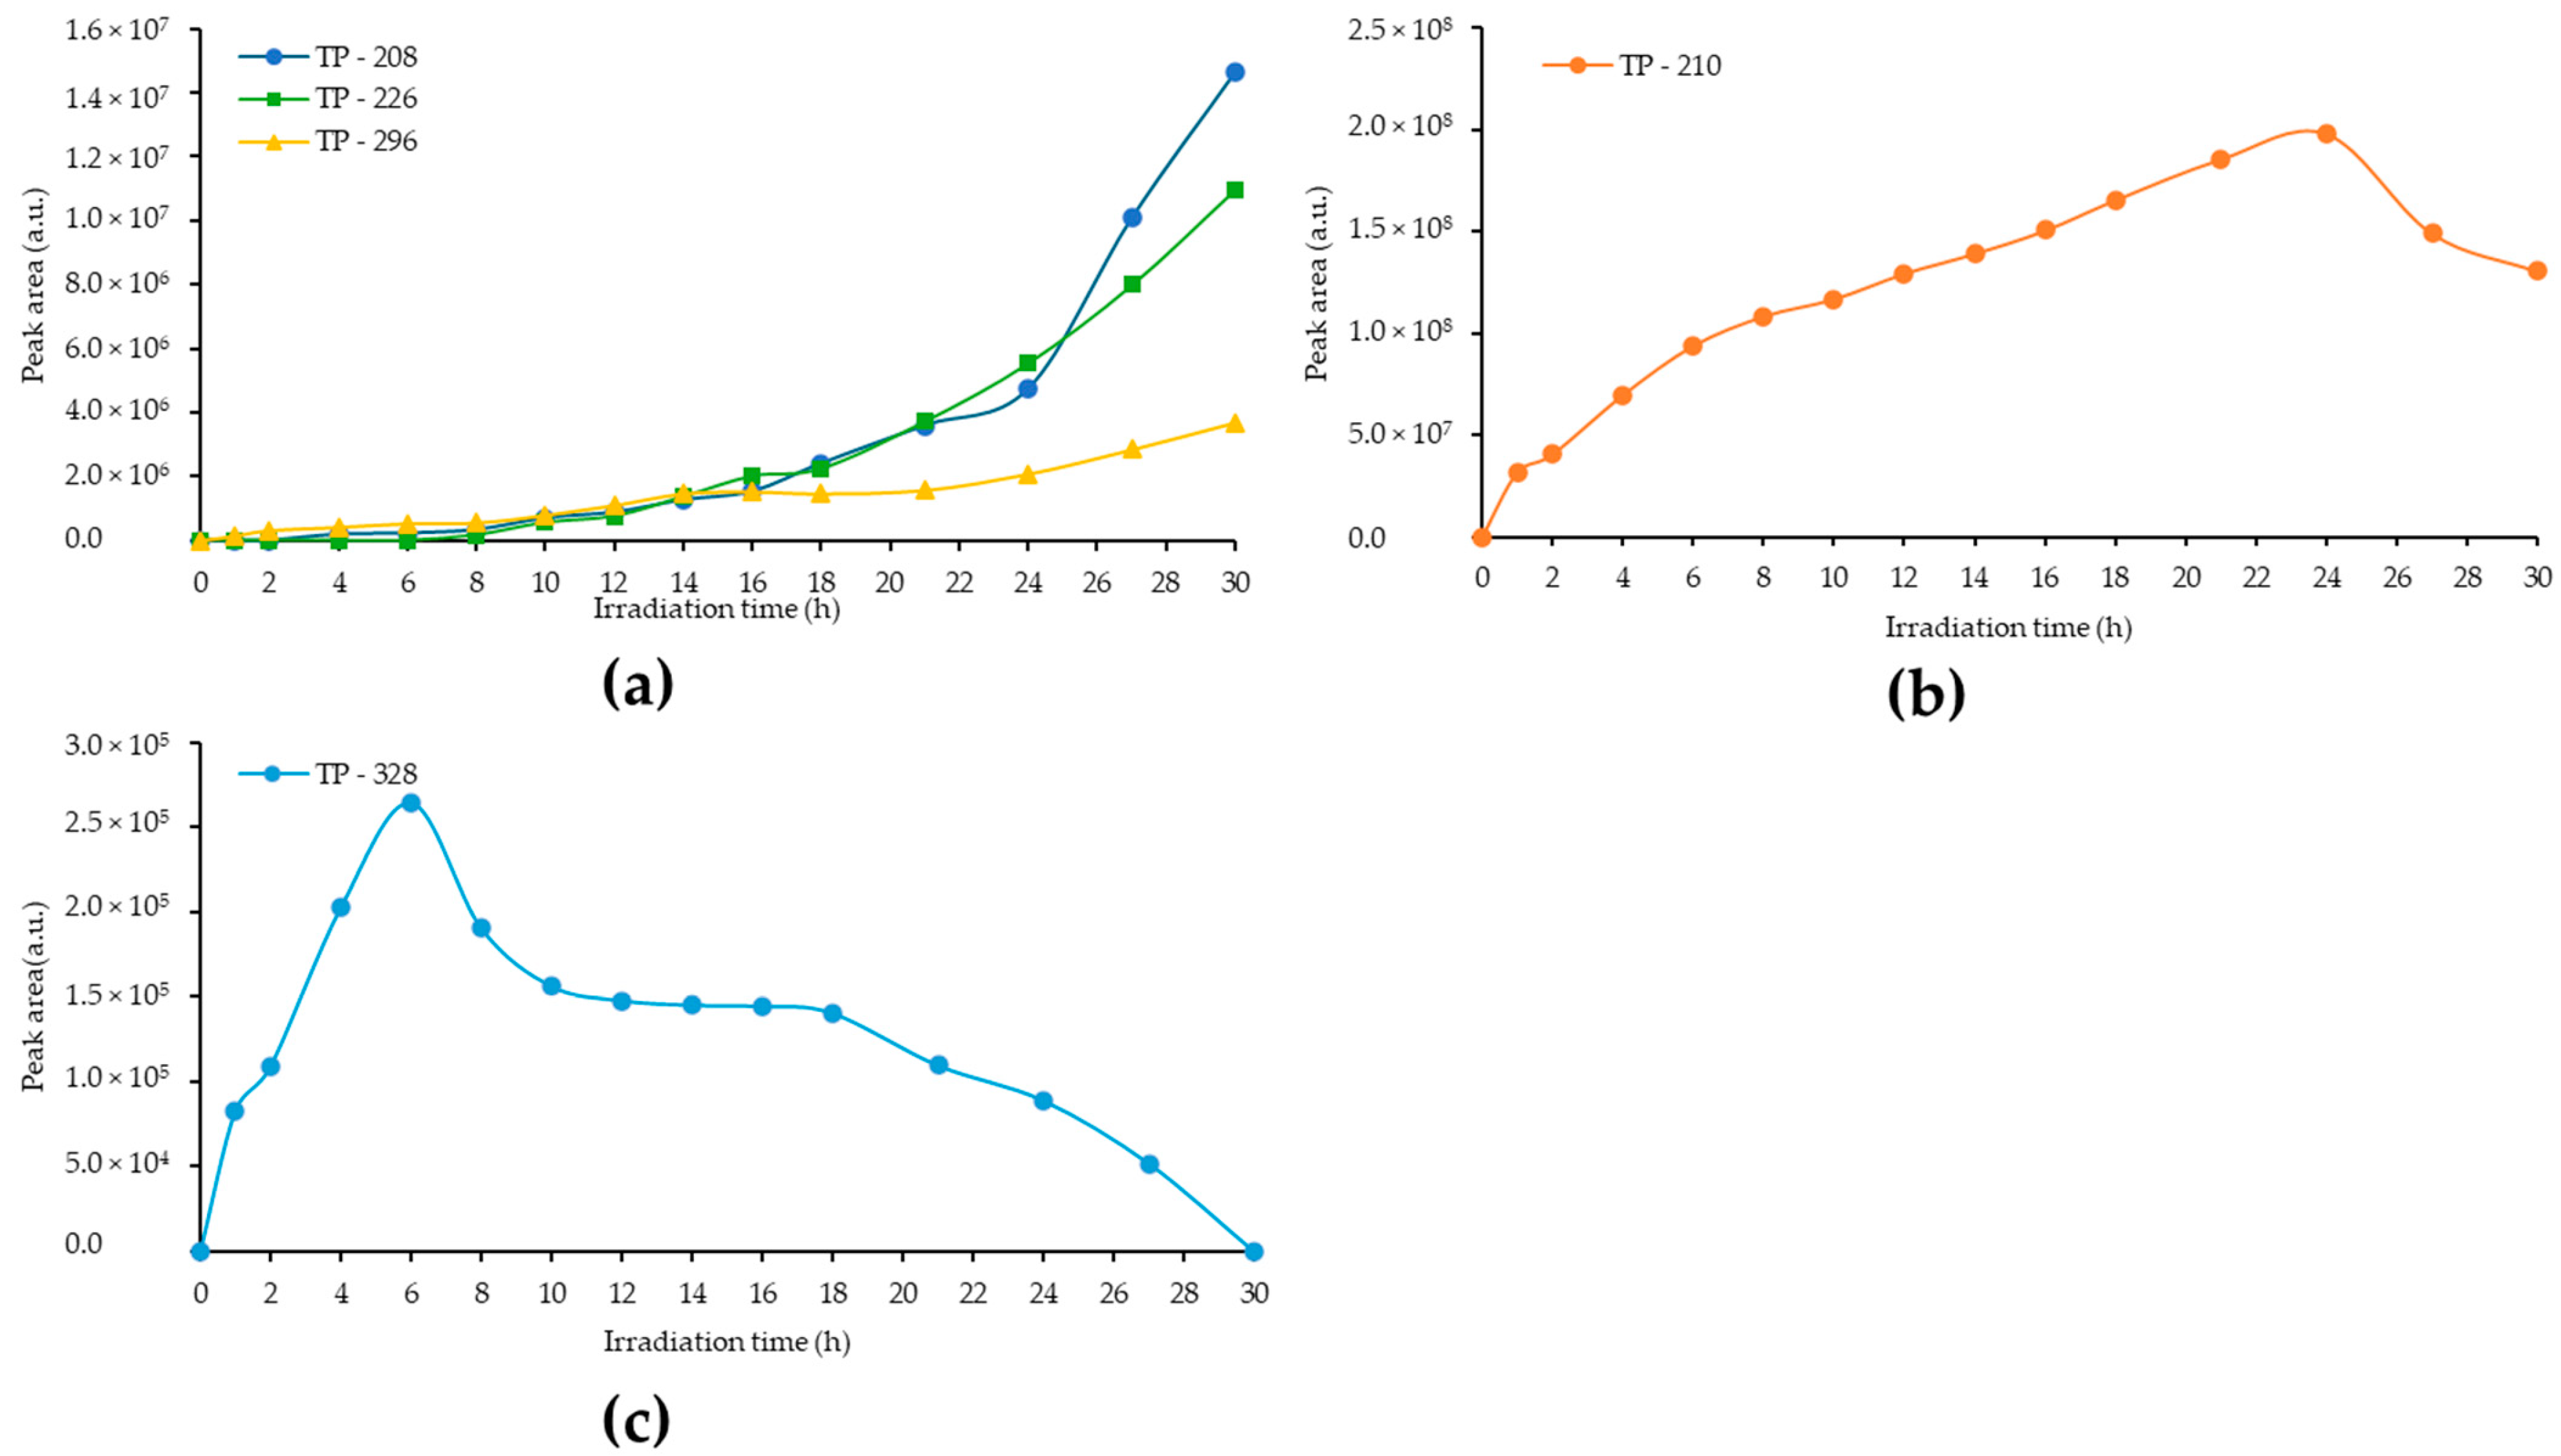
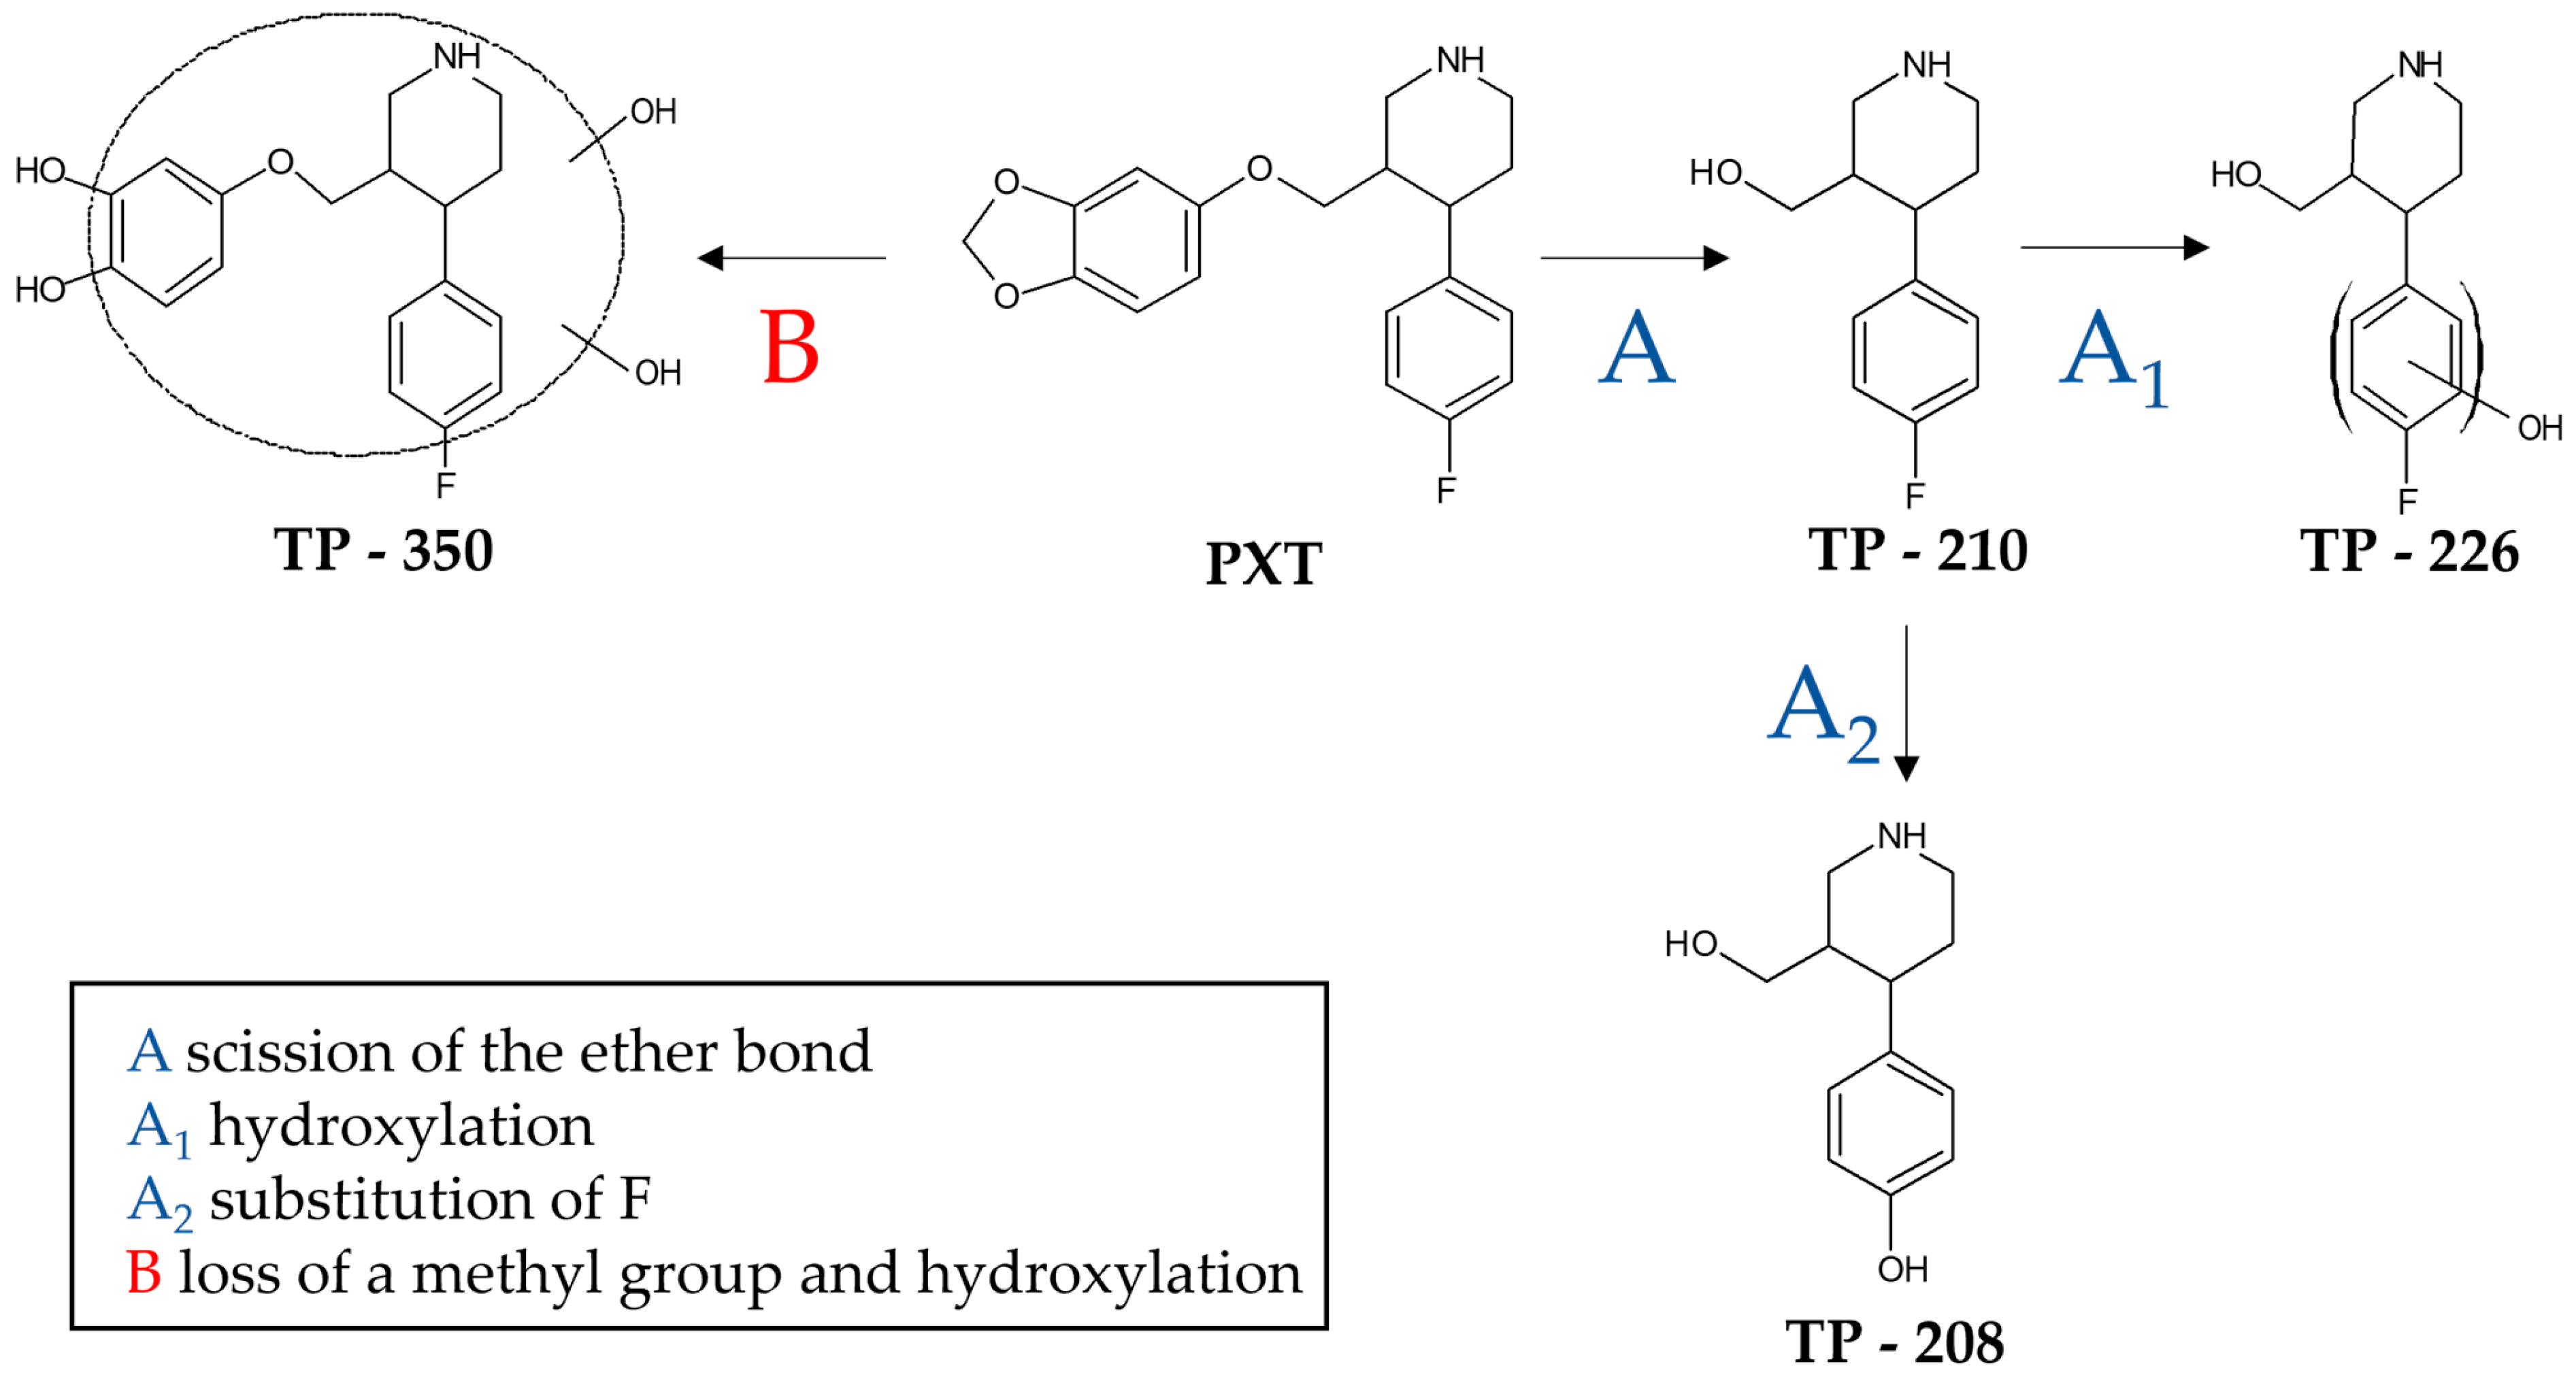
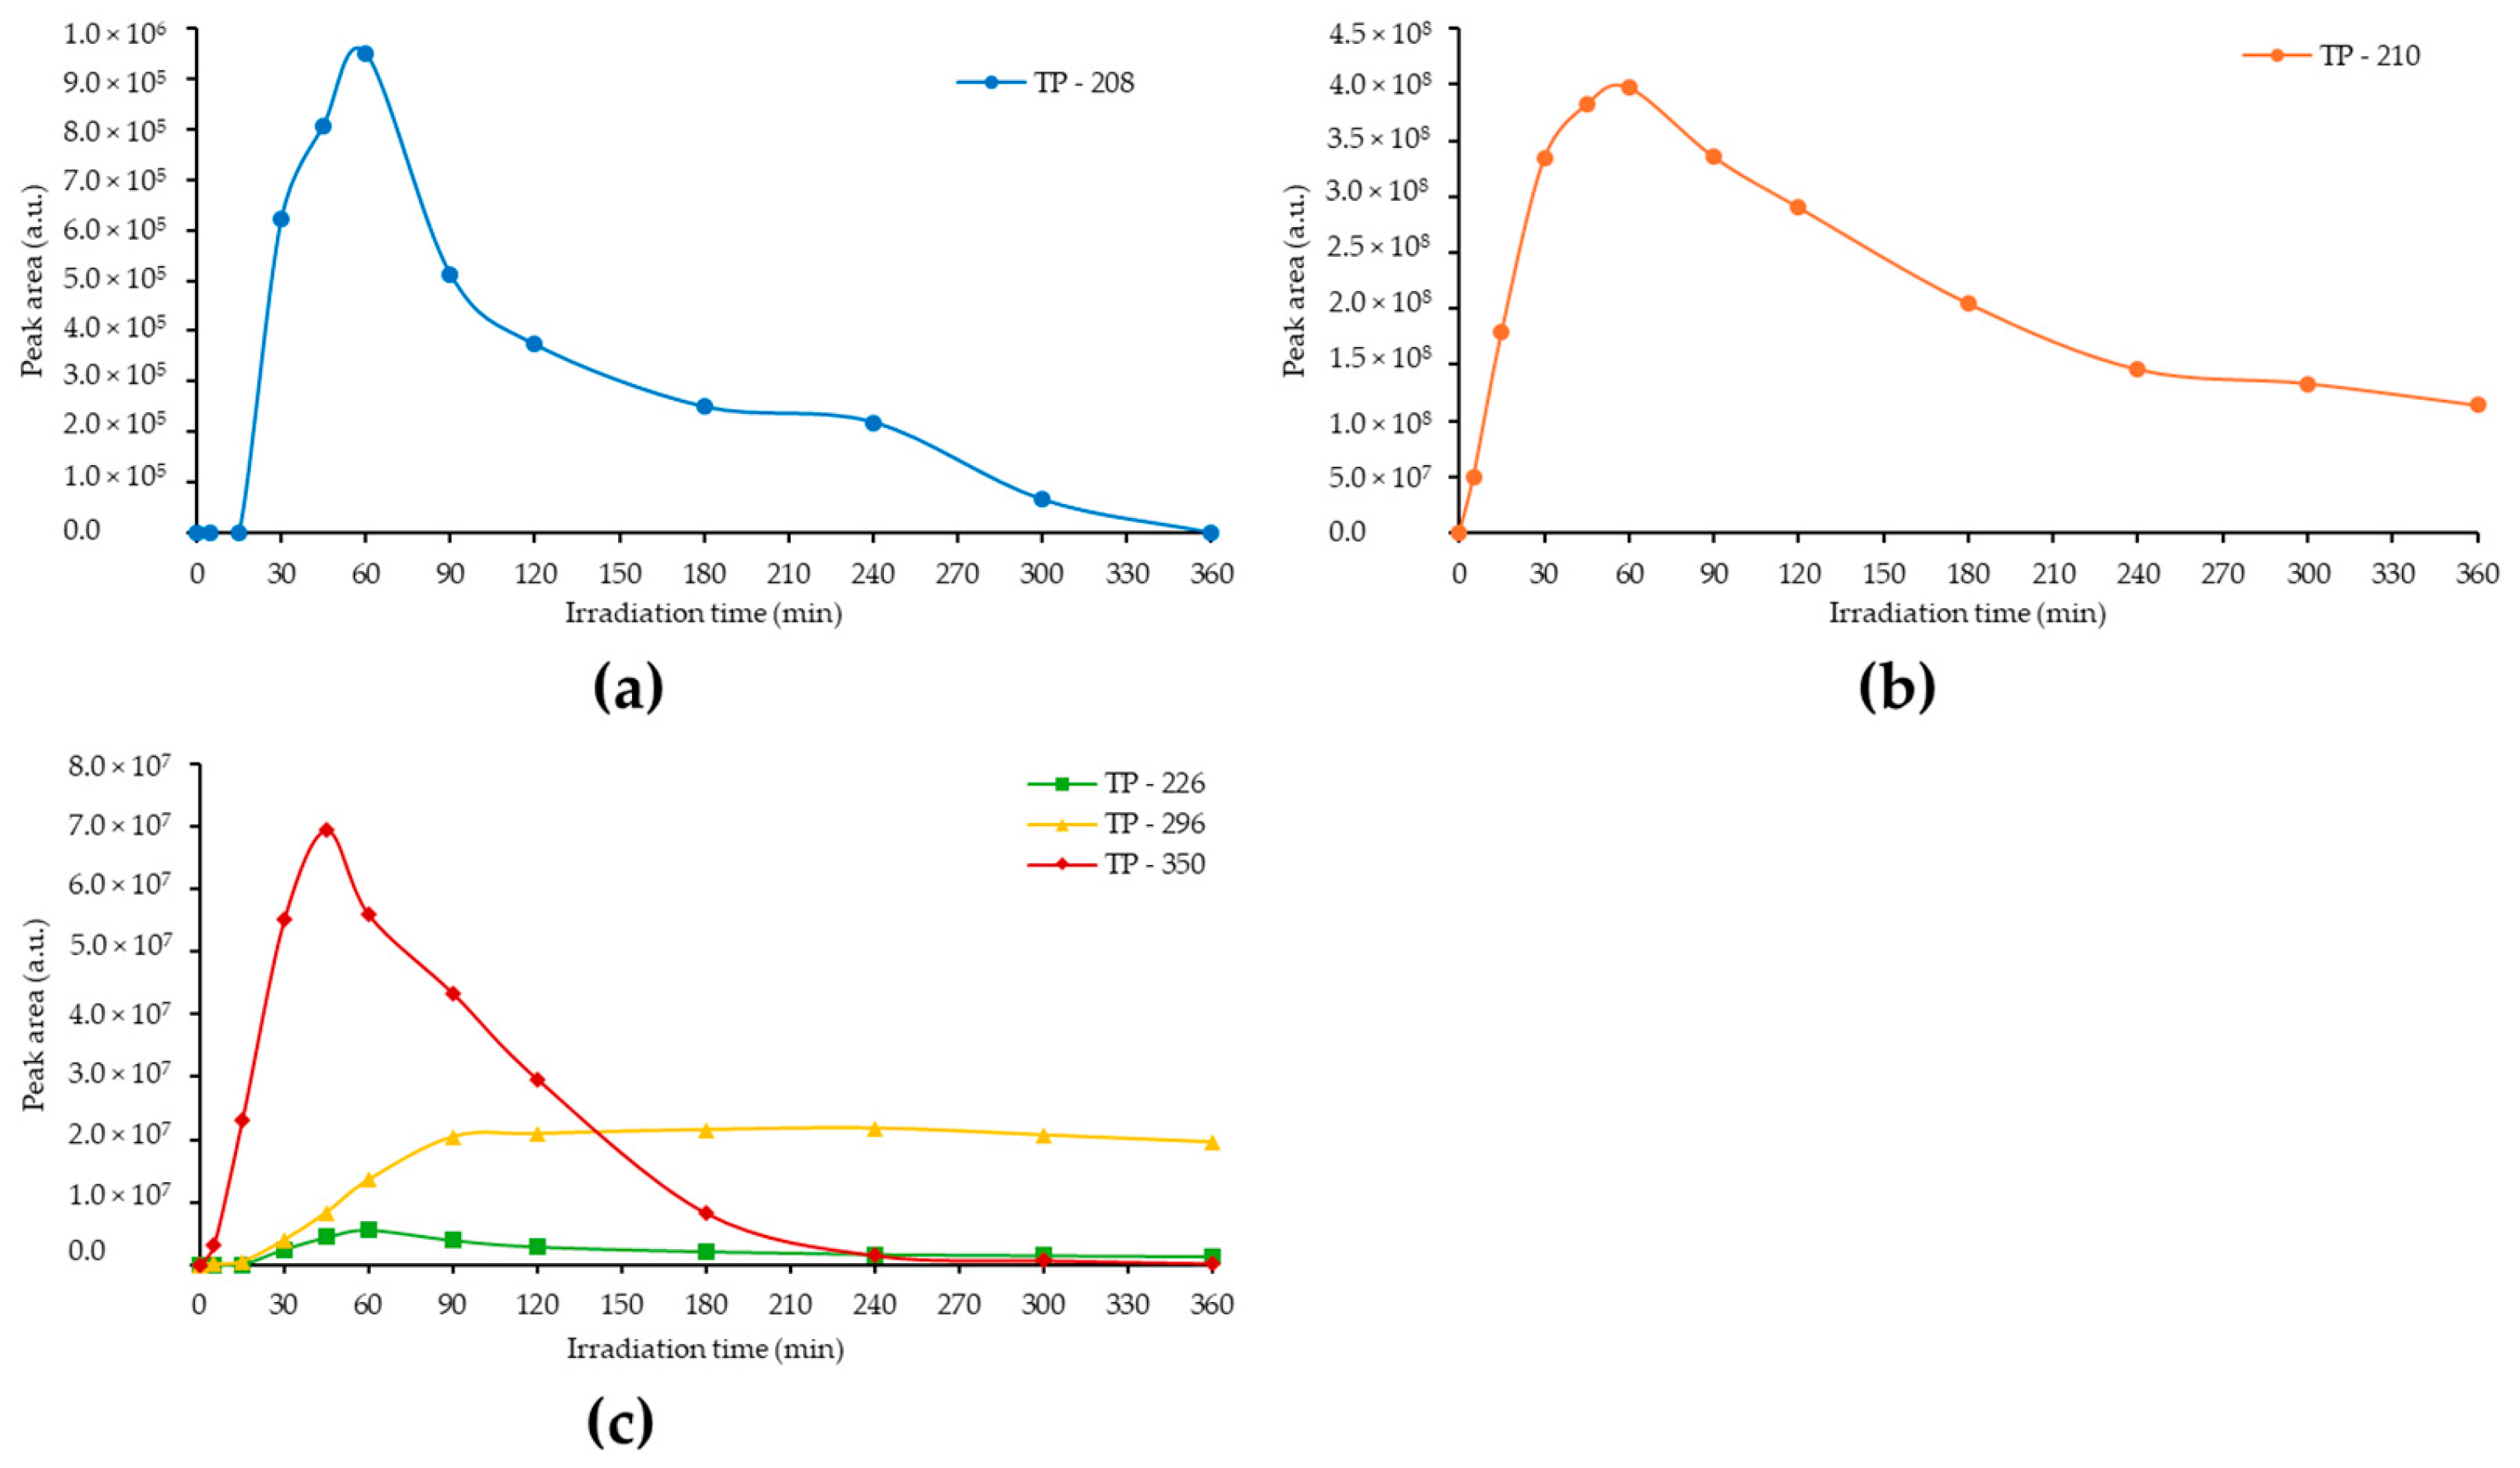
3.2. Identification of the Photolytically Produced TPs by High-Resolution LC–MS

During the photolytic degradation of PXT, five TPs were identified based on the retention time (Rt), m/z value, and relative abundance of their respective pseudo-molecular ions. The chromatograms and mass spectra are placed in Figure S4 and Figure S5, respectively, while Table S4 lists the data from the mass spectra processing. Of the five TPs detected, the most distinct and abundant was TP-210. It was eluted at 5.44 min and resulted from the loss of the benzodioxol moiety from the PXT molecule, differing from it by 120.0203 Da. Its structure was identified through the fragments with m/z = 192.1178, m/z = 163.0912, m/z = 123.0599, and m/z = 109.0444, which are characteristic and found in the molecule of the parent compound. Furthermore, this specific TP has been reported previously [7,42] in photolytic processes. Thus, TP-210 was assigned to 4-(4-fluoro-phenyl-)-3-piperidine-methanol.
Next, TP-208, which differs from TP-210 by 1.9960 Da and has a molecular formula of C12H18O2N, was identified. Compared to the molecular formula of TP-210, the fluorine atom of the benzene ring was replaced by a hydroxyl group, as evidenced mainly by the fragments with m/z = 121.0641 and m/z = 107.0482, which differ by about 2 Da from the corresponding fragments of TP-210 (m/z = 123.0599 and m/z = 109.0444) and their molecular formulas. Therefore, it was confirmed that the added hydroxyl group is located in the benzene ring in the place of fluorine, denoting a hydrolytic defluorination pathway.
TP-226 was eluted at 4.69 min with a molecular formula, C12H17O2NF, differing by 15.9943 Da compared to the molecular formula of TP-210, suggesting the presence of an extra oxygen atom in the structure. The added hydroxyl group is located in the benzene ring due to the existence of MS2 fragments with m/z = 139.0549 and m/z = 125.0393 and molecular formulas C8H8OF and C7H6OF, respectively. Furthermore, the same fragments, without the addition of oxygen, are found in the parent PXT compound with m/z = 123.0599 and m/z = 109.0443 and molecular formulas C8H8F and C7H6F, respectively.
TP-296, eluting at 6.45 min, was assigned to the molecular formula C15H19O4NF. PXT’s characteristic MS2 fragments m/z = 192.1180, m/z = 163.0911, and m/z = 123.0600 are also presented, while for the fragment with m/z = 210.1287, the molecular formula of TP-210 was proposed. For the fragment with m/z = 278.1181, the molecular formula C15H17O3NF was proposed, but despite the sufficient information obtained from the MS2 spectrum, it is not possible to propose a chemical formula for TP-296. The present accreditation contradicts the existing literature [7], which proposes C19H19ONF as the molecular formula of TP-296.
The last TP detected was TP-328 with m/z = 328.1537 and a molecular formula of C19H22O4N. This TP seems to arise from the substitution of a fluorine atom in the PXT molecule by a hydroxyl group, as happened in the case of the creation of TP-208 from TP-210. The fragmentation ion with m/z = 190.1222 and a molecular formula of C12H16ON is the same as reported for TP-208. Therefore, the hydroxyl group is located either in the piperidine ring or the benzene ring. In addition, the fragment with m/z = 151.0386 and a molecular formula of C8H7O3 was detected, which is a methoxy-benzodioxol moiety also present in the PXT molecule, originating from the cleavage of the ether bond, where there are three of a total of four oxygen atoms. Finally, the fluorine substitution in the benzene ring was confirmed by the fragments with m/z = 234.1120 and m/z = 217.0854, which have come from the cleavage of the bond between the benzene and piperidine ring, and the piperidine ring has been opened, and an ammonia molecule has been detached, hence the difference of 17.0266 Da between them. Three oxygen atoms were found in these fragment ions, so the fourth and final one will be found in the benzene ring, replacing the fluorine atom.
PXT’s proposed photolytic transformation pathway is depicted in Figure 2, and the evolutionary profiles of the TPs resulting from the semi-quantitative determination of the pseudo-molecular ions are presented in Figure 3. As observed from the evolutionary profile, TP-210 is detected in a much higher concentration than the other four TPs throughout the photolytic process. TP-208, TP-226, and TP-296 are produced in lower amounts, with their concentration continuously increasing until the end of the process. To be thoroughly degraded, these TPs require much longer irradiation times. The lowest concentration was observed for TP-328, which seems to be completely degraded after 30 h of irradiation. The last observation is related to the sharp increase in the concentration of TP-208 after 24 h of irradiation, which is explained by the cleavage of the ether bond in the TP-328 molecule and the additional production of TP-208 in addition to the primary pathway, which is the substitution of the fluorine atom by a hydroxyl group in TP-210.

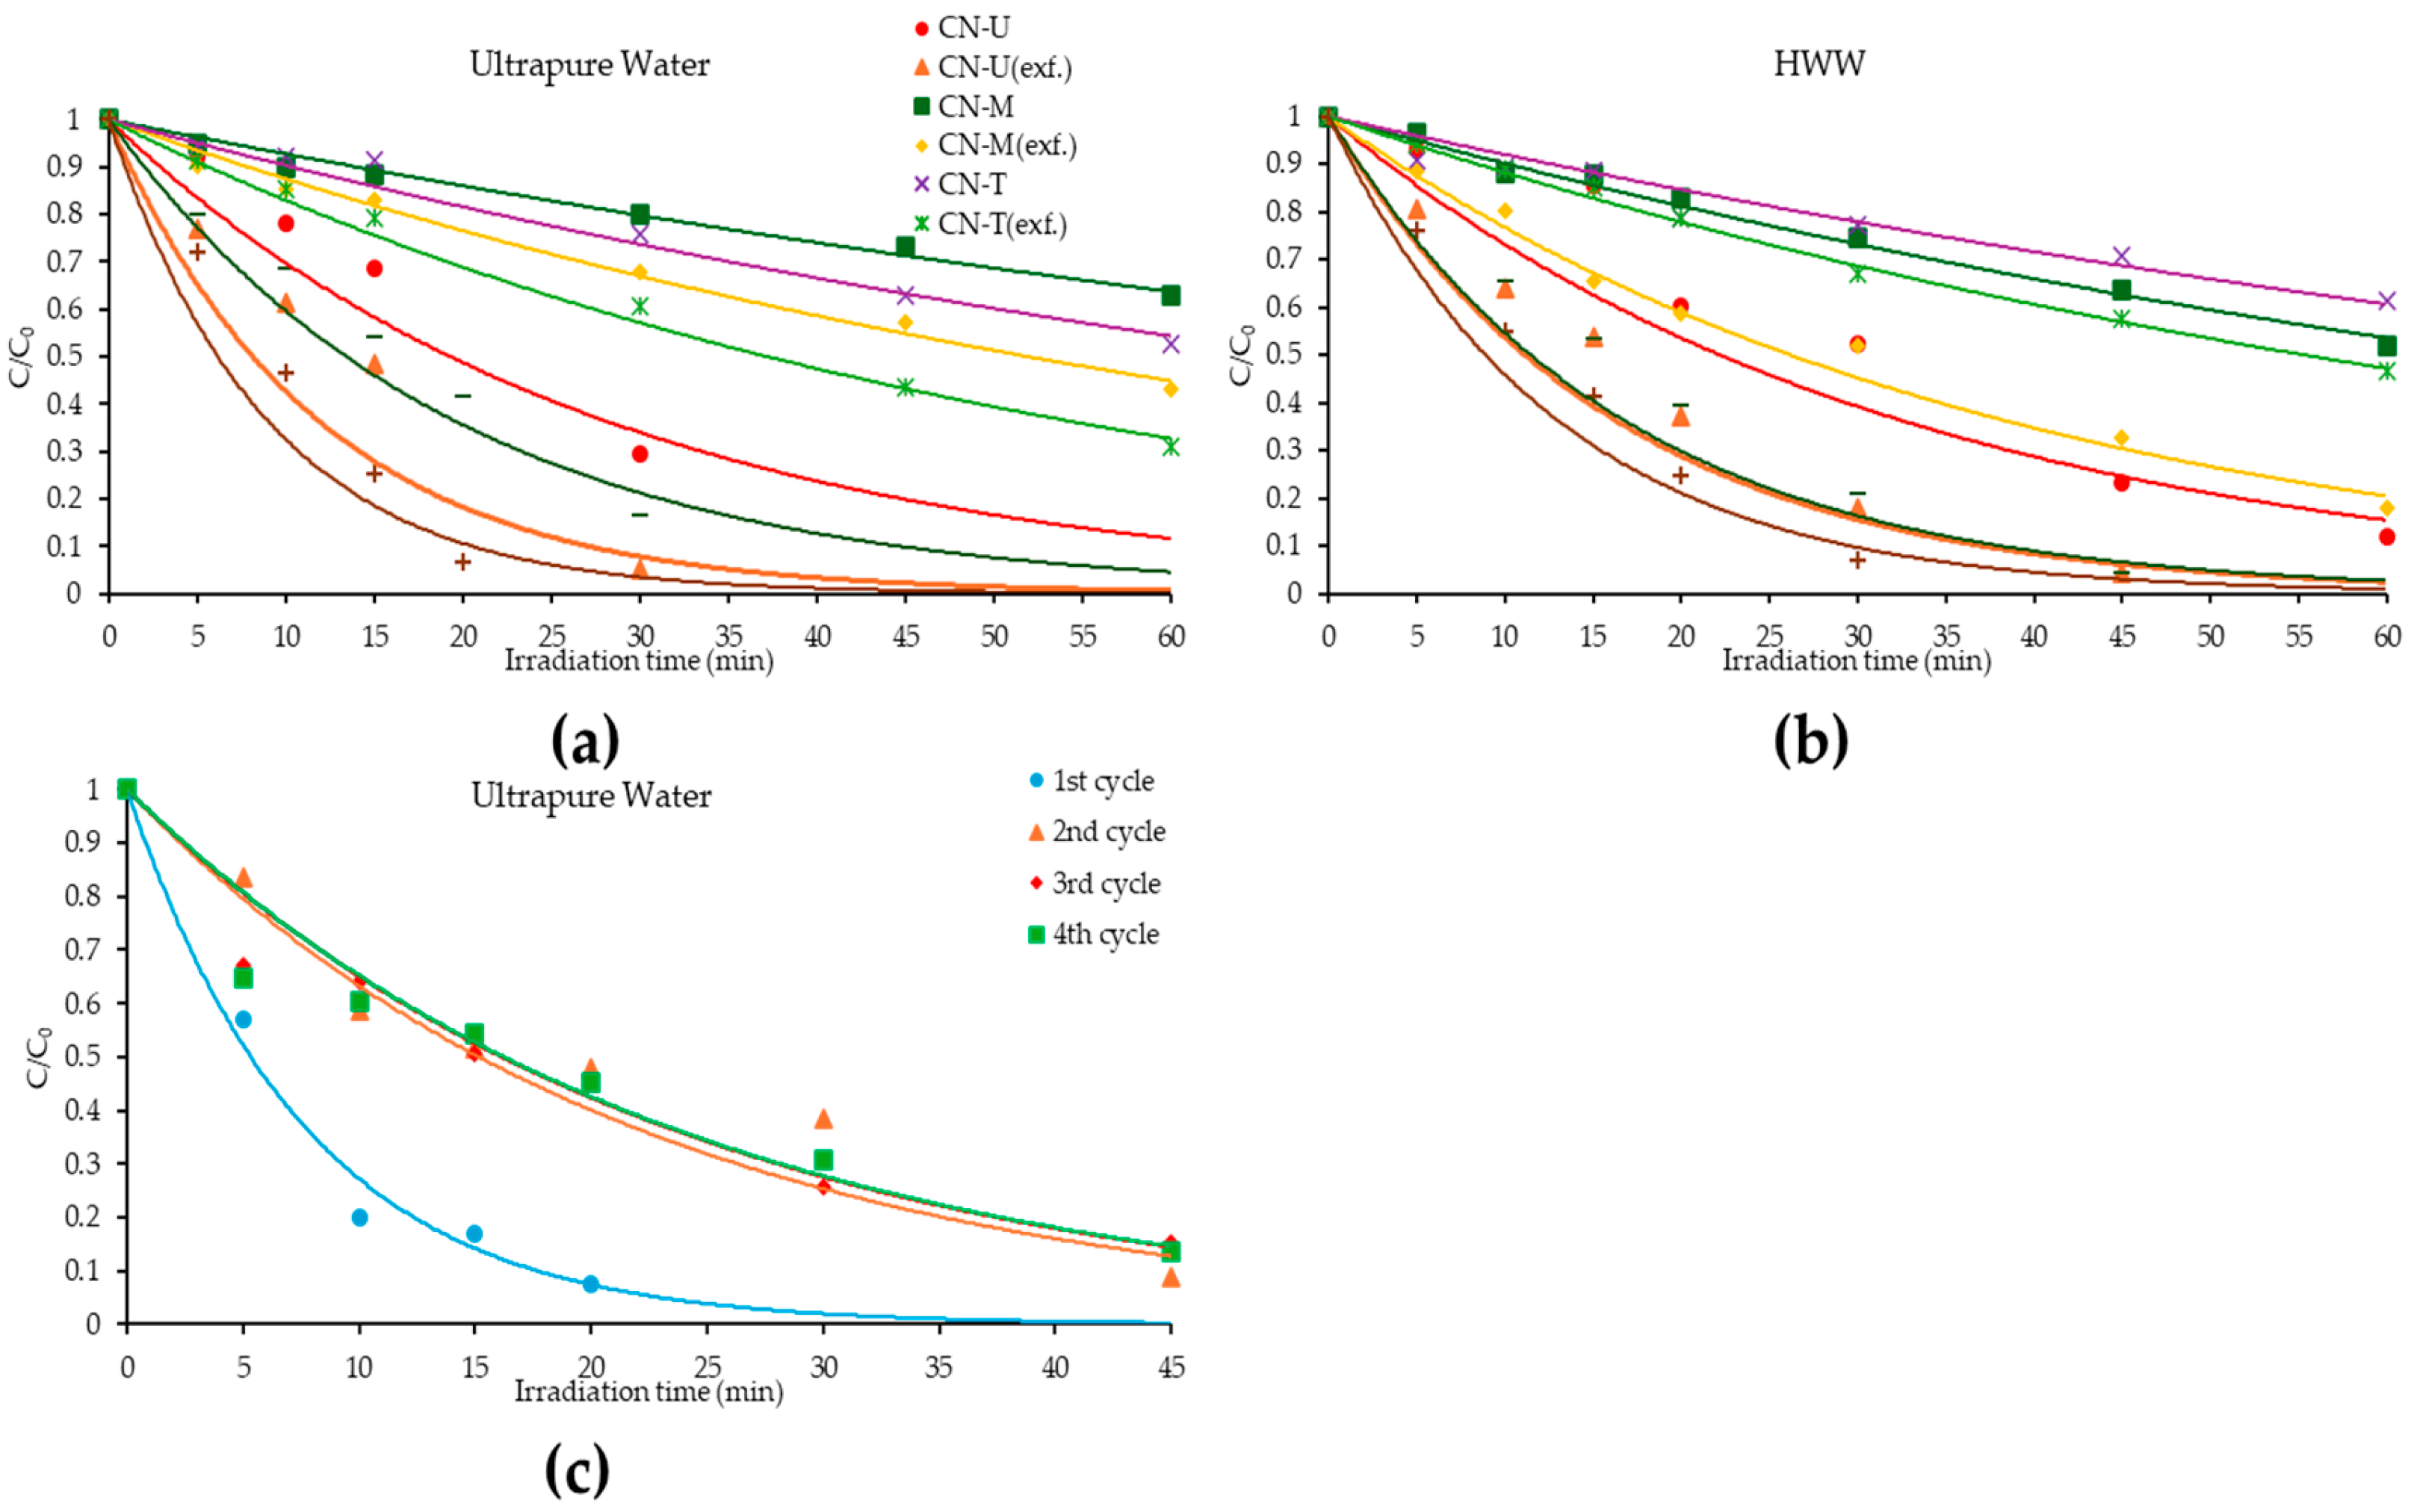
3.3. Photocatalytic Degradation of PXT with g-C3N4 in Lab-Scale Experiments

A total of six lab-prepared g-C3N4 materials (Figure S9) were tested as photocatalysts for the removal of PXT. All degradation kinetics (Figure 4) followed the pseudo-first model (R2 > 0.9). Among these types of g-C3N4, the most efficient in PXT removal in both ultrapure water and HWW substrates is CN-U(exf.), followed by CN-U, as shown in Table 1. To make a comparison, an experiment with TiO2 P-25 in a concentration of 200 mg/L was conducted in the same conditions and with U.P. water as a substrate to compare the CN-U’s photocatalytic efficiency in PXT’s degradation. Comparing the degradation rate constants, it is presented that CN-U (k = 0.052 min−1) is a little bit less efficient in PXT degradation than TiO2 (k = 0.074 min−1), but CN-U(exf.) shows a remarkable PXT removal (k = 0.112 min−1). The effect of the substrate does not appear to greatly affect the degradation of PXT based on the t1/2 values with the catalysts CN-U and CN-U(exf.) at either 100 mg/L or 200 mg/L concentrations.
One of the main reasons for the superior photocatalytic performance of graphitic carbon nitride prepared from urea, and by extension its exfoliated form, is its larger specific surface area and less bulk character compared to the other materials. It is also known that the specific surface area increases during the exfoliation process. This larger specific surface area allows for the adsorption of more pollutant molecules and their reaction with the active species for degradation, as well as greater utilization of photons to generate the active species. Furthermore, the exceptional photocatalytic activity of urea-derived g-C3N4 can be attributed to the reduced number of hydrogen bonds, a fact that leads to less bulk material and minimal structural defects [43,44,45].
However, in the case of the remaining catalysts, the effect of the substrate plays a more significant role. Characteristically, when using the catalysts CN-M and CN-M(exf.) and HWW as substrate, the pharmaceutical removal is faster compared to ultrapure water. HWW organic matter can act as a scavenger for oxidant species but also can photosensitize g-C3N4 by absorbing visible light and transferring the energy to g-C3N4, enhancing its photocatalytic activity. This process helps in generating more electron-hole pairs, which are crucial for photocatalytic reactions. g-C3N4 materials have shown significant adsorption capacities for the adsorption of humic and fulvic acids through electrostatic interactions, hydrogen bonding, and π–π interactions [46,47]. The two catalysts that presented the best performance in degrading PXT were studied at higher concentration levels (200 mg/L). Actually, the pharmaceutical’s removal rate becomes greater regardless of the substrate. Generally, the exfoliated materials seem to perform better in removing PXT from aqueous media, but CN-U(exf.) is pointed out as the best photocatalyst among those studied herein.
The degree of PXT’s mineralization was studied, first, in terms of monitoring the concentration of F, NO2, and NO3 anions. The maximum concentrations that can be stoichiometrically derived from the complete oxidation of PXT (10 mg/L) are for [F]st = 0.577 mg/L, for [NO2]st = 1.397 mg/L, and [NO3]st = 1.883 mg/L. The concentration of fluorine ions is gradually increased during the photocatalytic processes (Figure 5). Notably, in the case of using CN-U photocatalyst at 100 mg/L catalyst concentration level, the concentration of fluorine anions is higher at each sampling time compared to the respective catalyst concentration of 200 mg/L. At the end of the photocatalytic process, the concentration of F in the solution corresponds to 59% and 47% of the stoichiometrically available fluorine, respectively. This observation can be rationalized taking into account the adsorption of fluorine ions on the surface of the catalyst. When using the exfoliated catalysts fluorine ions were released into the solution at a higher rate for up to 90–120 min of irradiation in coincidence with the complete removal of PXT within the first 60 min of the process. However, thereafter the release rate is very slow due to competitive adsorption onto the catalyst’s surface. The thermal exfoliation of the bulk material resulted in a greater specific surface area, providing numerous sites for fluorine ions to adsorb. By the end of the process, the percentage of fluorine ions released with exfoliated CN-U photocatalyst concentrations of 200 and 100 mg/L reached 32.4% and 31% of the stoichiometric fluorine, respectively.
In the case of using CN-U, the concentration of NO2 anion is increased up to 90 min (catalyst’s concentration: 100 mg/L), corresponding to 5% of the stoichiometrically available nitrogen, and then decreases at a low rate until the end of the process, where the concentration corresponds to approximately 4%. This slight decrease is due to the oxidation of nitrite anions to nitrate. Moreover, it is noticed that after its production in the first 5 min of the process, its concentration remains practically unchanged until 45 min. Accordingly, in the process with a catalyst concentration equal to 200 mg/L, a gradual increase in NO2 concentration occurs until 90 min when the maximum concentration of the anion reaches approximately 6% of the stoichiometrically available nitrogen. From that moment till the end of the process, a decrease in concentration is observed at a slow rate, with the final concentration corresponding to 4.6%.
In contrast to CN-U, the concentrations of NO2 in the solution were significantly higher when using CN-U(exf.). This was particularly evident from 15 min of irradiation onwards. The release rate of nitrite anions is relatively fast till 90 min (similar to the behavior observed with fluorine ions and the same photocatalyst). After that time, the NO2 concentration continues to increase until the end of the photocatalytic process. At the end of the experiment, with a catalyst concentration of 200 mg/L, the nitrite anions’ concentration corresponded to 29.5% of the stoichiometrically available nitrogen. In comparison, the percentage was 20.4% when using 100 mg/L of CN-U(exf.). Overall, the evolutionary profile of NO2 concentration with the CN-U(exf.) catalyst suggests that the opening of the piperidine ring, the release of the nitrogen atom, and its oxidation to nitrite and nitrate anions are favored.
In Figure 5c, the evolution kinetics of NO3 ions is presented, and its concentration gradually increased throughout the process in both cases of catalyst concentration and with both catalysts. The highest release rate occurred with 200 mg/L CN-U. Thus, at the end of this specific process, the concentration of nitrate anions corresponds to 42% of the stoichiometrically available nitrogen. In contrast, with CN-U concentration equal to 100 mg/L, the NO3 concentration corresponds to approximately 23%. The proportional increase in nitrate ions with the rise in the catalyst’s concentration results from the opening of the piperidine ring, detachment of the nitrogen atom, and, afterward, its oxidation.
When the CN-U(exf.) catalyst is applied, the concentration of nitrate anions is significantly lower at each time point for both catalyst concentrations. Specifically, a linear increase in ΝO3 concentration is observed, especially from 60 min of the photocatalytic process until the end. Using catalyst concentrations of 200 and 100 mg/L mg/L, NO3 concentration in the solution corresponds to approximately 9% and 6% of the stoichiometric nitrogen. Similarly, with a catalyst concentration, the nitrate concentration corresponds to approximately. Again, the larger specific surface area of the exfoliated catalyst compared to CN-U, as was referred to in [44,45], might facilitate adsorption onto its surface. As regards TOC, 21% and 28% removal was determined after 180 min of irradiation and 200 mg/L catalyst loading, for CN-U and CN-U(exf.), respectively.

3.4. Reusability of CN-U(exf.) (Lab-Scale Experiments)

Figure 4c and the data from Table 2 both show a rapid degradation of PXT and complete removal after 30 min of irradiation in the first cycle (k1st cycle = 0.13 min−1). In the second photocatalytic cycle, the drug’s removal rate decreases to approximately 1/3 (k2nd cycle = 0.046 min−1), and there is no substantial decrease in the rate constant value from the second to the fourth cycle (k3rd cycle = k4th cycle = 0.043 min−1). Catalyst partial deactivation in the first cycle, followed by relative stability in subsequent cycles, is an interesting phenomenon that can be explained by various effects. Firstly, “surface cleaning”, where impurities or weakly bound species are removed during the first cycle, can be suggested. Secondly, the first cycle can lead to the formation of more stable active sites. Finally, the formation of a passivation layer on the catalyst surface during the first cycle can protect the catalyst from further deactivation, leading to stable performance in subsequent cycles [48,49].

3.5. Scavenging Study of the Photogenerated Reactive Species with CN-U and CN-U(exf.)

In the photocatalytic degradation of PXT, p-benzoquinone (p-BQ), tert-butanol (t-BuOH), potassium oxalate, and sodium azide were introduced to examine the main species involved: anionic superoxide radicals (•O2), hydroxyl radicals (•OH), positive holes (h+), and singlet oxygen (1O2), respectively [50,51]. Examination of the degradation kinetics shown in Figure 6, along with the kinetic parameters listed in Table S5, indicated that all scavengers significantly reduced the degradation of PXT, demonstrating the synergistic effect of all produced active species in the degradation of the drug in question. In fact, very small differences are observed in the rate of drug removal when the same scavenger is applied for the two different catalysts, proving that they function in the same way. The greatest inhibition in the degradation of PXT occurs when sodium azide is added to the solution, which primarily traps singlet oxygen while, to a lesser extent, also reacting with hydroxyl radicals. In addition, the drug’s degradation is influenced by positive holes, whose action is inhibited by the presence of potassium oxalate, resulting in a decreased rate of drug degradation. Finally, the least effect on the degradation of PXT for both catalysts is observed with tert-butanol, which scavenges hydroxyl radicals, indicating that they are not produced in significant amounts by these specific photocatalysts.

3.6. Detection and Identification of the Photocatalytically Produced TPs with CN-U and CN-U(exf.)

Five TPs were detected (Figure 7). Four of them have already been identified in PXT photolysis: TP-208, TP-210, TP-226, and TP-296. TP-350 with m/z = 350.1392 was assigned to the molecular formula C18H21O5NF. It seems to be formed after the substitution of two hydrogen atoms by two hydroxyl groups in PXT’s molecule and the opening of the benzodioxol moiety, as has been reported in the existing literature [7]. Fragment ions with m/z = 332.1286 and m/z = 306.1492 are formed after losses of H2O (18.0106 Da) and CO2 (43.9900 Da). Fragment ions (i.e., m/z = 192.1180, m/z = 178.1027, m/z = 163.0916, m/z = 123.0601, and m/z = 210.1287) are not indicative of the location of the added hydroxyl groups in TP structure.
Figure 8 presents the evolutionary profiles of the TPs produced in the faster photocatalytic process of PXT’s degradation with CN-U (200 mg/L), resulting from the semi-quantitative determination of the pseudo-molecular ions. According to these profiles, TP-210 is the one that, as in the photolytic process, is detected in a higher concentration than other TPs. In addition, the only TP that ceases detection after 360 min of irradiation is TP-208. Finally, the evolutionary profile of TP-296 presents a maximum concentration at 90 min; the concentration remains relatively unchanged until 300 min, where it decreases slightly until 360 min. In contrast, the evolutionary profiles of the remaining TPs show a maximum; after that time, their concentration is reduced till the end of the experiment.

3.7. In Silico Ecotoxicity Assessment (Lab-Scale Experiments)

Table S6 presents the theoretical acute (LC50, EC50) and chronic toxicity (ChV) values of PXT for fish, daphnids, and green algae. Depending on the acute and chronic toxicity levels, PXT and its TPs were categorized as Very Toxic, Toxic, Harmful, or Not Harmful according to the Globally Harmonized System of Classification and Labeling of Chemicals (GHS). For TPs whose functional groups were not precisely determined, the mean values for toxicity, mutagenicity, and bioconcentration factor were calculated by placing the functional group at every possible position on the molecule. Unfortunately, no conclusion can be drawn on the ecotoxicity of TP-296, as its molecular formula could not be suggested.
Data indicate that PXT is a very toxic compound for daphnids and green algae. In the case of fish, PXT is toxic for them after short exposure and very toxic in chronic exposure. Interestingly, TP-208 is non-harmful to the fish in its brief exposure to them. However, all the TPs detected are either very toxic or toxic to the aquatic organisms mentioned above, according to their Chronic Toxicity values. As noted previously, except for TP-208 concerning fish, all of them pose either high or lower risk for the same organisms regarding acute toxicity values.
Mutagenicity assessment is also crucial to determine toxicological risk due to potential harm and carcinogenicity. The Ames test is the standard in vitro mutagenicity assay used for evaluating chemicals due to its cost-effectiveness, and QSAR models are used to predict mutagenicity for new or data-lacking chemicals [52,53,54]. It has been established that PXT does not have any mutagenic potential from Figures S6 and S7, and it has been observed that TPs formed during photolytic and photocatalytic transformation are unlikely to cause mutagenic reactions, except for TP-210 and TP-226.
Bioconcentration factor (BCF) estimation is crucial in assessing the ecological risk of chemical contaminants. It provides information about a chemical’s propensity to accumulate in living organisms through aquatic environments’ respiratory and dermal routes. It is worth noting that dietary intake is not considered. However, obtaining BCF through experiments can be challenging for many pollutants. Therefore, predicting BCF through modeling is necessary [55,56,57]. Based on the predicted BCF values for PXT and its TPs, the TPs are less likely to accumulate in aquatic organisms than in the parent compound. This means that during photolysis and photocatalysis, the TPs produced are less likely to cause harmful toxicological effects in higher trophic levels.
Regarding developmental toxicity, PXT and all the TPs formed were characterized by the TEST software as “developmental toxicant”, as the predicted values for all compounds are >0.5.

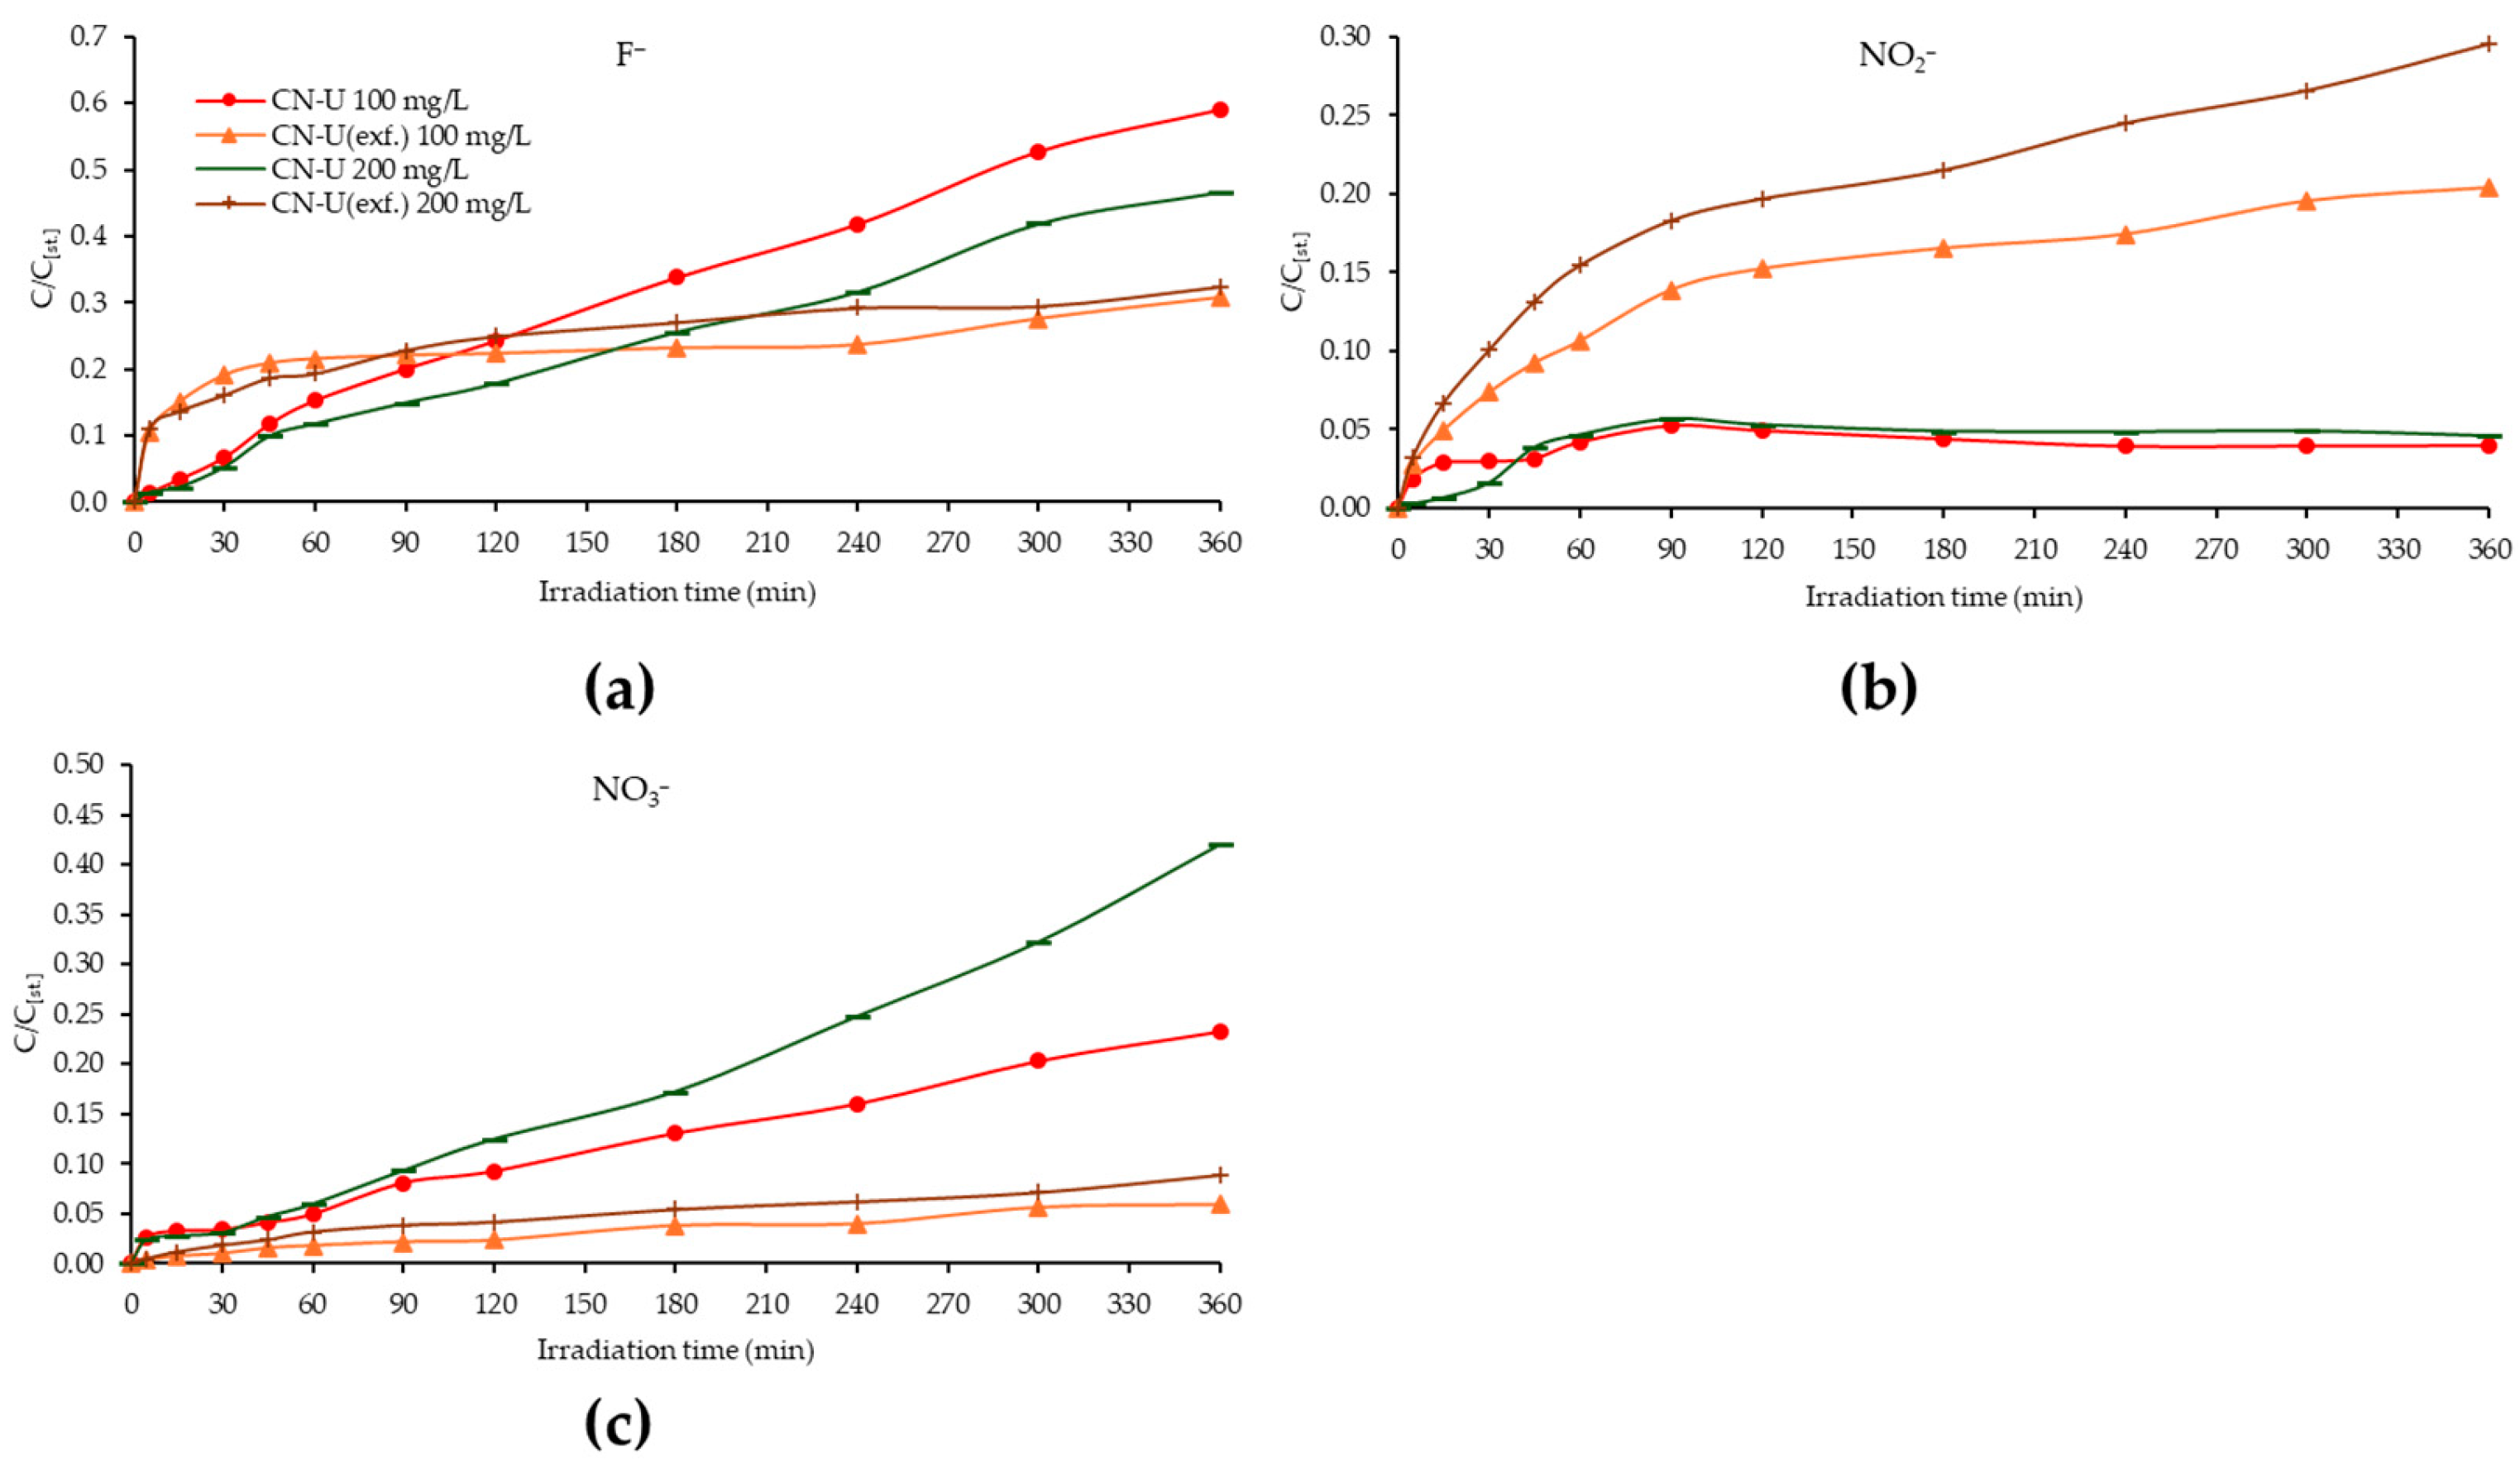
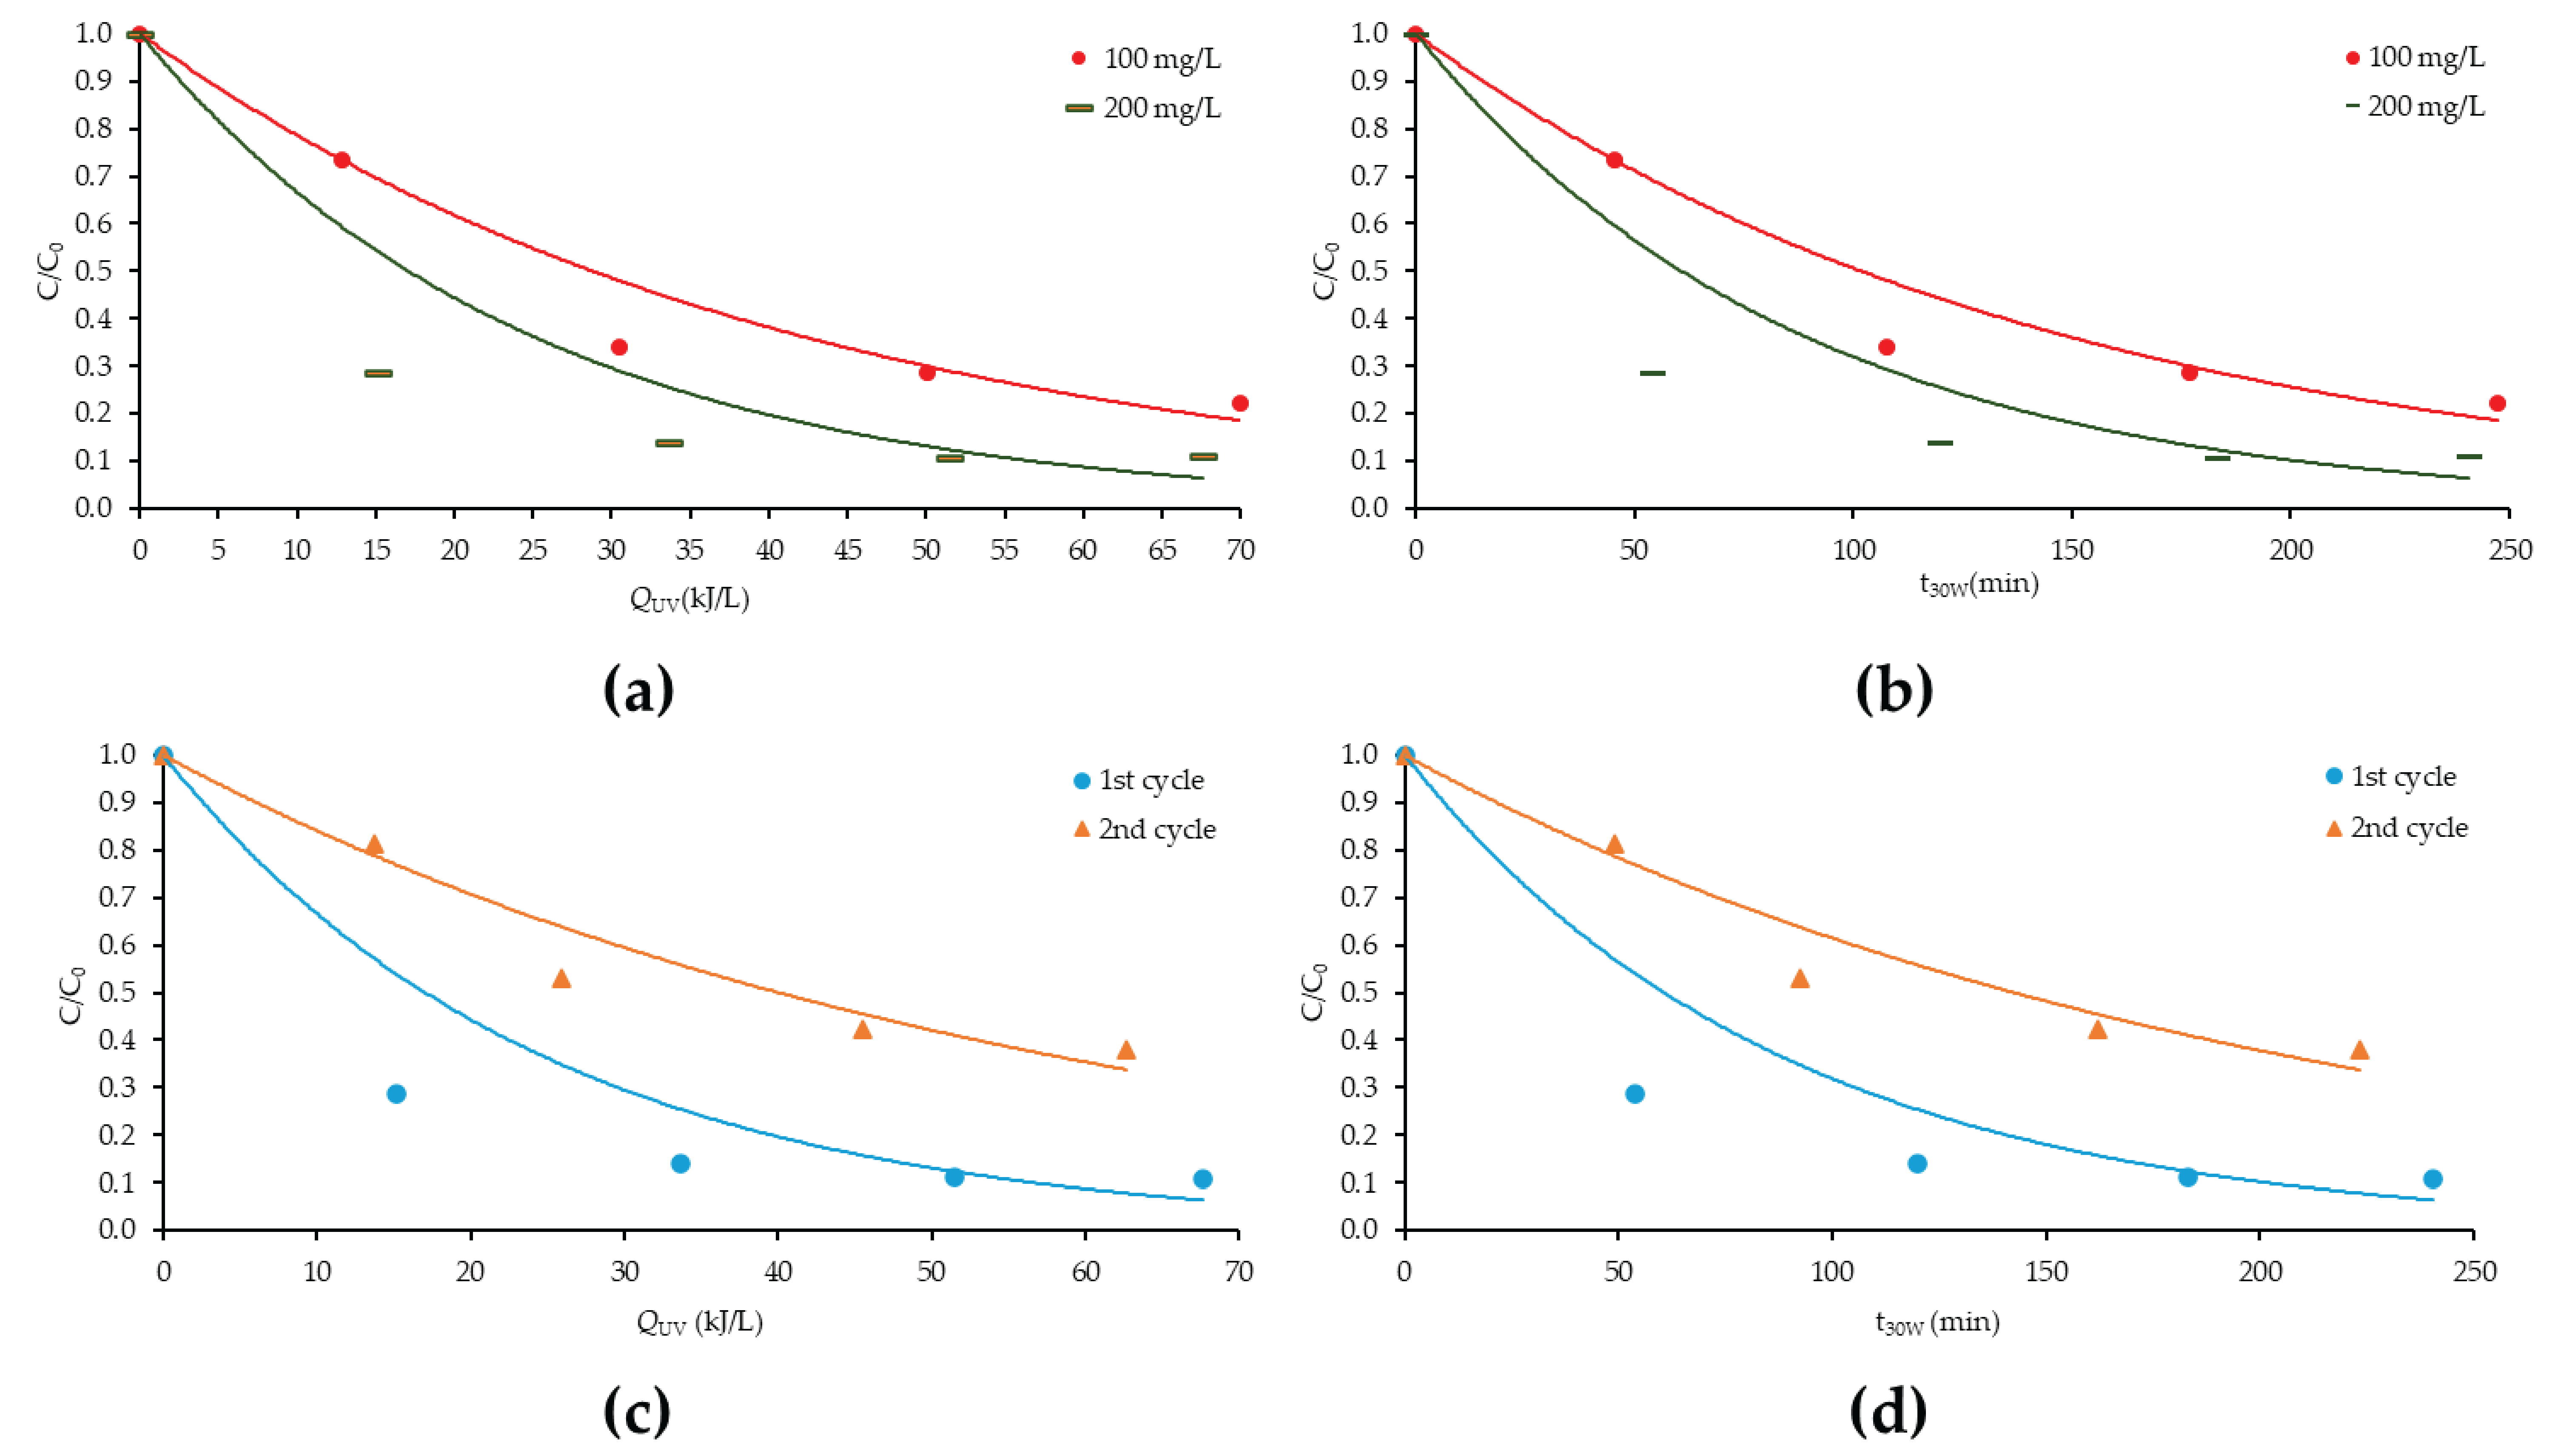
3.8. Photocatalytic Degradation of PXT with CN-U(exf.) in Lab Pilot-Scale Trial in Environmentally Relevant Concentrations

To further evaluate the activity of the catalyst CN-U(exf.) in the removal of PXT in more realistic conditions (initial concentration 20 μg/L, a larger volume of WW compared with lab-scale conditions), and despite its lower mass production yield, a photocatalytic experiment was carried out in the photoreactor Ecosystem ACADUS (Mod. 10/85). With a catalyst’s concentration of 100 mg/L, PXT was totally removed after 60 min of irradiation with a rate constant equal to 0.034 min−1 and its degradation kinetics fitting the pseudo-first-order model as depicted in Figure S8 and the kinetics parameters placed in Table 3. Additionally, the physicochemical parameters (Abs254, Total Phenols, BOD5, and COD) measured before and after the substrate’s treatment (Table S7) show better quality substrate production (more details are provided below).

3.9. Photocatalytic Degradation of PXT with CN-U in Environmentally Relevant Concentrations (Solar Pilot-Scale Experiments)

PXT’s removal from WW was also studied using CN-U at 100 and 200 mg/L concentrations. The data are plotted as PXT’s concentration decrease (C/C0) vs. QUV and t30W values in Figure 9a,b, respectively. In addition, PXT’s removal kinetics follows the pseudo-first-order model as in the lab-scale photocatalytic experiments. This photocatalyst removes PXT satisfactorily from WW after the photocatalytic experiment lasts 240 min. Indeed, when applying a concentration of 200 mg/L, PXT’s removal is approximately 89% (Table 3). Furthermore, the degradation rate of the pharmaceutical compound is faster with the catalyst mentioned above concentration compared to the concentration of 100 mg/L. The same condition was observed in lab-scale photocatalytic experiments.
Reuse of the CN-U photocatalyst in a concentration of 200 mg/L was also assessed. Two catalytic cycles were carried out in two consecutive days without replacing the catalyst from WW’s volume. Moreover, at the beginning of every cycle, WW was spiked with a PXT’s aqueous solution, reaching a final concentration of 20 μg/L.
In the first photocatalytic cycle and after 240 min duration, PXT’s removal from WW reaches a satisfactory 89%. In the second photocatalytic cycle, the same initial pharmaceutical concentration is reduced by 62% in a process that takes place at a slower rate, taking into consideration the values of the rate constants as listed in Table 3. The phenomenon of catalyst surface alteration possibly occurs by adsorbing on its surface WW constituents such as ions, other pollutants, and organic matter.
To assess the impact of the best-performed photocatalytic process (200 mg/L CN-U) and the effect of the catalyst’s reusability on the organic load in HWW, the physicochemical parameters such as Abs254, Total Phenols, BOD5, and COD values before and after the treatment were measured, and the % variation was calculated, indicating, from a first point of view, mainly of the “Abs254” and “Total Phenols” values, the production of a higher quality WW after treatment (Table S7). The BOD5/COD ratio, which indicates the biodegradability of the WW, was also calculated. Higher ratio values indicate higher biodegradability of the treated WW. Indeed, BOD5/COD ratio values increased at the end of each photocatalytic process.

3.10. In Vitro Toxicity Studies During the Photocatalytic Process (Pilot-Scale Experiments)

The toxicity of the samples collected during the photocatalytic processes is vital in evaluating their effectiveness. This is important because while trying to make WW more biodegradable at the end of a process, there is a risk of increasing its toxicity due to the intermediate oxidation products formed. Therefore, it is imperative to monitor toxicity levels when applying AOPs [58,59].
Samples’ toxicity was studied by monitoring changes in the light intensity of the naturally luminescent bacterium Vibrio fischeri. The results obtained from the samples taken at the start and end of each pilot-scale photocatalytic experiment are listed in Table 4.
At the beginning of each experiment, the percentage of bioluminescence inhibition is relatively low. However, an exception is the experiment applying the catalyst’s concentration of 200 mg/L (1st photocatalytic cycle), where the corresponding inhibition amounts to 69.65%, indicating the sample’s high toxicity. Furthermore, two of the samples at the end of the photocatalytic process exhibited hormesis. Hormesis occurs when a sample is not toxic enough to cause death to the bacteria; instead, the sample’s content benefits the bacteria population growth, increasing the emitted light intensity.
Eventually, the effectiveness of the pilot-scale photocatalytic tests is evident from the decreased amount of bioluminescence inhibition or hormesis phenomenon observed in the last sample of each experiment (300 min), indicating an improvement in the toxicity parameter.

4. Conclusions

In summary, g-C3N4, particularly urea-prepared g-C3N4, appears to be a highly efficient photocatalyst in the degradation of PXT in water and HWW. All PXT removal kinetics in both laboratory and pilot conditions fit the pseudo-first-order model, with thermally exfoliated g-C3N4 from urea [CN-U(exf.)] being the most efficient catalyst. In the lab experiments, conducting four consecutive photocatalytic cycles, its performance remained stable after a significant activity loss only from the first to the second cycle. PXT’s mineralization showed that without a catalyst, the process takes place at a very slow rate while comparing the two catalysts CN-U and CN-U (exf.), and in particular for F and NO3 ions release, no stoichiometric release was observed indicating the formation of TPs. Scavenging experiments indicated that hydroxyl radicals contributed less to degradation while 1O2, h+ are the main species that participated in the degradation mechanisms.
In the photolytic degradation of PXT, five TPs were detected and identified, as in the photocatalytic process with CN-U, with four of them being common, suggesting, at the same time, the transformation pathways of the parent compound. Additionally, evaluating in silico the ecotoxicity of TPs with the ECOSAR software, it is found that they are basically less toxic than the parent compound, with the only exception being TP-328. With the TEST software, PXT and all its TPs were categorized as “developmental toxicant”, while the only TPs that seem to be able to cause mutagenic reactions are TP-210 and TP-226. Regarding the BCF values, it appears that none of the TPs can bioaccumulate to a large extent in aquatic organisms.
Conducting pilot-scale photocatalytic experiments under natural sunlight in a CPC reactor using HWW as a substrate, PXT removal of about 89% was observed after 240 min for 200 mg/L catalyst concentration. The CN-U(exf.) catalyst was also tested for the removal of PXT from HWW in a lab-pilot setup due to its lower mass production yield, which was achieved after 60 min of irradiation. Therefore, the large-scale production of the exfoliated form is a point on which the research should focus. In the pilot-scale photocatalytic experiments, toxicity reduction or even detoxification was observed in the final sample of each process, highlighting the importance of heterogeneous photocatalysis in producing better WW quality.
Finally, further development of g-C3N4 synthesis methods to reduce the precursors’ mass loss is of significant need so that the photocatalytic process can be applied on larger scales to remove emerging contaminants from WW, especially pharmaceutical compounds.

Supplementary Materials

The following supporting information can be downloaded at: https://www.mdpi.com/article/10.3390/w17111609/s1, Figure S1: PXT chemical formula; Figure S2: Flowchart of the experimental procedures; Figure S3: The CPC pilot plant placed at the WWTP of the University Hospital of Ioannina; Figure S4: Total ion current (TIC) and extracted pseudo-molecular ion chromatograms of PXT and its TPs formed during the lab-scale photolytic and photocatalytic degradation; Figure S5: Mass spectra of PXT and its TPs formed during the lab-scale photolytic and photocatalytic degradation; Figure S6: In silico predicted values for (a) mutagenicity, (b) bioconcentration factor, and (c) developmental toxicity of PXT and its TPs formed during photolysis; Figure S7: In silico predicted values for (a) mutagenicity, (b) bioconcentration factor, and (c) developmental toxicity of PXT and its TPs formed during photocatalysis with CN-U and CN-U(exf.); Figure S8: Degradation kinetics of PXT (C0 = 20 µg/L) with CN-U(exf.) catalyst (100 mg/L) under UVA irradiation (10 lamps × 8.5 W); Figure S9: The lab-prepared g-C3N4 from Urea (CN-U), Melamine (CN-M), and Thiourea (CN-T) and their exfoliated forms; Table S1: Minimum (min), maximum (max), standard deviation (s.d.), and median values of the physicochemical parameters of secondary treated HWW; Table S2: Properties of PXT; Table S3: Operational parameters of the LTQ-ORBITRAP instrumentation; Table S4: High-resolution mass data of PXT and its TPs formed during the photolytic and photocatalytic degradation experiments; Table S5. Pseudo-first-order rate constants (kapp), half-time life (t1/2), correlation coefficient (R2), and % removal of PXT after lab-scale photocatalytic treatment with CN-U and CN-U(exf.) per scavenger; Table S6: In silico assessment of acute and chronic toxicity of PXT and its TPs with ECOSAR v2.2 software; Table S7: Abs254, Total Phenols, BOD5, COD values, and the BOD5/COD ratio of HWW before and after treatment by heterogeneous photocatalysis with CN-U and CN-U(exf.). References [60,61] are cited in the Supplementary Materials.

Author Contributions

S.S.: Investigation, Formal analysis, Visualization, Writing—Original draft and Editing, C.L.: Investigation and Formal Analysis, I.K.: Conceptualization, Project administration, Methodology, Supervision, Resources, Writing—Original draft preparation and Writing—Review and editing, T.A.: Conceptualization, Project administration, Methodology, Supervision, Resources. All authors have read and agreed to the published version of the manuscript.

Funding

This research was funded by the project “Advanced Nanostructured Materials for Sustainable Growth: Green Energy Production/Storage, Energy Saving and Environmental Remediation” (TAEDR-0535821), which is implemented under the action “Flagship actions in interdisciplinary scientific fields with a special focus on the productive fabric” (ID 16618), Greece 2.0—National Recovery and Resilience Fund, and funded by the European Union NextGenerationEU.

Data Availability Statement

The information provided in this research can be found in this article as well as in the related Supplementary Material.

Acknowledgments

The authors express their gratitude to the Unit of Environmental, Organic, and Biochemical high-resolution analysis—ORBITRAP-LC–MS at the University of Ioannina for granting access to its facilities.

Conflicts of Interest

The authors declare no conflicts of interest.

Abbreviations

The following abbreviations are used in this manuscript:
PXTParoxetine
WWWastewater
HWWHospital Wastewater
WWTPsWastewater Treatment Plants
CPCsConcentrating Parabolic Collectors
PhACsPharmaceutical Active Compounds
PCPsPersonal Care Products
SSRIsSelective Serotonin Reuptake Inhibitors
CN-Ug-C3N4 prepared by Urea
CN-U(exf.)thermally exfoliated g-C3N4 prepared by Urea
CN-Mg-C3N4 prepared by Melamine
CN-M(exf.)thermally exfoliated g-C3N4 prepared by Melamine
CN-Tg-C3N4 prepared by Thiourea
CN-T(exf.)thermally exfoliated g-C3N4 prepared by Thiourea

References

  1. Gopinath, K.P.; Madhav, N.V.; Krishnan, A.; Malolan, R.; Rangarajan, G. Present Applications of Titanium Dioxide for the Photocatalytic Removal of Pollutants from Water: A Review. J. Environ. Manag. 2020, 270, 110906. [Google Scholar] [CrossRef] [PubMed]
  2. Gurke, R.; Rößler, M.; Marx, C.; Diamond, S.; Schubert, S.; Oertel, R.; Fauler, J. Occurrence and Removal of Frequently Prescribed Pharmaceuticals and Corresponding Metabolites in Wastewater of a Sewage Treatment Plant. Sci. Total Environ. 2015, 532, 762–770. [Google Scholar] [CrossRef]
  3. Kosma, C.I.; Kapsi, M.G.; Konstas, P.S.G.; Trantopoulos, E.P.; Boti, V.I.; Konstantinou, I.K.; Albanis, T.A. Assessment of Multiclass Pharmaceutical Active Compounds (PhACs) in Hospital WWTP Influent and Effluent Samples by UHPLC-Orbitrap MS: Temporal Variation, Removals and Environmental Risk Assessment. Environ. Res. 2020, 191, 110152. [Google Scholar] [CrossRef]
  4. Couto, C.F.; Lange, L.C.; Amaral, M.C.S. Occurrence, Fate and Removal of Pharmaceutically Active Compounds (PhACs) in Water and Wastewater Treatment Plants—A Review. J. Water Process Eng. 2019, 32, 100927. [Google Scholar] [CrossRef]
  5. Wu, G.; Yao, R.; Zhang, Y.; Ying, M.; Wu, T.; Jiang, W.; Wang, D.; Zhang, X.X. Transformation Mechanisms of Antidepressants in Biological Wastewater Treatment: Removal Kinetic, Transformation Products and Pathways. Chem. Eng. J. 2024, 493, 152557. [Google Scholar] [CrossRef]
  6. Yuan, S.; Jiang, X.; Xia, X.; Zhang, H.; Zheng, S. Detection, Occurrence and Fate of 22 Psychiatric Pharmaceuticals in Psychiatric Hospital and Municipal Wastewater Treatment Plants in Beijing, China. Chemosphere 2013, 90, 2520–2525. [Google Scholar] [CrossRef]
  7. Gornik, T.; Carena, L.; Kosjek, T.; Vione, D. Phototransformation Study of the Antidepressant Paroxetine in Surface Waters. Sci. Total Environ. 2021, 774, 145380. [Google Scholar] [CrossRef]
  8. Hwang, S.; Kim, J.H.; Jo, S.H. Inhibitory Effect of the Selective Serotonin Reuptake Inhibitor Paroxetine on Human Kv1.3 Channels. Eur. J. Pharmacol. 2021, 912, 174567. [Google Scholar] [CrossRef]
  9. Giatti, S.; Domizio, A.D.; Diviccaro, S.; Cioffi, L.; Marmorini, I.; Falvo, E.; Caruso, D.; Contini, A.; Melcangi, R.C. Identification of a Novel Off-Target of Paroxetine: Possible Role in Sexual Dysfunction Induced by This SSRI Antidepressant Drug. J. Mol. Struct. 2022, 1268, 133690. [Google Scholar] [CrossRef]
  10. Paíga, P.; Correia, M.; Fernandes, M.J.; Silva, A.; Carvalho, M.; Vieira, J.; Jorge, S.; Silva, J.G.; Freire, C.; Delerue-Matos, C. Assessment of 83 Pharmaceuticals in WWTP Influent and Effluent Samples by UHPLC-MS/MS: Hourly Variation. Sci. Total Environ. 2019, 648, 582–600. [Google Scholar] [CrossRef]
  11. Silva, L.J.G.; Pereira, A.M.P.T.; Meisel, L.M.; Lino, C.M.; Pena, A. A One-Year Follow-up Analysis of Antidepressants in Portuguese Wastewaters: Occurrence and Fate, Seasonal Influence, and Risk Assessment. Sci. Total Environ. 2014, 490, 279–287. [Google Scholar] [CrossRef] [PubMed]
  12. Schlüsener, M.P.; Hardenbicker, P.; Nilson, E.; Schulz, M.; Viergutz, C.; Ternes, T.A. Occurrence of Venlafaxine, Other Antidepressants and Selected Metabolites in the Rhine Catchment in the Face of Climate Change. Environ. Pollut. 2015, 196, 247–256. [Google Scholar] [CrossRef] [PubMed]
  13. Lajeunesse, A.; Smyth, S.A.; Barclay, K.; Sauvé, S.; Gagnon, C. Distribution of Antidepressant Residues in Wastewater and Biosolids Following Different Treatment Processes by Municipal Wastewater Treatment Plants in Canada. Water Res. 2012, 46, 5600–5612. [Google Scholar] [CrossRef] [PubMed]
  14. Duarte, P.; Almeida, C.M.R.; Fernandes, J.P.; Morais, D.; Lino, M.; Gomes, C.R.; Carvalho, M.F.; Mucha, A.P. Bioremediation of Bezafibrate and Paroxetine by Microorganisms from Estuarine Sediment and Activated Sludge of an Associated Wastewater Treatment Plant. Sci. Total Environ. 2019, 655, 796–806. [Google Scholar] [CrossRef]
  15. Li, R.; Li, T.; Zhou, Q. Impact of Titanium Dioxide (TiO2) Modification on Its Application to Pollution Treatment—A Review. Catalysts 2020, 10, 804. [Google Scholar] [CrossRef]
  16. Lykos, C.; Kourkouta, T.; Konstantinou, I. Study on the Photocatalytic Degradation of Metronidazole Antibiotic in Aqueous Media with TiO2 under Lab and Pilot Scale. Sci. Total Environ. 2023, 870, 161877. [Google Scholar] [CrossRef]
  17. Pariente, M.I.; Segura, Y.; Álvarez-Torrellas, S.; Casas, J.A.; de Pedro, Z.M.; Diaz, E.; García, J.; López-Muñoz, M.J.; Marugán, J.; Mohedano, A.F.; et al. Critical Review of Technologies for the On-Site Treatment of Hospital Wastewater: From Conventional to Combined Advanced Processes. J. Environ. Manag. 2022, 320, 115769. [Google Scholar] [CrossRef]
  18. Varma, K.S.; Tayade, R.J.; Shah, K.J.; Joshi, P.A.; Shukla, A.D.; Gandhi, V.G. Photocatalytic Degradation of Pharmaceutical and Pesticide Compounds (PPCs) Using Doped TiO2 Nanomaterials: A Review. Water-Energy Nexus 2020, 3, 46–61. [Google Scholar] [CrossRef]
  19. Hassaan, M.A.; El-Nemr, M.A.; Elkatory, M.R.; Ragab, S.; Niculescu, V.C.; El Nemr, A. Principles of Photocatalysts and Their Different Applications: A Review. Top. Curr. Chem. 2023, 381, 31. [Google Scholar] [CrossRef]
  20. Zhu, D.; Zhou, Q. Action and Mechanism of Semiconductor Photocatalysis on Degradation of Organic Pollutants in Water Treatment: A Review. Environ. Nanotechnol. Monit. Manag. 2019, 12, 100255. [Google Scholar] [CrossRef]
  21. Muhmood, T.; Ahmad, I.; Haider, Z.; Haider, S.K.; Shahzadi, N.; Aftab, A.; Ahmed, S.; Ahmad, F. Graphene-like Graphitic Carbon Nitride (g-C3N4) as a Semiconductor Photocatalyst: Properties, Classification, and Defects Engineering Approaches. Mater. Today Sustain. 2024, 25, 100633. [Google Scholar] [CrossRef]
  22. Patel, S.B.; Tripathi, A.; Vyas, A.P. Recent Development in the Structural Modification of Graphitic Carbon Nitride for Sustainable Photocatalysis: Advances, Challenges and Opportunities. Environ. Nanotechnol. Monit. Manag. 2021, 16, 100589. [Google Scholar] [CrossRef]
  23. Qi, K.; Liu, S.; Zada, A. Graphitic Carbon Nitride, a Polymer Photocatalyst. J. Taiwan. Inst. Chem. Eng. 2020, 109, 111–123. [Google Scholar] [CrossRef]
  24. Bairamis, F.; Konstantinou, I. Photocatalytic Degradation Pathways of the Valsartan Drug by TiO2 and g-C3N4 Catalysts. Reactions 2022, 3, 160–171. [Google Scholar] [CrossRef]
  25. Cecconet, D.; Sturini, M.; Malavasi, L.; Capodaglio, A.G. Graphitic Carbon Nitride as a Sustainable Photocatalyst Material for Pollutants Removal. State-of-the Art, Preliminary Tests and Application Perspectives. Materials 2021, 14, 7368. [Google Scholar] [CrossRef]
  26. Wudil, Y.S.; Ahmad, U.F.; Gondal, M.A.; Al-Osta, M.A.; Almohammedi, A.; Sa’id, R.S.; Hrahsheh, F.; Haruna, K.; Mohamed, M.J.S. Tuning of Graphitic Carbon Nitride (g-C3N4) for Photocatalysis: A Critical Review. Arab. J. Chem. 2023, 16, 104542. [Google Scholar] [CrossRef]
  27. Farooq, N.; Khan, M.I.; ur Rehman, Z.; Wattoo, M.A.; Qureshi, A.M.; Shanableh, A.; ur Rehman, A. Barium-Doped Ceria-Fabricated Graphitic Carbon Nitride (BDC/g-C3N4) Nanomaterial as Improved Photocatalyst for Efficient Vitiation of Organic Dyes from Industrial Effluents. Inorg. Chem. Commun. 2024, 159, 111830. [Google Scholar] [CrossRef]
  28. Obregón, S. Exploring Nanoengineering Strategies for the Preparation of Graphitic Carbon Nitride Nanostructures. FlatChem 2023, 38, 100473. [Google Scholar] [CrossRef]
  29. Pei, J.; Li, H.; Zhuang, S.; Zhang, D.; Yu, D. Recent Advances in g-C3N4 Photocatalysts: A Review of Reaction Parameters, Structure Design and Exfoliation Methods. Catalysts 2023, 13, 1402. [Google Scholar] [CrossRef]
  30. Syed, J.A.S.; Zhang, X.Y.; Ding, W.J.; Li, A.D. An Overview of the Current Progress of Graphitic Carbon Nitride and Its Multifunctional Applications. J. Environ. Chem. Eng. 2022, 10, 108745. [Google Scholar] [CrossRef]
  31. Chen, L.; Maigbay, M.A.; Li, M.; Qiu, X. Synthesis and Modification Strategies of g-C3N4 Nanosheets for Photocatalytic Applications. Adv. Powder Mater. 2024, 3, 100150. [Google Scholar] [CrossRef]
  32. Molaei, M.J. Graphitic Carbon Nitride (g-C3N4) Synthesis and Heterostructures, Principles, Mechanisms, and Recent Advances: A Critical Review. Int. J. Hydrogen Energy 2023, 48, 32708–32728. [Google Scholar] [CrossRef]
  33. Rapti, I.; Kourkouta, T.; Malisova, E.M.; Albanis, T.; Konstantinou, I. Photocatalytic Degradation of Inherent Pharmaceutical Concentration Levels in Real Hospital WWTP Effluents Using g-C3N4 Catalyst on CPC Pilot Scale Reactor. Molecules 2023, 28, 1170. [Google Scholar] [CrossRef]
  34. Rapti, I.; Boti, V.; Albanis, T.; Konstantinou, I. Photocatalytic Degradation of Psychiatric Pharmaceuticals in Hospital WWTP Secondary Effluents Using g-C3N4 and g-C3N4/MoS2 Catalysts in Laboratory-Scale Pilot. Catalysts 2023, 13, 252. [Google Scholar] [CrossRef]
  35. Zheng, Q.; Aiello, A.; Choi, Y.S.; Tarr, K.; Shen, H.; Durkin, D.P.; Shuai, D. 3D Printed Photoreactor with Immobilized Graphitic Carbon Nitride: A Sustainable Platform for Solar Water Purification. J. Hazard. Mater. 2020, 399, 123097. [Google Scholar] [CrossRef]
  36. Lykos, C.; Sioulas, S.; Konstantinou, I. g-C3N4 as Photocatalyst for the Removal of Metronidazole Antibiotic from Aqueous Matrices under Lab and Pilot Scale Conditions. Catalysts 2023, 13, 254. [Google Scholar] [CrossRef]
  37. Fotiou, D.; Lykos, C.; Konstantinou, I. Photocatalytic Removal of the Antidepressant Fluoxetine from Aqueous Media Using TiO2 P25 and g-C3N4 Catalysts. J. Environ. Chem. Eng. 2024, 12, 111677. [Google Scholar] [CrossRef]
  38. Antonopoulou, M.; Kosma, C.; Albanis, T.; Konstantinou, I. An Overview of Homogeneous and Heterogeneous Photocatalysis Applications for the Removal of Pharmaceutical Compounds from Real or Synthetic Hospital Wastewaters under Lab or Pilot Scale. Sci. Total Environ. 2021, 765, 144163. [Google Scholar] [CrossRef]
  39. Zheng, Q.; Shen, H.; Shuai, D. Emerging Investigators Series: Advances and Challenges of Graphitic Carbon Nitride as a Visible-Light-Responsive Photocatalyst for Sustainable Water Purification. Environ. Sci. 2017, 3, 982–1001. [Google Scholar] [CrossRef]
  40. Sacco, O.; Vaiano, V.; Sannino, D. Main Parameters Influencing the Design of Photocatalytic Reactors for Wastewater Treatment: A Mini Review. J. Chem. Technol. Biotechnol. 2020, 95, 2608–2618. [Google Scholar] [CrossRef]
  41. Spasiano, D.; Marotta, R.; Malato, S.; Fernandez-Ibañez, P.; Di Somma, I. Solar Photocatalysis: Materials, Reactors, Some Commercial, and Pre-Industrialized Applications. A Comprehensive Approach. Appl. Catal. B 2015, 170–171, 90–123. [Google Scholar] [CrossRef]
  42. Kwon, J.-W.; Armbrust, K.L. Hydrolysis and photolysis of paroxetine, a selective serotonin reuptake inhibitor, in aqueous solutions. Environ. Toxicol. Chem. 2004, 23, 1394–1399. [Google Scholar] [CrossRef]
  43. Chand, H.; Kumar, A.; Goswami, S.; Krishnan, V. Comparison of Catalytic Activity of Graphitic Carbon Nitrides Derived from Different Precursors for Carbon Dioxide Conversion. Fuel 2024, 357, 129757. [Google Scholar] [CrossRef]
  44. Jiang, X.; Li, X.; Liu, Y.; Zhai, H.; Wang, G. The Oxidative Thermal Exfoliation-Dependent Microstructure and Photocatalytic Performance of g-C3N4 Nanosheets. Diam. Relat. Mater. 2024, 143, 110918. [Google Scholar] [CrossRef]
  45. Zhang, M.; Yang, Y.; An, X.; Zhao, J.; Bao, Y.; Hou, L. an Exfoliation Method Matters: The Microstructure-Dependent Photoactivity of g-C3N4 Nanosheets for Water Purification. J. Hazard. Mater. 2022, 424, 127424. [Google Scholar] [CrossRef]
  46. Wang, J.; Li, H.; Yue, D. Enhanced Adsorption of Humic/Fulvic Acids onto Urea-Derived Graphitic Carbon Nitride. J. Hazard. Mater. 2022, 424, 127643. [Google Scholar] [CrossRef]
  47. Yue, D.; Wang, J.; Cui, D.; Zhang, L.; Dong, X. Insights into Adsorption of Humic Substances on Graphitic Carbon Nitride. Environ. Sci. Technol. 2021, 55, 7910–7919. [Google Scholar] [CrossRef]
  48. Attri, P.; Garg, P.; Sharma, P.; Singh, R.; Chauhan, M.; Lim, D.K.; Kumar, S.; Chaudhary, G.R. Precursor-Dependent Fabrication of Exfoliated Graphitic Carbon Nitride (GCN) for Enhanced Photocatalytic and Antimicrobial Activity under Visible Light Irradiation. J. Clean. Prod. 2023, 422, 138538. [Google Scholar] [CrossRef]
  49. Tameu Djoko, S.Y.; Bashiri, H.; Njoyim, E.T.; Arabameri, M.; Djepang, S.; Tamo, A.K.; Laminsi, S.; Tasbihi, M.; Schwarze, M.; Schomäcker, R. Urea and Green Tea like Precursors for the Preparation of g-C3N4 Based Carbon Nanomaterials (CNMs) Composites as Photocatalysts for Photodegradation of Pollutants under UV Light Irradiation. J. Photochem. Photobiol. A Chem. 2020, 398, 112596. [Google Scholar] [CrossRef]
  50. Zhu, C.; Zhu, F.; Dionysiou, D.D.; Zhou, D.; Fang, G.; Gao, J. Contribution of Alcohol Radicals to Contaminant Degradation in Quenching Studies of Persulfate Activation Process. Water Res. 2018, 139, 66–73. [Google Scholar] [CrossRef]
  51. Wang, C.; Huang, R.; Sun, R.; Yang, J.; Sillanpää, M. A Review on Persulfates Activation by Functional Biochar for Organic Contaminants Removal: Synthesis, Characterizations, Radical Determination, and Mechanism. J. Environ. Chem. Eng. 2021, 9, 106267. [Google Scholar] [CrossRef]
  52. Diniz, R.R.; Domingos, T.F.S.; Pinto, G.R.; Cabral, L.M.; de Pádula, M.; de Souza, A.M.T. Use of in Silico and in Vitro Methods as a Potential New Approach Methodologies (NAMs) for (Photo)Mutagenicity and Phototoxicity Risk Assessment of Agrochemicals. Sci. Total Environ. 2023, 904, 167320. [Google Scholar] [CrossRef]
  53. Toropova, A.P.; Toropov, A.A.; Roncaglioni, A.; Benfenati, E. The Enhancement Scheme for the Predictive Ability of QSAR: A Case of Mutagenicity. Toxicol. In Vitro 2023, 91, 105629. [Google Scholar] [CrossRef]
  54. Pandey, S.K.; Roy, K. Development of a Read-across-Derived Classification Model for the Predictions of Mutagenicity Data and Its Comparison with Traditional QSAR Models and Expert Systems. Toxicology 2023, 500, 153676. [Google Scholar] [CrossRef]
  55. Xu, J.Y.; Wang, K.; Men, S.H.; Yang, Y.; Zhou, Q.; Yan, Z.G. QSAR-QSIIR-Based Prediction of Bioconcentration Factor Using Machine Learning and Preliminary Application. Environ. Int. 2023, 177, 108003. [Google Scholar] [CrossRef]
  56. Gómez-Regalado, M.D.C.; Martín, J.; Santos, J.L.; Aparicio, I.; Alonso, E.; Zafra-Gómez, A. Bioaccumulation/Bioconcentration of Pharmaceutical Active Compounds in Aquatic Organisms: Assessment and Factors Database. Sci. Total Environ. 2023, 861, 160638. [Google Scholar] [CrossRef]
  57. Khan, K.; Kumar, V.; Colombo, E.; Lombardo, A.; Benfenati, E.; Roy, K. Intelligent Consensus Predictions of Bioconcentration Factor of Pharmaceuticals Using 2D and Fragment-Based Descriptors. Environ. Int. 2022, 170, 107625. [Google Scholar] [CrossRef]
  58. Brienza, M.; Mahdi Ahmed, M.; Escande, A.; Plantard, G.; Scrano, L.; Chiron, S.; Bufo, S.A.; Goetz, V. Use of Solar Advanced Oxidation Processes for Wastewater Treatment: Follow-up on Degradation Products, Acute Toxicity, Genotoxicity and Estrogenicity. Chemosphere 2016, 148, 473–480. [Google Scholar] [CrossRef]
  59. Sousa, M.A.; Gonçalves, C.; Vilar, V.J.P.; Boaventura, R.A.R.; Alpendurada, M.F. Suspended TiO2-Assisted Photocatalytic Degradation of Emerging Contaminants in a Municipal WWTP Effluent Using a Solar Pilot Plant with CPCs. Chem. Eng. J. 2012, 198–199, 301–309. [Google Scholar] [CrossRef]
  60. Rapti, I.; Kosma, C.; Albanis, T.; Konstantinou, I. Solar Photocatalytic Degradation of Inherent Pharmaceutical Residues in Real Hospital WWTP Effluents Using Titanium Dioxide on a CPC Pilot Scale Reactor. Catal Today 2023, 423, 113884. [Google Scholar] [CrossRef]
  61. Germann, D.; Ma, G.; Han, F.; Tikhomirova, A. Paroxetine Hydrochloride. In Profiles of Drug Substances, Excipients and Related Methodology; Academic Press Inc.: Cambridge, MA, USA, 2013; Volume 38, pp. 367–406. [Google Scholar] [CrossRef]
Figure 1. Degradation kinetics of PXT (C0 = 5 mg/L) and evolution kinetics of the produced F, NO2 and NO3 anions under simulated solar irradiation (I = 750 W m−2); arrows indicating the corresponding Y-axis that experimental data refer to.
Water 17 01609 g001
Figure 2. Proposed pathway of PXT’s photolytic transformation.
Water 17 01609 g002
Figure 3. Evolutionary profiles of (a) TP-208, TP-226, TP-296, (b) TP-210 and (c) TP-328 detected in PXT’s photolytic degradation.
Water 17 01609 g003
Figure 4. Degradation kinetics of PXT (C0 = 10 mg/L) with different types of g-C3N4 catalyst (100 mg/L) and CN-U, CN-U(exf.) in 200 mg/L under simulated solar irradiation (I = 500 W/m2) in Water (a) and HWW (b) and (c) photocatalytic cycles with CN-U(exf.) in 200 mg/L.
Water 17 01609 g004
Figure 5. Evolution kinetics of the produced (a) F, (b) NO2, and (c) NO3 anion, during the photocatalytic degradation of PXT with CN-U and CN-U(exf.).
Water 17 01609 g005
Figure 6. Degradation kinetics of PXT (C0 = 10 mg/L) in the presence of scavengers (PXT:scavenger = 1:500) with CN-U (a) and CN-U(exf.) (b) in 100 mg/L under simulated solar irradiation (I = 500 W/m2).
Water 17 01609 g006
Figure 7. Proposed PXT’s photocatalytic transformation pathway with CN-U and CN-U(exf.).
Water 17 01609 g007
Figure 8. Evolutionary profiles of (a) TP-208, (b) TP-210 and (c) TP-226, TP-296, TP-350 detected in PXT’s photocatalytic degradation with 200 mg/L CN-U.
Water 17 01609 g008
Figure 9. Degradation kinetics of PXT (C0 = 20 µg/L) with CN-U catalyst at 100 and 200 mg/L (a,b) and reusing the catalyst (200 mg/L) (c,d) under natural solar irradiation as a function of QUV and t30W.
Water 17 01609 g009
Table 1. Pseudo-first-order rate constants (kapp), half-time life (t1/2), correlation coefficient (R2), and % removal of PXT after lab-scale photocatalytic treatment with different types of g-C3N4.
MaterialConcentration (mg/L)Substratekapp (min−1)t1/2 (min)R2% Removal
CN-U100U.P. Water0.03619.250.9487100
HWW0.03122.360.931188.18
200U.P. Water0.05213.330.9687100
HWW0.06111.360.9682100
CN-U(exf.)100U.P. Water0.0858.150.9121100
HWW0.06211.180.9701100
200U.P. Water0.1126.190.9497100
HWW0.0788.890.9754100
CN-M100U.P. Water0.00886.640.990137.02
HWW0.01069.310.991648.10
CN-M(exf.)100U.P. Water0.01353.320.991356.75
HWW0.02626.660.988681.94
CN-T100U.P. Water0.01069.310.984147.21
HWW0.00886.640.959438.51
CN-T(exf.)100U.P. Water0.01936.480.994268.97
HWW0.01353.320.996953.26
Table 2. Pseudo-first-order rate constant (kapp), correlation coefficient (R2), and degree of degradation kinetic constant reduction (%Δkapp) for each catalytic cycle in lab scale.
MaterialConcentration (mg/L)Catalytic Cyclekapp (min−1)R2Δkapp%
CN-U(exf.)2001st0.130.9857-
2nd0.0460.956164.6
3rd0.0430.96996.52
4th0.0430.95350
Table 3. Pseudo-first-order rate constant (kapp), correlation coefficient (R2), % removal of PXT, and degree of degradation kinetic constant reduction (%Δkapp) for each catalytic cycle in pilot and in-lab pilot-scale photocatalytic treatment.
MaterialConcentration (mg/L)kappR2% RemovalΔkapp%
CN-U(exf.)1000.034 min−10.9892100-
CN-U1000.024 L/kJ0.958677-
200 (1st catalytic cycle)0.041 L/kJ0.906989-
200 (2nd catalytic cycle)0.017 L/kJ0.95106258.5
Table 4. Toxicity study of pilot-scale photocatalytic experiments with different CN-U concentrations and catalyst reuse.
Irradiation Time (min)% Bioluminescence Inhibition of Vibrio fischeri
100 mg/L200 mg/L (1st Cycle)200 mg/L (2nd Cycle)
013.9469.659.6
300Hormesis20.36Hormesis
Disclaimer/Publisher’s Note: The statements, opinions and data contained in all publications are solely those of the individual author(s) and contributor(s) and not of MDPI and/or the editor(s). MDPI and/or the editor(s) disclaim responsibility for any injury to people or property resulting from any ideas, methods, instructions or products referred to in the content.

