Article

Trends, Patterns, and Persistence of Rainfall, Streamflow, and Flooded Area in the Upper Paraguay Basin (Brazil)

by
Maria Eduarda Moraes Sarmento Coelho
1,*,
Henrique Marinho Leite Chaves
2 and
Maria Rita Fonseca
2
1
World Wide Fund for Nature (WWF-Brazil), Brasília 70377-540, Brazil
2
Watershed Management Laboratory, University of Brasilia, Brasília 70910-900, Brazil
*
Author to whom correspondence should be addressed.
Water 2025, 17(10), 1549; https://doi.org/10.3390/w17101549
Submission received: 9 April 2025 / Revised: 7 May 2025 / Accepted: 16 May 2025 / Published: 21 May 2025
(This article belongs to the Section Hydrology)

Abstract

:
The Pantanal, considered the world’s largest floodplain, exhibits hydrological and ecological dynamics that are intrinsically linked to water inflows from the surrounding highlands. While the impacts of large-scale climatic phenomena and land-use changes on hydrological variables within the Upper Paraguay River Basin (UPRB) are acknowledged, their combined effects remain unknown. Recent reductions in precipitation and river discharge have adversely affected both environmental and socioeconomic aspects of the Cerrado (Brazilian Savannah) and Pantanal biomes in Brazil, raising concerns about the long-term sustainability of these important ecosystems. This study analyzes a 37-year hydrological time series (1986–2023) of rainfall, streamflow, and flooded area in three contributing basins of the Pantanal (Jauru—JB; Taquari—TB; and Miranda—MB), and reveals distinct hydrological trends influenced by different climate systems. Significant decreasing trends in rainfall and streamflow were observed in the northern JB and TB, contrasted by increasing trends in the southern MB. Consequently, a declining trend in downstream flooded areas within the Pantanal floodplain was identified. Long-term memory processes (Hurst phenomena) were identified in the time series of the Pantanal flooded area and also in the Paraguay river stage data. These findings indicate a persistent and aggregated reduction in the Pantanal’s hydrologic variables, adversely affecting its water-dependent ecology and economic activities, such as ranching, fishing, and navigation. This study underscores the necessity of adaptative management strategies to tackle the impacts of water surface loss, increased fire risks, and climate variability in the UPRB.

1. Introduction

Several regions of South America have experienced frequent and prolonged droughts in recent decades [1], which have been correlated with different global and regional climatic forcings, leading to important ecological and socioeconomic impacts, including widespread forest fires [2,3,4,5,6]. Extreme droughts in Brazil are often linked to the El-Niño Southern Oscillation (ENSO) phenomenon, which modulates the precipitation patterns on the continent [4,7,8,9], becoming more severe when years with below-average precipitation persistently occur in a sequence [10].
In the Brazilian Pantanal, the world’s largest floodplain, located in the Upper Paraguay River Basin (UPRB) in Brazil, a positive correlation was observed between the sea surface temperature (SST) rise in the Southern (Northern) Hemisphere oceans, and the increase (decrease) in the yearly precipitation [11] and streamflow [12]. Rainfall variability modulates the inter- and intra-annual flooding dynamics [13,14,15], and the combination of various large-scale climate events that can occur simultaneously is a complex process.
It is recognized that the ecological dynamics of the UPRB are regulated by the hydrological relationship between the Pantanal headwaters (highlands) and its floodplains [16,17]. Since precipitation is less than potential evapotranspiration in the floodplain, the regional water balance is modulated by upstream inflows [18,19]. Additionally, the relationship between streamflow and rainfall is not always linear, especially in modified watersheds [20]. In addition to global climate drivers, such as greenhouse effect emissions (GEEs) [21], regional forcings, such as large-scale land-use conversion, play an important role in precipitation and streamflow anomalies in the Cerrado biome [22,23,24,25], which spans 80% of the Pantanal headwaters [18].
Trends and variabilities were detected in the historical precipitation series of the Brazilian Cerrado between 1977 and 2010, where 71% of the rain gauges showed a decreasing trend [26]. Between 1960 and 2021, significant negative trends were found for rainfall during the dry season and the beginning of the wet season, with a 50% reduction in total rainfall and the number of rainy days [27]. Similarly, reductions between 6.7 and 8.7% in long-term streamflow in the region were projected for the biome until 2050, due to climate change and deforestation, respectively [24].
Land-use change in the Pantanal highlands leads to significant impacts in the downstream floodplain, including changes in water and sediment influxes [14,28,29,30,31,32,33]. Since agriculture and cattle ranching are the main economic activities in the Pantanal’s upstream areas, they are also impacted by temperature rises and the shortening of the rainy season, causing significant economic losses to farmers and municipalities [34]. Therefore, changes in the highland’s rainfall and streamflow regimes can impact the size, spatial distribution, seasonality, and persistence of the downstream flooded area [35,36,37]. During the typical flood season (Dec–May), the average flooded area covers between 60 and 80% of the Pantanal’s surface [30,38]. A recent remote sensing study mapped its monthly flooded surface [39], indicating that 2024 was the dryest year in a 30 yr long record.
Furthermore, water surface reduction in the Pantanal floodplain has been recorded in recent decades [40] with severe environmental and socioeconomic impacts [14,41,42], encouraging deforestation, agriculture, and cattle ranching in the dry areas [43,44], enhancing severe fire events [2,3,4,36,45], and hindering navigation, fishing, and tourism activities [17,46].
Therefore, a better understanding is needed of the relationship between climate change/variability and alterations in the hydrological components of the Pantanal flood pulses, resulting from both climate variability [47,48,49] and land-use change [50,51,52]. Considering the variability and the different effects of large-scale climate events, further investigation into the trends, patterns, and persistence in the hydrological time series of the Pantanal’s upstream basins is crucial to assess the impacts of climate and land-use change in the UPRP [33,49,52,53,54,55,56].
This research uses an innovative approach to assess the hydrology of the Upper Paraguay River Basin, integrating four statistical analyses—the Mann–Kendall trend test, Hurst exponent, Pearson correlation, and autocorrelation function (ACF)—to examine four critical hydrological variables of a 37 y long time series in order to provide new insights into the upstream contribution of three of its main tributaries to the downstream flooded area.

2. Materials and Methods
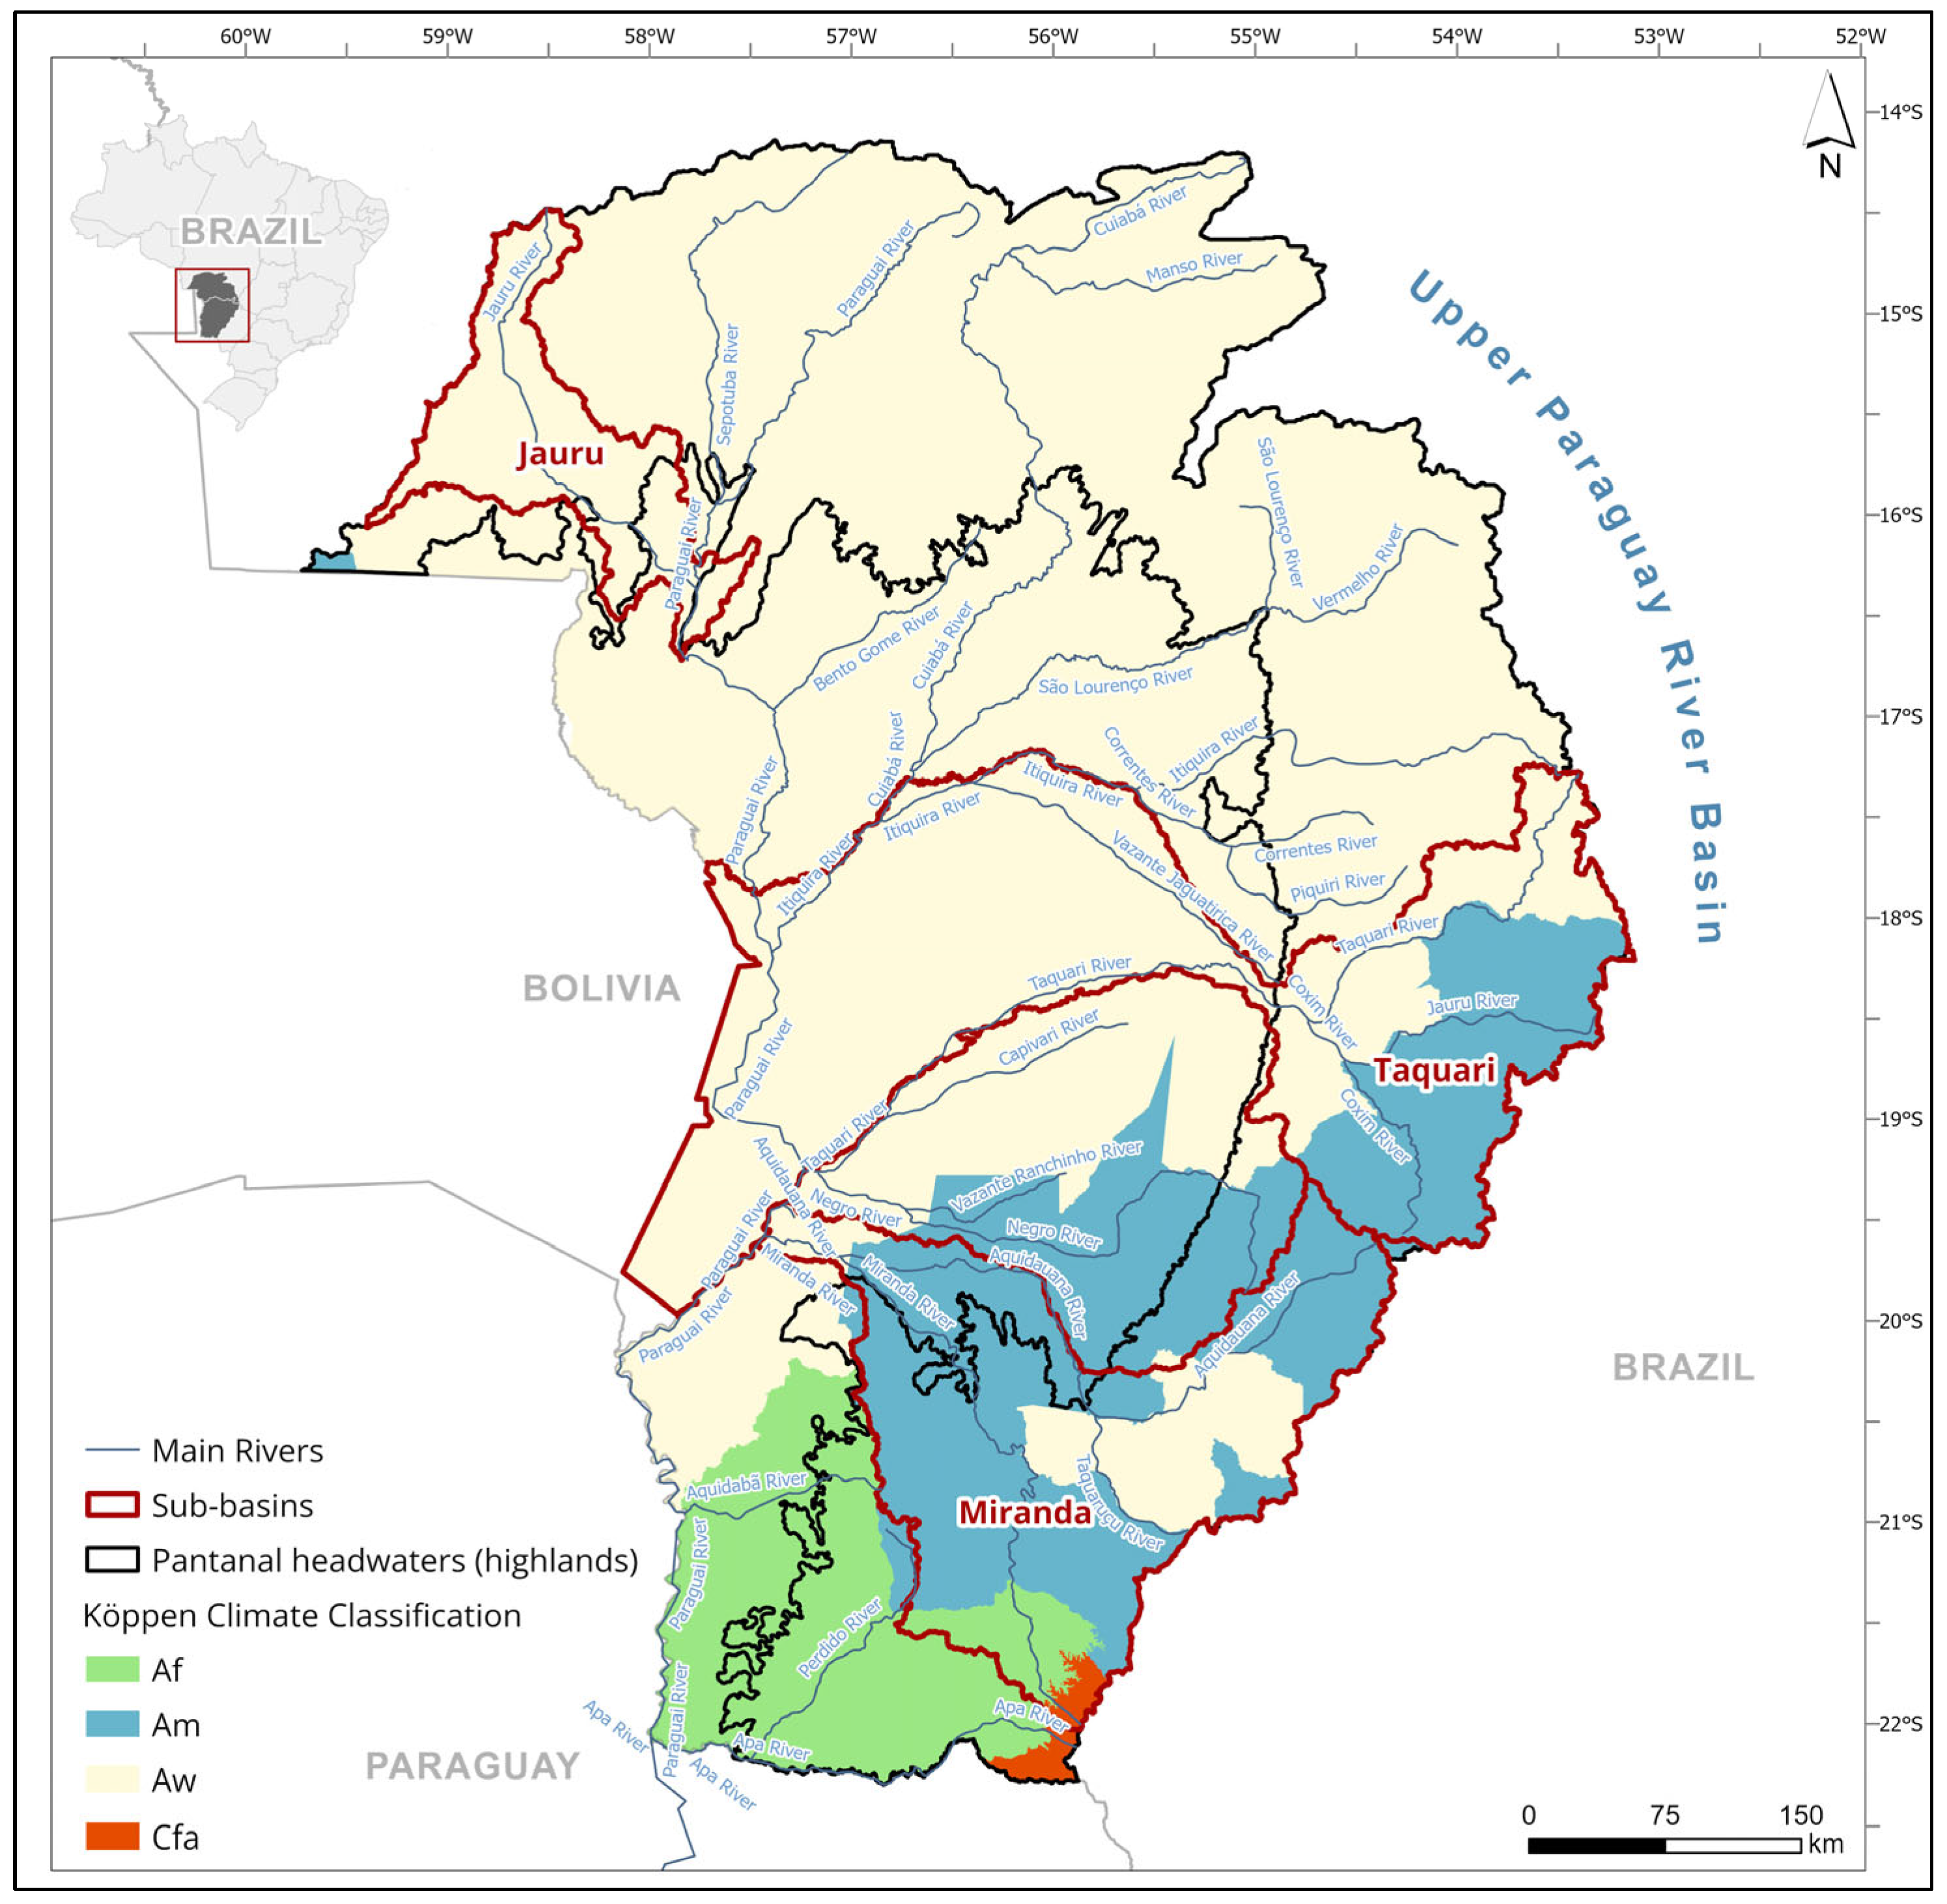
2.1. Study Area

The Paraguay River Basin, which contains the Pantanal floodplain, extends over 1.2 million km2 of Argentina, Bolivia, Paraguay, and Brazil, being the second largest river basin in South America. Its headwaters are located in the states of Mato Grosso and Mato Grosso do Sul (Brazil), and its main channel extends for approximately 2700 km until its confluence with the Paraná and La Plata rivers, which drain into the Atlantic Ocean. The Brazilian portion of the Paraguay River Basin is known as the Upper Paraguay River Basin—UPRB—upstream of the Pantanal floodplain (42%), whose headwaters contain portions of the Amazon (9%) and Cerrado/Savannah (49%) biomes. These upstream basins are the main sources of water and sediment for the downstream Pantanal floodplain [18,32].
This research focused on three UPRB basins: (i) The northern Jauru basin, in the southern Amazon region; (ii) the central Taquari basin, in the Cerrado biome; (iii) the southern Miranda basin, also in Cerrado, with fragments of the Brazilian Atlantic Forest (Figure 1). The Jauru basin (JB) spans 5647 km2 in its highland area and 2202 km2 in its floodplain. Its topography comprises gentle slopes, with a mean grade of 6.6%. The Taquari basin (TB) highlands span an area of 27,514 km2, with its downstream floodplain covering 40,160 km2. The basin has gentle topography, with a mean slope of 8.2%. Finally, the Miranda basin (MB) has an area of 15,125 km2 in its highlands and of 6638 km2 in its floodplain, being the lowest of the three basins in elevation (300 m), with a mean basin slope of 6.5%. The three study basins are covered by oxidic soils (Orthox), with pastureland and dryland agriculture as their dominant land uses.
The three studied sub-basins span two different Köppen climate zones (Figure 2). The Cerrado Aw climate is marked by a summer rainy season and dry winters, with annual rainfall ranging from 1070 mm to 1720 mm in the Jauru basin and from 1472 mm to 2067 mm in the Taquari basin. The Miranda basin, with annual rainfall volumes ranging between 970 mm and 1480 mm, is located in the transition zone between the Köppen Aw, Af, and Am climates, the latter being characterized by summer monsoons and warmer temperatures [57].

2.2. Hydrologic Data and Data Sources

The spatial delineation of the three studied basins was obtained by GIS spatial analysis, with the basin outlets coinciding with the corresponding streamflow gauging stations, situated at the frontier between the basins’ highlands and the downstream Pantanal floodplain (Figure 3). The floodplain of each basin was that defined by the Brazilian National Water Agency (NWA).
Monthly streamflow data were obtained from three NWA gauging stations: #66072000 (Porto Esperidiao), #66870000 (Coxim), and #66910000 (Miranda). Additionally, river stage data from the downstream Paraguay river gauge #66825000 (Ladário station) was used to complement the analysis and to evaluate the influence of eventual backwater effects in the flooded areas.
Data from six rainfall gauge stations, namely #1558004 (Alto Jauru), #1853002 (Cachoeira Pólvora), #1853003 (Jauru), #1954004 (Camapuã), #2156001 (Jardim), and #2056003 (Estrada MT-738) (Figure 3), were used to correct the bias of the gridded precipitation data, downloaded from the Climate Hazards Group InfraRed Precipitation with Station Data—CHIRPS, which were accurate for the studied area [58,59,60]. Rainfall bias correction was performed with parametric equations [58].
The monthly water surface (flooded) areas (A) of the Pantanal floodplain, located in the lower reaches of the three studied sub-basins, were obtained from the MapBiomas Water Project dataset (Collection #3) via Google Earth Engine® queries.

2.3. Statistical Analysis and Interpretation

To perform the statistical analysis of the hydrologic time series, the data were organized into monthly totals (precipitation) and monthly means (streamflow and flooded area), comprising N = 37 years, between 1986 and 2023, since at least 30 years of data were necessary to guarantee climatic stability [61]. All the hydrologic time series of the three sub-basins were organized into hydrologic years, starting in October and ending in September of the following year, to avoid the effect of baseflow carry-over between subsequent years [62].
The non-parametric Mann–Kendall (MK) statistic was used to assess the level of stationarity of the hydrologic time series, detecting trends or jumps [5,14,52,53,63,64]. Persistence (long-memory processes) in the hydrologic time series was detected with the Hurst coefficient, H [65], obtained from rescaled range (R/Sr) plots [66]. The R/Sr estimate was obtained by the following equations:
S r ( t , d ) = j = 1 t + d 1 x j 2 d x ¯ ( t , d ) 2
R ( t , d ) = m a x 1 < u < d j = 1 t + u 1 x j u x ¯ ( t , d ) m i n 1 < u < d j = 1 t + u 1 x j u x ¯ ( t , d )
where
x ¯   ( t ,   d ) = ( x i +   …… + x t + d 1 / d
The ratio R (t,d)/Sr (t,d) is the rescaled range, obtained by averaging the values of R/Sr for a number of values of t, for a given time lag (d), and plotting the average results of the series of rainfall, streamflow, or flooded area against log (d). The slope of the graph of x (d) versus log (d), found using ordinary linear regression, is the Hurst coefficient H [67]. Long-term memory (persistence) occurred in the time series when H > 0.5, whereas a value of H ≤ 0.5 indicated white noise (randomness) in the time series [64,65,66,67,68,69].
Additionally, the autocorrelation function (ACF) was performed in the hydrological series of rainfall (P), streamflow (Q), and flooded area (A) to assess the degree of autocorrelation between the observed data, indicating whether hydrologic behavior in subsequent years was explained by that in previous years. This occurred when the lag-1 and lag-2 ACF were statistically significant, and decreased monotonically [66]. The Mann–Kendall, Hurst, and ACF tests were performed for all the hydrological time series using the ‘mannkendall’, ‘hurstexp’, and ‘acf’ scripts available in the R-Studio® 4.5.0 platform, respectively.
Finally, the streamflow (Q) time series of the three basins were correlated with the corresponding flooded areas (A) downstream using the Spearman test [70] in order to assess the relationship between A and Q vis a vis the backwater effect of the downstream Paraguay river, measured at the Ladário river gauge.

3. Results

3.1. Jauru Basin (JB)

The rainfall and streamflow time series, their correlation, and the dynamics of the flooded area of the Jauru basin are presented in Figure 4. The decreasing trends observed in the rainfall (P) and streamflow (Q) series (MK = −0.04 and −0.11, respectively) were not statistically significant (p-value = 0.71 and 0.37, respectively). The Hurst coefficient for P and Q was H = 0.5, between the white noise and long-memory domains. The Annual P and Q in the basin were highly and positively correlated (r = 0.75) (Figure 4c).
On the other hand, there was a significant decreasing trend in the water surface in flooded region of the JB in the period analyzed (MK = −0.55, p-value < 0.001) (Figure 4d). Additionally, the Hurst coefficient (H = 0.69) indicated strong persistence. Significant autocorrelation was also detected in the basin’s flooded area, given the significant magnitudes and monotonic decrease in lags-1 and -2 [66] of the ACF.
The low correlation found between the flooded area and upstream inflow in the Jauru river basin (r = 0.06) (Figure 5) indicates that the former was not influenced by the latter.

3.2. Taquari Basin (TB)

The time series of rainfall and streamflow, their correlation, and the time series of the flooded area of the Taquari basin (TB) are presented in Figure 6a,b, respectively. Although the rainfall series showed a stationary behavior (MK = −0.12, p = 0.3), the streamflow series showed a significant decreasing trend (MK = −0.63, p < 0.001). The correlation between P and Q was r = 0.43 (Figure 6c), and the time series of the flooded area (Figure 6d) was non-stationary (MK = −0.54, p < 0.001), with a significant decreasing trend.
The Hurst (H) coefficient for the rainfall time series was 0.49 (white noise), while the H values for streamflow and flooded area were 0.68 and 0.69 (long-memory process), respectively. The latter was corroborated by the significant lag-1 and lag-2 of the ACF of the Q and A time series [10,66].
The positive correlation between TB annual streamflow and the basin’s annual flooded area (Figure 7a) was high (r = 0.72), indicating that the latter was influenced by the former. Additionally, Figure 7b indicates that the flooded area of the TB was affected by the backwater effect of the Paraguay river [71], given the significant positive correlation between them (r = 0.78).

3.3. Miranda Basin (MB)

Figure 8 presents the rainfall (P) and streamflow (Q) time series, their correlation, and the variation in the downstream flooded area of the Miranda basin (MB) in the studied period. As opposed to the Jauru and Taquari basins, where annual rainfall and streamflow decreased between 1986 and 2023, these hydrologic variables presented an increasing trend in the Miranda basin.
The MK coefficients for the time series of P and Q were 0.12 and 0.31, and the corresponding p-values were 0.29 and 0.02, respectively. The Hurst coefficients for the P, Q, and A time series were 0.64, 0.62, and 0.73, respectively, indicating the presence of persistence (long-memory processes) in the three hydrologic series. However, only the ACF of the flooded area showed autocorrelation, indicated by the significant and monotonic decreasing values of lags-1 and -2 of the ACF.
Figure 8c presents the correlation between P and Q (r = 0.5), and Figure 8d shows the time series of the Miranda downstream flooded area, with a significant decreasing trend (MK = −0.59, p < 0.001). The opposite trends observed in the series of streamflow and flooded area indicate that the latter was controlled by a different process from the former.
The Paraguay river stage and the Miranda basin flooded area (Figure 9a) showed a strong positive correlation (r = 0.70), whereas no correlation existed between the Miranda river streamflow and the downstream flooded area (r = 0.01) (Figure 9b). This indicates that the basin’s flooded area was controlled by the backwater effect of the Paraguay river [71]. Granted, the decreasing trend in Paraguay river stage (Figure 10a) corroborates this phenomenon.
Similarly to the flooded areas, the time series (1983–2023) of the Paraguay river stage showed a significant decreasing trend (MK = −0.41, p < 0.001) (Figure 10a) and long-memory processes, given by a Hurst coefficient of 0.64. As opposed to the case in recent decades, the extended time series of the Ladario river gauge (1901–2023) showed an increasing but not statistically significant trend (Figure 10b) (MK of 0.06, p = 0.3), and an even higher Hurst coefficient (H = 0.69), indicating strong persistence.

4. Discussion

Decreasing trends in rainfall and in streamflow were detected in two of the three Pantanal basins analyzed (Jauru and Taquari), with the third (Miranda) presenting increasing trends in the 37 years long series, corroborating with the findings of other studies [11]. A possible explanation for this behavior is the different climate systems governing the Pantanal’s hydrology [57]. In the case of the Jauru and Taquari basins, in the Cerrado biome, the dominant Köppen climate type is Aw, whereas in the southern Miranda basin, situated near the Tropic of Capricorn and the Atlantic Forest continuum, the dominant climate is Am. Recent climate change, arising from increased GHG concentrations, is known to be unique in the septentrional and meridional zones of the southern tropics, reducing yearly rainfall in the former and increasing it in the latter [72].
The observed hydrological variability also had unique regional agents. In the Taquari basin, a pronounced and statistically significant decline in streamflow (MK = −0.63, p < 0.001) contrasted with a comparatively modest and non-significant decrease in precipitation (MK = −0.12, p = 0.3), indicating a non-linear relationship between rainfall and runoff. Similar patterns have been observed in other Cerrado basins [10,24], where land-use and land cover (LULC) changes have been identified as primary drivers of hydrological alterations [24].
In tropical and subtropical regions, LULC modifications—such as deforestation and agricultural expansion—can significantly impact soil permeability, leading to increased surface runoff and reduced baseflow [73,74]. These effects are particularly pronounced in small-scale catchments, where the hydrological response is more sensitive to land cover changes [75,76,77]. Given that the streamflow data in this study came from single gauging stations, it is plausible that LULC changes have contributed to the observed streamflow reductions in the TB, resulting from a positive-feedback climatic process. Hoffmann and Jackson [22] found that the total deforestation of the Brazilian Savannah would reduce yearly precipitation and streamflow by 10%.
Analysis of the Paraguay river stage time series from 1901 to 2023 reveals no statistically significant trend (MK = 0.06, p = 0.3). However, a decreasing trend is evident for the period from 1986 to 2023 (MK = −0.41, p < 0.001). Both periods exhibit long-term persistence, as indicated by Hurst coefficients of 0.69 and 0.64, respectively, suggesting that natural climate variability cycles influence fluctuations in the Paraguay river stage.
In the long-duration series of the Paraguay river stage, the variability and persistence of both dry and wet years corroborate the findings in this research, where significant long-memory (H > 0.5) was detected in both the streamflow of the TB and MB and the flooded areas of the three analyzed basins in the Upper Paraguay River Basin [10,64,78].
Since 2018/19, the Pantanal floodplain has been in a spell of dry years, causing record low rainfall volumes and extreme fire events [45]. This rupture between wet and dry seasons has been explained by a complex combination of various teleconnection indices, such as the Atlantic Multidecadal Oscillation (AMO), which cycles from 60 to 90 years, Pacific Decadal Oscillation (PDO), and ENSO phenomena, but was mainly triggered by the anomalous warmth of the tropical North Atlantic [11,46].
Despite the differences in the hydrology of the three studied basins, their flooded areas showed a systematically and significantly decreasing trend in the studied period (MK(JB) = −0.55, MK(TB) = −0.54, MK(MB) = −0.59, p < 0.001). This can be observed in Figure 11, indicating the relative flood frequency in the Pantanal floodplain in two recent 10-year periods, the latter being much drier than the former [39,40,78].
In the case of the TB and MB, their flooded areas were positively correlated with the downstream Paraguay river stage, indicating that a backwater effect of the latter also contributed to the flooding of the lower reaches of the two basins [71,79]. The same correlation was found for JB, but there was not a cause–effect relationship in the latter, owing to the reduced flow contribution of the Jauru river to the Paraguay river stage.
While the Miranda basin (MB) presented positive P and Q trends, the basins located in the northern and central regions of the UPRB (JB and TB) had a major influence on the flow regime of the Pantanal floodplain, possibly to their large drainage areas and rainfall volumes [16,17,79].
Although a positive relationship was expected between rainfall volumes and flooded areas in the Pantanal floodplain, this correlation was weaker than the one obtained between annual rainfall and the Paraguay river stage at Ladario. As reported previously [38], the annual rainfall in the floodplain’s upland region is not capable of explaining the variability of the downstream flooded areas, the latter being better correlated with rainfall volumes between December and April. Also, annual streamflow time series usually show weaker correlations than monthly series in the basin [80].
There is evidence that the retraction of flooded areas in the Pantanal floodplain favors the expansion of cattle ranching [43,46] and agriculture [81] and reduces navigability, transportation (notably of soybeans and minerals), and tourism activities [38,46,79]. Reduced flooded areas also contribute to an increase in the number of extreme fire events [2,3,4,39,45], induce positive-feedback processes [22], diminish social and water resilience [44,82], and directly affect the survival of fauna and flora [39,45]. Additionally, since wetlands are among the most effective environments for carbon sequestration, the reduction in flooded areas contributes to a net carbon loss in the system [25,83,84,85,86].
Hence, the long-memory processes and negative trends identified in the flooded area time series of the Pantanal highlights the importance of precautionary and adaptive measures during the dry season [87,88], especially fire management programs [45,89], and efforts to improve its limited hydrological and meteorological monitoring stations [16,90].

5. Conclusions

Significant persistence, trends, and correlations were found in the 37 years long hydrologic time series of rainfall, streamflow, Paraguay river stage (Ladário), and flooded areas of these three contributing basins of the Pantanal floodplain in Brazil. In the northern and central basins (Jauru and Taquari), decreasing trends of rainfall and streamflow were detected. These basins are major contributors to Paraguay river floods compared to the southern Miranda basin. Therefore, the increase in rainfall and streamflow series found in the latter was not reflected in an increase in water surface in its floodplain, with this instead reflecting a backwater effect of the Paraguay river itself.
The historical series of flooded areas in the three basins showed a strong persistence (long memory) in the studied period, which indicates that anomalous years of droughts or floods occur in sequences that may last from a few years to decades, as confirmed by the 120 yr long time series of the Paraguay river stage.
As climate change exacerbates large-scale climate events and intensifies natural regional variability, it is strongly recommended that strategies of safeguarding the Pantanal floodplain be implemented, including the strengthening of fire control and water security based on adaptative management principles, all following a watershed management perspective, as established in the Brazilian Water Policy.

Author Contributions

Conceptualization, investigation, and methodology: M.E.M.S.C. and H.M.L.C.; data collection and writing—original draft preparation: M.E.M.S.C.; writing—review and editing: M.E.M.S.C., H.M.L.C. and M.R.F.; references review: M.R.F.; supervision and final editing: H.M.L.C. All authors have read and agreed to the published version of the manuscript.

Funding

This research received no external funding.

Data Availability Statement

River discharge, observed rainfall, and Paraguay river stage (Ladário gauge) data are available at https://www.snirh.gov.br/hidroweb, accessed on 10 May 2024. CHIRPS (https://www.chc.ucsb.edu/data/chirps), accessed on 10 May 2024, and the MapBiomas Water Project (https://plataforma.agua.mapbiomas.org/water/brazil), accessed on 1 October 2024, have open access to their datasets, which were obtained using the Google Earth Engine platform.

Acknowledgments

The authors thank the Forestry Engineering Department of the University of Brasília and WWF-Brazil for their technical and logistical support; WWF-Brazil for the funding, and also the two anonymous reviewers for their valuable comments and suggestions.

Conflicts of Interest

The authors declare no conflicts of interest.

References

  1. Hao, Z.; Hao, F.; Singh, V.P.; Zhang, X. Changes in the Severity of Compound Drought and Hot Extremes over Global Land Areas. Environ. Res. Lett. 2018, 13, 124022. [Google Scholar] [CrossRef]
  2. Libonati, R.; DaCamara, C.C.; Peres, L.F.; Sander de Carvalho, L.A.; Garcia, L.C. Rescue Brazil’s Burning Pantanal Wetlands. Nature 2020, 588, 217–219. [Google Scholar] [CrossRef] [PubMed]
  3. Leal Filho, W.; Azeiteiro, U.M.; Salvia, A.L.; Fritzen, B.; Libonati, R. Fire in Paradise: Why the Pantanal Is Burning. Environ. Sci. Policy 2021, 123, 31–34. [Google Scholar] [CrossRef]
  4. Chagas, V.B.P.; Chaffe, P.L.B.; Blöschl, G. Climate and Land Management Accelerate the Brazilian Water Cycle. Nat. Commun. 2022, 13, 5136. [Google Scholar] [CrossRef]
  5. Feron, S.; Cordero, R.R.; Damiani, A.; MacDonell, S.; Pizarro, J.; Goubanova, K.; Valenzuela, R.; Wang, C.; Rester, L.; Beaulieu, A. South America Is Becoming Warmer, Drier, and More Flammable. Commun. Earth Environ. 2024, 5, 501. [Google Scholar] [CrossRef]
  6. Vidal-Riveros, C.; Currey, B.; McWethy, D.B.; Bieng, M.A.N.; Souza-Alonso, P. Spatiotemporal Analysis of Wildfires and Their Relationship with Climate and Land Use in the Gran Chaco and Pantanal Ecoregions. Sci. Total Environ. 2024, 955, 176823. [Google Scholar] [CrossRef]
  7. Ropelewski, C.H.; Halpert, M.S. Precipitation Patterns Associated with the High Index Phase of the Southern Oscilation. J. Clim. 1989, 2, 268–284. [Google Scholar] [CrossRef]
  8. Grimm, A.M. How Do La Niña Events Disturb the Summer Monsoon System in Brazil? Clim. Dyn. 2004, 22, 123–138. [Google Scholar] [CrossRef]
  9. Cai, W.; McPhaden, M.J.; Grimm, A.M.; Rodrigues, R.R.; Taschetto, A.S.; Garreaud, R.D.; Dewitte, B.; Poveda, G.; Ham, Y.G.; Santoso, A.; et al. Climate Impacts of the El Niño–Southern Oscillation on South America. Nat. Rev. Earth Environ. 2020, 1, 215–231. [Google Scholar] [CrossRef]
  10. Chaves, H.M.L.; Lorena, D.R. Assessing Reservoir Reliability Using Classical and Long-Memory Statistics. J. Hydrol. Reg. Stud. 2019, 26, 100641. [Google Scholar] [CrossRef]
  11. Thielen, D.; Schuchmann, K.L.; Ramoni-Perazzi, P.; Marquez, M.; Rojas, W.; Quintero, J.I.; Marques, M.I. Quo Vadis Pantanal? Expected Precipitation Extremes and Drought Dynamics from Changing Sea Surface Temperature. PLoS ONE 2020, 15, e0227437. [Google Scholar] [CrossRef] [PubMed]
  12. Genta, J.L.; Perez-Iribarren, G.; Mechoso, C.R. A Recent Increasing Trend in the Streamflow of Rivers in Southeastern South America. J. Clim. 1998, 11, 2858–2862. [Google Scholar] [CrossRef]
  13. Krepper, C.M.; García, N.O.; Jones, P.D. Paraguay River Basin Response to Seasonal Rainfall. Int. J. Climatol. 2006, 26, 1267–1278. [Google Scholar] [CrossRef]
  14. Bergier, I. Effects of Highland Land-Use over Lowlands of the Brazilian Pantanal. Sci. Total Environ. 2013, 463–464, 1060–1066. [Google Scholar] [CrossRef]
  15. Pobocikova, I.; de Souza, A.; Abreu, M.C.; de Oliveira-Júnior, J.F.; Dos Santos, C.M.; Lins, T.M.P.; Aristone, F.; Ramos, P.L. The Impacts of Climate Change on Rainfall Modeling in the Pantanal of Mato Grosso Do Sul. Acta Sci. Technol. 2021, 43, e55112. [Google Scholar] [CrossRef]
  16. Collischonn, W.; Tucci, C.E.M.; Clarke, R.T. Further Evidence of Changes in the Hydrological Regime of the River Paraguay: Part of a Wider Phenomenon of Climate Change? J. Hydrol. 2001, 245, 218–238. [Google Scholar] [CrossRef]
  17. Wantzen, K.M.; Girard, P.; Roque, F.O.; Nunes da Cunha, C.; Chiaravalotti, R.M.; Nunes, A.V.; Bortolotto, I.M.; Guerra, A.; Pauliquevis, C.; Friedlander, M.; et al. The Pantanal: How Long Will There Be Life in the Rhythm of the Waters? In River Culture: Life as a Dance to the Rhythm of the Waters; UNESCO: Paris, France, 2023; pp. 497–536. [Google Scholar]
  18. Gonçalves, H.C.; Mercante, M.A.; Santos, E.T. Hydrological Cycle. Braz. J. Biol. 2016, 71, 241–253. [Google Scholar] [CrossRef]
  19. Alho, C.J.R.; Silva, J.S.V. Effects of Severe Floods and Droughts on Wildlife of the Pantanal Wetland (Brazil)—A Review. Animals 2012, 2, 591–610. [Google Scholar] [CrossRef]
  20. Hirsch, R.M. A Perspective on Nonstationarity and Water Management. J. Am. Water Resour. Assoc. 2011, 47, 436–446. [Google Scholar] [CrossRef]
  21. IPCC. Climate Change 2023: Synthesis Report. Contribution of Working Groups I, II and III to the Sixth Assessment Report of the Intergovernmental Panel on Climate Change; IPCC: Geneva, Switzerland, 2023. [Google Scholar]
  22. Hoffmann, W.A.; Jackson, R.B. Vegetation-Climate Feedbacks in the Conversion of Tropical Savanna to Grassland. J. Clim. 2000, 13, 1593–1602. [Google Scholar] [CrossRef]
  23. Oliveira, P.T.; Nearing, M.A.; Moran, S.M.; Goodrich, D.C.; Wendland, E.; Gupta, H.V. Trends in Water Balance Components across the Brazilia Cerrado. Water Resour. Res. 2014, 20, 7100–7114. [Google Scholar] [CrossRef]
  24. Salmona, Y.B.; Matricardi, E.A.T.; Skole, D.L.; Silva, J.F.A.; Coelho Filho, O.d.A.; Pedlowski, M.A.; Sampaio, J.M.; Castrillón, L.C.R.; Brandão, R.A.; da Silva, A.L.; et al. A Worrying Future for River Flows in the Brazilian Cerrado Provoked by Land Use and Climate Changes. Sustainability 2023, 15, 4251. [Google Scholar] [CrossRef]
  25. Guerra, A.; Resende, F.; Bergier, I.; Fairbrass, A.; Bernardino, C.; Centurião, D.A.S.; Bolzan, F.; Marcel, G.; Rosa, I.M.D.; da Silva, J.C.S.; et al. Land Use and Regulating Ecosystem Services Scenarios for the Brazilian Pantanal and Its Surroundings under Different Storylines of Future Regional Development. Conserv. Sci. Pract. 2025, e70012. [Google Scholar] [CrossRef]
  26. Campos, J.d.O.; Chaves, H.M.L. Trends and Variabilities in the Historical Series of Monthly and Annual Precipitation in Cerrado Biome in the Period 1977-2010. Rev. Bras. Meteorol. 2020, 35, 157–169. [Google Scholar] [CrossRef]
  27. Hofmann, G.S.; Silva, R.C.; Weber, E.J.; Barbosa, A.A.; Oliveira, L.F.B.; Alves, R.J.V.; Hasenack, H.; Schossler, V.; Aquino, F.E.; Cardoso, M.F. Changes in Atmospheric Circulation and Evapotranspiration Are Reducing Rainfall in the Brazilian Cerrado. Sci. Rep. 2023, 13, 11236. [Google Scholar] [CrossRef]
  28. Hamilton, S.K. Human Impacts on Hydrology in the Pantanal Wetland of South America. Water Sci. Technol. 2002, 45, 35–44. [Google Scholar] [CrossRef]
  29. Mercante, M.A.; Rodrigues, S.C.; Ross, J.L.S. Geomorphology and Habitat Diversity in the Pantanal. Brazilian J. Biol. 2011, 71, 233–240. [Google Scholar] [CrossRef] [PubMed]
  30. Alho, C.J.R.; Sabino, J. Seasonal Pantanal Flood Pulse: Implications for Biodiversity Conservation—A Review. Oecologia Aust. 2012, 16, 958–978. [Google Scholar] [CrossRef]
  31. de Oliveira, M.D.; Calheiros, D.F.; Hamilton, S.K. Mass Balances of Major Solutes, Nutrients and Particulate Matter as Water Moves through the Floodplains of the Pantanal (Paraguay River, Brazil). Rev. Bras. Recur. Hídr. 2019, 24, e1. [Google Scholar] [CrossRef]
  32. Assine, M.L.; Macedo, H.A.; Stevaux, J.C.; Bergier, I.; Padovani, C.R.; Silva, A. Avulsive Rivers in the Hydrology of the Pantanal Wetland. Handb. Environ. Chem. 2016, 37, 83–110. [Google Scholar] [CrossRef]
  33. Colman, C.B.; Oliveira, P.T.S.; Almagro, A.; Soares-Filho, B.S.; Rodrigues, D.B.B. Effects of Climate and Land-Cover Changes on Soil Erosion in Brazilian Pantanal. Sustainability 2019, 11, 7053. [Google Scholar] [CrossRef]
  34. Leite-Filho, A.T.; Soares-Filho, B.S.; Oliveira, U.; Coe, M. Intensification of Climate Change Impacts on Agriculture in the Cerrado Due to Deforestation. Nat. Sustain. 2025, 8, 34–43. [Google Scholar] [CrossRef]
  35. Bravo, J.M.; Collischonn, W.; da Paz, A.R.; Allasia, D.; Domecq, F. Impact of Projected Climate Change on Hydrologic Regime of the Upper Paraguay River Basin. Clim. Change 2014, 127, 27–41. [Google Scholar] [CrossRef]
  36. Roque, F.O.; Ochoa-Quintero, J.; Ribeiro, D.B.; Sugai, L.S.M.; Costa-Pereira, R.; Lourival, R.; Bino, G. Upland Habitat Loss as a Threat to Pantanal Wetlands. Conserv. Biol. 2016, 30, 1131–1134. [Google Scholar] [CrossRef]
  37. Pinheiro Noveli, R.A.; Lima de Paula Silva, B.; Escalante Pereira, L. Dinâmica Espacial Das Inundações Do Pantanal Sul. Rev. GeoPantanal 2023, 18, 74–85. [Google Scholar] [CrossRef]
  38. Pereira, G.; Ramos, R.d.C.; Rocha, L.C.; Brunsell, N.A.; Merino, E.R.; Mataveli, G.A.V.; da S. Cardozo, F. Rainfall Patterns and Geomorphological Controls Driving Inundation Frequency in Tropical Wetlands: How Does the Pantanal Flood? Prog. Phys. Geogr. 2021, 45, 669–686. [Google Scholar] [CrossRef]
  39. WWF Brazil Early Warning to Mitigate the Impacts of Drought in the Pantanal. Available online: https://wwfbrnew.awsassets.panda.org/downloads/0107-nota-tecnica---crise-hidrica.pdf (accessed on 31 March 2025).
  40. Moraes, E.C.; Pereira, G.; Da, F.; Cardozo, S. Evaluation of Reduction of Pantanal Wetlands in 2012. Available online: https://www.geopantanal.cnptia.embrapa.br/publicacoes/4geo/p6_81-93.pdf (accessed on 6 May 2025).
  41. Junk, W.J. Flood Pulsing and the Linkages between Terrestrial, Aquatic, and Wetland Systems. Int. Ver. Theor. Angew. Limnol. Verh. 2005, 29, 11–38. [Google Scholar] [CrossRef]
  42. Ivory, S.J.; McGlue, M.M.; Spera, S.; Silva, A.; Bergier, I. Vegetation, Rainfall, and Pulsing Hydrology in the Pantanal, the World’s Largest Tropical Wetland. Environ. Res. Lett. 2019, 14, 124017. [Google Scholar] [CrossRef]
  43. Araujo, A.G.d.J.; Obregón, G.O.; Sampaio, G.; Monteiro, A.M.V.; da Silva, L.T.; Soriano, B.; Padovani, C.; Rodriguez, D.A.; Maksic, J.; Farias, J.F.S. Relationships between Variability in Precipitation, River Levels, and Beef Cattle Production in the Brazilian Pantanal. Wetl. Ecol. Manag. 2018, 26, 829–848. [Google Scholar] [CrossRef]
  44. Chiaravalloti, R.M.; Freitas, D.M.; de Souza, R.A.; Biswas, S.; Markos, A.; Manfroi, M.N.; Dyble, M. Resilience of Social-Ecological Systems: Drastic Seasonal Change Is Associated with Economic but Not Social Flexibility among Fishers in the Brazilian Pantanal. Ecol. Soc. 2021, 26, 30. [Google Scholar] [CrossRef]
  45. Garcia, L.C.; Szabo, J.K.; de Oliveira Roque, F.; de Matos Martins Pereira, A.; Nunes da Cunha, C.; Damasceno-Júnior, G.A.; Morato, R.G.; Tomas, W.M.; Libonati, R.; Ribeiro, D.B. Record-Breaking Wildfires in the World’s Largest Continuous Tropical Wetland: Integrative Fire Management Is Urgently Needed for Both Biodiversity and Humans. J. Environ. Manag. 2021, 293, 112870. [Google Scholar] [CrossRef] [PubMed]
  46. Marengo, J.A.; Cunha, A.P.; Cuartas, L.A.; Deusdará Leal, K.R.; Broedel, E.; Seluchi, M.E.; Michelin, C.M.; De Praga Baião, C.F.; Chuchón Ângulo, E.; Almeida, E.K.; et al. Extreme Drought in the Brazilian Pantanal in 2019–2020: Characterization, Causes, and Impacts. Front. Water 2021, 3, 639204. [Google Scholar] [CrossRef]
  47. Spracklen, D.V.; Arnold, S.R.; Taylor, C.M. Observations of Increased Tropical Rainfall Preceded by Air Passage over Forests. Nature 2012, 489, 282–285. [Google Scholar] [CrossRef]
  48. Dey, P.; Mishra, A. Separating the Impacts of Climate Change and Human Activities on Streamflow: A Review of Methodologies and Critical Assumptions. J. Hydrol. 2017, 548, 278–290. [Google Scholar] [CrossRef]
  49. Diffenbaugh, N.S.; Singh, D.; Mankin, J.S.; Horton, D.E.; Swain, D.L.; Touma, D.; Charland, A.; Liu, Y.; Haugen, M.; Tsiang, M.; et al. Quantifying the Influence of Global Warming on Unprecedented Extreme Climate Events. Proc. Natl. Acad. Sci. USA 2017, 114, 4881–4886. [Google Scholar] [CrossRef]
  50. Marengo, J.A. Variations and Change in South American Streamflow. Clim. Change 1995, 31, 99–117. [Google Scholar] [CrossRef]
  51. Woodward, C.; Shulmeister, J.; Larsen, J.; Jacobsen, G.E.; Zawadzki, A. The Hydrological Legacy of Deforestation on Global Wetlands. Science 2014, 346, 844–847. [Google Scholar] [CrossRef]
  52. Debortoli, N.S.; Dubreuil, V.; Hirota, M.; Filho, S.R.; Lindoso, D.P.; Nabucet, J. Detecting Deforestation Impacts in Southern Amazonia Rainfall Using Rain Gauges. Int. J. Climatol. 2017, 37, 2889–2900. [Google Scholar] [CrossRef]
  53. Marengo, J.A.; Tomasella, J.; Uvo, C.R. Trends in Streamflow and Rainfall in Tropical South America: Amazonia, Eastern Brazil, and Northwestern Peru. J. Geophys. Res. Atmos. 1998, 103, 1775–1783. [Google Scholar] [CrossRef]
  54. Debortoli, N.S.; Dubreuil, V.; Funatsu, B.; Delahaye, F.; de Oliveira, C.H.; Rodrigues-Filho, S.; Saito, C.H.; Fetter, R. Rainfall Patterns in the Southern Amazon: A Chronological Perspective (1971–2010). Clim. Change 2015, 132, 251–264. [Google Scholar] [CrossRef]
  55. Cigizoglu, H.K.; Bayazit, M.; Önöz, B. Trends in the Maximum, Mean, and Low Flows of Turkish Rivers. J. Hydrometeorol. 2005, 6, 280–290. [Google Scholar] [CrossRef]
  56. De Souza, S.A.; Matos, B.A.; Troger, F.H.; De, T.L.L. Stationarity Analysis of Streamflow Time Series at Paraguai Basin. In Proceedings of the XXII Simpósio Brasileiro de Recursos Hídricos, Brasília, Brazil, 22–27 November 2015; pp. 1–8. [Google Scholar]
  57. Alvares, C.A.; Stape, J.L.; Sentelhas, P.C.; De Moraes Gonçalves, J.L.; Sparovek, G. Köppen’s Climate Classification Map for Brazil. Meteorol. Zeitschrift 2013, 22, 711–728. [Google Scholar] [CrossRef]
  58. Gudmundsson, L.; Bremnes, J.B.; Haugen, J.E.; Engen-Skaugen, T. Technical Note: Downscaling RCM Precipitation to the Station Scale Using Statistical Transformations &ndash; A Comparison of Methods. Hydrol. Earth Syst. Sci. 2012, 16, 3383–3390. [Google Scholar] [CrossRef]
  59. Cavalcante, R.B.L.; da Silva Ferreira, D.B.; Pontes, P.R.M.; Tedeschi, R.G.; da Costa, C.P.W.; de Souza, E.B. Evaluation of Extreme Rainfall Indices from CHIRPS Precipitation Estimates over the Brazilian Amazonia. Atmos. Res. 2020, 238, 104879. [Google Scholar] [CrossRef]
  60. Correia Filho, W.L.F.; de Oliveira-Júnior, J.F.; da Silva Junior, C.A.; Santiago, D.d.B. Influence of the El Niño–Southern Oscillation and the Sypnotic Systems on the Rainfall Variability over the Brazilian Cerrado via Climate Hazard Group InfraRed Precipitation with Station Data. Int. J. Climatol. 2022, 42, 3308–3322. [Google Scholar] [CrossRef]
  61. WMO. Calculation of Monthly and Annual 30-Year Standard Normals; WMO: Ginebra, Switzerland, 1989. [Google Scholar]
  62. Dahmen, E.R.; Hall, M.J. Screening of Hydrological Data: Tests for Stationarity and Relative Consistency; International Institute for Land Reclamation and Improvement/ILRI: Wageningen, The Netherlands, 1990; ISBN 9070754231. [Google Scholar]
  63. Libiseller, C.; Grimvall, A. Performance of Partial Mann-Kendall Tests for Trend Detection in the Presence of Covariates. Environmetrics 2002, 13, 71–84. [Google Scholar] [CrossRef]
  64. Chandrasekaran, S.; Poomalai, S.; Saminathan, B.; Suthanthiravel, S.; Sundaram, K.; Abdul Hakkim, F.F. An Investigation on the Relationship between the Hurst Exponent and the Predictability of a Rainfall Time Series. Meteorol. Appl. 2019, 26, 511–519. [Google Scholar] [CrossRef]
  65. Hurst, H.E.A. A Suggested Statistical Model of Some Time Series Which Occur in Nature. Nature 1957, 180, 494. [Google Scholar] [CrossRef]
  66. Salas, J.D. Analysis and Modeling of Hydrologic Time Series. In Handbook of Hydrology; Maidmend, D.R., Ed.; McGraw-Hill: New York, NY, USA, 1992; pp. 19.1–19.72. [Google Scholar]
  67. Mandelbrot, B.; Wallis, J. Range R/S in the Measurement Long Run Statistical Dependence. Water Resour. Res. 1969, 5, 967–988. [Google Scholar] [CrossRef]
  68. Mirza, M.Q.; Warrick, R.A.; Ericksen, N.J.; Kenny, G.J. Tendances et Persistance Des Précipitations Des Bassins Des Fleuves Gange, Brahmapoutre et Meghna. Hydrol. Sci. J. 1998, 43, 845–858. [Google Scholar] [CrossRef]
  69. Tatli, H. Detecting Persistence of Meteorological Drought via the Hurst Exponent. Meteorol. Appl. 2015, 22, 763–769. [Google Scholar] [CrossRef]
  70. Yue, S.; Pilon, P.; Cavadias, G. Power of the Mann-Kendall and Spearman’s Rho Tests for Detecting Monotonic Trends in Hydrological Series. J. Hydrol. 2002, 259, 254–271. [Google Scholar] [CrossRef]
  71. Stevaux, J.C.; de Azevedo Macedo, D.; Assine, M.L.; Silva, A. Changing Fluvial Styles and Backwater Flooding along the Upper Paraguay River Plains in the Brazilian Pantanal Wetland. Geomorphology 2020, 350, 106906. [Google Scholar] [CrossRef]
  72. Veiga, S.F.; Nobre, P.; Giarolla, E.; Capistrano, V.B.; da Silva, M.B., Jr.; Casagrande, F.; Soares, H.C.; Kubota, P.Y.; Figueroa, S.N.; Bottino, M.J.; et al. Climate Change over South America Simulated by the Brazilian Earth System Model under RCP4.5 and RCP8.5 Scenarios. J. S. Am. Earth Sci. 2023, 131, 104598. [Google Scholar] [CrossRef]
  73. Bruijinzeel, L.A. Hydrology of Moist Tropical Forests and Effects of Conversion: A State of Knowledge Review. Unesco International Hydrological Programme: Paris, France, 1990. [Google Scholar]
  74. Tucci, C.E.M.; Clarke, R.T. Impact Og Changes in Vegetation Cover on Runoff: Review of Terrestrail Hydrological Cycle Processes. Global Cycle Description of Hydrological Processes in the Basin. RBRH Rev. Bras. Recur. Hídr. 1997, 2, 135–152. [Google Scholar]
  75. Blöchl, G.; Ardoin-Bardin, S.; Bonell, M.; Dorninger, M.; Goodrich, D.; Gutknecht, D.; Matamoros, D.; Merz, B.; Shand, P.; Szolgay, J. At What Scales Do Climate Variability and Land Cover Change Impact on Flooding and Low Flows? Hydrol. Process. 2007, 21, 1241–1247. [Google Scholar] [CrossRef]
  76. Chagas, V.B.P.; Chaffe, P.L.B. The Role of Land Cover in the Propagation of Rainfall Into Streamflow Trends. Water Resour. Res. 2018, 54, 5986–6004. [Google Scholar] [CrossRef]
  77. Marques, M.C.S.; Rodriguez, D.A. Impacts of the Landscape Changes in the Low Streamflows of Pantanal Headwaters—Brazil. Hydrol. Process. 2022, 36, e14617. [Google Scholar] [CrossRef]
  78. Lázaro, W.L.; Oliveira-Júnior, E.S.; da Silva, C.J.; Castrillon, S.K.I.; Muniz, C.C. Climate Change Reflected in One of the Largest Wetlands in the World: An Overview of the Northern Pantanal Water Regime. Acta Limnol. Bras. 2020, 32, e104. [Google Scholar] [CrossRef]
  79. Padovani, C.R.; Vettorazzi, C.A.; Shimabukuro, Y.E.; Adami, M.; Morais De Freitas, R. Estudo Das Inundações Do Pantanal a Partir de Imagens MODIS. Available online: http://marte.sid.inpe.br/col/dpi.inpe.br/sbsr@80/2008/11.16.12.48/doc/4805-4812.pdf (accessed on 31 March 2025).
  80. Rao, A.R.; Bhattacharya, D. Effect of Short-Term Memory on Hurst Phenomenon. J. Hydrol. Eng 2001, 6, 125–131. [Google Scholar] [CrossRef]
  81. Silva, C.A.; Lima, M. Soy Moratorium in Mato Grosso: Deforestation Undermines the Agreement. Land Use Policy 2018, 71, 540–542. [Google Scholar] [CrossRef]
  82. Chiaravalloti, R.; Bolzan, F.; Roque, F.; Biswas, S. Ecosystem Services in the Floodplains: Socio-Cultural Services Associated with Ecosystem Unpredictability in the Pantanal Wetland, Brazil. Aquat. Ecosyst. Health Manag. 2022, 25, 72–80. [Google Scholar] [CrossRef]
  83. Were, D.; Kansiime, F.; Fetahi, T.; Cooper, A.; Jjuuko, C. Carbon Sequestration by Wetlands: A Critical Review of Enhancement Measures for Climate Change Mitigation. Earth Syst. Environ. 2019, 3, 327–340. [Google Scholar] [CrossRef]
  84. Lolu, A.J.; Ahluwalia, A.S.; Sidhu, M.C.; Reshi, Z.A.; Mandotra, S.K. Carbon Sequestration and Storage by Wetlands: Implications in the Climate Change Scenario. In Restoration of Wetland Ecosystem: A Trajectory Towards a Sustainable Environment; Springer: Singapore, 2020; pp. 45–58. [Google Scholar]
  85. Wantzen, K.; Beer, F.; Jungkunst, H.; Glatzel, S. Carbon Dynamics in Wetlands. In Encyclopedia of Inland Waters, 2nd ed.; Elsevier: Amsterdam, The Netherlands, 2022; Volume 3, pp. 169–181. [Google Scholar]
  86. De Freitas, D.A.F.; Silva, M.L.N.; Cardoso, E.L.; da Silva Oliveira, D.M.; Moitinho, M.R.; Curi, N. Carbon and Nitrogen Stocks in Soil under Native Pastures in the Pantanal Wetland Biome, Brazil. Agronomy 2024, 14, 1994. [Google Scholar] [CrossRef]
  87. Mônica Harris, M.B.; Tomas, W.; Mour, G.; Da Silva, C.J.; Guimar, E.; Sonoda, A.; Fachim, E. Safeguarding the Pantanal Wetlands: Threats and Conservation Initiatives. Conserv. Biol. 2005, 19, 714–720. [Google Scholar] [CrossRef]
  88. Tomas, W.M.; Andrade, M.H.; Berlinck, C.N.; Bolzan, F.; Camilo, A.R.; Catella, A.C.; Chiaravalloti, R.M.; da Cunha, C.N.; Damasceno Junior, G.A.; Fernando, A.M.E.; et al. Eight Basic Principles for the Elaboration of Public Policies and Development Projects for the Pantanal. Conserv. Sci. Pract. 2024, e13207. [Google Scholar] [CrossRef]
  89. Oliveira, M.R.; Ferreira, B.H.S.; Souza, E.B.; Lopes, A.A.; Bolzan, F.P.; Roque, F.O.; Pott, A.; Pereira, A.M.M.; Garcia, L.C.; Damasceno, G.A.; et al. Indigenous Brigades Change the Spatial Patterns of Wildfires, and the Influence of Climate on Fire Regimes. J. Appl. Ecol. 2022, 59, 1279–1290. [Google Scholar] [CrossRef]
  90. Cristaldo, M.F.; de Souza, C.C.; de Jesus, L.; Padovani, C.R.; de Oliveira, P.T.S.; da Gama Viganó, H.H. Análise e Distribuição Da Rede de Monitoramento de Chuvas Na Região Do Pantanal Brasileiro. Rev. Bras. Meteorol. 2017, 32, 199–205. [Google Scholar] [CrossRef]
Figure 1. Elevation of Upper Paraguay River Basin with corresponding sub-basins.
Water 17 01549 g001
Figure 2. Upper Paraguay River Basin, with Köppen climate zones and corresponding sub-basins.
Water 17 01549 g002
Figure 3. Upper Paraguay River Basin, with corresponding sub-basins, study areas, and rainfall and streamflow gauging stations.
Water 17 01549 g003
Figure 4. The time series of annual rainfall (a) and discharge (b) for the Jauru basin, their correlation (c), and the time series of the downstream flooded area (d).
Water 17 01549 g004aWater 17 01549 g004b
Figure 5. Correlation between annual flooded area (A) of Jauru basin and its mean annual discharge upstream (inflow).
Water 17 01549 g005
Figure 6. The time series of annual rainfall (a) and discharge (b) for the Taquari basin, their correlation (c), and the time series of the downstream flooded area (d) between 1986 and 2023.
Water 17 01549 g006
Figure 7. The correlation between the annual flooded area of the Taquari basin and its mean annual inflow (a), and between A and the mean annual river stage (Q) of the Paraguay river (b).
Water 17 01549 g007
Figure 8. The time series of annual precipitation (a) and streamflow (b) for the Taquari basin, their correlation (c), and the time series of the downstream flooded area (d) between 1986 and 2023.
Water 17 01549 g008
Figure 9. The correlations between the Miranda basin flooded area and the Paraguay river stage (a) and the upland streamflow (b).
Water 17 01549 g009
Figure 10. Time series of Paraguay river stage from 1986 to 2023 (a) and 1901 to 2023 (b).
Water 17 01549 g010
Figure 11. Flooded areas and flood frequency in Pantanal biome, with dark blue colors indicating permanently flooded areas.
Water 17 01549 g011
Disclaimer/Publisher’s Note: The statements, opinions and data contained in all publications are solely those of the individual author(s) and contributor(s) and not of MDPI and/or the editor(s). MDPI and/or the editor(s) disclaim responsibility for any injury to people or property resulting from any ideas, methods, instructions or products referred to in the content.

