Abstract
With the acceleration of urbanization and the increased frequency of extreme rainfall events, flooding has emerged as one of the most serious natural disaster problems, particularly affecting riparian cities. This study conducted a flooding risk assessment and an analysis of the driving factors behind flood disasters in the Songhua River Basin utilizing an improved Soil Conservation Service Curve Number (SCS-CN) model. First, the model was improved by slope adjustments and effective precipitation coefficient correction, with its performance evaluated using the Nash–Sutcliffe efficiency coefficient (NSE) and the Root Mean Square Error (RMSE). Second, flood risk mapping was performed based on the improved model, and the distribution characteristics of the flooding risk were analyzed. Additionally, the Geographical Detector (GD), a spatial statistical method for detecting factor interactions, was employed to explore the influence of natural, economic, and social factors on flooding risk using factor detection and interaction detection methods. The results demonstrated that the improvements to the SCS-CN model encompassed two key aspects: (1) the optimization of the CN value through slope correction, resulting in an optimized CN value of 50.13, and (2) the introduction of a new parameter, the effective precipitation coefficient, calculated based on rainfall intensity and the static infiltration rate, with a value of 0.67. Compared to the original model (NSE = 0.71, rRMSE = 19.96), the improved model exhibited a higher prediction accuracy (NSE = 0.82, rRMSE = 15.88). The flood risk was categorized into five levels based on submersion depth: waterlogged areas, low-risk areas, medium-risk areas, high-risk areas, and extreme-risk areas. In terms of land use, the proportions of high-risk and extreme-risk areas were ranked as follows: water > wetland > cropland > grassland > shrub > forests, with man-made surfaces exacerbating flood risks. Yilan (39.41%) and Fangzheng (31.12%) faced higher flood risks, whereas the A-cheng district (6.4%) and Shuangcheng city (9.4%) had lower flood risks. Factor detection results from the GD revealed that river networks (0.404) were the most significant driver of flooding, followed by the Digital Elevation Model (DEM) (0.35) and the Normalized Difference Vegetation Index (NDVI) (0.327). The explanatory power of natural factors was found to be greater than that of economic and social factors. Interaction detection indicated that interactions between factors had a more significant impact on flooding than individual factors alone, with the highest explanatory power for flood risk observed in the interaction between annual precipitation and DEM (q = 0.762). These findings provide critical insights for understanding the spatial drivers of flood disasters and offer valuable references for disaster prevention and mitigation strategies.
1. Introduction
In recent decades, extreme precipitation events have frequently led to severe flood damage, primarily due to the multifaceted impacts of climate change and the intensification of human activities [1]. On one hand, global climate change and increasing average precipitation are expected to elevate the frequency and intensity of extreme weather events [2,3]. On the other hand, rapid urbanization has significantly altered the surface environment, reducing permeability and impairing drainage efficiency [4,5]. Consequently, flooding has become an increasingly pressing concern, drawing heightened attention from both scholars and policymakers [6,7]. Given these challenges, assessing flood disasters and understanding their spatial variations and driving factors have emerged as critical research priorities [8].
Common methods for flood risk simulation include statistical analysis and hydrological modeling [9,10]. Statistical approaches often rely on historical flood damage records and indicators, but they typically lack integration with hydrological processes and are constrained by data accuracy and geographic coverage [11]. In contrast, hydrological modeling is grounded in mechanistic representations of the full hydrological cycle, dynamically simulating the spatiotemporal patterns of stormwater hazards by integrating observed precipitation datasets [12]. Widely used hydrological models include the Storm Water Management Model (SWMM), the Integrated Catchment Management Model (InfoWorks ICM), and the Soil Conservation Service Curve Number model (SCS-CN). For instance, Rabori et al. estimated flood risk and evaluated the performance of a drainage system in Zanjan City, northwest Iran, using the SWMM [13]. Similarly, Sidek et al. simulated the integrated watershed drainage capacity of the Damansara Catchment in Malaysia using the InfoWorks ICM model [14]. Among these, SWMM is a one-dimensional model, and its simulation outputs cannot be visualized and analyzed. Meanwhile, the InfoWorks ICM is a commercial software, and both models face challenges related to data-intensive parameterization, particularly in the acquisition of high-resolution municipal drainage network datasets when implemented at regional scales [15,16]. In contrast, the SCS-CN model offers advantages in terms of simple parameterization and accessible observational data, making it a popular choice for precipitation-runoff simulation [17,18,19,20].
The standard SCS-CN model was originally developed for small watersheds with average slopes of less than 5% and assumes a constant rainfall intensity by default. Therefore, improving the model’s prediction accuracy often requires the optimization of its parameters and modifications to its structural equations [21]. Common optimization strategies include adjusting the runoff curve number (CN) and the initial abstraction coefficient (λ) based on rainfall [22], slope [23], and soil moisture content [24,25]. For example, Shi et al. enhanced the SCS-CN model by developing an equation that incorporated slope gradient, soil moisture, and storm duration, and used it to estimate surface runoff in a watershed of the Loess Plateau [26]. The results showed that the modified model had a higher simulation accuracy than the original SCS-CN model, with soil wetland factor having the greatest influence on model performance. Additional modifications of the SCS-CN model have focused on refining its assumptions and internal structures. Sahu et al. decomposed the cumulative infiltration assumed by the traditional SCS-CN model into dynamic and static infiltration components, applying the revised model to simulate runoff under various rainfall types in a small watershed in the United States [27]. Ma et al. proposed an improved SCS-CN model based on rainfall amount and the average intensity information, applying it to simulate rainfall runoff in the Loess Plateau region in China [28]. However, most existing improvements focus on single factors, whereas flooding is typically driven by multiple interacting factors. Thus, it is more reasonable to optimize flood risk models from a multi-perspective approach.
Previous studies have demonstrated that flood disasters result from a combination of natural and anthropogenic factors [29]. Understanding the interactions among these drivers is crucial for accurately modeling and predicting flood risks. Both qualitative and quantitative methods have been found in flash flood research. For instance, Scorzini et al. employed qualitative mapping techniques but concluded that such methods were limited due to the use of coarse hazard classifications, reducing their effectiveness for identifying flood-driving factors [30]. On the other hand, Kazmierczak et al. selected 26 indicators related to the natural environment, land use, and socio-economic conditions, and established a flood risk evaluation framework based on the principles of hazard, exposure, and vulnerability, using principal component analysis to assess indicator correlations [31]. However, these studies mainly focus on analyzing factor sensitivities and contribution rates, lacking research on the spatial heterogeneity of factors and their interactions. The Geographical Detector is a spatial statistical method that can identify relationships between multiple factors and complex geographical phenomena without requiring prior assumptions or model restrictions [32]. It can also quantify both the individual contributions of factors and the interactive effects between pairs of factors [33]. Therefore, this study selected 10 indicators covering natural, economic, and social factors, and employed a modified SCS-CN model in combination with the Geographical Detector method to evaluate flood risk in the Songhua River Basin. The main objectives of this study were as follows: (1) to develop an improved SCS-CN model incorporating slope-based CN value optimization and effective precipitation adjustment for surface runoff prediction; (2) to analyze the spatial distribution characteristics of flood risk across the Songhua River Basin using GIS technology; and (3) to explore the driving factors of flood risk using the Geographical Detector method.
2. Materials and Methods
2.1. Study Area
This study was conducted in the mainstem section of the Songhua River, located in Harbin City, Heilongjiang Province (44°04′ N–46°40′ N, 125°42′ E–130°10′ E), covering an area of approximately 5.3 × 10⁴ km2 (Figure 1). The region includes five municipal districts and six counties (Figure 2a). The study area experiences a temperate continental monsoon climate, characterized by an average annual precipitation of 569.1 mm, predominantly concentrated between June and September, which accounts for 70% of the total annual precipitation [34]. The topography exhibits a south-to-north slope, with the main stream of the Songhua River traversing the central part of Harbin City from west to east. The terrain is predominantly composed of extensive plains, interspersed with hilly and mountainous regions, particularly in the eastern and northern areas, including the Lesser Khingan Mountains. The dominant soil type in this region is black soil, which is widely distributed and encompasses a diverse range of subtypes. Historical records indicate that the earliest documented flood in the Songhua River dates back to the Qing Dynasty. Based on historical accounts of heavy rainfall and associated disaster losses, there have been seven significant floods recorded in the 20th century [35].
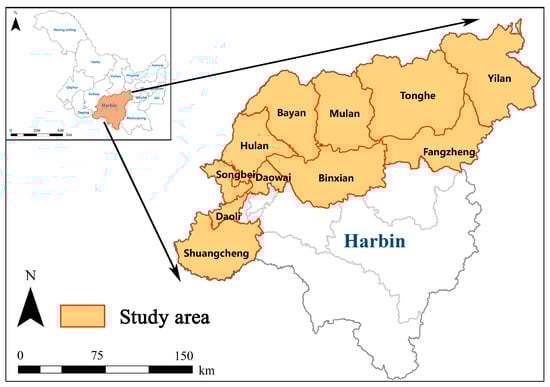
Figure 1.
The study area located in Harbin City of Heilongjiang Province.
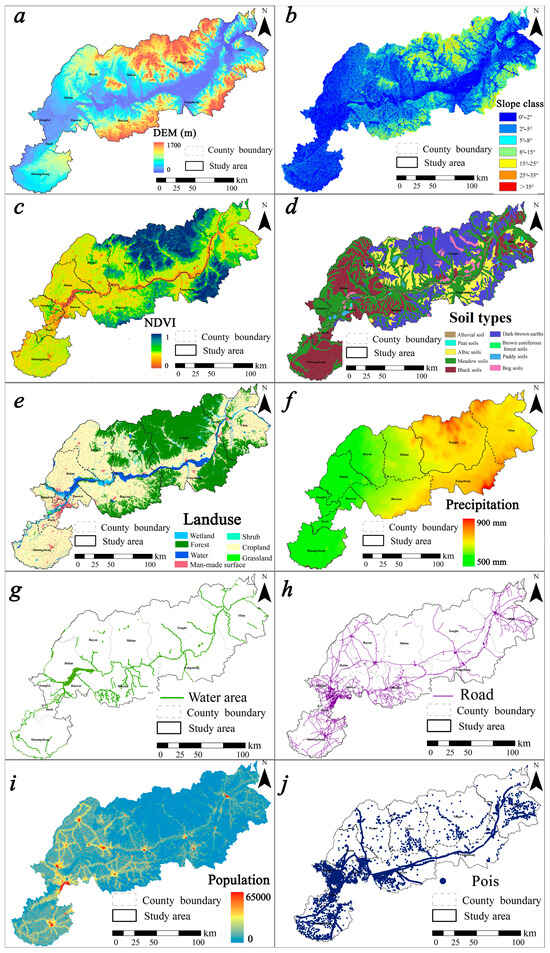
Figure 2.
Thematic layers of landslide conditioning factors, i.e., (a): DEM; (b): slope; (c): NDVI; (d): soil types; (e): land use; (f): precipitation; (g): water system; (h): road system; (i): population density; (j): POI.
2.2. Data Sources
In this study, various datasets were collected for the Songhua River Basin, including meteorological data, geospatial information, land use data, and socio-economic data. The specific data types and data sources are listed in Table 1. All data were converted to a unified projection coordinate system (WGS84), Vector data were spatially interpolated using the Ordinary Kriging method, and all layers were resampled to a resolution of 250 m × 250 m to ensure consistency for subsequent analyses.

Table 1.
The data and variables used in this study.
2.3. Study Design
Figure 3 illustrates the framework employed to investigate the spatial distribution of flood risk, utilizing an enhanced SCS-CN model alongside the driving factors contributing to flood disasters in this study. The workflow consists of three primary components: data processing, modeling, and flood risk and cause analysis. Initially, the CN values and runoff parameters for the SCS-CN model were adjusted based on DEM, slope, land use, and precipitation data. Subsequently, the improved model was applied to assess regional runoff and generate a flood risk map. Finally, GD was employed to identify the driving factors influencing flood risks in the Songhua River Basin.
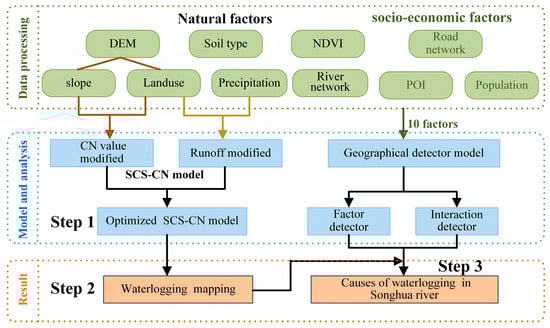
Figure 3.
Diagram of the overall framework of the study.
2.4. Original SCS-CN Model
The SCS-CN model is established based on a water balance model and two fundamental hypotheses: the proportional equality assumption and the initial loss assumption [36]. The model equations are as follows:
where P is the amount of precipitation (mm); F is the amount of infiltration loss; Q is the surface runoff (mm); I is the initial loss of precipitation (including retention and surface storage); S is the potential maximum retention (mm); and λ is the coefficient of the initial loss of precipitation, which is generally taken as the value of 0.2. Therefore, the surface runoff Q can be expressed as:
where the maximum retention S is determined by the soil type, land use, and antecedent soil moisture conditions. To facilitate calculations, a dimensionless parameter CN is introduced to calculate S:
The CN value depends on factors such as soil type, antecedent moisture conditions, vegetation cover, slope, and land use, ranging from 0 to 100.
2.5. Optimization of the Original SCS-CN Model
The optimization of the SCS-CN model in this study was conducted in terms of two main aspects: (1) CN value optimization and (2) the introduction of a new parameter, the effective precipitation coefficient.
2.5.1. CN Value Optimization
The CN values in the original SCS-CN model are derived from flat terrain with a slope of 5%, without accounting for the effects of slope variations on surface runoff. Although the majority areas of the Songhua River Basin consist of plains, the eastern and northern regions feature hilly and mountainous terrain with significant surface undulations. This can introduce uncertainty in the results if the influence of slope changes is not addressed. Therefore, the CN values must be optimized through slope correction. First, various land use types were classified in conjunction with soil types according to slope gradients, allowing for the calculation of the average slope and corresponding area for each land use type. Finally, CN values were computed using the slope correction formulas proposed Huang [23] and Li [37].
where CNm is the slope-corrected CN value, slp is the average slope (%), and CN is the initial CN value from the SCS manual. In this study, the initial CN value was 50.04.
2.5.2. Effective Precipitation Correction Calculation
Previous studies have proposed refining the standard model by decomposing infiltration loss (F) into static infiltration (Fc) and dynamic infiltration (Fd) [38,39], resulting in the following equations:
where Fc is the static loss (mm), Fd is the dynamic loss (mm), fc is the static infiltration rate, (mm/min), and t is the precipitation duration (min).
To unify the denominators in Equations (4) and (9), an effective precipitation correction coefficient k was introduced:
Assuming that the average intensity of rainfall is I’ (mm/min), k can be expressed as:
From the equation, it can be seen that k is mainly related to the infiltration characteristics of the soil in the region, and the value of fc was set as a constant based on the studies of Sahu and Shi [27,40]. The value of I’ was determined from the rainfall intensities of multiple rainfall events in the Songhua River Basin. Both the static infiltration rate and precipitation intensity parameters were calibrated by evaluating the relative Root Mean Square Error (rRMSE) and Nash–Sutcliffe efficiency (NSE) using the step-size optimization parameter algorithm [41]. When rRMSE reached its minimum and NSE its maximum, the corresponding parameter values were identified as optimal. According to the SCS handbook, the soil type of the study area is type B, with a static infiltration rate range of 3.81–7.62 mm/min (step size: 0.1 mm/min). The precipitation intensity values used for calibration were derived from Harbin’s storm intensity formula, ranging from 0.12 to 4.61 mm/min with a step size of 0.3 mm/min. Then, the surface runoff of the Songhua River Basin could be expressed as:
where Q’ is the surface runoff volume of the Songhua River Basin (mm), i is different land use types, A is the total area of the Songhua River Basin area (m2), and Ai is the area of each land use type (m2).
2.5.3. Performance Evaluation of Methods
In this study, the Nash–Sutcliffe efficiency coefficient (NSE) and the relative Root Mean Square Error (rRMSE) were selected to evaluate the performance of the SCS-CN model [42]. The NSE reflects the proximity between the simulated and measured runoff depths, and the value of NSE ranges from (−∞, 1), and the closer the value is to 1, the better the simulation effect of the model, with NSE = 1 being the optimal value. According to Moriasi et al.’s opinion, when the NSE exceeds 0.75, the simulation results are considered good [43]. The NSE can be calculated as follows:
where xi is the observed runoff for the i rainfall (mm), is the observed mean value, is the estimated runoff for the i rainfall (mm), and n is the number of rainfall events.
The rRMSE reflects the proximity of the model’s simulated runoff to the measured runoff; lower values indicate a higher accuracy of the predicted values:
2.6. Inundation Statistics
The inundation area was calculated based on the non-source flood method [44], which involved the following steps: (1) Using the DEM (30 m × 30 m) data of the study area, depression filling was applied to remove sinks, followed by calculating flow direction and flow accumulation to extract information on the drainage network and catchment areas. The DEM-derived results were subsequently refined using actual drainage network data for accuracy corrections. Ultimately, this catchment zoning process delineated the entire study area into 542 individual catchment areas. (2) An improved SCS-CN model was employed to calculate the runoff (Q’, mm) for each threshold, with the volume of runoff at each threshold acquired using the following equation:
where Vr is the volume in the watershed i (m3), Q’ is the runoff depth (mm), and A is the area of watershed i (m2).
(3) Based on the assumption that when Vr approaches the surface volume, the elevation (en) represents the submergence threshold, the region below en was identified as the inundation area [45]. Referring to the “Standard for design of outdoor wastewater engineering” [46] and “Technical code for urban flooding prevention and control” [47], the inundation risk was categorized into five levels: <15 cm (waterlogged area), 15–27 cm (low-risk area), 27–40 cm (medium-risk area), 40–60 cm (high-risk area), and >60 cm (extreme-risk area).
2.7. Geographical Detector Analysis
The Geographical Detector is a spatial statistical model designed to assess spatially stratified heterogeneity, examine the coupling relationships between the spatial distributions of two independent variables, and reveal the spatial correlations among variables [48]. In this study, the flooding risk level in the Songhua River Basin was used as the dependent variable (Y), while selected indicators served as independent variables (X). The interactions between these selected indicators and their correlations with the dependent variable were analyzed using both factor detection and interaction detection methods [32,49].
Factor detection identifies spatial hierarchical heterogeneity in variable Y by detecting factor X. The explanatory power of spatial heterogeneity was measured by the q-statistic, calculated as follows:
where q is the explanatory power of the independent variable for the dependent variable; a higher q value indicates stronger explanatory power, with values ranging between [0, 1]. Here, h is the classification of the independent variable, L is the number of cells of the model, and N and are the total sample size and variance, respectively, while Nh and are the number of samples in the hth stratum and their variance.
The interaction detection method examines the extent to which two distinct influencing factors affect the dependent variable (Y) under their combined effects. The possible interaction relationships are summarized in Table 2. The process involves first computing the q values of the two influencing factors X1 and X2 through factor detection. Next, the q value q(X1∩X2) under the interaction of X1 and X2 is calculated. Finally, the interaction is determined by comparing q(X1), q(X2), and q(X1∩X2).
Table 2.
Types of interaction between two covariates.
3. Results
3.1. Optimization of the SCS-CN Model
3.1.1. Determination of Initial CN Values
The initial Curve Number (CN) values were established based on soil types and land use classifications. According to the U.S. National Engineering SCS Handbook [36], the Songhua River Basin is categorized under soil type B within the SCS-CN model. Referring to relevant studies [50], it was determined that the soil moisture class of the Songhua River Basin is AMCⅠ. Utilizing land use data from 2020, the initial CN values were calculated by weighting the values according to the proportional area of each land use type (Table 3).
Table 3.
CN values in Harbin city under AMCⅠ conditions.
3.1.2. CN Value Optimization Based on Slope Correction
Slope data for the study area were derived from the DEM of the Songhua River Basin, revealing a regional slope range of 0–65.7°. Following the classification of slope categories by the International Geographical Union, the slopes in the study area were divided into seven classes: 0–2° (Level 1), 2–5° (Level 2), 5–8° (Level 3), 8–15° (Level 4), 15–25° (Level 4), 25–35° (Level 6), and 35–65.7° (Level 7). The area and average slope for each land use type were determined using overlay analysis statistics based on slope classification data and land use data (Table 4). The optimized CN values were then obtained through slope weighted calculations (Table 5). As indicated in Table 3, cropland, man-made surfaces, and water bodies were predominantly located in areas with slopes less than 8°. In contrast, forests were distributed across a broader range of slopes from 0° to 25°, with the largest area found in the 8–15° slope category. Areas with slopes exceeding 25° exhibited a decreased distribution of all land use types. Table 4 illustrates that as slope increases, the CN values for each land use type also exhibit an upward trend. Following slope optimization, the CN values for different land use types in the Songhua River Basin were as follows: cropland (51.99), grassland (37.96), shrubland (37.14), man-made surfaces (93.95), forest (35.16), wetland (53.95), and water (97.87). Consequently, the overall weighted CN value for the Songhua River Basin was optimized to 50.13.
Table 4.
The different land use types and slope compositions of Songhua River.
Table 5.
The CN weight values under different slope grade optimizations.
3.1.3. Surface Runoff Optimization Based on Effective Precipitation Correction
The effective precipitation coefficient is associated with both the static infiltration rate and the average precipitation intensity, as indicated by the model Equation (12). To identify the optimal static infiltration rate and precipitation intensity parameters, a sensitivity analysis was conducted to calibrate parameters by calculating NSE and rRMSE. The results of the sensitivity analysis are presented in Figure 4. Figure 4a illustrates the variation trends of NSE and rRMSE with respect to the infiltration rate, revealing a symmetrical pattern. The NSE initially increases and then decreases, ranging from 0.52 to 0.83, with a maximum value of 0.83 achieved at an infiltration rate of 5.7 mm/min. Conversely, rRMSE demonstrates a decreasing trend followed by an increase, with values ranging from 15.43 to 30.78; the minimum value of 15.43 occurs at 5.75 mm/min. Figure 4b shows the variation trends of NSE and rRMSE in relation to rainfall intensity. The NSE shows a similar trend of increasing and then decreasing, with values ranging from 0.54 to 0.82, achieving a maximum of 0.82 at a rainfall intensity of 1.92 mm/min. In contrast, rRMSE decreases and then increases, with values ranging from 15.43 to 30.78, the minimum value of 15.43 was obtained at 5.75 mm/min. When intensity exceeds 4.0 mm/min, the value stabilizes at 0.54. rRMSE reaches its lowest value of 15.43 at 1.9 mm/min (range: 15.88–52.35). Thus, the optimal static infiltration rate and precipitation intensity are determined as 5.75 mm/min and 1.9 mm/min, respectively, resulting in an effective precipitation coefficient (k) of 0.67. The spatial distributions of flood risk are shown in Figure 5.
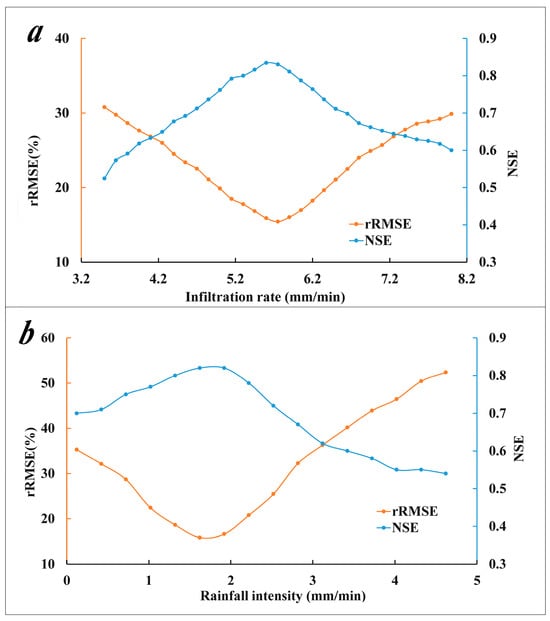
Figure 4.
The change in rRMSE and NSE values under different (a) static infiltration rates and (b) average precipitation intensity values.
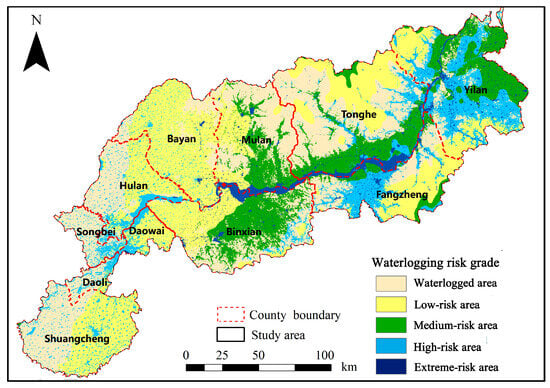
Figure 5.
Flood risk categories mapped based on runoff simulation using improved SCS-CN model.
Using measured runoff data from six rainfall events in 2020 at four hydrological stations (Harbin, Mulan, Tonghe, and Yilan) along the main stream of the Songhua River, both the original and optimized SCS-CN models were employed to conduct runoff simulation calculations for each station. The NSE and rRMSE statistics were evaluated to assess the comparative performance of two methods, as shown in Figure 6. Figure 6a compares the observed runoff to that computed by the original SCS-CN model, revealing a relatively scattered data distribution that does not closely align with the 1:1 line, with an R2 value of 0.73 and calculated NSE and rRMSE values of 0.71 and 19.96, respectively. Conversely, Figure 6b compares the observed runoff to that computed by the improved SCS-CN model, demonstrating that the runoff data points predicted by the improved model are more evenly distributed, predominantly clustering around both sides of the 1:1 line. The R2 value increases to 0.84, while both NSE and rRMSE exhibit improved accuracy compared to the original model, with the NSE value increasing to 0.82 and the rRMSE value decreasing to 15.88.
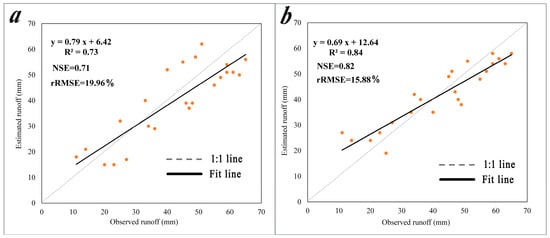
Figure 6.
Scatterplots for the observed and computed runoff by (a) the original SCS-CN model and (b) the improved SCS-CN model from six rainfall events at four hydrological stations in the Songhua River Basin.
3.2. Spatial Distribution of Flooding in the Songhua River Basin
According to the statistical results regarding flood risk levels across different land use types in the Songhua River Basin (Table 6), the total waterlogged area accounts for approximately 32% of the entire region. The low-risk area has the largest distribution, accounting for 34.3% of the total area, while the proportions of the medium-risk, high-risk, and extreme-risk areas decrease sequentially, comprising 16%, 13.2%, and 4.5%, respectively.
Table 6.
The statistics of flood risk in different land use types (km2).
From the perspective of land use types (Table 6, Figure 7 and Figure 8), nearly 58.6% of the cropland area in the Songhua River Basin is classified as waterlogged or low-risk, with 25.2% in the medium-risk area, 14.9% in the high-risk area, and only 1.3% in the extreme-risk area. The risk levels for water bodies in the waterlogged, low-risk, and medium-risk areas account for less than 5%, while high-risk areas constitute 32.5%, and extreme-risk areas represent the largest proportion, nearing 60% of the total area. Grassland types have the largest area of waterlogged regions (54.6%), followed by low-risk (15.8%), while medium-risk, high-risk, and extreme-risk areas account for 12.7%, 14.39%, and 2.48%, respectively. Wetland types display a more balanced risk distribution, with each category occupying approximately 20–35% of the total area, except for extreme-risk areas (3.7%). Shrublands and forests show similar distribution tendencies across different risk levels; as risk level increases, the percentage of the area decreases from waterlogged areas to extreme-risk areas, with extreme-risk areas covering less than 1%. In man-made surface areas, the proportions of waterlogged, low-risk, and medium-risk areas are relatively small, ranging from 6% to 12%, while high-risk and extreme-risk areas are more substantial, accounting for 48.1% and 24.7%, respectively.
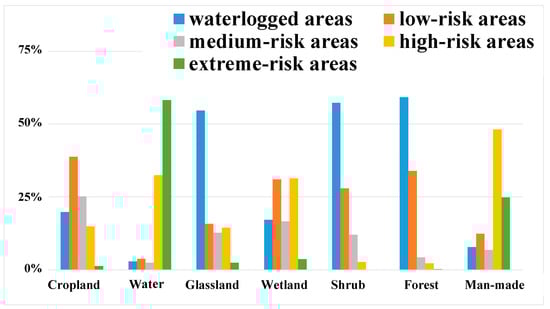
Figure 7.
The proportion of flood risk classes simulated using the improved SCS-CN model in different land use types.
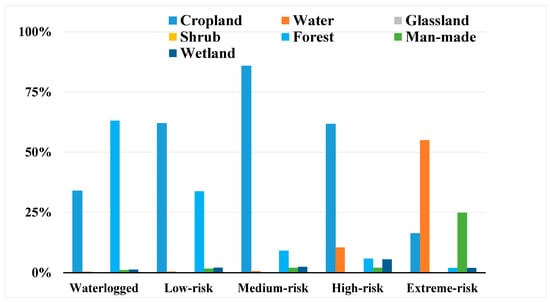
Figure 8.
The proportion of land use types in different flood risk classes simulated by the improved SCS-CN model.
The proportions of the waterlogging risk levels in administrative units across the Songhua River Basin are presented in Table 7 and Figure 9. Significant differences in flood risk are observed among various counties and districts. In terms of waterlogged area distribution, Songbei has the highest proportion at 76.37% (577.6 km2), followed by Mulan at 46.9% (1487.53 km2). Daoli, Shuangcheng, Hulan, and Tonghe also exhibit relatively high proportions, all exceeding 40%, while Daowai has the smallest proportion of waterlogged areas at approximately 1%. The distribution of low-risk areas reveals different scenarios, with Bayan having the highest proportion of low-risk areas at 67.85% (2130.78 km2), followed by Daowai with a proportion above 50%, and Shuangcheng at 48.41% (1507.14 km2). The proportions of low-risk areas in Daoli, Hulan, Mulan, Fangzheng, Bin, and Tonghe are relatively similar, ranging between 20% and 30%, while Songbei has the smallest proportion at 2.78%. For medium-risk areas, Bin has the largest proportion at 33.18% (1243.53 km2), followed by Yilan (29.2% (1345.32 km2)). Daowai, Mulan, and Tonghe also have relatively high proportions of medium-risk areas, all around 20%, while Songbei and Shuangcheng have the smallest proportions, both below 5%. Regarding high-risk and extreme-risk areas, Yilan has the largest proportion of high-risk areas at 39.41% (1815.9 km2), followed by Fangzheng at 31.12% (929.06 km2). Daowai also has a high-risk area proportion exceeding 20%. Bayan has the smallest proportion at 6.39% (200.73 km2), while Shuangcheng, Bin, and Tonghe also have relatively low proportions, all around 10%.
Table 7.
The statistics of flood risk area (km2) and their proportions in different administrative units.
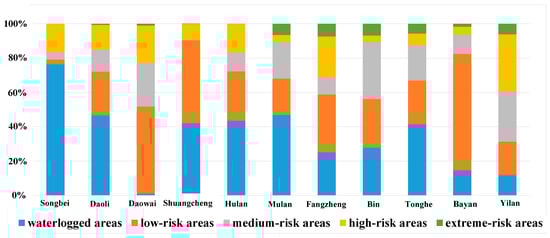
Figure 9.
The proportion of waterlogging risk in different counties and districts of the Songhua River.
3.3. Driving Factor Analysis of Flooding in the Songhua River Basin
To investigate the relationship between flood risk and influencing factors, the GD was employed to perform driver factor analysis and interaction detection analysis on 10 influencing factors, encompassing both the natural and socio-economic elements used in this study. The factor detection results are shown in Figure 10a, where larger q values indicate a stronger explanatory power for flood risk. Among the ten factors, seven exhibited statistically significant effects (p < 0.01), while three were non-significant. The ranking of these factors was as follows: water network density (0.404) > DEM (0.35) > NDVI (0.327) > precipitation (0.276) > slope (0.259) > land use (0.211) > POI data (0.174) > road density (0.149) > population density (0.103) > soil type (0.107). Overall, natural factors exerted a greater influence on flood risk than socio-economic factors.
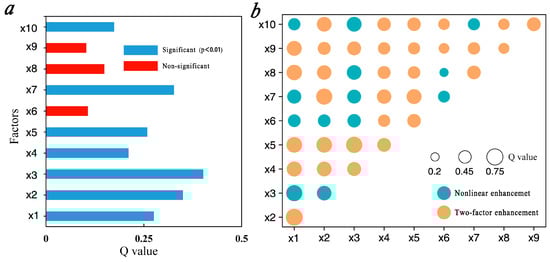
Figure 10.
The results of the Geographical Detector. (a) The explanatory power of the driving factors of waterlogging. (b) The statistical diagram of the explanatory power of two-factor interaction. X1: precipitation, X2: DEM, X3: river networks, X4: slope, X5: land use, X6: soil type, X7: NDVI, X8: road, X9: population, X10: POI data.
In this study, interaction analysis was employed to examine the extent of influence and the interactive relationships among the 10 factors with pairwise interactions on flood disasters in the Songhua River Basin. The results (Figure 10b) demonstrated that only two types of interactions were observed, two-factor enhancement and nonlinear enhancement, with no weakening or independent relationships detected. This indicated that all factors were correlated and that their interactions had a significantly greater impact on flooding than the individual factors alone. The interaction between annual precipitation and DEM had the highest explanatory power (q = 0.762), followed by the interaction between slope and water network density (q = 0.707). The explanatory power of water network density when interacting with any other factor exceeded 0.5. Similarly, interactions involving DEM and slope also played significant roles in determining flood risk in the Songhua River Basin.
4. Discussion
This study optimized the Curve Number (CN) values and effective precipitation coefficients in the SCS-CN model based on land use type, slope, soil type, static infiltration rate, and storm intensity in the Songhua River Basin. The optimized CN values exhibited a positive correlation with increasing slope, consistent with the findings of Forootan et al. [51]. Moreover, the optimized CN values varied across different land use types, with the highest values observed for water bodies and the lowest for forests. This finding aligns with the conclusions of Fu et al. [52] and Soulis et al. [53]. The optimized CN value for the Songhua River Basin was calculated to be 48.03, which significantly differed from the CN value reported by Cai for the same region [50]. This discrepancy can be attributed to differences in study areas and land use composition; specifically, Cai’s study area had 55% man-made surface coverage, resulting in a higher CN value compared to this study, where the CN value was calculated by weighting the area of different land use types [54]. According to the optimization model, the effective precipitation coefficient was related to the static soil infiltration rate and rainstorm intensity. This parameter has been set as a fixed value in some studies [40,55], while others have determined it through parameter calibration [56]. In this study, the soil static infiltration rate was derived from the SCS handbook based on soil characteristics, rather than being measured in the study area. This approach may increase the prediction error of the SCS-CN model. Furthermore, the predictive accuracy of the model is influenced by the interpolation method of the rainfall data. This study employed the Kriging interpolation method, which has demonstrated high accuracy in previous research [57]. However, the effectiveness of the Kriging method is highly dependent on the density of the interpolation data, as it relies on a linear weighting process [58].
The flood risk varied across different land use types. The proportion of water and man-made surfaces in high-risk and extreme-risk areas was 2.5 to 3.5 times higher than that in low-risk and medium-risk areas. Considering the unique hydrological characteristics of water bodies, these findings suggest that man-made surfaces exacerbate flooding by reducing rainwater infiltration. Conversely, the proportion of forests and shrub in low-risk area and medium-risk areas was significantly higher than in high-risk and extreme-risk areas, as well as being much higher than the proportion in the low-risk area and medium-risk area in terms of man-made surfaces, indicating that forests and scrub grasses effectively slow down surface runoff and mitigate urban flood risk [59,60,61]. In terms of administrative units, Acheng and Shuangcheng faced the least flood risk compared to other regions, attributed to their higher elevations and lower population densities. This finding is supported by the results of Jin’s study [62]. In contrast, Nangang and Xiangfang, located in the city center, as well as Yanshou and Yilan in the northeastern part of the basin, exhibited higher flood risks, consistent with the results of Zhang et al. [63]. This distribution reflects the urban characteristics of the Songhua River Basin: Nangang and Xiangfang, which are situated in the city center, have significant impervious surface coverage and an elevated population density. Coupled with aging drainage infrastructure, these urban areas demonstrate heightened vulnerability to flooding events. Yanshou and Yilan, located in suburban areas, feature low-lying terrain and are situated within the lower reaches of the Songhua River. Due to the compounded effects of topographic and hydrological conditions, these regions exhibit substantial susceptibility to flood risk [64].
Water network density emerged as the most significant factor influencing flood risk (q = 0.402), followed closely by DEM (0.350). The interaction between these two factors also demonstrated a high explanatory power for flood risk (q = 0.692), likely due to the unique geographical characteristics of cities along the Songhua River. As a waterfront city traversed by the main stream of the Songhua River, these counties and districts experience significant increases in water flow during heavy rainfall events. The concurrent rise in river water levels creates a backwater effect that substantially diminishes the urban drainage capacity [65]. Furthermore, the topographic characteristics of the Songhua River Basin dictate that precipitation runoff originates from mountainous and hilly areas, ultimately converging into the plain river networks. The nearly 1500 m elevation differential accelerates flow concentration, increasing the likelihood of stagnant water and flooding, which is consistent with the conclusions of Xu et al. [66] and Elsadek et al. [67]. Comparative studies reveal variations in dominant flooding factors across different cities. Xiao et al. identified impermeable surfaces as the primary driving factor of flooding in Wuhan, followed by precipitation and GDP [68]. Similarly, Zheng et al. found that urban spatial structures and impermeable surfaces were the main flooding factors in Guiyang [69]. However, similar factors had lower explanatory power in this study, likely due to geospatial differences among the study areas. The Wuhan study was confined to the flat-terrain central urban area where built-up zones and transportation infrastructure collectively occupy over 50% of the land surface, while Guiyang’s mountainous topography necessitates spatially concentrated building clusters characterized by vertical intensification (predominance of high-rise structures) and elevated floor area ratios, making urban spatial structures a critical flooding factor. Conversely, the extensive territories of counties and districts along the Songhua River encompass not only plains but also substantial areas of hilly and mountainous terrain. Consequently, urban development in this region is more decentralized with significantly lower building density and height compared to mountainous cities. As a result, the drivers of flooding in this region differ from those in other cities. The explanatory power of a single factor in this study was much lower than that of two-factor synergy, indicating that flood occurrences resulted from the combined effects of multiple factors. While population density alone had a weak correlation with flood risk, its interaction with geographical factors significantly enhanced explanatory power, suggesting that the combination of specific topographic conditions and population density increased the risk of flooding [70]. According to the results, the most critical measure is to increase green space coverage to slow down rainwater infiltration rates and reduce surface runoff. Additionally, optimizing drainage channels is essential to enhance the construction of water retention, detention, and drainage capacities in high-risk areas.
5. Conclusions
This study employed the improved SCS-CN model to assess flood risk in the Songhua River Basin, and utilized the Geographical Detector method to investigate the primary driving factors of flooding based on 10 indicators. The results indicated that, with an optimized CN value of 50.13, and an effective precipitation coefficient of 0.67, the improved model demonstrated greater suitability for flood estimation in the Songhua River Basin. Factor detection of GD revealed that natural factors exerted a more significant influence on flood risk than socio-economic factors, identifying them as the most critical driving factors. Furthermore, interaction detection indicated that all factor interactions contributed to an increase in flooding risk, with the interaction between annual precipitation and DEM exhibiting the highest explanatory power; this result underscores the importance of considering factor interactions in flood risk assessments. Our findings suggest that effective measures for flood disaster management include the promotion of sponge city construction to enhance rainwater infiltration, the assurance of urban green space coverage, and the advancement of green infrastructure. Since the soil static infiltration rate was derived from the SCS handbook, it is recommended that future research refine this parameter based on field data that account for local characteristics. Additionally, rapid urbanization has resulted in noticeable changes in land use; therefore, further research should be conducted to evaluate the impact of land use changes on surface runoff, utilizing multi-period spatial and temporal data.
Author Contributions
Conceptualization, K.L. and P.L.; methodology, K.L.; software, Y.Q.; validation, Y.Q., W.X., and Z.W.; writing—original draft preparation, K.L.; writing—review and editing, P.L., Y.Q., W.X., and Z.W.; funding acquisition, Z.W. All authors have read and agreed to the published version of the manuscript.
Funding
This research was funded by the Special Fund of Chinese Central Government for Basic Scientific Research Operations in commonweal Research Institute (GYZX230405).
Data Availability Statement
Dataset available on request from the authors.
Conflicts of Interest
The authors declare no conflicts of interest.
References
- Do, H.X.; Mei, Y.W.; Gronewold, A.D. To What Extent Are Changes in Flood Magnitude Related to Changes in Precipitation Extremes? Geophys. Res. Lett. 2020, 47, e2020GL088684. [Google Scholar] [CrossRef]
- IPCC. Climate Change 2021: The Physical Science Basis; Contribution of Working Group I to the Sixth Assessment Report of the Intergovernmental Panel on Climate Change; Cambridge University Press: Cambridge, UK, 2021. [Google Scholar] [CrossRef]
- Zhang, Y.; Wang, Y.; Chen, Y.; Liang, F.; Liu, H. Assessment of future flash flood inundations in coastal regions under climate change scenarios—A case study of Hadahe River basin in northeastern China. Sci. Total Environ. 2019, 693, 133550. [Google Scholar] [CrossRef] [PubMed]
- Tran, D.; Xu, D.W.; Dang, V.; Alwah, A.A.Q. Predicting Urban Waterlogging Risks by Regression Models and Internet Open-Data Sources. Water 2020, 12, 879. [Google Scholar] [CrossRef]
- Lu, X.H.; Chan, F.K.S.; Chen, W.Q.; Chan, H.K.; Gu, X.B. An overview of flood-induced transport disruptions on urban streets and roads in Chinese megacities: Lessons and future agendas. J. Environ. Manag. 2022, 321, 115991. [Google Scholar] [CrossRef] [PubMed]
- Liu, W.; Zhang, X.; Feng, Q.; Yu, T.F.; Engel, B.A. Analyzing the impacts of topographic factors and land cover characteristics on waterlogging events in urban functional zones. Sci. Total Environ. 2023, 904, 166669. [Google Scholar] [CrossRef]
- Yu, H.F.; Zhao, Y.L.; Fu, Y.C.; Li, L. Spatiotemporal Variance Assessment of Urban Rainstorm Waterlogging Affected by Impervious Surface Expansion: A Case Study of Guangzhou, China. Sustainability 2018, 10, 3761. [Google Scholar] [CrossRef]
- Soomro, S.E.H.; Boota, M.W.; Shi, X.T.; Soomro, G.E.Z.; Li, Y.H.; Tayyab, M.; Hu, C.H.; Liu, C.S.; Wang, Y.Y.; Wahid, J.A.; et al. Appraisal of Urban Waterlogging and Extent Damage Situation after the Devastating Flood. Water Resour. Manag. 2024, 38, 4911–4931. [Google Scholar] [CrossRef]
- Pal, S.; Singha, P. Analyzing sensitivity of flood susceptible model in a flood plain river basin. Geocarto Int. 2022, 37, 7186–7219. [Google Scholar] [CrossRef]
- Islam, T.; Zeleke, E.B.; Afroz, M.; Melesse, A.M. A Systematic Review of Urban Flood Susceptibility Mapping: Remote Sensing, Machine Learning, and Other Modeling Approaches. Remote Sens. 2025, 17, 524. [Google Scholar] [CrossRef]
- Weng, L.; Ma, L.; Xu, F.J. The Urban Rainstorm Disaster Risk Assessment and Defensive Countermeasure—A Case Study of Nanjing of Jiangsu Province. J. Catastrophology 2015, 30, 130–134. [Google Scholar]
- Zoppou, C. Review of urban storm water models. Environ. Model. Softw. 2001, 16, 195–231. [Google Scholar] [CrossRef]
- Rabori, A.M.; Ghazavi, R. Urban Flood Estimation and Evaluation of the Performance of an Urban Drainage System in a Semi-Arid Urban Area Using SWMM. Water Environ. Res. 2018, 90, 2075–2082. [Google Scholar] [CrossRef]
- Sidek, L.M.; Jaafar, A.S.; Majid, W.; Basri, H.; Marufuzzaman, M.; Fared, M.M.; Moon, W.C. High-Resolution Hydrological-Hydraulic Modeling of Urban Floods Using InfoWorks ICM. Sustainability 2021, 13, 259. [Google Scholar] [CrossRef]
- Wang, L.; Li, Y.; Hou, H.; Chen, Y.; Fan, J.; Wang, P.; Hu, T. Analyzing spatial variance of urban waterlogging disaster at multiple scales based on a hydrological and hydrodynamic model. Nat. Hazards 2022, 114, 1915–1938. [Google Scholar] [CrossRef]
- Tramblay, Y.; Bouvier, C.; Martin, C.; Didon-Lescot, J.-F.; Todorovik, D.; Domergue, J.-M. Assessment of initial soil moisture conditions for event-based rainfall-runoff modelling. J. Hydrol. 2010, 387, 176–187. [Google Scholar] [CrossRef]
- Radinja, M.; Skerjanec, M.; Sraj, M.; Dzeroski, S.; Todorovski, L.; Atanasova, N. Automated modelling of urban runoff based on domain knowledge and equation discovery. J. Hydrol. 2021, 603, 127077. [Google Scholar] [CrossRef]
- Liu, W.; Chen, W.; Feng, Q. Field simulation of urban surfaces runoff and estimation of runoff with experimental curve numbers. Urban Water J. 2018, 15, 418–426. [Google Scholar] [CrossRef]
- Sjöman, J.D.; Gill, S.E. Residential runoff—The role of spatial density and surface cover, with a case study in the Hojea river catchment, southern Sweden. Urban For. Urban Green. 2014, 13, 304–314. [Google Scholar] [CrossRef]
- Szwagrzyk, M.; Kaim, D.; Price, B.; Wypych, A.; Grabska, E.; Kozak, J. Impact of forecasted land use changes on flood risk in the Polish Carpathians. Nat. Hazards 2018, 94, 227–240. [Google Scholar] [CrossRef]
- Mishra, S.K.; Singh, V.P. Long-term hydrological simulation based on the Soil Conservation Service curve number. Hydrol. Process. 2004, 18, 1291–1313. [Google Scholar] [CrossRef]
- Soulis, K.X.; Valiantzas, J.D. SCS-CN parameter determination using rainfall-runoff data in heterogeneous watersheds—The two-CN system approach. Hydrol. Earth Syst. Sci. 2012, 16, 1001–1015. [Google Scholar] [CrossRef]
- Huang, M.; Gallichand, J.; Wang, Z.; Goulet, M. A modification to the Soil Conservation Service curve number method for steep slopes in the Loess Plateau of China. Hydrol. Process. 2006, 20, 579–589. [Google Scholar] [CrossRef]
- Mishra, S.K.; Singh, V.P.; Sansalone, J.J.; Aravamuthan, V. A modified SCS-CN method: Characterization and testing. Water Resour. Manag. 2003, 17, 37–68. [Google Scholar] [CrossRef]
- Reshmidevi, T.V.; Jana, R.; Eldho, T.I. Geospatial estimation of soil moisture in rain-fed paddy fields using SCS-CN-based model. Agric. Water Manag. 2008, 95, 447–457. [Google Scholar] [CrossRef]
- Shi, W.; Wang, N. An Improved SCS-CN Method Incorporating Slope, Soil Moisture, and Storm Duration Factors for Runoff Prediction. Water 2020, 12, 1335. [Google Scholar] [CrossRef]
- Sahu Ram, K.; Mishra, S.K.; Eldho, T.I. Improved Storm Duration and Antecedent Moisture Condition Coupled SCS-CN Concept-Based Model. J. Hydrol. Eng. 2012, 17, 1173–1179. [Google Scholar] [CrossRef]
- Ma, Y.X.; Zhang, D.; Pan, C.Z.; Jiang, Y.N. Effects of terrace on the precipitation-runoff process in the Chinese loess areas and application and improvement of SCS-CN model. Trans. Chin. Soc. Agric. Eng. 2022, 38, 85–91. [Google Scholar] [CrossRef]
- Tehrany, M.S.; Jones, S.; Shabani, F. Identifying the essential flood conditioning factors for flood prone area mapping using machine learning techniques. Catena 2019, 175, 174–192. [Google Scholar] [CrossRef]
- Scorzini, A.R.; Leopardi, M. River basin planning: From qualitative to quantitative flood risk assessment: The case of Abruzzo Region (central Italy). Nat. Hazards 2017, 88, 71–93. [Google Scholar] [CrossRef]
- Kazmierczak, A.; Cavan, G. Surface water flooding risk to urban communities: Analysis of vulnerability, hazard and exposure. Landsc. Urban Plan. 2011, 103, 185–197. [Google Scholar] [CrossRef]
- Wang, J.-F.; Li, X.-H.; Christakos, G.; Liao, Y.-L.; Zhang, T.; Gu, X.; Zheng, X.-Y. Geographical Detectors-Based Health Risk Assessment and its Application in the Neural Tube Defects Study of the Heshun Region, China. Int. J. Geogr. Inf. Sci. 2010, 24, 107–127. [Google Scholar] [CrossRef]
- Ju, H.; Zhang, Z.; Zuo, L.; Wang, J.; Zhang, S.; Wang, X.; Zhao, X. Driving forces and their interactions of built-up land expansion based on the geographical detector—A case study of Beijing, China. Int. J. Geogr. Inf. Sci. 2016, 30, 2188–2207. [Google Scholar] [CrossRef]
- Gong, W.F.; Yuan, L.; Fan, W.Y.; Stott, P. Analysis and simulation of land use spatial pattern in Harbin prefecture based on trajectories and cellular automata-Markov modelling. Int. J. Appl. Earth Obs. Geoinf. 2015, 34, 207–216. [Google Scholar] [CrossRef]
- Zhang, S.H.; Wang, T.W.; Zhao, B.H. Calculation and visualization of flood inundation based on a topographic triangle network. J. Hydrol. 2014, 509, 406–415. [Google Scholar] [CrossRef]
- Mishra, S.K.; Singh, V.P. Soil Conservation Service Curve Number (SCS-CN) Methodology; Springer: Dordrecht, The Netherlands, 2003; pp. 84–146. [Google Scholar] [CrossRef]
- Li, J.M.; Zhou, J.C.; Wang, J.L. Optimization of SCS-CN Model in a Mountainous Area on West Bank of Dianchi Lake. Bull. Soil Water Conserv. 2023, 43, 139–147+158. [Google Scholar] [CrossRef]
- Shen, H.B.; Xu, X.Z.; Cao, B.; Wang, H.Z. A distributed SCS-CN model with revised effective precipitation. Adv. Water Sci. 2023, 34, 553–561. [Google Scholar] [CrossRef]
- Wu, A.; Wang, X.; Huang, J.; Huang, J.; Wang, J.; Li, Z. Improvement of SCS-CN model based on antecedent precipitation and rainfall duration. Trans. Chin. Soc. Agric. Eng. 2021, 37, 85–94. [Google Scholar] [CrossRef]
- Shi, W.; Wang, N. Improved SMA-based SCS-CN method incorporating storm duration for runoff prediction on the Loess Plateau, China. Hydrol. Res. 2020, 51, 443–455. [Google Scholar] [CrossRef]
- Willems, P.; Mora, D.; Vansteenkiste, T.; Taye, M.T.; Van Steenbergen, N. Parsimonious rainfall-runoff model construction supported by time series processing and validation of hydrological extremes—Part 2: Intercomparison of models and calibration approaches. J. Hydrol. 2014, 510, 591–609. [Google Scholar] [CrossRef]
- Verma, S.; Singh, P.K.; Mishra, S.K.; Singh, V.P.; Singh, V.; Singh, A. Activation soil moisture accounting (ASMA) for runoff estimation using soil conservation service curve number (SCS-CN) method. J. Hydrol. 2020, 589, 125114. [Google Scholar] [CrossRef]
- Moriasi, D.N.; Arnold, J.G.; Van Liew, M.W.; Bingner, R.L.; Harmel, R.D.; Veith, T.L. Model evaluation guidelines for systematic quantification of accuracy in watershed simulations. Trans. Asabe 2007, 50, 885–900. [Google Scholar] [CrossRef]
- Liu, R.Y.; Liu, N. Flood area and damage estimation in Zhejiang, China. J. Environ. Manag. 2002, 66, 1–8. [Google Scholar] [CrossRef]
- Jia, M.; He, D.; Huo, X.; Zhang, H.; Jia, S.; Zhang, J. Exploring the impact of climate change on flood risk at cultural heritage sites using a GIS-based SCS-CN method: A case study of Shanxi province, China. Int. J. Disaster Risk Reduct. 2023, 96, 103968. [Google Scholar] [CrossRef]
- GB 50014-2021; Standard for Design of Outdoor Wastewater Engineering. Ministry of Housing and Urban-Rural Development: Beijing, China, 2021; p. 286.
- GB 51222-2017; Technical Code for Urban Flooding Prevention and Control. Ministry of Housing and Urban-Rural Development: Beijing, China, 2017; p. 99.
- Wang, J.F.; Xu, C.D. Geographic detector: Principle and prospect. Acta Geogr. Sin. 2017, 72, 116–134. [Google Scholar]
- Wang, J.-F.; Zhang, T.-L.; Fu, B.-J. A measure of spatial stratified heterogeneity. Ecol. Indic. 2016, 67, 250–256. [Google Scholar] [CrossRef]
- Cai, X.H. Research on the Construction of Water Safety Pattern Evalution System and Planning Stratege in Central District of Harbin City. Master’s Thesis, Northeast Forestry University, Harbin, China, 2022. [Google Scholar]
- Forootan, E. GIS-based slope-adjusted curve number methods for runoff estimation. Environ. Monit. Assess. 2023, 195, 489. [Google Scholar] [CrossRef]
- Fu, S.; Wang, H.; Wang, X.; Yuan, A.; Lu, B. The runoff curve number of SCS-CN method in Beijing. Geogr. Res. 2013, 32, 797–807. [Google Scholar] [CrossRef]
- Soulis, K.X.; Ntoulas, N.; Nektarios, P.A.; Kargas, G. Runoff reduction from extensive green roofs having different substrate depth and plant cover. Ecol. Eng. 2017, 102, 80–89. [Google Scholar] [CrossRef]
- Deshmukh, D.S.; Chaube, U.C.; Hailu, A.E.; Gudeta, D.A.; Kassa, M.T. Estimation and comparision of curve numbers based on dynamic land use land cover change, observed rainfall-runoff data and land slope. J. Hydrol. 2013, 492, 89–101. [Google Scholar] [CrossRef]
- Wang, N.; Chu, X. A Modified SCS Curve Number Method for Temporally Varying Rainfall Excess Simulation. Water 2023, 15, 2374. [Google Scholar] [CrossRef]
- Singh, P.K.; Mishra, S.K.; Berndtsson, R.; Jain, M.K.; Pandey, R.P. Development of a Modified SMA Based MSCS-CN Model for Runoff Estimation. Water Resour. Manag. 2015, 29, 4111–4127. [Google Scholar] [CrossRef]
- Zhang, T.; Xu, X.S.; Xu, S.B. Method of establishing an underwater digital elevation terrain based on kriging interpolation. Measurement 2015, 63, 287–298. [Google Scholar] [CrossRef]
- Adhikary, S.K.; Muttil, N.; Yilmaz, A.G. Ordinary kriging and genetic programming for spatial estimation of rainfall in the Middle Yarra River catchment, Australia. Hydrol. Res. 2016, 47, 1182–1197. [Google Scholar] [CrossRef]
- Wang, Y.; Li, S.; Hu, C.; Ren, J.; Liu, P.; Zhao, C.; Zhu, M. Analysis of Surface Runoff Characteristics in Zhengzhou City under Extreme Rainfall Conditions. Sustainability 2024, 16, 6980. [Google Scholar] [CrossRef]
- Acharya, S.; Hori, T.; Karki, S. Assessing the spatio-temporal impact of landuse landcover change on water yield dynamics of rapidly urbanizing Kathmandu valley watershed of Nepal. J. Hydrol. Reg. Stud. 2023, 50, 101562. [Google Scholar] [CrossRef]
- Bhattacharjee, K.; Behera, B. Does forest cover help prevent flood damage? Empirical evidence from India. Glob. Environ. Change-Hum. Policy Dimens. 2018, 53, 78–89. [Google Scholar] [CrossRef]
- Jin, Y.N. Study on Safety Assessment of Rain and Flood Disaster in Harbin Based on GIS. Master’ Thesis, Northeast Forestry University, Harbin, China, 2022. [Google Scholar]
- Zhang, H.L.; Song, L.H.; Liu, H.N.; Xu, Y.Q. Risk Zoning of Flood and Waterlog in Heilongjiang Province. Chin. J. Agrometeorol. 2012, 33, 623–629. [Google Scholar]
- Abuzied, S.; Yuan, M.; Ibrahim, S.; Kaiser, M.; Saleem, T. Geospatial risk assessment of flash floods in Nuweiba area, Egypt. J. Arid. Environ. 2016, 133, 54–72. [Google Scholar] [CrossRef]
- Li, Y.; Zhang, Z.; Gong, S.; Liu, M.; Zhao, Y. Risk assessment of rainstorm disasters under different return periods: A case study of Bohai Rim, China. Ocean. Coast. Manag. 2020, 187, 105107. [Google Scholar] [CrossRef]
- Xu, S.; Zhao, Q.; Ding, S.; Qin, M.; Ning, L.; Ji, X. Improving Soil and Water Conservation of Riparian Vegetation Based on Landscape Leakiness and Optimal Vegetation Pattern. Sustainability 2018, 10, 1571. [Google Scholar] [CrossRef]
- Elsadek, W.M.; Almaliki, A.H. Integrated hydrological study for flash flood assessment using morphometric analysis and MCDA based on hydrological indices-Al-Sail Al-Kabir, KSA. Nat. Hazards 2024, 120, 6853–6880. [Google Scholar] [CrossRef]
- Xiao, S.; Zou, L.; Xia, J.; Dong, Y.; Yang, Z.; Yao, T. Assessment of the urban waterlogging resilience and identification of its driving factors: A case study of Wuhan City, China. Sci. Total Environ. 2023, 866, 161321. [Google Scholar] [CrossRef] [PubMed]
- Zheng, J.W.; Yin, C.Y.; Dai, L.; Zhou, F.; Zhao, Y.H. Analysis of spatial and temporal distribution characteristics and driving factors of inundation in karst mountains, Southwest China at multi-scales: Taking Guiyang City as an example. Water Resour. Hydropower Eng. 2023, 54, 33–46. [Google Scholar] [CrossRef]
- Sinha, R.; Bapalu, G.V.; Singh, L.K.; Rath, B. Flood Risk Analysis in the Kosi River Basin, North Bihar using Multi-Parametric Approach of Analytical Hierarchy Process (AHP). Photonirvachak J. Indian Soc. Remote Sens. 2008, 36, 335–349. [Google Scholar] [CrossRef]
Disclaimer/Publisher’s Note: The statements, opinions and data contained in all publications are solely those of the individual author(s) and contributor(s) and not of MDPI and/or the editor(s). MDPI and/or the editor(s) disclaim responsibility for any injury to people or property resulting from any ideas, methods, instructions or products referred to in the content. |
© 2025 by the authors. Licensee MDPI, Basel, Switzerland. This article is an open access article distributed under the terms and conditions of the Creative Commons Attribution (CC BY) license (https://creativecommons.org/licenses/by/4.0/).