Article

Optimization of Ozonation in Drinking Water Production at Lake Butoniga

1
Faculty of Food Technology and Biotechnology, University of Zagreb, Pierottijeva Str. 6, 10000 Zagreb, Croatia
2
Department for Water Safety and Water Supply, Croatian Institute of Public Health, Rockefeller Str. 7, 10000 Zagreb, Croatia
*
Author to whom correspondence should be addressed.
Water 2025, 17(1), 97; https://doi.org/10.3390/w17010097
Submission received: 2 November 2024 / Revised: 16 December 2024 / Accepted: 27 December 2024 / Published: 1 January 2025

Abstract

:
This study focuses on optimizing the ozonation process in drinking water production from Lake Butoniga to ensure safe water quality while minimizing disinfection by-products (DBPs). Laboratory simulations were conducted using the Box–Behnken design to model the effects of ozone dose and treatment duration on bromate formation, trihalomethanes (THMs), haloacetic acids (HAAs) and specific UV absorption (SUVA). Two ozonation strategies were tested: Strategy 1 aimed to minimize all DBPs, while Strategy 2 focused on controlling bromate levels while keeping THMs, HAAs and SUVA below 80% of maximum contaminant levels. Results showed that Strategy 2 reduced ozone consumption while maintaining water quality within regulatory standards, providing a cost-effective and environmentally sustainable treatment approach. Seasonal and depth-dependent variations in water quality had a significant impact on treatment efficiency and required adjustments to operational settings. The study also addressed discrepancies between laboratory and real plant results and suggested recalibration methods that improved the accuracy of model predictions. These results highlight the potential for integrating predictive modelling and dynamic treatment strategies into large-scale water treatment processes.

Graphical Abstract

1. Introduction

Drinking water is an important resource for human consumption, obtained from natural reservoirs such as lakes, rivers and groundwater. To be considered safe, drinking water must be free of pathogenic microorganisms, have an acceptable concentration of mineral salts and be neutral in colour, odour and taste. Its production involves several stages of physical and chemical treatment, including oxidation, coagulation, flocculation, sedimentation and filtration. These processes remove insoluble particles, disinfect the water and reduce health risks. Oxidation technologies, including chlorine, ozone and ultraviolet light, are commonly used to inactivate microorganisms. The World Health Organization (WHO) publishes guidelines for drinking water quality, which countries can adapt into enforceable national standards depending on local circumstances. In Europe, drinking water standards are set by the European Union (EU) through directives such as Directive (EU) 2020/2184, which are binding on member states. In the United States, the Environmental Protection Agency (EPA) sets legally enforceable drinking water standards under the Safe Drinking Water Act [1,2]. The production of drinking water therefore requires expertise in various technologies and processes as well as the ability to predict demand, which requires detailed knowledge of the physical, chemical and microbial water quality parameters of the source water.
Ozone is a powerful oxidizing agent that can be used for water treatment. It is highly efficient at killing bacteria, viruses and protozoa and is always produced on site. It does not require the transport or storage of hazardous substances. As it disinfects, it oxidizes inorganic and organic contaminants such as iron and manganese [2]. The oxidation of sulphides reduces the need for filtration, which is often a treatment step after oxidation [3]. As ozone is a stronger oxidizing agent than chlorine, it requires a much shorter contact time to remove inorganic/organic compounds than conventional methods. Ozone is the cause of organic substances losing the potential to later form trihalomethanes (THMs) and haloacetic acids (HAAs) when disinfected with chlorine [2]. Prolonged exposure to these compounds is associated with adverse health effects. THMs, such as chloroform, are associated with an increased risk of bladder cancer and possible reproductive problems, while HAAs, such as dichloroacetic acid, can cause liver and kidney toxicity and are considered potential carcinogens [4]. Manganese is converted into an insoluble form by oxidation and removed by rapid filtration processes. However, formation of bromate can occur during the process [5]. In addition to its disinfectant properties, ozone has other advantages: it is environmentally friendly, has a short half-life in water and is subsequently tasteless. As ozone has a half-life of 20 min, no residues remain in the water after this time, meaning that a further disinfectant needs to be added [6]. In wastewater treatment, ozonation degrades recalcitrant organic pollutants, pharmaceuticals and personal care products while reducing biological and chemical oxygen demand. It is particularly effective in removing colour and detoxifying industrial and municipal wastewater, making it a versatile solution for emerging water treatment challenges [7].
The water treatment plant (WTP) of Lake Butoniga in Croatia uses a multi-stage treatment process of ozonation, filtration and coagulation/flocculation to compensate for seasonal fluctuations in water quality [8]. However, the bromides present in the water can form bromates during ozonation, for which a maximum contaminant level of 10 µg/L has been set [1,2]. In summer, the lake experiences thermal stratification, forcing water intake from deeper, more polluted layers rich in dissolved organic compounds, manganese and microbial contaminants. These conditions complicate water treatment and require precise, dynamic process adjustments to ensure water safety [8].
The quality of water bodies can be assessed based on changes in their physical, chemical and biological properties that are attributable to both anthropogenic and natural activities. The assessment of these changes involves taking samples and analysing various parameters [9]. Despite extensive research, there is no universal index for assessing water quality in different countries [10]. For this reason, further research is being conducted to monitor changes in water quality and reliable predictive models are being sought.
This study presents a novel approach to optimize ozonation for drinking water treatment in Lake Butoniga, which includes predictive modelling, seasonal variation analysis and comparison with real plant operation. Using a response desirability profiling model based on the Box–Behnken experimental design, we have developed an advanced tool for predicting water quality outcomes such as bromate, THM and HAA concentrations. This model enables process optimization while ensuring regulatory compliance.
In addition, two ozonation strategies were tested: one that minimizes all disinfection by-products simultaneously and another that focuses on cost-effective bromate control. The latter strategy proved to be beneficial as it balances chemical consumption, treatment time and disinfection effectiveness.
The study also examined seasonal and depth-related changes in water quality and emphasized dynamic treatment strategies that respond to fluctuating concentrations of organics and bromide. In particular, a comparison between model predictions and real plant data led to recalibrated dosing strategies that improve prediction accuracy and practical application. The results show that it is possible to reduce operating costs while ensuring the production of safe drinking water, furthering both scientific understanding and practical solutions for the water industry.

2. Materials and Methods

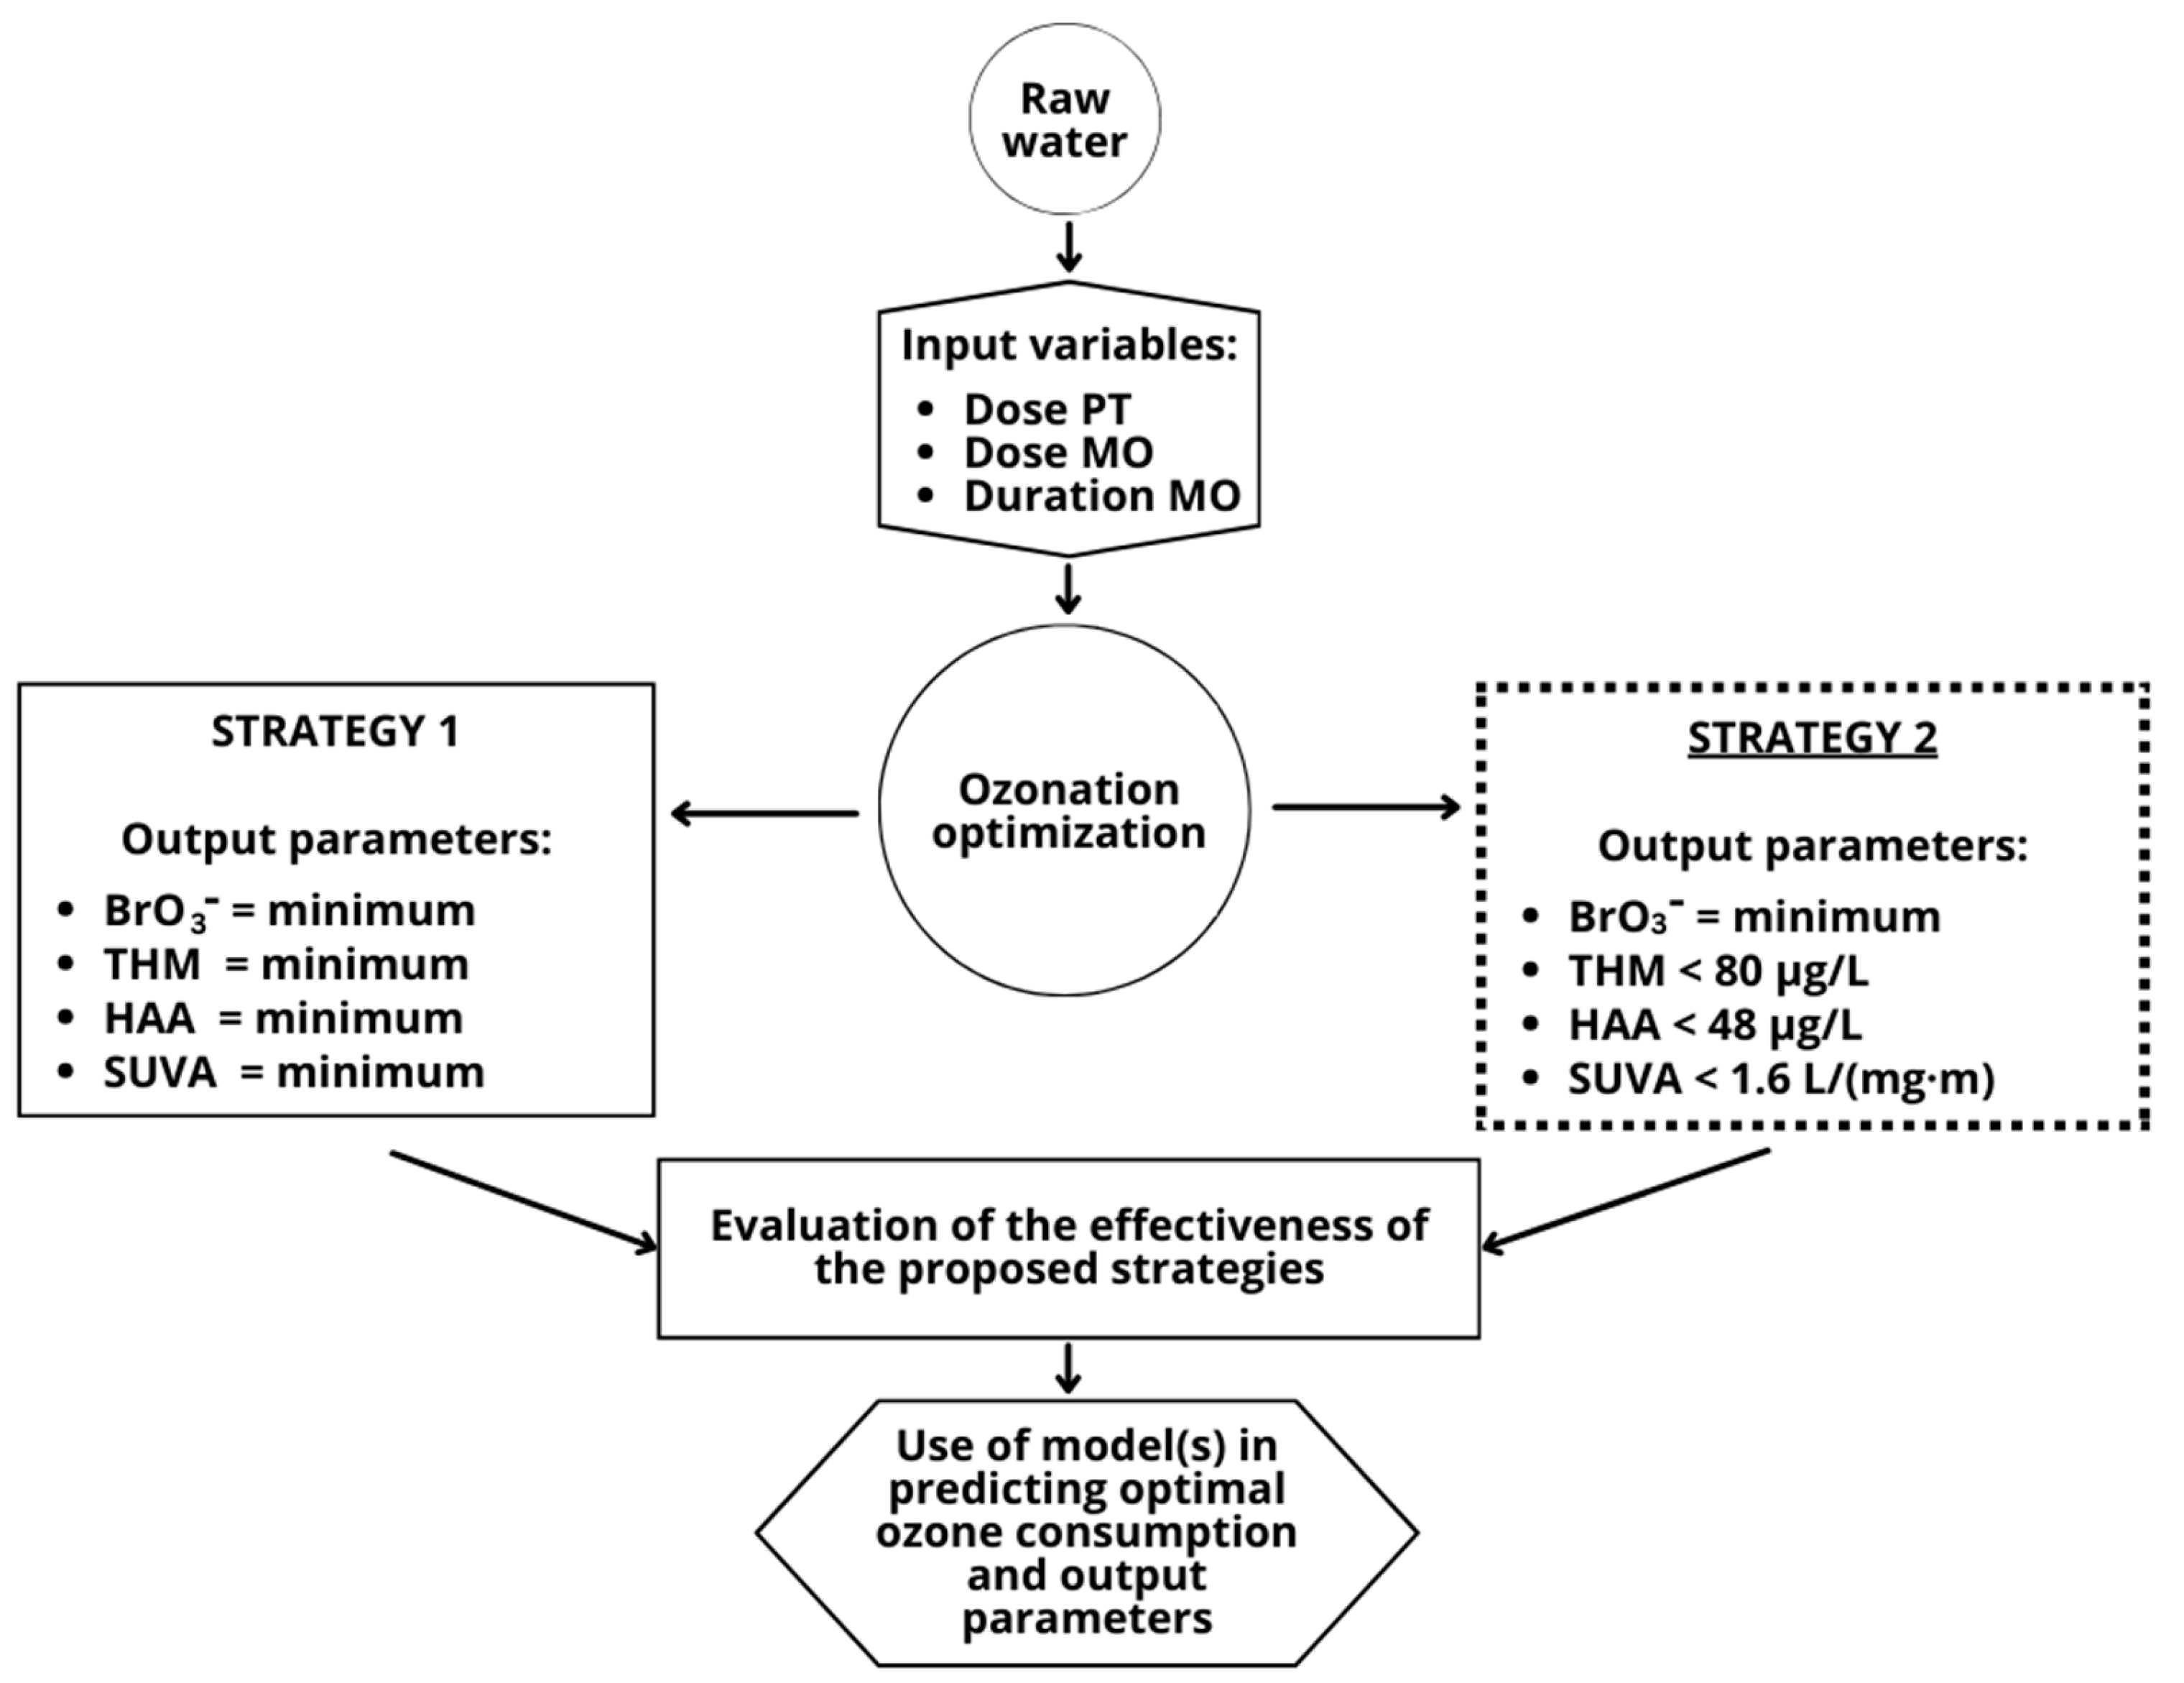
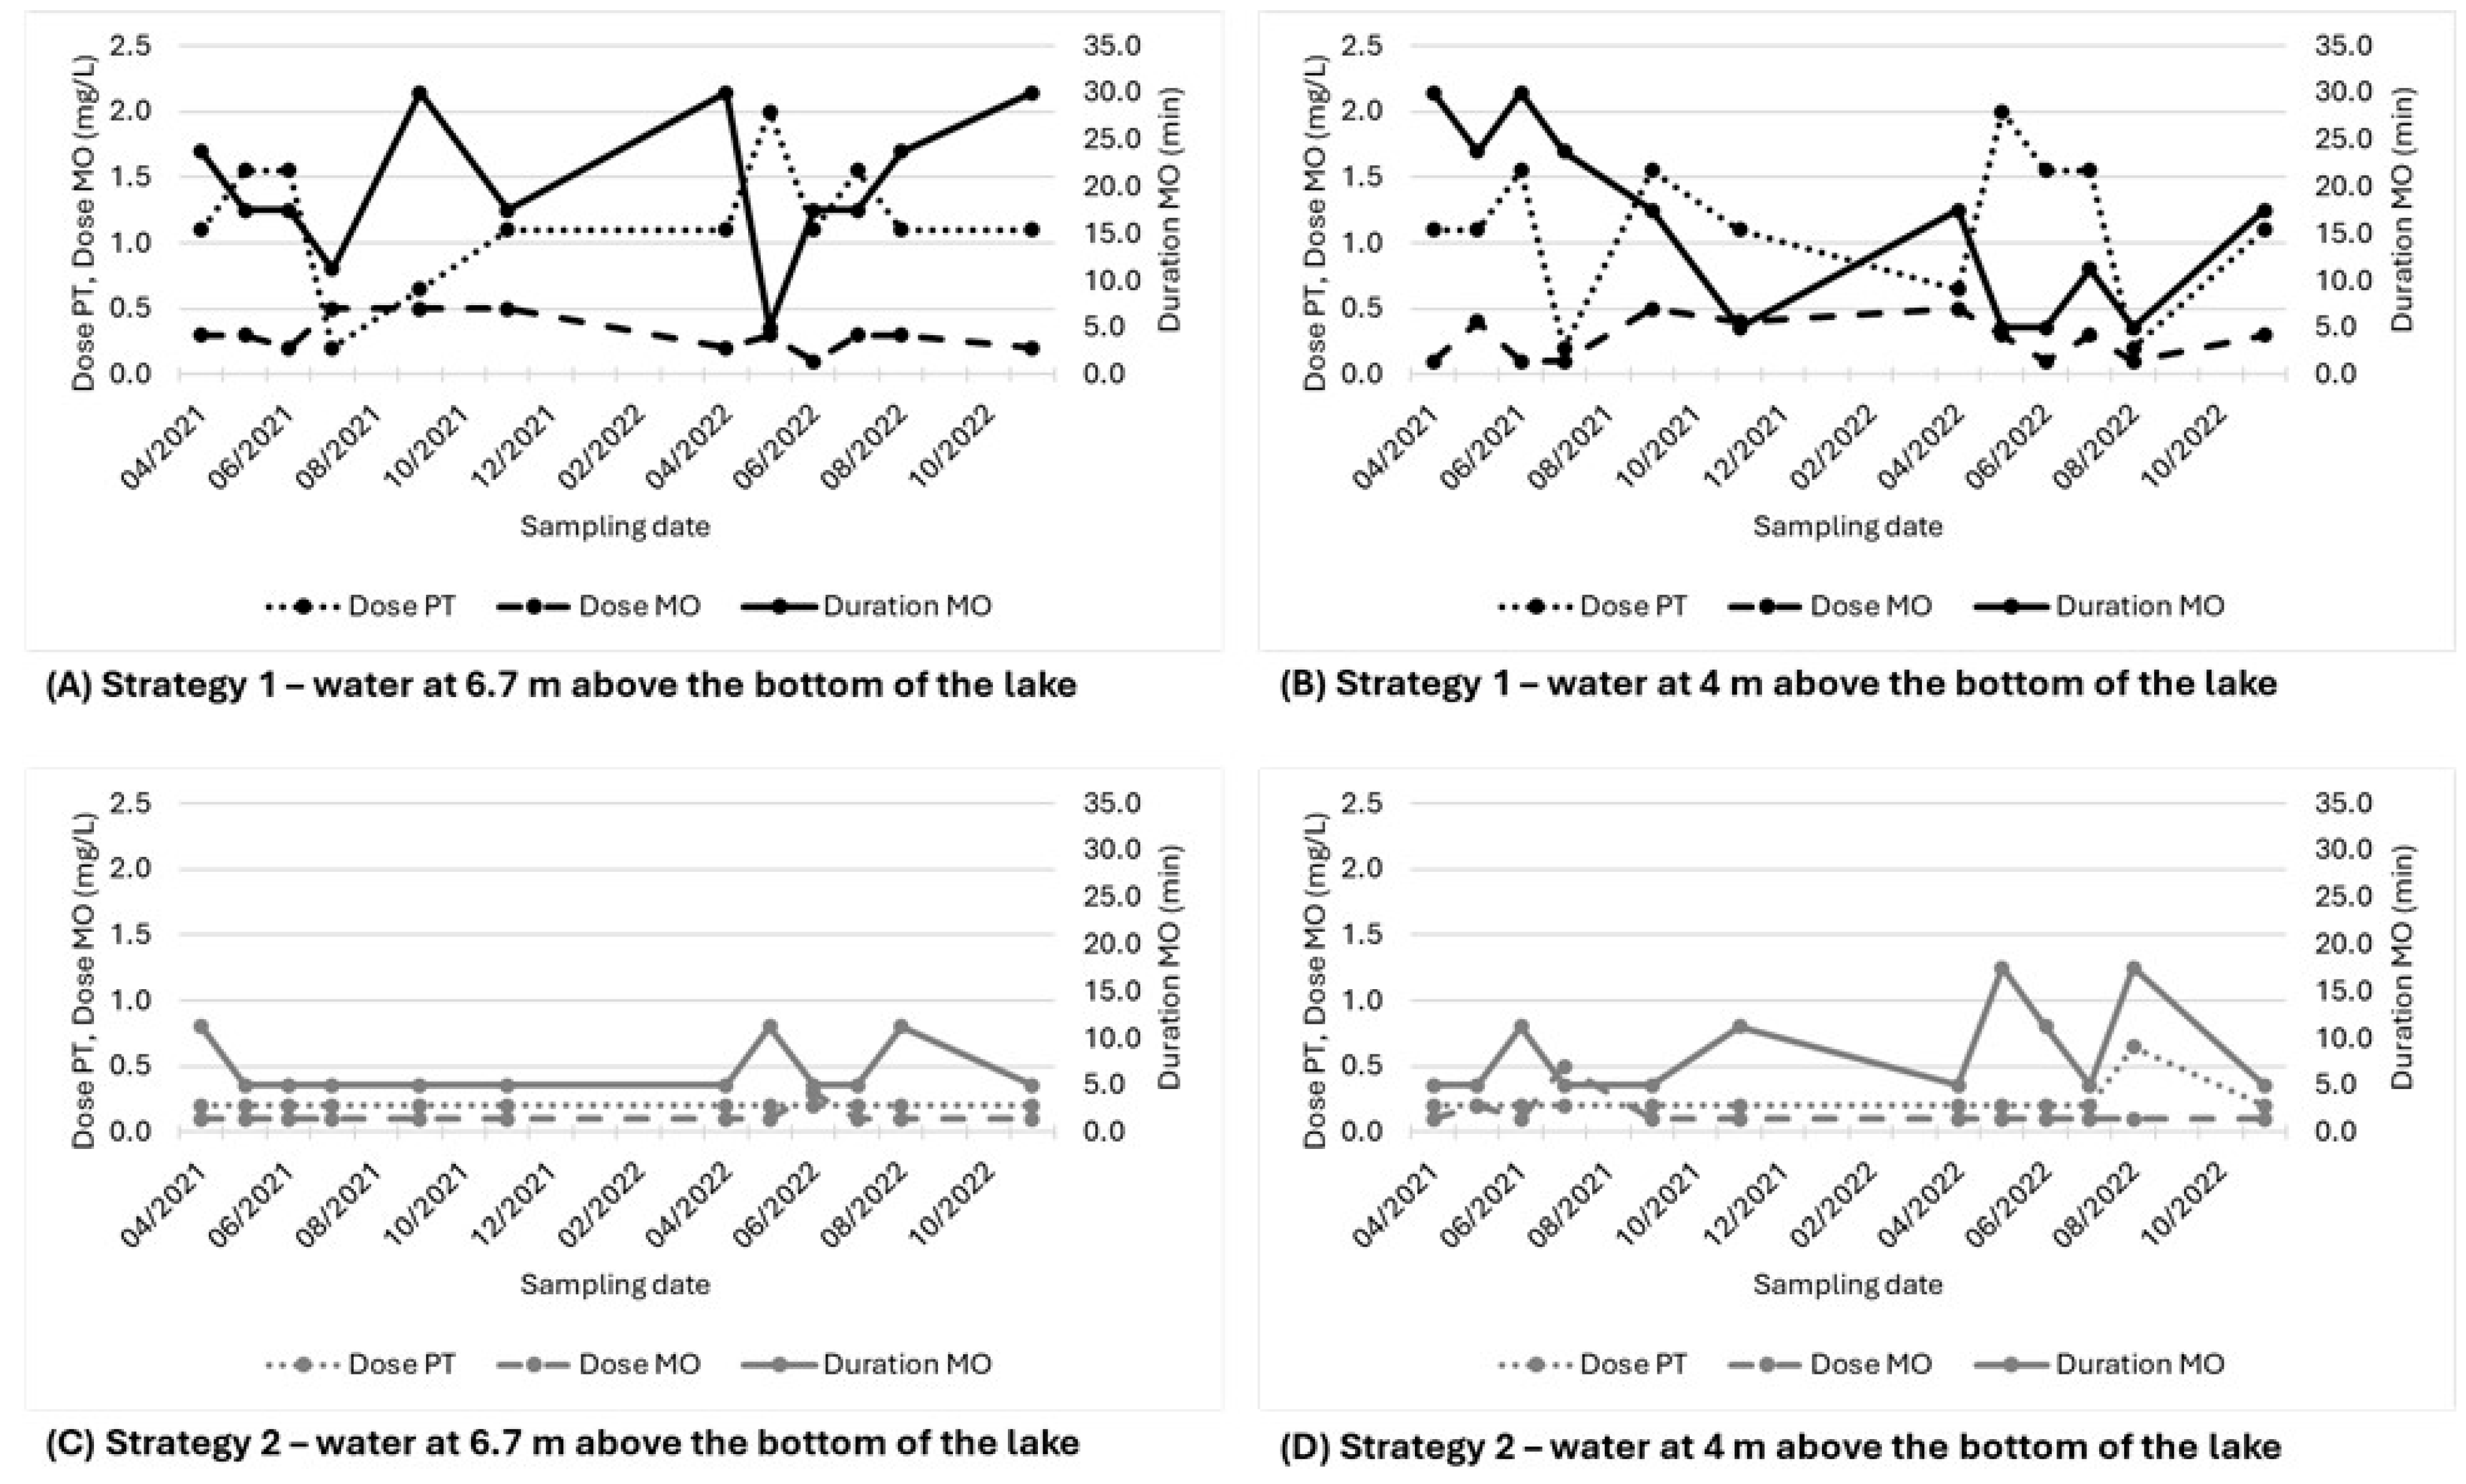
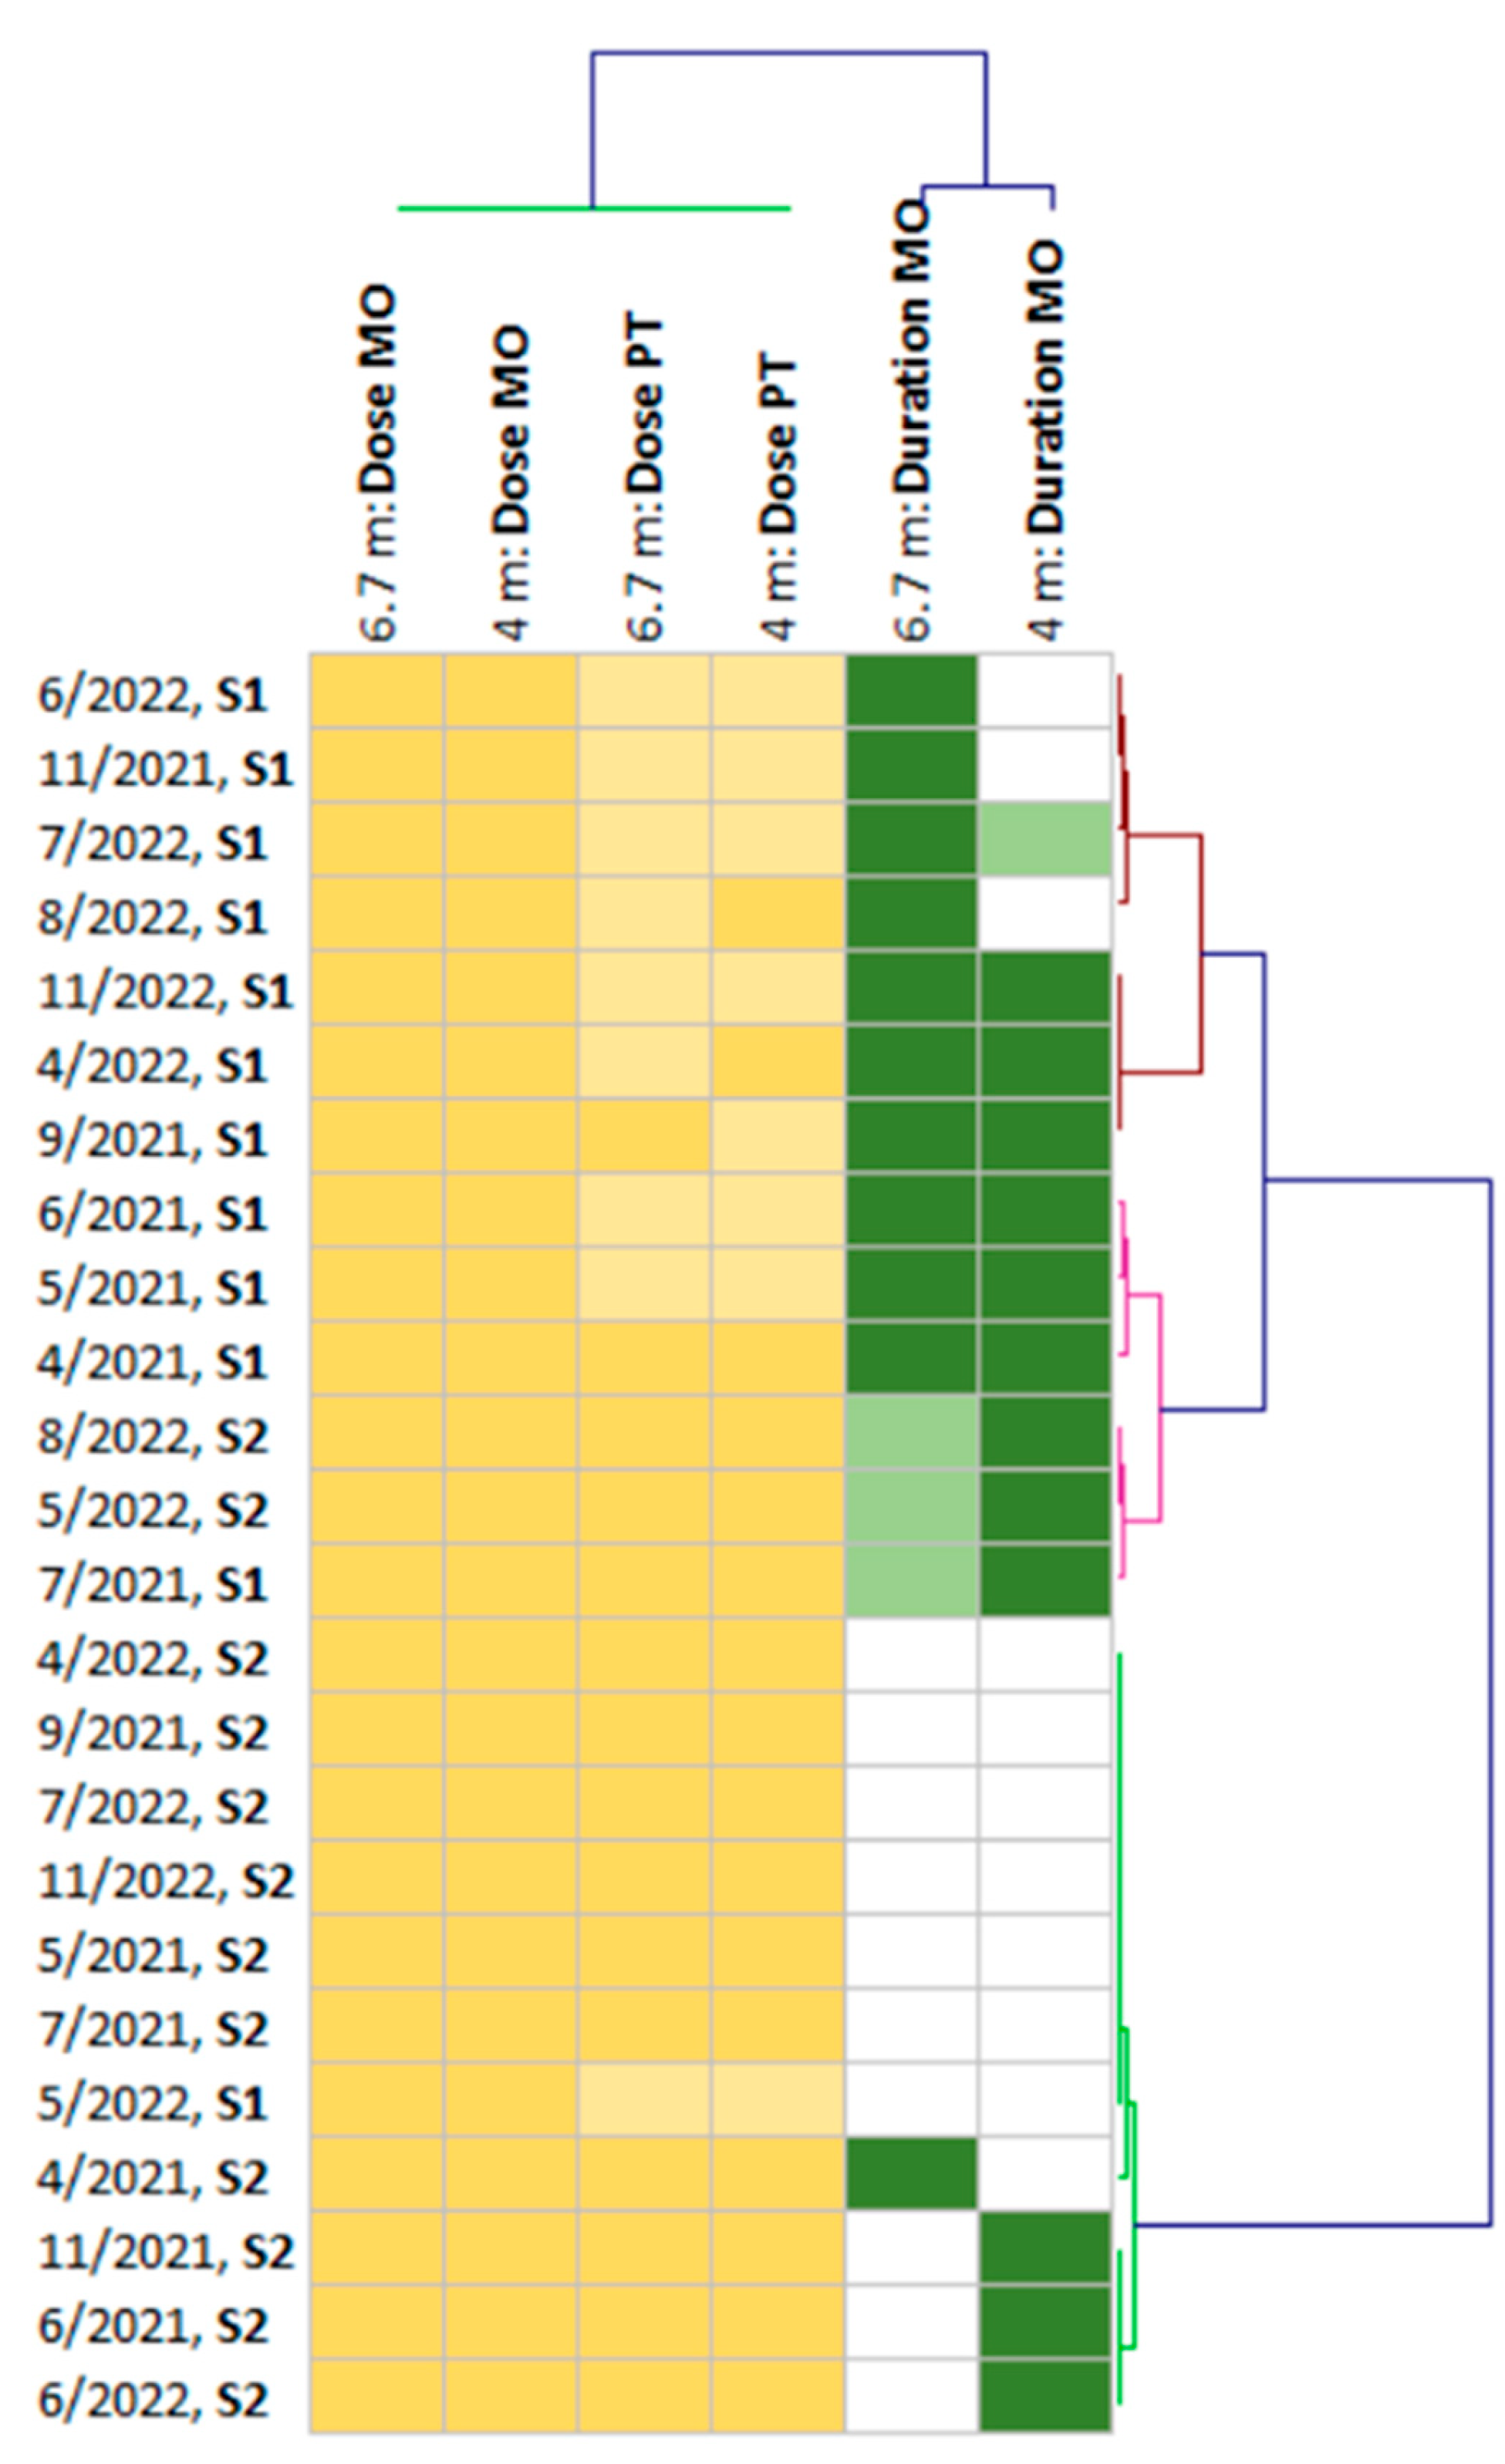
2.1. Water Samples and Design of Experiment

In 2021 and 2022, water samples were taken from the Butoniga WTP, in which the concentration of bromides (Br), bromates (BrO3), dissolved organic carbon (DOC) and the absorbance of UV light at 254 nm (UV254) were determined in the raw water samples and in the water samples after the main ozonation. There were two groups of samples: raw water taken from 6.7 m above the lake bottom and from 4 m above the lake bottom. Lake Butoniga has a maximum depth of 16 metres. These two types of water were taken to the laboratory of the Faculty of Food and Biotechnology in Zagreb, Croatia, where the experiments on water treatment were carried out. The experiments on water treatment in the laboratory tried to simulate the treatment conditions prevailing in the Butoniga WTP. Therefore, the phases of pre-ozonation, flocculation with subsequent filtration and main ozonation were carried out under laboratory conditions. The pre-ozonation and main ozonation phases were carried out in a laboratory ozonation unit according to the Box–Behnken design of experiments [11]. Based on the Box–Behnken design, 17 experiments were conducted for three input parameters: ozone dose at pretreatment (A), ozone dose at main ozonation (B) and ozonation time at main ozonation (C). The actual values for A range from 0.2 to 2 mg/L, for B from 0.1 to 0.5 mg/L and for C from 5 to 30 min. Each experiment combines different values of these parameters to evaluate their impact on the treatment process, with several experiments performed at the central point to ensure reliability.
The flocculation phase was carried out in a jar tester (Phipps & Bird 7790-900B, Richmond, VA, USA) under conditions as similar as possible to those in the water of the Butoniga plant, with a dose of polyaluminium chloride (PAC) (Donau PAC activis, Donauchem Polska Sp. z.o.o., Rokietnica k/Poznania, Poland) ranging from 0.95 to 1.28 mg Al/L. The water sample was then filtered onto 10 µm filter paper (Munktell 389, 150 mm, Falun, Sweden). During flocculation, the flocculant was dosed at the same concentration as in the system. After filtration, the sample was ozonated in a laboratory unit as the main ozonation phase, after which the samples were analysed.

2.2. Ozonation Experiment

The laboratory system for ozonation consisted of columns filled with water through which ozone, produced from oxygen in the generator, was introduced. The collected water samples were processed according to precisely defined ozone concentrations and times according to the Box–Behnken design. The experimental design followed the Box–Behnken methodology, consisting of 17 experimental runs, including five central points, to account for variability and ensure statistical reliability of the model predictions. Under laboratory conditions, 3 L samples were ozonated for 4 min at a dose of 0.2, 1.1 and 2.0 mg/L for the pretreatment phase, and after flocculation and filtration in the main ozonation, 2 L samples were used at a dose of 0.1, 0.3 and 0.5 mg/L for a duration of 5, 15 and 30 min. During ozonation, gas flow conditions of 4 L/min, a pressure of (0.6 ± 0.1) bar and a temperature of (20 ± 1) °C were maintained. The ozone was generated using an ozone generator (A2Z S-10G Industrial Ozone Generator, Louisville, KY, USA), while the dissolved ozone dose was measured using a probe (sealed flowcell with Q46H/64 dissolved ozone monitor, Analytical Technology, Badger Meter, Milwaukee, WI, USA) before the introduction of ozone.

2.3. Chemical Analysis

Various water quality parameters were determined in the samples and used for data processing and modelling, with a focus on Br, BrO3, DOC and UV254. Bromides and bromates were determined by ion chromatography (DIONEX ICS 5000, Thermo Fisher Scientific, Sunnyvale, CA, USA), dissolved organic carbon with a TOC analyser (SHIMADZU TOC-L CSH, Tokyo, Japan) according to the standard method [12], while UV254 was determined spectrophotometrically (HACH DR6000, Loveland, CO, USA). Bromides were measured according to the standard method [13] and bromates according to the standard method [14].

2.4. Data Analysis and Modelling

The Box–Behnken design of the experiment was analysed using Statistica v.14.0 software (Tibco Statistica, Palo Alto, Santa Clara, CA, USA) to obtain optimal conditions for the ozonation process (dose and duration of ozonation in pretreatment (PT) and main ozonation (MO)). Therefore, the following initial values were selected as independent variables to optimise the ozonation process:
  • Trihalomethanes formation potential (FP THM);
  • Haloacetic acids formation potential (FP HAA);
  • Specific UV absorbance (SUVA);
  • Bromate concentration.
The above parameters were selected because there are maximum permissible concentrations for them according to the European Regulation (EU 2020/2184) (bromates at 10 µg/L, THMs at 100 µg/L, HAAs at 60 µg/L) or because there are recommendations from relevant organisations for their recommended value (USEPA [15] recommends that the value for SUVA should be below 2 L/(mg·m)).
The formation potential for THMs and HAAs was determined according to the models used by Chen et al. (2010) [16] and the Br, UV254 and DOC values were used for their calculation. The UV254 and DOC values were also used to calculate the SUVA parameter. The equations used are:
S U V A = U V 254 · 100 D O C
F P   T H M = 1147 · U V 254 0.83 · B r + 1 0.27
F P   H A A = 1151 · D O C 0.17 · U V 254 0.89 · B r + 1 0.60
for which the parameters are expressed as: concentration of dissolved organic carbon (DOC, mg/L) concentration of bromides (Br, mg/L), concentration of bromates (BrO3, mg/L) and absorbance of UV light at 254 nm (UV254, cm−1), specific UV absorbance (SUVA, L/(mg·m)); concentration of formation potential (FP) for trihalomethanes (THMs, µg/L) and haloacetic acids (HAAs, µg/L).
To optimise the input values of the ozonation process, it was decided to adjust the output values according to two strategies. Strategy 1 was to reduce all parameters simultaneously to minimum values and Strategy 2 was to reduce bromate to the lowest possible concentration without the concentrations of the other selected output parameters exceeding 80% of the recommended or maximum allowable values, which is shown in the flow chart (Figure 1).
Strategy 1 aims to minimise all output parameters simultaneously, which often requires higher ozone doses and longer ozonation durations. While this approach is effective in improving water quality, it can increase operating costs. Strategy 2 focuses on achieving minimal variation in treatment conditions, which generally requires lower ozone doses and shorter durations, resulting in lower operating costs while ensuring effective treatment.
The results obtained after the laboratory experiments were later used to optimise the ozone treatment process. Models were created to predict the quality of the treated water depending on the different strategies that can be used in ozone treatment. The optimization was carried out using the response desirability profiling method.

3. Results and Discussion

Two-stage ozonation, which includes both pre-ozonation and intermediate ozonation, is a widely used approach. Pre-ozonation is used for the oxidation of organic and inorganic substances and to improve coagulation, while intermediate ozonation is mainly used for disinfection [17]. In this paper, the results of experiments on a laboratory scale and on real plant are brought together to illustrate their interdependence. The laboratory experiments provided a controlled environment to evaluate the effects of ozone dose and treatment duration on water quality parameters. These findings served as the basis for optimizing ozonation strategies under real operating conditions at Butoniga WTP. By presenting these results together, we highlight how the findings from the laboratory were translated into improvements in the real plant, taking into account operational variations such as water temperature, flow rates and ozone dosing methods. This comparative approach enabled recalibration of the predictive model to ensure its practical application in water treatment processes while ensuring compliance with regulatory standards.
The effectiveness of ozonation lies in its strong oxidizing capacity, which enables it to break down organic and inorganic compounds in the water. The bromides present in raw water are oxidized to bromate through a series of reactions with ozone and hydroxyl radicals, as described by Gunten (2003) [18] and Morrison et al. (2023) [19]. The formation of bromates is influenced by factors such as ozone dose, contact time and the presence of organic material that competes for oxidants and can suppress bromate formation [20]. Dissolved organic carbon and UV-absorbing substances react with ozone to form reactive intermediates that can later generate disinfection by-products (DBPs) such as THMs and HAAs when chlorination follows ozonation [16]. As Sadrnourmohamadi and Gorczyca (2015) [21] have shown, pre-ozonation reduces the formation of DBPs by oxidizing organic precursors and improving coagulation by destabilizing particles. The specific THM in pre-ozonated and coagulated water samples was lower than in the corresponding ozonated waters at all ozone doses tested. This dual effect improves water quality while reducing the dosage of coagulants and chlorine, thereby reducing the overall consumption of chemicals. Agbaba et al. (2015) [22] found that increasing the ozone dose (0.2–0.8 mg O3/mg DOC) generally led to a reduction in DOC (2–26%) and FP THM values (4–58%). This process can also reduce the pressure drop of the filter and extend filter run times [23]. By carefully controlling ozone dosing and treatment duration, the proposed optimization model effectively minimizes bromate formation while keeping THM, HAA and SUVA within regulatory limits. This approach ensures safe and efficient water treatment while maintaining operational sustainability.
Lind et al. (2024) [24] concluded that the application of a small amount of ozone improves sludge coagulation and filtration. The addition of 1.3 mg PAC/mg DOC led to an average reduction in micropollutants of 73%. With the addition of 0.13 mg O3/mg DOC, the reduction increased to 83%, which corresponded to the result of adding 30 mg/L PAC without ozone. The process configuration and operating conditions resulted in no detectable bromate formation despite relatively high bromide levels in the influent. This type of combination of PAC with ozone appears to have several advantages in terms of treatment efficiency and operation.
Water quality in the distribution system is difficult to model due to large variations in water age, pipe condition, non-linear water quality interactions and often rapidly changing hydraulics. The DBP values should be measured at the consumers’ taps or in the distribution system, as their critical values cannot be measured at the outlet of a centralised treatment system [25]. For this reason, modelling from the literature was used in this study to predict the formation potential of THMs and HAAs.
Based on the results of the laboratory experiments, mathematical modelling was carried out to determine the optimal input conditions that would enable successful water treatment. Table 1 shows the water properties before the start of the actual laboratory experiment. Bromide concentrations were relatively low in all samples, ranging from 0.017 to 0.028 mg/L. This indicates a minimal risk of bromate formation during ozonation because, according to von Gunten (2003) [18], the probability of bromate formation during ozonation in water with less than 20 µg/L bromide is very low.
The formation potential for THMs and HAAs can vary seasonally and is influenced by factors such as DOC content and SUVA. Higher values during certain periods, such as April 2021 and November 2022 for water at 6.7 m above the lake bottom and 4 m above the lake bottom, respectively, indicate an increased DBP formation potential due to increased precursors. These seasonal fluctuations illustrate the influence of climate and environmental factors on the water quality parameters. In the study by Tang et al. (2022) [26], significant correlations were found between total bacteria, Mycobacterium spp., Legionella spp., L. pneumophila and DOC. It was concluded that changes in DOC levels can significantly influence the presence of pathogens and the formation of DBPs. The observed values for THMs and HAAs formation potential occasionally exceeded the recommended limits, underlining the need for careful monitoring and optimization of water treatment processes. In particular, the high FP THM and FP HAA values in November 2022 require an adjustment of the treatment strategy to ensure compliance with legal standards and minimise the health risks associated with DBPs. The study by Wilske et al. (2021) [27] emphasised the need to investigate both the chemical background and seasonal behaviour of DOM for effective water quality monitoring using optical parameters, as they concluded that long-term changes in DOM quality, especially in humic-rich raw waters, can lead to intensive adjustments in drinking water treatment. The average values for the sampling levels (6.7 m and 4 m) are listed in Table S1. They confirm statistically significant differences for all observed parameters sampled at different levels, except DOC and SUVA.
To determine the optimum input conditions for ozonation, the desired output values such as FP THM, FP HAA, SUVA and the bromate concentration were defined. Organic chlorinated DBPs were not a major problem, but inorganic DBPs, especially bromate in bromide-containing waters, had to be carefully evaluated. Natural organic substances influence bromate formation through the consumption of intermediates [28]. Reactive organics and bromates were the focus of this study, while manganese was excluded due to its consistent removal at low ozone doses and measurement difficulties. Excess ozone has a negative effect on manganese removal as it causes over-oxidation and the formation of soluble permanganate, emphasising the need for careful control of ozone levels. However, the disadvantage of ozone treatment under optimal conditions is that most of the dissolved organic carbon is not yet degraded [20].
Table 2 shows the optimal values of the input parameters determined by modelling with output values consistent with Strategy 1. The table is divided according to the water abstraction stages. It should be noted that the water at 6.7 m above the lake bottom represents the water at the inlet of the plant.
The key findings from the analysis of the water at 6.7 m above the lake bottom are that when Strategy 1 was applied, the optimal dose and duration of ozonation resulted in higher bromate levels (below the maximum contaminant level in most cases) and low FP THM and FP HAA values, with the exception of a slight spike in July 2022 when the bromate concentration (11.0 µg/L) exceeded the maximum contaminant level, indicating the need for further optimization of the ozonation dose and duration. Similar results were seen for water 4 metres above the bottom, where optimal doses of input conditions generally resulted in low bromate levels, with the lowest value being 1.9 µg/L in September 2021, while the highest bromate concentration was observed in May 2022 (10.3 µg/L). The study shows that careful optimization of ozone dosing in the PT and MO stages can effectively control bromate formation while maintaining low levels of FP THM and FP HAA. Seasonal changes have a significant impact on the optimum ozone doses required for effective water treatment. Adjustments to the duration and dose of ozonation, especially during periods of higher organic loading, are necessary to ensure compliance with safety standards. Seasonal changes have a significant impact on water quality parameters and the formation of disinfection by-products. In the warmer months, higher DOC and UV254 levels are usually recorded due to higher biological activity, while in the colder months, higher SUVA and DBP formation potentials may occur, requiring an adjustment of ozonation strategies [29]. Strategy 1 led to the application of higher ozone doses during pretreatment and main ozonation with a longer duration of the main ozonation due to optimization. When using Strategy 1 to minimise all output parameters, the bromates in the output water exceed the maximum contaminant level in some cases, as highlighted in bold in Table 2. The values of other output parameters (BrO3, SUVA, FP THM and FP HAA) are significantly lower than the maximum allowable or recommended concentrations with this strategy. In addition, this strategy requires more frequent adjustment of the process conditions.
Figure 2 shows the input conditions for the optimum ozone dosage in the PT and MO stages when Strategies 1 and 2 are applied, as well as the duration of ozonation for different raw water samples taken at 6.7 above the lake bottom and 4 m above the lake bottom. For water at 6.7 m above the lake bottom, the optimum ozone doses and durations showed considerable variation for the different sampling dates. These variations indicate that different water qualities throughout the year require customised ozone doses to achieve optimal treatment efficiency (Figure 2A). For water samples taken 4 metres above the lake bottom (Figure 2B), the optimal conditions also varied. The changes in dosage and duration highlight the need to adjust ozonation conditions based on specific water quality conditions at different depths and seasons. Various studies highlight the complexity and variability in modelling ozone depletion and DOM interactions, underlining the importance of precise measurements and tailored adjustment procedures to ensure accurate predictions and optimizations in water treatment processes [19,30]. Strategy 1, which aims to minimise all output parameters simultaneously, often requires higher ozone doses and longer ozonation durations. While this approach is effective in improving water quality, it can also increase operating costs. Therefore, a balance must be found between improving water quality and cost efficiency. The optimum ozonation conditions for different water samples at 6.7 m above the lake bottom are shown in Figure 2C,D. Strategy 2 obviously requires the application of a lower ozone dose in pretreatment and main ozonation with a shorter duration of the main ozonation process, thereby reducing the operating costs of the treatment process. In addition, the adjustment of the treatment process is easier with Strategy 2 as the variation in optimal ozonation conditions is less than with Strategy 1, which can lead to cost savings in terms of ozone consumption and energy consumption while achieving effective disinfection and DBP control. The more stable and predictable treatment parameters under Strategy 2 make it easier to control and adjust the ozonation process, resulting in improved operational efficiency. This is particularly beneficial in large water treatment plants where consistent performance is critical [31].
The quantitative values are shown in Figure 2, but the qualitative differences of the input parameters (dose of PT and MO) are presented with a heat map in Figure 3 where a specific grouping of the parameters of raw water samples mainly from Strategy 2 with very low output parameters (white boxes) can be observed, although the input parameters have the same values, except for the sample collected in May 2022, where the dose of PT was the highest (=2), resulting in the same outputs as the samples with lower input values.
The treatment and management of drinking water is of economic and social interest as it ensures sufficient treatment for different uses while optimising processes and minimising costs. Understanding water quality and the factors that cause changes is essential [32]. Strategy 2 in this study optimises the ozonation conditions throughout the year without adjusting the input variables for each sample. Using general model values (0.2 mg/L ozone in pretreatment, 5 min main ozonation at a dose of 0.1 mg/L) across all samples showed minimal changes in output water quality, making this approach beneficial for consistent performance in large-scale plants. The data in Table 3 and Table 4 indicate that the application of general input conditions does not result in a significant change in the quality of the output water. For the water at 6.7 m above the lake bottom, the ozone doses in the PT and MO stages remained relatively low (0.2 mg/L in PT and 0.1 mg/L in MO), with the duration typically set at 5.0 min. Bromate concentrations were mostly negligible (0.0 µg/L) across all sampling dates, except in June 2022, which showed a slight increase to 1.3 µg/L at a higher MO dose of 0.3 mg/L. The SUVA values were between 0.5 and 1.2 L/(mg·m), which indicates a low content of aromatic organic substances. The FP THM and FP HAA fluctuated but generally remained within acceptable limits, with the highest values observed in April 2021 and November 2022. The close alignment of predicted results between the general and individual models in Table 3 and Table 4 highlights the reliability of using fixed operational parameters, simplifying system management while ensuring stable water quality. This general modelling approach is increasingly advocated in research when modelling is based on a large database, as such models can be more easily applied to other samples, not just those of the case study. The use of black box modelling in critical systems that directly impact public health, such as water treatment plants, raises significant accountability, safety and liability concerns. With increasing interest in the application of data-driven modelling, it is important to ensure that the focus is on creating explanatory or interpretable models. Automation requires improved modelling methods to indirectly strengthen relationships with treatment [32].
Strategy 2 showed effective control of bromate formation and disinfection by-products using constant and lower doses of ozone. This approach minimises the need for frequent adjustments and increases operational efficiency. Predictions of the general model closely matched those of the individual models, emphasising its reliability for practical water treatment applications. This model can streamline operations by reducing the complexity of dosing adjustments. Lower and consistent ozone doses combined with a shorter duration can lead to cost savings in chemical and energy consumption, making Strategy 2 a cost-effective solution for water treatment. To reduce the bromate concentration in the effluent water and reduce the need for parameter adjustment, it is suggested to use Strategy 2 and the input condition values given by the general model, which limit the ozone dose in the pretreatment to 0.2 mg/L, the ozone dose in the main ozonation to 0.1 mg/L and the main ozonation time to 5 min. It should be noted that the model was developed using samples collected over two years and that it applies to the range of input parameters of the water on which the model was built.
After the development of the model and the water treatment strategies under laboratory conditions, predictions for the water quality after the main ozonation in the Butoniga WTP were attempted with the help of the developed model. Water samples were taken at the inlet of the plant and after the main ozonation. Data on water flow, service lines and estimated ozone doses for pre-ozonation and main ozonation were collected from the plant manager. The ozone dose is calculated by measuring the gas flow rate and the differential pressure multiplied by the ozone concentration and the water flow rate. The quality of the source water was estimated by the model and compared with the actual water analysis results (Table 5). A significant discrepancy was found between the model predictions and the actual measurements. The model predicted higher bromate concentrations and lower concentrations of other parameters than observed. The laboratory conditions, including water standing time and constant temperature (20 ± 1) °C, differ from the variable conditions in the plant, but these differences alone do not explain the discrepancies. Differences in dosing methods and ozone concentration measurement techniques between the laboratory and the plant likely contribute to these discrepancies. Measured bromate concentrations were generally lower than model predictions. For example, in April 2021, the measured bromate concentration was 2.0 µg/L, while the model predicted 6.7 µg/L. The SUVA values measured in the plant were consistently higher than the model predictions. In May 2021, for example, the measured SUVA was 1.2 L/(mg·m) compared to the model’s 0.6 L/(mg·m). Higher SUVA values indicate a higher proportion of aromatic organic matter, which may not be fully considered in the model. The measured formation potentials for THMs and HAAs were generally higher than the model predictions. In July 2021, the measured FP THM was 28 µg/L, while the model predicted 31 µg/L. These differences suggest that the model may underestimate the formation potential of these disinfection by-products, particularly in more complex or variable real-world conditions. This analysis highlights the need for further refinement of the model, particularly to improve its accuracy in predicting bromate concentrations and disinfection by-product formation under operational conditions at the WTP. Enhanced calibration of the model to incorporate plant-specific variables and measurement methodologies could help bridge the gap between predictions and observed outcomes.
In view of the inconsistency of ozone calculation and measurement methods, a review was conducted to compare the ozone doses measured in the plant with the doses predicted by the general model. It was found that there was a constant relationship between the ozone concentrations measured at the Butoniga WTP and the concentrations required to achieve similar water quality in the model. The ratios were around 2.3 for the pre-ozonation and around five for the main ozonation doses. Table 6 shows the recalculated ozone doses and the corresponding model predictions. The recalculated doses resulted in model predictions that agreed well with the actual measurements on most days. The recalculated ozone doses and model evaluations provide several insights. The study confirms that low ozone doses (0.3 to 0.7 mg/L) and short ozonation durations can effectively control bromate formation and keep DBP levels low. The model accurately predicts SUVA and FP values with little difference in bromate formation, suggesting that it can be a reliable tool for optimising water treatment processes. The stable SUVA and DBP formation potentials under different dosing conditions indicate that the treatment process is robust and adaptable to seasonal variations in water quality. These results support the further use of the recalculated ozone dosing strategy for efficient and cost-effective water treatment. Further refinement of the model to improve its predictive accuracy for bromate formation could further improve treatment outcomes and operational efficiency.
Although a comprehensive cost analysis is beyond the scope of this study, potential operational savings associated with Strategy 2 can be derived from the lower ozone dosing requirements. Since Strategy 2 uses lower ozone doses for shorter treatment times, energy consumption is expected to decrease significantly. Since ozone production is energy-intensive, minimizing the dose and treatment time directly translates into lower electricity consumption, which in turn contributes to lower operating costs. In addition, Strategy 2 maintains water quality within legal limits while using fewer chemical resources. By maintaining maximum levels for bromates, THMs and HAAs, this strategy supports sustainable and cost-effective water treatment. Future research could include detailed economic modelling to quantify the specific savings associated with energy and chemical consumption in large water treatment plants.
Although the predictive model developed effectively optimized the ozonation process at Lake Butoniga, certain limitations should be acknowledged. The model was based on real water samples collected over a two-year period. Longer-term data could improve its accuracy given the seasonal and climatic variations. In addition, climate change could affect water quality through changes in temperature and precipitation patterns, which would require future recalibration of the model. As the model was tailored to the specific water characteristics of Lake Butoniga, its applicability to other sources without adjustments to other environmental conditions might be limited. Despite these limitations, the model represents a valuable tool for optimizing ozonation that could find broader application through future refinements.
These models can be used to guide the treatment of water with similar raw data, especially for surface waters affected by atmospheric changes due to climate change. The study underlines the advantages of modelling for optimal ozonation compared to conventional treatments and highlights the year-round process efficiency. This opens new perspectives for drinking water treatment and the development of more effective technologies to mitigate the effects of climate change. This research makes an important contribution to environmental management and adaptation to climate change by advancing models for predicting changes in water quality and adapting industrial processes accordingly.

4. Conclusions

The study demonstrated the effectiveness of optimizing the ozonation process in drinking water production from Lake Butoniga through predictive modelling and adaptive treatment strategies. Using a Box–Behnken experimental design-based reaction demand model, water quality outcomes, including concentrations of bromate, THMs, HAAs and SUVA, were successfully predicted, allowing process optimization within regulatory limits. An iterative process with correction factors for ozone dosing improved the prediction accuracy of the model, making it suitable for large-scale applications.
Of the strategies tested, Strategy 2 proved to be the most efficient, reducing ozone dose and treatment duration while maintaining water quality within 80% of maximum contaminant levels. This approach offers significant potential for energy savings and reduced chemical consumption and represents a cost-effective and environmentally sustainable solution for water treatment. The optimal operating conditions determined by the model included 0.2 mg/L ozone in pretreatment and 5 min of main ozonation at a dose of 0.1 mg/L.
Seasonal and depth-related fluctuations in raw water quality emphasized the need for dynamic and responsive treatment strategies. Recalibration methods further strengthened the reliability of the model under variable plant conditions, supporting its integration into large-scale water treatment processes. Future work should include detailed cost analysis and extended field testing in different water treatment plants to validate the wider applicability of the model.

Supplementary Materials

The following supporting information can be downloaded at: https://www.mdpi.com/article/10.3390/w17010097/s1, Table S1: Characteristics of the average samplings for inlet water for all experiments performed (water at 6.7 m and 4 m above the lake bottom).

Author Contributions

Conceptualization, M.M., J.G.K., M.U.B. and J.Ć.; methodology, M.G., J.G.K., D.V. and J.Ć.; validation, J.G.K., M.B., T.J., A.J.T., M.M., M.U.B. and J.Ć.; formal analysis, M.G., D.V., M.B., T.J., A.J.T., V.C. and J.Ć.; investigation, M.G. and V.C.; writing—original draft preparation, M.G.; writing—review and editing, M.G., J.G.K., D.V., M.B., T.J., A.J.T., M.M., M.U.B. and J.Ć.; visualization, M.G.; supervision, M.U.B. and J.Ć.; funding acquisition, M.U.B. All authors have read and agreed to the published version of the manuscript.

Funding

This work is part of the project “Mitigating the negative impacts of Climate Change on the treatment of surface water Reservoirs in drinking water production by flocculation and Ozone” (KK.05.1.1.02.0003) by the Croatian Institute of Public Health and the partner of project University of Zagreb, Faculty of Food Technology and Biotechnology. The project received funding from the European structural and investment funds. The total value of the project is HRK 3,573,786.14.

Data Availability Statement

The data presented in this study are available on request from the corresponding author due to the confidentiality of the data of the Water Treatment Plant of Lake Butoniga (Istrian Water Supply).

Acknowledgments

The authors would like to thank the Istrian Water Supply for their cooperation and help with the experiments.

Conflicts of Interest

The authors declare no conflicts of interest. The funders had no role in the design of the study; in the collection, analyses, or interpretation of data; in the writing of the manuscript; or in the decision to publish the results.

References

  1. European Parliament. Directive (EU) 2020/2184. Qual. Water Intend. Hum. Consum. 2020. Available online: https://eur-lex.europa.eu/legal-content/HR/TXT/?uri=uriserv%3AOJ.L_.2020.435.01.0001.01.HRV&toc=OJ%3AL%3A2020%3A435%3AFULL (accessed on 13 April 2023).
  2. WHO. Guidelines for Drinking-Water Quality: Fourth Edition Incorporating the First and Second Addenda; WHO: Geneva, Switzerland, 2022; Available online: https://www.who.int/publications/i/item/9789241549950 (accessed on 6 June 2024).
  3. Tzvi, Y.; Paz, Y. Highly efficient method for oxidation of dissolved hydrogen sulfide in water, utilizing a combination of UVC light and dissolved oxygen. J. Photochem. Photobiol. A Chem. 2019, 372, 63–70. [Google Scholar] [CrossRef]
  4. Richardson, S.D.; Plewa, M.J.; Wagner, E.D.; Schoeny, R.; DeMarini, D.M. Occurrence, genotoxicity, and carcinogenicity of regulated and emerging disinfection by-products in drinking water: A review and roadmap for research. Mutat. Res.-Rev. Mutat. 2007, 636, 178–242. [Google Scholar] [CrossRef] [PubMed]
  5. Pham, M. Two-Stage Filtration to Control Manganese and DBPS at the Lantern Hill Water Treatment Plant. Environ. Water Resour. Eng. Masters Proj. 2010, 51, 11–12. Available online: https://scholarworks.umass.edu/cee_ewre (accessed on 28 December 2023).
  6. O’Donnell, C.; Tiwari, B.K.; Cullen, P.J.; Rice, R.G. Ozone in Food Processing; Blackwell Publishing: West Sussex, UK, 2012. [Google Scholar]
  7. Rosal, R.; Rodríguez, A.; Perdigón-Melón, J.A.; Mezcua, M.; Hernando, M.D.; Letón, P.; García-Calvo, E.; Agüera, A.; Fernán-dez-Alba, A.R. Removal of pharmaceuticals and kinetics of mineralization by O3/H2O2 in a biotreated municipal wastewater. Water Res. 2008, 42, 3719–3728. [Google Scholar] [CrossRef]
  8. IVB. Akumulacija Butoniga. 2023. Available online: https://www.ivb.hr/o-vodovodu/distribucija-i-izvori/akumulacija-butoniga/ (accessed on 6 June 2024).
  9. Britto, F.B.; Vasco, A.N.D.; Aguiar Netto, A.D.O.; Garcia, C.A.B.; Moraes, G.F.O.; Silva, M.G.D. Surface water quality assessment of the main tributaries in the lower São Francisco River, Sergipe. Rev. Bras. Recur. Hidricos 2018, 23, e28. Available online: https://www.scielo.br/j/rbrh/a/BBJ9HdwX9wrtFdYcP3RLkFx/?lang=en (accessed on 4 June 2024). [CrossRef]
  10. Paun, I.; Cruceru, L.V.; Chiriac, F.L.; Niculescu, M.; Vasile, G.G.; Marin, N.M. Water Quality Indices-Methods for Evaluating the Quality of Drinking Water. In The Environment and the Industry, Proceedings of the INCD ECOIND—International Symposium—SIMI 2016, Bucharest, Romania, 13–14 October 2016; 2016; pp. 395–402. Available online: https://www.researchgate.net/publication/309304038_WATER_QUALITY_INDICES_-_METHODS_FOR_EVALUATING_THE_QUALITY_OF_DRINKING_WATER (accessed on 4 June 2024).
  11. Montgomery, D.C.; Wiley, J. Design and Analysis of Experiments, 8th ed.; John Wiley & Sons, Inc.: Hoboken, NJ, USA, 2013. [Google Scholar]
  12. HRN EN 1484:2002; Water Analysis—Guidelines for the Determination of Total Organic Carbon (TOC) and Dissolved Organic Carbon (DOC) (EN 1484:1997) (Reference Method). HZN: Zagreb, Croatia, 2002.
  13. HRN EN ISO 10304-1:2009/Ispr.1:2012; Water Quality—Determination of Dissolved Anions by Liquid Chromatography of Ions—Part 1: Determination of Bromide, Chloride, Fluoride, Nitrate, Nitrite, Phosphate and Sulfate—Technical Corrigendum 1 (ISO 10304-1:2007/Cor 1:2010; EN ISO 10304-1:2009/AC:2012) (Reference Method). HZN: Zagreb, Croatia, 2012.
  14. HRN EN ISO 15061:2001; Water Quality—Determination of Dissolved Bromate—Method by Liquid Chromatography of Ions (ISO 15061:2001; EN ISO 15061:2001) (Reference Method). HZN: Zagreb, Croatia, 2001.
  15. USEPA. Disinfectants and Disinfection Byproducts Rules (Stage 1 and Stage 2). 2020. Available online: http://nepis.epa.gov/Exe/ZyPDF.cgi?Dockey=P100C8XW.txt (accessed on 10 June 2024).
  16. Chen, B.; Westerhoff, P. Predicting disinfection by-product formation potential in water. Water Res. 2010, 44, 3755–3762. [Google Scholar] [CrossRef]
  17. Ikehata, K. Recent Research on Ozonation By-products in Water and Wastewater Treatment: Formation, Control, Mitigation, and Other Relevant Topics. In Energy, Environment, and Sustainability; Springer: Singapore, 2019; pp. 117–144. [Google Scholar]
  18. Von Gunten, U. Ozonation of drinking water: Part II. Disinfection and by-product formation in presence of bromide, iodide, or chlorine. Water Res. 2003, 37, 1469–1487. [Google Scholar] [CrossRef]
  19. Morrison, C.M.; Hogard, S.; Pearce, R.; Mohan, A.; Pisarenko, A.N.; Dickenson, E.R.V.; von Gunten, U.; Wert, E.C. Critical Review on Bromate Formation during Ozonation and Control Options for Its Minimization. Environ. Sci. Technol. 2023, 57, 18393–18409. [Google Scholar] [CrossRef]
  20. Jeirani, Z.; Sadeghi, A.; Soltan, J.; Roshani, B.; Rindall, B. Effectiveness of advanced oxidation processes for the removal of manganese and organic compounds in membrane concentrate. Sep. Purif. Technol. 2015, 149, 110–115. [Google Scholar] [CrossRef]
  21. Sadrnourmohamadi, M.; Gorczyca, B. Effects of ozone as a stand-alone and coagulation-aid treatment on the reduction of trihalomethanes precursors from high DOC and hardness water. Water Res. 2015, 73, 171–180. [Google Scholar] [CrossRef] [PubMed]
  22. Agbaba, J.; Molnar, J.; Tubić, A.; Watson, M.; Maletić, S.; Dalmacija, B. Effects of water matrix and ozonation on natural organic matter fractionation and corresponding disinfection by-products formation. Water Sci. Technol. Water Supply 2015, 15, 75–83. [Google Scholar] [CrossRef]
  23. Mazloum, S.; Jasim, S.; Biswas, N.; Rakness, K.; Hunter, G. Improvement and optimization of the A.H. Weeks water treatment plant processes, Windsor, ON, Canada. Ozone Sci. Eng. 2004, 26, 125–140. [Google Scholar] [CrossRef]
  24. Lind, P.; Sauvignet, P.; Flodin, J.; Bourghardt, C.; Bengtsson, S. Pilot scale removal of organic micropollutants by combining ozonation with powdered activated carbon. Water Pract. Technol. 2024, 19, 2255–2266. [Google Scholar] [CrossRef]
  25. May, R.J.; Dandy, G.C.; Maier, H.R.; Nixon, J.B. Application of partial mutual information variable selection to ANN forecasting of water quality in water distribution systems. Environ. Model. Softw. 2008, 23, 1289–1299. [Google Scholar] [CrossRef]
  26. Tang, W.; Liu, Y.; Li, Q.; Chen, L.; Li, Q.; Li, P.; Xia, S. The Impact of Extreme Weather Events on Bacterial Communities and Opportunistic Pathogens in a Drinking Water Treatment Plant. Water 2022, 14, 54. [Google Scholar] [CrossRef]
  27. Wilske, C.; Herzsprung, P.; Lechtenfeld, O.J.; Kamjunke, N.; Einax, J.W.; von Tümpling, W. New insights into the seasonal variation of DOM quality of a humic-rich drinking-water reservoir—coupling 2D-fluorescence and FTICR MS measurements. Water 2021, 13, 1703. [Google Scholar] [CrossRef]
  28. Von Gunten, U. Oxidation Processes in Water Treatment: Are We on Track? Environ. Sci. Technol. 2018, 52, 5062–5075. [Google Scholar] [CrossRef]
  29. Gregov, M.; Jurinjak Tušek, A.; Valinger, D.; Benković, M.; Jurina, T.; Surać, L.; Kurajica, L.; Matošić, M.; Gajdoš Kljusurić, J.; Ujević Bošnjak, M.; et al. Linear and Non-Linear Modelling of Bromate Formation during Ozonation of Surface Water in Drinking Water Production. Water 2023, 15, 1516. [Google Scholar] [CrossRef]
  30. Von Sonntag, C.; von Gunten, U. Chemistry of Ozone in Water and Wastewater Treatment: From Basic Principles to Applications; IWA Publishing: London, UK, 2015. [Google Scholar]
  31. Beltrán, F.J.; Rey, A.; Gimeno, O. The Role of Catalytic Ozonation Processes on the Elimination of DBPs and Their Precursors in Drinking Water Treatment. Catalysts 2021, 11, 521. [Google Scholar] [CrossRef]
  32. Aliashrafi, A.; Zhang, Y.; Groenewegen, H.; Peleato, N.M. A review of data-driven modelling in drinking water treatment. Rev. Environ. Sci. Biotechnol. 2021, 20, 985–1009. [Google Scholar] [CrossRef]
Figure 1. Flowchart of strategies used for the modelling of ozonation optimization.
Water 17 00097 g001
Figure 2. Input parameters (ozone dose in PT (pretreatment) and MO (main ozonation), ozonation duration in MO) for Strategy 1 (A,B) and Strategy 2 (C,D) for different raw waters extracted at 6.7 m above the lake bottom (A,C) and 4 m above the lake bottom (B,D).
Water 17 00097 g002
Figure 3. Qualitative differences of the input and output parameters for different raw water extracted at 6.7 m above the lake bottom and 4 m above the lake bottom. Input parameters are optimal ozone dosing in pretreatment (PT) and main ozonation (MO) with output duration.
Water 17 00097 g003
Table 1. Characteristics of the inlet water for all experiments performed (water at 6.7 m and 4 m above the lake bottom).
Date of SamplingDOCUV254BrSUVAFP 1 THMFP 1 HAA
mg/Lcm−1mg/LL/(mg·m)µg/Lµg/L
6.7 m above the lake bottom
April 20212.2 ± 0.1 a0.057 ± 0.002 b0.017 ± 0.001 a2.6 ± 0.2 c106.7 ± 3.1 c,d101.5 ± 2.5 d
May 20212.1 ± 0.1 a0.055 ± 0.001 b,#0.018 ± 0.001 a2.7 ± 0.1 c103.2 ± 0.8 c,#96.9 ± 1.7 c
June 20212.3 ± 0.1 a0.052 ± 0.002 b0.019 ± 0.001 b2.3 ± 0.1 b,c98.8 ± 3.2 c93.9 ± 3.6 c
July 20212.3 ± 0.1 a0.052 ± 0.001 a0.019 ± 0.001 a,b2.3 ± 0.1 b,c99.4 ± 1.2 c94.7 ± 1.8 c
September 20212.4 ± 0.1 a,b0.047 ± 0.001 a,b,#0.021 ± 0.001 b2.0 ± 0.0 b,#91.2 ± 1.6 c,#86.8 ± 2.3 c,#
November 20212.5 ± 0.1 b0.033 ± 0.002 a0.025 ± 0.001 b1.3 ± 0.0 a68.3 ± 2.8 a63.9 ± 3.1 a
April 20222.2 ± 0.1 a,#0.037 ± 0.002 a0.083 ± 0.110 c1.7 ± 0.0 a,b,#75.4 ± 0.9 b66.7 ± 6.8 a
May 20222.5 ± 0.1 b0.036 ± 0.001 a0.023 ± 0.001 b1.5 ± 0.1 a73.3 ± 1.7 a,b68.8 ± 1.5 a
June 20223.1 ± 0.1 c,#0.038 ± 0.002 a0.022 ± 0.001 b1.2 ± 0.1 a,#75.9 ± 2.6 b74.4 ± 2.5 b
July 20222.4 ± 0.1 a,b0.039 ± 0.001 a,#0.026 ± 0.001 b1.7 ± 0.1 a,b78.9 ± 0.8 b,#74.0 ± 0.7 b,#
August 20222.8 ± 0.2 b,c0.039 ± 0.001 a,#0.027 ± 0.002 b1.4 ± 0.1 a78.4 ± 1.8 a,#75.4 ± 0.9 b,#
November 20223.1 ± 0.1 c,#0.065 ± 0.001 c0.028 ± 0.002 b2.1 ± 0.0 c,#119.7 ± 1.6 d120.8 ± 2.3 d
4 m above the lake bottom
April 20212.2 ± 0.2 a0.057 ± 0.001 a,b0.018 ± 0.002 a2.6 ± 0.3 c106.5 ± 1.0 c101.2 ± 1.0 c
May 20212.1 ± 0.1 a0.057 ± 0.001 a,b,#0.018 ± 0.001 a2.7 ± 0.1 c107.1 ± 1.6 c,#101.1 ± 2.5 c
June 20212.3 ± 0.1 a0.054 ± 0.002 a,b0.019 ± 0.001 a2.4 ± 0.0 b,c102.2 ± 3.2 c97.6 ± 3.5 c
July 20212.5 ± 0.2 a0.053 ± 0.001 b0.019 ± 0.001 a2.1 ± 0.1 b100.6 ± 1.6 c97.3 ± 2.7 c
September 20212.5 ± 0.1 a0.057 ± 0.001 b,#0.023 ± 0.001 b2.3 ± 0.1 b,#106.5 ± 0.9 c,#103.1 ± 0.5 d,#
November 20212.4 ± 0.1 a0.031 ± 0.001 a0.025 ± 0.001 b1.3 ± 0.0 a64.7 ± 1.7 a59.9 ± 2.2 a
April 20222.5 ± 0.0 a,#0.037 ± 0.001 a0.020 ± 0.001 a,b1.5 ± 0.0 a,#74.7 ± 1.7 a,b70.7 ± 1.8 b
May 20222.4 ± 0.1 a0.036 ± 0.001 a0.023 ± 0.001 b1.5 ± 0.1 a73.2 ± 1.7 a68.4 ± 1.4 a,b
June 20222.4 ± 0.2 a,#0.039 ± 0.001 a0.021 ± 0.002 b1.6 ± 0.1 a,#77.9 ± 1.7 a,b73.4 ± 2.4 b
July 20222.5 ± 0.2 a,b0.043 ± 0.001 a,b,#0.025 ± 0.001 b1.8 ± 0.2 a,b85.2 ± 1.1 b,#80.9 ± 0.8 b,#
August 20222.7 ± 0.1 b0.042 ± 0.001 a,#0.027 ± 0.001 b1.6 ± 0.1 a83.4 ± 1.7 b,#80.0 ± 1.3 b,#
November 20223.4 ± 0.1 c,#0.066 ± 0.001 c0.027 ± 0.001 b2.0 ± 0.1 b,#121.3 ± 1.6 d124.1 ± 1.4 e
Notes: 1 FP—THM (trihalomethane)/HAA (haloacetic acid) formation potential calculated according to the previously mentioned Formulas (2) and (3); BrO3 (µg/L) was 0 in all measurements and therefore was left out from the table; different letters in a column indicate statistical difference for data measured at the same level but on different dates; #—indication of significant differences between the observed parameter, for the same date but different level (significance level: p < 0.05). DOC—dissolved organic carbon, Br—bromide, BrO3—bromate, UV254—absorbance of UV light at 254 nm, SUVA—specific UV absorbance.
Table 2. Optimal ozone dose values at pretreatment (PT), main ozonation (MO) and duration of ozonation (MO duration) of the water at 6.7 m above the lake bottom and 4 m above the lake bottom according to Strategy 1 (simultaneous lowering of all parameters to minimum values), with an indication of the model-predicted output parameters at the input optima. Values that are above the maximum allowed or recommended values are marked in bold, which are: bromates (BrO3) at 10 µg/L, SUVA (specific UV absorbance) at 2 L/(mg·m), THMs at 100 µg/L, HAAs at 60 µg/L.
DateInput VariablesPredicted Output Parameters
Dose PTDose MODuration MOBrO3SUVAFP 1 THMFP 1 HAA
mg/Lmg/Lminµg/LL/(mg·m)µg/Lµg/L
6.7 m above the lake bottom
April 20211.10.323.87.00.63025
May 20211.60.317.57.10.73127
June 20211.60.217.58.00.52925
July 20210.20.511.37.20.63228
September 20210.70.530.05.10.53026
November 20211.10.517.58.00.42218
April 20221.10.230.09.90.52622
May 20222.00.35.09.30.42219
June 20221.10.117.56.70.42522
July 20221.60.317.511.00.32017
August 20221.10.323.815.00.42521
November 20221.10.230.09.60.63632
4 m above the lake bottom
April 20211.10.130.02.40.62622
May 20211.10.423.87.00.63126
June 20211.60.130.05.50.52925
July 20210.20.123.86.20.52723
September 20211.60.517.51.90.63430
November 20211.10.45.05.30.52319
April 20220.70.517.57.80.52622
May 20222.00.35.010.30.32017
June 20221.60.15.04.10.52926
July 20221.60.311.35.20.42219
August 20220.20.15.03.20.52622
November 20221.10.317.57.30.63834
Note: 1 FP—THM (trihalomethane)/HAA (haloacetic acid) formation potential calculated according to the previously mentioned Formulas (2) and (3).
Table 3. Results of Strategy 2 for the water at 6.7 m above the lake bottom during the year according to individual and general optimal models for dose and duration of ozonation in pretreatment (PT) and main ozonation (MO).
DateModelInput VariablesPredicted Output Parameters
Dose PTDose MODuration MOBrO3SUVAFP 1 THMFP 1 HAA
mg/Lmg/Lminµg/LL/(mg·m)µg/Lµg/L
April 2021Individual0.20.111.30.01.15347
General0.20.15.00.01.25650
May 2021Individual0.20.15.00.01.05044
June 2021Individual0.20.15.00.00.74137
July 2021Individual0.20.15.00.00.84541
September 2021Individual0.20.15.00.00.94240
November 2021Individual0.20.15.00.00.63531
April 2022Individual0.20.15.00.00.73732
May 2022Individual0.20.111.30.00.63329
General0.20.15.00.00.53128
June 2022Individual0.20.35.01.30.63734
General0.20.15.00.00.53431
July 2022Individual0.20.15.00.20.53228
August 2022Individual0.20.111.30.00.63228
General0.20.15.00.00.63328
November 2022Individual0.20.15.00.00.84844
Notes: 1 FP—THM (trihalomethane)/HAA (haloacetic acid) formation potential calculated according to the previously mentioned Formulas (2) and (3). BrO3—bromate, SUVA—specific UV absorbance.
Table 4. Results of Strategy 2 for the water at 4 m above the lake bottom during the year according to individual and general optimal models for dose and duration of ozonation in pretreatment (PT) and main ozonation (MO).
DateModelInput VariablesPredicted Output Parameters
Dose PTDose MODuration MOBrO3SUVAFP 1 THMFP 1 HAA
mg/Lmg/Lminµg/LL/(mg·m)µg/Lµg/L
April 2021Individual0.20.15.00.01.25145
May 2021Individual0.20.25.00.01.04640
General0.20.15.00.01.04842
June 2021Individual0.20.111.30.20.73935
General0.20.15.00.00.73935
July 2021Individual0.20.55.00.00.84541
General0.20.15.00.00.84541
September 2021Individual0.20.15.00.00.94944
November 2021Individual0.20.111.30.00.63227
General0.20.15.00.00.63227
April 2022Individual0.20.15.00.00.73430
May 2022Individual0.20.117.51.40.63228
General0.20.15.00.00.63026
June 2022Individual0.20.111.30.00.73430
General0.20.15.00.00.73430
July 2022Individual0.20.15.00.00.63531
August 2022Individual0.70.117.51.10.73733
General0.20.15.00.00.63126
November 2022Individual0.20.15.00.00.95247
Notes: 1 FP—THM (trihalomethane)/HAA (haloacetic acid) formation potential calculated according to the previously mentioned Formulas (2) and (3). BrO3—bromate, SUVA—specific UV absorbance.
Table 5. Comparison of measured data and model results for all water samples for dose and duration of ozonation in pretreatment (PT) and main ozonation (MO).
DateParameters in the PlantAnalysis from the PlantModel Results
Dose PTDose MODuration MOBrO3SUVAFP 1 THMFP 1 HAABrO3SUVAFP 1 THMFP 1 HAA
April 20210.70.517.52.01.043386.70.63228
May 20210.80.614.60.01.245386.40.63329
June 20210.80.614.60.01.142356.00.63430
July 20210.80.417.51.50.728236.90.63127
September 20210.90.117.51.81.143364.00.63329
November 20211.00.617.51.31.142367.30.63329
April 20221.20.414.60.00.730267.80.63026
May 20221.30.614.62.20.834297.80.63328
July 20221.30.38.71.60.732276.40.63127
August 20221.40.58.71.60.637337.40.63127
November 20221.60.517.50.00.9464110.00.52925
Notes: 1 FP—THM (trihalomethane)/HAA (haloacetic acid) formation potential calculated according to the previously mentioned Formulas (2) and (3). BrO3—bromate, SUVA—specific UV absorbance.
Table 6. Recalculated ozone dose and duration of ozonation in pretreatment (PT) and main ozonation (MO) from the plant and evaluation of model output values.
DateDose PTDose MODuration MOBrO3SUVAFP 1 THMFP 1 HAA
April 20210.30.117.51.10.73733
May 20210.30.114.60.90.73733
June 20210.30.114.61.20.73732
July 20210.30.117.50.90.73733
September 20210.40.017.50.00.73934
November 20210.40.117.52.10.73631
April 20220.50.114.61.00.73733
May 20220.60.114.62.00.73631
July 20220.60.18.70.00.73834
August 20220.60.18.70.40.73733
November 20220.70.117.52.60.73531
Notes: 1 FP—THM (trihalomethane)/HAA (haloacetic acid) formation potential calculated according to the previously mentioned Formulas (2) and (3). BrO3—bromate, SUVA—specific UV absorbance.
Disclaimer/Publisher’s Note: The statements, opinions and data contained in all publications are solely those of the individual author(s) and contributor(s) and not of MDPI and/or the editor(s). MDPI and/or the editor(s) disclaim responsibility for any injury to people or property resulting from any ideas, methods, instructions or products referred to in the content.

