1. Introduction
Ecosystem services encompass the natural environmental conditions and benefits that ecosystems and their processes provide, upon which human beings depend. These services form the foundation for the sustainable development of both society and nature, and they are essential for the functioning of Earth’s life-support systems [
1,
2,
3]. Water conservation, as a typical ecosystem service function, is an expression of the ability of an ecosystem to maintain water retention, filtration, and storage within the system at a particular spatial and temporal scale and under particular conditions. It plays a pivotal role in mitigating floods, regulating runoff, purifying water, preserving water resources, and preventing soil erosion [
4,
5]. Water resources are vital for human survival, development, and daily life, serving as a critical foundation for the sustainable progress of society. However, in recent years, due to global warming, population growth, and intensified human activities, the gap between water supply and demand has become more pronounced, placing increasing pressure on the water conservation functions of various regions. Consequently, the regional ecological water conservation capacity has garnered significant attention from governments worldwide. In this context, the water conservation function of ecosystems has become a key focus in both ecological and hydrological research [
6,
7].
Due to the different understandings of the connotation of water conservation by relevant scholars, a variety of water conservation assessment methodologies have been developed. Commonly employed approaches include the integrated water storage capacity method, water balance method, soil water storage capacity method, annual runoff method, multi-factor regression method, weighting analysis method, and hydrological modeling method [
8,
9,
10,
11,
12,
13]. Among these, the hydrological modeling method has emerged as the mainstream approach for evaluating water conservation capacity, owing to its advantages of controllability, repeatability, and dynamic simulation capabilities. Commonly utilized models in this method include the SWAT model, TerrainLab model, and InVEST model [
14,
15,
16]. The SWAT model divides the watershed into several hydrological response units, facilitating the analysis of spatial differences in water conservation. However, it encounters limitations, as the modeled soil database does not align with the domestic soil classification system, and parameter values entail high uncertainty. On the other hand, the TerrainLab model leverages subsurface saturated flow mechanisms to accurately estimate groundwater levels and soil water content. It comprehensively incorporates vegetation’s impact on evapotranspiration and topography influence. However, it overlooks wind speed’s effect and lacks watershed water balance validation. Compared to other models, the InVEST model fully accounts for spatial differences in soil permeability under different terrain and vegetation cover. The model data are easy to obtain and are suitable for areas where data are scarce. Its parameter settings are flexible and can be adapted to the actual characteristics of the study area. It can also generate visual thematic maps, spatially quantify ecosystem service functions, and provide strong support for land use management and accurate policy implementation. With these advantages, the model has been widely used by scientists at home and abroad in the field of ecosystem service valuation [
17,
18]. Azimi et al. (2020) [
19] linked the Soil and Water Assessment Tool (SWAT) and the Integrated Valuation of Ecosystem Services and Tradeoffs (InVEST) model for analyzing the impacts of different rangeland conditions on water resource conservation in the Atrak River Basin in arid and semi-arid climatic zones of Iran. Li et al. (2021) [
20] analyzed the spatial and temporal dynamics of water conservation in the Danjiang River Basin watershed and the response of water conservation to climate, land use, and soil changes from 2000 to 2019 using the InVEST water quantity model. Nahib et al. (2021) [
21] used InVEST to estimate water yield within the Citarum River Basin unit in West Java, Indonesia, and tested the sensitivity of water yield to variations in climatic variables (rainfall and evapotranspiration) and Land Use and Land Cover (LULC); they found that the water yield was more influenced by climatic parameters. Hu et al. (2020) [
22] quantitatively assessed water yield and land use change in the Dongting Lake wetland using the InVEST model and geostatistical methods and found that climate change and landscape patterns were the main drivers affecting water conservation in the region. Xue et al. (2022) [
23] comprehensively quantified the amount of water conservation in the ecological barrier area of the Tibetan Plateau, analyzed its spatial and temporal changes and their influencing factors, and predicted future changes in water conservation under different climate scenarios.
However, the existing studies based on the InVEST model are mostly based on the overall regional unit and have not explored in-depth the differences in the amount of water conservation under different climatic and topographic conditions in different vegetation cover sub-areas. An in-depth analysis of the effects of regional climatic and topographic variations on water retention under different vegetation systems is the research focus of this paper. In addition, the existing studies based on the InVEST model to estimate water savings mostly take empirical values based on the seasonal precipitation characteristics of the study area or calibrate the model by the existing water production data, which is convenient and fast, but does not take into account the heterogeneity of regional climate or the reliability of water production data [
24], especially for complex terrains with significant vertical climate change. The application of existing methods has limitations. application has limitations. Therefore, a localized calculation for the InVEST model parameters is key to improve the applicability of the model and the estimation accuracy in the region.
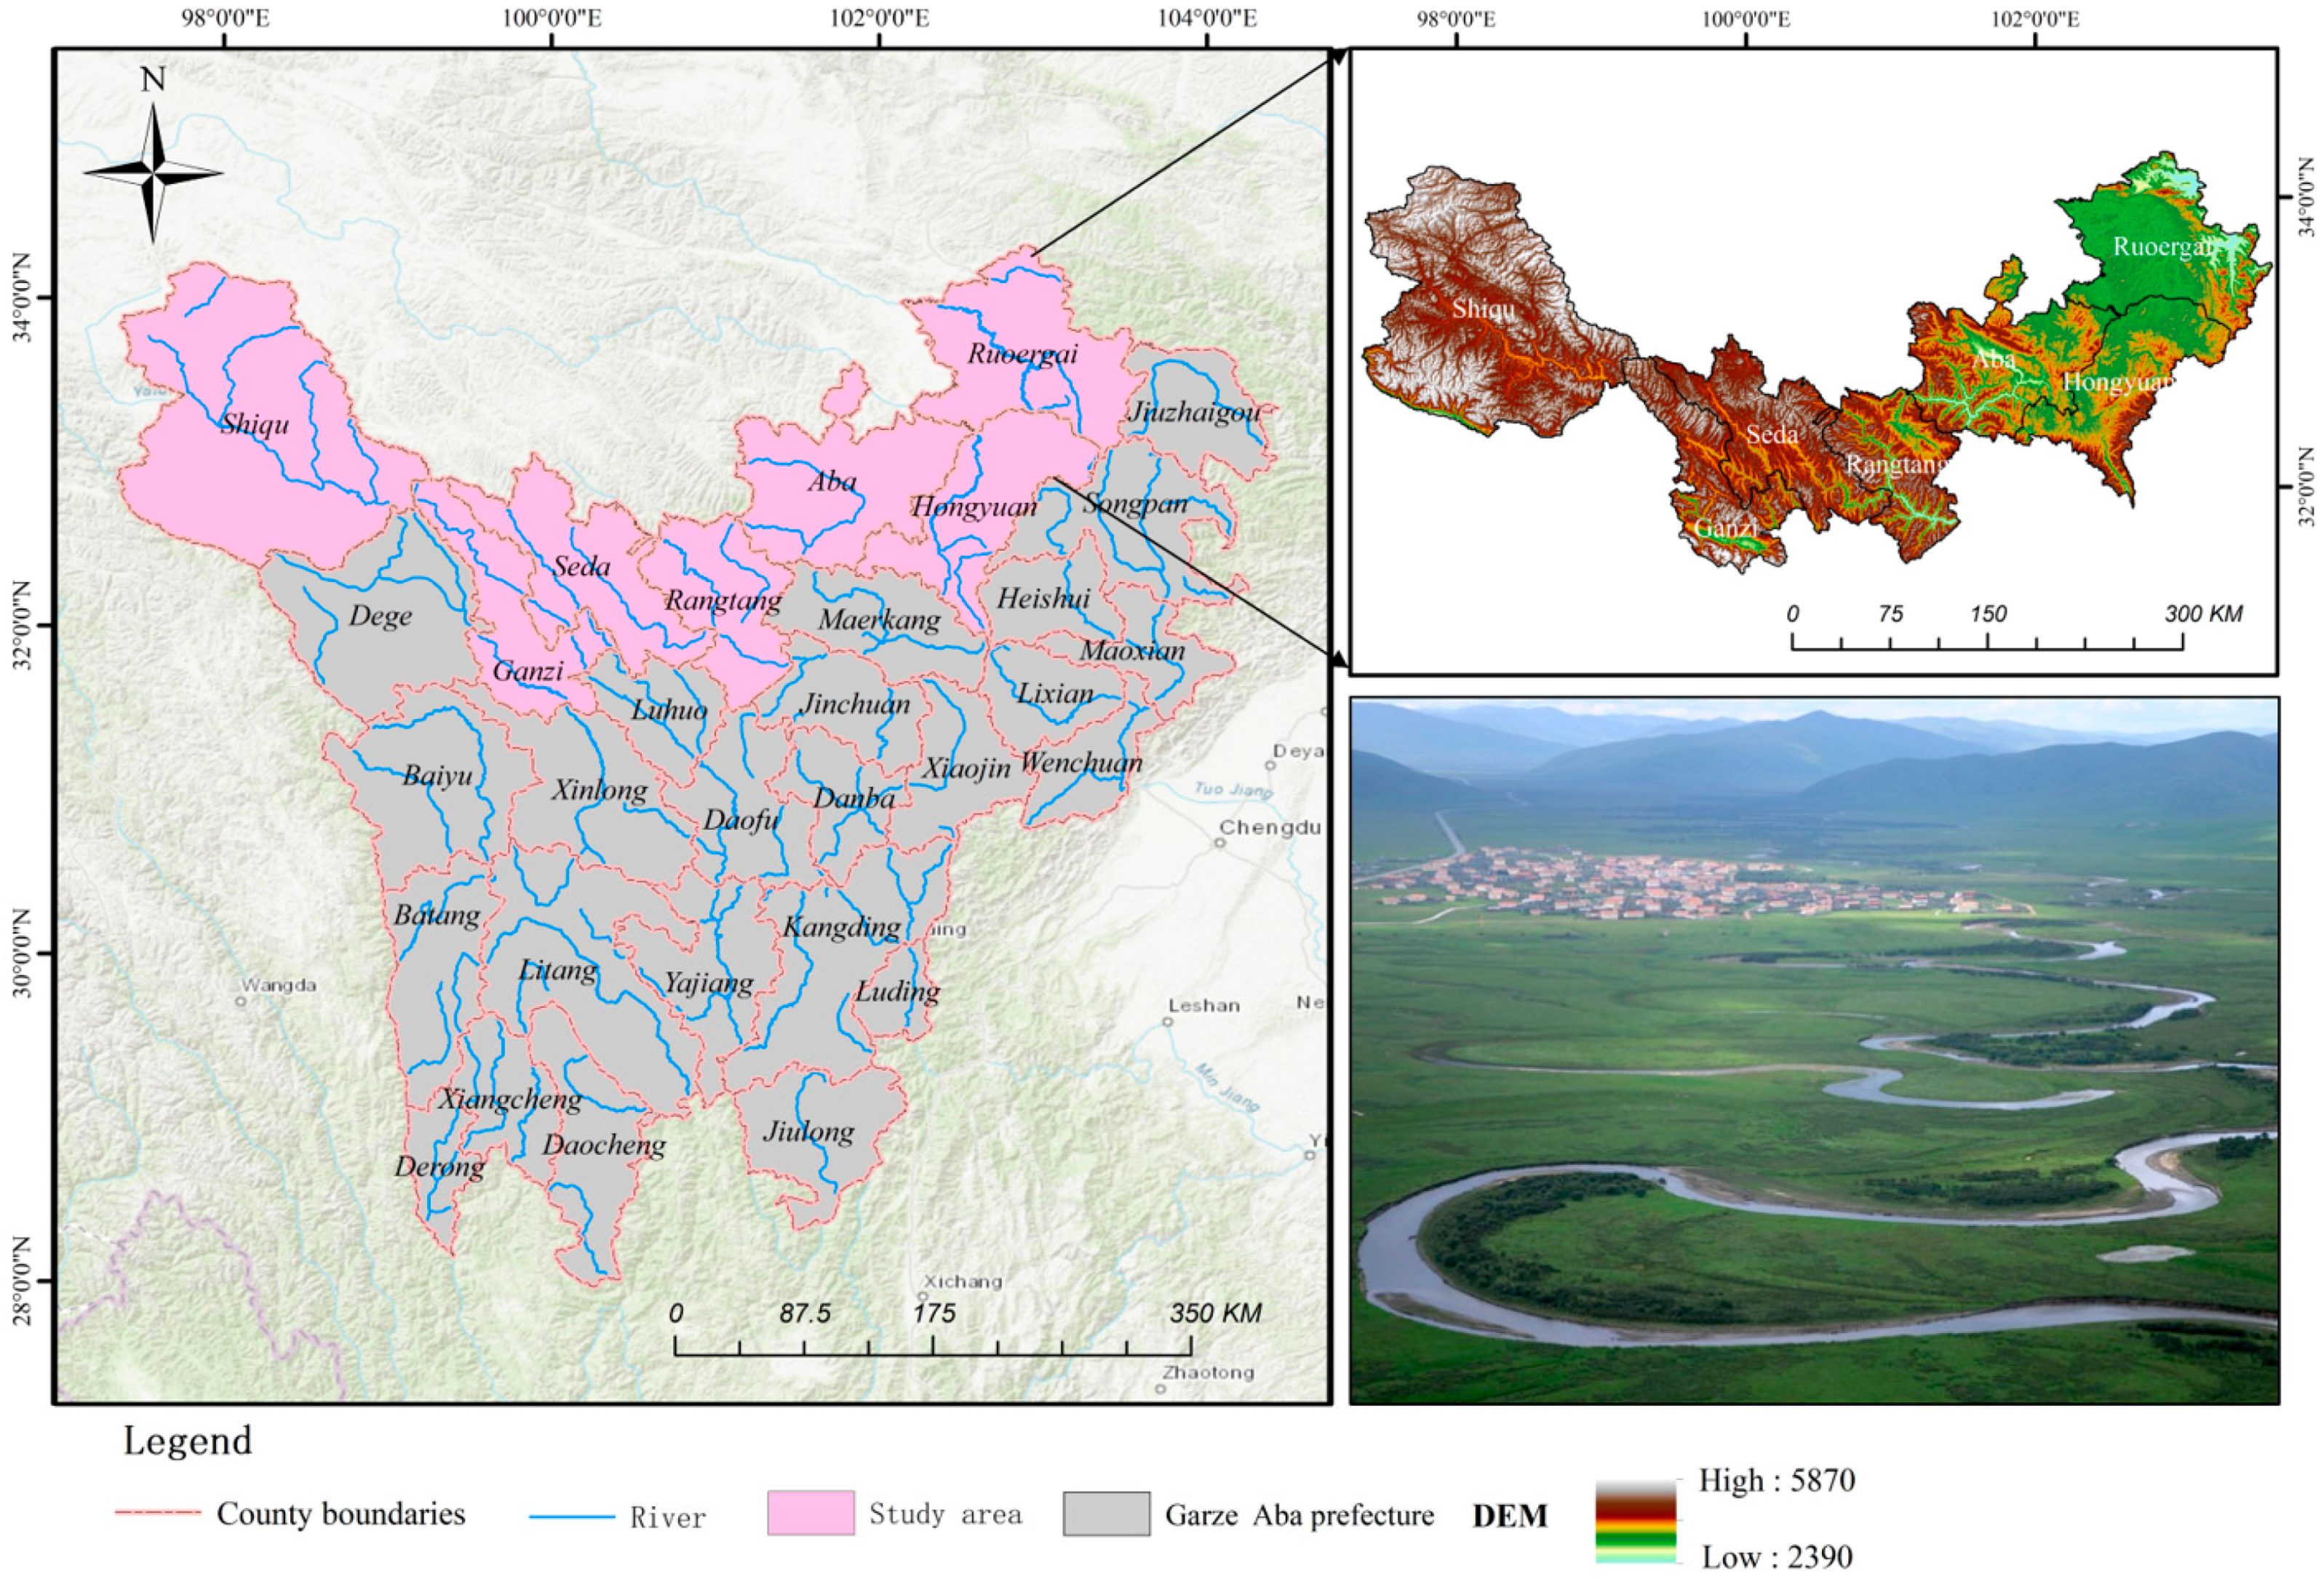
The source area of the northwest Sichuan River is an important water conservation area for the Yangtze River and Yellow River systems. Within this region lies the Ruoergai wetland, renowned as the largest “natural reservoir” globally. This wetland annually supplies around 30% of the water to the Yellow River, earning it the title of the “Yellow River’s reservoir” [
25]. The region plays an important role in maintaining the balance of the regional water cycle and safeguarding the water ecosystem and socio-economic water use in the middle and lower reaches of the Yangtze and Yellow Rivers. In recent years, however, the region has faced a number of environmental challenges. The complexity and variability of the terrain and the intricacy of the geological formations, together with the significant vertical differences in thermal and hydrological conditions, combine to make the region naturally vulnerable. Socio-economic activities, on the other hand, put considerable pressure on the region’s water resources. Livestock farming, the mainstay of the local economy, is extremely dependent on grasslands, but it also exacerbates the degradation of marshes and grasslands and soil erosion, and the function of water conservation is seriously threatened. The peculiar topography, vegetation cover type, and significant vertical climate change in the study area make its water conservation mechanism significantly different from other regions. Although there have been studies focusing on the spatial distribution and wetland functions of water conservation in the region, there have been fewer studies on the differences in water conservation among different vegetation cover areas under different climatic and topographic conditions.
To this end, the article, based on the regional characteristics of the river source area in northwest Sichuan, locally corrected the coefficients of the water production module of the InVEST model to generate the spatial and temporal changes in the amount of water in the study area from 2007 to 2021. With the help of the trend analysis method and correlation analysis, we studied the spatial and temporal changes in the water conservation function in the river source area in northwest Sichuan and explored the spatial relationship between influencing factors and water conservation function by zoning according to the vegetation cover characteristics of the study area. The above study will help to strengthen the understanding and research on the water conservation function of the river source area in northwest Sichuan and provide theoretical basis and scientific support for the scientific planning and precise layout of ecological civilization construction in the area, as well as to improve the water conservation capacity.
3. Results
3.1. Validation of Water Yield Models
Through the localization calculation of the Zhang coefficient, the value of Z ranges between 1.3 and 7.5, with an average value of 4.1. The average value was input into the InVEST model to calculate the water yield of the study area. Generally, the water yield of a region can be approximately equivalent to the surface water resources of that area (excluding the groundwater resources to avoid double counting). Therefore, this study validated the model’s simulated water yield using the regional surface water resource data obtained from water resource bulletins.
By reviewing the water resource bulletins of Aba Prefecture and Ganzi Prefecture from 2007 to 2021, the surface water resources of seven county-level administrative regions within the study area were compiled and compared with the annual water yield simulated by the model. The results showed that the discrepancies between the model’s simulated values and the observed values were within 10%, with the specific relative errors provided in
Table 2. This indicates that the model results fit well with the actual observations, confirming the rationality of the selected Zhang coefficient values.
Overall, the InVEST model’s simulation of water yield in the Jiang River source area of northwest Sichuan is acceptable. The model demonstrates reliability and can be further applied to estimate water conservation in the study area.
3.2. Characteristics of the Temporal Distribution of Water Conservation in the River Source Area of Northwest Sichuan Province
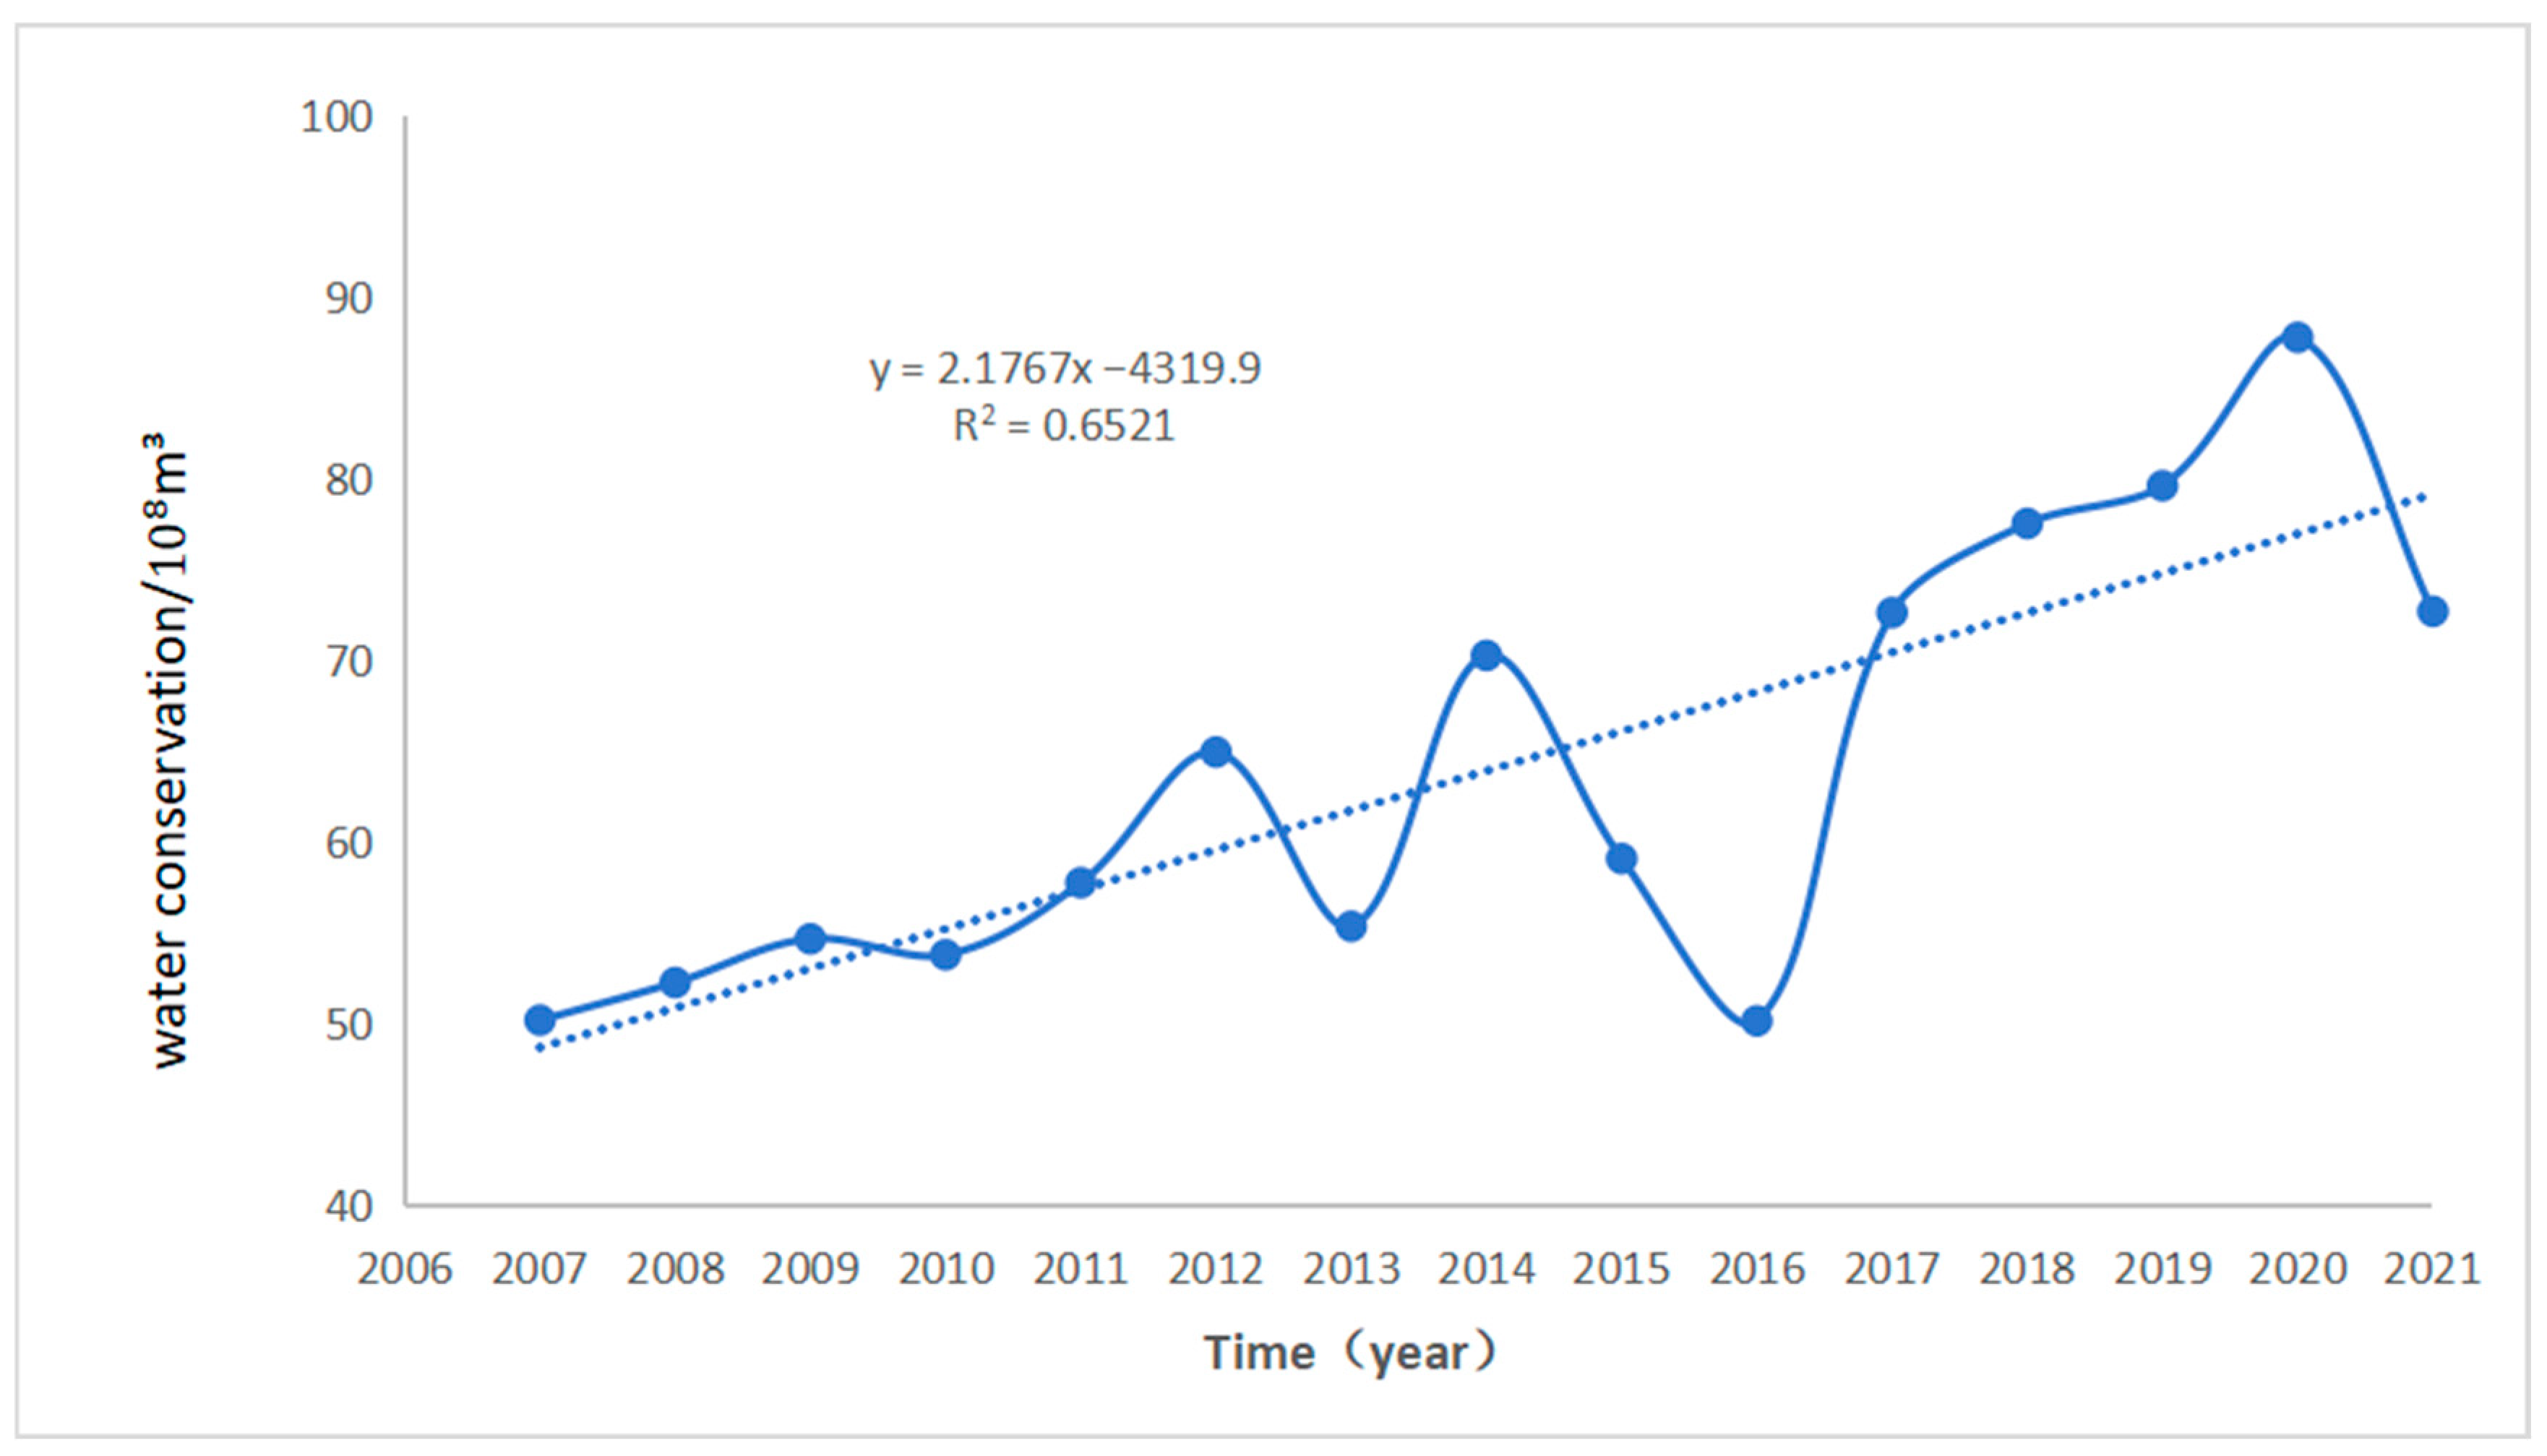
Table 3 provides statistics on the inter-annual change characteristics of water conservation in the river source area of the northwest Sichuan River from 2007 to 2021. The maximum value of water conservation in the raster unit appeared in 2019 as 674.56 mm, the maximum value of the average value appeared in 2020 as 120.31 mm, and the minimum value was in 2016 as 68.71 mm. When calculating the coefficient of variation of it through the standard deviation and the average value, it was found that the maximum degree of variation was found to be 82.32% in 2010, and the minimum degree of variation was found to be 75.36% in 2015. The coefficient of variation reflects the absolute value of the degree of dispersion of the data. The larger the coefficient of variation, the higher the degree of variability of the data; the smaller the coefficient of variation, the lower the degree of variability of the data. The more pronounced changes were in the annual totals of the water conservation, with the lowest value recorded in 2016 at 50.14 × 10
8 m
3 and the highest value observed in 2020 at 87.79 × 10
8 m
3.
A linear trend analysis was conducted on the total water conservation across the time series of the study area using one-way linear regression (
Figure 2), illustrating that the total water conservation exhibited an upward trend over the 15-year period, with variations in local trends. To explore the driving factors of water conservation variation, we conducted a comparative analysis of ET, precipitation, and water conservation depth over a 15-year period (
Figure 3). The results indicate a strong temporal correlation between water conservation depth and precipitation depth, with both showing a steady upward trend over the study period. The trend slopes within the 95% confidence interval were 2.98 and 7.24, respectively. Specifically, in years with significant changes in precipitation, water conservation depth exhibited corresponding fluctuations. For instance, in 2015 and 2016, the annual average precipitation depth decreased substantially compared to the previous year, and water conservation depth also showed a marked decline. Conversely, in 2012, the annual average precipitation depth increased significantly, and the water conservation depth rose accordingly. This trend highlights that precipitation is a key driving factor influencing variations in water conservation depth in the study area.
ET showed an overall declining trend over the study period, with a trend slope of −4.77. Notable decreases in ET occurred in 2014, 2015, and 2020, while ET peaked in 2012. As a critical process of water transfer from the land surface to the atmosphere, ET is influenced by various climatic factors, including temperature, precipitation, wind speed, and solar radiation. Further analysis reveals that ET and water conservation depth exhibit generally opposite trends: In years with lower ET, water conservation depth tends to be higher, whereas in years with higher ET, water conservation depth is relatively lower. This indicates that ET, as a water consumption process, is significantly negatively correlated with water conservation functionality.
3.3. Characteristics of Spatial and Temporal Distribution of Water Conservation in the River Source Area of Northwest Sichuan Province
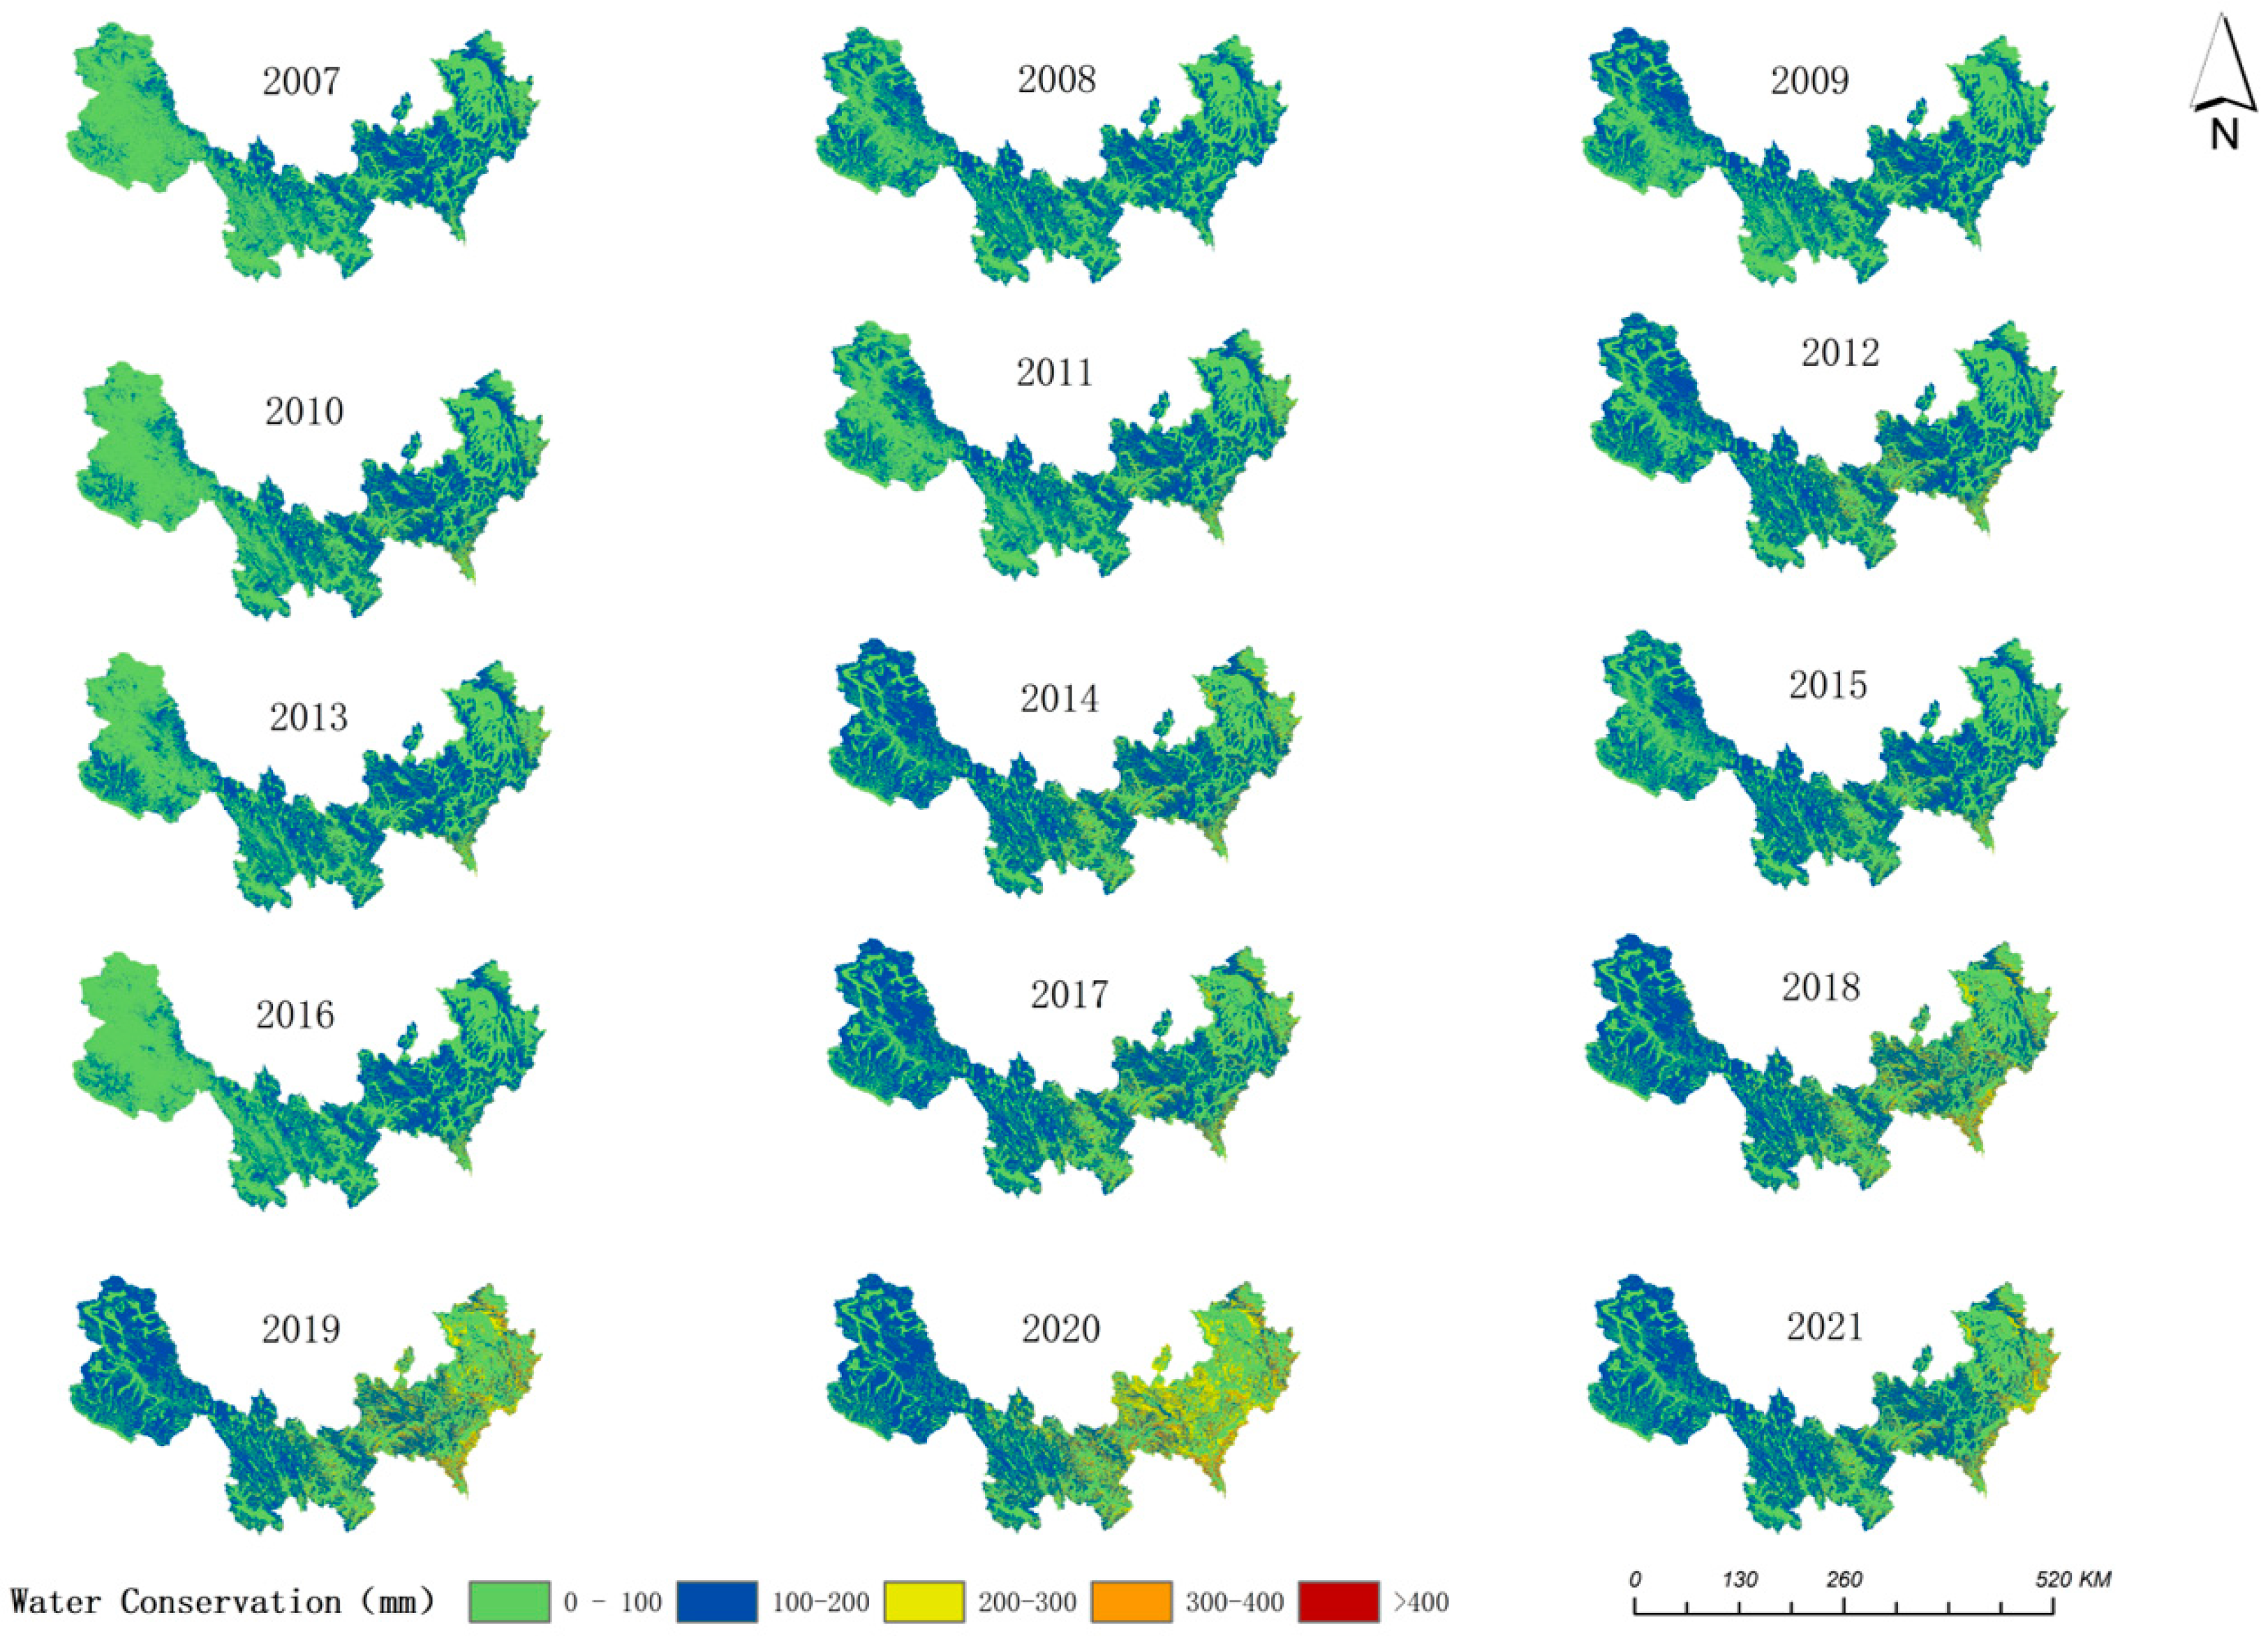
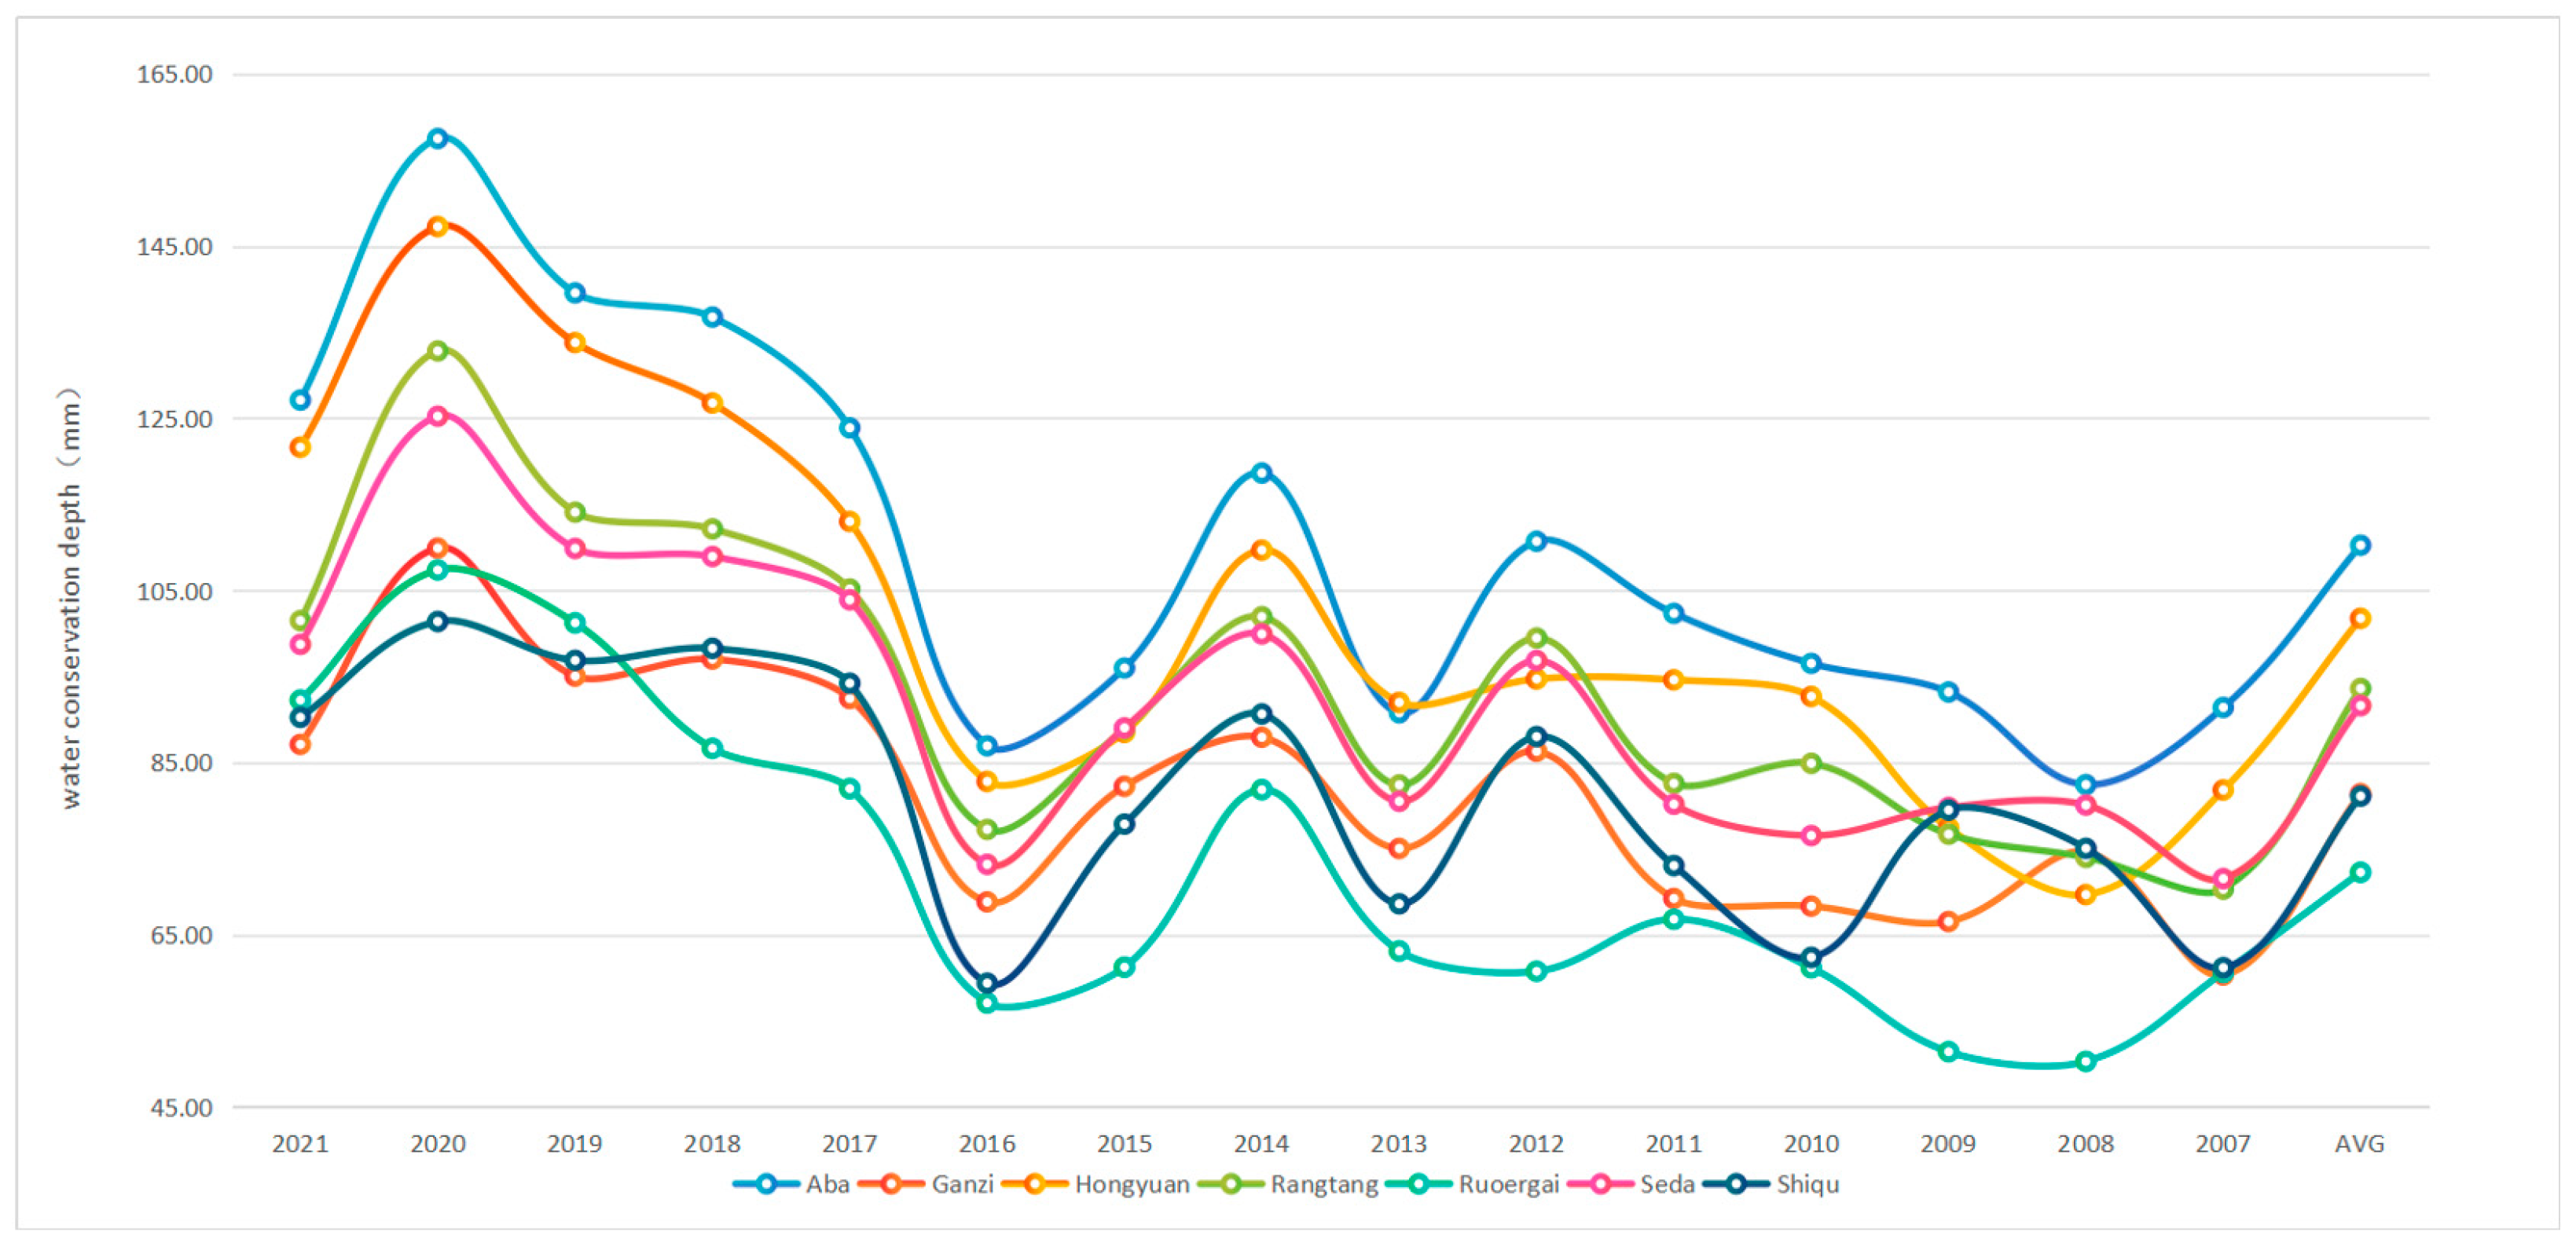
The spatial distribution of water conservation depth in the river source area of northwest Sichuan exhibited strong regional variability. The mean value of water conservation depth from 2007 to 2021 depicted an overall low–middle–high–low distribution from east to west (refer to
Figure 4). Analysis based on administrative divisions illustrated that among the seven counties in the study area (as depicted in
Figure 5), Ruoergai had the lowest mean value of water conservation depth, at 72.26 mm, followed by Shiqu (81.11 mm), Ganzi (81.39 mm), Seda (91.62 mm), Yantang (93.61 mm), and Hongyuan (101.75 mm). Aba County exhibited the highest mean value of water depth during the 15-year period, reaching 110.24 mm.
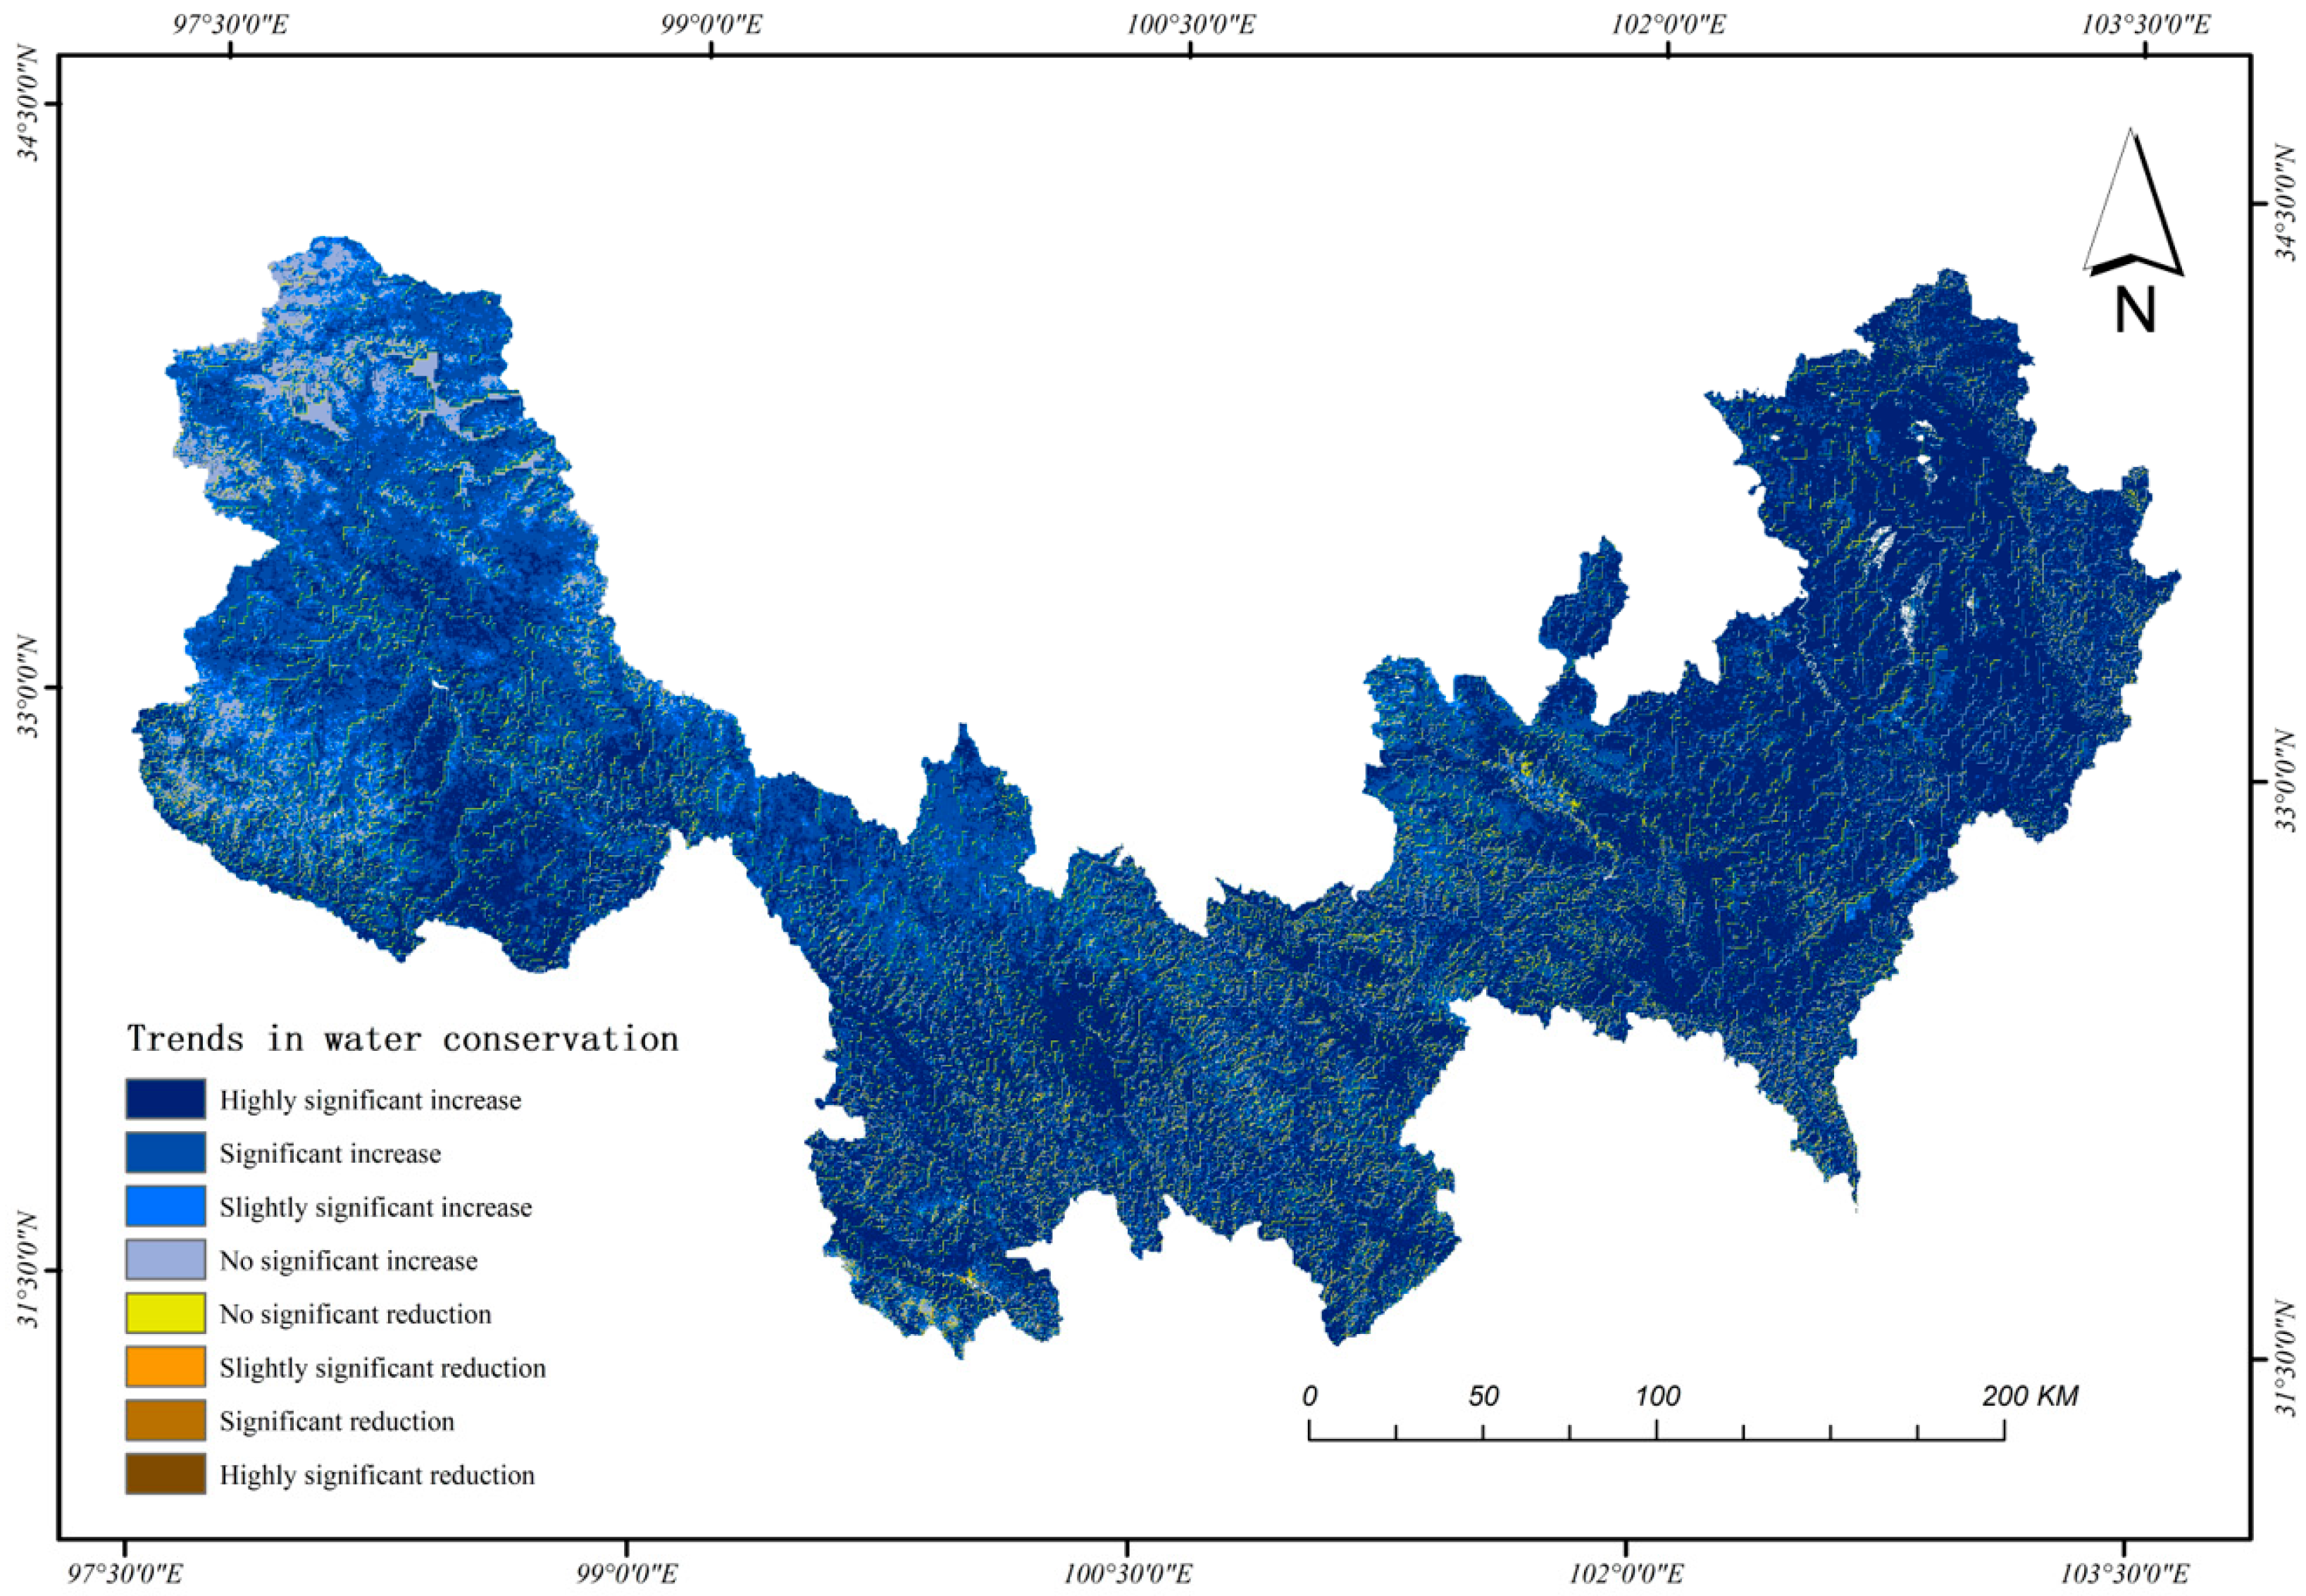
Using the Sen–MK trend analysis method, the spatial and temporal change rate of the water conservation volume and its significance characteristics in the river source area of northwest Sichuan were calculated, and the results are depicted in
Figure 6. The figure illustrates that the multi-year water conservation volume displays an increasing trend in most areas. Specifically, there is a highly significant increase of 54.86%, a significant increase of 24.79%, and a slightly significant increase of 4.65%. These three parts of the study area exhibit a more pronounced distribution. Additionally, a non-significant increase of 10.36% is observed, primarily concentrated in the higher altitudes of Shiqu County.
Conversely, the decreasing portion accounts for a small percentage. The four portions, including highly significant decrease, significant decrease, slightly significant decrease, and non-significant decrease, collectively account for only 5.34% of the total. These areas are mainly distributed in the eastern part of Ruoergai County, the southern part of Hongyuan County, and areas with larger slopes in the study area.
Overall, it is evident that water conservation in the study area exhibited a positive trend between 2007 and 2021.
3.4. Analysis of Influencing Factors
The study area encompasses seven counties within the Ganzi Tibetan Autonomous Prefecture and the Aba Tibetan and Qiang Autonomous Prefecture. Its topographic structure mainly comprises a hilly plateau, a high plain, an alpine plain, and an alpine canyon area, with an average elevation of 4087 m. The corresponding vegetation types primarily include the forest system in mountain areas, the alpine grassland system in plateau areas, and the plateau swamp system distributed in the regions of Ruoergai, Hongyuan, and Aba. These three vegetation covers constitute the dominant vegetation types in the study area.
Given the intrinsic importance of water storage in the subsurface for the water conservation function, the article will focus on these three vegetation cover types as the study area. It aims to explore the spatial distribution of water conservation under different vegetation cover systems and further analyze the effects of climate and topography on water conservation under varying vegetation cover conditions.
3.4.1. Changes in Water Conservation Under Different Vegetation Cover Conditions
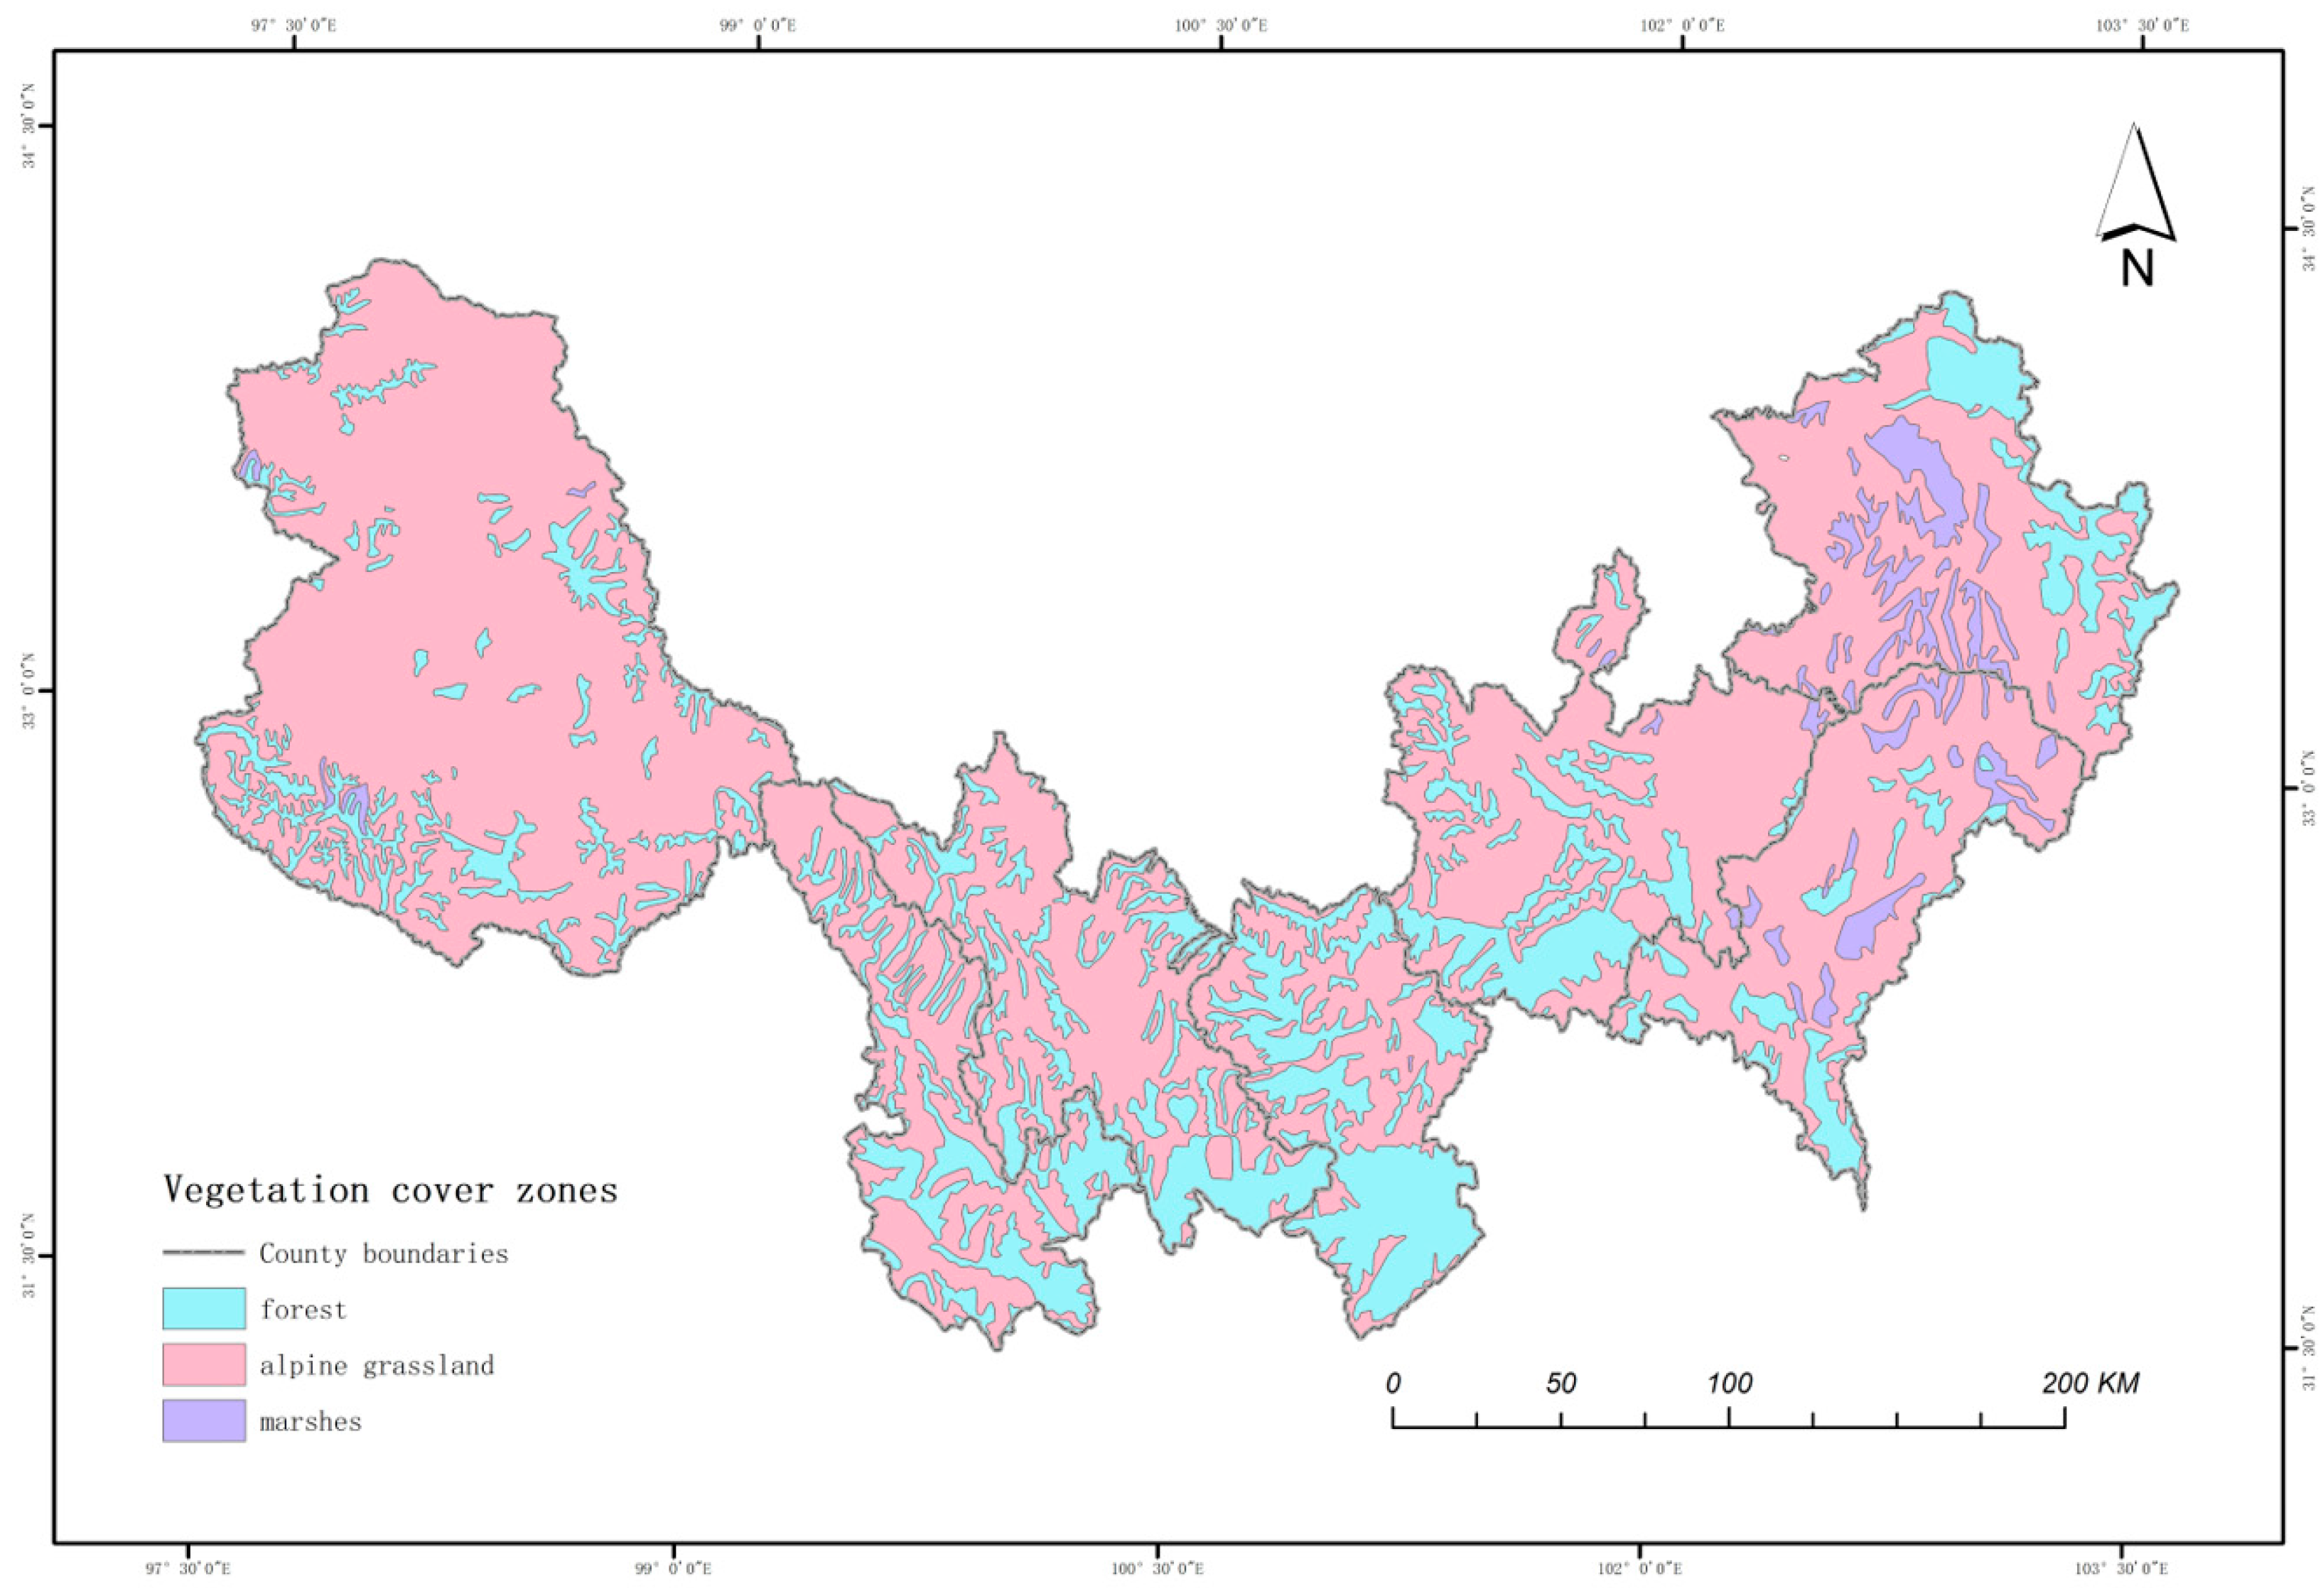
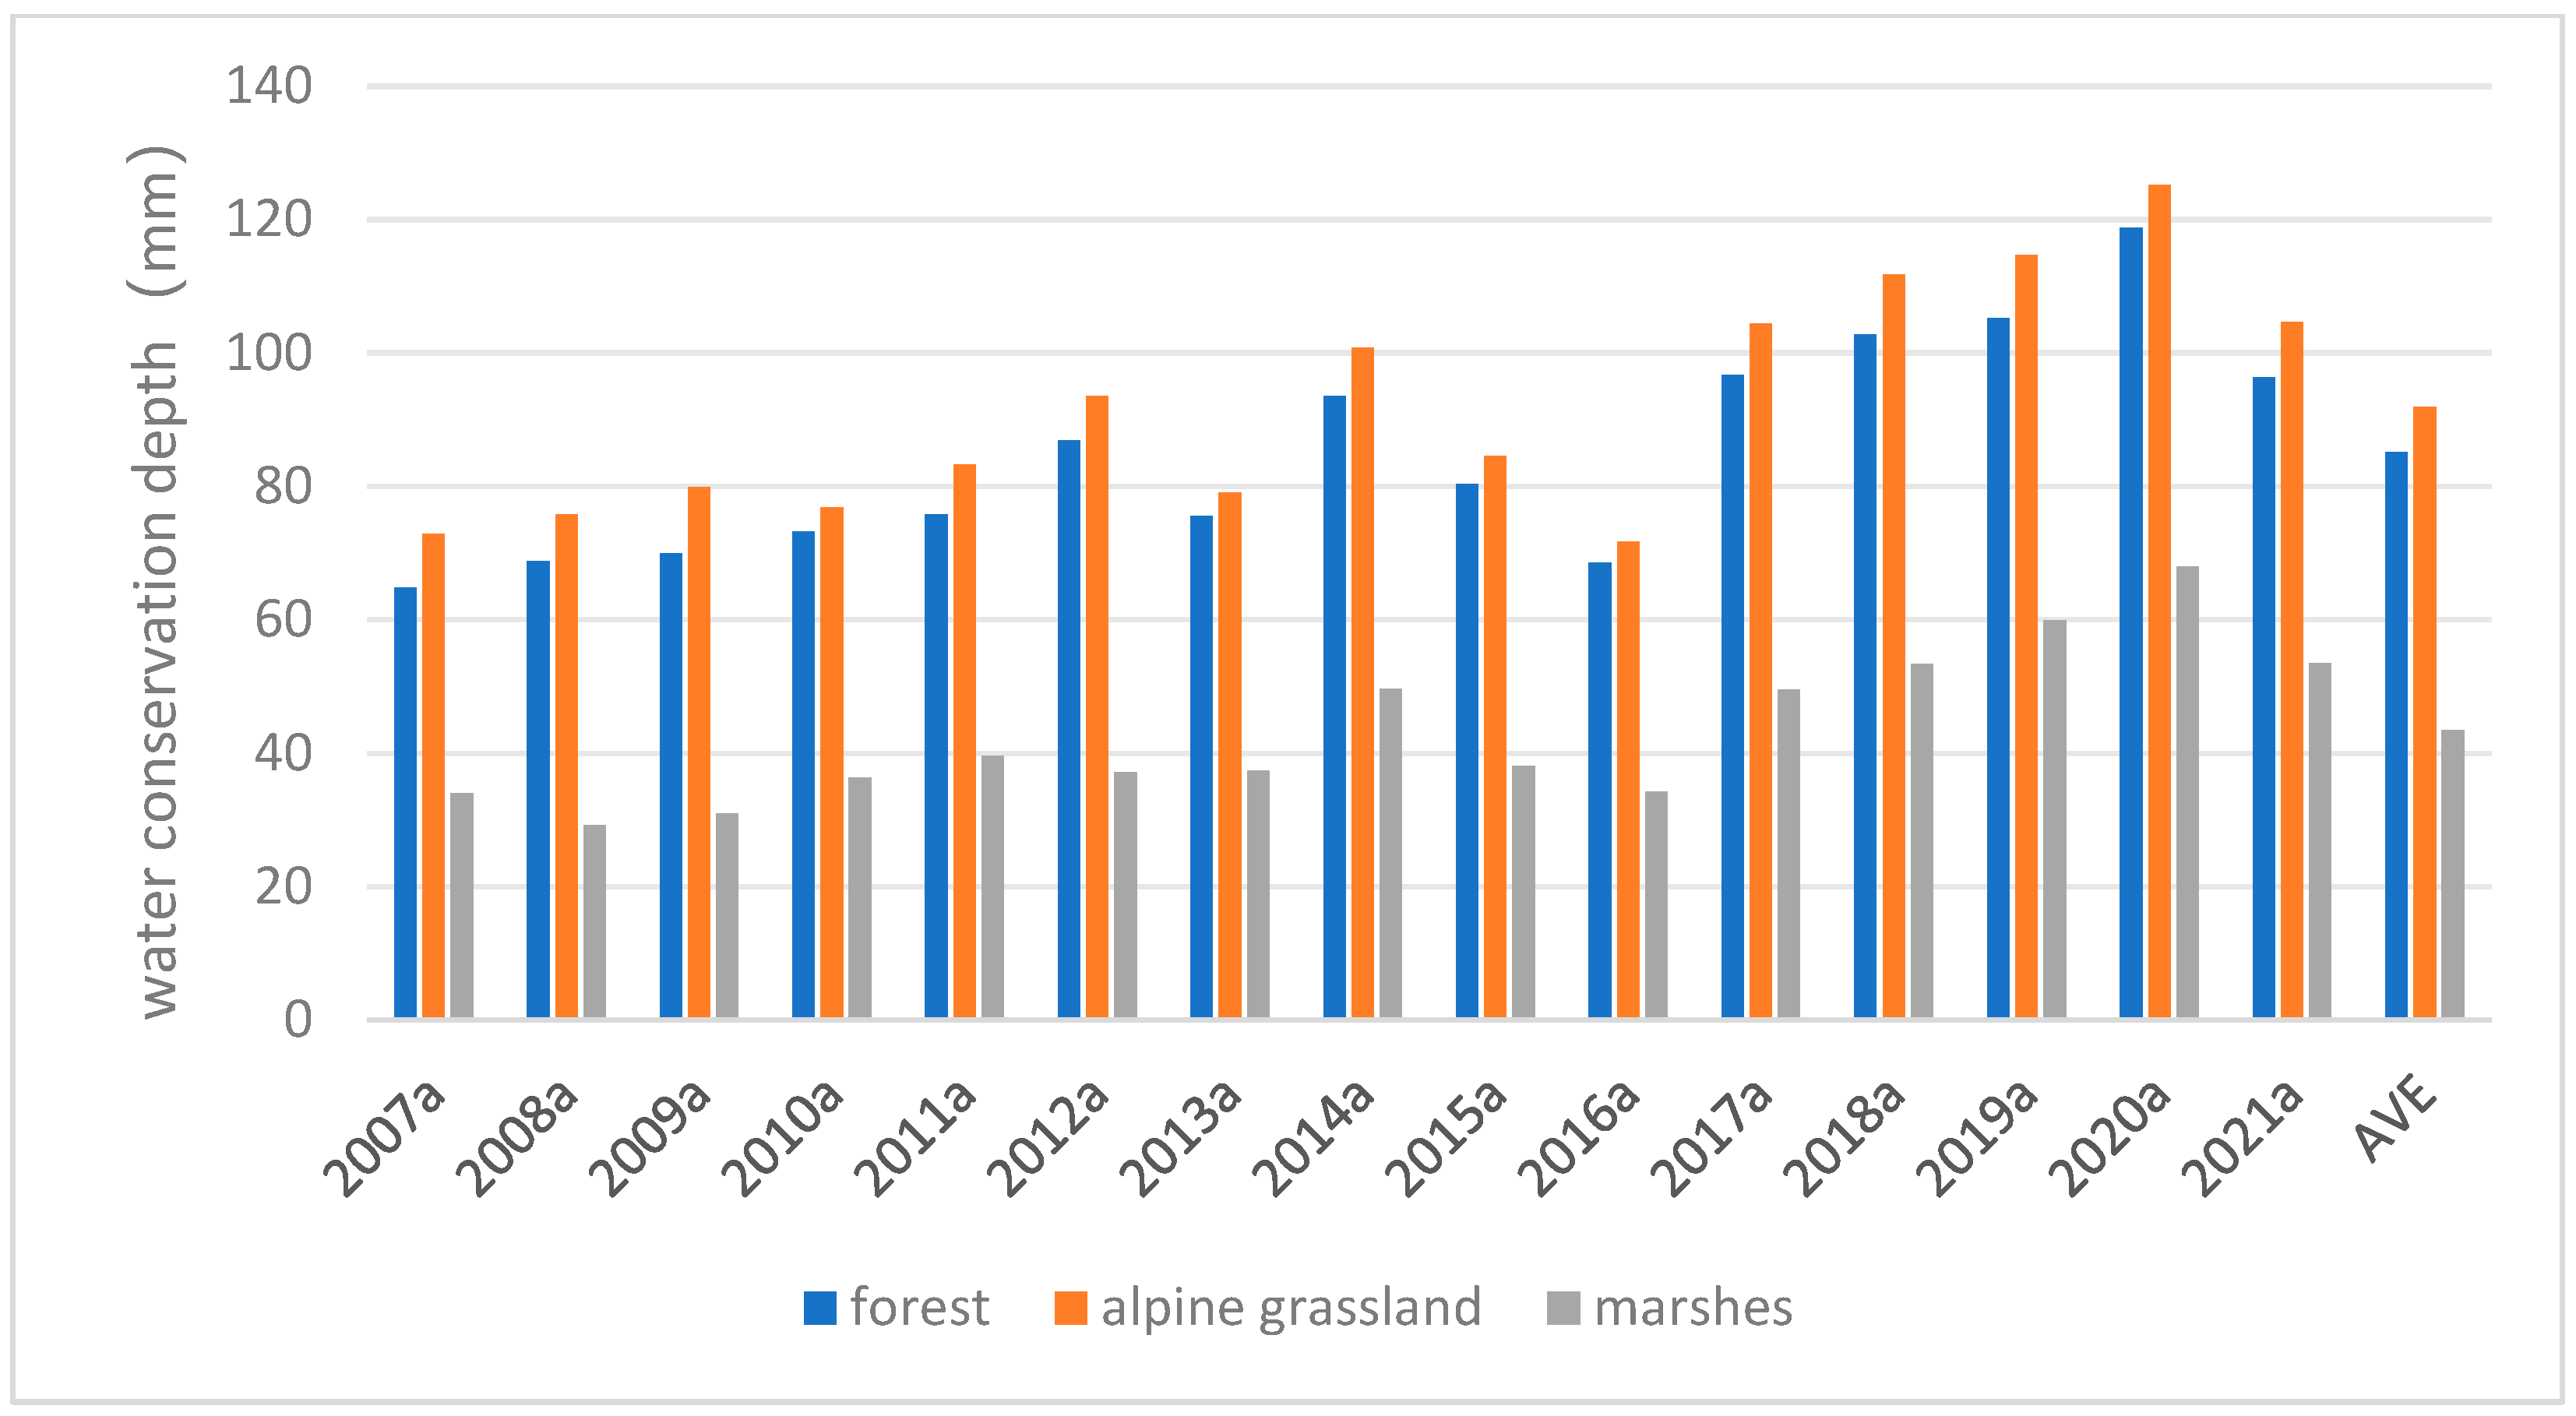
The results of zoning statistics, overlaying the mean values of water conservation over the 15-year period with the raster plot of vegetation cover (
Figure 7), are presented in
Figure 8. As can be seen in the figure, under the three vegetation cover systems, the water conservation capacity has an overall upward trend with the passage of time. Among them, the water conservation capacity of the alpine grassland is the largest, with an average value of 91.94 mm, followed by the water conservation capacity of the forest, with an average value of 85.15 mm, and the lowest Is the water conservation capacity of the swamp, with an average value of 43.41 mm. There were relatively obvious downward fluctuations in the time series between 2016 and 2021. According to the Water Resources Bulletin of that year, the total precipitation in Aba Prefecture in 2016 was 6.3% lower than in 2015 and 11.1% lower than normal. In the same year, precipitation in Garze County and Seda County in Garze Prefecture decreased by 14.4% and 10.3%, respectively, compared to 2015. In 2021, the total precipitation in Aba Prefecture decreased by 17.5% compared to 2020, while in Ganzi Prefecture, the total precipitation decreased by 5.9% compared to 2020 and by 5.1% compared to the annual average. Precipitation is the direct source of water conservation. The decrease in precipitation directly affects the spatio-temporal change trend of water conservation in the study area. Especially in years with abnormally low precipitation, the decrease in water conservation is more significant.
In terms of area coverage, the alpine grassland cover system accounts for 72.45% of the entire study area. As one of the eight major pastures in China, the grassland of northwest Sichuan has shown a positive trend of “overall degradation basically curbed” following the successful implementation of policies such as fencing and forbidding pasture and the project of returning pasture to grassland in 2003 and 2011 in China [
42]. Degraded grasslands have been restored to a certain extent, leading to the faster restoration of production functions, improved ecological services, and relatively significant water conservation functions.
The forest cover system occupies 24.06% of the study area and Is primarily composed of scrub and coniferous and deciduous forests, predominantly found in mountainous areas with steeper slopes at lower elevations. Alpine forests effectively mitigate the rate of rainwater runoff, while the cover formed by forest vegetation roots and dead leaves enhances soil water retention capacity and prevents water loss. However, on steeper slopes with less tree cover, there may be varying degrees of impact on water conservation.
The marsh cover system is the smallest in the area, accounting for 3.48%. Mainly distributed in Ruoergai and Hongyuan Counties, wetland vegetation and soil in the marsh exhibit good water retention performance. However, the fragile ecosystem of Ruoergai grassland wetland, dominated by marsh and meadow vegetation, is susceptible to human disturbances. Pastoralists, pressured to expand pastures, have extensively ditched and drained wetlands since the 1960s, adversely affecting soil structure, pore flow, and groundwater table. Illegal peat soil mining further damages the ecological environment service function of peat wetlands, impacting water storage capacity and water conservation capacity. Despite the low mean value of water conservation in the marsh cover system, it exhibits an upward trend in the time series, possibly due to recent government initiatives such as the “fill the ditch to wet” project and crackdowns on illegal peat soil mining, highlighting the interplay between policy interventions and ecosystem health.
3.4.2. Climate Effects on Water Conservation Under Different Vegetation Cover Conditions
Climate factors are the primary natural drivers of changes in water conservation capacity [
43], with precipitation and evapotranspiration (ET) being the main climatic factors directly influencing the increase or decrease of water conservation in ecosystems. Therefore, this paper focuses on two key factors, precipitation and ET, and analyzes their correlations with water conservation in the three major vegetation cover systems. A grid of 2 km × 2 km was established in the study area, and feature points were uniformly generated within the grid. Multi-value extraction was then employed to extract the multi-year average precipitation, ET, water conservation, and vegetation types, respectively. Zonal statistics of these factors were conducted based on the three vegetation cover systems, and the statistical results were analyzed through correlation and linear regression, the outcomes of which are depicted in
Figure 9.
The relationships between precipitation, ET, and water conservation under forest cover systems are illustrated in
Figure 9a,b. The relationships between precipitation, ET, and water conservation under alpine grassland cover systems are shown in
Figure 9c,d. The relationships between precipitation, ET, and water conservation under the marsh cover system are presented in
Figure 9e,f. It can be observed that precipitation under the three vegetation cover systems exhibited a positive correlation with the depth of water retention, with correlation coefficients of 0.21, 0.24, and 0.14, respectively, at a confidence interval of
p ≤ 0.05. Precipitation serves as a primary water resource, with higher precipitation typically indicating more water recharge. Adequate precipitation replenishes surface water, groundwater, and water bodies like lakes and rivers, while increased precipitation helps maintain soil moisture and prevent soil erosion and loss, thus generally enhancing water conservation capacity.
ET showed a strong negative correlation with the depth of water conservation under all three vegetation cover systems, with correlation coefficients of −0.69, −0.71, and −0.70, respectively, which shows that ET is an important factor affecting water conservation. ET depletes water from vegetation and soil, resulting in water loss, especially during dry seasons and in arid regions, where ET may exacerbate water scarcity and reduce water conservation capacity. ET can also slow down stormwater runoff, thereby reducing surface runoff and affecting surface water supply. In some areas, excessive ET may lead to surface water depletion, further diminishing water conservation. Hence, increased ET generally impacts the ability of water sources to retain water.
3.4.3. Influence of Topography on Water Conservation Under Different Vegetation Cover Conditions
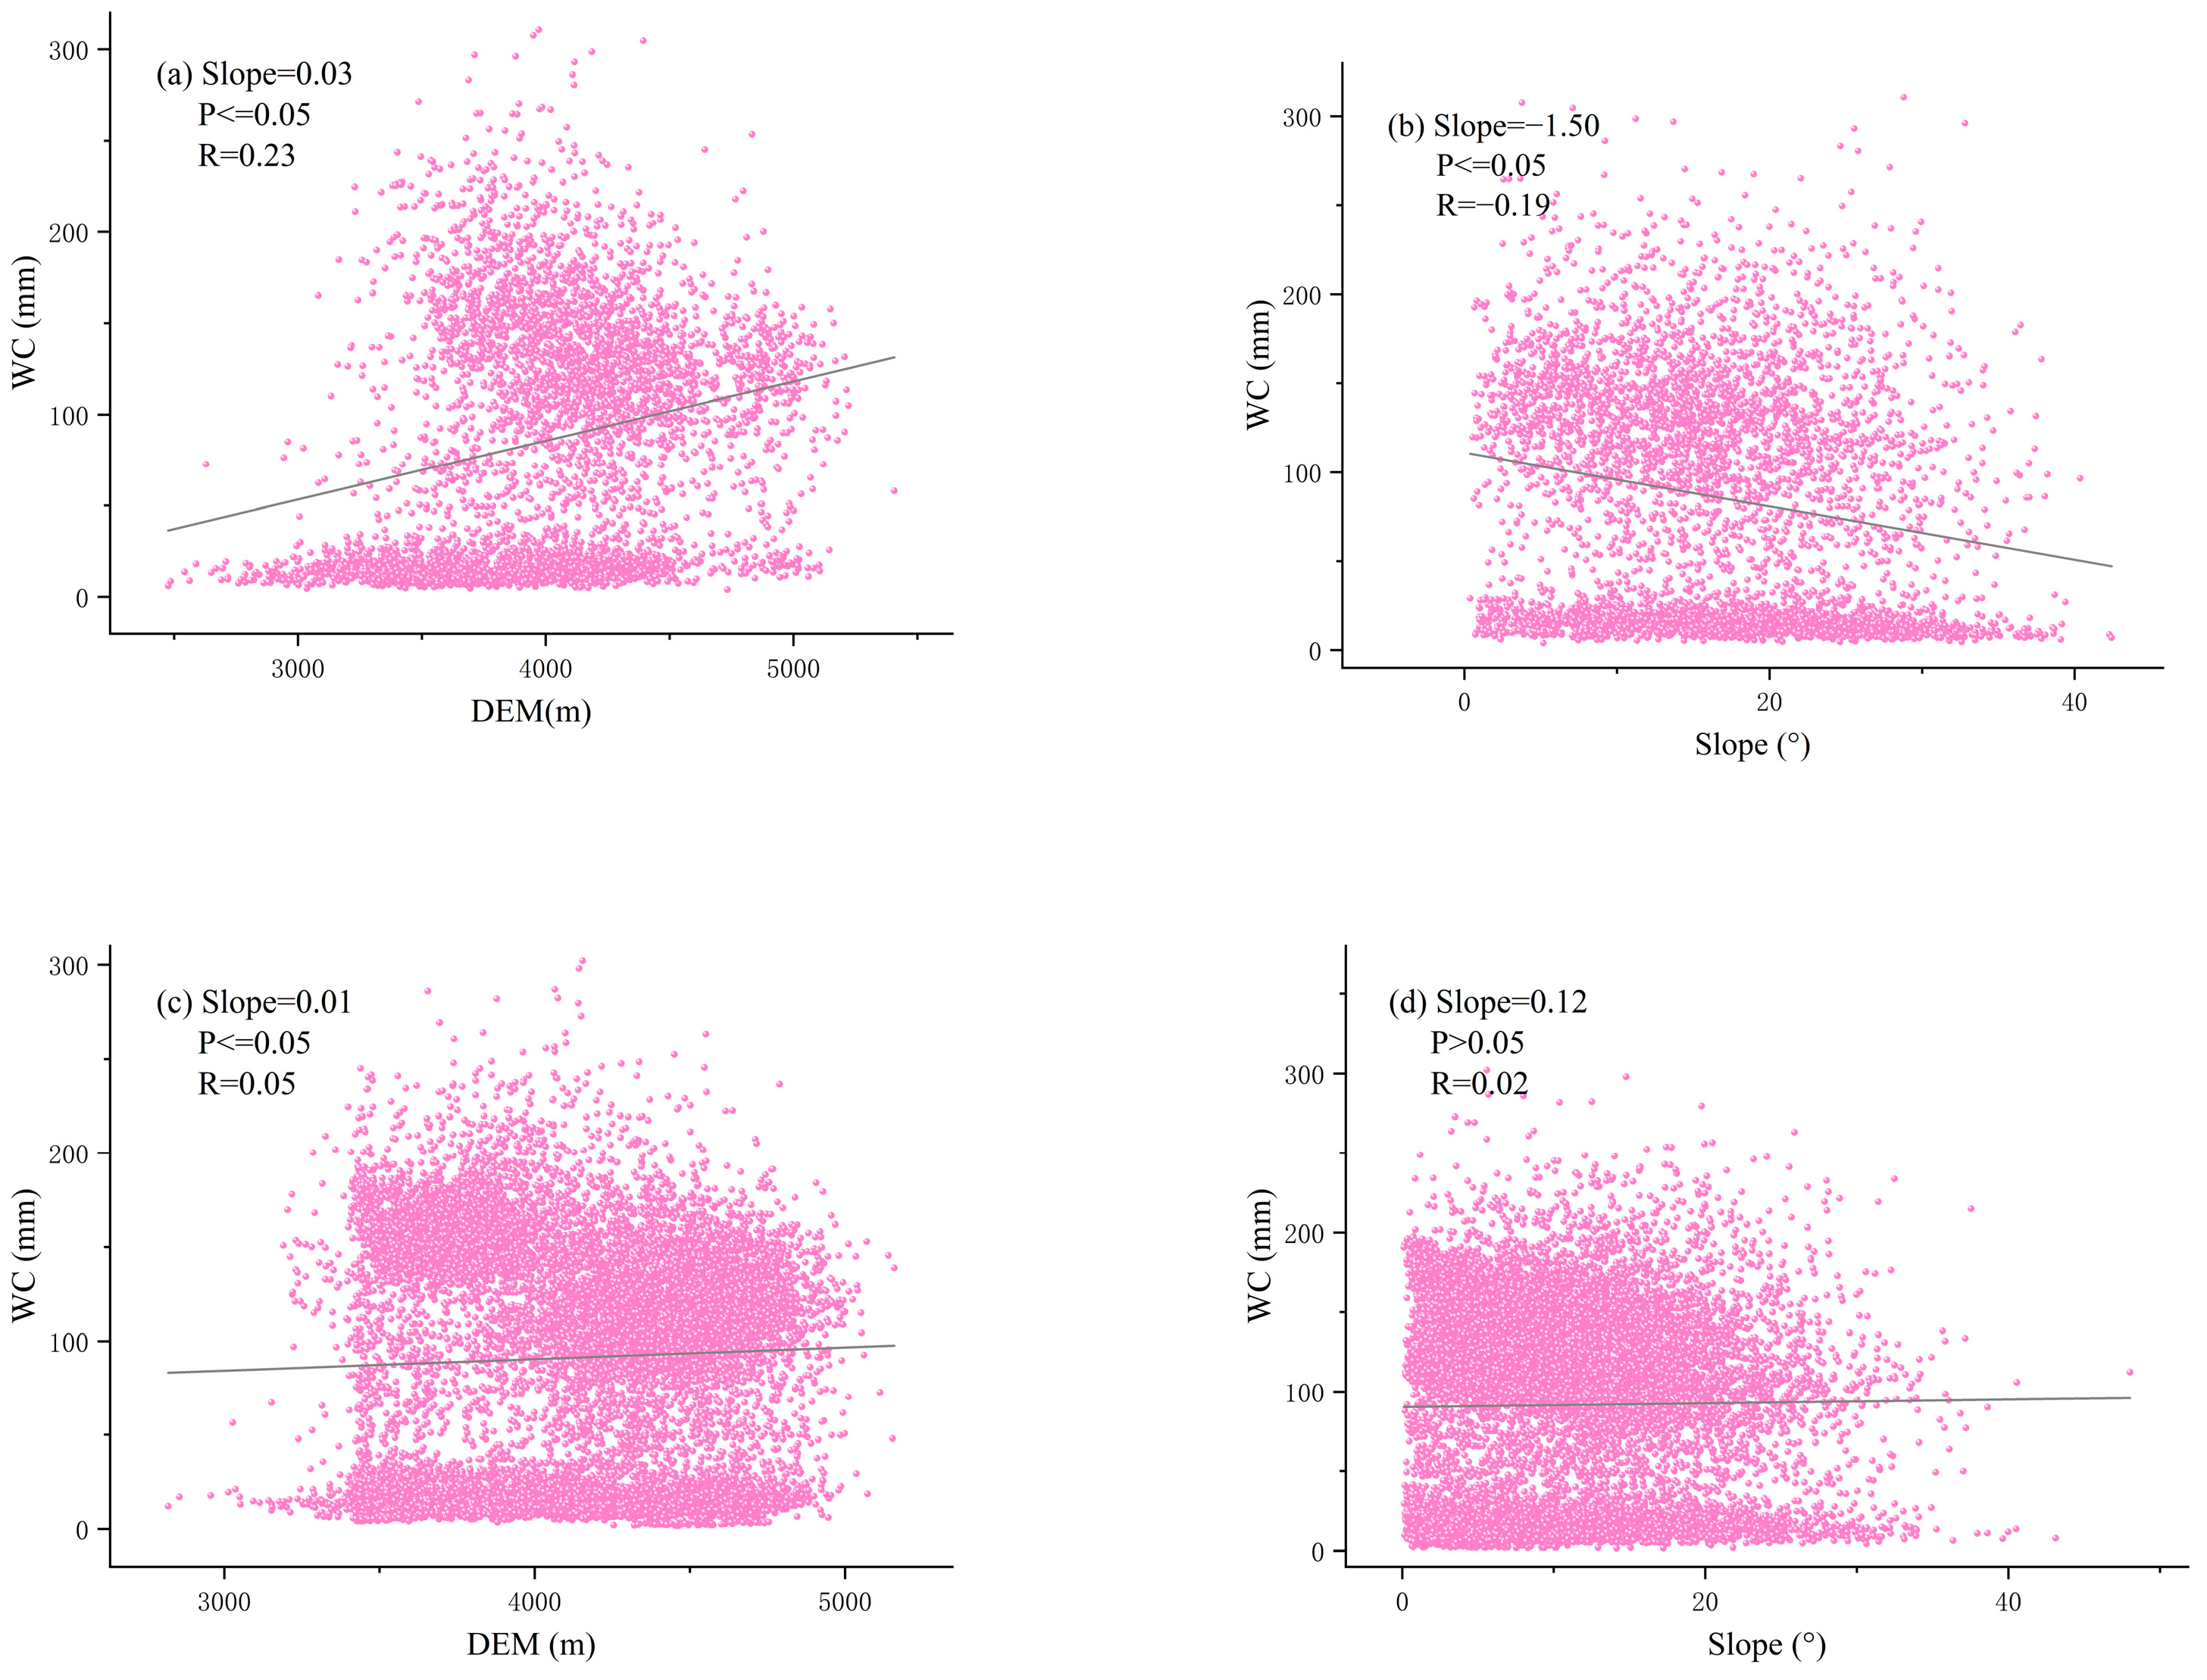
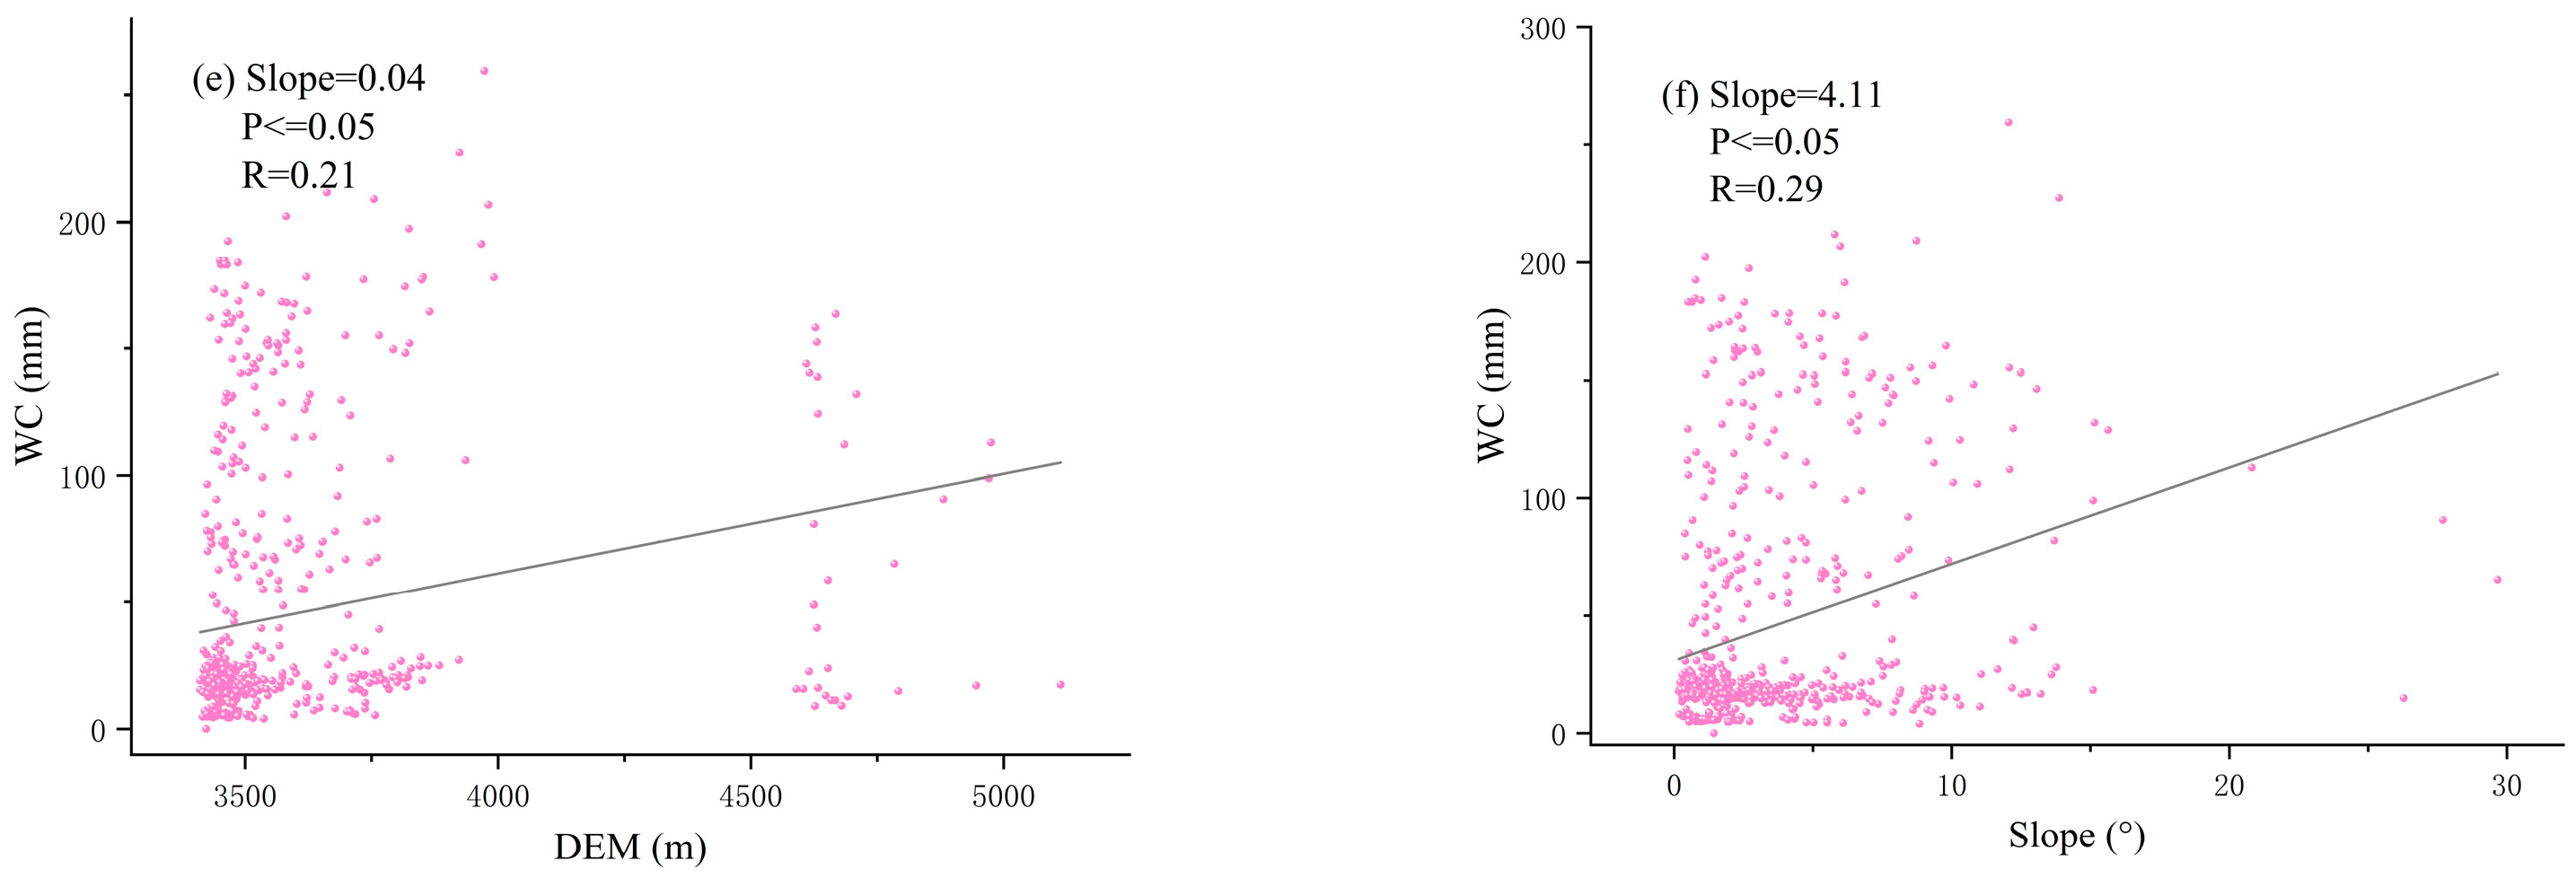
Topographic factors play a crucial role in water conservation by influencing water movement, storage, and retention. In this paper, elevation and slope data were selected to analyze their relevance to water conservation in the three major vegetation cover systems. The same methodology was used for the extraction of elevation and slope data, zoning statistics based on the three vegetation cover systems, and correlation analysis and linear regression analysis of the statistical results, as shown in
Figure 10.
Figure 10a,b illustrate the relationship between elevation and slope and water conservation under the forest cover system. The relationship between elevation and slope and water conservation under the alpine grassland cover system is depicted in
Figure 10c,d.
Figure 10e,f show the relationship between elevation and slope and water conservation under the marsh cover system.
It can be observed that elevation under the three vegetation cover systems exhibited a positive correlation with the depth of water conservation, with correlation coefficients of 0.23, 0.05, and 0.21, respectively, at the confidence interval of p ≤ 0.05. Higher altitudes typically have lower temperatures and higher humidity, which favors less evaporation of water bodies. Additionally, precipitation is relatively greater at higher altitudes, making it easier to form water sources. The positive correlation aligns with objective laws. However, in the region covered by alpine grassland, the correlation between elevation and water conservation is low due to the low elevation changes in the region and the predominance of plateaus in the terrain. Water conservation in this region depends more on the degree of water retention in the subsurface (soil and water conservation capacity) than on changes in elevation alone.
Slope was negatively correlated with water conservation depth, with a correlation coefficient of −0.19 under the forest cover system, and positively correlated under the alpine grassland system and swamp system, with 0.02 and 0.29, respectively. From the scatter plot, it can be observed that under the forest cover system, characteristic points have a more uniform distribution across all slopes. Generally, areas with larger slopes, especially those above 30°, exhibit a negative correlation trend with a faster water flow rate, which increases the likelihood of soil erosion and reduces water conservation capacity. Under the alpine grassland system, the correlation between slope and water conservation is relatively low, and most areas do not show a significant spatial correlation. The scatter plot shows that most data points are concentrated within a slope range of 25°, where the slope is relatively gentle and the terrain is more flat. In this range, the water conservation capacity is more dependent on the water retention ability of the underlying surface, showing a weak positive correlation. Under the swamp cover system, the undulating slope easily forms depressions, which strengthens the convergence of water flow and enhances the water collection capacity, thus showing a positive correlation trend.
4. Discussion
Water conservation capacity is a complex and comprehensive concept influenced by both natural and anthropogenic factors. The study area, located in the alpine region of northwest Sichuan, has a low population density, low construction intensity, and land use dominated by grassland and woodland. Therefore, this paper mainly starts from natural factors and reveals the differences in water conservation and its driving factors among different vegetation cover types at the zonal scale, which provides a more detailed perspective for understanding the water conservation mechanism.
4.1. Protection Strategies for Water Conservation Functions of Different Vegetation Cover Systems
The study shows that in recent years, the ecosystem service functions in the study area have continuously improved due to a series of ecological protection policies implemented by the government, such as grassland restoration and wetland protection programs. This is consistent with the research conducted by Wang et al. (2023) [
44] in the ecological barrier region of the Tibetan Plateau, which found that policy interventions significantly enhanced the water conservation function in high-altitude areas. Subsequently, the protection and management of water conservation zones should continue to be strengthened, and targeted restoration and reconstruction of ecosystems such as forests, grasslands, and wetlands in water conservation zones should be conducted by actual needs to improve the water conservation capacity of ecosystems.
For forest systems, measures such as artificial thinning and forest gap creation, optimizing vegetation structure, and introducing mixed-species patterns can effectively enhance the soil’s water retention capacity. For steep slopes, ecological slope protection measures, such as vegetation buffer zones and soil and water conservation projects, can significantly reduce surface runoff velocity and improve water conservation functions. In areas with vegetation degradation or forest destruction, active reforestation and the restoration of degraded areas are essential to restore the water conservation functions of the forest system.
For alpine grassland systems, in areas of degraded grasslands and severe desertification, priority should be given to grass species restoration programs, such as planting cold- and drought-resistant local grasses to restore grassland vegetation cover. The scientific implementation of rotational grazing and grazing prohibition management is essential, with proper control of grazing pressure based on grassland growth conditions, climate factors, and ecological carrying capacity to prevent overgrazing and maintain reasonable grassland cover. Additionally, the ecological restoration of grasslands should include pest control measures for rodents and insects, using a combination of scientific rodent control and vegetation restoration to reduce the damage caused by rodents to soil structure and grassland vegetation, thus promoting ecosystem recovery.
For plateau marsh systems, it is crucial to strictly adhere to the ecological red line for wetlands, prohibiting the construction of drainage ditches and channels in wetland areas. For wetlands that have been reclaimed or damaged, ecological restoration measures such as blocking drainage channels and artificially planting hydrophilic plants should be implemented to restore the hydrological connectivity of the wetland and enhance its water storage capacity. Through these measures, the water conservation capacity of the three types of vegetation-covered systems can effectively be improved, providing essential support for the sustainable development of the ecosystem.
4.2. Directions for Future Research
External factors such as climate and topography directly influence water conservation, while the internal condition of the subsurface also plays a crucial role. In addition to vegetation cover, soil type is another significant factor affecting water conservation. The Ruoergai wetland, located within the study area, is China’s first large plateau swamp wetland and the largest and best-preserved plateau peat bog globally. Peat, formed over millions of years under specific conditions, acts as a vital carbon sink and ecosystem reservoir. Its destruction could have irreversible ecological consequences, highlighting the importance of safeguarding peat wetlands for global ecological security. Further research on peat and its role in water conservation and ecological services is recommended to prioritize the protection of carbon-rich wetlands and enhance global ecological security.
Over seventy percent of the study area comprises alpine grassland, a critical ecological pasture area. Since the implementation of the national policy of fencing and grazing prohibition, the grasslands in northwest Sichuan have shown positive signs of recovery, with improvements in the ecological environment and ecosystem service function to some extent. However, recent studies have identified spatial variability in the effectiveness of the “fencing and grazing prohibition” policy in promoting the recovery of degraded grasslands. Large-scale and long-term grassland monitoring studies suggest that the restoration of degraded grasslands depends on environmental factors, especially regional climatic conditions, indicating the need for tailored approaches based on specific grassland types and environmental conditions [
45].
The “one-size-fits-all” approach of the “fencing and grazing ban” may have adverse effects on the decline of grassland vegetation diversity and productivity, as well as the fragmentation of landscape patterns, consequently impacting the water conservation function of alpine grassland [
46]. Therefore, subsequent comprehensive and systematic scientific evaluations of the spatio-temporal patterns of the response of water conservation in alpine grasslands in the upper reaches of the rivers in northwestern Sichuan to fencing and grazing bans can be conducted, aiming to provide technical support and decision-making basis for scientifically planning and precisely laying out ecological protection projects for fencing and grazing bans in the alpine grasslands of the upper reaches of the rivers in northwestern Sichuan, and ultimately improve water conservation capacity.
5. Conclusions
In this paper, based on the principle of water equilibrium, the spatial and temporal evolution characteristics of the water conservation function and its influencing factors in the river source area of the northwest Sichuan River from 2007 to 2021 were investigated, and the results showed the following.
- (1)
Spatial and temporal distribution characteristics:
Over the 15-year study period, the total water source conservation showed an increasing trend, with the depth of water conservation showing a similar upward trend to precipitation, while being negatively correlated with evapotranspiration (ET). Spatially, the water conservation depth followed a low–medium–high–low distribution pattern from east to west, with Aba County having the highest water conservation and Ruoergai County the lowest. Trend analysis revealed a significant overall increase in water source conservation from 2007 to 2021.
- (2)
Spatial characteristics of different vegetation cover systems:
Among different vegetation cover systems, alpine grasslands had the highest water source conservation, followed by forests, while wetlands had the lowest. The marsh ecosystem, due to its relatively homogenous vegetation structure, is greatly affected by rainfall and anthropogenic causes, and its water conservation capacity needs to be further restored. Since the “Twelfth Five-Year Plan,” the State has intensified efforts to protect the ecological environment, implementing policies such as fencing and banning grazing on grasslands and returning pasture to grassland. In mountainous areas with steep slopes, ecologically fragile areas of the western Sichuan Plateau have been restored through forestation and artificial afforestation programs. In swampy wetlands, wetlands are protected and water is returned, promoting scientific and systematic protection. Today, the ecological function of the northwest Sichuan Plateau has been continuously strengthened, and water conservation capacity continues to improve. These measures need to be further optimized in the future by developing refined management strategies for different vegetation systems to enhance the efficiency and sustainability of ecological restoration.
- (3)
Climate influences under different vegetation cover systems:
Precipitation was positively correlated with water source conservation, while evapotranspiration showed a strong negative correlation with it. This indicates that precipitation is the main replenishment source for water conservation, while evapotranspiration reduces soil moisture and slows down runoff, thereby inhibiting the water conservation capacity. Long-term monitoring of precipitation and evapotranspiration should be strengthened, and water resource management strategies should be optimized.
- (4)
Topographic influences under different vegetation cover systems:
By analyzing the correlation between elevation, slope, and water conservation under the three main vegetation cover systems, it was found that elevation was positively correlated with water conservation depth under all three systems, while slope showed variability. Generally, higher elevations have higher precipitation and lower temperatures, conducive to reduced evaporation of water bodies. Slope, however, exhibited variability: Within 30°, greater slopes correlated with higher water conservation, while above 30°, susceptibility to soil erosion led to a declining trend in water conservation.
