Article

Impact of Rain Gauge Density on Flood Forecasting Performance: A PBDHM’s Perspective

School of Geography and Planning, Sun Yat-sen University, Guangzhou 510006, China
*
Author to whom correspondence should be addressed.
Water 2025, 17(1), 18; https://doi.org/10.3390/w17010018
Submission received: 14 November 2024 / Revised: 18 December 2024 / Accepted: 23 December 2024 / Published: 25 December 2024
(This article belongs to the Section Hydrology)

Abstract

:
The structures and parameters of physically-based distributed hydrological models (PBDHMs) can now be established and derived from remote-sensing data with relative ease. When engineers apply PBDHMs for flood forecasting in mesoscale catchments, they encounter varying rain gauge infrastructure conditions. Understanding model performance expectations under varying rain gauge density conditions is crucial for wide PDBHM construction. This study presents a case study of a PBDHM called the Liuxihe Model and examines six rain gauge density scenarios designed based on real-world data to assess the impact of rain gauge density on model flood forecasting performance. The study focuses on a mesoscale catchment in Jiangxi Province, China, covering an area of 2364 km2 with 62 rain gauges. The results indicate that models optimized under an adequate rain gauge density condition are less affected by gauge density changes, maintaining accuracy within a range of change. Compared to Kling–Gupta Efficiency (KGE) and Nash–Sutcliffe Efficiency (NSE), the indicators absolute peak time error (APTE) and peak relative error (PRE) are less sensitive to variation in rain gauge density. The study further discusses how rain gauge density changes related to the interpolated rainfall surfaces and parameter optimization, hoping to facilitate the broader application of PBDHMs and offer insights for future practices.

1. Introduction

Flooding resulting from excessive rainfall has been occurring frequently and disasters caused by floods damage people’s lives and property [1], especially for catchments that lack flood monitoring and management. Flood forecasting is a crucial task in catchment management, which falls within the scope of short-term streamflow forecasting, targeting on the hourly time scale, and providing information on flood peak quantity, peak timing, and the flood hydrograph.
It is necessary for flood-prone catchments to set up a flood forecasting system. PBDHMs have a reputation for their interpretability and robustness, which is a feasible and stable component for constructing a catchment flood forecasting system [2]. As disciplines like pedology and remote-sensing developed, more and more high-quality data could be accessed worldwide, and parameters depicting the catchment’s underlying surface characteristics could be derived from public datasets with relative ease. Moreover, the resolution of remote-sensing data has been gradually improving, leading to the advancement in hydrological models into the era of PBDHMs [3,4]. PBDHMs require data such as terrain data, land-use data, and soil data. In the past, acquiring these data was challenging; it was difficult for researchers to obtain the data needed for constructing PBDHMs or the data’s coarse resolution led to suboptimal performance. Nowadays, there is a wealth of terrain data available for constructing PBDHMs. For mesoscale catchment, DEM data with resolutions of 90 m (SRTM DEM), 30 m (ASTER GDEM), or even 12.5 m (TanDEM-X DEM) can be selected according to specific needs, and most of these datasets are freely available and cover global regions [5]. The availability of land-use data for PBDHMs is also extensive, with numerous datasets such as the 30 m CLCD [6], the 10 m Sentinel-2 Global Land Cover Map [7], and many more. Soil-related parameters can also be obtained through remote-sensing technologies; available datasets include soil type database SOTER [8], soil moisture product SMAP [9], and so on. These remote-sensing datasets have significantly advanced the development and widespread application of PBDHMs.
For PBDHMs on flood forecasting, with the combined efforts of many interdisciplinarities, a lot of models were proposed for decision-making on flood prevention and control, such as the SHE [10], VIC [11], HEC-HMS [12], Liuxihe model [13], etc. A PBDHM that describes the catchment’s underlying surface well is robust to respond to various magnitudes of rainfall and has the ability to depict characteristics of a flood that is caused by extreme rainfall accurately.
Once the structure and parameters of the model are determined, for a typical mountainous catchment, inputting rainfall data to the model is sufficient for flood forecasting [14,15]. The preliminary establishment of a PBDHM requires an assessment of the rain gauge infrastructure within the catchment, the rain gauge infrastructure condition in each catchment is constrained by factors such as the local economy and terrain. The observational data from rain gauges measure the rainfall reaching the ground at specific station locations, serving as a crucial source of input data for the model. By using spatial interpolation methods, the rainfall surfaces required for model input are obtained. The density of rain gauges in a catchment is one of the indicators used to measure the condition of the rainfall observation system of a catchment. Investigating the impact of rain gauge density on flood forecasting can provide valuable insights for the construction of flood forecasting models and the development of rain gauge networks within catchments.
In many developing countries, the establishment of rain gauges within river basins is often characterized by poor infrastructure and limited resources. This results in a lack of comprehensive and reliable data, hindering effective water resource management and flood forecasting efforts. Additionally, the sparse distribution of rain gauges exacerbates the challenge of accurately assessing precipitation patterns [16].
There are some studies about rain gauge density’s influence on the hydrological process. Sucozhañay and Célleri [17], Hohmann et al. [18] conclude that gauge density is a key factor affecting model performance. Yin et al. [19] studied the effect of rain station density on hydrological modeling from the perspective of model types. Zeng et al. [20] studied the impact of rain gauge density on runoff simulation from a lumped model perspective. Mishra [21] studied the effect of rain gauge density on the accuracy of rainfall and Prakash et al. [22] proposed a new parameter to access the minimum number of rain gauges necessary for a region to estimate rainfall. However, few studies, if any, have explored how rain gauge density indirectly impacts the performance of PBDHMs in hourly flood forecasting. Since spatial interpolation methods act as the bridge between rainfall observations and the rainfall surfaces used as model inputs, it is essential to investigate the sensitivity of commonly used interpolation methods to changes in rain gauge density. Additionally, parameter calibration/optimization methods provided by PBDHMs help compensate for errors in both input data and model structure to some extent. Therefore, understanding how the impact of rain gauge density propagates through spatial interpolation methods and parameter calibration/optimization is crucial. This knowledge will help answer the question of how the dynamic changes in rain gauge density affect the flood forecasting performance of PBDHMs.
This study set up a PBDHM called the Liuxihe model [13] in a mesoscale catchment located in Jiangxi Province, China to explore the above problems. The study considers three commonly used and representative spatial interpolation methods for rainfall input—Thiessen Polygons (THI), Inverse Distance Weighting (IDW), and Geographically Weighted Regression (GWR)—under varying gauge density conditions. Figure 1 is the flow chart of experiments designed in this study. The study first evaluates the performance of the model using existing gauges with three interpolation methods. Then five rain gauge density conditions are derived from the existing gauge distribution via a sampling algorithm based on gauge distance. These gauge density conditions and spatial interpolation methods consist of 18 scenarios in total. A dataset consisting of 15 flood events is used to compare the models to quantitatively analyze the impact of rain gauge density on model flood forecasting performance. Models using different spatial interpolation settings are optimized and tested separately. This case study hopes to promote PBDHMs construction on mesoscale catchments, especially for catchments with limited gauge infrastructure installed, providing a reference for catchment management agencies on gauge infrastructure development and curves of model performance expectation under varying rain gauge density conditions. A thorough analysis of the PBDHMs for flood forecasting principles is also illustrated, such analyses in this study would be valuable for engineers, hydrologists, or decision-makers working on flood forecasting and related research. The materials, methods, and detailed experimental design and settings of this study are comprehensively described in the following sections.

2. Materials and Methods

2.1. Study Catchment

The study catchment is called Ningdu catchment, named after its outlet stations. It is a mesoscale catchment with an area of about 2364 km2, located in Jiangxi Province, China (ranging from 26.43° N to 27.14° N, 115.71° E to 116.26° E). 
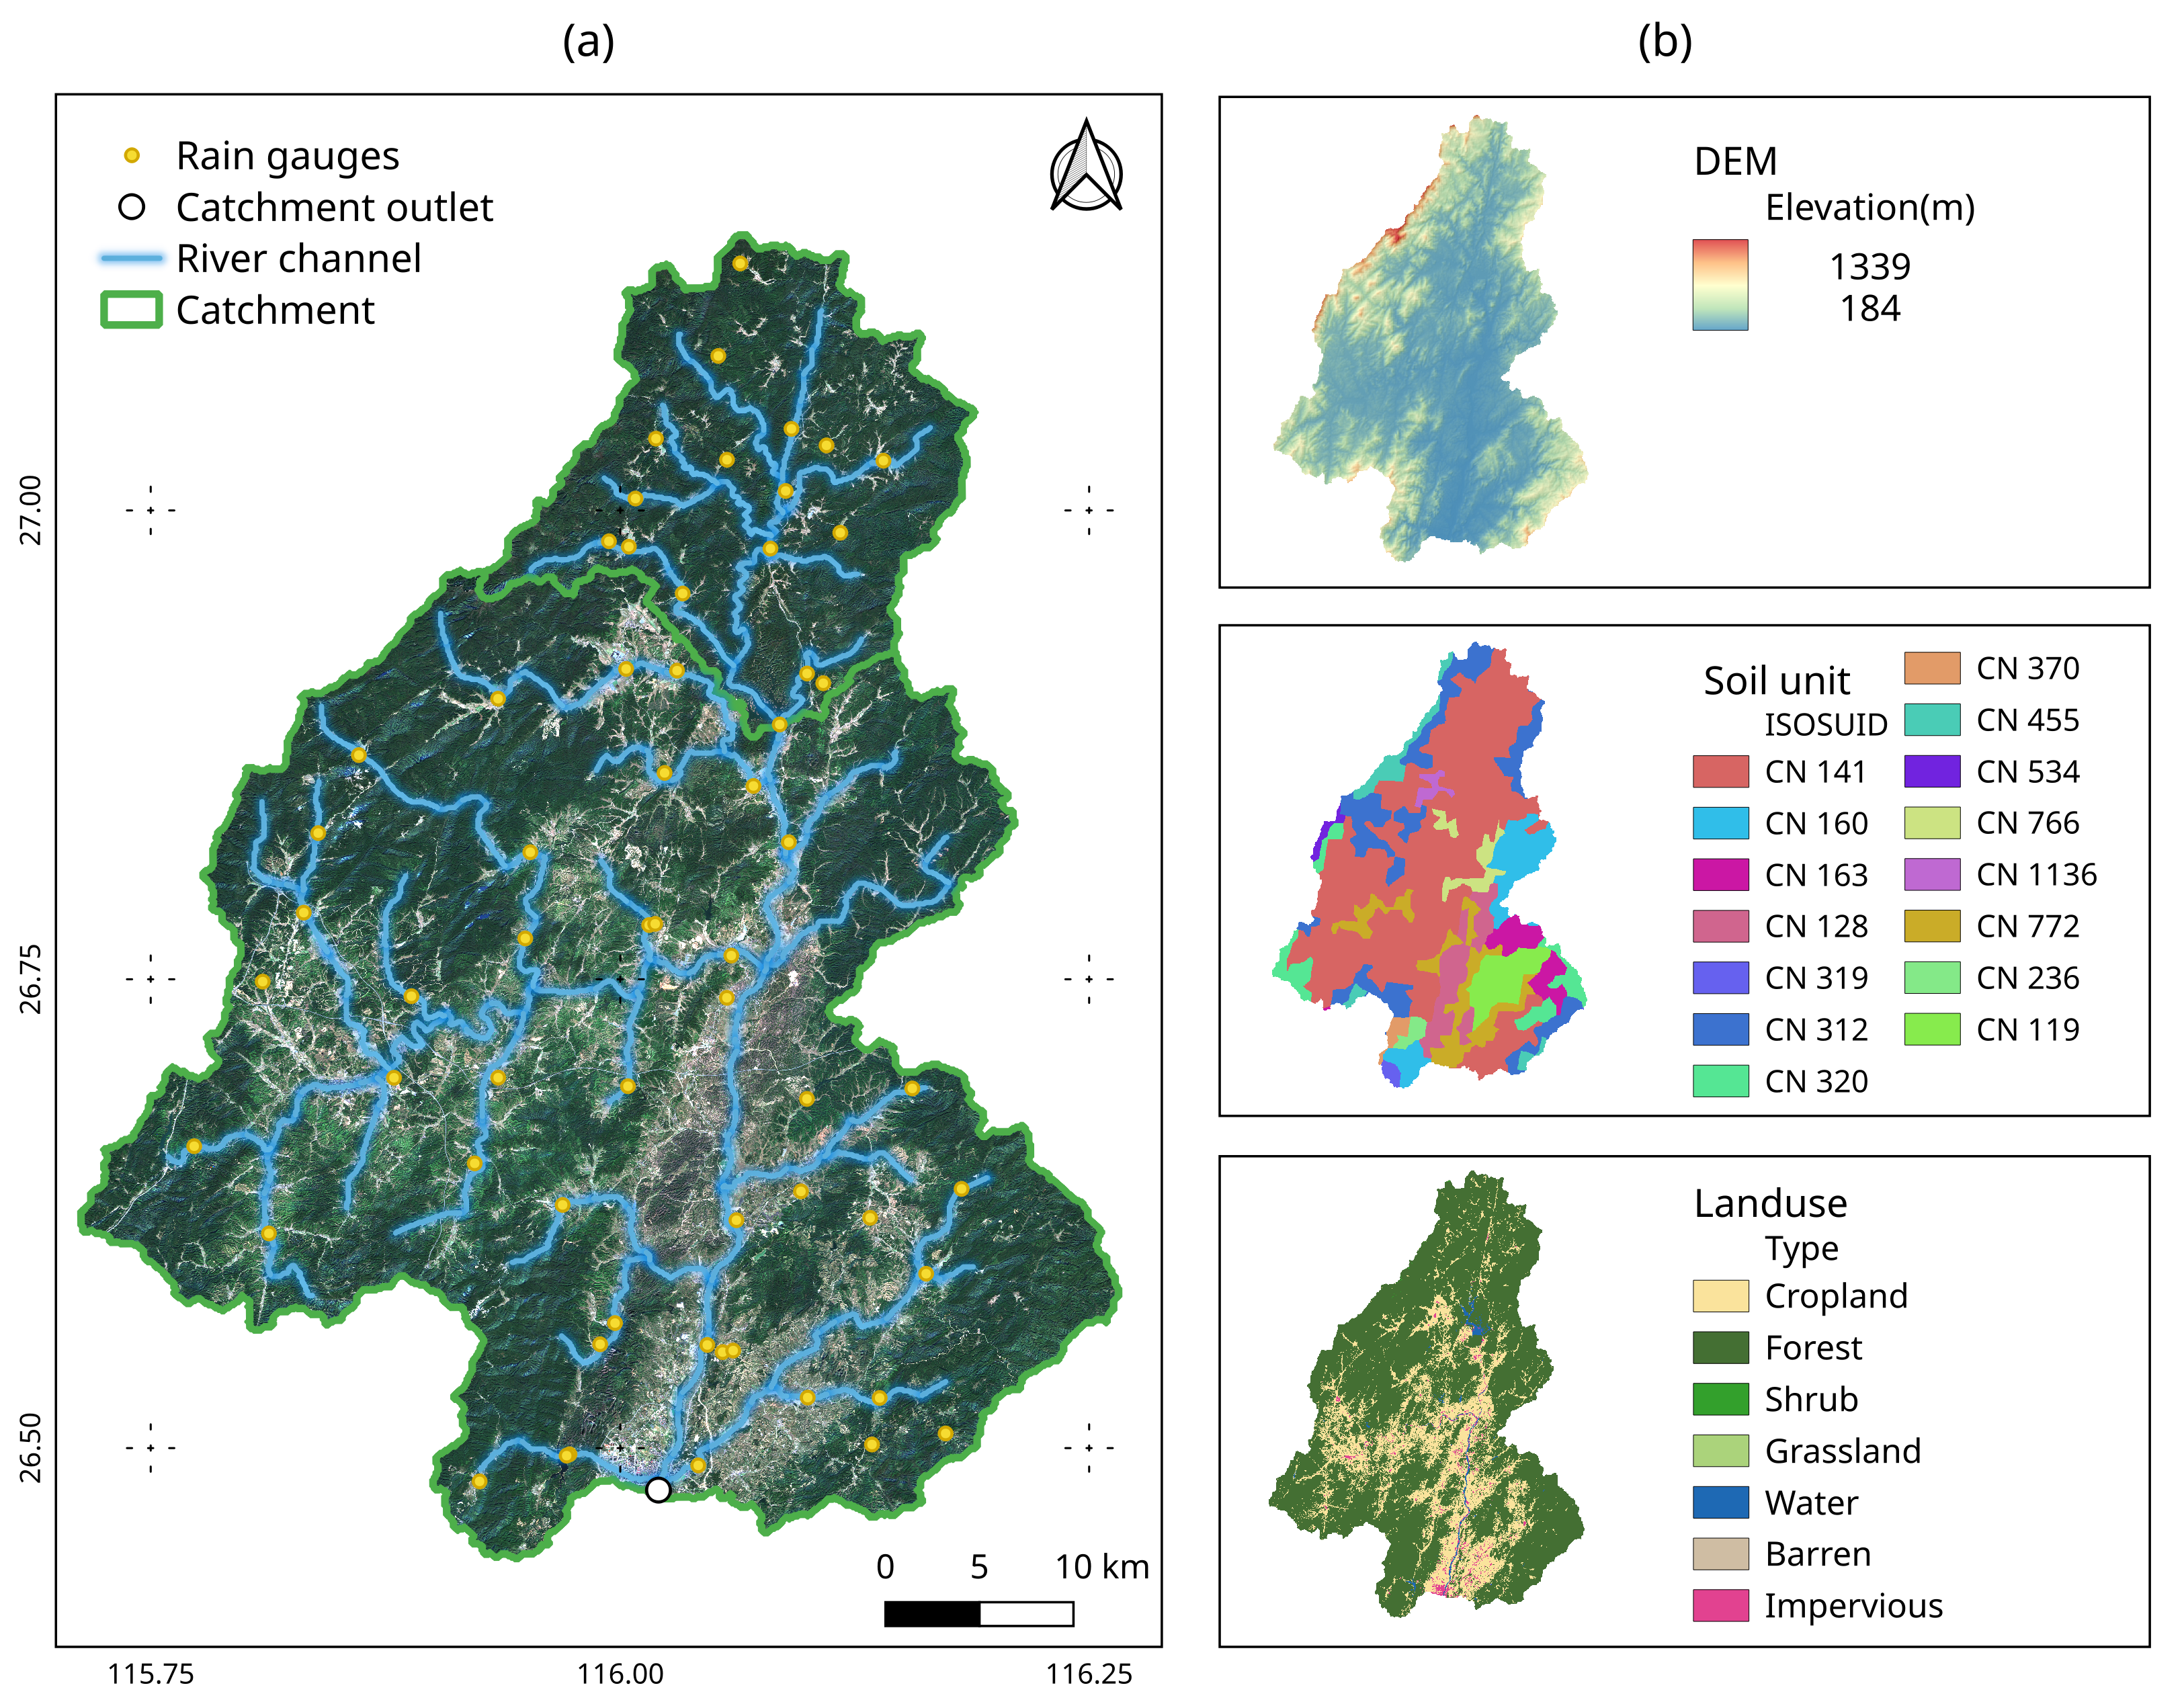
Figure 2 is the overview of the Ningdu catchment, showing its river network, rain gauge distribution, DEM, soil type, and land use. The catchment lies between 35 and 693 m in elevation and consists of river networks, which are tributaries of the Mei River. The catchment is located in the subtropical monsoon region, with forest and cropland as the primary land-use types. Human influence on the hydrological processes is relatively limited. According to the SOTER China database [8], there are 15 soil units in the catchment, with Haplic Acrisols being the predominant soil type. The Ningdu catchment is well-managed, it has a 62 rain gauge network, and long-time series hourly rainfall observations for the past few years have been collected.

2.2. Flood Events Data and Model Construction Data

Sixteen typical flood event data (time series of precipitation in each rain gauge and flow observation in catchment outlet) are extracted from the long time series of rain gauge observation from 2013 to 2017. Table 1 describes the flood events’ characteristics. The flood event dataset encompasses floods of varying magnitudes, ranging from large to small, and the flood durations span from 119 h to 527 h.
Event 2016-11-19 is chosen for parameter optimization, as it is a medium twin peak flood with a smooth flood hydrograph, which is relatively information-rich and less noisy for model parameter optimization. The other 15 events are used for model performance testing.
The basic structure of the Liuxihe model is constructed by DEM, soil, and land-use remote-sensing products. In this study, the 90 m SRTMv4 dataset [23] is used for the catchment DEM, model parameter slope and flow direction can be calculated from the DEM. For land-use data, a 30 m land-use product by Yang and Huang [6] is warped (resampled and aligned) to the resolution of DEM, and the model slope cell parameter evaporation coefficient and roughness coefficient are estimated according to the land-use of the cell. For soil data, the SOTER China database [8] is used. Soil-related parameters of the model could be calculated by a soil water characteristic calculator developed by Saxton and Rawls [24], according to the profile component of the soil. The initial values of landuse-related and soil-related parameters for the study catchment are provided in the Appendix A.

2.3. Liuxihe Model and Its Parameter Optimization Method

Liuxihe model is a productive PBDHM for mesoscale catchment flood forecasting, which has been applied to flood forecasting in many catchments in Southern China [25,26,27,28,29]. The following is a brief anatomy of the Liuxihe model and further details about the model can be found in [13].
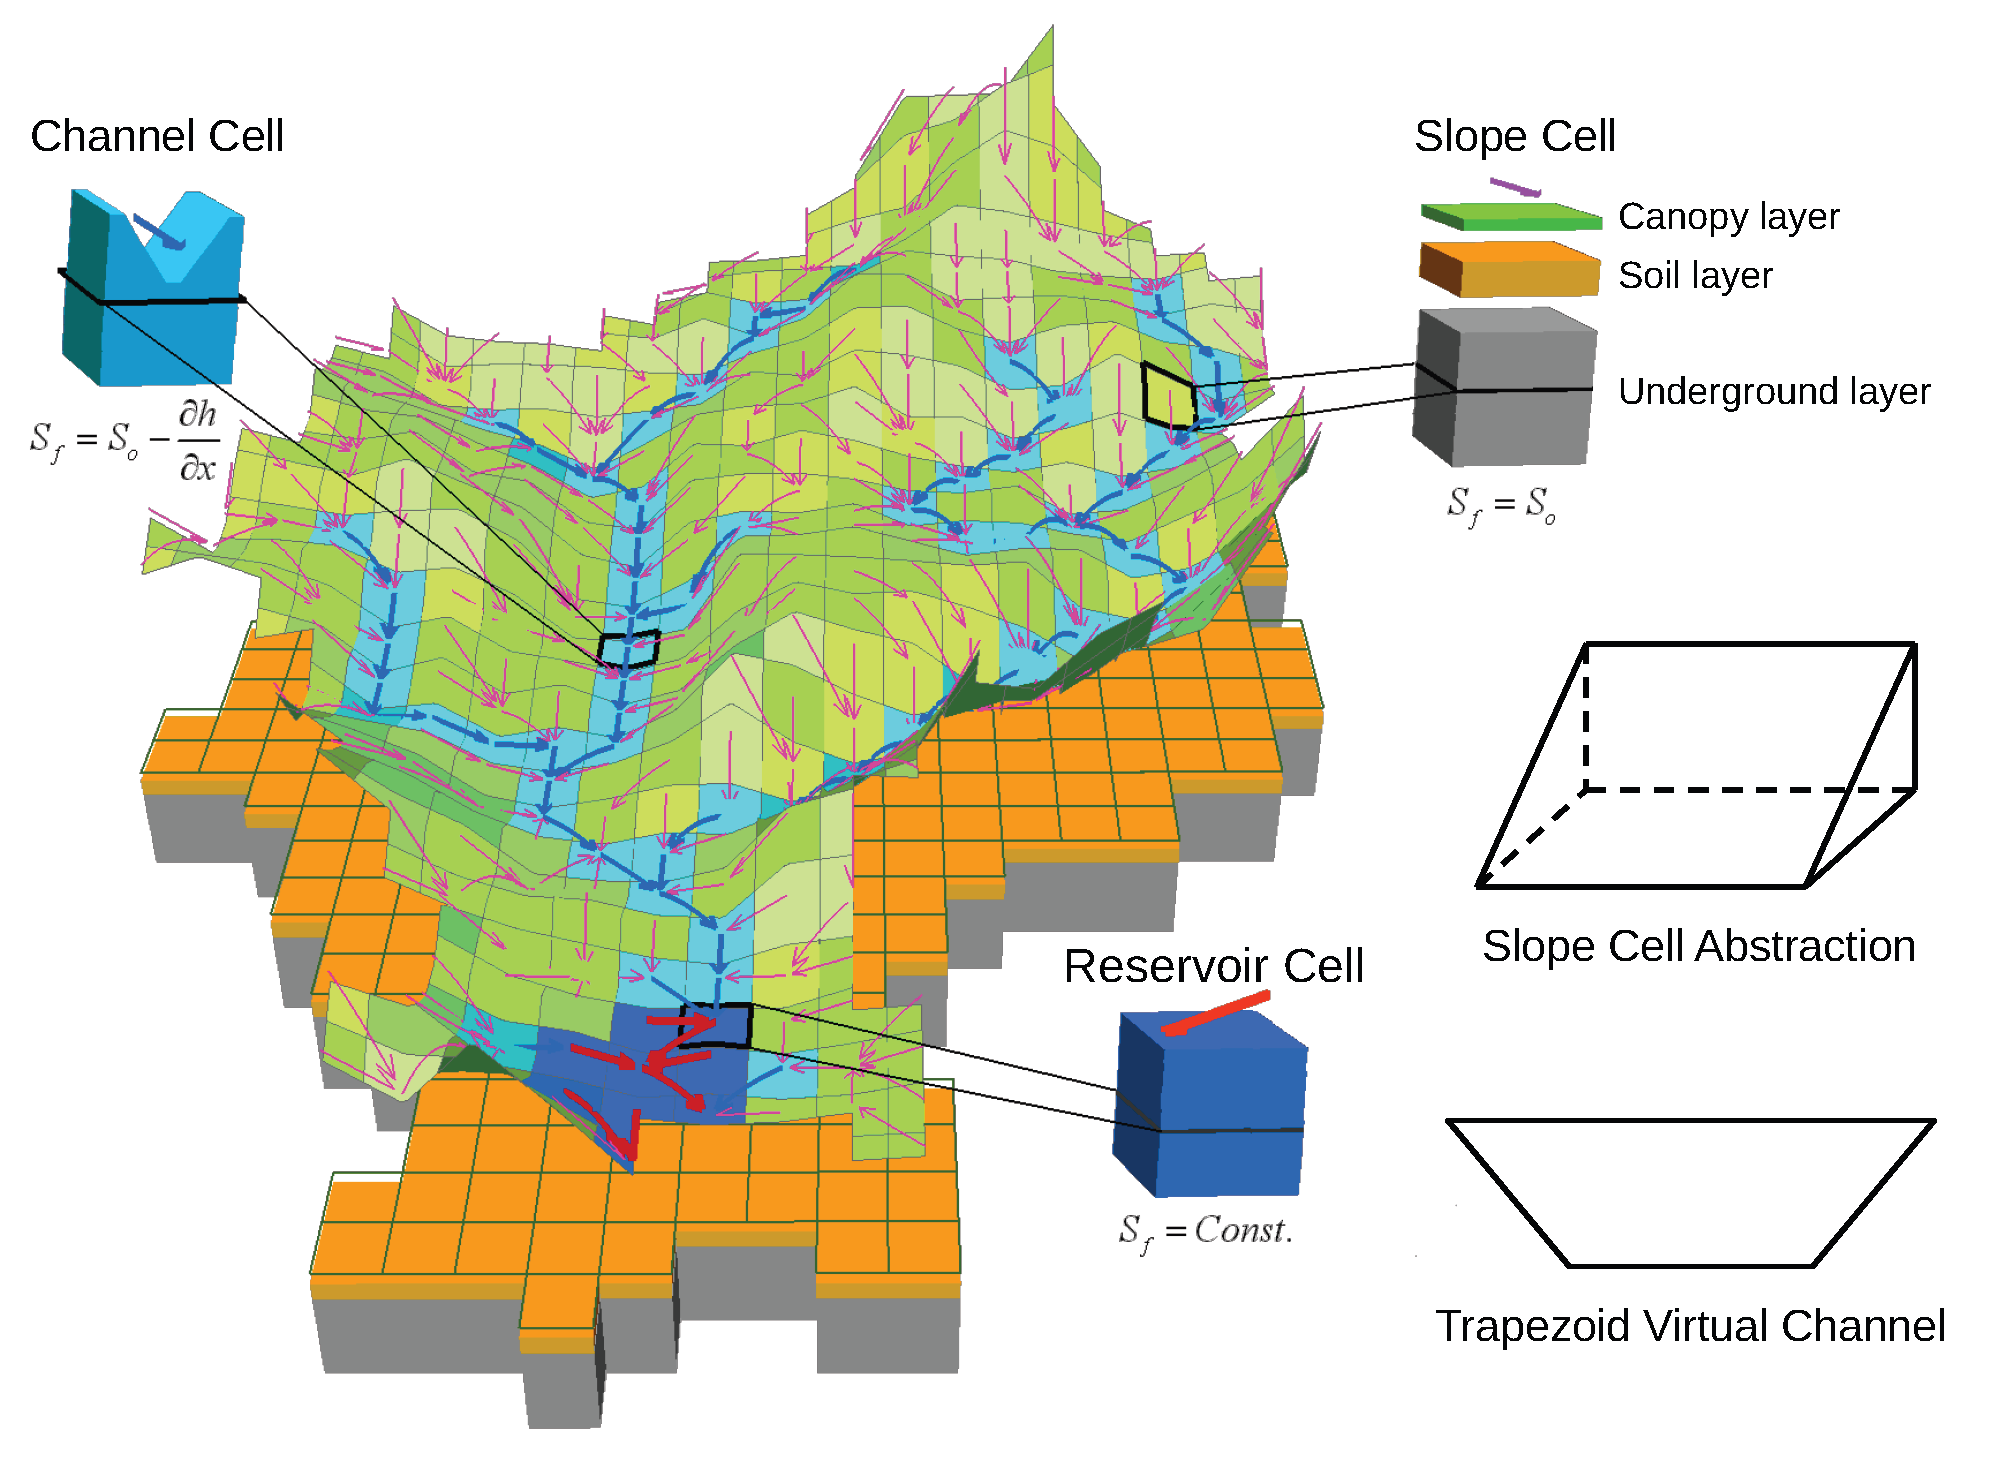
As a PBDHM, the Liuxihe model’s distributed structure is derived from DEM; the grid unit of the DEM is the minimum calculation unit of the model, which is also called cells in the GIS context. Each cell has its attributes, i.e., the model parameters. The Liuxihe model has a few parameters for its simplicity, which fall into four categories, DEM-derived parameters (cell class, slope, flow direction), soil parameters (thickness, saturation hydraulic conductivity, saturated soil water content, field water capacity, wilting point, porosity coefficient, infiltration intensity), land-use parameters (evaporation coefficient, roughness coefficient), and channel parameters (bottom width, bottom slope, side slope, channel roughness). By dividing the catchment into slope cell, channel cell, and reservoir cell horizontally and canopy layer, soil layer, and underground layer vertically, the Liuxihe model couples three subroutines on evaporation, flow generation, and flow convergence to describe the flood process response to a rain event. Figure 3 illustrates the structure of the Liuxihe model.
Though the parameters of PBDHMs derived from remote-sensing data are near to real value, revising the parameters is still needed in model building [30,31], due to the uncertainty in geography data. Many PBDHMs are equipped with parameter optimization/calibration methods [31,32,33], which need observed flow data to tune model parameters responding to rainfall input as close to reality as possible. As with many PBDHMs, the Liuxihe model is equipped with its parameter optimization method [31], which is based on the particle swarm optimization (PSO) algorithm [34]. The Liuxihe Model adopts a scaling law to optimize its parameters. As mentioned earlier, the model’s initial parameters are derived from remote-sensing data, which carry inherent uncertainties. To account for potential deviations, the parameters can be scaled within a range of 0.5 to 1.5 times their initial values and constrained by physical significance. Different particles in the swarm represent the scaling coefficients of the model parameters and move within the solution space. These particles evaluate the quality of their positions using an objective function (also called fit in the PSO context, Equation (1) is used in this study) and adjust their direction and speed accordingly, ultimately converging towards an optimal state. The final optimized model parameters are obtained by multiplying the initial parameters by the scaling coefficients, ensuring that the parameters remain physically meaningful.
F i t = i N ( Q o , i 2 Q s , i 2 ) 2

2.4. Rainfall Spatial Interpolation Methods

There are many spatial interpolation methods to generate a distributed rainfall input from gauge observation point data, but most of them are focused on a day scale or month scale [35,36], or are too complicated for application on an hourly scale. Take Ordinary Kriging, for example, data with weak spatial heterogeneity may face difficulty fitting the semivariogram automatically, resulting in unreliable spatial predictions [37]; this phenomenon often occurs when there are few gauges and minor rainfall, leading to inconsistency in the interpolated rainfall surfaces. In flood forecasting, operators often lack sufficient knowledge to handle these conditions. For these reasons, simple and automatic methods are still commonly used in practice. Considering the ease of use and applicability, this study selects THI, IDW, and GWR for research. They are both representative and widely used in practice. The theoretical backgrounds are briefly introduced below. More detailed information can be found in [38,39,40].
The theory of THI is simple, as in Equation (2), rainfall that occurs in one cell c is generalized the same as its nearest gauges g’s measurement P ( g ) .
P ( c ) = P ( g n e a r e s t )
IDW assumes that gauges closer to the location of interest have more influence on the estimated value. The method calculates a weighted average of gauge observations, with weights inversely proportional to their distance from the target location, as shown in Equation (3).
P ( c ) = i N P ( g i ) D 2 ( g i , c ) i N D 2 ( g i , c )
where D is a function that describes distances between Cell c and gauge g; the Euclidean distance is commonly used.
GWR accounts for the spatial heterogeneity inherent in rainfall patterns. Unlike traditional regression, GWR accounts for geographic location, allowing coefficients to vary across space. It fits a regression model at each location using nearby observations, weighted by their distance, thus capturing local variations and providing more accurate spatial predictions. For consistency with THI and IDW, who only consider distance in rainfall interpolation, the form of GWR without considering other variables is used in this study. Rainfall in one cell c can be predicted as in Equation (4).
P ( c ) = i δ w g i β i i δ w g i
where β i is the solved regression coefficients, δ is bandwidth calculated by the AIC method [40], and w i is the spatial weight which could be calculated by Equation (5).
w g i = ( 1 ( D ( c , g i ) δ ) 2 ) 2 , D ( c , g i ) < δ 0 , D ( c , g i ) δ

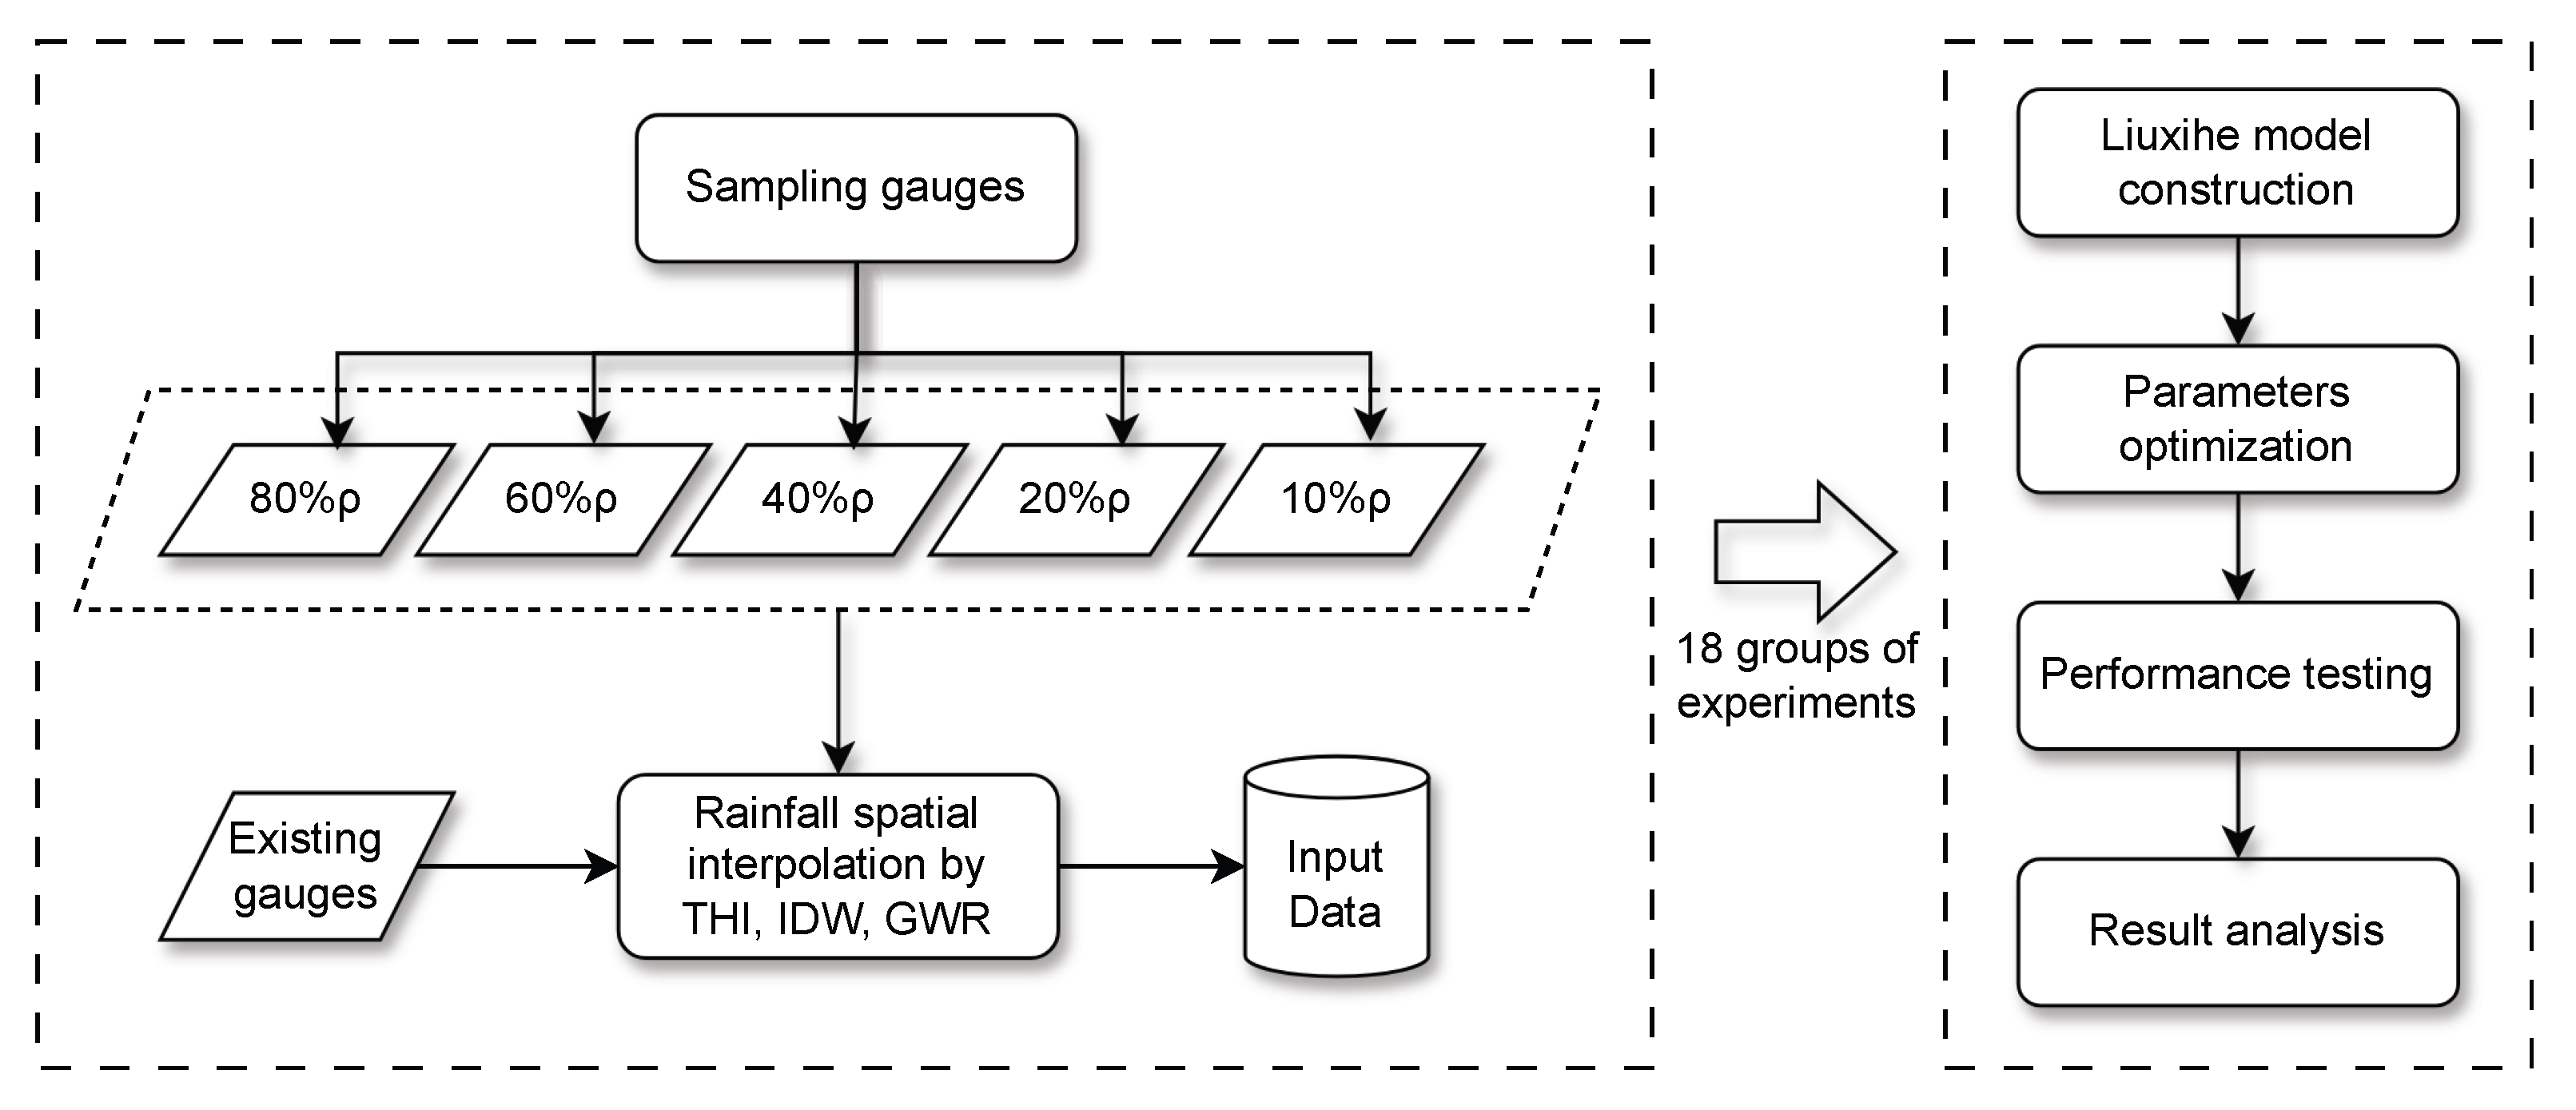
2.5. Experimental Settings

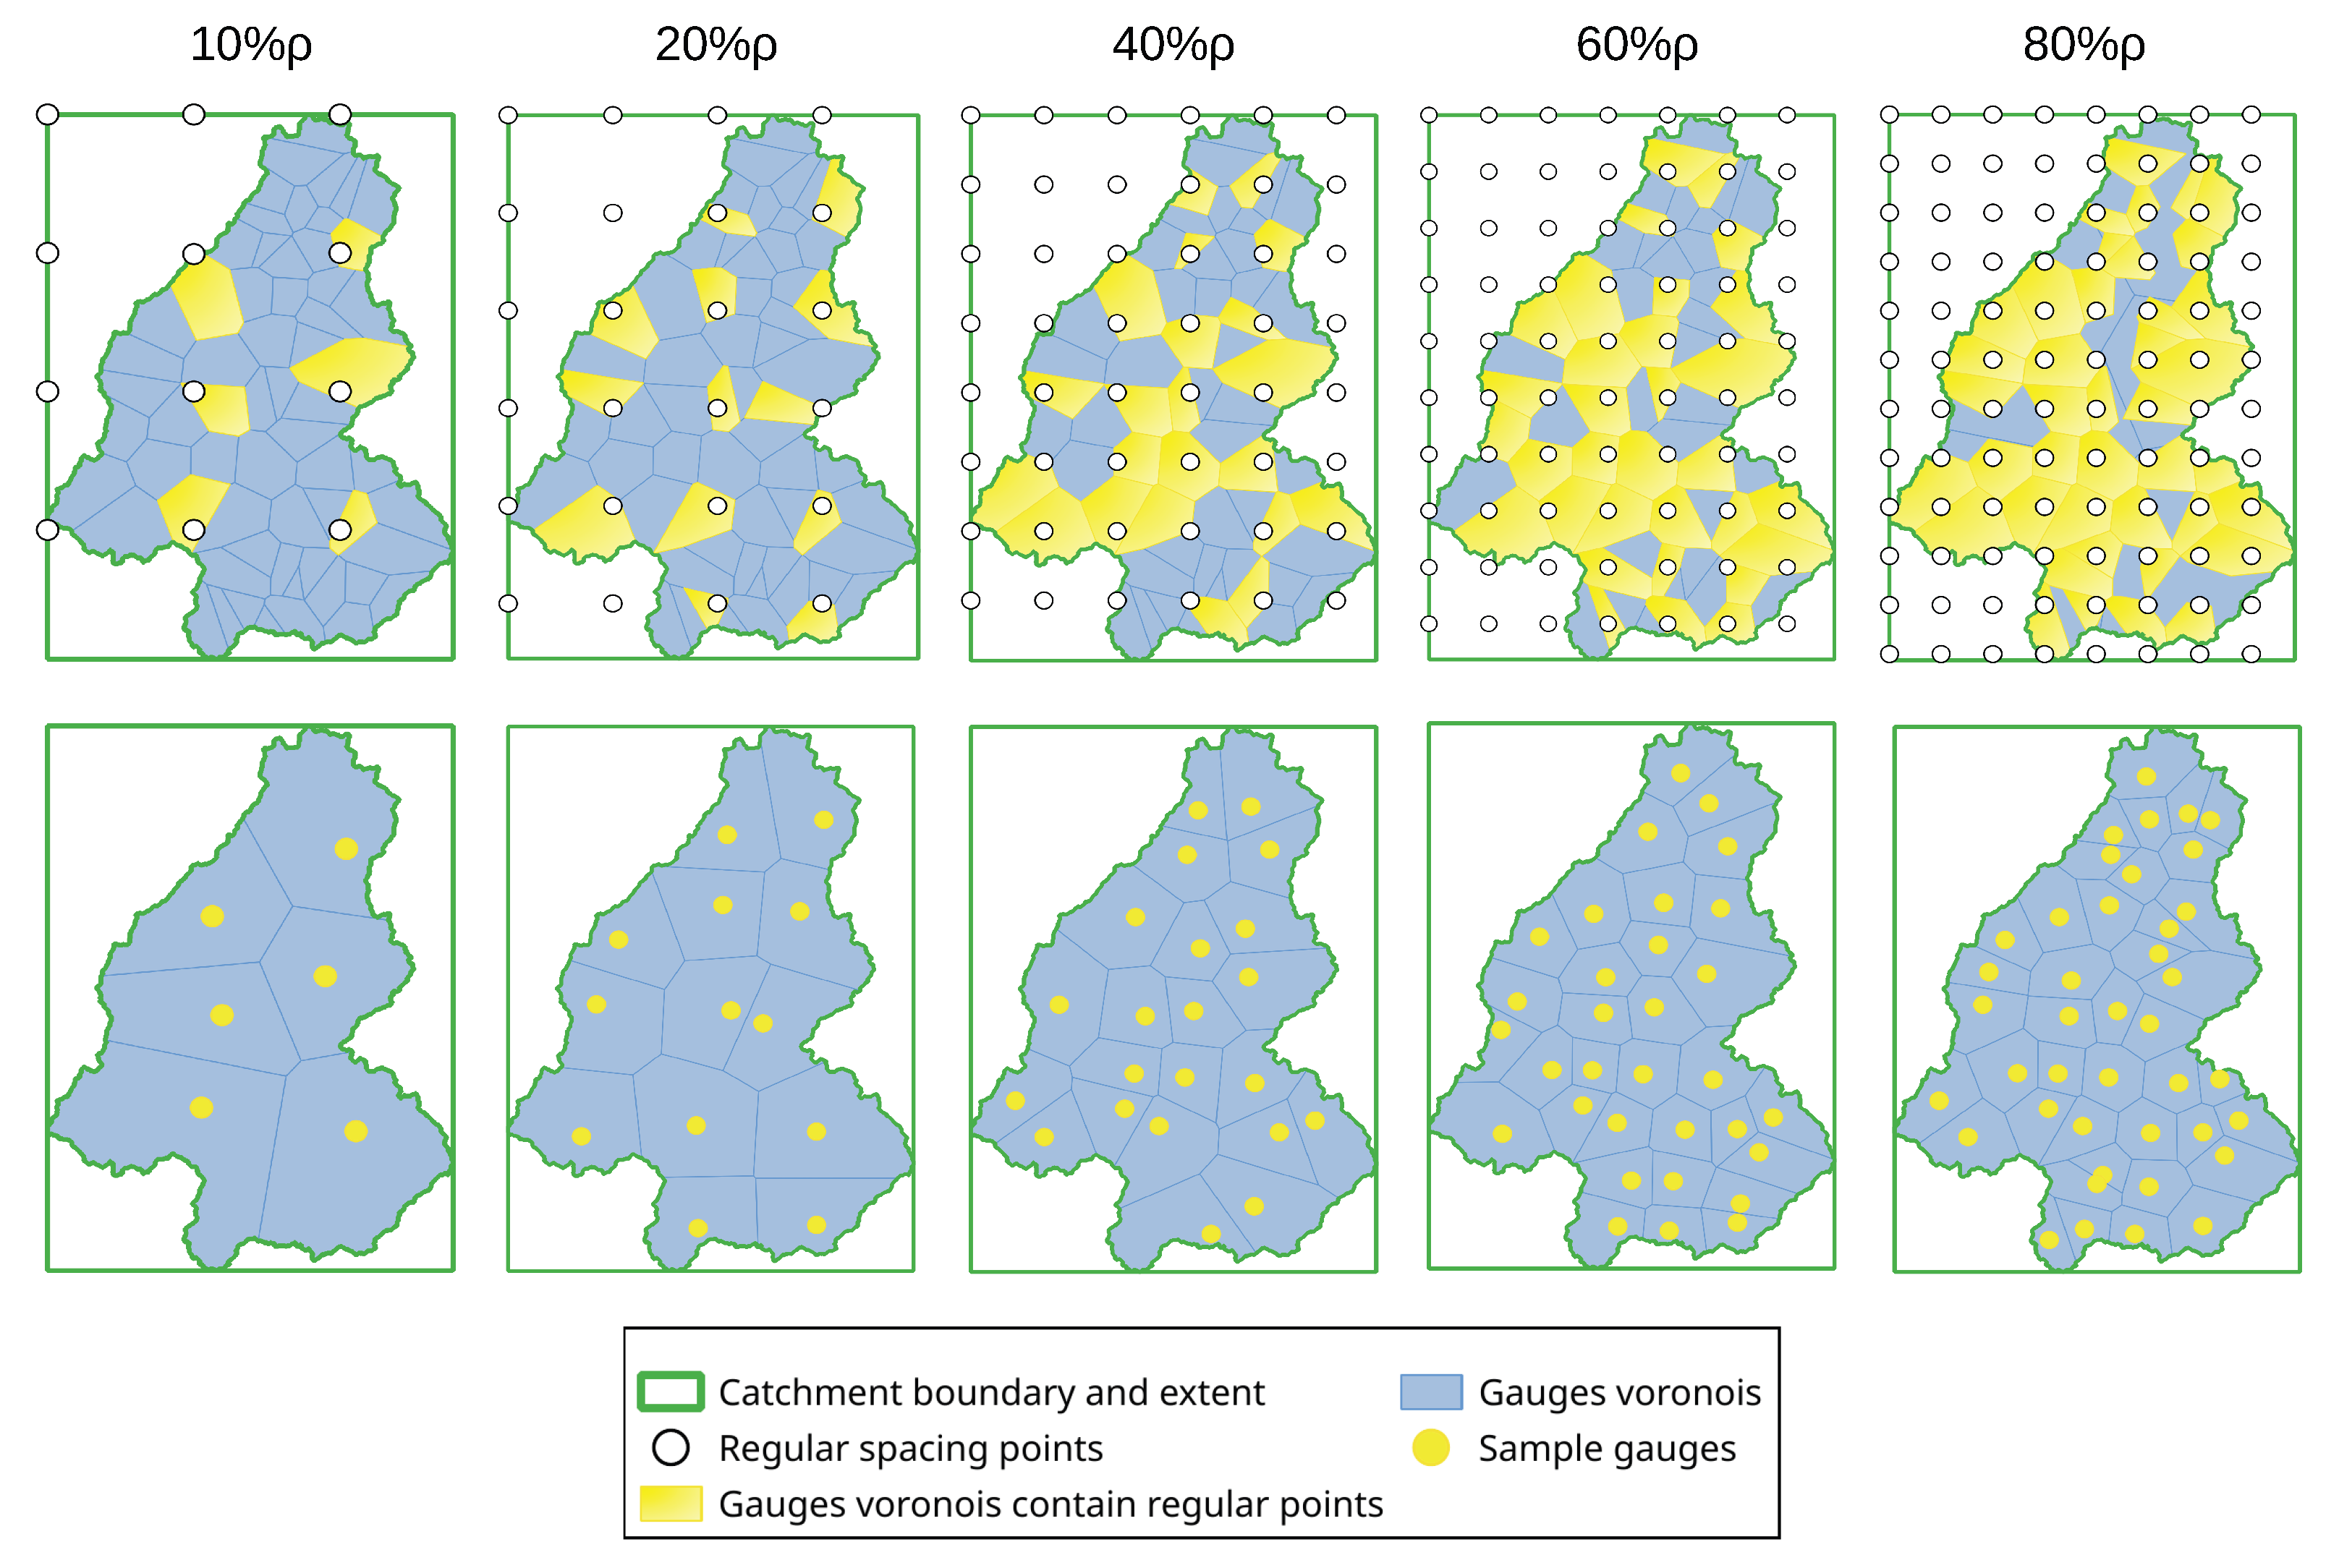
As mentioned earlier in the introduction, five rain gauge density conditions are derived from existing gauge distribution by an algorithm based on the distance of gauges. Algorithm 1 illustrated these procedures and Figure 4 further depicted the process visually.
Algorithm 1 Sampling Scheme
  • Calculate average gauge distance by D = A N , where A = catchment area and N =  number of existing gauges.
  • Generate the Voronoi polygons P of existing rain gauges (blue polygons in Figure 4).
  • Generate regular spacing point collections S i (white points in Figure 4) in the catchment extent, with the spacing D i = D 0.8 , D 0.6 , D 0.4 , D 0.2 , D 0.1 .
  • The gauges whose Voronoi polygons are in S i P (yellow polygons in Figure 4) are selected as the samples (yellow points in Figure 4).
When installing rain gauges within a catchment, it is common to maximize their effectiveness by distributing rain gauges as evenly as possible when conditions permit. Without considering special circumstances, the density of rain gauges in a catchment can be estimated by dividing the catchment area by the number of gauges. Some GIS tricks can be employed to generate different rain gauge density scenarios. In Algorithm 1, it is assumed that rain gauge density can be measured by the average distance between gauges. By scaling the estimated average distance of existing gauges with factors of 0.8, 0.6, 0.4, 0.2, and 0.1, regular spacing points that mimic the distribution of sampled gauges in these scenarios can be generated. If an existing rain gauge whose Voronoi polygon contains a regular spacing point, this gauge will be chosen to use. This approach simplifies real-world scenarios based on the Voronoi polygon theory. Ultimately, five generated rain gauge density scenarios and 1 existing gauge scenario are present, corresponding to the number of gauges being used are 62, 41, 32, 22, 13, and 6, and the estimated control area of each gauge is 38 km2, 57 km2, 74 km2, 107 km2, 182 km2, and 394 km2, respectively. Notice that from 100% density to 80% density, up to 20 gauges are excluded from the sample. This occurs because existing rain gauges are not perfectly uniformly distributed, some closely spaced gauges are filtered out by the algorithm.
Gauges are selected from a scale of the average distance, which could be regarded as a scale of gauge density. For simplicity, use an abbreviated notation for experiment naming, e.g., “100P” represents the experiment on existing gauge density ( 100 % × ρ ), “THI80P” represents the experiment on gauges sampled by intersection with D 0.8 spacing points ( 80 % × ρ ) and use THI to interpolate distributed rainfall surfaces. Combining six gauge density conditions with three spatial interpolation methods, there are 18 scenarios in total. The model parameters are optimized only for scenarios THI100P, IDW100P and GWR100P in the same PSO settings, as the characteristics of their interpolated surface are different. The performance of the experiments THI100P, IDW100P, and GWR100P will be evaluated first, serving as the reference baseline for observing how the model’s performance changes under varying rain gauge density conditions.
The evaluators chosen to compare the model performance are Kling–Gupta Efficiency (KGE) [41], Nash–Sutcliffe Efficiency (NSE), peak relative error (PRE), and absolute peak time error (APTE). KGE and NSE evaluate the overall agreement between the predicted and observed hydrographs. While NSE focuses on how well the predictions capture the observed variability, KGE offers a more balanced evaluation by incorporating correlation, bias, and variability into the assessment and is less affected by extreme values [42]. PRE and APTE assess the model’s flood forecasting performance from the perspective of peak flow, while the former focuses on the magnitude of the peak flow, and the latter on the timing of the peak. These four evaluators together provide a comprehensive comparison of the model’s performance. Their definitions are as follows.
K G E = 1 ( r 1 ) 2 + ( α 1 ) 2 + ( β 1 ) 2
where r is the Pearson correlation coefficient, α is the ratio of the mean of simulated flows and observed flows defined as Q s ¯ Q o ¯ , and β is the ratio of the standard deviation of simulated flow and observed flows defined as δ s δ o .
N S E = 1 t = 1 n ( Q o , t Q s , t ) 2 t = 1 n ( Q o , t Q o ¯ ) 2
where Q o , t is the observed flow at time t, Q s , t is the simulated flow at time t, Q o ¯ is the mean of observed flows over the simulation period, n is the number of observations.
P R E = | Q o , m a x Q s , m a x | Q o , m a x
where Q o , m a x is the observed flow peak, and Q s , m a x is the simulated flow peak.
A P T E = | t Q o , m a x t Q s , m a x |
where t Q o , m a x and t Q s , m a x are flood peak occurrence time of the observed flow and simulated flow, respectively.

3. Results

3.1. Results of Parameter Optimization

As mentioned above, models using THI100P, IDW100P, and GWR100p as inputs were first subjected to parameter optimization. Figure 5 presents the results of this optimization. Subplots (a), (b), and (c) are hydrographs that represent THI100P, IDW100P, and GWR100P, respectively, showing predicted discharge (Q) for the training event 2016-11-19 using initial parameters (yellow line) and optimized parameters (red line). The predicted hydrographs from the three models align closely with the observed hydrographs. Subplot (d) depicts the change in object function error across iterations. It demonstrates that, as iterations increase, prediction errors for the training event gradually decrease and stabilize after 120 iterations, reaching a range of 3 × 10⁵ to 4 × 10⁵ for the three interpolation settings. This corresponds to the average absolute difference in the squared values of observed and predicted flows per time step between 34.367 and 39.683 (calculated from Equation (1)), which is an acceptable value. Figure 5 illustrates the effectiveness of parameter optimization, indicating that the optimized parameters can be used to further assess model performance.

3.2. Testing Performance of Models Using All Available Gauges

The models THI100P, IDW100P, and GWR100P use rainfall surfaces interpolated from all available rain gauges as inputs, serving as benchmarks for assessing model performance under varying rain gauge density conditions. Figure 6 shows hydrographs for these three models’ predictions on the 15 test events after parameter optimization, with the predicted hydrographs for THI100P, IDW100P, and GWR100P represented in red, orange, and yellow, respectively, and the observed discharge shown in blue. As seen in Figure 6, the predicted hydrographs from all three models are close to each other. Table 2 summarizes the statistical metrics quantifying model performance, where only the best values among the three models are listed for brevity, along with the corresponding model for each value.
From Figure 6, it is evident that the predicted hydrographs for all three models closely match the key features of the observed hydrographs across the 15 test events. Statistically, 14 out of 15 events achieve KGE values above 0.85, 13 out of 15 events have NSE values exceeding 0.82; the peak relative error (PRE) is below 10% for 13 out of 15 events, and the absolute peak time error (APTE) is within 5 h for 13 out of 15 events. These results indicate that models using the existing rain gauges in this catchment yield satisfactory outcomes for flood forecasting and can be used as benchmarks for further comparison.

3.3. Testing Performance Under Rain Gauges Density Changes

The optimized parameters from the baseline scenarios THI100P, IDW100P, and GWR100P were applied to other rain gauge density scenarios, resulting in Figure 7 and Figure 8.
In Figure 7, subplots (a) to (d) display the relationship curves of four statistical metrics—KGE, NSE, PRE, and APTE—showing the average values across 15 test events as rain gauge density varies. The rainfall interpolation methods THI, IDW, and GWR are represented in red, blue, and gray, respectively. The shaded area surrounding each curve indicates the range, with the upper and lower boundaries representing the maximum and minimum metrics values in the 15 test events.
Figure 7 reflects the general findings of the experiment. Figure 8, however, provides box plots of the experimental results, offering a more detailed view of the distribution, variability, and outliers of model performance metrics across the 15 test events for each scenario. The three spatial interpolation methods—THI, IDW, and GWR—are represented in red, blue, and gray, corresponding to columns (a), (b), and (c) in the figure.
As shown in Figure 7, model performance gradually declines as rain gauge density decreases, a trend consistently observed across experiments using different interpolation methods. This is evident in the close alignment of the curves representing THI, IDW, and GWR. Specifically, as rain gauge density decreases from 100P (approximately 38 km2 per rain gauge) to 10P (approximately 394 km2 per rain gauge), the average values of the metrics across the 15 test events show a reduction: the KGE decreases from 0.879 to 0.816, and the NSE drops from 0.848 to 0.800 (the listed values represent the average results across the three interpolation methods).
The overall performance of the models across the 15 test events declines gradually, with global metrics such as KGE and NSE showing a change of approximately 5%. However, as seen in Figure 7 and Figure 8, the boundary ranges of the metrics expand, and the boxplots become longer as rain gauge density decreases. The boundaries of the shaded area represent the maximum and minimum values of the metrics across the test events, while the box represents the interquartile range (IQR), which contains the middle 50% of the data distribution. This suggests that the model’s performance in certain flood events has deteriorated, leading to increased dispersion. The model’s generalization ability decreases as rain gauge density declines.
For the metrics PRE and APTE, taking the THI scenario as an example, when rain gauge density decreases from 100P to 10P, the average range of PRE fluctuates between 8% and 14.7%, and the range of APTE fluctuates between 3.6 and 4.4 h. This indicates that the sensitivity of PRE and APTE to changes in rain gauge density is relatively low, suggesting that the model’s ability to predict peak flow and peak time is less affected by changes in rain gauge density.
A slight but noticeable inflection is observed from 40P (one gauge per 107 km2) to 20P (one gauge per 182 km2), where the model’s average performance experiences a relatively sharp (though not significant) decline and the range of the shadow area widens. This suggests that when the rain gauge density decreases to 20P or lower, the rain gauge network may fail to capture sufficient spatial rainfall information, leading to a decline in model performance. This finding is reflected across all four metrics. Therefore, for the Ningdu catchment, ensuring approximately one gauge per 107 km2 is operational may be the minimum requirement to ensure stable flood forecasting accuracy for the model.

4. Discussion

4.1. Impact of Rain Gauge Density on the Interpolated Rainfall Surfaces

The results indicate that as rain gauge density decreases, model performance declines and the dispersion of metrics across the 15 test events increases. This is intuitive, as fewer rain gauges capture less rainfall information, leading to poorer model performance. The primary cause of the decline in model performance lies in the spatial heterogeneity of the rainfall input from different gauge density conditions. This section discusses the impact of changes in rain gauge density on the interpolated rainfall surfaces, which may offer insight into some of the patterns observed in the results.
Figure 9 visualizes the interpolated rainfall surfaces from the event 2016-11-19, which was used to optimize the model parameters.
In Figure 9, the rainfall interpolation surface generated by the THI method appears as polygonal patches, which become increasingly larger as rain gauge density decreases, resulting in a loss of distributed characteristics essential for PBDHMs. The IDW method produces a continuous rainfall surface; however, it can display “holes” that may not accurately reflect actual rainfall distribution. The GWR method generates a smoother rainfall surface, integrating local peaks into adjacent regions, and providing a more blended representation. Visually, each interpolation method produces distinctive rainfall surfaces. Figure 10 and Table 3 further analyze the characteristics of the interpolated rainfall surface for the event 2016-11-19, from a statistical perspective.
Figure 10 shows bar plots of the average rainfall for event 2016-11-19 in experiments 100 Ps, calculated by summing the rainfall surface grids and dividing by the number of grids at each time step. As seen in Figure 10, the average rainfall generated by the three interpolation methods (THI, IDW, and GWR) is very similar at each time step. Table 3 further supports this observation, indicating that the total rainfall input to the model remains nearly equivalent across all three methods under the same rain gauge density conditions, with the largest difference being 6 mm in scenario 40P. This statistical similarity in total rainfall aligns with findings from Ly et al. [36], which compared THI, IDW, and four Kriging methods in a Belgium case study. This consistency in total rainfall input may help explain why the experimental results (Figure 7) remain largely consistent across interpolation scenarios and why metrics such as PRE and APTE are relatively insensitive to changes in rain gauge density, as the total rainfall differences are minimal across varying scenarios.

4.2. Parameter Optimization for Each Scenario

In the experimental settings section, the rainfall generated using all available rain gauges was used to optimize the model parameters. This setup investigates how changes in rain gauge density affect model performance after parameter optimization. From the above discussion, it was noted that each interpolation method (THI, IDW, and GWR) produces rainfall surfaces with distinct characteristics under different gauge density scenarios, leading to input uncertainty. Parameter optimization, to some extent, compensates for this variability. This section discusses the impact of gauge density changes on models that parameter optimization across the 18 scenarios (THI, IDW, and GWR, 100P to 10P).
Figure 11 presents the results of parameter optimization for each scenario under the same experimental conditions as before. Compared to the results in Figure 5, the models optimized individually for each rain gauge scenario visually perform slightly worse on training data than models optimized with all rain gauges (100 Ps), with object function values concentrating between 4 × 10⁵ and 6 × 10⁵ after 120 iterations.
Figure 12 shows line plots of the average metric values across the 15 test events, plotted against decreasing rain gauge density. The spatial interpolation methods THI, IDW, and GWR are represented by red, blue, and gray, respectively. Unlike the stable decline in model performance with decreasing gauge density seen in Figure 7, models optimized for each scenario show performance within a defined range or with fluctuations. The degree of fluctuation varies by interpolation method, with THI and GWR showing greater variability, while IDW remains comparatively steady and consistent. IDW, compared to THI and GWR (which consider only spatial locations as variables in this study), may be better suited to handle changes in rain gauge density. This also suggests that the sensitivity of model performance to changes in rain gauge density is influenced by the choice of spatial interpolation method to some extent.
Identifying interpolation methods that exhibit low sensitivity to gauge density variations is crucial for reliable flood forecasting with PBDHMs. Further investigation into advanced methods is warranted, such as coupling rain gauge observation with satellite data [43,44], integrating additional variables like elevation [37] and time [45]. Developing more automated and robust rainfall interpolation tools for use by catchment managers also remains essential. These are important directions for future research.

5. Conclusions

Flood forecasting performance in physically based distributed hydrological models (PBDHMs) is significantly influenced by rainfall input, which is related to the density of rain gauges and the chosen spatial interpolation method. A quantitative understanding of the impact of rain gauge density on PBDHMs flood forecasting performance offers insights into the expected upper and lower limits of model performance. This information can serve as a reference for rain gauge installation, flood forecasting system setup, and the selection of spatial interpolation methods in practice.
The main findings and conclusions of this study are summarized as follows:
  • Using rainfall surfaces generated by interpolation from a high-density rain gauge network to calibrate model parameters results in a model with stable performance. As rain gauge density decreases, model performance declines gradually, with minimal variability; a trend consistently observed across commonly used spatial interpolation methods.
  • With decreasing rain gauge density, the spatial heterogeneity of interpolated rainfall surfaces diminishes, reducing the model’s generalization capability. However, the amount of surface average rainfall remains largely unchanged, and the model’s ability to predict peak flow and peak timing is less sensitive to changes in rain gauge density.
  • Parameter optimization can partially compensate for model error, with varying effectiveness depending on the characteristics of the rainfall interpolation method used. Identifying rainfall interpolation methods with low sensitivity to changes in rain gauge density may enhance the flood forecasting ability of PBDHMs.

Author Contributions

Conceptualization, Y.C. and Z.H.; methodology, Y.C. and Z.H.; writing—original draft preparation, Z.H.; writing—review and editing, Z.H. and Y.C.; visualization, Z.H.; funding acquisition, Y.C. All authors have read and agreed to the published version of the manuscript.

Funding

This research was funded by Natural Science Foundation of China (Grant No. U2243227).

Data Availability Statement

Hydrological data are unavailable due to privacy, publicly available remote-sensing data can be downloaded online.

Conflicts of Interest

The authors declare no conflicts of interest. The funders had no role in the design of the study; in the collection, analyses, or interpretation of data; in the writing of the manuscript; or in the decision to publish the results.

Abbreviations

The following abbreviations are used in this manuscript:
PBDHMPhysically-based Distributed Hydrological Model
DEMDigital Elevation Model
GISGeography Information System
THIThiessen Polygons
IDWInverse Distance Weighting
GWRGeographically Weighted Regression
KGEKling–Gupta Efficiency
NSENash–Sutcliffe Efficiency
PREPeak Relative Error
APTEAbsolute Peak Time Error

Appendix A. Initial Parameters for Landuse-Related Parameters and Soil-Related Parameters

Table A1. Model initial values for landuse-related parameters. The evaporation coefficient and the roughness coefficient are dimensionless parameters, determined based on empirical values.
LanduseEvaporation CoefficientRoughness Coefficient
Cropland0.70.5
Forest0.70.6
Shrub0.70.4
Grassland0.70.1
Water0.70.2
Barren0.70.15
Impervious0.70.1
Table A2. Model initial values for soil-related parameters. Soil-related parameters are calculated based on soil profile components [24], where Zs refers to soil thickness, Ks to saturation hydraulic conductivity, Sat to saturated soil water content, Fc to field water capacity, Wl to wilting point, and b to the porosity coefficient.
ISOSUIDZs (mm)Sat (%)Fc (%)Wl (%)Ks (mm/h)b
CN 119100044.327.41612.092.5
CN 12860043.924.113.819.142.5
CN 141100045.13017.68.642.5
CN 16060051.542.229.61.952.5
CN 163100045.531.919.26.342.5
CN 236100044.125.114.316.852.5
CN 31270045.531.418.77.042.5
CN 319100045.414.46.374.492.5
CN 3207005037.722.14.892.5
CN 37080047.131.716.49.742.5
CN 45581043.322.913.820.32.5
CN 53481045.125.212.620.332.5
CN 766100045.326.813.716.552.5
CN 772100045.433.721.43.992.5
CN 1136110044.329.117.68.752.5

References

  1. Westra, S.; Fowler, H.J.; Evans, J.P.; Alexander, L.V.; Berg, P.; Johnson, F.; Kendon, E.J.; Lenderink, G.; Roberts, N.M. Future changes to the intensity and frequency of short-duration extreme rainfall. Rev. Geophys. 2014, 52, 522–555. [Google Scholar] [CrossRef]
  2. Clark, M.P.; Bierkens, M.F.P.; Samaniego, L.; Woods, R.A.; Uijlenhoet, R.; Bennett, K.E.; Pauwels, V.R.N.; Cai, X.; Wood, A.W.; Peters-Lidard, C.D. The evolution of process-based hydrologic models: Historical challenges and the collective quest for physical realism. Hydrol. Earth Syst. Sci. 2017, 21, 3427–3440. [Google Scholar] [CrossRef] [PubMed]
  3. Zhang, Y.; Ryu, D.; Zheng, D. Using Remote Sensing Techniques to Improve Hydrological Predictions in a Rapidly Changing World. Remote Sens. 2021, 13, 3865. [Google Scholar] [CrossRef]
  4. Munawar, H.S.; Hammad, A.W.A.; Waller, S.T. Remote Sensing Methods for Flood Prediction: A Review. Sensors 2022, 22, 960. [Google Scholar] [CrossRef] [PubMed]
  5. Lakshmi, S.E.; Yarrakula, K. Review and critical analysis on digital elevation models. Geofizika 2018, 35, 129–157. [Google Scholar] [CrossRef]
  6. Yang, J.; Huang, X. The 30 m annual land cover dataset and its dynamics in China from 1990 to 2019. Earth Syst. Sci. Data 2021, 13, 3907–3925. [Google Scholar] [CrossRef]
  7. Karra, K.; Kontgis, C.; Statman-Weil, Z.; Mazzariello, J.C.; Mathis, M.; Brumby, S.P. Global land use/land cover with Sentinel 2 and deep learning. In Proceedings of the 2021 IEEE International Geoscience and Remote Sensing Symposium IGARSS, Brussels, Belgium, 11–16 July 2021; pp. 4704–4707. [Google Scholar] [CrossRef]
  8. Dijkshoorn, K.; van Engelen, V.; Huting, J. Soil and landform properties for LADA partner countries. ISRIC Rep. 2008, 6, 1–28. [Google Scholar]
  9. Entekhabi, D.; Njoku, E.G.; O’neill, P.E.; Kellogg, K.H.; Crow, W.T.; Edelstein, W.N.; Entin, J.K.; Goodman, S.D.; Jackson, T.J.; Johnson, J.; et al. The soil moisture active passive (SMAP) mission. Proc. IEEE 2010, 98, 704–716. [Google Scholar] [CrossRef]
  10. Ma, L.; He, C.; Bian, H.; Sheng, L. MIKE SHE modeling of ecohydrological processes: Merits, applications, and challenges. Ecol. Eng. 2016, 96, 137–149. [Google Scholar] [CrossRef]
  11. Liang, X.; Lettenmaier, D.P.; Wood, E.F.; Burges, S.J. A simple hydrologically based model of land surface water and energy fluxes for general circulation models. J. Geophys. Res. Atmos. 1994, 99, 14415–14428. [Google Scholar] [CrossRef]
  12. Sahu, M.K.; Shwetha, H.R.; Dwarakish, G.S. State-of-the-art hydrological models and application of the HEC-HMS model: A review. Model. Earth Syst. Environ. 2023, 9, 3029–3051. [Google Scholar] [CrossRef]
  13. Chen, Y.; Ren, Q.; Huang, F.; Xu, H.; Cluckie, I. Liuxihe Model and Its Modeling to River Basin Flood. J. Hydrol. Eng. 2011, 16, 33–50. [Google Scholar] [CrossRef]
  14. Zhou, F.; Chen, Y.; Wang, L.; Wu, S.; Shao, G. Flood forecasting scheme of Nanshui reservoir based on Liuxihe model. Trop. Cyclone Res. Rev. 2021, 10, 106–115. [Google Scholar] [CrossRef]
  15. Zhu, Y.; Chen, Y.; Zhao, Y.; Zhou, F.; Xu, S. Application and Research of Liuxihe Model in the Simulation of Inflow Flood at Zaoshi Reservoir. Sustainability 2023, 15, 9857. [Google Scholar] [CrossRef]
  16. Chwala, C.; Kunstmann, H. Commercial microwave link networks for rainfall observation: Assessment of the current status and future challenges. Wiley Interdiscip. Rev. Water 2019, 6, e1337. [Google Scholar] [CrossRef]
  17. Sucozhañay, A.; Célleri, R. Impact of Rain Gauges Distribution on the Runoff Simulation of a Small Mountain Catchment in Southern Ecuador. Water 2018, 10, 1169. [Google Scholar] [CrossRef]
  18. Hohmann, C.; Kirchengast, G.; O, S.; Rieger, W.; Foelsche, U. Small Catchment Runoff Sensitivity to Station Density and Spatial Interpolation: Hydrological Modeling of Heavy Rainfall Using a Dense Rain Gauge Network. Water 2021, 13, 1381. [Google Scholar] [CrossRef]
  19. Yin, Z.; Liao, W.; Lei, X.; Wang, H.; Wang, R. Comparing the Hydrological Responses of Conceptual and Process-Based Models with Varying Rain Gauge Density and Distribution. Sustainability 2018, 10, 3209. [Google Scholar] [CrossRef]
  20. Zeng, Q.; Chen, H.; Xu, C.Y.; Jie, M.X.; Chen, J.; Guo, S.L.; Liu, J. The effect of rain gauge density and distribution on runoff simulation using a lumped hydrological modelling approach. J. Hydrol. 2018, 563, 106–122. [Google Scholar] [CrossRef]
  21. Mishra, A.K. Effect of rain gauge density over the accuracy of rainfall: A case study over Bangalore, India. Springerplus 2013, 2, 311. [Google Scholar] [CrossRef] [PubMed]
  22. Prakash, S.; Seshadri, A.; Srinivasan, J.; Pai, D.S. A New Parameter to Assess Impact of Rain Gauge Density on Uncertainty in the Estimate of Monthly Rainfall over India. J. Hydrometeorol. 2019, 20, 821–832. [Google Scholar] [CrossRef]
  23. Reuter, H.I.; Nelson, A.; Jarvis, A. An evaluation of void-filling interpolation methods for SRTM data. Int. J. Geogr. Inf. Sci. 2007, 21, 983–1008. [Google Scholar] [CrossRef]
  24. Saxton, K.E.; Rawls, W.J. Soil Water Characteristic Estimates by Texture and Organic Matter for Hydrologic Solutions. Soil Sci. Soc. Am. J. 2006, 70, 1569–1578. [Google Scholar] [CrossRef]
  25. Chen, Y.; Li, J.; Wang, H.; Qin, J.; Dong, L. Large-watershed flood forecasting with high-resolution distributed hydrological model. Hydrol. Earth Syst. Sci. 2017, 21, 735–749. [Google Scholar] [CrossRef]
  26. Xu, S.; Chen, Y.; Xing, L.; Li, C. Baipenzhu Reservoir Inflow Flood Forecasting Based on a Distributed Hydrological Model. Water 2021, 13, 272. [Google Scholar] [CrossRef]
  27. Gu, Y.; Chen, Y.; Sun, H.; Liu, J. Remote Sensing-Supported Flood Forecasting of Urbanized Watersheds—A Case Study in Southern China. Remote Sens. 2022, 14, 6129. [Google Scholar] [CrossRef]
  28. Li, J.; Chen, Y.; Zhu, Y.; Liu, J. Study of Flood Simulation in Small and Medium-Sized Basins Based on the Liuxihe Model. Sustainability 2023, 15, 11225. [Google Scholar] [CrossRef]
  29. Zhao, Y.; Chen, Y.; Zhu, Y.; Xu, S. Evaluating the Feasibility of the Liuxihe Model for Forecasting Inflow Flood to the Fengshuba Reservoir. Water 2023, 15, 1048. [Google Scholar] [CrossRef]
  30. Pokhrel, P.; Yilmaz, K.K.; Gupta, H.V. Multiple-criteria calibration of a distributed watershed model using spatial regularization and response signatures. J. Hydrol. 2012, 418, 49–60. [Google Scholar] [CrossRef]
  31. Chen, Y.; Li, J.; Xu, H. Improving flood forecasting capability of physically based distributed hydrological models by parameter optimization. Hydrol. Earth Syst. Sci. 2016, 20, 375–392. [Google Scholar] [CrossRef]
  32. Refsgaard, J.C. Parameterisation, calibration and validation of distributed hydrological models. J. Hydrol. 1997, 198, 69–97. [Google Scholar] [CrossRef]
  33. Vieux, B.E.; Moreda, F.G. Ordered physics-based parameter adjustment of a distributed model. Calibration Watershed Model. 2003, 6, 267–281. [Google Scholar]
  34. Kennedy, J.; Eberhart, R. Particle swarm optimization. In Proceedings of the ICNN’95—International Conference on Neural Networks, Perth, WA, Australia, 27 November–1 December 1995; Volume 4, pp. 1942–1948. [Google Scholar] [CrossRef]
  35. Hu, Q.; Li, Z.; Wang, L.; Huang, Y.; Wang, Y.; Li, L. Rainfall Spatial Estimations: A Review from Spatial Interpolation to Multi-Source Data Merging. Water 2019, 11, 579. [Google Scholar] [CrossRef]
  36. Ly, S.; Charles, C.; Degré, A. Geostatistical interpolation of daily rainfall at catchment scale: The use of several variogram models in the Ourthe and Ambleve catchments, Belgium. Hydrol. Earth Syst. Sci. 2011, 15, 2259–2274. [Google Scholar] [CrossRef]
  37. Goovaerts, P. Geostatistical approaches for incorporating elevation into the spatial interpolation of rainfall. J. Hydrol. 2000, 228, 113–129. [Google Scholar] [CrossRef]
  38. Tabios, G.Q., III; Salas, J.D. A comparative analysis of techniques for spatial interpolation of precipitation 1. JAWRA J. Am. Water Resour. Assoc. 1985, 21, 365–380. [Google Scholar] [CrossRef]
  39. Lu, G.Y.; Wong, D.W. An adaptive inverse-distance weighting spatial interpolation technique. Comput. Geosci. 2008, 34, 1044–1055. [Google Scholar] [CrossRef]
  40. Li, Z.; Fotheringham, A.S.; Li, W.; Oshan, T. Fast Geographically Weighted Regression (FastGWR): A scalable algorithm to investigate spatial process heterogeneity in millions of observations. Int. J. Geogr. Inf. Sci. 2019, 33, 155–175. [Google Scholar] [CrossRef]
  41. Kling, H.; Fuchs, M.; Paulin, M. Runoff conditions in the upper Danube basin under an ensemble of climate change scenarios. J. Hydrol. 2012, 424, 264–277. [Google Scholar] [CrossRef]
  42. Gupta, H.V.; Kling, H. On typical range, sensitivity, and normalization of Mean Squared Error and Nash-Sutcliffe Efficiency type metrics. Water Resour. Res. 2011, 47, W10601. [Google Scholar] [CrossRef]
  43. Li, J.; Chen, Y.; Wang, H.; Qin, J.; Li, J.; Chiao, S. Extending flood forecasting lead time in a large watershed by coupling WRF QPF with a distributed hydrological model. Hydrol. Earth Syst. Sci. 2017, 21, 1279–1294. [Google Scholar] [CrossRef]
  44. Yoon, S.S.; Lee, B. Effects of Using High-Density Rain Gauge Networks and Weather Radar Data on Urban Hydrological Analyses. Water 2017, 9, 931. [Google Scholar] [CrossRef]
  45. Huang, B.; Wu, B.; Barry, M. Geographically and temporally weighted regression for modeling spatio-temporal variation in house prices. Int. J. Geogr. Inf. Sci. 2010, 24, 383–401. [Google Scholar] [CrossRef]
Figure 1. Flow chart of Experiments Design.
Water 17 00018 g001
Figure 2. Ningdu Catchment Overview. (a) Left panel mainly displays the rain gauges and river network in Ningdu catchment. (b) Right panel displays DEM, land-use and soil map of the catchment.
Water 17 00018 g002
Figure 3. Liuxihe model structure [13] (a few more details added).
Water 17 00018 g003
Figure 4. Illustration of the sampling scheme.
Water 17 00018 g004
Figure 5. Parameter optimization results. (a) Predicted hydrograph of THI100P. (b) Predicted hydrograph of IDW100P. (c) Predicted hydrograph of GWR100P. (d) Errors (fit) in the parameter optimization process.
Water 17 00018 g005
Figure 6. Predicted hydrographs of the 15 test events by all available gauges (i.e., experiments 100 Ps). Red line for experiment THI, orange line for IDW, and yellow line for GWR.
Water 17 00018 g006
Figure 7. Relational curves of rain gauge density and metrics. Shaded area boundaries represent the maximum and minimum metrics values. (a) Average KGE of test dataset as rain gauge density varies. (b) Average NSE of test dataset as rain gauge density varies. (c) Average PRE of test dataset as rain gauge density varies. (d) Average APTE of test dataset as rain gauge density varies.
Water 17 00018 g007
Figure 8. Box plot of the experimental results. (a) Experiments using THI. (b) Experiments using IDW. (c) Experiments using GWR.
Water 17 00018 g008
Figure 9. Interpolated rainfall surfaces of THI, IDW, and GWR.
Water 17 00018 g009
Figure 10. Bar plots of the average rainfall in three time segments of event 2016-11-19 for experiment 100 Ps.
Water 17 00018 g010
Figure 11. Results of parameter optimization for each scenario. (a) Predicted hydrograph of THI experiments. (b) Predicted hydrograph of IDW experiments. (c) Predicted hydrograph of GWR experiments. (d) Errors (fit) in the optimization processes for each scenario.
Water 17 00018 g011
Figure 12. Relational curves of rain gauge density and metrics for experiments involving parameter optimization for each scenario. Shaded area boundaries represent the maximum and minimum metrics values. (a) Average KGE of test dataset as rain gauge density varies. (b) Average NSE of test dataset as rain gauge density varies. (c) Average PRE of test dataset as rain gauge density varies. (d) Average APTE of test dataset as rain gauge density varies.
Water 17 00018 g012
Table 1. Events data overview.
IDEvent IdentifierBegin TimeDuration (h)Peak (m3/s)
12013-08-2109:00:00137619.0
22014-03-0100:00:00527292.3
32014-03-2608:00:00249291.5
42014-06-1610:00:00262692.6
52014-07-1311:00:00208271.4
62014-08-1103:00:00300312.3
72015-05-2703:00:00180885.6
82015-07-0105:00:002011104.7
92015-11-1014:00:003001140.0
102016-06-1410:00:00164919.3
112016-07-1612:00:00119965.9
122016-11-19 112:00:00254566.0
132016-09-2718:00:00182800.2
142017-03-2722:00:00172541.0
152017-06-0105:00:00228749.3
162017-06-1208:00:00317485.0
Note: 1 The event used for model parameter optimization.
Table 2. Statistical metrics of the experiments 100 Ps.
EventKGENSEPRE (%)APTE (h)
2013-08-210.971/IDW0.947/THI4.1/THI2/IDW
2014-03-010.852/IDW0.867/GWR2.8/GWR0/IDW
2014-03-260.884/IDW0.914/THI5.0/THI0/THI
2014-06-160.902/IDW0.885/IDW6.6/IDW0/IDW
2014-07-130.850/GWR0.697/GWR3.7/IDW4/GWR
2014-08-110.905/GWR0.825/GWR6.2/THI4/GWR
2015-05-270.921/GWR0.858/THI15.9/GWR4/THI/IDW/GWR
2015-07-010.856/IDW0.875/IDW9.6/IDW4/THI
2015-11-100.754/GWR0.798/IDW18.1/GWR6/IDW/GWR
2016-05-040.907/IDW0.858/IDW2.7/IDW2/THI/GWR
2016-06-140.924/GWR0.860/GWR4.4/GWR2/IDW/GWR
2016-07-160.933/IDW0.954/IDW0.3/IDW5/GWR
2016-09-270.858/GWR0.908/GWR2.2/IDW1/THI/IDW
2017-03-270.933/THI0.885/THI3.5/THI0/THI/IDW
2017-06-120.920/GWR0.859/GWR0.4/GWR7/THI/GWR
Table 3. Total amount of averaged rainfall in event 2016-11-19.
Rainfall (mm)100P80P60P40P20P10P
THI112.953112.192112.217112.157105.038118.824
IDW114.536112.828114.693108.381105.226117.084
GWR114.586112.225115.177106.024103.367115.625
Disclaimer/Publisher’s Note: The statements, opinions and data contained in all publications are solely those of the individual author(s) and contributor(s) and not of MDPI and/or the editor(s). MDPI and/or the editor(s) disclaim responsibility for any injury to people or property resulting from any ideas, methods, instructions or products referred to in the content.

