Article

Effects of Bio-Organic Fertilizers Substitution on Gaseous Nitrogen Losses in Rice Fields

College of Hydraulic Science and Engineering, Yangzhou University, Yangzhou 225009, China
*
Authors to whom correspondence should be addressed.
Water 2024, 16(9), 1229; https://doi.org/10.3390/w16091229
Submission received: 18 March 2024 / Revised: 22 April 2024 / Accepted: 23 April 2024 / Published: 25 April 2024

Abstract

:
Traditional practices for managing irrigation and fertilizer in Chinese rice fields have historically consumed large amounts of water resources and caused serious gaseous nitrogen losses (ammonia volatilization and N2O), resulting in low water and fertilizer use efficiency. While both water-saving irrigation and substituting organic fertilizer for chemical fertilizer can impact ammonia volatilization and N2O emissions, the impact of their combined application on gaseous nitrogen loss in rice fields remains unclear. To achieve this goal, we conducted a two-year experiment using two irrigation methods and three bio-organic fertilizer substitution modes. The experiment investigated the effect of different irrigation and fertilizer management techniques on gaseous nitrogen losses in rice fields. The result indicated that controlled irrigation could reduce the peak value of ammonia volatilization by 36.8~75.9% and ammonia volatilization accumulation by 45.8%. However, it also leads to a 71.4% increase in N2O accumulation emissions, resulting in a 43.0% reduction in gaseous nitrogen losses. Compared to full chemical fertilizers, bio-organic fertilizer substitution could effectively reduce the peak of N2O and ammonia volatilization. Cumulative ammonia volatilization and N2O emissions went down by 22.7~60.0% and 38.6~42.6%, respectively. This then led to a 23.4~52.9% drop in total gaseous nitrogen losses. In contrast, the utilization of controlled irrigation and bio-organic fertilizer substitution did not have a significant impact on rice yield. However, it did reduce the intensity of gaseous nitrogen loss from rice fields by 42.7% and 22.5% to 56.5%, respectively. When taken together, the substitution of bio-organic fertilizer in controlled irrigation can effectively reduce gaseous nitrogen losses while maintaining rice yields. This study has significant practical implications for reducing nitrogen loss from paddy fields, improving water and fertilizer utilization, and achieving sustainable agricultural development.

1. Introduction

China has a long history of cultivating rice, with vast areas dedicated to its production and world-leading yields. However, agricultural productivity in China has improved since the 1980s by increasing the amount of chemical nitrogen fertilizer, which has long exceeded its economic use [1]. The over-application of chemical nitrogen fertilizers over a long period has resulted in a decrease in fertilizer utilization rates [2]. A significant amount of nitrogen enters the atmosphere and surrounding water bodies through volatilization, runoff, and leaching, causing significant environmental issues in rice fields [3,4,5,6]. Among them, N2O emissions and ammonia volatilization are the primary modes of gaseous nitrogen loss in rice fields, and have also become the main pathways of nitrogen losses [7]. In China, the annual emissions of N2O and ammonia volatilization exceed 0.1 Tg and 0.3 Tg [8,9], respectively, accounting for more than 50% of the nitrogen loss in rice fields [10]. This phenomenon not only causes significant fertilizer waste, but it also contributes to environmental issues such as air pollution (PM2.5), the greenhouse effect, and the acidification and eutrophication of water [11,12]. Therefore, reducing the emissions of N2O and ammonia volatilization from rice fields can promote environmental improvements, with ecological and economic benefits.
Research related to the replacement of chemical fertilizers with organic fertilizers was gradually carried out due to the serious soil and ecological problems that could result from the long-term use of chemical fertilizers. The chemical nitrogen fertilizers used in rice fields rapidly hydrolyze ammonium nitrogen (NH4+-N), increasing its content in field water and soil. Nitrogen losses occur due to the release of NH4+-N into the atmosphere, caused by ammonia volatilization and N2O emissions [13,14]. Organic fertilizer’s slow nutrient release reduces the available nitrogen content in soil and water after fertilization, thereby decreasing ammonia volatilization and N2O emissions during the fertilization stage [15]. However, some studies have found that organic fertilizer is alkaline, which increases soil and water pH, promotes the conversion of NH4+-N to NH3, and subsequently increases ammonia volatilization [15,16]. Overall, organic fertilizers generally reduce the emissions of N2O and ammonia volatilization from agricultural fields. For instance, Liu et al. [17] analyzed published studies on changes in nitrogen loss from farmland with organic and inorganic fertilizers from 2000 to 2019. They found that organic fertilizer substitution at a rate below 70% can reduce N2O emissions by 28.4% to 34.9%. Shan et al. [18] discovered in a 3-year field experiment that, compared to full chemical fertilizers, blending organic and inorganic fertilizers reduced ammonia volatilization by 8.8% to 12.7%, and the full organic fertilizers reduced ammonia volatilization by 11.8% to 18.5%. Bio-organic fertilizers, a derivative of organic fertilizers, were more effective in improving soil quality and enhancing crop yield and quality [19,20]. However, existing studies have rarely examined the impact of bio-organic fertilizers on gaseous nitrogen losses in rice fields. Is the effect of bio-organic fertilizer on N2O and ammonia volatilization from rice fields consistent with that of conventional organic fertilizer? The relevant research is worth discussing.
Rice is a crop that requires a lot of water. Traditional rice cultivation in China relies on flood irrigation, which not only consumes a large amount of water resources but also leads to fertilizer loss [21], particularly the loss of gaseous nitrogen in rice fields. Flooded irrigation can promote the release of nitrogen from fertilizers, which affects the water NH4+-N and could lead to increased ammonia volatilization emissions [22,23]. Controlled irrigation is a water-saving mode used in rice fields in China. It helps to conserve irrigation amounts while maintaining rice yield [24,25]. In controlled irrigation, frequent alternations of wet and dry soil accelerate the accumulation of NH4+-N into the soil. This promotes the nitrification process in soil and the NH4+-N content continues to decrease, which, in turn, reduces ammonia volatilization [26,27]. However, the alternations in soil dryness and wetness affect soil’s microbial activity and nitrification–denitrification processes and can regulate soil aeration [28,29], ultimately leading to increased N2O emissions in rice fields [24,25]. Therefore, further confirmation was required regarding overall gaseous nitrogen losses from ammonia and N2O in water-saving irrigated rice fields.
Both irrigation method and fertilizer management are important factors that affect N2O emissions and ammonia volatilization from rice fields. However, studies on the effects of irrigation and organic fertilizer substitution on ammonia volatilization in rice fields have produced inconsistent results, and the impact of bio-organic fertilizer substitution on gaseous nitrogen losses in rice fields requires further investigation. This study monitored the emission patterns of N2O and ammonia volatilization in rice fields from different bio-organic fertilizer substitutions with two types of irrigation by field experiments. The study explored the effects of bio-organic fertilizers on gaseous nitrogen losses in rice fields under different irrigation modes. It provides a method for reducing nitrogen loss from farmland, provides data supporting the advancement of bio-organic fertilizer application in rice cultivation, and provides a scientific basis for achieving sustainable agriculture that is water-saving, efficient, and environmentally friendly.

2. Materials and Methods

2.1. Experimental Site Description

The field experimental site was located at Yangzhou University in Yangzhou, Jiangsu Province (119°23′24″ E,32°20′24″ N). Yangzhou has a subtropical monsoon climate. The mean annual temperature is 14.8 °C;, while the multi-year average rainfall and evaporation are 1025.6 mm and 937.7 mm, respectively. The soil in the experiment area consisted of sandy loam. At the start of the experiment, the main properties of the soil were pH 7.4, soil bulk density of 1.32 g cm−3, and soil total nitrogen, effective phosphorus, effective potassium, and organic matter contents of 1.07 g kg−1, 56.42 mg kg−1, 87.06 mg kg−1, and 17.6 g kg−1, respectively. The average temperatures for the rice seasons of 2022 and 2023 were 26.9 °C and 25.7 °C, respectively. In early August 2022, there was a consecutive week of high temperatures that exceeded 40 °C.

2.2. Field Experiment Design

The experiment considered the dual factors of irrigation and fertilization. Field plot experiments were conducted between June and October of the years 2022 and 2023. The experiment combined two irrigation methods and three nitrogen fertilizer management modes, with three replicates and eighteen plots in total. The two irrigation methods used in the study were flooded irrigation (FI) and controlled irrigation (CI). In flooded irrigation, the field was flooded with a 1~5 cm water layer throughout the rice growing stage (Table 1), except for drainage during the mid-growth period and a week before harvest. In controlled irrigation, a field water layer of 5~25 mm was retained only during the rice re-greening stage, fertilization, and dosing. Afterward, the root layer soil moisture was employed as the reference index to ascertain the irrigation amounts and irrigation time at subsequent stages [30]. The upper limit of the soil moisture control was the saturated water content, and the lower limit was 60~80% of the saturated soil water content. Table 1 presents the field water management at different rice growth stages under flooded and controlled irrigation.
Nitrogen fertilizer was applied at a rate of 300 kg N ha−1 in all treatments. Three types of nitrogen fertilizer management were used: the full application of chemical fertilizer (N300); bio-organic fertilizers provided 15% of the nitrogen and the rest was chemical nitrogen fertilizer (BO15); bio-organic fertilizers provided 30% of the nitrogen and the rest was chemical nitrogen fertilizer (BO30). Urea (N = 46%) was used as the chemical nitrogen fertilizer. The bio-organic fertilizer was produced using chicken manure as the primary organic material in our experiment. The manure was crushed, fermented, and then mixed with active microbial bacteria culture (Bacillus subtilis, Bacillus amyloliquefaciens, and Bacillus licheniformis). The bio-organic fertilizer had an organic matter content of 40%, with total nitrogen, phosphorus, and potassium contents of 3.5%, 2.7%, and 2.5%, respectively. The bio-organic fertilizer contained over 20 million effective live bacteria per gram. The application of nitrogen fertilizer occurred three times, with a distribution of 30% for the base fertilizer, 40% at the tillering stage, and 30% at the spike stage. Additionally, bio-organic fertilizers were added to the base and spike fertilizers at a ratio of 60% and 40%, respectively. Phosphorus and potassium fertilizers were adjusted to the same level (75 kg P2O5 ha−1; 75 kg K2O ha−1) in each treatment by using agricultural calcium superphosphate (P2O5 = 12%) and agricultural potassium chloride (K2O = 60%). All the calcium superphosphate was applied in the basal fertilizer, and the potassium chloride was divided equally between the basal fertilizer and the spike fertilizer.
The water and fertilizer management treatments were arranged completely randomly in experimental plots, each of which was 2 m × 2.5 m in size. The rice variety that was tested was ‘Nanjing 9108’. Rice was planted at a density of 20 cm × 20 cm. Other agronomic measures were consistent with local field management. A rain shield was installed over the experimental plots, which was transparent, and the rainfall did not affect the test.

2.3. Ammonia Sampling and Analysis

Ammonia volatilization fluxes from rice fields were monitored using the aeration method. A PVC pipe (diameter 16 cm, height 25 cm) was inserted 5 cm into the soil in each plot. Two sponges, impregnated with glycerol phosphate, were placed inside the pipe. The upper sponge was utilized to prevent external ammonia from affecting the experiment, while the lower sponge was utilized to collect ammonia from the area covered by the pipe. The distance between the upper and lower sponges was 2 cm. Ammonia volatilization was measured every 1~2 days for the first 15 days after fertilization, and then at 5~7-day intervals. The device was fixed in a rice field for 24 h for each sampling. Afterward, the lower sponge was transferred to a plastic bottle containing 300 mL of potassium chloride solution (1 mol L−1) and shaken for one hour. The NH4+-N of the solution was then measured using the ultraviolet spectrophotometer (UVmini-1280, Shimadzu, Tokyo, Japan), and the method of Chen et al. [30] was used to calculate the ammonia volatilization flux.

2.4. N2O Collection and Analysis

Gas samples were collected in situ using static boxes. The box dimensions were 40 cm × 40 cm × 45 cm (length × width × height), with an additional 45 cm high section with extensions for when the rice plant grows taller. The box and extension were covered with aluminum foil on the outer surfaces to minimize the impact of light on the temperature inside. The static box’s base was buried in the experiment plot after rice were transplanted. For sampling, the chamber box was placed on the groove of the base, which was filled with water and sealed to prevent gas exchanges between the inside and outside. Gas samples were collected frequently for one week following fertilizer application and then at intervals of 5 to 7 days until the subsequent fertilizer application. Between 10:00 am and 11:00 am, the gas samples were collected using a 50 mL syringe every 10 min, for a total of four times a day, starting with the sealing of the static box. The N2O concentration in the gas samples was measured by gas chromatography (GC-2014C, Shimadzu, Tokyo, Japan). The temperature inside the static box and the height of the water layer in the field were recorded during each gas sample collection. The N2O flux was then calculated using the method of Hou et al. [24].
The cumulative ammonia volatilization and N2O emissions in rice fields were obtained by integrating the ammonia volatilization flux and N2O flux, which were then summed to determine the gaseous nitrogen loss. The gaseous nitrogen loss intensity (GNLI) was calculated by combining the gaseous nitrogen loss and rice yield, using the following formula:
T GNL = T NH 3 + T N 2 O
GNLI = T GNL Y
where T GNL , T NH 3 , and T N 2 O are gaseous nitrogen loss, ammonia volatilization accumulation, and N2O cumulative emissions, kg N ha−1, respectively; GNLI is the gaseous nitrogen loss intensity, kg N ha−1; and Y is the rice yield, t ha−1.

2.5. Soil and Water Sample Collection and Analysis

Each sample of field water or topsoil water (in controlled irrigation) was collected simultaneously with ammonia volatilization for each treatment. The NH4+-N was measured by ultraviolet spectrophotometer (UVmini-1280, Shimadzu, Tokyo, Japan) after filtering the water samples. Soil samples were collected from each experimental plot on the same day that gas samples were collected. The soil samples were leached with a 1 mol L−1 potassium chloride solution for 1 h at a soil–liquid volume ratio of 1:5, followed by filtration. The NH4+-N in the filtrate was measured by the ultraviolet spectrophotometer (UVmini-1280, Shimadzu).

2.6. Statistical Analyses

The data in the paper were calculated using Microsoft Excel 2021 and represent the average of three replicates for each treatment. Graphs were created and ammonia volatilization and N2O cumulative emissions were calculated using OriginPro 9.1. The experimental data were analyzed statistically using IBM SPSS Statistics 25.0.

3. Results

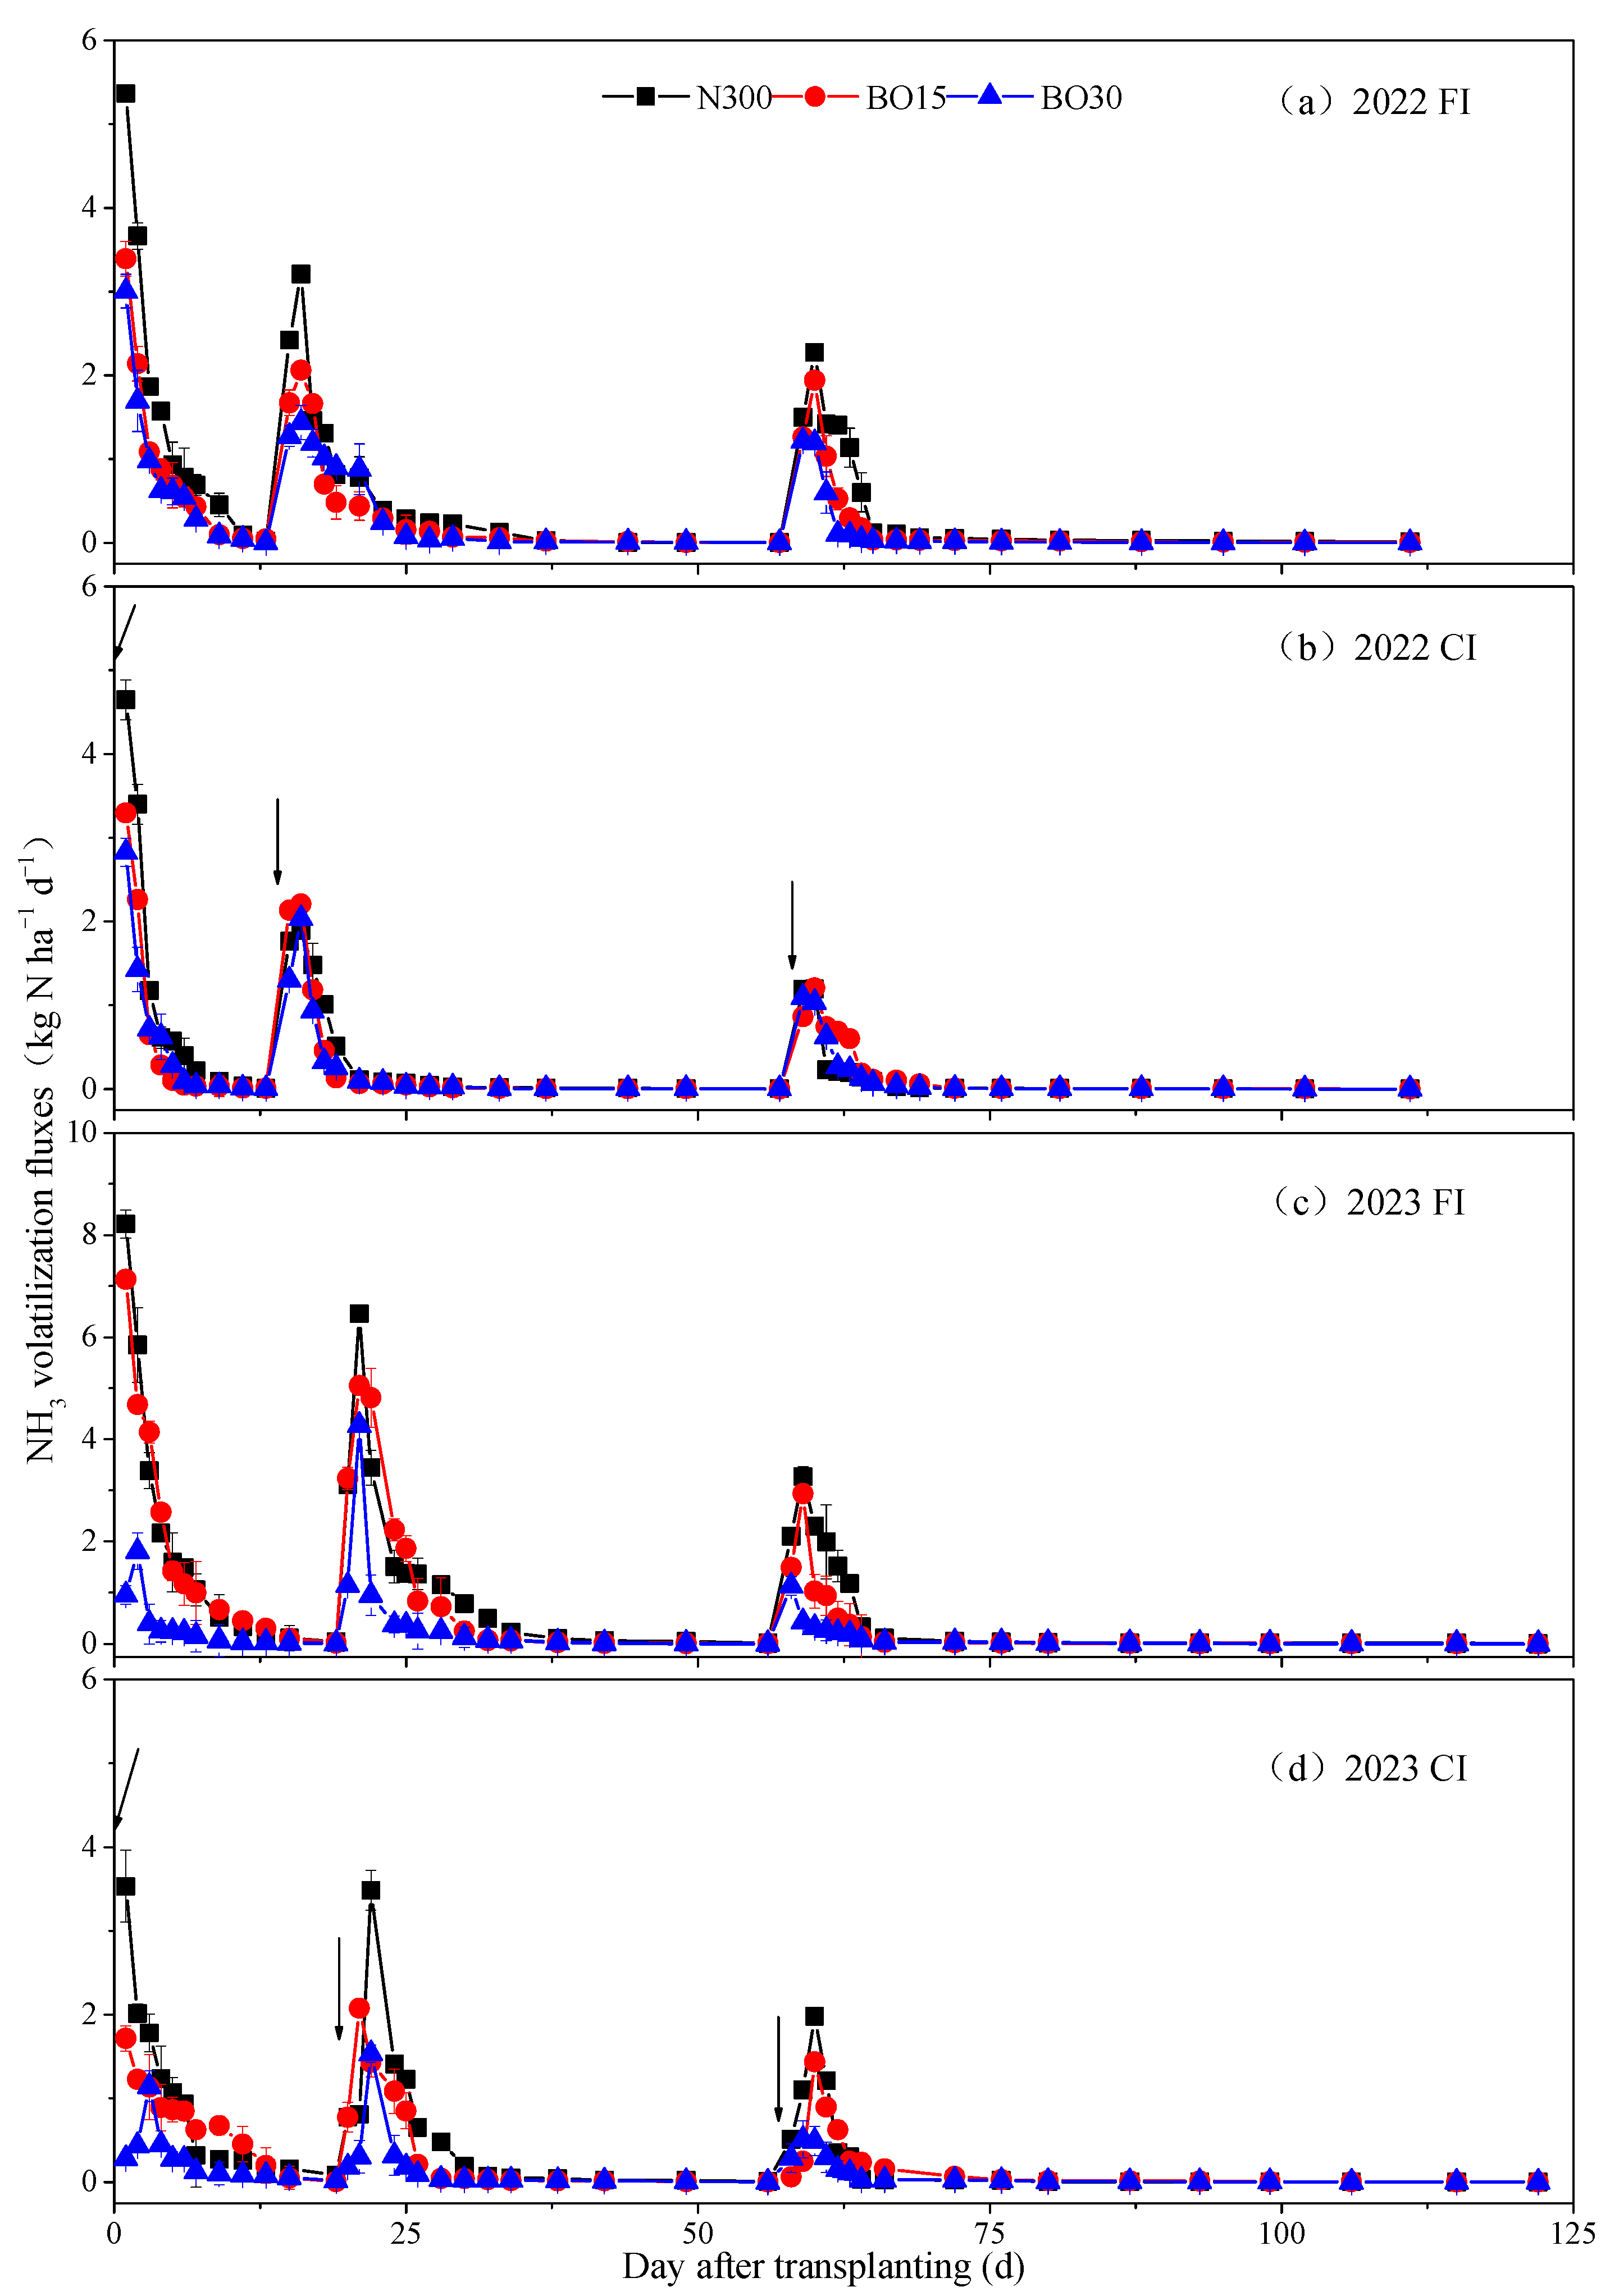
3.1. Ammonia Volatilization Fluxes
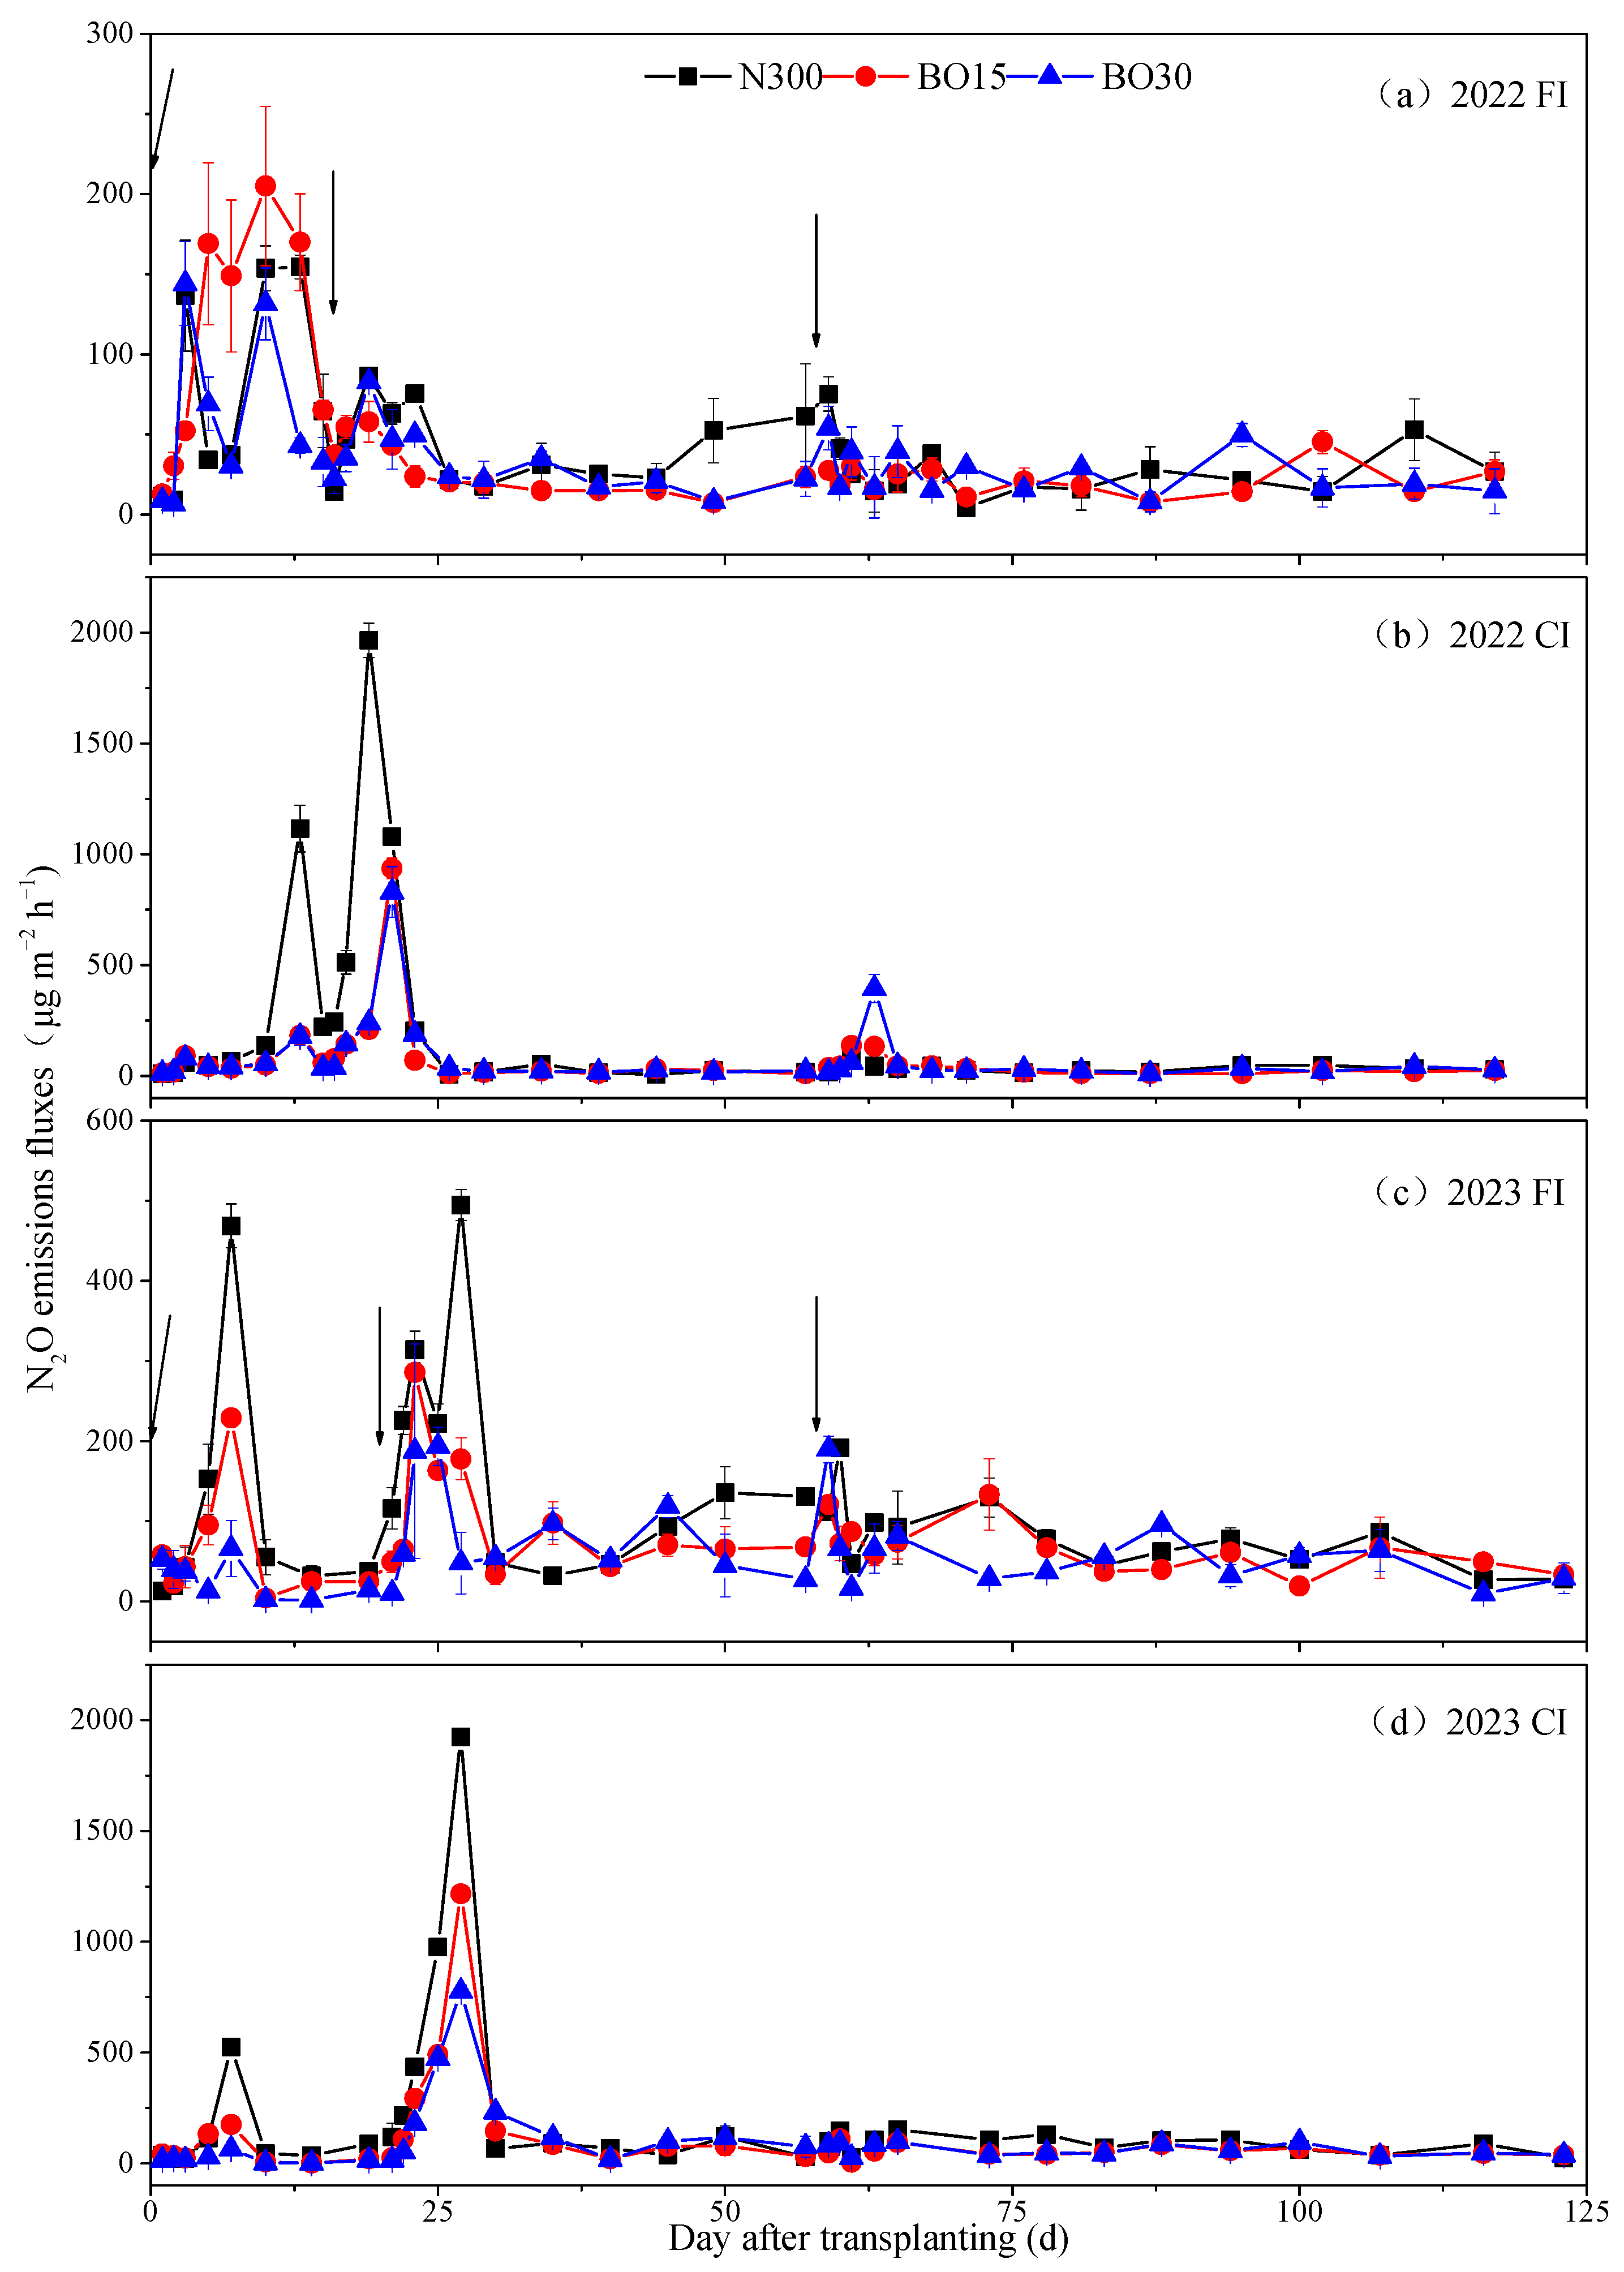
The ammonia volatilization fluxes in different treatments all showed the same pattern of change (Figure 1). The ammonia volatilization fluxes in all treatments reached a peak rapidly after each fertilizer application, then gradually reduced to a lower level over the next week and remained there until the next application. In rice fields with varying water and fertilizer management, the maximum peak values of ammonia volatilization ranged from 1.53 to 8.21 kg N ha−1 d−1. These peaks were observed mostly after basal fertilizer application. In contrast, under controlled irrigation conditions in 2023, the highest peak of ammonia volatilization from the BO15 and BO30 treatments occurred after tiller fertilization (Figure 1d). The ammonia volatilization peak after spike fertilization was the smallest among all treatments. After basal fertilization, the peak of ammonia volatilization in the BO15 and BO30 treatments decreased significantly by 13.2~78.0% compared to the full chemical fertilizer treatment (p < 0.05). Furthermore, the bio-organic fertilizer replacement treatments resulted in a significant reduction of 14.6% to 56.0% and 10.2% to 74.2% in peak ammonia volatilization after tillering and spike fertilization (p > 0.05), respectively, compared to the N300 treatment, except for the controlled irrigation rice field in 2022. However, the impact of irrigation on ammonia volatilization peaks in rice fields was significant. In particular, in 2023, the peak values of ammonia volatilization fluxes following fertilizer application from rice fields in controlled irrigation were significantly reduced by 36.8~75.9% compared to flooded irrigation (p < 0.05; Figure 1c,d).

3.2. N2O Fluxes

The patterns of N2O flux changes in rice fields with different water and fertilizer management differed considerably and were primarily affected by the irrigation method and fertilizer management (Figure 2). Under flooded irrigation, the N2O fluxes were low in 2022 and peaked significantly only after basal fertilizer application, ranging from 144.19 to 205.09 μg m−2 h−1 (Figure 2a). In contrast, the N2O fluxes in flooded irrigation increased slightly in 2023 and peaked after both basal fertilizer and tiller fertilizer, with the peak values ranging from 193.86 to 494.79 μg m−2 h−1 (Figure 2c). The N2O fluxes increased rapidly after tillering fertilization under controlled irrigation in 2022 and 2023, peaked, and then decreased (Figure 2b,d). Additionally, the N2O flux of the N300 treatment rapidly increased to 1115.81 μg m−2 h−1 during the first dewatering of the rice field at the end of the rice re-greening period in 2022 under controlled irrigation (Figure 2b). However, this change was not observed in 2023. In contrast, base and spike fertilizers had a limited effect on N2O fluxes in controlled irrigation rice fields. However, overall, controlled irrigation increased the peaks of N2O fluxes compared to flooded irrigation. This was observed in both the 2022 and 2023 experiments, with peak values of N2O fluxes in controlled irrigation being 3.9 to 4.3 times higher than those in flooded irrigation in 2023. Additionally, bio-organic fertilizer substitution could significantly reduce the peaks of N2O flux. In flooded irrigation, bio-organic fertilizer substitution can reduce the peaks of N2O fluxes treatments by 42.2% to 60.8% after basal and tillering fertilization in 2023 (p < 0.05). Compared to the N300, bio-organic fertilizer substitution significantly reduced the peaks of N2O fluxes after tillering fertilization by 36.8% to 59.7% in controlled irrigation (p < 0.05).

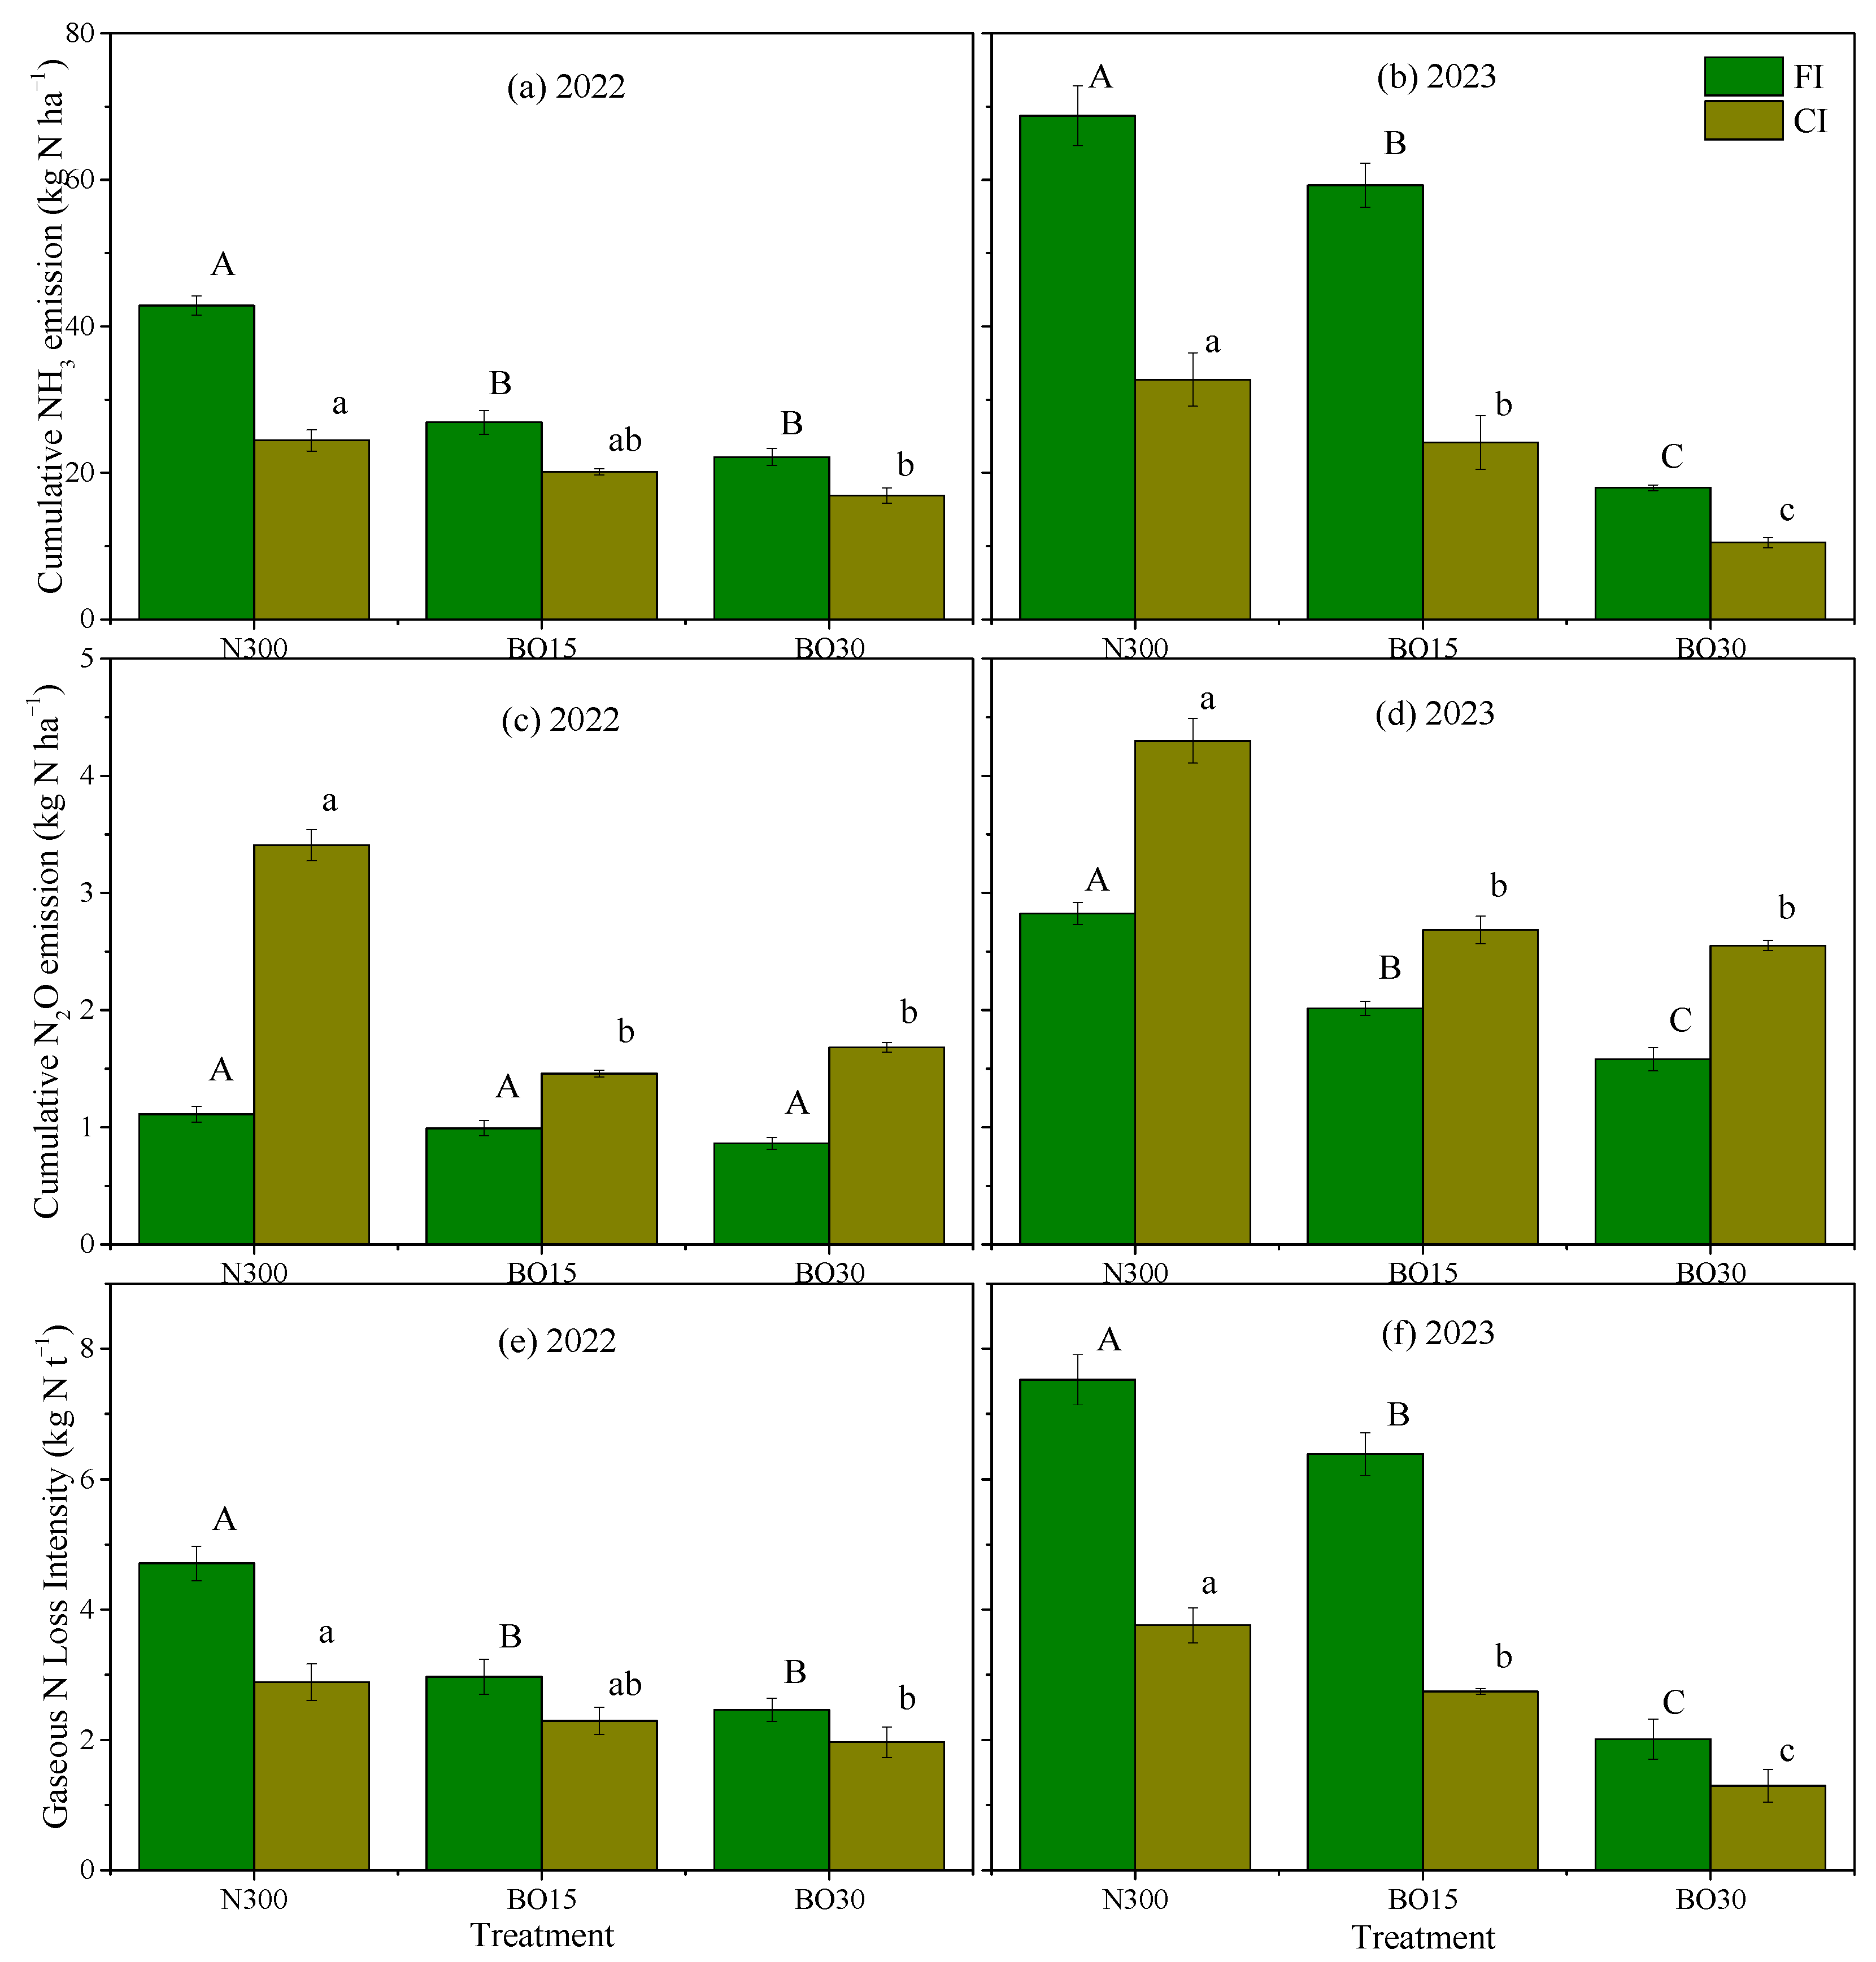
3.3. Cumulative Ammonia Volatilization and N2O Emissions, Rice Yield, and GNLI

The high temperatures (>40 °C) experienced during the rice heading and flowering stage in 2022 decreased the rice yield, ammonia volatilization, and N2O emissions. This resulted in a significant difference between the experiment results obtained in 2022 and those obtained in 2023. Additionally, both irrigation methods and fertilizer management significantly affect the cumulative ammonia volatilization and N2O emissions in rice fields (Table 2). Compared to flooded irrigation, ammonia volatilization accumulation was reduced by 45.8%, while N2O cumulative emissions increased by 71.4% with controlled irrigation (p < 0.05). However, the N2O accumulation from rice fields was much lower than the accumulation of ammonia volatilization. This led to a significant 43.0% decrease in total gaseous nitrogen losses under controlled irrigation (p < 0.05). Bio-organic fertilizer substitution can effectively reduce the cumulative emissions of ammonia volatilization and N2O. The reduction increased with the ratio of bio-organic fertilizer substitution. Compared to N300, BO15 and BO30 showed a significant reduction in cumulative ammonia volatilization and N2O emissions by 22.7% to 60.0% and 38.6% to 42.6%, respectively (p < 0.05). This led to a noteworthy decrease in gaseous nitrogen losses by 23.4% to 59.2% (p < 0.05).
The yield of rice was minimally affected by the methods of irrigation and fertilizer management (Table 2). Additionally, the controlled irrigation of rice fields significantly reduced the GNLI by 42.7% compared to flooded irrigation, while still maintaining the rice yield (p < 0.05). Similarly, the GNLI was significantly reduced by 23.7% and 59.0% for BO15 and BO30 treatments, respectively, compared to N300 (p < 0.05). In conclusion, when using controlled irrigation, substituting a portion of chemical nitrogen fertilizers with bio-organic fertilizers can maintain rice yield and significantly decrease gaseous nitrogen losses from rice fields.
The combination of flooded irrigation and N300 resulted in the highest accumulation of ammonia volatilization in rice fields among the different water–fertilizer interaction treatments, ranging from 42.87 to 68.75 kg N ha−1 (Figure 3a,b). When used with flooded or controlled irrigation, BO15 and BO30 effectively reduced ammonia volatilization accumulation. The cumulative ammonia volatilization was significantly reduced by 13.8% to 70.7% in BO15 treatments under flooded and controlled irrigation compared to the combination of flooded and N300 (p < 0.05). Similarly, the reduction was 67.7% to 84.7% with BO30 treatment. However, cumulative N2O emissions were highest using the controlled irrigation and N300 combinations (Figure 3c,d). Bio-organic fertilizer substitution reduced cumulative N2O emissions in both flooded and controlled irrigation. BO15 and BO30 showed reductions ranging from 10.7% to 57.2% and 22.3% to 50.6% (p < 0.05), respectively. Furthermore, with flooded irrigation, the N300 treatment resulted in the highest GNLI in rice fields (7.52 kg N t−1). However, both controlled irrigation and bio-organic fertilizer substitution were effective in reducing the GNLI (Figure 3e,f). Controlled irrigation resulted in a significant reduction in GNLI from paddy fields, ranging from 20.2% to 57.0%, compared to flooded irrigation (p < 0.05). Similarly, bio-organic fertilizer substitution in BO15 and BO30 treatments led to a significant reduction in GNLI, ranging from 15.1% to 37.0% and 31.9% to 73.2%, respectively, compared to the N300 (p < 0.05).

3.4. Field Water (Top Soil Water) and Soil NH4+-N Content

The NH4+-N content in rice field water and soil was affected by irrigation practices and the substitution of bio-organic fertilizer. The effects varied at different fertilization stages. Compared to flooded irrigation, controlled irrigation resulted in a slightly lower NH4+-N content in field water after basal and tillering fertilization (Figure 4). Additionally, the soil NH4+-N content was slightly higher after each fertilizer application (Figure 5). Compared to N300, the bio-organic fertilizer substitution resulted in significantly lower field water NH4+-N content after basal and tillering fertilizers. Soil NH4+-N content was also significantly lower after basal fertilizers, but the difference was less or even slightly higher after tillering and spike fertilizers.

3.5. Relationship between Ammonia Volatilization, N2O Flux, and NH4+-N in Soil and Water

Significant positive correlations were found between ammonia volatilization and the NH4+-N in field water and soil with varying water and fertilizer management (p < 0.01). Notably, the effect of water NH4+-N on ammonia volatilization was more significant than that in soil (Table 3). Bio-organic fertilizer substitution reduces the effect of water NH4+-N on ammonia volatilization in flooded irrigation, but this effect was enhanced with controlled irrigation (Table 3). The N2O fluxes were not significantly affected by NH4+-N in field water and soil with varying water and fertilizer management (Table 3, p > 0.05). Among them, mostly negative correlations were found between the NH4+-N in terms of field water and N2O emissions. However, positive correlations were observed between soil NH4+-N and N2O emissions. This correlation reached a significant level in the BO15 treatment of flooded irrigation.

4. Discussion

4.1. Effect of Irrigation and Fertilizer on Ammonia Volatilization

The ammonia volatile fluxes in rice fields followed a consistent pattern of change under all treatments. The peaks of ammonia volatile fluxes were observed after the fertilizer application (Figure 1), indicating the significant impact of fertilizer application on ammonia volatile emissions [31]. The ammonia volatile fluxes at peak levels in rice fields with bio-organic fertilizer substitution treatment after each fertilizer application, as well as the ammonia volatile accumulation during the reproductive period of rice, were lower compared to those of the full chemical fertilizer application treatment (Figure 1, Table 2). This finding was consistent with related studies [18]. Compared to chemical nitrogen fertilizers, bio-organic fertilizers release nitrogen at a slower rate, resulting in lower levels of quick-acting nitrogen in soil and water, and subsequently lower emissions of ammonia volatilization at the same level of nitrogen application [32,33]. Additionally, the organic matter and effective live bacteria in bio-organic fertilizers stimulate soil microbial activity and promote soil nitrogen fixation. The fixed nitrogen is either consumed by microbial activity or taken up by the crop, reducing all forms of nitrogen loss [32,34]. The lower peak of ammonia volatilization fluxes during the fertilizer stages of tillering and spike, compared to the basal fertilizer stage (Figure 1), can be explained even when the N application rates were consistent with or higher than those of the basal fertilizer. The NH4+-N content in field water and soil was lower in the bio-organic fertilizer substitution treatment compared to the N300 (Figure 4 and Figure 5). Additionally, there was a significant positive correlation between the water and soil NH4+-N and ammonia volatilization (Table 3), which was consistent with existing studies [35]. The correlation between water NH4+-N and ammonia volatilization was stronger than that of soil NH4+-N (Table 3) [31]. However, it has been suggested that the gradual release of nitrogen by organic fertilizers could lead to increased ammonia volatilization during non-fertilization phases [36] and the alkaline properties of organic fertilizers could raise the pH levels of soil and water, further promoting the ammonia volatilization process [36]. Ultimately, compared to full chemical fertilizer application, the accumulation of ammonia volatilization during the rice season was similar to or even higher than the organic fertilizer substitution treatment [36]. However, the slow release of nitrogen was beneficial for rice uptake, which in turn reduces its losses [37]. Furthermore, the relatively small amount of bio-organic fertilizer had a negligible impact on the pH enhancement of soil and water, and was unable to effectively influence ammonia volatilization [33].
Irrigation methods can impact ammonia volatilization in rice fields. However, the effects of different irrigation methods on ammonia volatilization are still controversial. Some studies suggested that the higher water layer of continuously flooded irrigation rice fields can dilute the water NH4+-N content after fertilizer application, which may reduce ammonia volatilization losses [22,23]. Water-saving irrigation not only reduces the height of the field water layer and increases the water NH4+-N content after fertilizer application, but also frequently changes the soil moisture to stimulate soil urease activity. This increases ammonia volatilization emissions [38]. However, there are also studies showing that water-saving irrigation in rice fields can cause frequent wet and dry soil alternations, which enhances the adsorption of NH4+-N in rooted soil and reduces ammonia volatilization losses [30,39]. The frequent wet–dry alternations enhance the nitrification process in the soil, promoting the conversion of NH4+-N to nitrate nitrogen. This increases the loss of nitrogen by other pathways and reduces ammonia volatilization losses [26]. These findings are consistent with our research. In our study, controlled irrigation was effective in retaining the water layer only during the rice re-greening period and fertilizer application. Afterward, the field was irrigated until the soil was saturated. After fertilizer application, under controlled irrigation rice fields, the water NH4+-N content was slightly lower than that of flooded irrigation. Meanwhile, the soil NH4+-N content was slightly higher, and N2O emissions significantly increased with controlled irrigation. At all stages of fertilizer application, the peak and cumulative ammonia volatilization were lower than that of flooded treatments.

4.2. Effect of Irrigation and Fertilizer on N2O Emissions

Water and fertilizer management were important factors that drove N2O production and emissions [40]. Irrigation methods impact the processes of nitrification and denitrification in soil by regulating soil aeration, which ultimately affects the production and emissions of N2O. However, an excessive or insufficient soil moisture content can inhibit N2O emissions [41,42]. Nitrogen fertilizer provided the substrate for soil N2O emissions, and the peaks of N2O fluxes mostly occurred after its application [43]. In our study, we found that under flooded and controlled irrigation conditions, the peak of N2O fluxes mostly appeared within 7 days after basal and tillering fertilization (Figure 2). However, we observed that the N2O peaks from rice fields were mostly lower with flooded irrigation than controlled irrigation. After tillering fertilization, the differences in N2O peaks among treatments were particularly significant. The reason for this was that the water management during the rice re-greening stage for controlled irrigation was consistent with that of flooded irrigation. At this time, there was a water layer in the rice field, and the soil had poor permeability, which limited the emissions of N2O, allowing sufficient time for it to be further reduced [28]. After the rice re-greening period in controlled irrigation, the soil reaches a saturation level of over 70%, without the presence of a water layer. As a result, soil nitrification and denitrification occurred simultaneously, which was suitable for the production and emission of N2O [26]. Additionally, when applying the tillering fertilizer, it was often accompanied by irrigation. This process was followed by a gradual decrease in soil water content during controlled irrigation, during which a large amount of N2O is produced and is highly susceptible to emission peaks [25,44]. However, no significant peak of N2O flux was detected in the rice field during the spike fertilization stage of each treatment, consistent with previous studies [45]. This can be attributed to the high nutrient demand for the reproductive growth of rice during this stage, resulting in a lower water and soil NH4+-N content compared to that after basal and tillering fertilization [40]. In addition, bio-organic fertilizer substitution can reduce N2O emissions in rice fields. Bio-organic fertilizers have a longer fertilizing effect and release nutrients more slowly compared to chemical fertilizers. This is beneficial for crop uptake and inhibits the production of N2O [46,47]. However, this phenomenon was not significant in rice fields under flooded irrigation conditions. The release of nutrients from bio-organic fertilizers was accelerated by adequate moisture and high temperatures [45]. Consequently, the difference in N2O emissions between the different fertilization treatments under flooded irrigation in 2022 was not significant (Figure 3c). An interaction between irrigation and fertilizer management regarding N2O emissions was suggested (Table 2) [48]. Wang et al. [49] found that the mineralization and decomposition processes of organic fertilizers vary under different conditions, resulting in different rates of nitrogen and carbon. This variation led to differences in N2O emissions, with higher carbon-to-nitrogen ratios resulting in lower N2O emissions.
The impact of irrigation methods and fertilization management on ammonia volatilization and N2O emissions from rice fields is complex. However, to achieve efficient and clean agricultural production, it is recommended to optimize irrigation management and bio-organic fertilizer substitution. This can safeguard rice yield, reduce gaseous nitrogen losses, and improve water and fertilizer use efficiency.

5. Conclusions

Controlled irrigation can reduce ammonia volatilization accumulation while increasing N2O emissions in rice fields. However, the N2O emissions are much lower than ammonia volatilization in rice fields. This leads to a significant reduction in gaseous nitrogen losses in rice fields under controlled irrigation compared to flooded irrigation. Substituting a portion of chemical nitrogen fertilizers with bio-organic fertilizers significantly reduced total gaseous nitrogen losses from rice fields by decreasing ammonia volatilization and N2O emissions. Both the bio-organic fertilizer substitution and controlled irrigation had no significant effect on rice yield, but they could significantly reduce the intensity of gaseous nitrogen losses. Under controlled irrigation, substituting a portion of chemical nitrogen fertilizers with bio-organic fertilizers can further reduce gaseous nitrogen losses in rice fields and maintain rice yields. However, the use of bio-organic fertilizers may lead to an increase in methane emissions from rice paddies. Therefore, further field experiments are necessary to determine the optimal ratio of bio-organic fertilizers when used in combination with chemical fertilizers.

Author Contributions

Z.H., H.H. and M.Z. designed the experimental study plans; Z.H. and H.H. wrote the manuscript. H.H., X.Y., X.Q. and Q.T. collected and calculated the data. All authors have read and agreed to the published version of the manuscript.

Funding

This study was jointly funded by the Postgraduate Research & Practice Innovation Program of Jiangsu Province, China (No. KYCX22_3497) and the Priority Academic Program Development of Jiangsu Higher Education Institutions (PAPD).

Data Availability Statement

The original contributions presented in the study are included in the article; further inquiries can be directed to the corresponding authors.

Conflicts of Interest

The authors declare no conflicts of interest, and all authors have given their consent for the publication of the manuscript.

References

  1. Huang, J.K.; Hu, R.F.; Cao, J.M.; Rozelle, S. Training programs and in-the-field guidance to reduce China’s overuse of fertilizer without hurting profitability. J. Soil Water Conserv. 2008, 63, 165–167. [Google Scholar] [CrossRef]
  2. Chen, G.; Chen, Y.; Zhao, G.; Cheng, W.; Guo, S.; Zhang, H.; Shi, W. Do high nitrogen use efficiency rice cultivars reduce nitrogen losses from paddy fields? Agric. Ecosyst. Environ. 2015, 209, 26–33. [Google Scholar] [CrossRef]
  3. Shen, J.; Li, Y.; Wang, Y.; Li, Y.; Zhu, X.; Jiang, W.; Li, Y.; Wu, J. Soil nitrogen cycling and environmental impacts in the subtropical hilly region of china: Evidence from measurements and modeling. Front. Agric. Sci. Eng. 2022, 9, 407–424. [Google Scholar] [CrossRef]
  4. Lu, H.; Xie, H. Impact of changes in labor resources and transfers of land use rights on agricultural non-point source pollution in Jiangsu Province, China. J. Environ. Manag. 2018, 207, 134–140. [Google Scholar] [CrossRef]
  5. Du, X.; Li, X.; Zhang, W.; Wang, H. Variations in source apportionments of nutrient load among seasons and hydrological years in a semi-arid watershed: GWLF model results. Environ. Sci. Pollut. Res. 2014, 21, 6506–6515. [Google Scholar] [CrossRef]
  6. Fu, J.; Wu, Y.; Wang, Q.; Hu, K.; Wang, S.; Zhou, M.; Hayashi, K.; Wang, H.; Zhan, X.; Jian, Y.; et al. Importance of subsurface fluxes of water, nitrogen and phosphorus from rice paddy fields relative to surface runoff. Agric. Water Manag. 2019, 213, 627–635. [Google Scholar] [CrossRef]
  7. Yang, W.; Que, H.; Wang, S.; Zhu, A.; Zhang, Y.; He, Y.; Xin, X.; Zhang, X.; Ding, S. High temporal resolution measurements of ammonia emissions following different nitrogen application rates from a rice field in the Taihu Lake Region of China. Environ. Pollut. 2020, 257, 113489. [Google Scholar] [CrossRef]
  8. Sun, H.; Feng, Y.; Ji, Y.; Shi, W.; Yang, L.; Xing, B. N2O and CH4 emissions from N-fertilized rice paddy soil can be mitigated by wood vinegar application at an appropriate rate. Atmos. Environ. 2018, 185, 153–158. [Google Scholar] [CrossRef]
  9. Yang, G.; Ji, H.; Sheng, J.; Zhang, Y.; Feng, Y.; Guo, Z.; Chen, L. Combining Azolla and urease inhibitor to reduce ammonia volatilization and increase nitrogen use efficiency and grain yield of rice. Sci. Total Environ. 2020, 743, 140799. [Google Scholar] [CrossRef]
  10. Ding, W.; He, P.; Zhang, J.; Liu, Y.; Xu, X.; Ullah, S.; Cui, Z.; Zhou, W. Optimizing rates and sources of nutrient input to mitigate nitrogen, phosphorus, and carbon losses from rice paddies. J. Clean. Prod. 2020, 256, 120603. [Google Scholar] [CrossRef]
  11. Zhong, X.; Zhou, X.; Fei, J.; Huang, Y.; Wang, G.; Kang, X.; Hu, W.; Zhang, H.; Rong, X.; Peng, J. Reducing ammonia volatilization and increasing nitrogen use efficiency in machine-transplanted rice with side-deep fertilization in a double-cropping rice system in Southern China. Agric. Ecosyst. Environ. 2021, 306, 107183. [Google Scholar] [CrossRef]
  12. Recio, J.; Vallejo, A.; Le-Noe, J.; Garnier, J.; Garcia-Marco, S.; Manuel Alvarez, J.; Sanz-Cobena, A. The effect of nitrification inhibitors on NH3 and N2O emissions in highly N fertilized irrigated Mediterranean cropping systems. Sci. Total Environ. 2018, 636, 427–436. [Google Scholar] [CrossRef]
  13. Ni, B.; Zhang, W.; Xu, X.; Wang, L.; Bol, R.; Wang, K.; Hu, Z.; Zhang, H.; Meng, F. Exponential relationship between N2O emission and fertilizer nitrogen input and mechanisms for improving fertilizer nitrogen efficiency under intensive plastic-shed vegetable production in China: A systematic analysis. Agric. Ecosyst. Environ. 2021, 312, 107353. [Google Scholar] [CrossRef]
  14. Liu, T.; Li, C.; Tan, W.; Wang, J.; Feng, J.; Hu, Q.; Cao, C. Rice-crayfish co-culture reduces ammonia volatilization and increases rice nitrogen uptake in central China. Agric. Ecosyst. Environ. 2022, 330, 107869. [Google Scholar] [CrossRef]
  15. Wenjun, J.; Wenchao, C.; Fei, L.; Yongkang, W.; Fengwen, W.; Zhaorong, D.; He, S. Water management impact on denitrifier community and denitrification activity in a paddy soil at different growth stages of rice. Agric. Water Manag. 2020, 241, 348–359. [Google Scholar] [CrossRef]
  16. Rukshana, F.; Butterly, C.R.; Baldock, J.A.; Tang, C. Model organic compounds differ in their effects on pH changes of two soils differing in initial pH. Biol. Fertil. Soils 2011, 47, 51–62. [Google Scholar] [CrossRef]
  17. Liu, B.; Wang, X.; Ma, L.; Chadwick, D.; Chen, X. Combined applications of organic and synthetic nitrogen fertilizers for improving crop yield and reducing reactive nitrogen losses from China’s vegetable systems: A meta-analysis. Environ. Pollut. 2021, 269, 116143. [Google Scholar] [CrossRef]
  18. Shan, L.; He, Y.; Chen, J.; Huang, Q.; Wang, H. Ammonia volatilization from a Chinese cabbage field under different nitrogen treatments in the Taihu Lake Basin, China. J. Environ. Sci. 2015, 38, 14–23. [Google Scholar] [CrossRef]
  19. Ansari, R.A.; Mahmood, I. Optimization of organic and bio-organic fertilizers on soil properties and growth of pigeon pea. Sci. Hortic. 2017, 226, 1–9. [Google Scholar] [CrossRef]
  20. Wang, J.F.; Li, X.L.; Xing, S.Z.; Ma, Z.Y.; Hu, S.J.; Tu, C. Bio-organic Fertilizer Promotes Plant Growth and Yield and Improves Soil Microbial Community in Continuous Monoculture System of Chrysanthemum morifolium cv. Chuju. Int. J. Agric. Biol. 2017, 19, 563–568. [Google Scholar] [CrossRef]
  21. Jiang, M.; Li, X.; Xin, L.; Tan, M. Paddy rice multiple cropping index changes in Southern China: Impacts on national grain production capacity and policy implications. J. Geogr. Sci. 2019, 29, 1773–1787. [Google Scholar] [CrossRef]
  22. Xu, J.; Peng, S.; Yang, S.; Wang, W. Ammonia volatilization losses from a rice paddy with different irrigation and nitrogen managements. Agric. Water Manag. 2012, 104, 184–192. [Google Scholar] [CrossRef]
  23. Yao, Y.; Zhang, M.; Tian, Y.; Zhao, M.; Zhang, B.; Zeng, K.; Zhao, M.; Yin, B. Urea deep placement in combination with Azolla for reducing nitrogen loss and improving fertilizer nitrogen recovery in rice field. Field Crops Res. 2018, 218, 141–149. [Google Scholar] [CrossRef]
  24. Hou, H.J.; Yang, S.H.; Wang, F.T.; Li, D.; Xu, J.Z. Controlled irrigation mitigates the annual integrative global warming potential of methane and nitrous oxide from the rice-winter wheat rotation systems in Southeast China. Ecol. Eng. 2016, 86, 239–246. [Google Scholar] [CrossRef]
  25. Peng, S.Z.; Hou, H.J.; Xu, J.Z.; Yang, S.H.; Mao, Z. Lasting effects of controlled irrigation during rice-growing season on nitrous oxide emissions from winter wheat croplands in Southeast China. Paddy Water Environ. 2013, 11, 583–591. [Google Scholar] [CrossRef]
  26. Xia, L.; Lam, S.K.; Yan, X.; Chen, D. How Does Recycling of Livestock Manure in Agroecosystems Affect Crop Productivity, Reactive Nitrogen Losses, and Soil Carbon Balance? Environ. Sci. Technol. 2017, 51, 7450–7457. [Google Scholar] [CrossRef]
  27. Xu, J.; Liu, B.; Wang, H.; Liu, W.; Li, Y.; Dai, Y.; Lu, T. Ammonia volatilization and nitrogen leaching following top-dressing of urea from water-saving irrigated rice field: Impact of two-split surge irrigation. Paddy Water Environ. 2019, 17, 45–51. [Google Scholar] [CrossRef]
  28. Zou, J.W.; Huang, Y.; Jiang, J.Y.; Zheng, X.H.; Sass, R.L. A 3-year field measurement of methane and nitrous oxide emissions from rice paddies in China: Effects of water regime, crop residue, and fertilizer application. Glob. Biogeochem. Cycles 2005, 19, 1–9. [Google Scholar] [CrossRef]
  29. Song, C.; Zhang, J.; Wang, Y.; Wang, Y.; Zhao, Z. Emission of CO2, CH4 and N2O from freshwater marsh in northeast of China. J. Environ. Manag. 2008, 88, 428–436. [Google Scholar] [CrossRef]
  30. Chen, X.; Yang, S.-H.; Jiang, Z.-W.; Ding, J.; Sun, X. Biochar as a tool to reduce environmental impacts of nitrogen loss in water-saving irrigation paddy field. J. Clean. Prod. 2021, 290, 125811. [Google Scholar] [CrossRef]
  31. Liao, B.; Liao, P.; Hu, R.; Cai, T.; Zhang, Y.; Yu, Q.; Zhang, B.; Shu, Y.; Wang, J.; Luo, Y.; et al. Mitigating ammonia volatilization in rice cultivation: The impact of partial organic fertilizer substitution. Chemosphere 2023, 344, 140326. [Google Scholar] [CrossRef] [PubMed]
  32. Liu, T.; Huang, J.; Chai, K.; Cao, C.; Li, C. Effects of N Fertilizer Sources and Tillage Practices on NH3 Volatilization, Grain Yield, and N Use Efficiency of Rice Fields in Central China. Front. Plant Sci. 2018, 9, 385. [Google Scholar] [CrossRef] [PubMed]
  33. Dong, Y.; Wu, Z.; Zhang, X.; Feng, L.; Xiong, Z. Dynamic responses of ammonia volatilization to different rates of fresh and field-aged biochar in a rice-wheat rotation system. Field Crops Res. 2019, 241, 107568. [Google Scholar] [CrossRef]
  34. Zhang, T.; Liu, H.; Luo, J.; Wang, H.; Zhai, L.; Geng, Y.; Zhang, Y.; Li, J.; Lei, Q.; Bashir, M.A.; et al. Long-term manure application increased greenhouse gas emissions but had no effect on ammonia volatilization in a Northern China upland field. Sci. Total Environ. 2018, 633, 230–239. [Google Scholar] [CrossRef] [PubMed]
  35. Ma, B.L.; Wu, T.Y.; Tremblay, N.; Deen, W.; McLaughlin, N.B.; Morrison, M.J.; Stewart, G. On-Farm Assessment of the Amount and Timing of Nitrogen Fertilizer on Ammonia Volatilization. Agron. J. 2010, 102, 134–144. [Google Scholar] [CrossRef]
  36. Nobile, C.M.; Bravin, M.N.; Becquer, T.; Paillat, J.M. Phosphorus sorption and availability in an andosol after a decade of organic or mineral fertilizer applications: Importance of pH and organic carbon modifications in soil as compared to phosphorus accumulation. Chemosphere 2020, 239, 124709. [Google Scholar] [CrossRef] [PubMed]
  37. Sun, B.; Bai, Z.; Bao, L.; Xue, L.; Zhang, S.; Wei, Y.; Zhang, Z.; Zhuang, G.; Zhuang, X. Bacillus subtilis biofertilizer mitigating agricultural ammonia emission and shifting soil nitrogen cycling microbiomes. Environ. Int. 2020, 144, 105989. [Google Scholar] [CrossRef] [PubMed]
  38. Cao, X.; Zhang, J.; Yu, Y.; Ma, Q.; Kong, Y.; Pan, W.; Wu, L.; Jin, Q. Alternate wetting-drying enhances soil nitrogen availability by altering organic nitrogen partitioning in rice-microbe system. Geoderma 2022, 424, 115993. [Google Scholar] [CrossRef]
  39. Xu, J.-Z.; Peng, S.-Z.; Hou, H.-J.; Yang, S.-H.; Luo, Y.-F.; Wang, W.-G. Gaseous losses of nitrogen by ammonia volatilization and nitrous oxide emissions from rice paddies with different irrigation management. Irrig. Sci. 2013, 31, 983–994. [Google Scholar] [CrossRef]
  40. Liao, B.; Wu, X.; Yu, Y.; Luo, S.; Hu, R.; Lu, G. Effects of mild alternate wetting and drying irrigation and mid-season drainage on CH4 and N2O emissions in rice cultivation. Sci. Total Environ. 2020, 698, 134212. [Google Scholar] [CrossRef] [PubMed]
  41. Franco-Luesma, S.; Cavero, J.; Plaza-Bonilla, D.; Cantero-Martinez, C.; Arrue, J.L.; Alvaro-Fuentes, J. Tillage and irrigation system effects on soil carbon dioxide (CO2) and methane (CH4) emissions in a maize monoculture under Mediterranean conditions. Soil Tillage Res. 2020, 196, 104488. [Google Scholar] [CrossRef]
  42. Shen, J.L.; Tang, H.; Liu, J.Y.; Wang, C.; Li, Y.; Ge, T.D.; Jones, D.L.; Wu, J.S. Contrasting effects of straw and straw-derived biochar amendments on greenhouse gas emissions within double rice cropping systems. Agric. Ecosyst. Environ. 2014, 188, 264–274. [Google Scholar] [CrossRef]
  43. Huang, T.; Gao, B.; Hu, X.-K.; Lu, X.; Well, R.; Christie, P.; Bakken, L.R.; Ju, X.-T. Ammonia-oxidation as an engine to generate nitrous oxide in an intensively managed calcareous Fluvo-aquic soil. Sci. Rep. 2014, 4, 3950. [Google Scholar] [CrossRef] [PubMed]
  44. Liao, B.; Cai, T.; Wu, X.; Luo, Y.; Liao, P.; Zhang, B.; Zhang, Y.; Wei, G.; Hu, R.; Luo, Y.; et al. A combination of organic fertilizers partially substitution with alternate wet and dry irrigation could further reduce greenhouse gases emission in rice field. J. Environ. Manag. 2023, 344, 118372. [Google Scholar] [CrossRef]
  45. Shan, J.; Yan, X. Effects of crop residue returning on nitrous oxide emissions in agricultural soils. Atmos. Environ. 2013, 71, 170–175. [Google Scholar] [CrossRef]
  46. Tao, R.; Li, J.; Guan, Y.; Liang, Y.; Hu, B.; Lv, J.; Chu, G. Effects of urease and nitrification inhibitors on the soil mineral nitrogen dynamics and nitrous oxide (N2O) emissions on calcareous soil. Environ. Sci. Pollut. Res. Int. 2018, 25, 9155–9164. [Google Scholar] [CrossRef] [PubMed]
  47. Li, Y.; Xu, J.; Liu, X.; Qi, Z.; Wang, H.; Li, Y.; Liao, L. Nitrification inhibitor DMPP offsets the increase in N2O emission induced by soil salinity. Biol. Fertil. Soils 2020, 56, 1211–1217. [Google Scholar] [CrossRef]
  48. Li, J.; Li, Y.e.; Wan, Y.; Wang, B.; Waqas, M.A.; Cai, W.; Guo, C.; Zhou, S.; Su, R.; Qin, X.; et al. Combination of modified nitrogen fertilizers and water saving irrigation can reduce greenhouse gas emissions and increase rice yield. Geoderma 2018, 315, 1–10. [Google Scholar] [CrossRef]
  49. Wang, C.; Ma, X.; Shen, J.; Chen, D.; Zheng, L.; Ge, T.; Li, Y.; Wu, J. Reduction in net greenhouse gas emissions through a combination of pig manure and reduced inorganic fertilizer application in a double-rice cropping system: Three-year results. Agric. Ecosyst. Environ. 2022, 326, 107799. [Google Scholar] [CrossRef]
Figure 1. Ammonia volatilization fluxes from rice fields with different water and fertilizer management in 2022 (a,b) and 2023 (c,d). Note: The arrows in the graph represent the time of fertilizer application.
Water 16 01229 g001
Figure 2. The N2O emissions fluxes from rice fields with different water and fertilizer management in 2022 (a,b) and 2023 (c,d). Note: The arrows in the graph represent the time of fertilizer application.
Water 16 01229 g002
Figure 3. Differences in ammonia volatilization accumulation (a,b), N2O cumulative emissions (c,d), and gaseous nitrogen loss intensity (e,f) for different water and fertilizer combinations. Note: Different letters in the figure represent significant differences between treatments (p < 0.05).
Water 16 01229 g003
Figure 4. Variations in NH4+-N content in field water (top soil water) with different irrigation and fertilizer treatments in 2022 (a,b) and 2023 (c,d). Note: The arrows in the graph represent the time of fertilizer application.
Water 16 01229 g004
Figure 5. Variations in soil NH4+-N content in rice fields with different water fertilization treatments in 2022 (a,b) and 2023 (c,d). Note: The arrows in the graph represent the time of fertilizer application.
Water 16 01229 g005
Table 1. Field water management in different rice growth stages under flooded and controlled irrigation.
Irrigation MethodsControl IndexesGTJ&BH&FMR
Flooded irrigationUpper limit50 mm30 mm50 mm50 mm30 mmNaturally drying
Lower limit20 mm10 mm10 mm20 mm10 mm
Controlled irrigationUpper limit25 mmθsθsθsθsNaturally drying
Lower limit5 mm60~70% θs70~75% θs80% θs70% θs
Notes: G, T, J&B, H&F, M, and R represent re-greening stage, tillering stage, jointing and booting stages, heading and flowering stages, milk stage, and ripening stage, respectively. θs represents the saturated soil water content.
Table 2. Ammonia volatilization accumulation, N2O cumulative emissions, rice yield, and GNLI in rice fields in different years and using different irrigation and fertilization management practices.
Ammonia Volatilization Accumulation
(kg N ha−1)
N2O Cumulative Emission
(kg N ha−1)
Gaseous Nitrogen Losses
(kg N ha−1)
Yield
(kg ha−1)
GNLI
(kg N t−1)
Year (Y)
202225.58 b1.01 b26.59 b9217.46 a2.88 b
202335.57 a1.69 a37.26 a9414.19 a3.96 a
Irrigation (I)
FI39.66 a1.00 b40.66 a9338.60 a4.35 a
CI21.49 b1.71 a23.19 b9293.05 a2.49 b
Fertilizer (M)
N30042.20 a1.85 a44.05 a9317.61 a4.72 a
BO1532.63 b1.14 b33.76 b9342.64 a3.60 b
BO3016.90 c1.06 b17.96 c9287.22 a1.94 c
F-value (F)
Y184.7 **471.9 **206.0 **ns54.0 **
I708.0 **508.7 **646.4 **ns177.3 **
M391.3 **255.1 **406.6 **ns119.4 **
Y × I171.4 **ns169.9 **ns76.3 **
Y × M87.1 **9.1 **87.6 **ns34.3 **
I × M67.5 **64.1 **63.9 **ns23.7 **
Y × I × M24.1 **11.2 **23.7 **ns7.2 **
Notes: Different lowercase letters after the values represent significant differences between treatments (p < 0.05). ns represents non-significant effect (p > 0.05); ** indicates significant difference at p < 0.01.
Table 3. Correlations between ammonia volatilization, N2O fluxes, and NH4+-N in water and soil in rice fields with different irrigation and fertilizer management.
IrrigationFertilizerField Water NH4+-NSoil NH4+-N
Ammonia volatilizationFIN3000.777 **0.630 **
BO150.720 **0.579 **
BO300.721 **0.638 **
CIN3000.705 **0.666 **
BO150.933 **0.679 **
BO300.869 **0.856 **
N2OFIN300−0.0090.168
BO150.2300.334 *
BO300.0600.288
CIN300−0.0040.174
BO15−0.1100.064
BO30−0.171−0.084
Notes: * and ** indicates significant different at p < 0.05 and p < 0.01, respectively.
Disclaimer/Publisher’s Note: The statements, opinions and data contained in all publications are solely those of the individual author(s) and contributor(s) and not of MDPI and/or the editor(s). MDPI and/or the editor(s) disclaim responsibility for any injury to people or property resulting from any ideas, methods, instructions or products referred to in the content.

