Article

The Long-Term Dynamics of Walleye Pollock Stocks in Relation to Oceanographic Changes in the East Sea

1
East Sea Fisheries Research Institute, National Institute of Fisheries Science, Gangneung 25435, Republic of Korea
2
Department of Marine Ecology and Environment, Gangneung-Wonju National University, Gangneung 25457, Republic of Korea
3
Coastal Water Fisheries Resources Research Division, National Institute of Fisheries Science, Busan 46083, Republic of Korea
4
Dokdo Research Center, East Sea Research Institute, Korea Institute of Ocean Science & Technology, Uljin 36315, Republic of Korea
5
Ocean Climate & Ecology Research Division, National Institute of Fisheries Science, Busan 46083, Republic of Korea
*
Author to whom correspondence should be addressed.
Water 2024, 16(7), 955; https://doi.org/10.3390/w16070955
Submission received: 19 February 2024 / Revised: 22 March 2024 / Accepted: 25 March 2024 / Published: 26 March 2024
(This article belongs to the Special Issue Coastal Ecology and Fisheries Management)

Abstract

:
The decline in walleye pollock (Gadus chalcogrammus) stocks in Korean waters is a major concern for fishery conservation and management. However, the causes and mechanisms of this collapse remain unclear. This study investigated the complex dynamics influencing the abundance of walleye pollocks in the East Sea of Korea over several decades, by analyzing data from long-term changes in biological factors including composition of length and sex, catch, and oceanographic condition. Prior to the mid-1980s, the catch ratio of juveniles was higher than that of adults, with a higher proportion of females in both juvenile and adult catches compared to males. Especially, high fishing pressure on female individuals can be an important factor contributing to declining reproduction. Consequently, after the mid-1980s, there was a sudden decline in juvenile pollock catches. In the late 1980s, there was a rapid increase in sea surface temperature (SST) in the spawning grounds, resulting in a decrease in both the duration of suitable temperature for spawning and the regional proportion for suitable spawning conditions. Consequently, the decline in pollock stocks after the late 1980s due to overfishing of pollock in the mid-1980s was further exacerbated by the effects of SST warming after the late 1980s. These findings highlight the impact of overfishing and environmental factors on pollock stocks and indicate the need for appropriate fishery management practices to ensure the sustainable use of fishery resources.

1. Introduction

Walleye pollock (Gadus chalcogrammus), referred to as “pollock” hereafter, is a semidemersal, cold-water species widely distributed across the North Pacific Ocean, ranging from Korea to the central coast of California [1,2]. As of 2020, the global annual pollock catch stood at approximately 3544 thousand tons, making it the second-ranked species in global fish catches [3]. Notably, fluctuations in the total catch of this species were higher than those of other demersal species [3]. Pollock plays a crucial role in the marine food web, acting both as a predator of zooplankton and small fish and as prey for demersal fish, seabirds, and marine mammals [4,5].
Long-term changes in pollock production worldwide have exhibited a decreasing trend since the late 1980s, attributed to global warming and overfishing of both juvenile and adult individuals [6,7,8]. However, pollock production in Japan and Russia has either remained stable or slightly increased after 2000 [8], while the pollock catch in the United States and Canada, situated in the North Pacific, has not continued to decline since 2000 but has instead maintained a stable level [8]. In Korean waters, pollock fisheries have also undergone a drastic decline since the late 1980s, with catches plummeting below 1000 tons, nearly reaching extinction since 2000, in contrast to production in other countries [7,8,9,10,11].
Within Korean waters, the primary habitat of pollock is located in the southwestern part of its North Pacific distributional range, with the main fishing area situated in the western part of the East Sea [12,13]. During the 1970s and 1980s, pollock ranked as the second-largest catch among all fisheries in Korea. The pollock catch in Korea peaked in 1981 at approximately 170,000 metric tons but rapidly declined to a few hundred metric tons after the late 1980s [7,14]. Since the 2010s, pollock has ceased to be a commercial fishery resource in Korea, as catches fell below one metric ton [7,15,16]. To determine the cause of changes in catches of fisheries, it is essential to consider the simultaneous impacts of human activities such as overfishing and changes in the physical environment of habitats and spawning grounds. Recent studies aiming to understand the fluctuations in pollock catch have focused on changes in the oceanic and biological conditions around spawning grounds [9,17].
Donghan Bay (DB) in North Korea is the primary spawning ground for pollock in Korean waters [11,18]. Pollock aggregate to spawn during winter, from January to March, and the eggs released during this period remain in the surface layer [19,20]. The optimal spawning temperature associated with low mortality typically falls within the 2–5 °C range in the continental shelf area [9,21,22,23]. Following hatching, juvenile pollocks move from their vertical distribution to deeper layers as they grow [24,25], and their dietary preferences evolve, transitioning from mesozooplankton to mesopelagic fish, as evidenced by stomach content analysis [26,27]. Larger pollocks are generally found in deep water, characterized by consistently cold temperatures (below 5 °C) with minimal seasonal variation [28,29,30].
The collapse of pollock stocks poses a significant concern in the conservation and management of fishery resources, given its importance in commercial fisheries. Understanding the underlying causes and mechanisms of this collapse is crucial to mitigate the risk of further collapses in other fishery species. Previous studies have posited that overfishing and environmental changes in habitats due to climate change are the primary drivers of changes in pollock stocks. Three potential hypotheses have been suggested to elucidate the collapse of pollock stocks in Korean waters: (1) overfishing during periods of high biomass [11]; (2) ocean warming in their habitat grounds [7,9,10]; and (3) food availability impacting growth, survival, and recruitment [31,32]. However, these hypotheses are primarily based on simple correlation analyses of individual parameters affecting changes in total pollock catch, such as water temperature and zooplankton biomass [29]. Additionally, these hypotheses lack ecological information, such as size and sex composition, for each period. To gain a more comprehensive understanding of the drivers behind changes in fishery resource biomass, it is imperative to consider varying responses to oceanic conditions and overfishing at each life stage and their corresponding mechanisms [7,10,30].
To address this knowledge gap, this study aimed to analyze the responses of pollock stocks to changes in oceanic conditions in both spawning and habitat grounds and assess the impact of these ecological responses at each life stage on the collapse of pollock stocks. Our specific objectives were to: (1) identify the effect of spatial and temporal changes in the spawning ground; (2) analyze long-term shifts in ecological responses to oceanic conditions in the habitat using a long-term dataset (1970s, 1980s, 1990s, and recent years) that includes biological information on Korean pollock; and (3) investigate the causes underlying the accumulation of caught juvenile pollock and their effects on pollock resources. Based on our findings, we evaluated the potential mechanisms and causes underlying the collapse of pollock stocks in Korean waters.

2. Materials and Methods

2.1. Pollock Statistical Data

Long-term changes in the catches of adult and juvenile pollocks were estimated using data from the Korean statistical yearbook (Korean Statistical Information Service; KOSIS; https://kosis.kr/eng/ (accessed on 5 January 2023)). This yearbook does not provide information on the size of individual pollocks, and data on juvenile pollock catches are available only for 22 years, spanning from 1975 to 1997. Prior to 1975, pollock catch data were not categorized by age, and post-1997, fishing for juveniles was prohibited to preserve resources. Using this dataset, a correlation coefficient with a time lag was analyzed to ascertain the relationship between changes in adult and juvenile pollock catch.

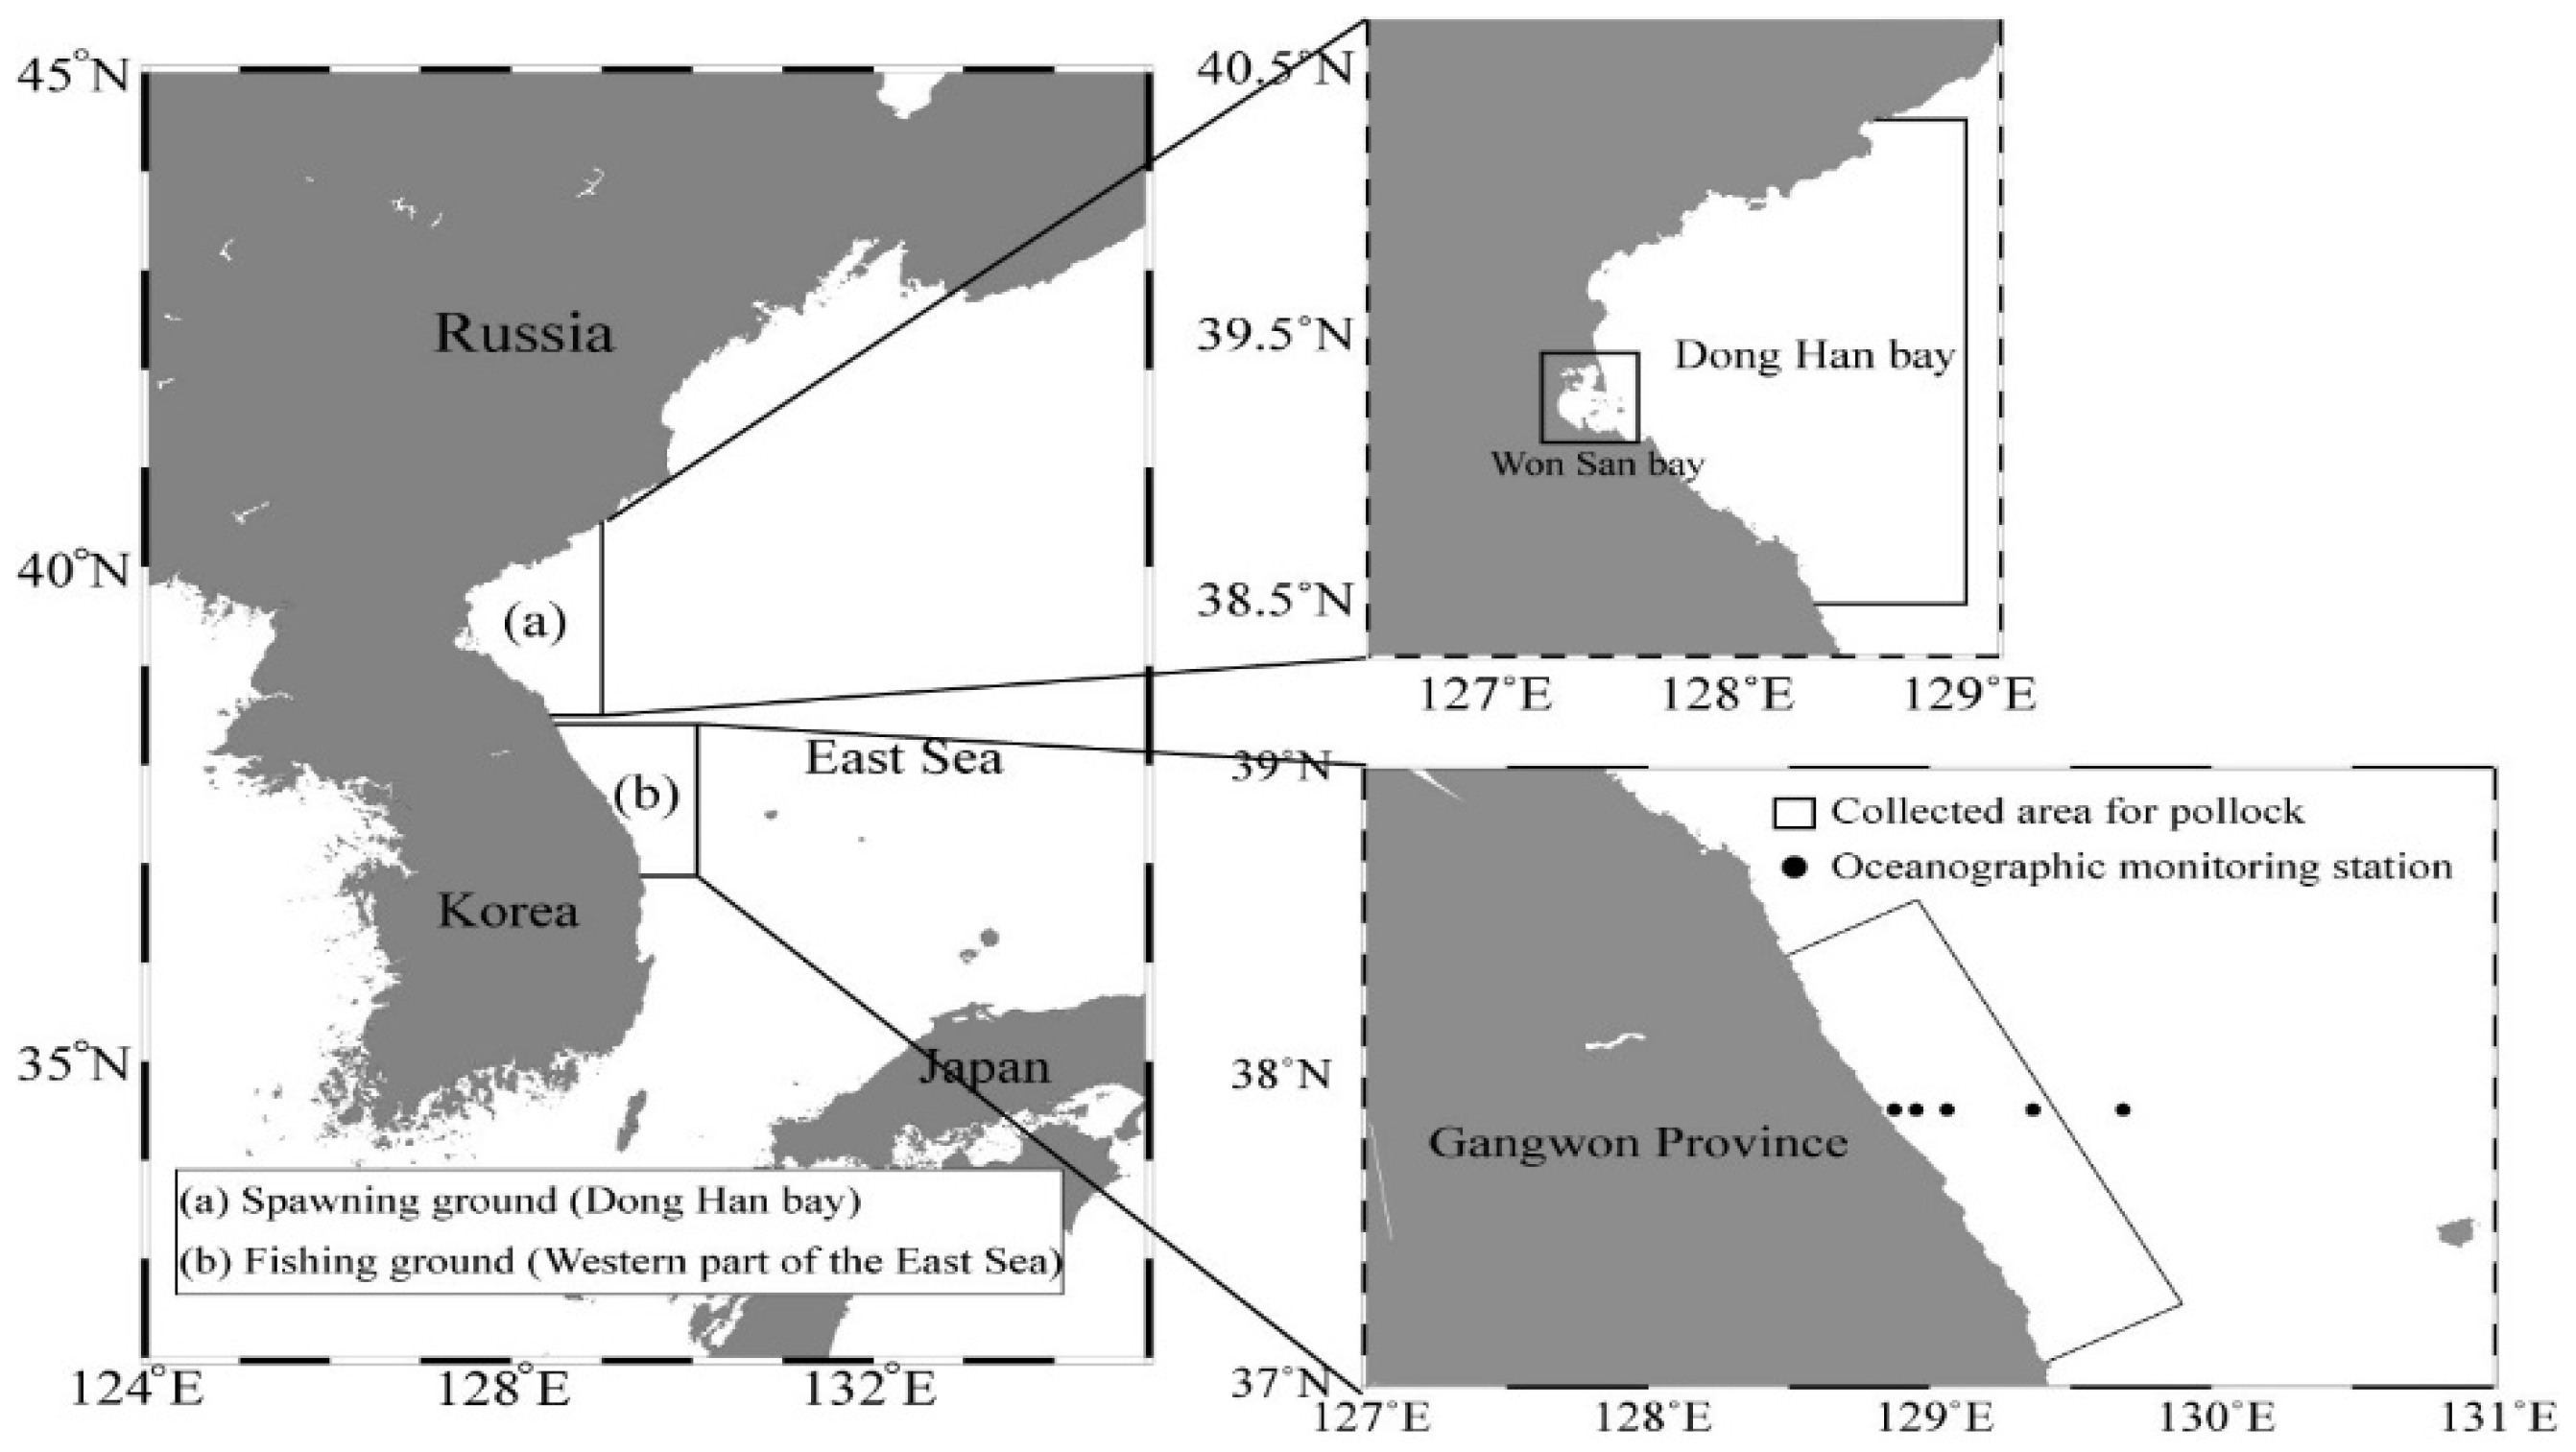
2.2. On-Site Pollock Catch Data around the Main Fishing Ground in Korean Waters

Pollock sampling was conducted in the mid-eastern waters of Korea (Figure 1) during the winter months (January to March). Samples were collected using gill net fishery techniques over four distinct periods by the National Institute of Fisheries Science (NIFS): Period A (1973–1979), Period B (1980–1985), Period C (1991–1995), and Period D (2016–2018) (Table 1 and Appendix A). The total lengths (TL) and weights of the specimens were measured to the nearest 0.1 cm and 0.1 g, respectively (Figure 2). To determine changes in the catch ratio between adult (≥37 cm) and juvenile (<37 cm) pollock during each time period, a total length (TL) of 37 cm was adopted as the standard for differentiation [14,33]. To compare the differences in the biological condition between each period, the condition factor was calculated for each period using the formula: K = 100 W/L3 [34], where W and L represent body weight (g) and total length (cm), respectively. The age of the pollock was estimated using: Age = (−Ln((654−TL × 10)/654) − 0.0555716)/0.223 [35].

2.3. Long-Term Changes in Oceanic Conditions around Spawning and Fishing Grounds

In situ observation data and satellite data were used to examine long-term trends in oceanographic conditions of fishing and spawning grounds. Oceanic conditions in the DB located in North Korea were obtained using satellite data sets for the periods from 1982 to 2022, while oceanic conditions in the fishing grounds located in the western part of the East Sea were acquired through in situ observation data for the periods from 1973 to 2018. The climate regime shift (CRS) that occurred in the late 1980s was associated with a step change in oceanic and atmospheric conditions in the Northern Hemisphere, such as the Arctic Oscillation (AO), Siberian High Pressure (SH), East Asian Winter Monsoon (EAWM), and El Niño-Southern Oscillation (ENSO). This shift is noted in graphs depicting longer-term changes in oceanic conditions and pollock catch [7,36,37,38].
The sea surface temperature (SST) around DB, recognized as a spawning ground for pollock in Korean waters, was analyzed using data from 1982 to 2022 from the Operational Sea Surface Temperature and Sea Ice Analysis (OSTIA) [39]. OSTIA provides daily global-scale sea surface temperature and sea ice data in a 0.05° lattice, which are reanalyzed for public consumption based on field observations of the International Comprehensive Ocean-Atmosphere Data Set (ICOADS) [40] and data from the Advanced Very High-Resolution Radiometer (AVHRR) (http://www.nodc.noaa.gov/SatelliteData/ (accessed on 5 January 2023)) as well as from Along-track Scanning Radiometer (ATSR) (http://neodc.nerc.ac.uk/ (accessed on 5 January 2023)). Most pollock spawn between January and March, with the eggs remaining in the surface layer after release as pelagic eggs [16,41]. The suitable temperature range for spawning grounds falls between 2–5 °C, considering the known optimal spawning temperature [21] and its correlation with low mortality [9,10,17,22,23]. Hence, changes in the spatiotemporal distribution of the spawning grounds were estimated using the following methods: (1) Assessing changes in the duration of suitable temperature (2–5 °C) for spawning (DTS) and its horizontal distribution at each decade using daily SST data, and (2) Analyzing long-term changes in the regional proportion for suitable spawning conditions (2–5 °C) (RPS) relative to the total area of DB.
To assess the long-term changes in oceanic conditions in the western part of the East Sea, recognized as a fishing ground for pollock in Korean waters (Figure 1), water temperature data from five fixed stations during winter (February) were collected from the Korea Oceanographic Data Center at the NIFS (https://www.nifs.go.kr/kodc/index.kodc (accessed on 10 March 2023)). This water temperature data is provided by year and standard depth (0 m, 10 m, 20 m, 30 m, 50 m, 75 m, 100 m, 125 m, 200 m, 250 m, 300 m, 400 m, and 500 m), and the water temperature in February during each period (period A, B, C, and D) was averaged by depth. Specifically, long-term changes in water temperature were analyzed in the upper layer (up to 100 m), intermediate layer (100–300 m), and bottom layer (greater than 300 m) to determine the relationship between changes in the water column structure and the size composition of pollock.

3. Results

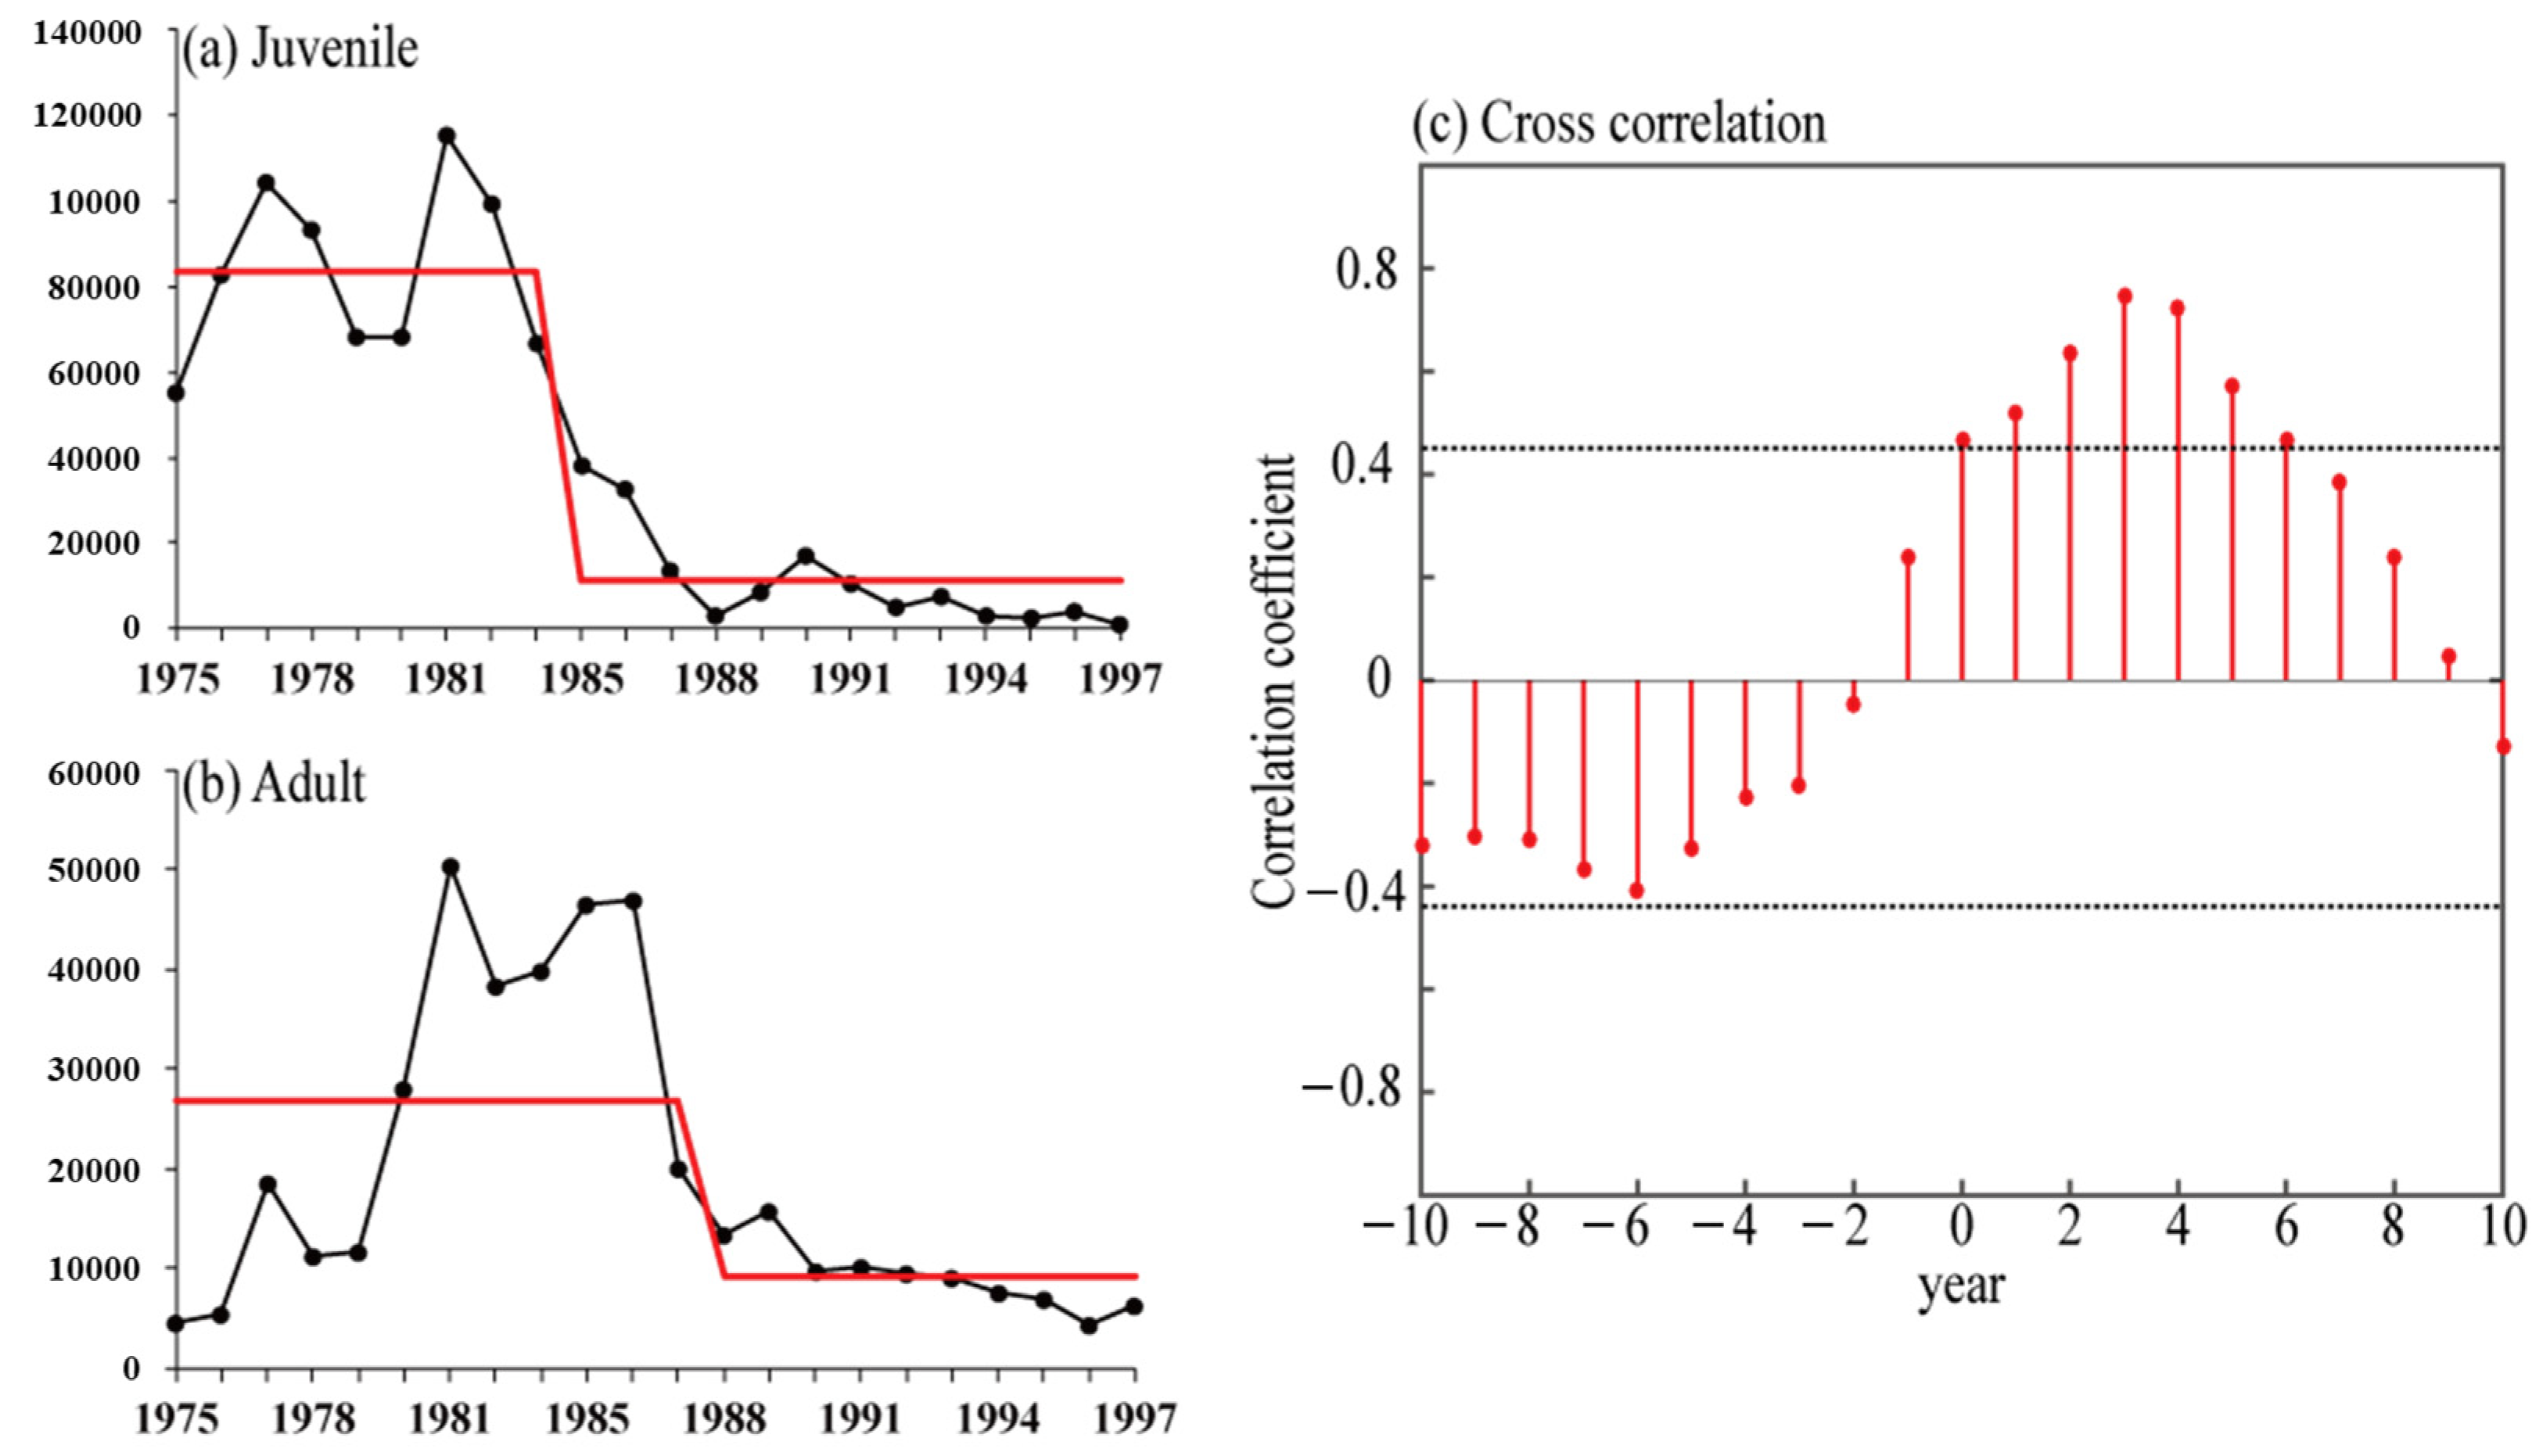
3.1. Long-Term Changes in Catches of Juvenile and Adult Pollock

Long-term changes in the total catch of pollocks, based on the statistical yearbook, indicate a distinct regime shift. However, juvenile and adult pollocks exhibited different regime-shift timings (Figure 3). For juveniles, the total catch averaged 83,000 metric tons from 1975 to 1983. After 1984, it decreased rapidly to 11,000 metric tons (Figure 3a). Conversely, the total catch of adult pollock diverged from that of juveniles and has shown a decreasing trend since the late 1980s (Figure 3b). The correlation coefficient between juvenile and adult pollock catches suggests that fluctuations in juvenile pollock catches precede those in adult pollock catches by 3–4 years (Figure 3c). Thus, the high fishing pressure on juveniles was closely associated with decline in pollock resources. Additionally, sudden changes in oceanographic conditions of habitats and spawning grounds, combined with the effects of fishing pressure on immature fish, may further exacerbate the decline in pollock resources.

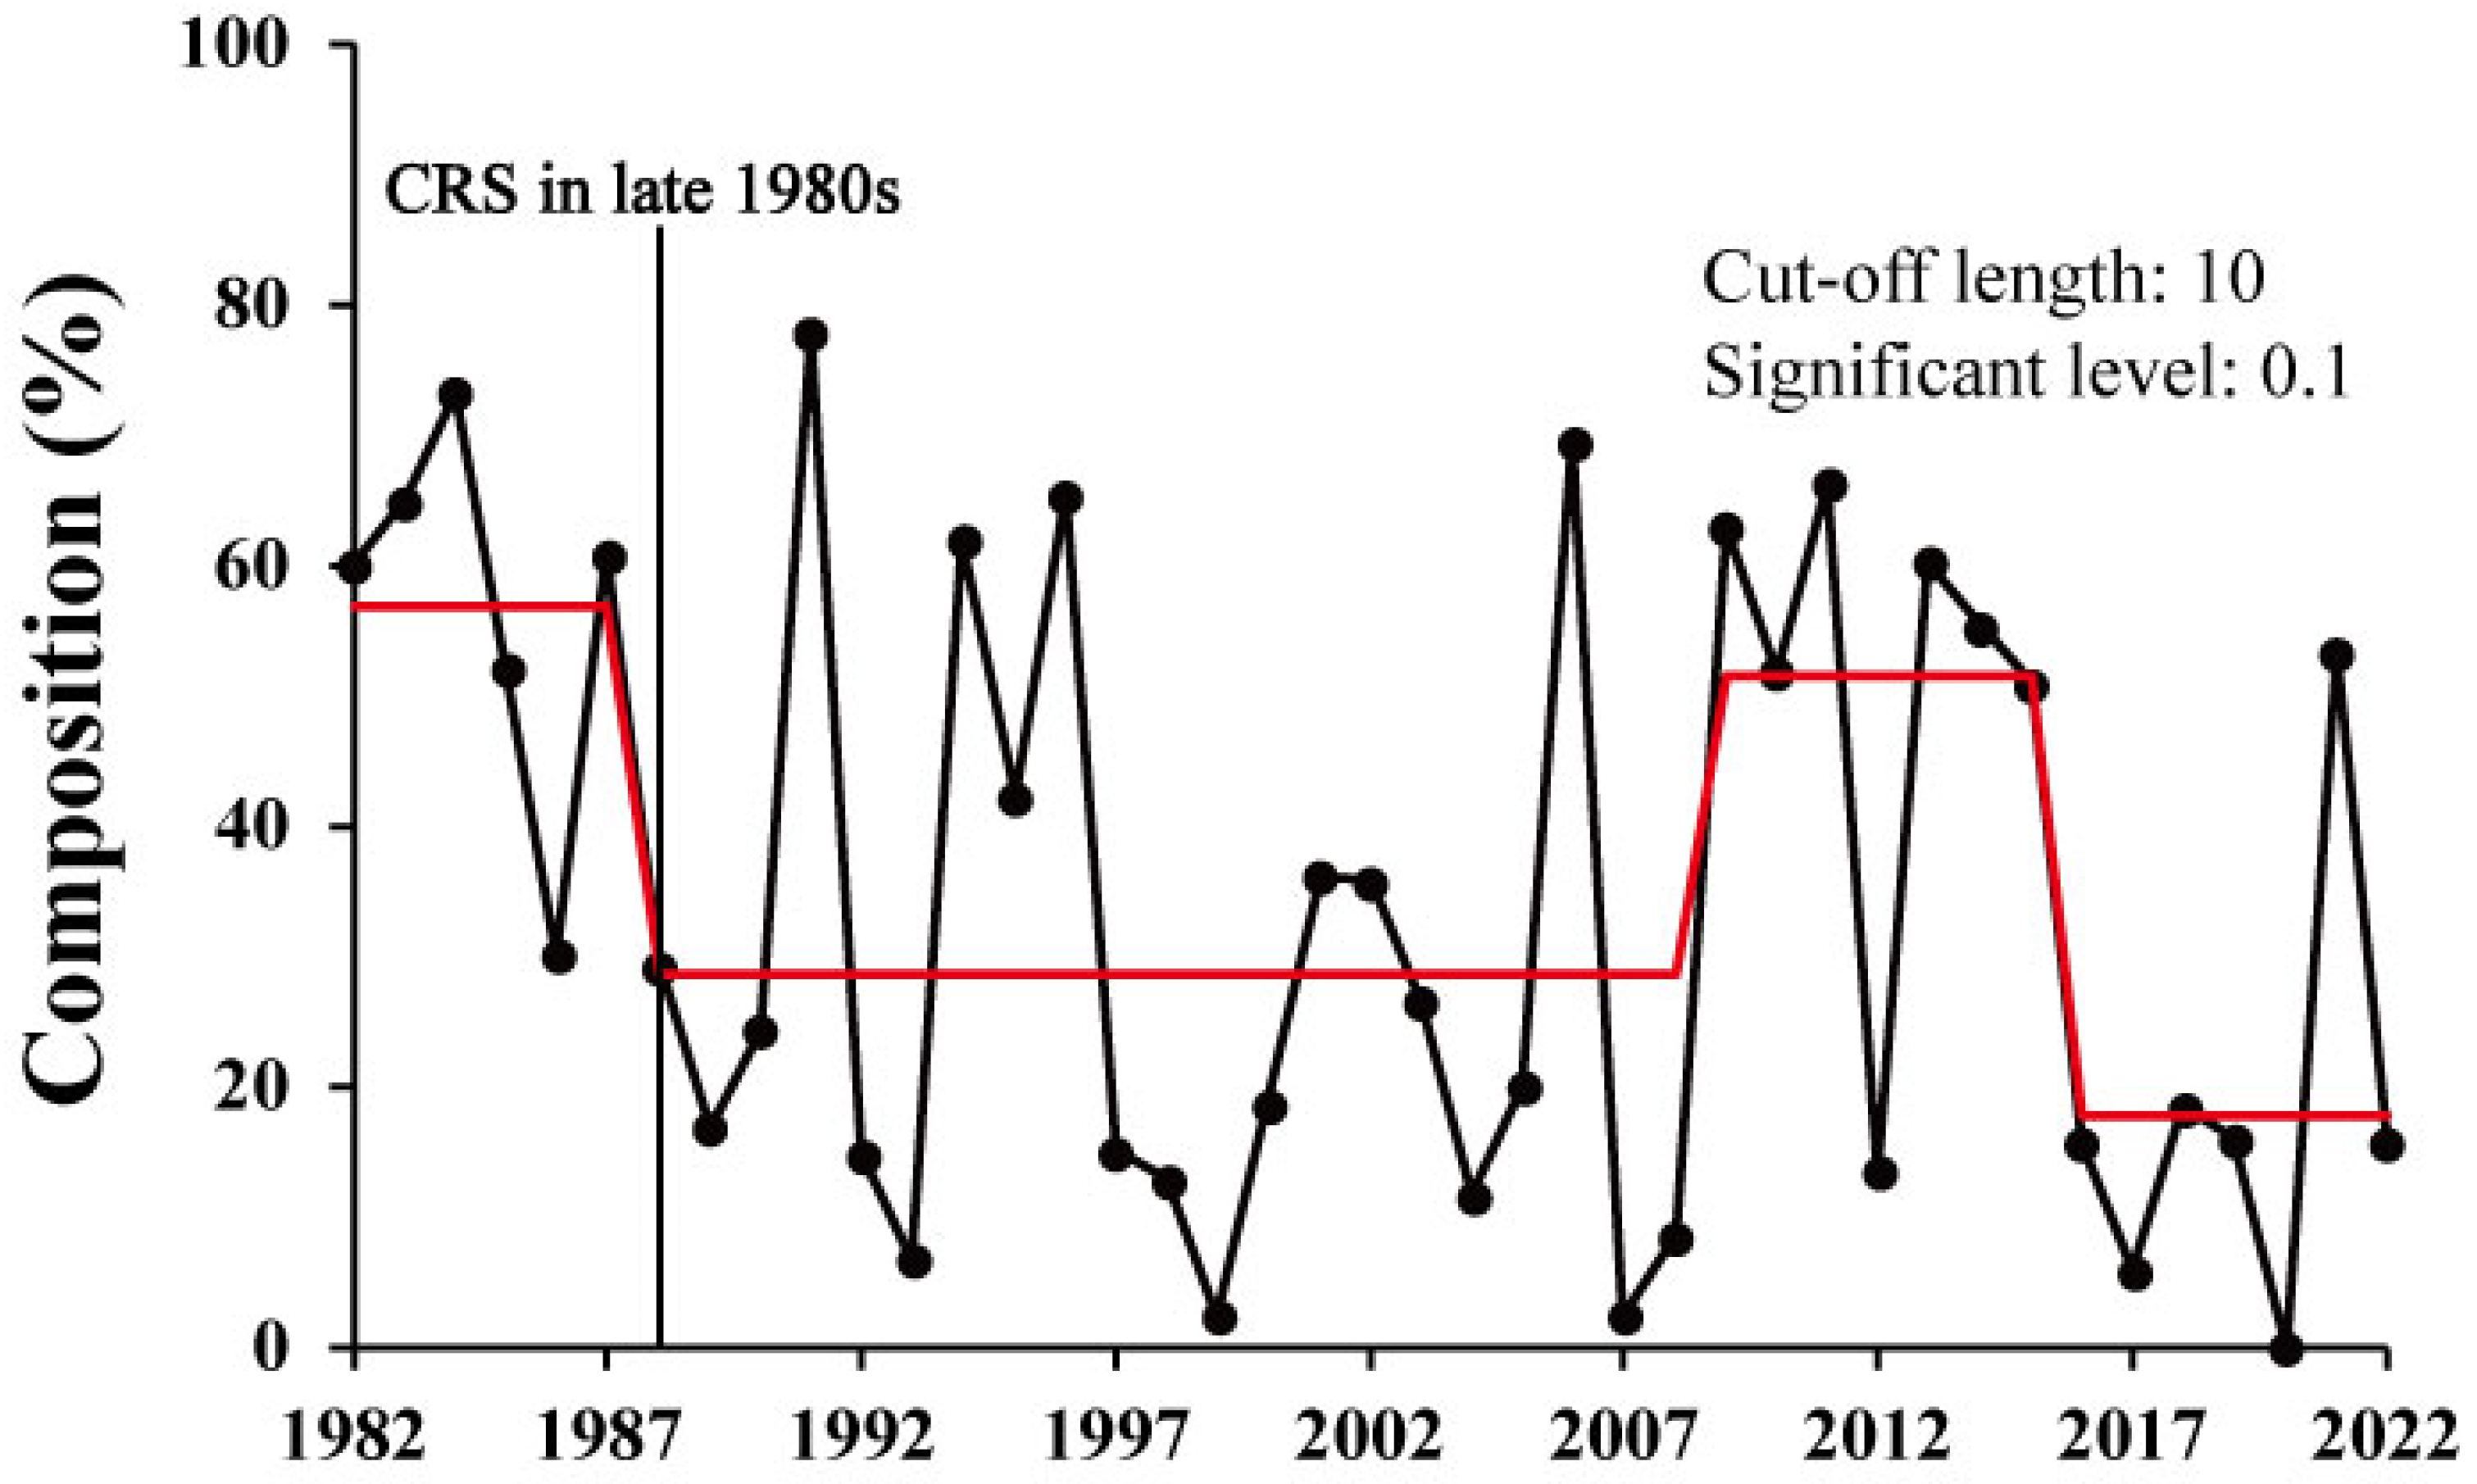
3.2. Long-Term Changes in the Sex Composition of Pollock

Long-term changes in the composition of juvenile and adult pollocks exhibited diverse patterns across different periods (Figure 4). Notably, the composition of females in the adult group remained consistently higher than that in the juvenile group throughout most of the experimental period (Figure 4). However, during certain periods, such as period C, the proportion of females in the adult group was notably lower compared to other periods (Figure 4). While the proportion of females in the juvenile group was relatively higher than that of males, females did not constitute a large proportion of the adult group (Figure 4).

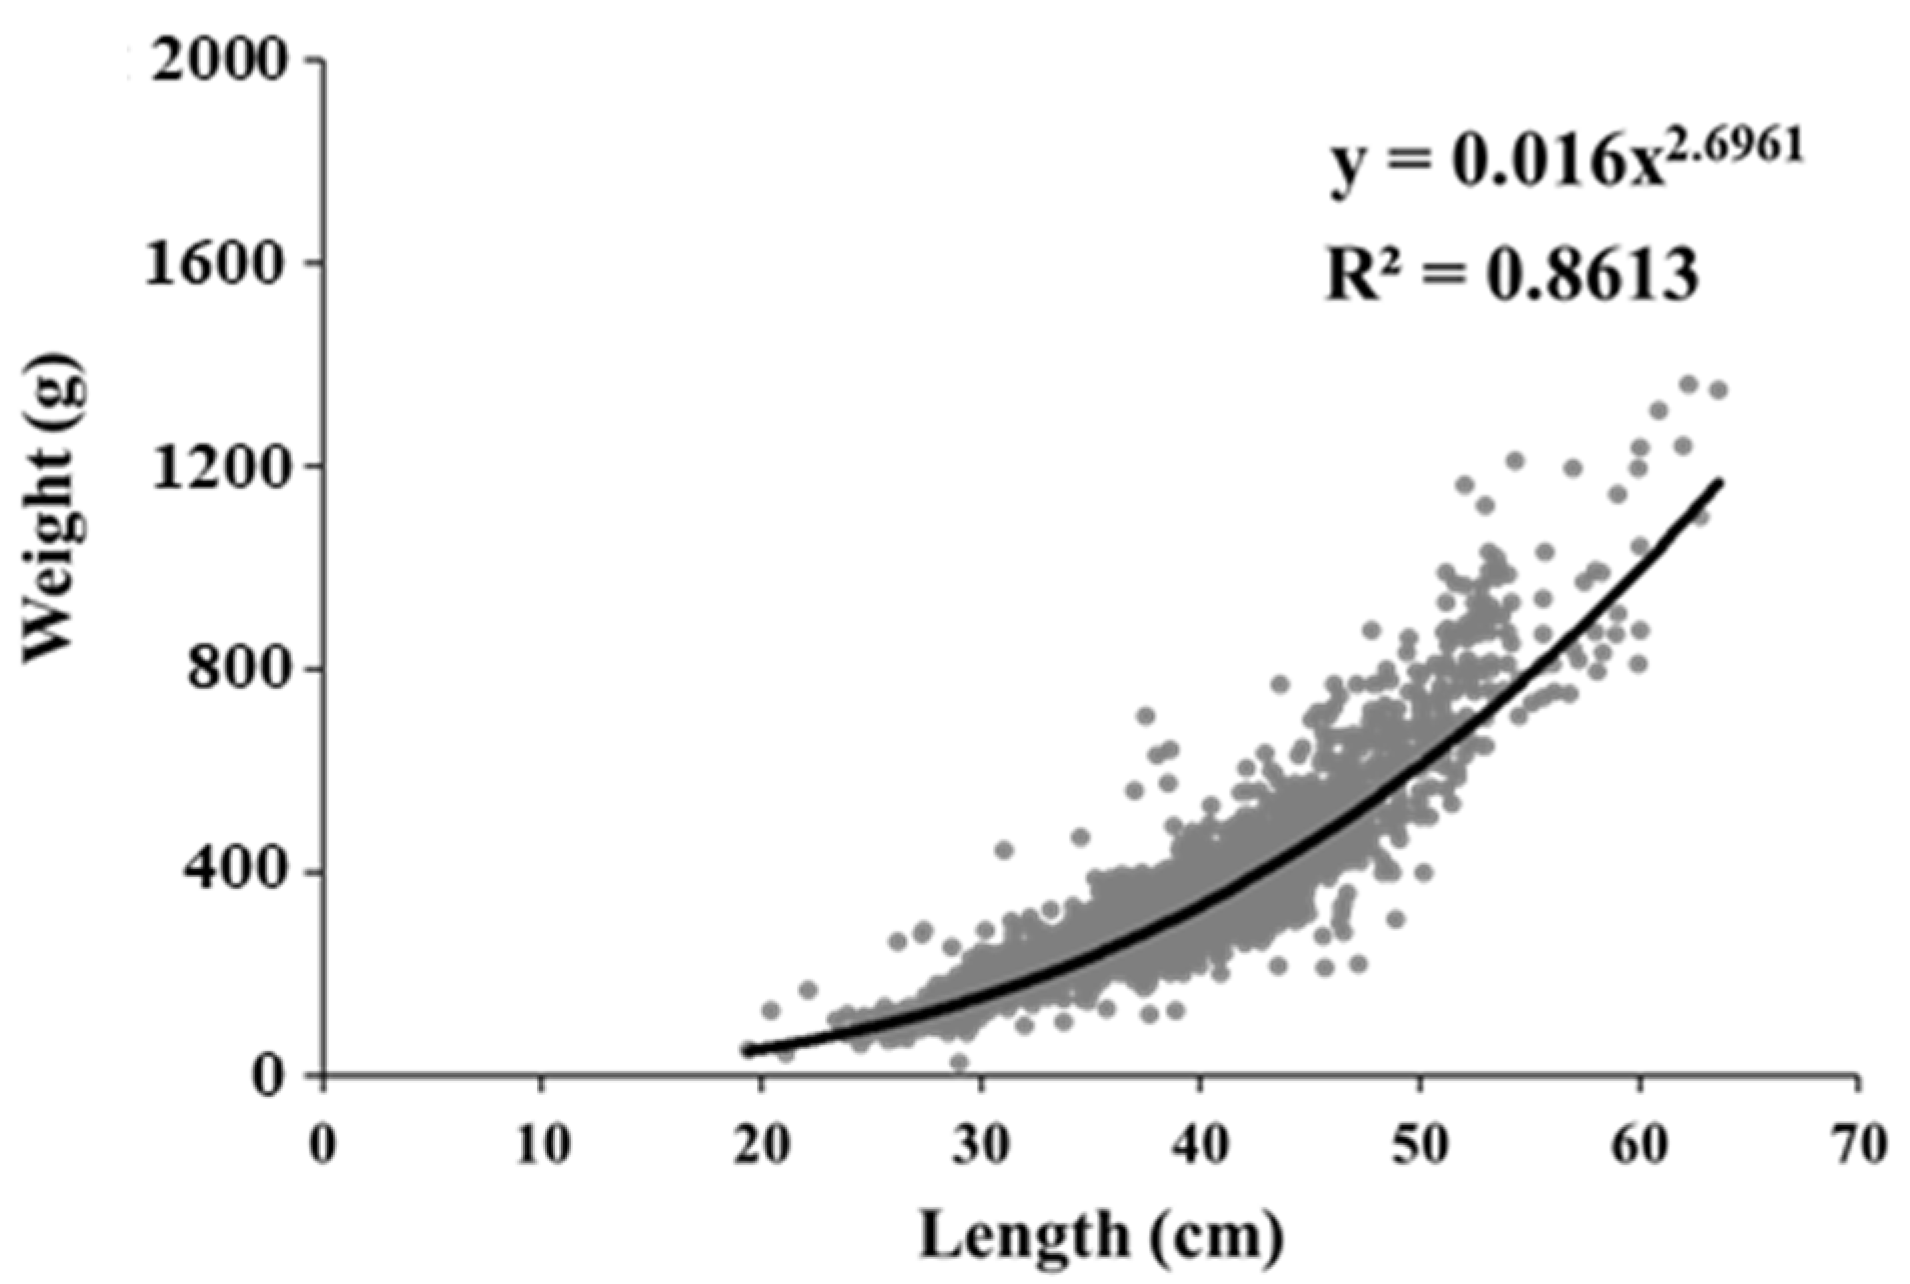
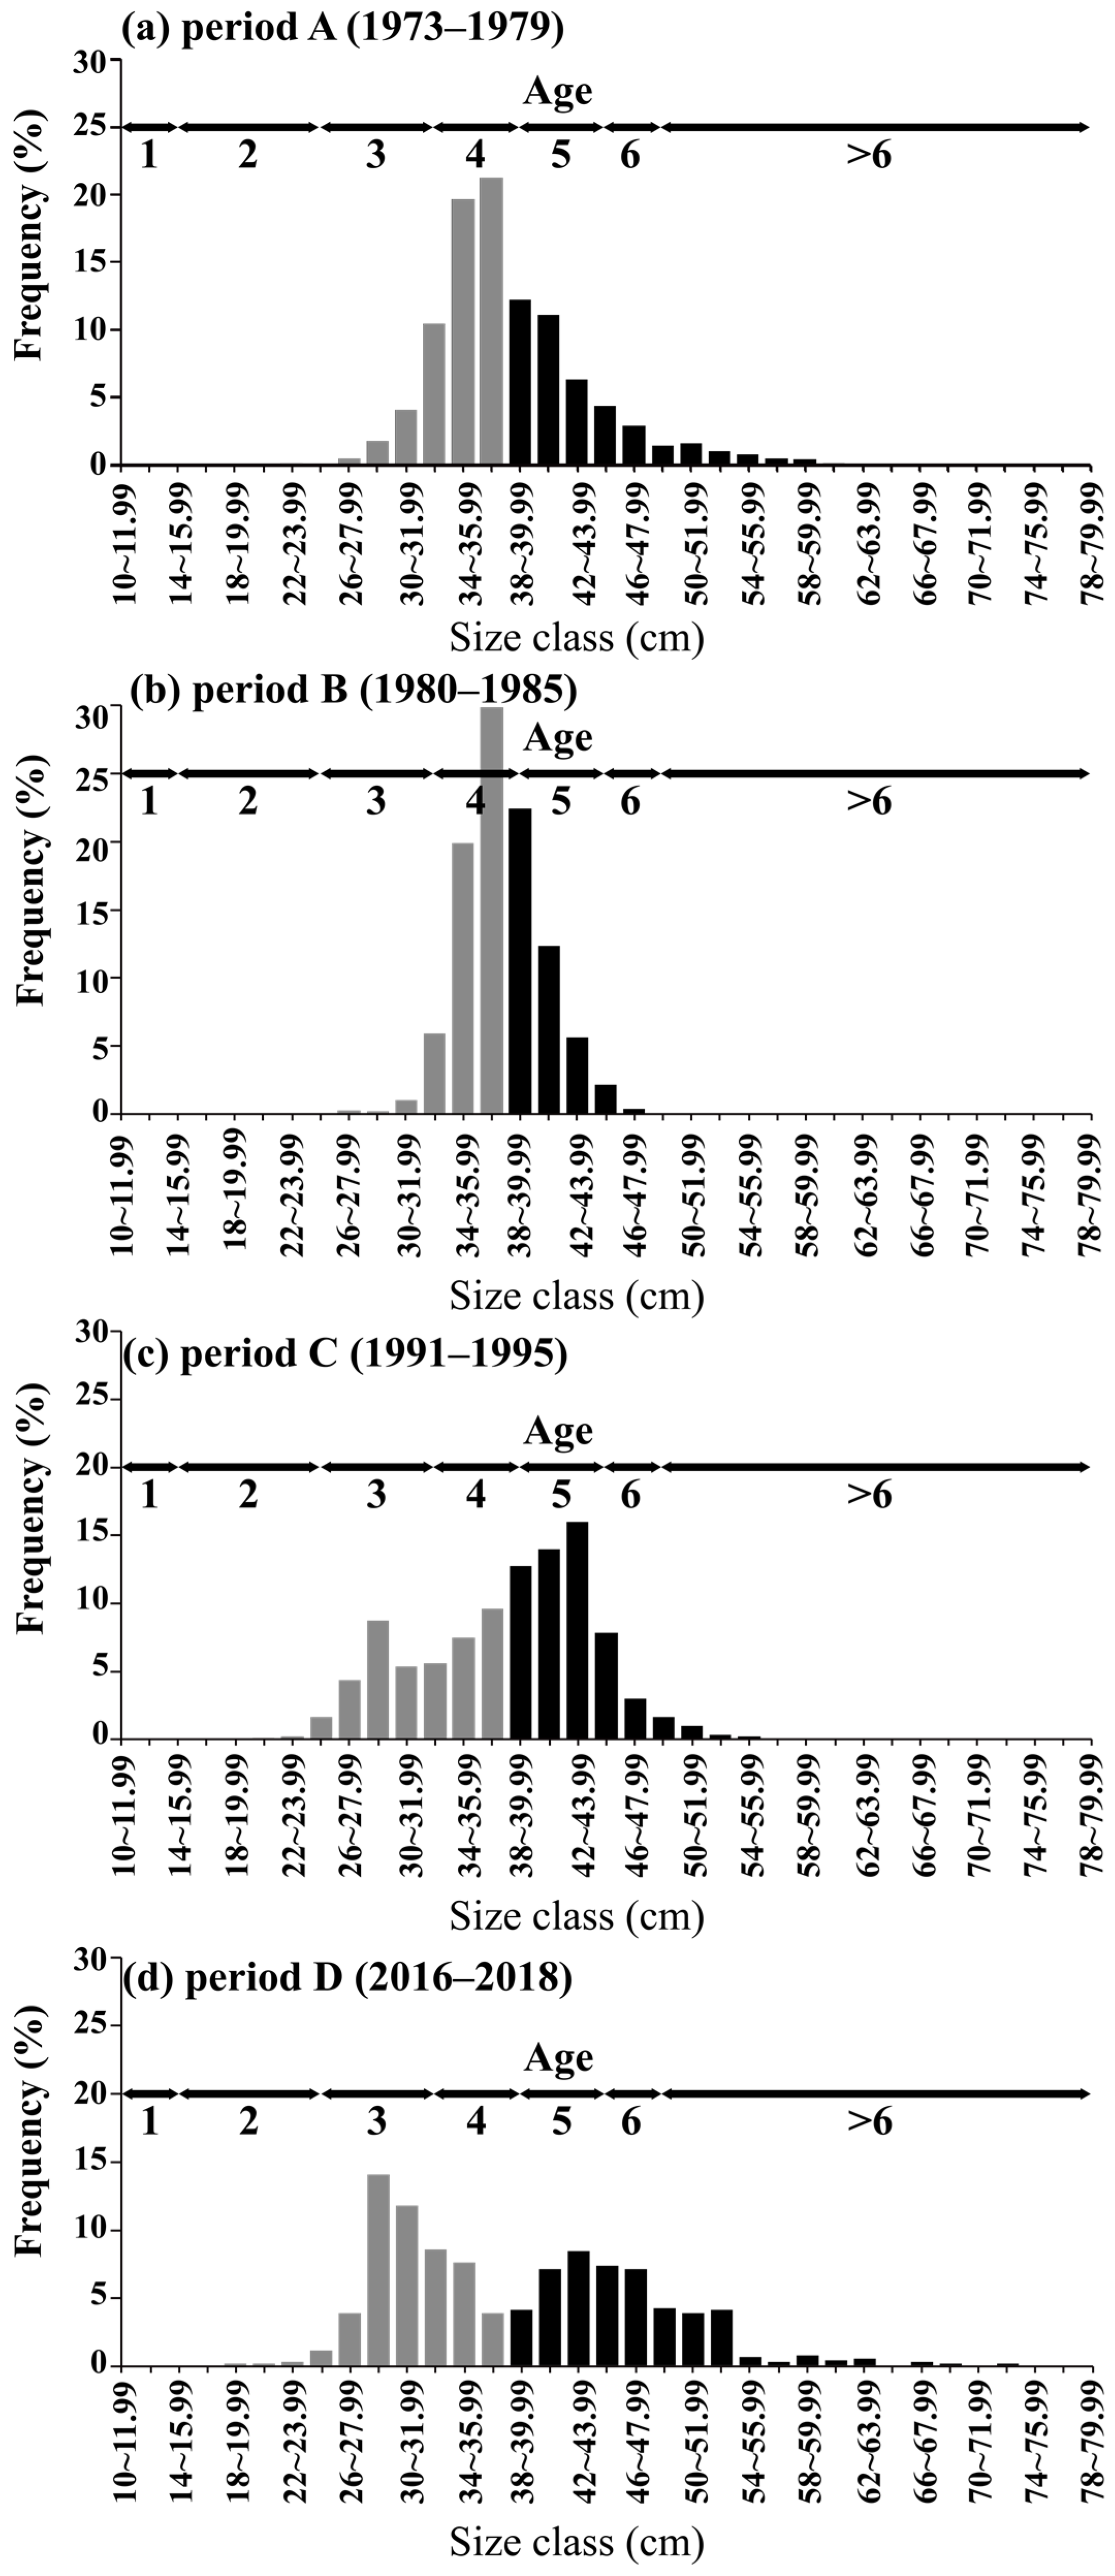
3.3. Long-Term Changes in the Size Spectrum and Condition Factor of Pollock

Long-term changes in the size composition exhibited distinct patterns during each period (Figure 5). During Period A, juveniles accounted for 57.7% of the population, whereas adults comprised 42.3%. Notably, the size composition exhibited a single-peak curve, with the highest representation observed in the 34–37 cm size group (41%) (Figure 4). In Period B, a similar trend was observed, with a higher proportion of juveniles (57.1%) than adults (42.9%). A single-peak curve characterized the size distribution, with the most significant proportion found in the 36–39 cm size range (52.2%). However, in Period C, a different pattern emerged compared to Periods A and B. The proportion of juveniles decreased by 43.2%, whereas that of adults increased by 56.8% (Figure 5). The size spectrum displayed a bimodal curve with peaks at 28–29 cm (8.8%) and 42–43 cm (16.1%). Finally, during Period D, the composition of juveniles and adults became more balanced, with juveniles representing 51.1% and adults representing 48.9% of the population. The size distribution exhibited a bimodal curve with peaks at 28–31 cm (25.8%) and 40–43 cm (15.5%) (Figure 5). Additionally, the proportions of individuals smaller than 30 cm and larger than 50 cm was 19.4% and 10.8%, respectively, which were higher than those of other periods (Figure 5).
The condition factor, a metric reflecting both the weight and length of pollock and serving as an indicator of energy storage, provided insights into the biological state of pollock over time (Figure 6). Across Periods A, B, and C, the condition factor remained relatively stable, exhibiting consistent values ranging from K = 0.51 to 0.53 and standard deviations from 0.8 to 0.1. Notably, Period B stood out with the lowest recorded value of 0.51, indicating potential fluctuations in the energy reserves of the pollock during that period (Figure 6). However, in Period D, there was a slight increase in the condition factor, with a rise to K = 0.6, suggesting a potential improvement in the biological condition of the pollock. This increase was accompanied by a maintained standard deviation of 0.1, indicating a consistent trend within the observed data (Figure 6).

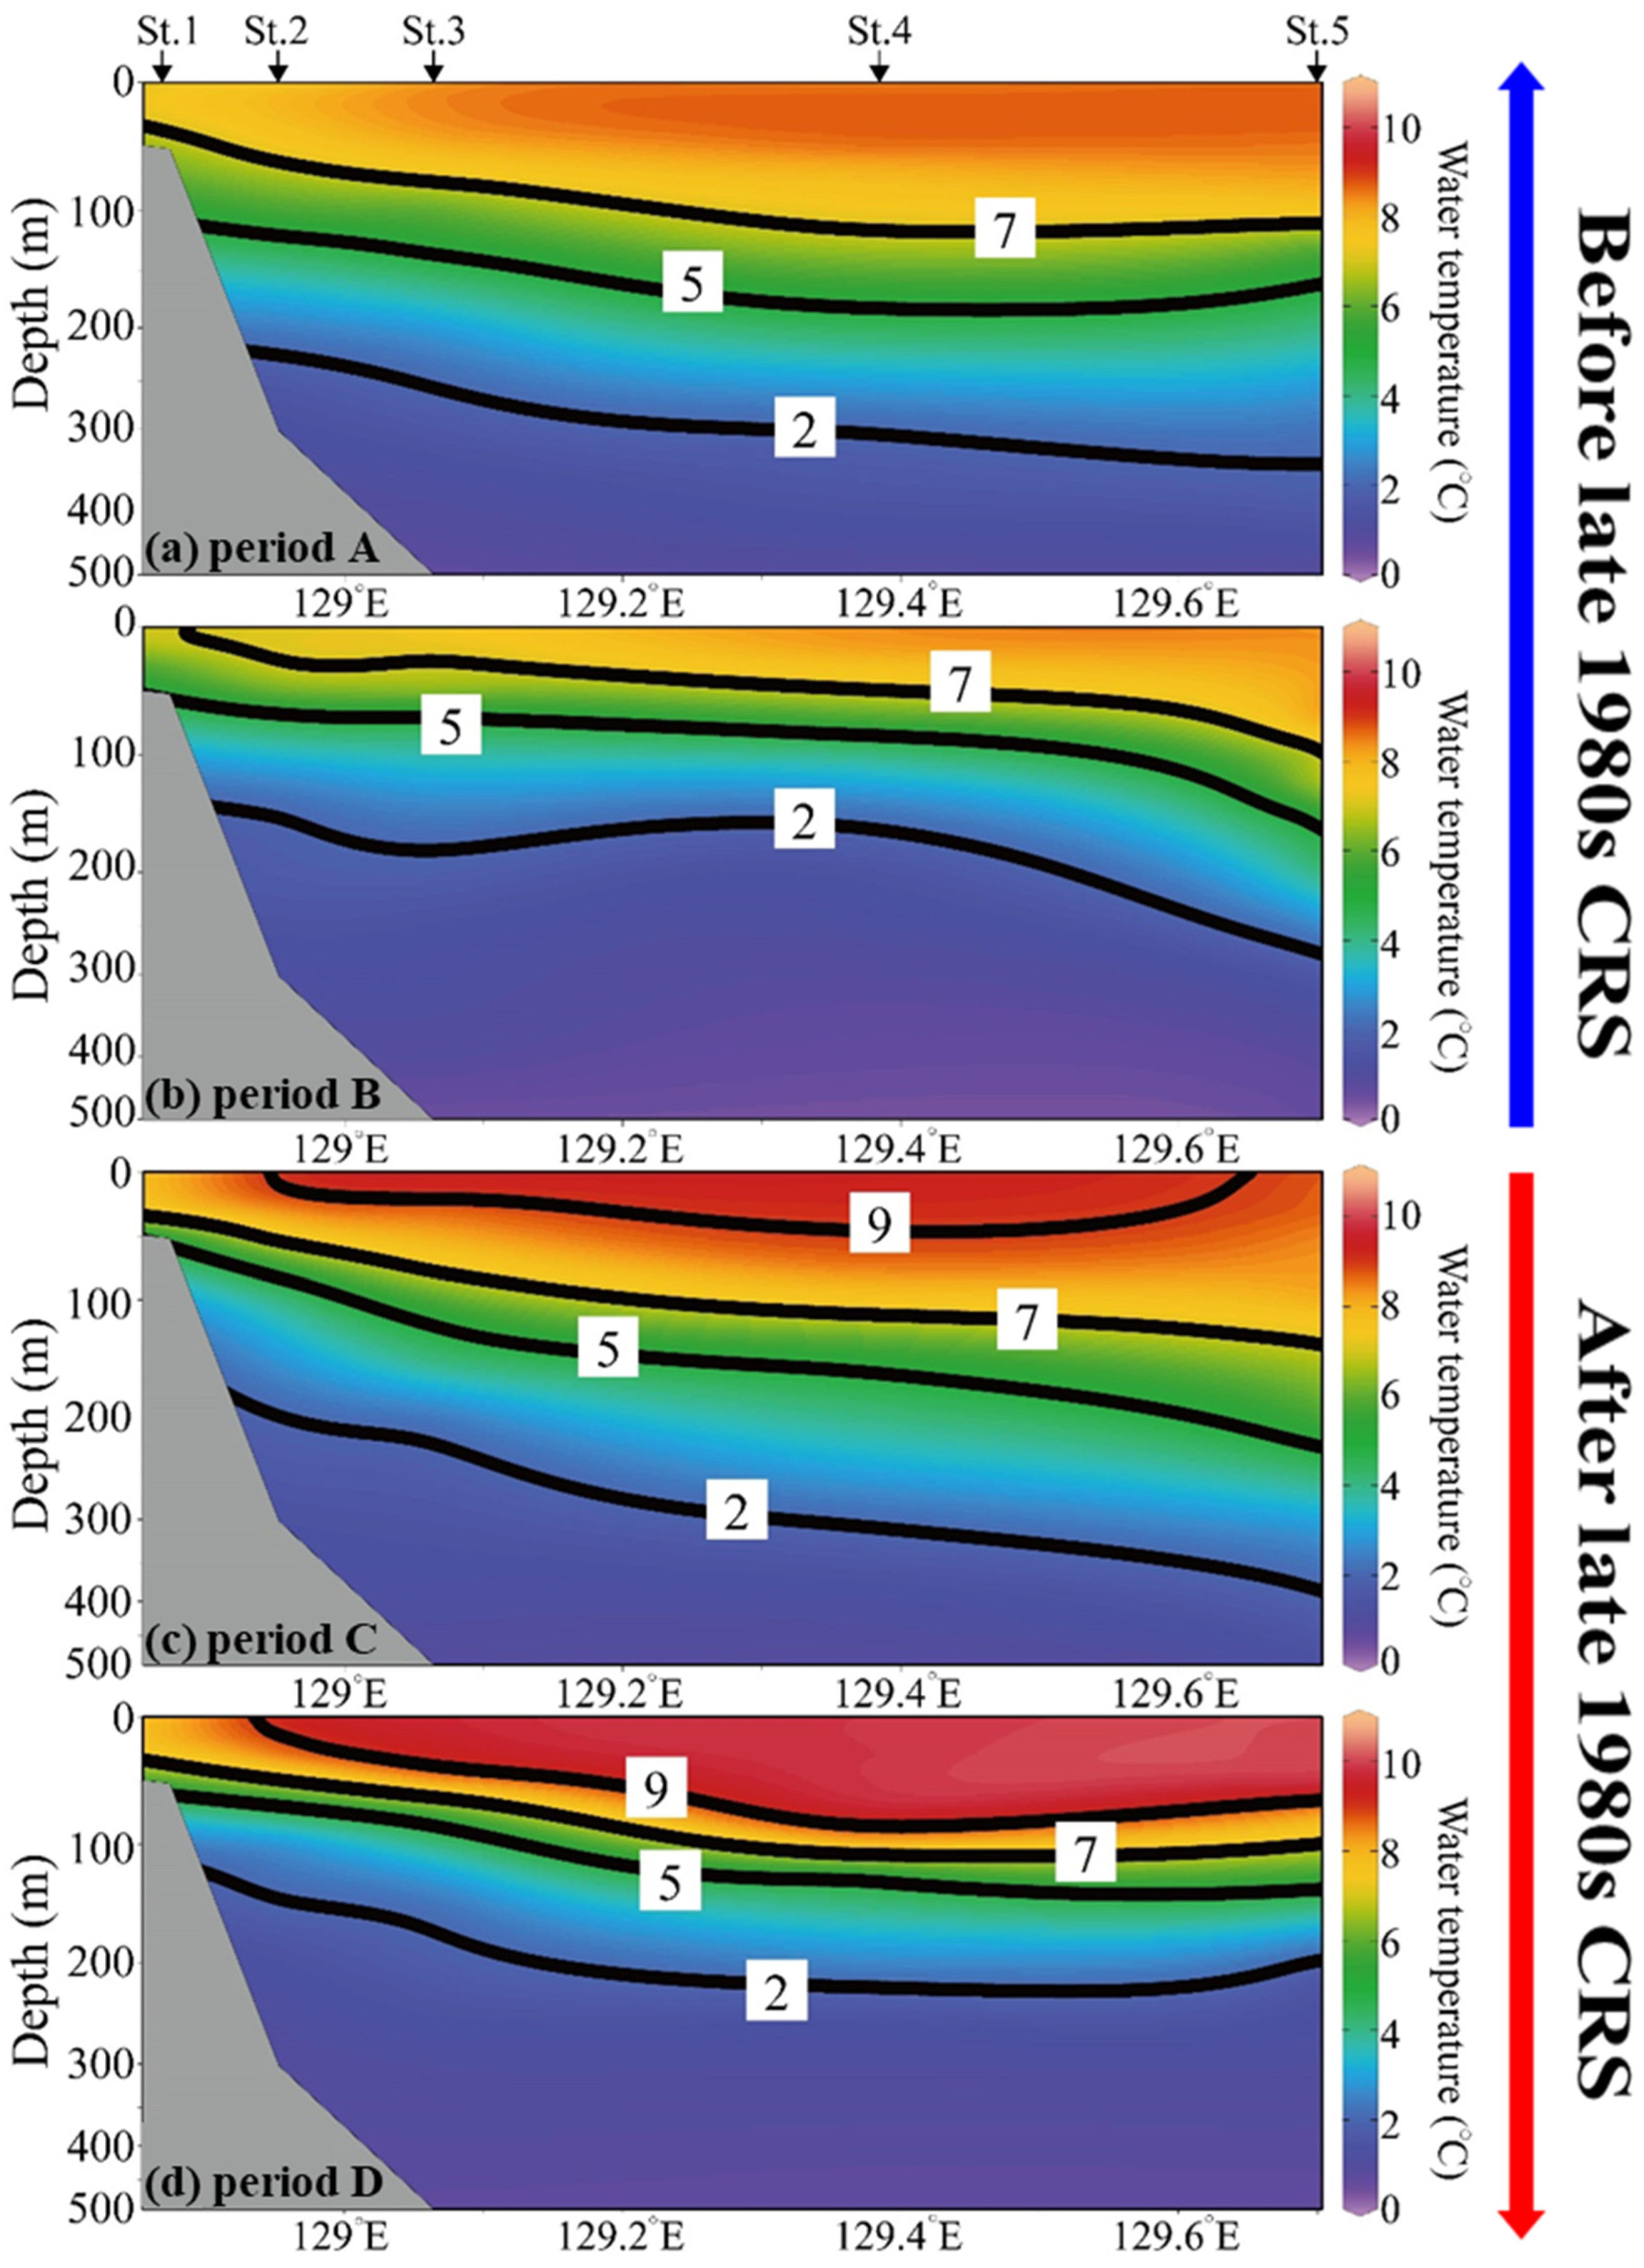
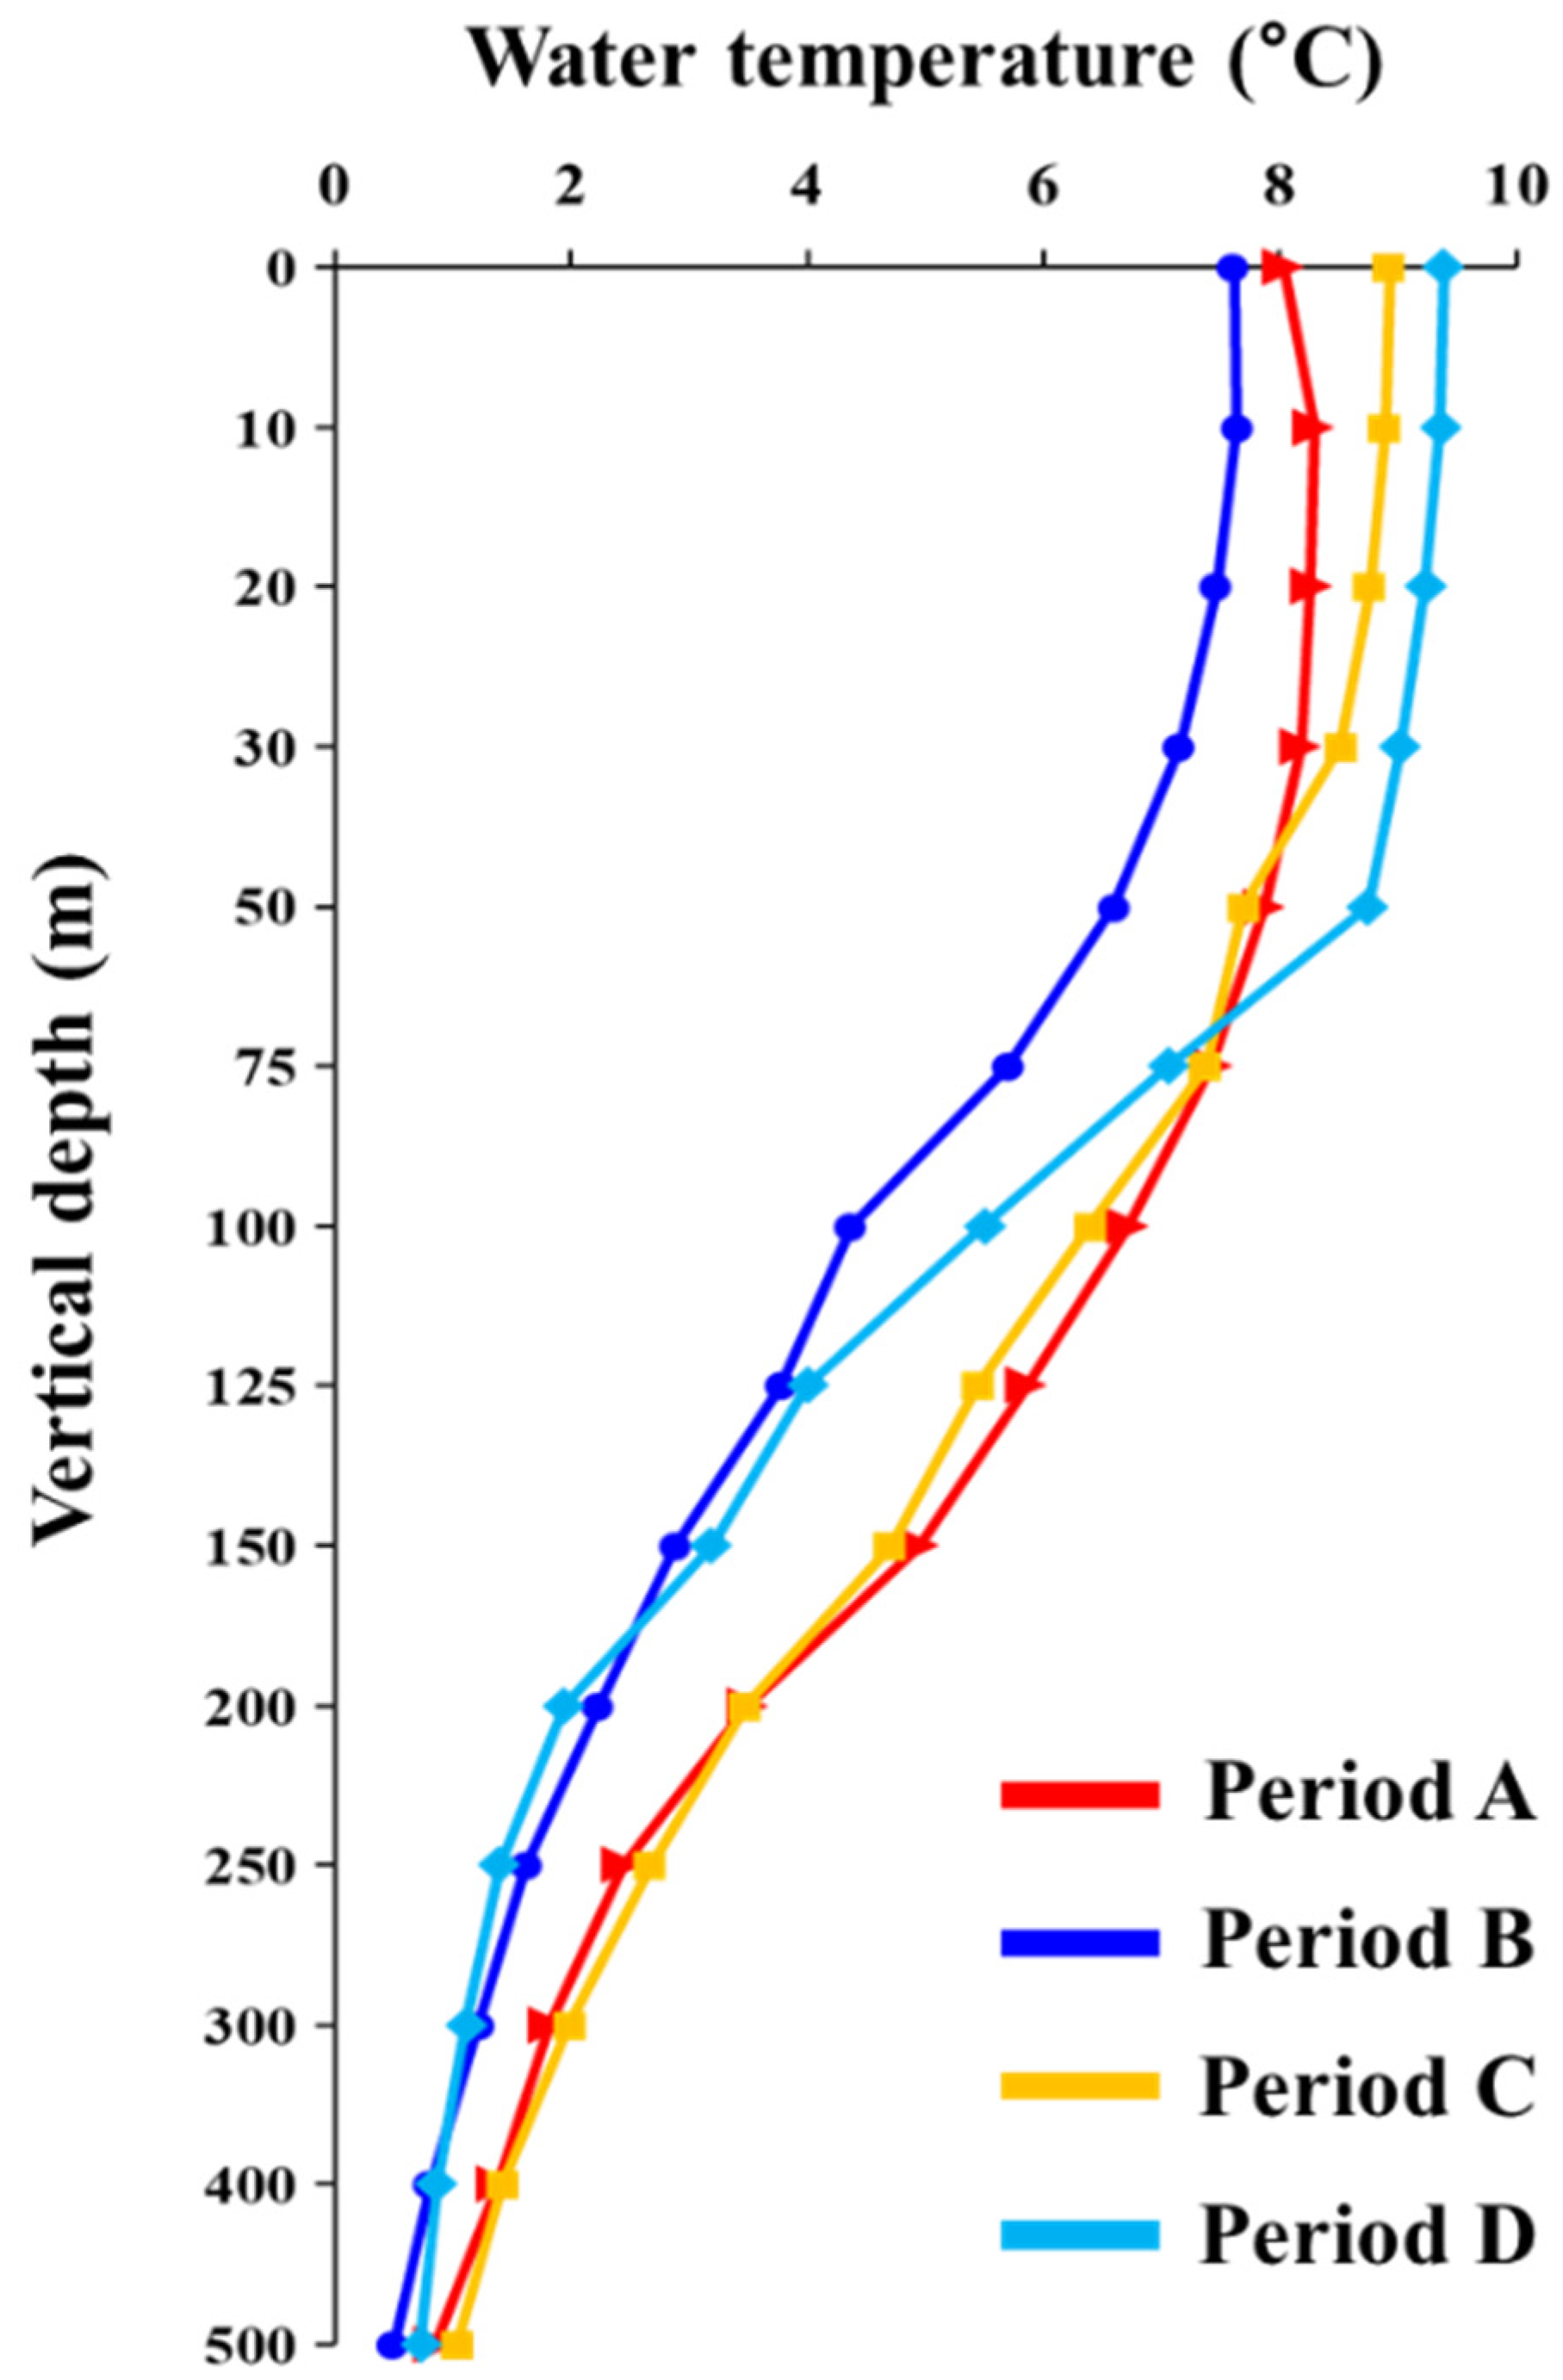
3.4. Water Temperature Structure in the Western Part of the East Sea

In the western part of the East Sea, the vertical water temperature structure varied across different time periods, showing distinctive patterns in the changes in the intensity of stratification and the temperature difference between the upper layer (0–100 m) and intermediate layer (100–300 m) during each period (Figure 7).
During Period A, the water temperature in the upper layer ranged from 5.9 to 8.8 °C, with average temperatures of 7.5 °C in the coastal area and 8.4 °C in the offshore area (Figure 7a). In the intermediate layer, the water temperature ranged from 1.4 to 6.8 °C, with average temperatures of 3.1 °C in the coastal area and 4.3 °C in the offshore area (Figure 7a). In Period B, the water temperature in the upper layer exhibited a greater decrease (3.5–8.4 °C) compared to Period A, with average temperatures of 6.2 °C in the coastal area and 7.5 °C offshore (Figure 7b). The intensity of stratification was weaker than that in Period A, and the water temperature in the intermediate layer was the lowest among all periods (Figure 7b). In the intermediate layer, the water temperature ranged from 0.9 to 6.5 °C, with average temperatures of 1.9 °C in the coastal area and 2.8 °C offshore (Figure 7b). During Period C, the water temperature in the upper layer increased rapidly (4.0–9.3 °C) compared to Period B, with average temperatures of 7.7 °C in the coastal area and 8.7 °C offshore (Figure 7c). The intensity of stratification was stronger than that in Period B. In the intermediate layer, the water temperature ranged from 1.4 to 7.2 °C, with average temperatures of 2.6 °C in the coastal area and 4.7 °C offshore (Figure 7c). In Period D, the water temperature in the upper layer ranged from 2.7 to 10.1 °C, with average temperatures of 7.6 °C in the coastal area and 9.5 °C offshore (Figure 7d). In the intermediate layer, the water temperature ranged from 1.1 to 5.8 °C, with average temperatures of 1.9 °C in the coastal area and 2.9 °C offshore (Figure 7d). Notably, the water temperature in the deep layer (≥300 m) did not exhibit significant changes and remained consistently below 2 °C throughout all the periods (Figure 7d).
Long-term observations of the vertical water temperature structure in the ground habitat revealed varying fluctuations between the upper and intermediate layers. Notably, in the 1980s (Period B), the water temperature in the upper layer was lower than that of other periods. Subsequently, there was a continuous upward trend in the water temperature in the upper layer. In contrast, the water temperature in the intermediate layer decreased during Periods C and D (Figure 8).

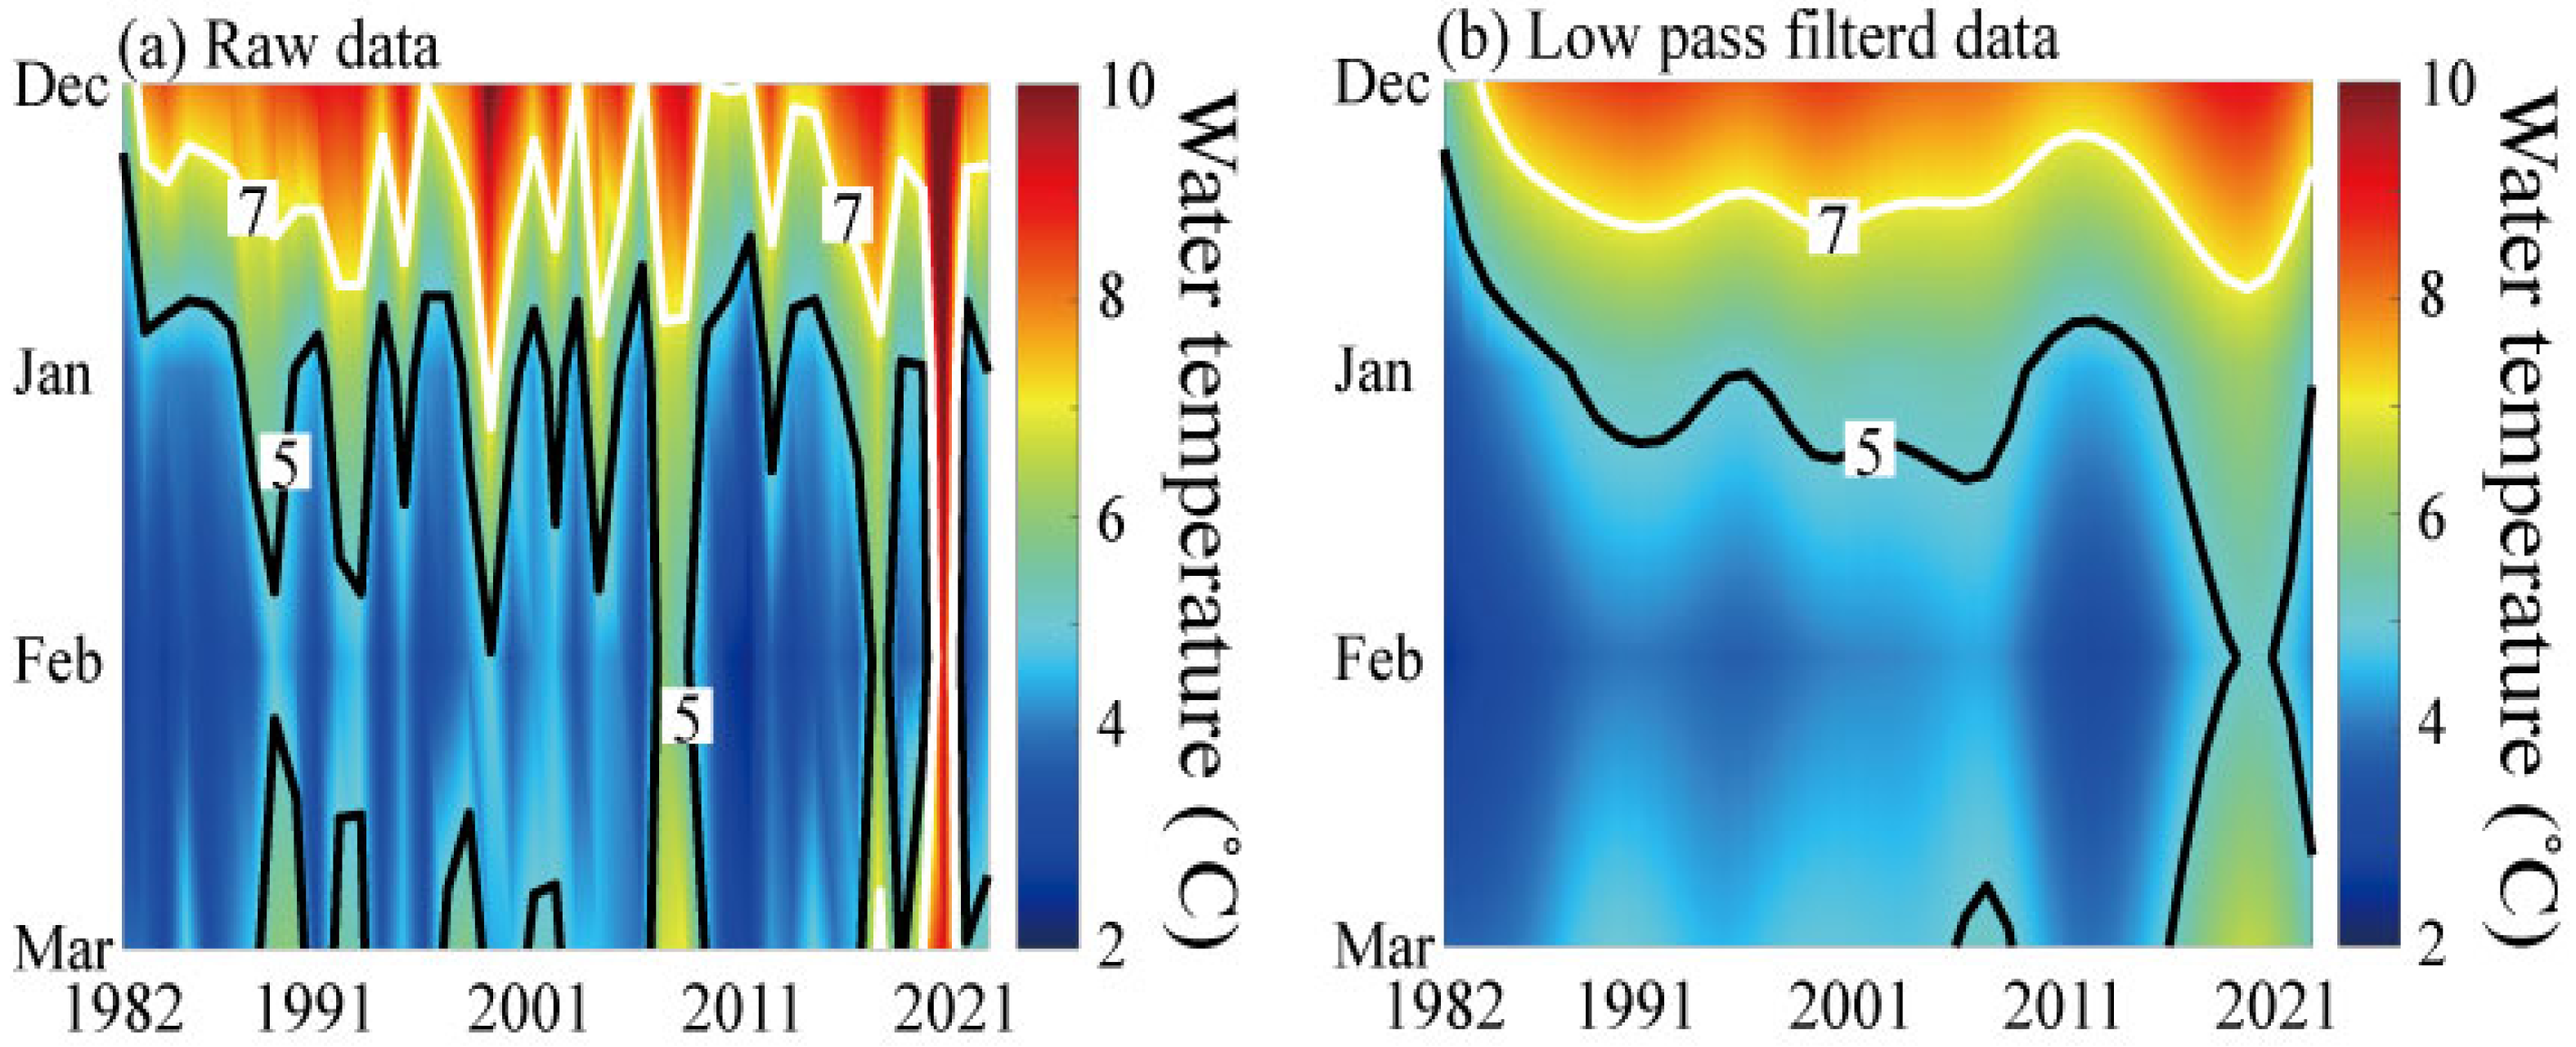
3.5. Long-Term Changes in Oceanic Conditions of the Spawning Ground

The monthly variations in SST in the pollock spawning ground showed a decreasing pattern after December, reaching its lowest values in January and February (Figure 9).
From 1982 to 2022, the SST in December ranged between 5.5 °C and 12.2 °C (mean 8.2 °C) and did not provide a suitable temperature range for spawning (2–5 °C). The SST decreased continuously after December. In January and February, SST ranged between 3.2–10.5 °C (mean 4.8 °C) and 2.3–9.1 °C (mean 3.9 °C), respectively (Figure 9). The SST slightly increased from March onward, ranging between 2.9–9.1 °C (mean 4.8 °C) (Figure 7). The winter SST around the spawning grounds showed a consistent increase. Suitable oceanic conditions for spawning were observed from January to March after the 1990s, and from February to March after the 2010s. Additionally, due to the rising SST, the duration of temperatures exceeding 7 °C has expanded from December to January. These fluctuation patterns were related to changes in the duration of the formation of suitable oceanic conditions for spawning (Figure 9).

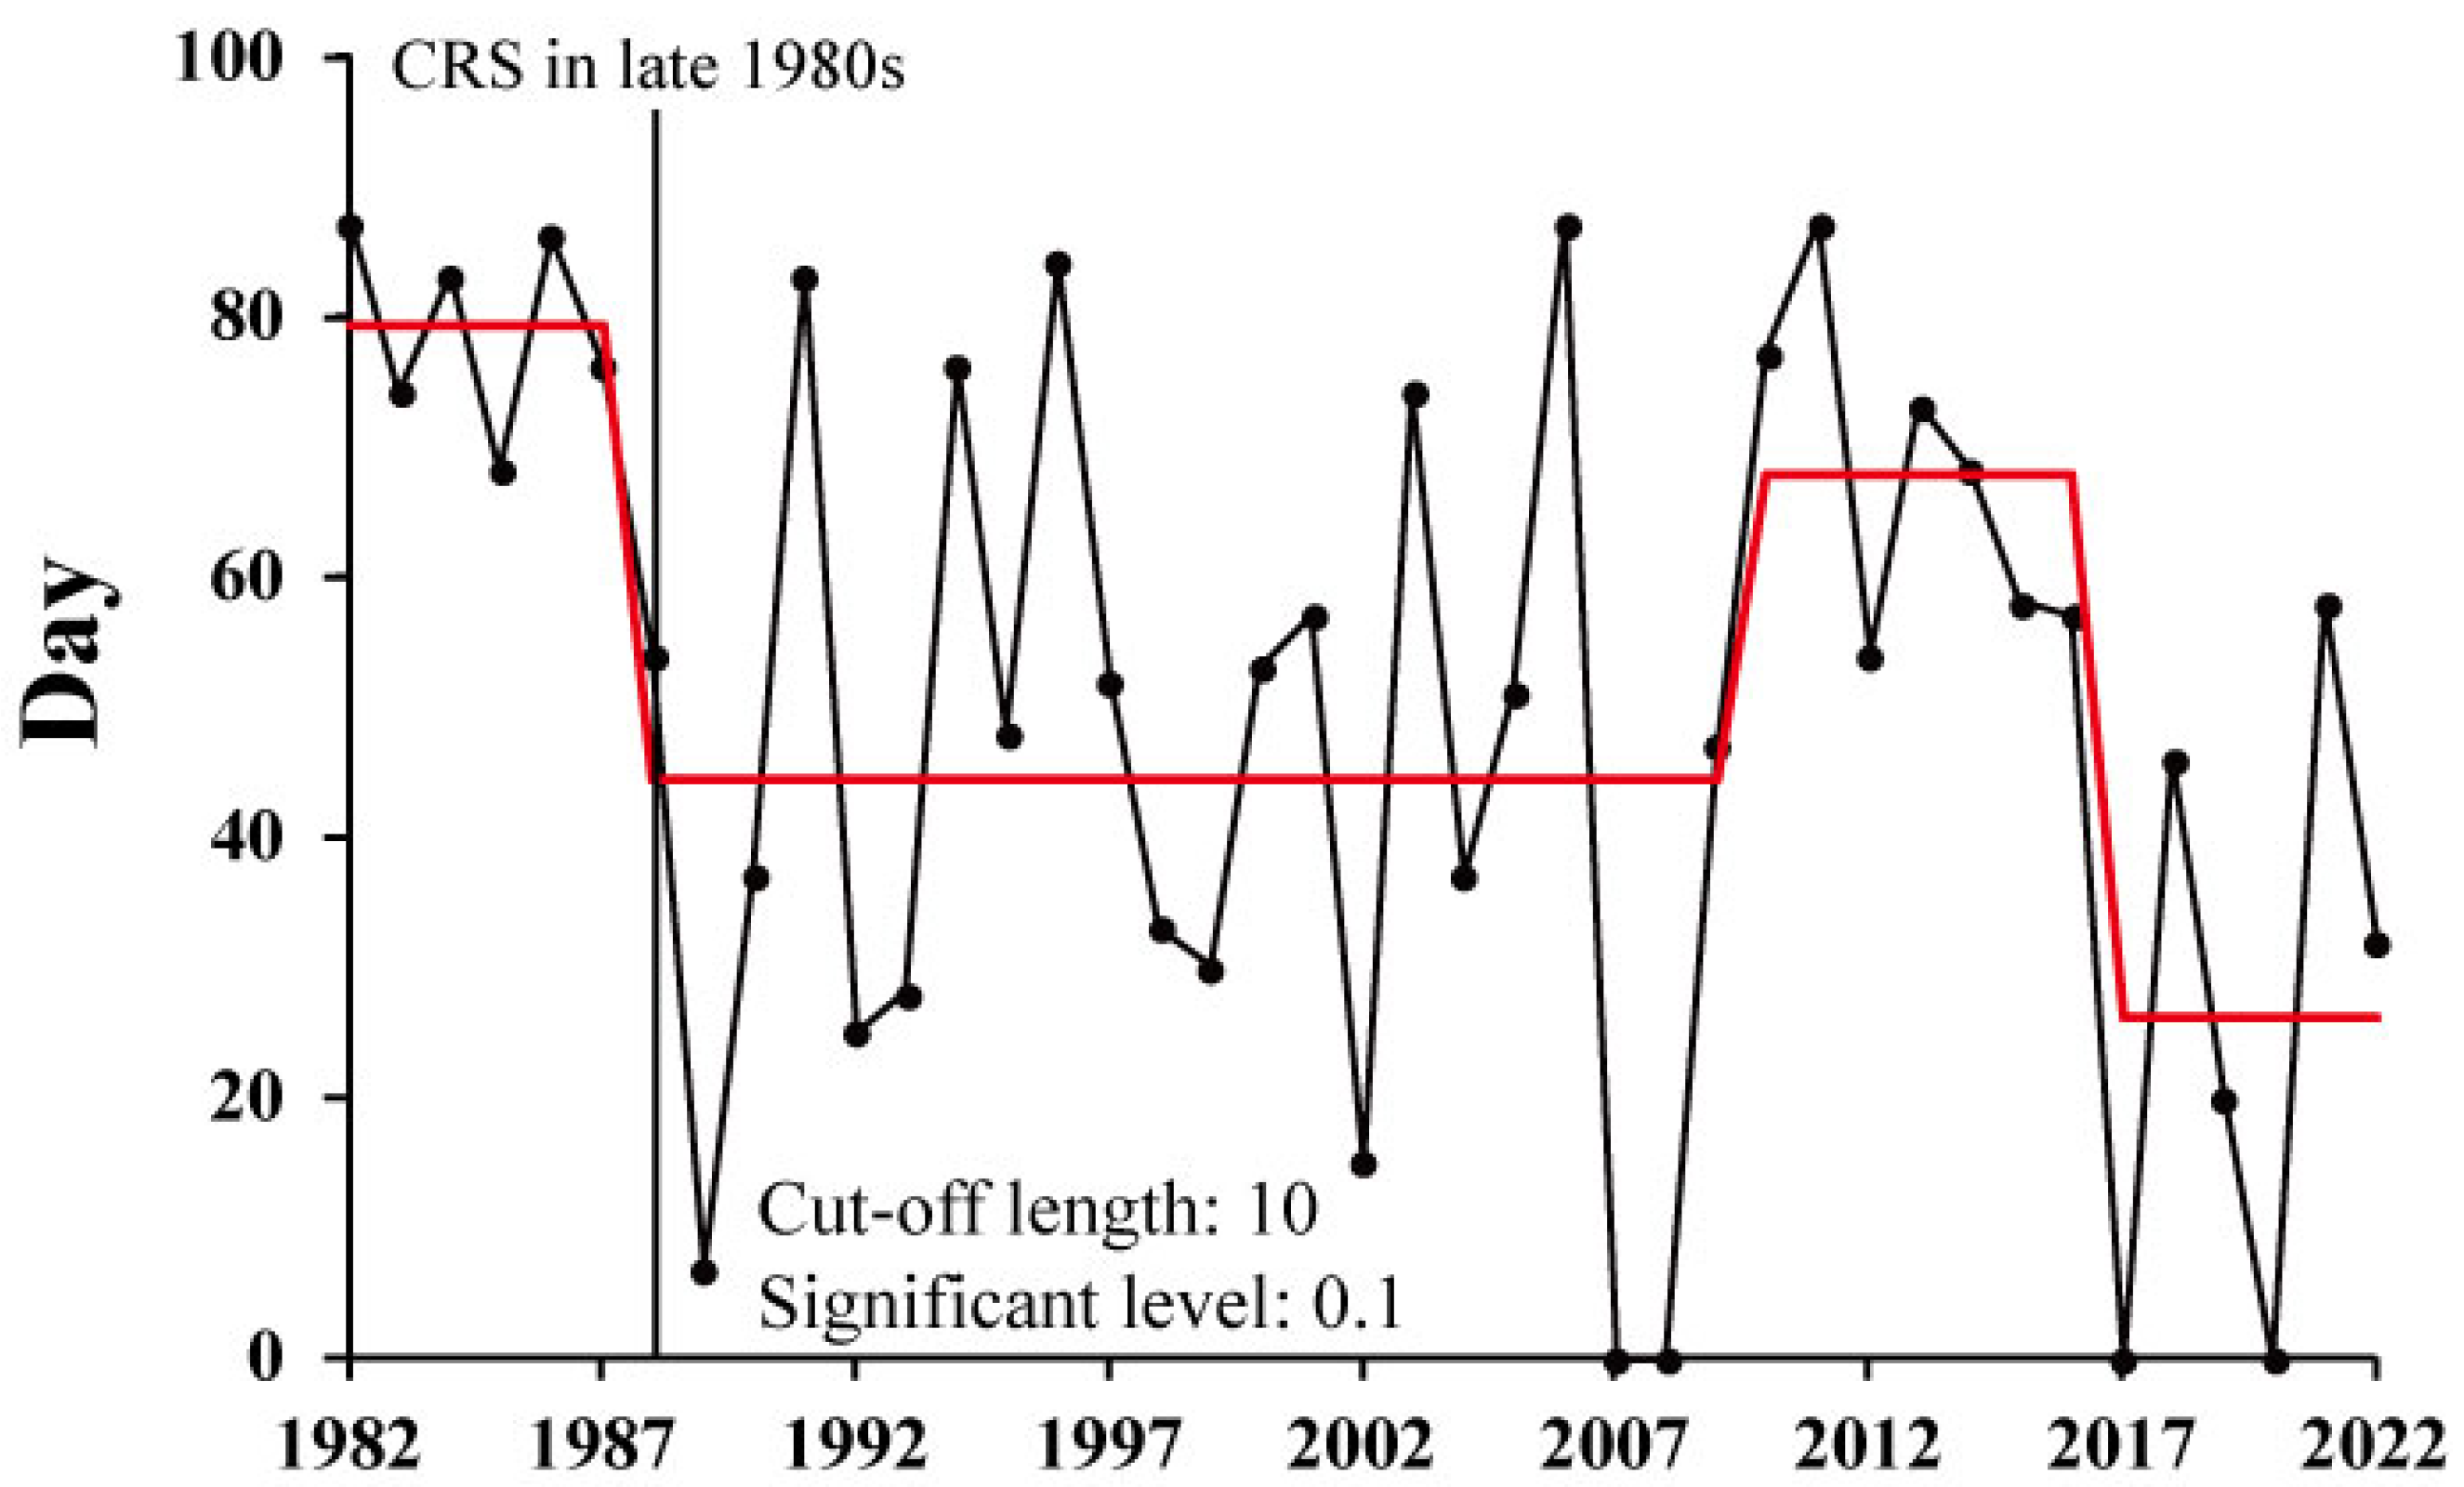
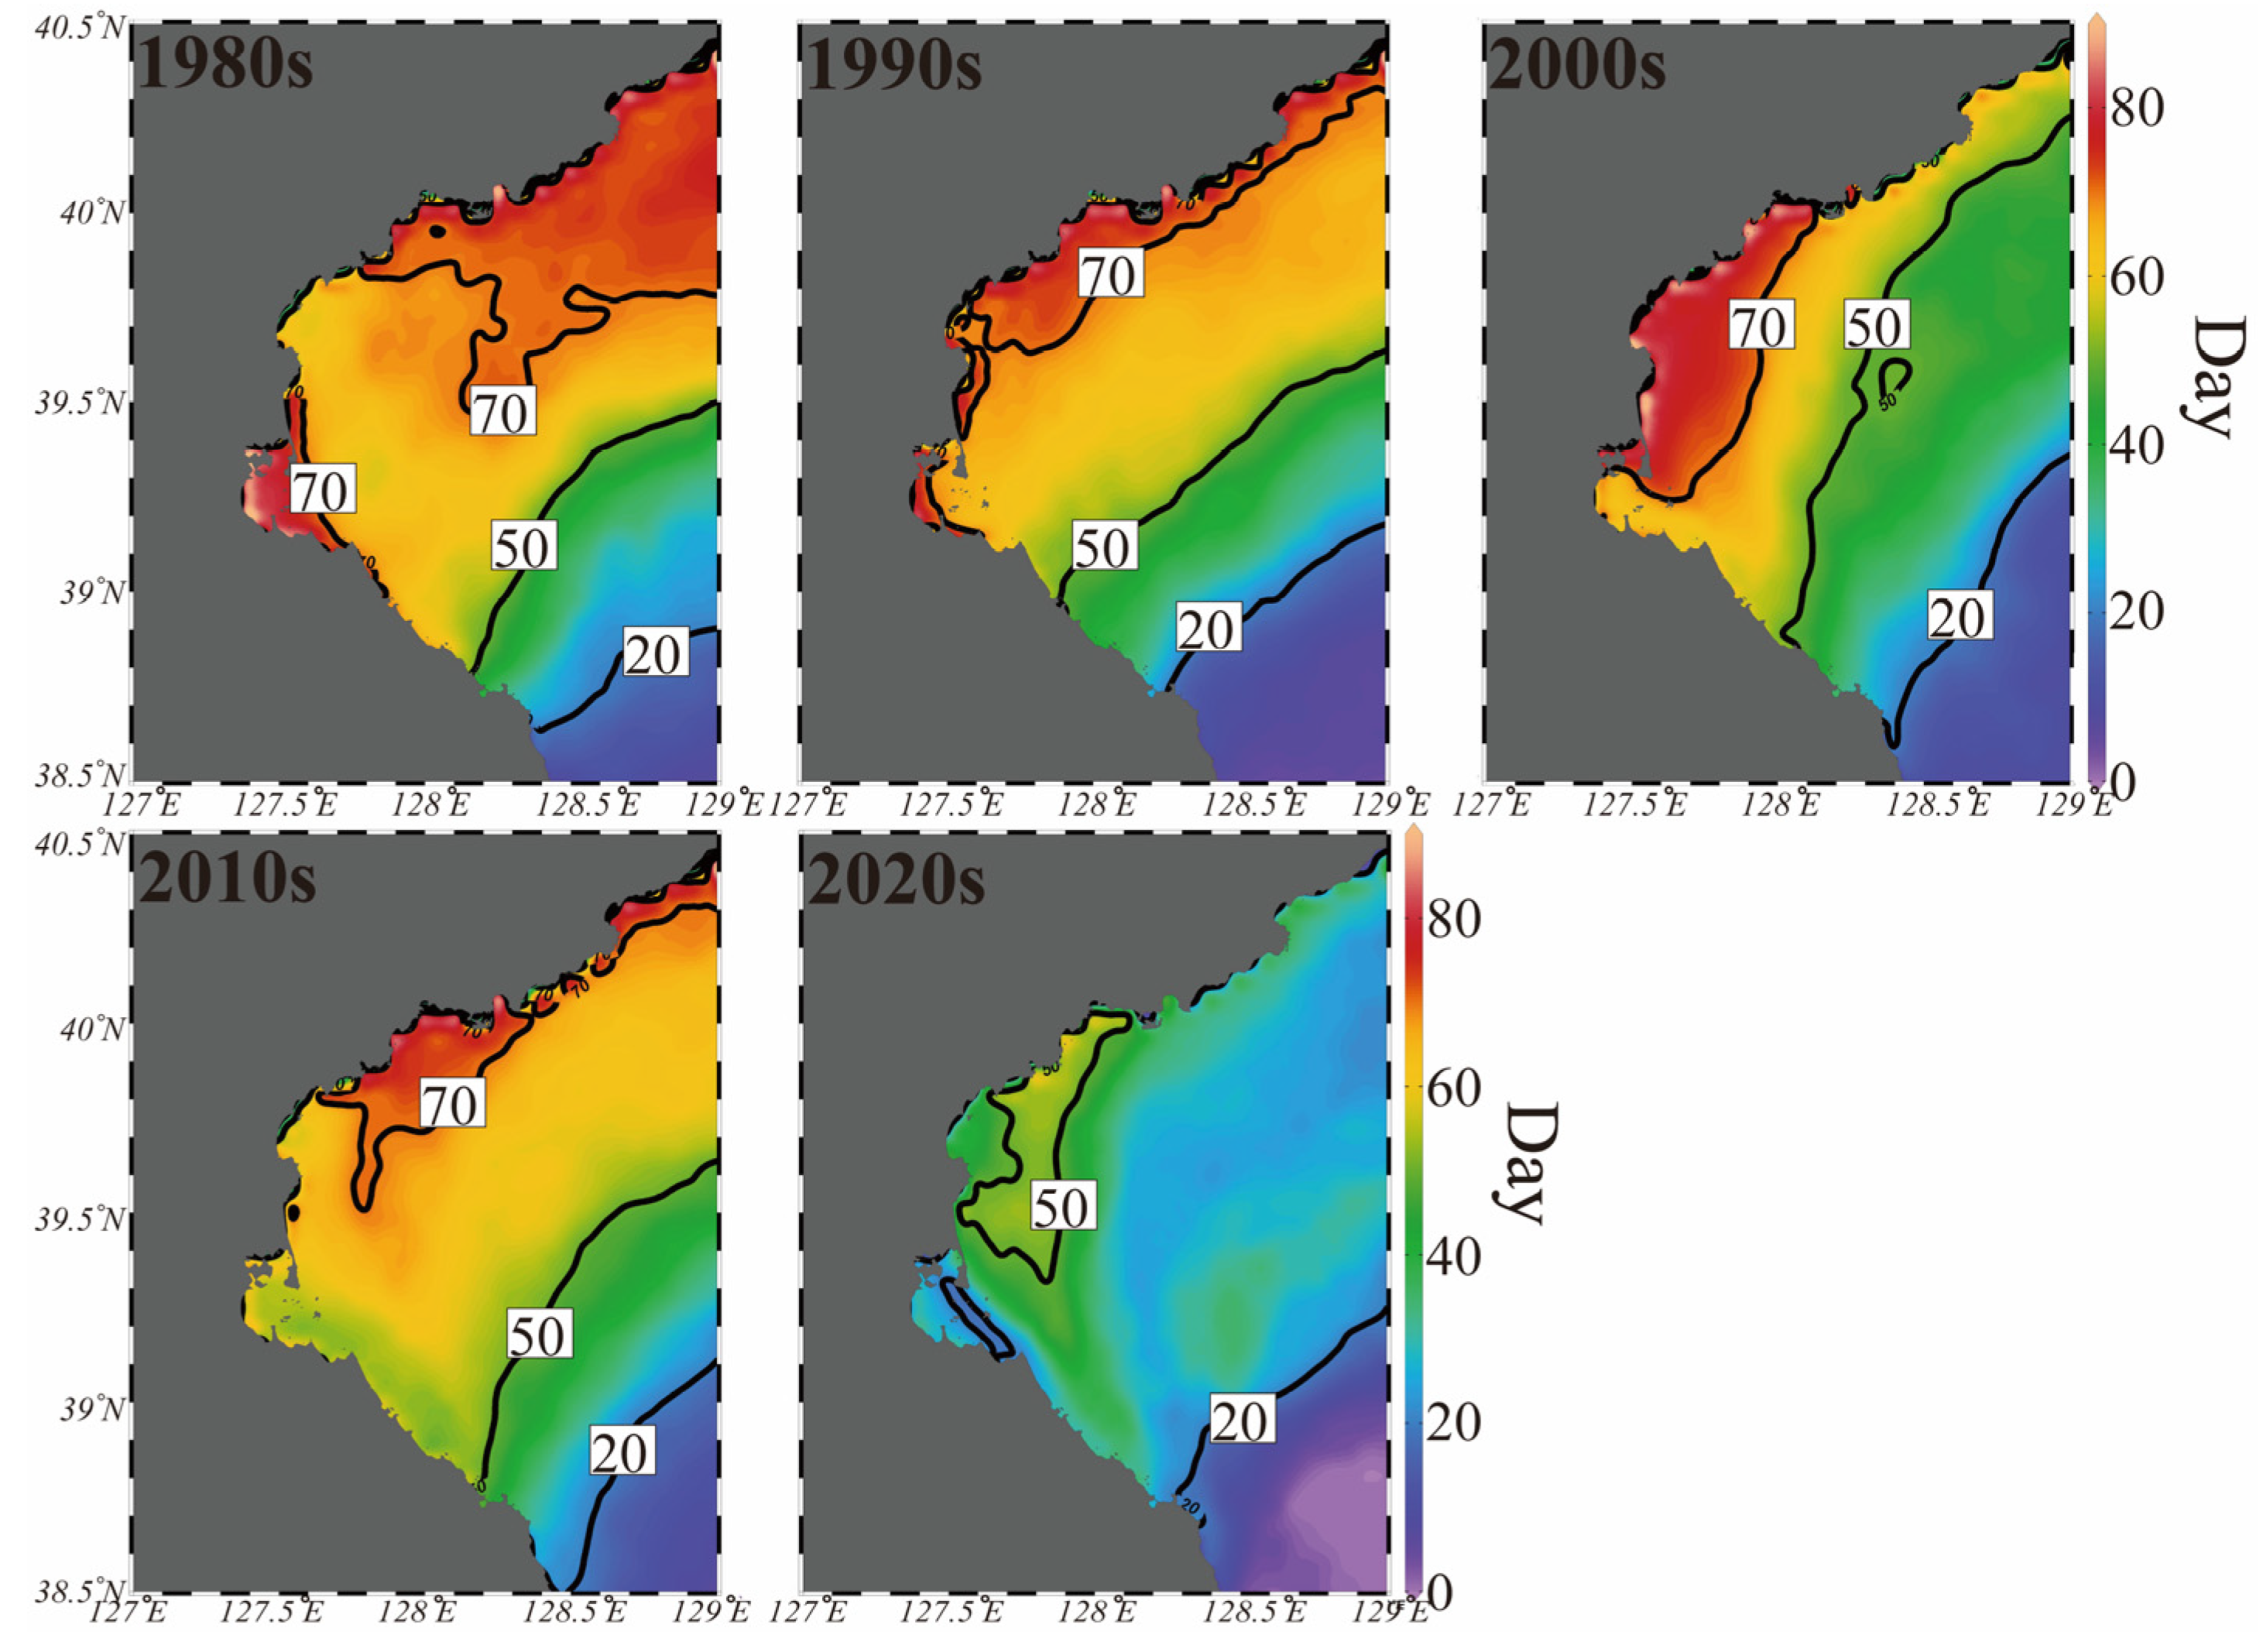
3.6. Long-Term Changes in the Duration of Suitable Temperature for Spawning (DTS) and Regional Proportion for Suitable Spawning Conditions (RPS)

Up to 1987, the DTS spanned approximately 79 days (Figure 10). However, after 1988, this duration reduced to approximately 45 days, attributable to a rapid increase in SST. From 2010 onward, the DTS exhibited an upward trend for approximately 68 days before experiencing a sharp decline in late 2010 (Figure 10). The horizontal distribution of DTS also exhibited different fluctuation patterns across different periods (Figure 11). During the 1980s, the primary locations with DTS exceeding 70 days were distributed across a broad area encompassing the inshore and northern parts of the DB, including Wonsan Bay (Figure 11). In contrast, in the 1990s the principal area with DTS surpassing 70 days witnessed a rapid decline and shifted to the northern part of the coastal zone within the DB. These regions expanded during the 2000s with a decrease in SST and were situated in the northern coastal area of the DB (Figure 11). In the 2010s, these regions were located in the northern part of the DB. However, in the 2020s, these regions were not included in the DB (Figure 11). Variations in RPS were also linked to changes in SST (Figure 12). Prior to the late 1980s, RPS constituted approximately 56.9% of the total DB area; subsequently, it rapidly declined to approximately 28.6% after the late 1980s. Following the late 2000s, the RPS increased again to 51.6%; however, after the late 2010s, it decreased to 17.9% (Figure 12).

4. Discussion

The collapse of the pollock fishery was simultaneously influenced by anthropogenic activities, such as overfishing, and natural factors such as climate change. Furthermore, the effects of these factors on changes in pollock biomass showed distinct timing.
Pollocks exhibit distinct biological characteristics at each stage of life. Pollock eggs and larvae are typically distributed near the surface layer [16,42]. Subsequently, during the juvenile and adult stages, they change their vertical habitat range, transitioning from the upper layer to deeper ones [43]. Furthermore, changes in oceanic conditions in their habitats also significantly influence the size of individual pollocks. Pollocks exhibit distinct habitat preferences based on their preferred habitats.
Large groups of pollock, depending on their size, predominantly inhabit specific temperature ranges. Larger pollocks prefer temperatures between 2–6 °C, whereas smaller pollocks primarily inhabit the temperature range of 4–12 °C [14,27,29,30]. These variations in the oceanic conditions of their preferred habitats, based on size and growth patterns, play a crucial role in their survival strategies. Relatively smaller individuals favor environments conducive to higher metabolic rates for growth, whereas larger individuals prefer environments suitable for lower metabolic rates to enhance energy efficiency. Therefore, larger pollock tend to inhabit deeper and cooler areas [44,45].
Previous studies have highlighted that warming water temperatures resulting from climate change are a critical factor contributing to the collapse of pollock fisheries [7,46]. In particular, the warming trend observed after the late 1980s has been linked to significant changes in the ecosystem dynamics of the East Sea of Korea [36,46]. Cold-water species such as pollock, which were the most abundant species during the 1980s, became a minor component of catches after the late 1980s. Conversely, warm-water species, such as the common squid (Todarodes pacificus), have emerged as major components of catches since the late 1980s [7,46]. However, in the 1990s and 2010s, following a decline in pollock biomass, water temperatures in the upper layer exhibited a rapidly increasing pattern. In contrast, in the intermediate layer where both small and large individuals inhabit, water temperatures decreased. This created oceanic conditions suitable for the habitats of small and large individuals. Furthermore, it is recognized that the primary prey source for juvenile pollock, euphausiids [27,28], prefer colder water temperatures within the range of 7–9 °C. The decrease in water temperature in the intermediate layer likely resulted in an increase in the abundance of these prey organisms [26,27]. Throughout the entire pollock life cycle, the early stage is most affected by environmental changes in the upper layer. Pollock mortality is highest during the early life stages. Therefore, a sudden rise in water temperature in the upper layer of the East Sea after the late 1980s, resulting from climate change, negatively affected the survival rate of pollock during the early stage more than in other life stages.
For the Alaska Pollock inhabiting the Alaska region, the mortality rate within the first five months after hatching is 66–88% [19]. In Korean waters, the rate of warming in the upper layer, which serves as the primary habitat for larvae and eggs, is higher than that of the intermediate and deep layers where adult pollocks reside [47]. These changes in oceanic conditions in spawning grounds affect mortality during the early life stages [10,48,49]. Specifically, the timing of creating suitable oceanic conditions for spawning and hatching [50], advection of eggs and larvae [17,51], and food sources are important factors influencing changes in survival rates and mortality during the early life stages [4,52].
Fluctuations in SST around the DB have not only impacted suitable conditions for pollock spawning but also the spatial distribution of spawning grounds [9,10,17,30]. Since the late 1980s, there has been a significant decrease in both the DTS and RPS, leading to suitable spawning conditions. These environmental changes in pollock spawning grounds are key factors influencing the hatching and survival rates of juvenile pollock [9,53]. The developmental rate of pollock eggs appears to be slower at lower temperatures, whereas hatching rates are higher [10,54,55,56,57]. During the early stages, juvenile pollocks exhibit more vigorous energy metabolism under higher temperature conditions, leading to faster growth compared to colder sea temperatures [58]. However, as metabolic rates increase, a constant supply of abundant food is required. Failure to consume food quickly under high-temperature conditions can lead to an increased mortality rate [22]. Although hatching and juvenile survival are possible under high-temperature conditions, lower-temperature conditions yield even higher hatching and juvenile survival rates. Spatial changes in pollock spawning grounds also serve as key factors that influence the hatching and survival rates of pollock juveniles [17]. When pollock spawning grounds are primarily located along the inshore area of the DB, they are more stable in the face of environmental changes caused by external factors such as ocean currents. These changes in oceanic conditions can significantly impact the food web structure, including variations in food source abundance and competition with other species, thereby affecting the survival rate of pollock during their early life stages [36,46]. When the central part of the spawning ground shifts to the northern coast of the DB, a higher likelihood of eggs and juveniles being advected offshore because of factors such as ocean currents exists. Even if the temperature conditions are suitable for growth, the limited food supply in offshore areas could have a negative impact on the survival rate of juveniles. In particular, since the late 1980s, with the increase in volume transport by the East Korean Warm Current, the proportion of eggs and juveniles transported to nursery grounds suitable for growth and survival has decreased. Instead, there has been an increase in the proportion transported offshore or to northern areas [17].
Sudden changes in oceanic conditions in the East Sea since the late 1980s have had a negative impact on the early life stages [10]. This is believed to be a major factor contributing to the decrease in pollock biomass. However, unlike other countries such as Japan and Russia, the total catch of pollock in Korean waters has steadily declined since the late 1980s, recording amounts of less than one ton since the 2000s. The fluctuations in pollock biomass in Korean waters appear to be the result of the cumulative impact of long-term overfishing of juveniles and the effects of climate change since the late 1980s. The climate changes that occurred in the late 1980s are well-documented and have been observed in various oceanic conditions and marine ecosystems in the North Pacific, including the northeast Pacific [59], the subtropical Kuroshio Current region [37], and Korean waters in the East Sea [7]. Long-term changes in the oceanic conditions of the East Sea have been associated with climate factors, indicating atmospheric and oceanic conditions in the North Pacific [7]. Specifically, changes in the intensity of the AO, SH, and EAWM have been identified as major factors influencing the sudden increase in water temperature in the East Sea after the late 1980s [7]. The transition of the AO from a negative to a positive phase in the late 1980s resulted in the strengthening of the Arctic wind vortex, which impeded the southward movement of cold air to mid-latitudes during the positive phase of the AO [60], a phenomenon linked to the weakened SH [7]. Consequently, the change in the pressure gradient force between the central pressures of the SH and Aleutian low pressure affected the weakening of the EAWM and the increase in air temperature around the East Sea [7]. Additionally, the weakened EAWM after the late 1980s and intensified northward warm current might have created unfavorable conditions for the walleye pollock in the late 1980s [17]. Furthermore, during periods of a weak Kuroshio Current combined with El Niño [61,62], the effect of Ekman transport on the Kuroshio Current flowing in the East China Sea was weakened, causing the main axis of the Kuroshio Current to migrate westward with decreased velocity [7,47,61,63]. Consequently, the Tsushima Warm Current, which flows into the East Sea and separates from the Kuroshio Current, was enhanced [7,47,61,63]. As a result, oceanic conditions in the East Sea indicated warmer than normal conditions.
The Korean government initially prohibited the fishing of juvenile pollock but lifted this prohibition after 1974, which led to the continuation of juvenile pollock fishing until the early 1990s [64,65]. During the mid-1970s, juveniles constituted over 80% of the total catch, and this high proportion of juvenile catches persisted until the mid-1980s [18]. The high intensity of juvenile fishing appears to have been influenced by both biological characteristics and advancements in fishing techniques and gear. During the 1970s and 1980s, the primary fishing grounds for pollock in Korean waters were shallow areas near the shore, which served as the primary habitat for juvenile pollock. This can be attributed to two factors: (1) the high abundance of pollock in both inshore and offshore areas, and (2) limitations on fishing activities in deep layers and offshore areas due to the underdevelopment of fishing gear and methods. As a result of fishing activities and the spatial distribution of juvenile pollock, the proportion of juveniles in catches exceeds that of adults. This continued fishing for juvenile pollock for over a decade has likely contributed to overfishing [64]. The ongoing and increased fishing pressure on juvenile pollock has had an impact on adult pollock biomass and recruitment [18]. The highest recorded catch of juvenile pollock was in 1981, with a significant decline in the total catch of juvenile pollock after 1984–1985. Subsequently, the catch of adult pollock also showed a declining trend after 1987–1988, suggesting a time-lag effect in response to changes in the juvenile pollock population. In summary, the high fishing pressure on juveniles is associated with a decline in adult biomass and appears to be a significant factor contributing to decreased reproduction and recruitment [18]. Notably, in Korean waters, there are more female individuals than males, and increased fishing pressure on females has a greater impact on reproduction and recruitment than on males [66,67,68]. This imbalance in gender ratio may be a response to overfishing of juveniles.
The decline in pollock resources, primarily driven by high catch pressure on juvenile pollocks and climate change, has led to notable changes in body size. Specifically, in the East Sea of Korea, the proportion of juvenile pollock decreased, whereas that of adult pollock increased in the 1990s and in more recent times (2010s), compared with the period of high biomass in the late 1970s and mid-1980s. The decline in the proportion of juvenile pollock is primarily attributed to excessive fishing of juveniles, whereas the increase in the size of adult individuals is believed to be influenced by density-dependent effects [18]. During the 1990s, as pollock biomass rapidly declined, competition for food resources decreased, resulting in accelerated growth and maturation processes. Consequently, the size of adult pollock in the East Sea of Korea significantly surpassed that of the mid-1970s [18,20]. Moreover, advancements in fishing techniques and gear have enabled fishing activities to extend into deeper layers and cover longer distances after the 1990s, facilitating the capture of pollock. Consequently, it is important to consider the possibility of an increased proportion of both larger-sized and smaller-sized pollocks in Period D.

5. Conclusions

The abundance of pollock in the East Sea of Korea has significantly decreased since the late 1980s, with catches dropping below one ton after the 2000s. This decline appears to result from complex interactions between human activities, such as overfishing, and natural factors, such as climate change. Before the early 1980s, the catch ratio of juveniles notably exceeded that of adults and persisted for a decade, primarily due to sustained and excessive fishing of juveniles, leading to a sharp decrease in juvenile abundance in the mid-1980s. Subsequently, in the late 1980s, climatic changes had a significant impact as sea surface temperatures (SST) in spawning grounds rapidly increased, resulting in a reduction in both the suitable region and duration of spawning. The reduced reproduction due to excessive overfishing during the early 1980s, combined with the sudden changes in oceanic conditions of spawning and habitat grounds that occurred in the late 1980s, further worsened the situation. This cumulative impact of both overfishing and environmental changes in habitats and spawning grounds due to climate change served as major factors in exacerbating the decline.

Author Contributions

Conceptualization, Methodology, Validation, Formal analysis, and Writing—Original Draft, H.K.J.; Data Curation and Visualization, J.W.P. and J.H.Y.; Writing—Review and Editing, J.M.P. and I.S.H.; Supervision, Project Administration and Funding Acquisition, and Writing—Review and Editing, C.I.L.; All authors have read and agreed to the published version of the manuscript.

Funding

This research was supported by the National Institute of Fisheries Science, Ministry of Oceans and Fisheries, Korea (R2024013), and the Korea Institute of Marine Science & Technology Promotion (KIMST) funded by the Ministry of Oceans and Fisheries (20220533).

Data Availability Statement

All data supporting the results of this study are provided in this manuscript.

Conflicts of Interest

The authors declare no conflicts of interest.

Appendix A

Table A1. The information of specimens used in this study.
PeriodYearMonthFemaleMale
Total Length (cm)Weight (g)No.Total Length (cm)Weight (g)No.
MeanSTD.MeanSTD.MeanSTD.MeanSTD.
A1973144.288.39483.15261.552636.332.52256.6344.4224
1973238.693.91307.4186.933438.232.13301.8848.3616
19733----------
1974141.856.13384.45140.188339.295.70326.69119.0935
1974241.134.36383.61126.333641.884.55410.54111.9824
1974338.694.64300.83134.273638.263.18265.1448.4414
1975141.976.73361.07146.952838.796.30305.83164.0712
1975244.5111.05507.89285.161939.636.25392.38193.4321
1975340.024.99361.76161.873341.534.12380.7192.027
1976137.895.07352.54181.871337.166.25300.18177.7844
19762----------
19763----------
19771----------
1977239.775.21347.06155.116339.134.72335.46133.4137
19773----------
1978136.612.36253.6846.333136.102.47251.2443.5729
1978238.032.04294.2253.382737.101.67259.2745.0433
1978335.352.43232.7954.122936.882.79256.3549.2131
1979139.115.00354.61169.385635.953.05255.1470.8964
1979235.731.97256.4146.737835.162.13235.3250.4141
1979334.693.13225.8756.718134.292.73222.7954.4739
B1980137.932.20292.3043.297136.561.98269.6156.8849
1980238.402.51302.6261.426637.492.41268.5049.3154
19803----------
1981138.412.61291.8869.526938.373.05280.1263.7451
1981239.393.24279.2149.473838.212.81252.7346.2222
19813----------
1982137.983.04266.3662.826738.483.06274.1265.8333
1982237.282.85267.2254.034937.342.38258.9453.4851
19823----------
1983138.072.51277.3152.307536.842.34268.8847.2725
1983236.862.15263.4050.474536.912.83265.9553.8165
19833----------
1984137.183.52264.8862.886736.382.36244.8548.9533
1984238.083.54285.0072.596936.483.63259.1553.2120
19843----------
1985137.863.03265.5052.858836.452.34246.4555.8011
19852----------
19853----------
C1991142.633.02397.2790.6711341.242.14381.8067.7715
1991238.906.36302.59120.436332.076.01186.2393.8335
1991336.115.55252.5899.056235.715.97246.08108.4037
1992141.315.65345.13113.757731.845.34173.3077.7423
1992239.336.25334.90134.026035.235.84224.3794.0638
1992337.224.59333.38116.016330.714.93217.11114.6937
19931----------
19932----------
1993334.483.36211.4673.133233.963.05195.2837.8439
19941----------
1994241.974.39386.56117.793939.077.09332.44191.2212
19943----------
1995140.493.25387.25148.514236.993.98286.85105.668
19952----------
19953----------
D2016145.676.97550.10271.453042.355.91424.96189.4821
2016244.089.13529.36268.571346.176.31570.44261.4715
2016344.927.23517.05290.441940.297.57395.71186.7815
2017142.398.97512.90290.645941.677.76457.02223.3438
2017239.149.71384.13282.103739.327.28359.95169.2829
2017338.3610.84420.34340.504138.297.18350.49180.5438
2018141.558.76510.66277.294839.477.53408.29194.9635
2018240.977.42452.71217.745539.247.62389.69201.4448
2018332.746.57254.94180.8713934.275.32258.99131.95154

References

  1. Makino, M.; Kim, S.A.; Velikanov, A.; Criddle, K.; Funamoto, T.; Hirota, M.; Sakurai, Y. Introduction: From the Birth to the Table of Walleye Pollock Theragra chalcogramma. Fish. Sci. 2014, 80, 103–107. [Google Scholar] [CrossRef]
  2. Bailey, K.M.; Quinn, T.J.; Bentzen, R.; Grant, W.S. Population Structure and Dynamics of Walleye Pollock, Theragra chalcogramma. Adv. Mar. Biol. 1999, 37, 179–255. [Google Scholar] [CrossRef]
  3. FAO. The State of World Fisheries and Aquaculture 2020; Sustainability in Action: Rome, Italy, 2020; ISBN 978-92-5-132692-3. [Google Scholar]
  4. Napp, J.M.; Kendall, A.W.; Schumacher, J.D. A Synthesis of Biological and Physical Processes Affecting the Feeding Environment of Larval Walleye Pollock (Theragra chalcogramma) in the Eastern Bering Sea. Fish. Oceanogr. 2000, 9, 147–162. [Google Scholar] [CrossRef]
  5. Mueter, F.J.; Ladd, C.; Palmer, M.C.; Norcross, B.L. Bottom-up and Top-down Controls of Walleye Pollock (Theragra chalcogramma) on the Eastern Bering Sea Shelf. Prog. Oceanogr. 2006, 68, 152–183. [Google Scholar] [CrossRef]
  6. Noakes, D.J.; Beamish, R.J. Synchrony of Marine Fish Catches and Climate and Ocean Regime Shifts in the North Pacific Ocean. Mar. Coast. Fish. 2009, 1, 155–168. [Google Scholar] [CrossRef]
  7. Jung, H.K.; Rahman, S.M.; Kang, C.K.; Park, S.Y.; Lee, S.H.; Park, H.J.; Kim, H.W.; Lee, C.I. The Influence of Climate Regime Shifts on the Marine Environment and Ecosystems in the East Asian Marginal Seas and Their Mechanisms. Deep Sea Res. Part II Top. Stud. Oceanogr. 2017, 143, 110–120. [Google Scholar] [CrossRef]
  8. Bulatov, O.A. Walleye Pollock: Global Overview. Fish. Sci. 2014, 80, 109–116. [Google Scholar] [CrossRef]
  9. Seol, K.S.; Lee, C.I.; Jung, H.K. Long Term Changes in Sea Surface Temperature Around Habitat Ground of Walleye Pollock (Gadus chalcogrammus) in the East Sea. J. Korean Soc. Mar. Environ. Saf. 2020, 26, 195–205. [Google Scholar] [CrossRef]
  10. Park, J.W.; Yoo, H.K.; Jung, H.K.; Park, H.J.; Bae, K.M.; Kang, C.K.; Lee, C.I. Effects of Water Temperature Changes on the Early Life Stages (Egg and Larvae) of Walleye Pollock (Gadus chalcogrammus)—Laboratory Experiments and Field Applications. J. Exp. Mar. Biol. Ecol. 2024, 571, 151980. [Google Scholar] [CrossRef]
  11. Kim, S.A.; Kang, S.K. The Status and Research Direction for Fishery Resources in the East Sea/Sea of Japan. Korean Soc. Fish. Res 1998, 1, 44–58. [Google Scholar]
  12. Kim, Y.S.; Han, K.H.; Kang, C.B.; Kim, J.B. Commercial Fishes of the Coastal and Offshore Water in Korea; Hanguel-Publishing: Busan, Republic of Korea, 2004. [Google Scholar]
  13. Beamish, R.J.; McFarlane, G.A. A Discussion of the Importance of Aging Errors, and an Application to Walleye Pollock: The World’s Largest Fishery. In Recent Developments in Fish Otolith Research; University of South Carolina Press: Columbia, SC, USA, 1995; pp. 545–565. [Google Scholar]
  14. Lee, C.I.; Han, M.H.; Jung, H.K.; Park, H.J.; Park, J.M. Spawning Season, and Factors Influencing Allometric Growth Pattern and Body Condition of Walleye Pollock Gadus chalcogrammus in the Middle East Sea, Korea. Korean J. Ichthyol. 2019, 31, 141–149. [Google Scholar] [CrossRef]
  15. Katou, T. Alaska Pollack Trade Relation between Japan and Korea. J. Fish. Bus. Adm. 2002, 33, 109–119. [Google Scholar]
  16. Kang, S.K.; Kim, S.A. What Caused the Collapse of Walleye Pollock Population in Korean Waters? KMI Int. J. Marit. Aff. Fish. 2015, 7, 43–58. [Google Scholar] [CrossRef]
  17. Kim, Y.Y.; Kang, Y.K.; Lee, S.T.; Jung, H.K.; Lee, C.I.; Kim, S.; Jeong, K.Y.; Byun, D.S.; Cho, Y.K. Potential Impact of Late 1980s Regime Shift on the Collapse of Walleye Pollock Catch in the Western East/Japan Sea. Front. Mar. Sci. 2022, 9, 802748. [Google Scholar] [CrossRef]
  18. Bang, M.K.; Kang, S.K.; Kim, S.A.; Jang, C.J. Changes in the Biological Characteristics of Walleye Pollock Related to Demographic Changes in the East Sea during the Late 20th Century. Mar. Coast. Fish. 2018, 10, 91–99. [Google Scholar] [CrossRef]
  19. Bailey, K.M.; Stabeno, P.J.; Powers, D.A. The Role of Larval Retention and Transport Features in Mortality and Potential Gene Flow of Walleye Pollock. J. Fish Biol. 1997, 51, 135–154. [Google Scholar] [CrossRef]
  20. Kang, S.K.; Park, J.H.; Kim, S.A. Size-Class Estimation of the Number of Walleye Pollock Theragra chalcogramma Caught in the Southwestern East Sea during the 1970s–1990s. Korean J. Fish. Aquat. Sci. 2013, 46, 445–453. [Google Scholar] [CrossRef]
  21. Nakatani, T.; Maeda, T. Thermal Effect on the Development of Walleye Pollock Eggs and Their Upward Speed to the Surface. Bull. Jpn. Soc. Sci. Fish. 1984, 50, 937–942. [Google Scholar] [CrossRef]
  22. Bailey, K.M.; Stehr, C.L. Laboratory Studies on the Early Life History of the Walleye Pollock, Theragra chalcogramma (Pallas). J. Exp. Mar. Biol. Ecol. 1986, 99, 233–246. [Google Scholar] [CrossRef]
  23. Yoo, H.K.; Byun, S.G.; Yamamoto, J.; Sakurai, Y. The Effect of Warmer Water Temperature of Walleye Pollock (Gadus chalcogrammus) Larvae. J. Korean Soc. Mar. Environ. Saf. 2015, 21, 339–346. [Google Scholar] [CrossRef]
  24. Kim, S.A. Status of Fishery and Science of Bering Sea Walleye Pollock: (II). Ocean Res. 1992, 14, 149–170. [Google Scholar]
  25. Muigwa, N.M. Vertical Distribution Pattern of Prespawning and Spawning Pollock (Theragra chalcogramma) in Shelikof Strait. In Proceedings of the International Symposium on the Biology and Management of Walleye Pollock, Anchorage, AK, USA, 14–16 November 1989; pp. 403–431. [Google Scholar]
  26. Park, H.J.; Park, T.H.; Lee, C.I.; Kang, C.K. Ontogenetic Shifts in Diet and Trophic Position of Walleye Pollock, Theragra chalcogramma, in the Western East Sea (Japan Sea) Revealed by Stable Isotope and Stomach Content Analyses. Fish. Res. 2018, 204, 297–304. [Google Scholar] [CrossRef]
  27. Park, J.M.; Jung, H.K.; Lee, C.I. Factors Influencing Dietary Changes of Walleye Pollock, Gadus chalcogrammus, Inhabiting the East Sea off the Korean Coast. J. Mar. Sci. Eng. 2021, 9, 1154. [Google Scholar] [CrossRef]
  28. Yamamura, O.; Yabuki, K.; Shida, O.; Watanabe, K.; Honda, S. Spring Cannibalism on 1 Year Walleye Pollock in the Doto Area, Northern Japan: Is It Density Dependent? J. Fish Biol. 2001, 59, 645–656. [Google Scholar] [CrossRef]
  29. Miyashita, K.; Tetsumura, K.; Honda, S.; Oshima, T.; Kawabe, R.; Sasaki, K. Diel Changes in Vertical Distribution Patterns of Zooplankton and Walleye Pollock (Theragra chalcogramma) off the Pacific Coast of Eastern Hokkaido, Japan, Estimated by the Volume Back Scattering Strength (Sv) Difference Method. Fish. Oceanogr. 2004, 13, 99–110. [Google Scholar] [CrossRef]
  30. Jung, H.K.; Lee, C.I.; Park, H.J.; Park, J.M. Influences of Oceanographic Features on Spatial and Temporal Distributions of Size Spectrum of Walleye Pollock, Gadus chalcogrammus Inhabiting Middle Eastern Coast of Korea. Korean J. Ichthyol. 2020, 32, 148–159. [Google Scholar] [CrossRef]
  31. Llopiz, J.; Cowen, R.; Hauff, M.; Ji, R.; Munday, P.; Muhling, B.; Peck, M.; Richardson, D.; Sogard, S.; Sponaugle, S. Early Life History and Fisheries Oceanography: New Questions in a Changing World. Oceanography 2014, 27, 26–41. [Google Scholar] [CrossRef]
  32. Siddon, E.C.; Kristiansen, T.; Mueter, F.J.; Holsman, K.K.; Heintz, R.A.; Farley, E.V. Spatial Match-Mismatch between Juvenile Fish and Prey Provides a Mechanism for Recruitment Variability across Contrasting Climate Conditions in the Eastern Bering Sea. PLoS ONE 2013, 8, e84526. [Google Scholar] [CrossRef] [PubMed]
  33. Froese, R.; Pauly, D. Fishbase World Wide Web Electronic Publication; Version 02/2024; ScienceOpen, Inc.: Boston, MA, USA, 2024. [Google Scholar]
  34. Pauly, D. Some Simple Methods for the Assessment of Tropical Fish Stocks; FAO Fisheries Technical Paper; FAO: Rome, Italy, 1983; p. 52. [Google Scholar]
  35. NFRDI. Ecology and Fishing Ground of Fisheries Resources in Korean Waters; National Institute of Fisheries Science: Busan, Republic of Korea, 2021. [Google Scholar]
  36. Tian, Y.; Kidokoro, H.; Watanabe, T.; Iguchi, N. The Late 1980s Regime Shift in the Ecosystem of Tsushima Warm Current in the Japan/East Sea: Evidence from Historical Data and Possible Mechanisms. Prog. Oceanogr. 2008, 77, 127–145. [Google Scholar] [CrossRef]
  37. Tian, Y.; Ueno, Y.; Suda, M.; Akamine, T. Decadal Variability in the Abundance of Pacific Saury and Its Response to Climatic/Oceanic Regime Shifts in the Northwestern Subtropical Pacific during the Last Half Century. J. Mar. Syst. 2004, 52, 235–257. [Google Scholar] [CrossRef]
  38. Trenberth, K.E. The Definition of El Niño. Bull. Am. Meteorol. Soc. 1997, 78, 2771–2777. [Google Scholar] [CrossRef]
  39. Donlon, C.J.; Martin, M.; Stark, J.; Roberts-Jones, J.; Fiedler, E.; Wimmer, W. The Operational Sea Surface Temperature and Sea Ice Analysis (OSTIA) System. Remote Sens. Environ. 2012, 116, 140–158. [Google Scholar] [CrossRef]
  40. Worley, S.J.; Woodruff, S.D.; Reynolds, R.W.; Lubker, S.J.; Lott, N. ICOADS Release 2.1 Data and Products. Int. J. Climatol. 2005, 25, 823–842. [Google Scholar] [CrossRef]
  41. Kim, S.A.; Zhang, C.I.; Kim, J.Y.; Oh, J.H.; Kang, S.K.; Lee, J.B. Climate Variability and Its Effects on Major Fisheries in Korea. Ocean Sci. J. 2007, 42, 179–192. [Google Scholar] [CrossRef]
  42. Kendall, A.W., Jr.; Nakatani, T. Comparisons of Early-Life-History Characteristics of Walleye Pollock Theragra chalcogramma in Shelikof Strait, Gulf of Alaska, and Funka Bay, Hokkaido, Japan. Fish. Bull. 1992, 90, 129–138. [Google Scholar]
  43. Funamoto, T.; Yamamura, O.; Shida, O.; Itaya, K.; Mori, K.; Hiyama, Y.; Sakurai, Y. Comparison of Factors Affecting Recruitment Variability of Walleye Pollock Theragra chalcogramma in the Pacific Ocean and the Sea of Japan off Northern Japan. Fish. Sci. 2014, 80, 117–126. [Google Scholar] [CrossRef]
  44. Yoshida, H.; Sakurai, Y. Relationship between Food-Consumption and Growth of Adult Walleye Pollock Theragra chalcogramma in Captivity. Bull. Jpn. Soc. Sci. Fish. 1984, 50, 763–769. [Google Scholar] [CrossRef]
  45. Smith, R.L.; Paul, A.J.; Paul, J.M. Effect of Food Intake and Temperature on Growth and Conversion Efficiency of Juvenile Walleye Pollock (Theragra chalcogramma (Pallas)): A Laboratory Study. ICES J. Mar. Sci. 1986, 42, 241–253. [Google Scholar] [CrossRef]
  46. Zhang, C.I.; Yoon, S.C.; Lee, J.B. Effects of the 1988/89 Climatic Regime Shift on the Structure and Function of the Southwestern Japan/East Sea Ecosystem. J. Mar. Syst. 2007, 67, 225–235. [Google Scholar] [CrossRef]
  47. Lee, C.I.; Jung, Y.W.; Jung, H.K. Response of Spatial and Temporal Variations in the Kuroshio Current to Water Column Structure in the Western Part of the East Sea. J. Mar. Sci. Eng. 2022, 10, 1703. [Google Scholar] [CrossRef]
  48. Iles, T.D.; Sinclair, M. Atlantic Herring: Stock Discreteness and Abundance. Science 1982, 215, 627–633. [Google Scholar] [CrossRef] [PubMed]
  49. Bailey, K.M.; Ciannelli, L.; Bond, N.A.; Belgrano, A.; Stenseth, N.C. Recruitment of Walleye Pollock in a Physically and Biologically Complex Ecosystem: A New Perspective. Prog. Oceanogr. 2005, 67, 24–42. [Google Scholar] [CrossRef]
  50. Hinckley, S.; Hermann, A.J.; Mier, K.L.; Megrey, B.A. Importance of Spawning Location and Timing to Successful Transport to Nursery Areas: A Simulation Study of Gulf of Alaska Walleye Pollock. ICES J. Mar. Sci. 2001, 58, 1042–1052. [Google Scholar] [CrossRef]
  51. Wilson, M.T.; Brodeur, R.D.; Sarah, H. Distribution and Abundance of Age-O Walleye Pollock, Theragra chalcogramma, in the Western Gulf of Alaska during September 1990. In NOAA Technical Report NMFS 126 Ecology of Juvenile Walleye Pollock, Theragra chalcogramma; Brodeur, R.D., Livingston, P.A., Loughlin, T.R., Hollowed, A.B., Eds.; U.S. Department of Commerce: Seattle, WA, USA, 1996; pp. 11–24. [Google Scholar]
  52. Honda, S.; Oshima, T.; Nishimura, A.; Hattori, T. Movement of Juvenile Walleye Pollock, Theragra chalcogramma, from a Spawning Ground to a Nursery Ground along the Pacific Coast of Hokkaido, Japan. Fish. Oceanogr. 2004, 13, 84–98. [Google Scholar] [CrossRef]
  53. Tanaka, H.; Nakagawa, T.; Yokota, T.; Chimura, M.; Yamashita, Y.; Funamoto, T. Effects of Spawning Temperature on the Reproductive Characteristics of Walleye Pollock Gadus chalcogrammus. Fish. Sci. 2019, 85, 901–911. [Google Scholar] [CrossRef]
  54. McGurk, M.D. Effects of Delayed Feeding and Temperature on the Age of Irreversible Starvation and on the Rates of Growth and Mortality of Pacific Herring Larvae. Mar. Biol. 1984, 84, 13–26. [Google Scholar] [CrossRef]
  55. Fortier, L.; Sirois, P.; Michaud, J.; Barber, D. Survival of Arctic Cod Larvae (Boreogadus saida) in Relation to Sea Ice and Temperature in the Northeast Water Polynya (Greenland Sea). Can. J. Fish. Aquat. Sci. 2006, 63, 1608–1616. [Google Scholar] [CrossRef]
  56. Laurel, B.J.; Copeman, L.A.; Spencer, M.; Iseri, P. Comparative Effects of Temperature on Rates of Development and Survival of Eggs and Yolk-Sac Larvae of Arctic Cod (Boreogadus saida) and Walleye Pollock (Gadus chalcogrammus). ICES J. Mar. Sci. 2018, 75, 2403–2412. [Google Scholar] [CrossRef]
  57. Blood, D.M. Low-Temperature Incubation of Walleye Pollock (Theragra chalcogramma) Eggs from the Southeast Bering Sea Shelf and Shelikof Strait, Gulf of Alaska. Deep Sea Res. Part II Top. Stud. Oceanogr. 2002, 49, 6095–6108. [Google Scholar] [CrossRef]
  58. Porter, S.M. Effects of Size and Light on Respiration and Activity of Walleye Pollock (Theragra chalcogramma) Larvae. J. Exp. Mar. Biol. Ecol. 2001, 256, 253–265. [Google Scholar] [CrossRef] [PubMed]
  59. Hare, S.R.; Mantua, N.J. Empirical Evidence for North Pacific Regime Shifts in 1977 and 1989. Prog. Oceanogr. 2000, 47, 103–145. [Google Scholar] [CrossRef]
  60. Thompson, D.W.J.; Wallace, J.M. The Arctic Oscillation Signature in the Wintertime Geopotential Height and Temperature Fields. Geophys. Res. Lett. 1998, 25, 1297–1300. [Google Scholar] [CrossRef]
  61. Jung, Y.; Park, J.-H.; Hirose, N.; Yeh, S.-W.; Kim, K.J.; Ha, H.K. Remote Impacts of 2009 and 2015 El Niño on Oceanic and Biological Processes in a Marginal Sea of the Northwestern Pacific. Sci. Rep. 2022, 12, 741. [Google Scholar] [CrossRef] [PubMed]
  62. Jacobi, L.; Nürnberg, D.; Chao, W.; Lembke-Jene, L.; Tiedemann, R. ENSO vs Glacial-Interglacial-Induced Changes in the Kuroshio-Oyashio Transition Zone during the Pleistocene. Front. Mar. Sci. 2023, 10, 1074431. [Google Scholar] [CrossRef]
  63. Ma, C.; Wu, D.; Lin, X.; Yang, J.; Ju, X. On the Mechanism of Seasonal Variation of the Tsushima Warm Current. Cont. Shelf Res. 2012, 48, 1–7. [Google Scholar] [CrossRef]
  64. Park, S.K.; Ok, Y.S. Bio-Economic Research in Fishery Resource Management: Walleye Pollock. Nongchon-Gyungje 1986, 9, 59–68. [Google Scholar]
  65. Kim, W.S.; Huh, S.H. Meristic and Morphometric Observations on Nogari and Alaska Pollock. J. Oceanol. Soc. Korea 1978, 13, 26–30. [Google Scholar]
  66. Solemdal, P. Maternal Effects—A Link between the Past and the Future. J. Sea Res. 1997, 37, 213–227. [Google Scholar] [CrossRef]
  67. Trippel, E.A. Egg Size and Viability and Seasonal Offspring Production of Young Atlantic Cod. Trans. Am. Fish. Soc. 1998, 127, 339–359. [Google Scholar] [CrossRef]
  68. Froese, R. Keep It Simple: Three Indicators to Deal with Overfishing. Fish Fish. 2004, 5, 86–91. [Google Scholar] [CrossRef]
Figure 1. Map of the study area: (a) spawning ground, (b) sampling area of pollock specimens and oceanographic monitoring station.
Water 16 00955 g001
Figure 2. The length-weight relationship for pollock analyzed in this study (n = 3891).
Water 16 00955 g002
Figure 3. Long-term changes in catches of juvenile (a) and adult (b) pollock, and (c) cross-correlation between juvenile and adult pollock (The red line represents the step changes estimated by the sequential t-test analysis of regime shifts).
Water 16 00955 g003
Figure 4. Composition of juvenile and adult pollock in the male (a) and female (b) groups in each period.
Water 16 00955 g004
Figure 5. Size spectrum of pollock in each period. (The gray and black vertical bars indicate the juvenile and adult groups, respectively).
Water 16 00955 g005
Figure 6. Condition factor for pollock in each period.
Water 16 00955 g006
Figure 7. Vertical structure of water temperature in the western part of the East Sea in each period.
Water 16 00955 g007
Figure 8. Vertical profile of water temperatures in the western part of the East Sea in each period.
Water 16 00955 g008
Figure 9. Long-term changes in sea surface temperature (SST) in the spawning ground.
Water 16 00955 g009
Figure 10. Long-term changes in the duration of suitable temperature for spawning (The red line represents the step changes estimated by the sequential t-test analysis of regime shifts).
Water 16 00955 g010
Figure 11. Horizontal distribution of the duration of suitable temperature for spawning (DTS) in each decade. (The number indicates the duration of suitable temperature for spawning measured in days).
Water 16 00955 g011
Figure 12. Long-term changes in the regional proportion for suitable spawning conditions (The red line represents the step changes estimated by the sequential t-test analysis of regime shifts).
Water 16 00955 g012
Table 1. Number of specimens included in this study.
Number of Specimens
Period APeriod BPeriod CPeriod D
Total specimens11441118795834
Female673704551441
Male471414244393
Disclaimer/Publisher’s Note: The statements, opinions and data contained in all publications are solely those of the individual author(s) and contributor(s) and not of MDPI and/or the editor(s). MDPI and/or the editor(s) disclaim responsibility for any injury to people or property resulting from any ideas, methods, instructions or products referred to in the content.

