Review

Summary of Experiments and Influencing Factors of Sediment Settling Velocity in Still Water

1
College of Water Resources and Architectural Engineering, Northwest A&F University, Xianyang 712100, China
2
State Key Laboratory of Soil Erosion and Dryland Farming on the Loess Plateau, Institute of Soil and Water Conservation, Northwest A&F University, Xianyang 712100, China
3
Institute of Soil and Water Conservation, Chinese Academy of Sciences and Ministry of Water Resources, Xianyang 712100, China
*
Author to whom correspondence should be addressed.
Water 2024, 16(7), 938; https://doi.org/10.3390/w16070938
Submission received: 28 February 2024 / Revised: 16 March 2024 / Accepted: 21 March 2024 / Published: 24 March 2024

Abstract

:
Sediment deposition significantly impacts soil erosion processes, consequently influencing the geographical morphology and surrounding environments of reservoirs and estuaries. Given the intricate nature of sediment deposition, it is imperative to consolidate and analyze existing research findings. Presently, studies on sediment settling velocity primarily employ theoretical, laboratory, and field experimentation methods. Theoretical approaches, rooted in mechanics, examine the various forces acting on sediment particles in water to derive settling velocity equations. However, they often overlook external factors like temperature, salinity, organic matter, and pH. Although laboratory experiments scrutinize the influence of these external factors on sedimentation velocity, sediment settling is not solely influenced by individual factors but rather by their collective interplay. Field observations offer the most accurate depiction of sediment deposition rates. However, the equipment used in such experiments may disrupt the natural sedimentation process and damage flocs. Moreover, measurements of sediment particle size from different instruments yield varied results. Additionally, this paper synthesizes the impact of suspended sediment concentration, particle size, shape, temperature, salinity, and organic matter on sediment settling velocity. Future research should focus on innovating new laboratory observation methods for sediment settling velocity and utilizing advanced scientific and technological tools for on-site measurements to provide valuable insights for further investigation into sediment settling velocity.

1. Introduction

Sediment settling velocity refers to the speed at which sediment particles sink under the equilibrium of forces in sediment movement mechanics [1]. It represents the rate at which sediment descends at a constant pace in a static water body. This parameter is fundamental for understanding the dynamics of sediment particles and serves as a key factor in sediment erosion, sediment carrying capacity, and the processes of sediment deposition and accumulation. The investigation of sediment deposition not only guides the scientific simulation of soil erosion processes and accurate prediction of soil erosion volumes but also holds significant importance in estimating deposition flux at riverbed bottoms, calculating sediment transport in river channels, and determining reservoir construction scales. Sediment can be classified into coarse-grained sediment (particles larger than 0.05 mm) and fine-grained sediment. Coarse-grained sediment typically constitutes a minor proportion of suspended solids in rivers, lakes, and similar environments, generally less than 1 g/L. Due to the limited presence of sand, coarse-grained sediment is typically analyzed using particle size meter methods [2]. However, the settling velocity of coarse-grained sediment determined by particle size meter methods often yields values that are excessively high, necessitating corrections using single-particle settling size to align with the actual conditions. With an increase in the suspended sediment concentration (SSC) of coarse sediment, collisions occur between coarse and fine sediment particles, elevating resistance during sedimentation and reducing settling velocity. Nonetheless, at equivalent sediment concentrations, the settling velocity of coarse sediment rises with increasing particle size [3].
Fine sediment, in comparison to coarse sediment, exhibits a significantly larger relative surface area, with finer particles having even greater relative surface areas. Fine-grained sediment can be classified into cohesive and non-cohesive types depending on whether flocculation occurs. Non-cohesive fine sediment is primarily influenced by individual particle movements, while cohesive fine particles can undergo physical and chemical interactions leading to the formation of microscopic structural aggregates, a process known as flocculation [4]. These aggregates, or flocs, possess larger particle sizes and settling velocities compared to the original fine particles. Consequently, in practical engineering applications, it is essential to account for the impact of cohesive fine sediment flocculation on settling velocity, particularly by focusing on the critical particle size for flocculation. In any given aquatic setting, when the particle size of cohesive sediment drops below a certain threshold, flocculation ensues. This specific particle size value represents the critical size for flocculation. Notably, the smaller the sediment particle size, the more pronounced the physical and chemical effects on the particle surface, leading to a more evident flocculation phenomenon [5]. Investigation into the settling velocity of fine sand particles traces back to Stokes’ formula in 1851 [6].
The existing research methods for determining the sediment settling velocity can be classified into three categories: theoretical methods, laboratory experiments, and field experiments. Theoretical approaches are grounded in mechanics, analyzing the myriad forces acting upon sediment particles in water to formulate equations for the sediment settling velocity. However, sediment settling is not solely influenced by forces; external factors such as temperature, salinity, organic matter, and pH also play significant roles. Laboratory experiments investigate the individual impact of various external factors on sediment settling velocity, often employing a combination of theoretical frameworks and experimental methods to derive semi-empirical formulas reflecting the influence of these factors on sediment settling. For instance, Yang [7] developed an empirical equation for the median sedimentation velocity of cohesive fine-grained sand by integrating the effects of salinity and sediment concentration. Similarly, Zheng [8] derived an empirical formula for kaolin sedimentation velocity influenced by temperature through sedimentation tank experiments. Wan [9] considered the combined effects of sediment concentration, salinity, and temperature on sediment settling velocity, resulting in an empirical formula applicable to sediment settling in the Yangtze Estuary. During sedimentation, particles are influenced not only by individual factors but also by the combined impact of all variables. Field observations provide the most accurate representation of sediment settling rates, yet the equipment used in field experiments can disrupt the natural sedimentation process and disturb flocculation [10]. Moreover, the measurements of sediment particle size obtained concurrently by different instruments yield disparate results [11].
Theoretical frameworks, determining factors, and calculation methodologies for researching fine sand particle sedimentation velocity exhibit considerable diversity. Due to variations in particle size and the complex, region-specific conditions of observation sites, sediment sedimentation velocity measurement methods vary significantly. This study conducts an extensive literature review to elucidate the characteristics of existing sediment settling velocity measurement methods and the pertinent influencing factors. Additionally, it outlines future research directions. It is of great significance to clarify the principles and influencing factors of sediment sedimentation velocity measurement methods and to select appropriate and feasible observation methods to assess the health status of aquatic ecosystems, monitor sediment sedimentation rates, and adopt erosion control measures and sustainable sediment management strategies in eroded areas.

2. Measuring Methods

2.1. Theoretical Method

2.1.1. Single Particle Sediment Settling Velocity

When a single sediment particle sinks in quiescent water, its motion state is related to the Reynolds number [12], written as:
R e = ω d v
where ω is the settling velocity of sediment, d is the particle size, and v is the kinematic viscosity coefficient of clear water.
The settling velocity of a single sediment particle was first proposed by Stokes [6]. Stokes ignores all the inertial forces in the Navier–Stokes equations and assumes that the sediment particles are spherical, regular particles with known density and Re < 1 (if the quartz sand density is used as the standard, the corresponding sphere diameter is 0.06 mm) and the sediment particles fall vertically in the quiescent water. The inertial force generated by the surrounding water body can be ignored, written as:
ω = ρ s ρ f g d 2 18 v
where ρ s is the particle density, ρ f is the fluid density, and g is the acceleration of gravity.
However, in natural environments, the majority of sediment particles exhibit irregular shapes, resulting in higher sediment settling velocities being calculated using the Stokes formula. In 1876, Oberbeck [13] introduced a settlement formula for ellipsoids during slow descent. Subsequently, in 1997, Cheng [14] established the widely acknowledged relationship between the resistance coefficient and particle Reynolds number, along with summarizing the settlement formula applicable to natural sand particles. Building upon this work, Riazi [15] enhanced the accuracy of the resistance coefficient, thereby deriving a more precise equation for sediment settling velocity, written as:
ω 2 = 4 3 C 1 g a 4   ×   v d n 1.5   ×   g 0.5 + a 5 a 2 S f 2 3 d n
where C is the sediment particle relative density, S f is the Corey shape coefficient, d n is the sediment particle nominal diameter, and a 4   and   a 5 are shape-factor-related variables that are used to calibrate the slope of the drag coefficient under laminar conditions and correct the shape factor under turbulent conditions, respectively.

2.1.2. Sediment Group Settling Velocity

In fact, the sedimentation of particles entails the collective settling of numerous particles with varying sizes, rather than individual settlement events. Group sedimentation velocity can be categorized into two main types: non-viscous and viscous particle group settling formulas. Richardson [16] derived a formula describing the impact of high sediment concentration on the settling velocity of non-cohesive sediment based on the observed similarity between settlement resistance at high concentrations and seepage resistance, written as:
ω ω 0 = 1 S v m
where m is the adjustment index and S v is the volume sediment concentration of muddy water.
The formula is derived from the dimension and lacks theoretical basis. Chien [1] believed that the value of m in this formula is related to the Reynolds number, and the minimum value is 2.25. Li [17] believed that the index m in the formula increases with the decrease in particle number and is related to the flow pattern around particles, so the value of m is difficult to determine. When S v = 1 , the sedimentation velocity reaches zero but the volume sediment concentration cannot reach 1, and when S v = 0.4~0.64, the sediment particles have been in close contact with each other; at this time, the sedimentation velocity can be considered to be zero [12].
Richardson added a correction coefficient β to apply the formula to the range of cohesive sediment, namely the Richardson–Zaki formula.
ω ω 0 = 1 β S v m
where β is the correction coefficient, which is determined by the type and structure of cohesive sediment.
Qian [18] conducted a comparative analysis between the settlement behavior of sediment groups and individual particles in clear water. The study comprehensively considers the influence of bulk density (buoyancy), viscosity (resistance), and convection (resistance) on settling velocity in contrast to the modified Richardson–Zaki formula. However, it is essential to note that the settling process of cohesive sediment groups primarily involves the settling of flocs rather than individual particles. Thus, deriving group settling velocity solely from the settling velocity of single particles lacks consideration of the specific mechanisms involved in settling. Meanwhile, Chu [19] examined the sediment concentration of muddy water and the size distribution of sediment particles, deriving settling velocity formulas for both uniform and non-uniform mixed sands, written as:
ω ω 0 = 1 1 + 0.14 d 1 0.5 S V 3.5
ω ω 0 = 1 1 + α 0 1 δ d 1 β d p S V 3.5
where d 1 is the equivalent particle size of the particle, α and β are the coefficients related to particle shape and surface smoothness, and δ is the thickness of the bound water film on the particle surface.
On the basis of Chu’ s formula, Meng [20] considered the influence of muddy water viscosity change on sediment settling velocity and deduced the formula of group settling velocity of viscous fine particles in muddy water. By comparing the formula with the Stokes formula and the Ruby formula by using field measured data, it is concluded that the correlation coefficients of Meng’s formula, Stokes’s formula, and Ruby’s formula with the measured data are 0.933, 0.884, and 0.898, respectively, so the calculation accuracy of Meng’s formula is higher.

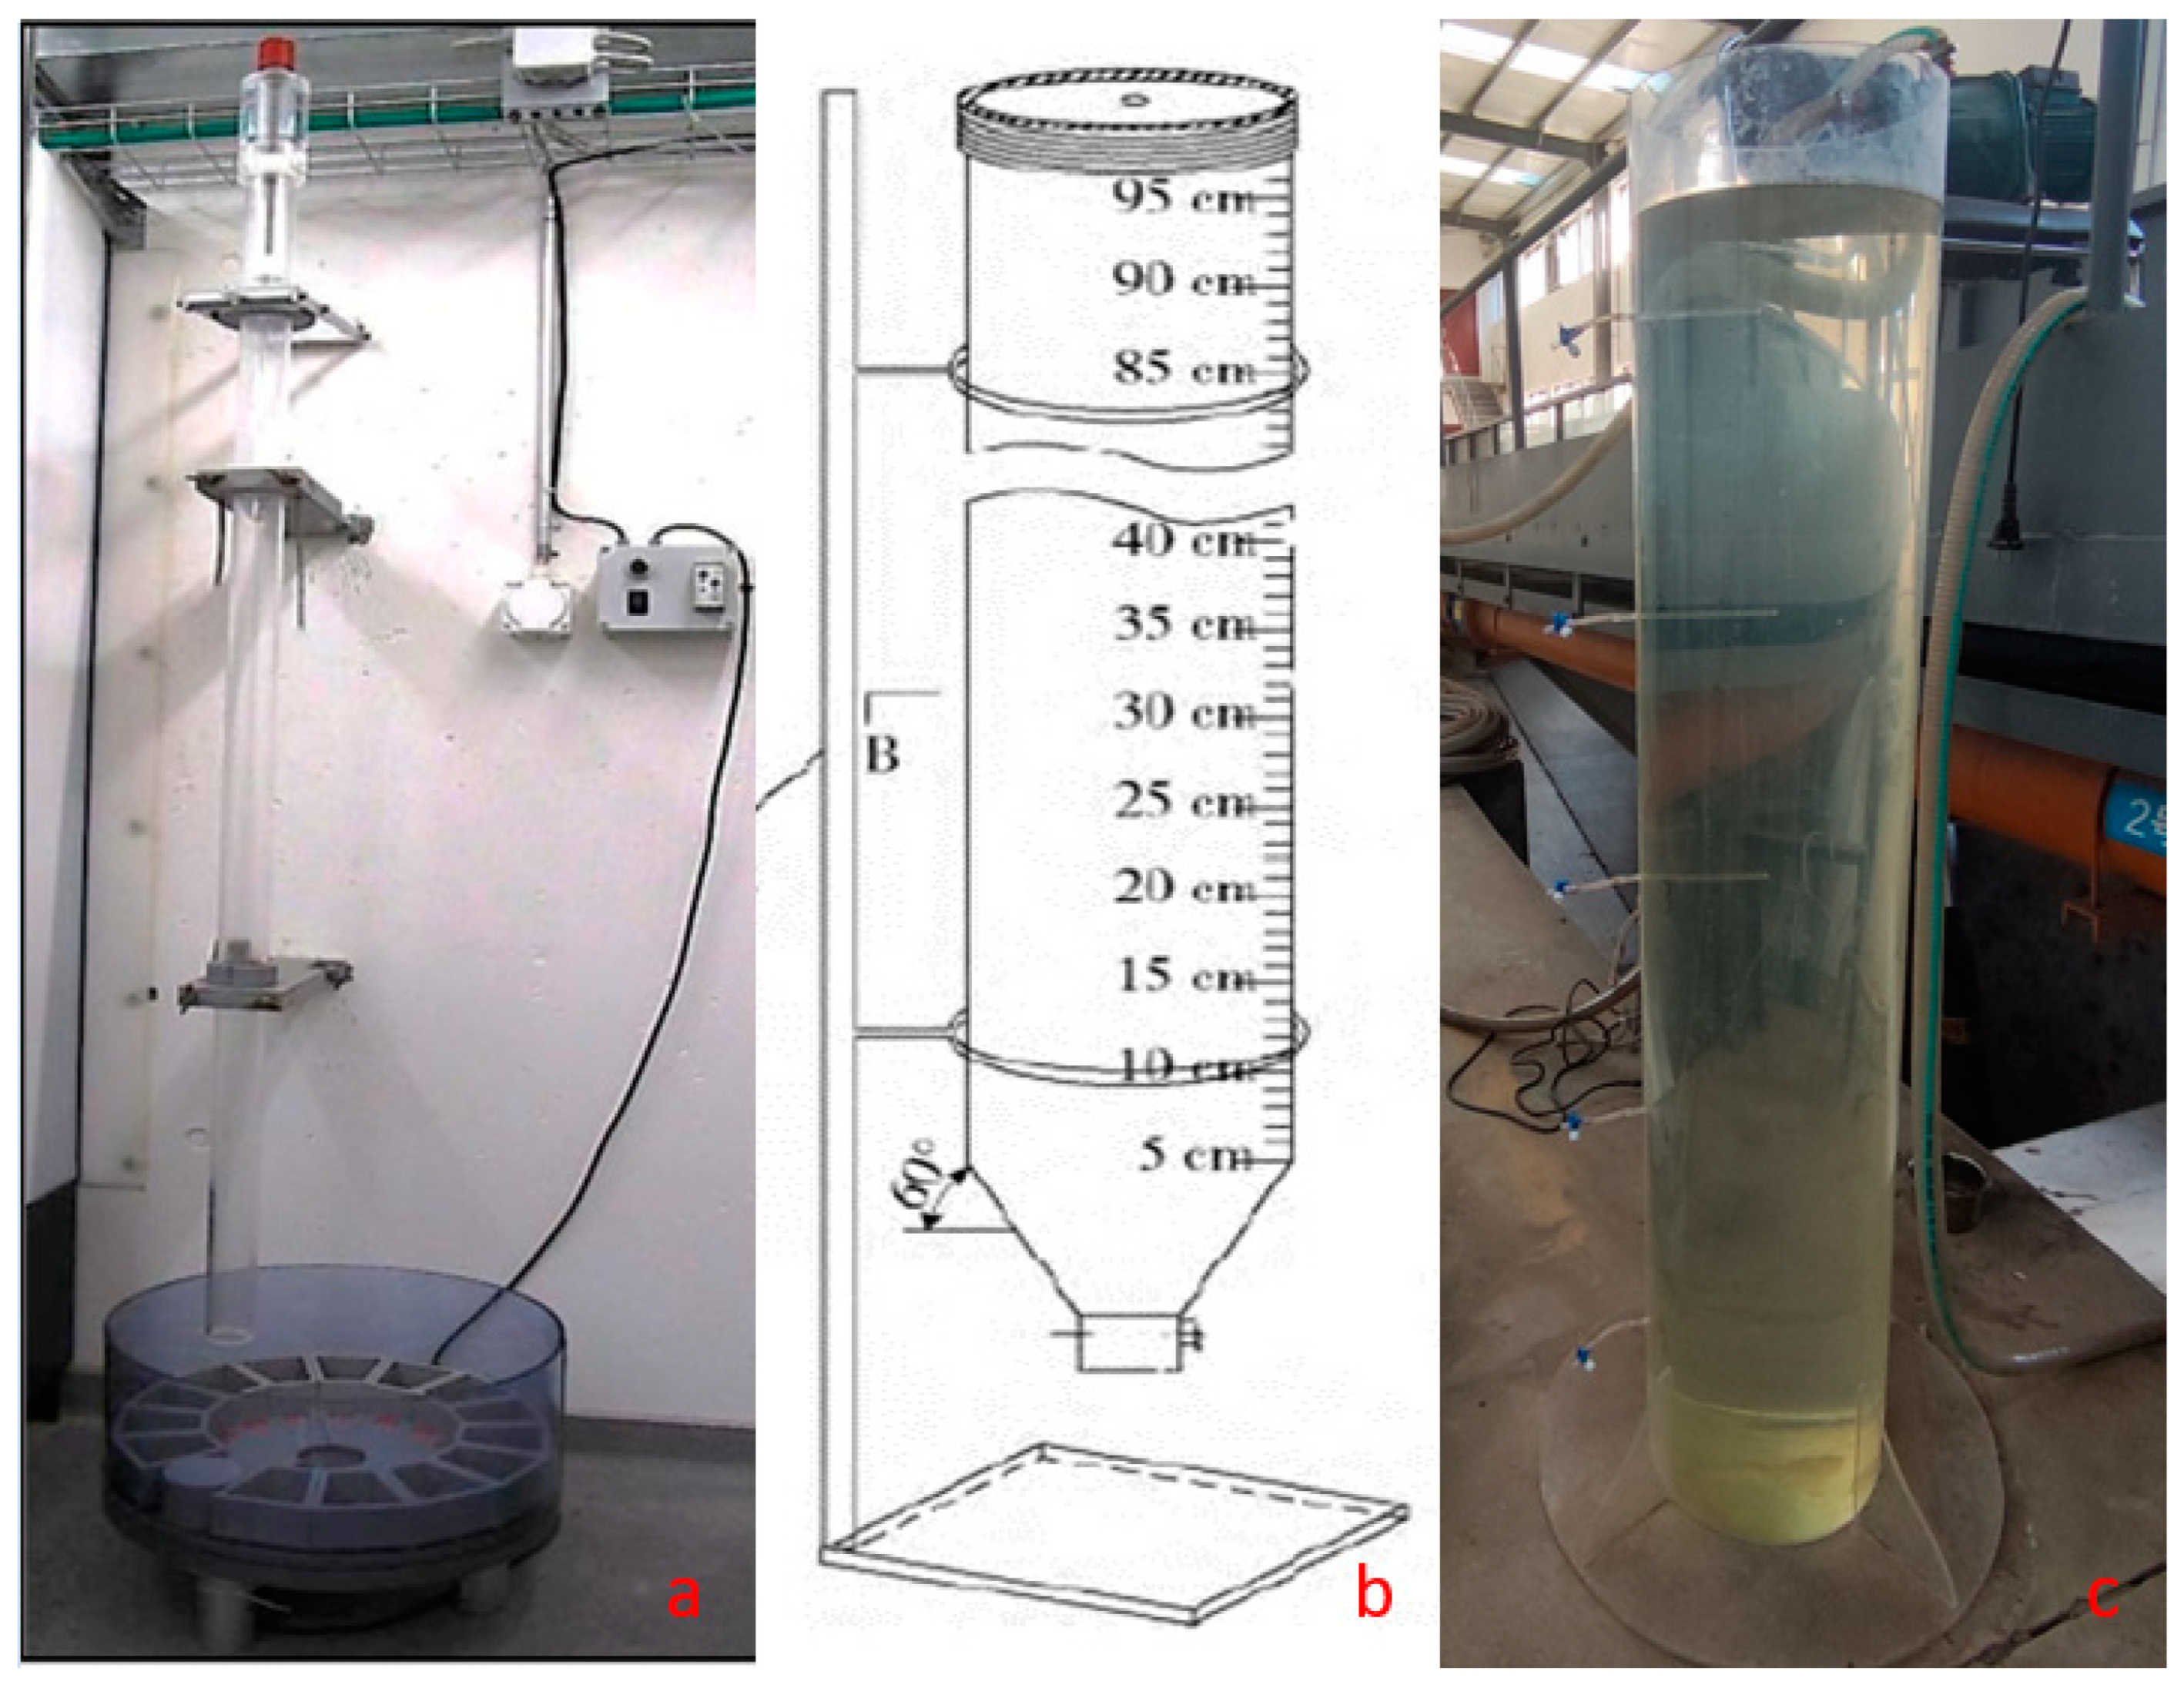
2.2. Laboratory Settlement Tube Measurement

The advantage of measuring the settling velocity in the laboratory is that it can measure the settling velocity under controllable conditions. Laboratory measurements can be divided into two categories according to the state of the sample at the beginning of sedimentation: the continuous sedimentation method and mixed sedimentation method.

2.2.1. Continuous Settlement Method

Initially, the continuous sedimentation method commences with filling the sedimentation tank with pure water. Once the water becomes stationary, the sediment sample is injected from the top of the tank and the timing begins. The sediment particles swiftly descend, gradually filling the entire tank. Larger particles, those exceeding 200 μm in size, settle first at the bottom, while particles of smaller sizes naturally settle throughout the water column. Over time, sediment particles of varying sizes accumulate at the tank’s bottom. Ultimately, the rate of sediment deposition at the bottom is observed.
The representative settling tanks utilized in the continuous settlement method include those designed by Cole and Edlefsen [21] or Rigler [22] and a novel settling tank developed by Hu [23], drawing from the frameworks established by Hairsine and McTainsh [24] and Loch [25]. Hu’s settling tube comprises four components (Figure 1a): an injection device, settling tube, turntable, and control panel. The settling tube, constructed from a semi-fixed transparent PVC material, measures 1.8 m in length, with an inner diameter of 0.1 m. Water is injected into the tube, followed by rapid sediment injection from the top using the injection device. A motor affixed to the column rotates the turntable systematically, ensuring each sampling plate aligns precisely beneath the settling tube. Post-experimentation, drying and weighing procedures are conducted to ascertain sediment settling velocity distribution. However, in the continuous sedimentation method, sedimentation within the settling tube is unrelated to sediment quantity, thus precluding the expression of the sediment concentration’s influence on settling velocity.

2.2.2. Mixed Sedimentation Method

The mixed settlement method involves the sediment particles reaching the maximum uniform mixing state in the settling tube, starting the settlement timing, and sampling at the set time interval and sampling position. The sampling position can be one or more fixed positions. It mainly includes two types.
(1)
Bottom Withdrawal Tube (BWT)
In 1924, Oden [26] sampled sediment water from the bottom of the settling tank at various intervals to determine the weight of remaining sediment over time. When the sediment concentration is high, the ratio of height to time h/t is correlated with the sediment settling velocity. Consequently, the bottom withdrawal tube (BWT) method is employed to investigate sediment group settling velocity [27]. However, maintaining a constant water surface height throughout the settling process is essential. Anon [28] addressed this by ensuring the settling tube’s height remained fixed during the 1943 BWT experiment. The experimental findings indicate that it is only suitability for particles smaller than 60 μm.
In 1988, Lovell and Rose [29] enhanced the bottom withdrawal tube (BWT) experiment to the modified bottom withdrawal tube (MBWT) experiment (Figure 1b), employing precise theory to extend the accurate measurement range of sediment settling velocity from 0.001 m/s to 0.5 m/s. The MBWT method enables direct measurement of the settling velocity distribution in mixed suspension, encompassing soil aggregates with varied particle sizes and mineral single particles. Moreover, it offers a broader measurement range compared to the traditional pipette and specific gravity methods, effectively minimizing damage to aggregates [30,31,32].
(2)
McLaughlin Method
The McLaughlin method (Figure 1c) [33] is an improvement of the BWT. It can sample at different heights of the settling tube, measure the sediment concentration at each height, and obtain the distribution of the sediment concentration along the water depth at different times. Finally, McLaughlin [34] derived the particle continuity equation under hydrostatic conditions from the sediment transport equilibrium equation, written as:
ω ¯ S Z = H = 0 H 𝜕 S 𝜕 t d z = 𝜕 𝜕 t 0 H S d z
where ω ¯ is the average sedimentation velocity of sediment, S is sediment concentration, z is the water depth, and t is time.
By measuring the vertical distribution of the sediment concentration at different time points, the instantaneous sedimentation velocity ω ¯ at various water depths z can be determined using the method of graphical integration. Despite the McLaughlin method’s capability to ascertain the sediment settling velocity at different times and positions, it still possesses certain shortcomings. Firstly, the sampling port is situated on the wall of the settling tube, resulting in a deviation from the actual sediment concentration due to sidewall effects. Secondly, the extensive number of sampling instances and resultant disturbance to the water body make it challenging to maintain its natural sedimentation process. Moreover, the sediment settling velocity varies with time and water depth, making it difficult to establish a representative settling velocity. Building upon the repeated deep pipette method, Yang [7] employed a needle tube to sample from the center of the settling tube, minimizing sidewall effects and water disturbance, thus yielding a settling velocity more representative of the quiescent water’s general state.

2.3. Field Measurement

The field measurement methods for sediment settling velocity can be divided into the acoustic method, optical method, and imaging method. The acoustic method includes acoustic Doppler velocimetry (ADV), the optical method includes the optical backscatter sensor method (OBS), laser in situ scattering transmissometer method (LISST), and optical remote sensing method, and the imaging method includes the particle tracking velocimetry (PTV)/particle image velocimetry (PIV) method and particle imaging camera system (PICS) method. These methods for measuring the sediment settling velocity in the field actually calculate the settling velocity by measuring the sediment concentration or particle size.

2.3.1. ADV Method

Acoustic Doppler velocimetry (ADV) primarily detects backscattered sound intensity, which is closely linked to sediment concentration and particle size. Hence, scholars [35,36,37] initially established the correlation between backscattered sound intensity and sediment concentration to derive sediment concentration values. Subsequently, they established the relationship between sediment concentration and sedimentation velocity to determine the settling velocities. Numerous formulas exist for calculating the settling velocity based on ADV sediment concentration data, each offering distinct advantages. In this study, two broadly applicable formulas were chosen for analysis, written as:
ω S = v S ¯
v S ¯ = m S n
where v is the vertical velocity fluctuation, S is the sediment concentration fluctuation estimated by ADV, ‘-’ is the symbol of time average; S = S ¯ is the time-average sediment concentration, and m and n are constants obtained by nonlinear least squares fitting. Equation (9) is linear fitting ω = m S n 1 in Equation (10) [36].
The two aforementioned formulas are applicable under specific conditions: (1) steady state; (2) negligible horizontal gradient of sediment concentration; and (3) known vertical average velocity. Equation (10) suits a wide concentration range, while Equation (9) is employed at lower concentrations. Gao [38] suggests that Equation (10) is preferable as it provides a concentration-based settling velocity across diverse conditions, yielding more precise results compared to the average settling velocity. It allows for variable settling velocities corresponding to varying sediment concentration conditions, exhibiting a robust correlation coefficient. The acoustic Doppler velocimetry (ADV) method, extensively employed in settling velocity measurement via Doppler frequency shift, is increasingly favored for field measurements [39,40,41]. The primary advantage of this indirect settling velocity estimation method lies in its non-intrusive nature, which preserves surrounding turbulence and, consequently, flocculation kinetics.
Table 1 illustrates substantial variations in the sediment settling velocity measurements obtained using ADV across different regions. Discrepancies in sedimentation velocity between different times and positions within the same area can span two orders of magnitude. Several factors may contribute to this phenomenon: Firstly, sedimentation velocities may differ at various times and locations. Secondly, inconsistencies may arise from variations in the calibration methods among researchers employing ADV. Thirdly, disparate calculation formulas are utilized by different researchers, each with its specific scope of applicability, resulting in variations in results. Consequently, it can be inferred that ADV lacks standardized protocols for sedimentation velocity measurements. Primarily, there is a deficiency in calibration standards. Diverse calibration methods are employed by researchers in different regions, making it uncertain which calibration method yields sedimentation velocity closest to reality. Secondly, there is a need for standardization in calculation formulas. The applicability scope of each formula should be defined, followed by the determination and application of appropriate formulas to calculate the settling velocity.

2.3.2. Optical Method

(1)
OBS
The OBS is unable to directly measure sedimentation velocity. Instead, it indirectly estimates it by tracking changes in sediment concentration through a formulaic model. Utilizing sensors, the OBS emits near-infrared light to monitor a portion of the light scattered by suspended particles for sediment concentration measurement. Estimation of the settling velocity typically involves employing a simple linear model. This model assumes a constant settling velocity for particles, disregarding particle diffusion and other potential influencing factors, written as:
ω = h t
where h is the height of a cylindrical container and t is the measurement time.
It can also be a more complex model in practical applications due to the influence of particle diffusion and water flow, as well as the possible nonlinear relationship between particle concentration and sedimentation velocity. For example, it may be necessary to use some mathematical models to describe the change in particle concentration and then estimate the settling velocity of particles by fitting the parameters of these models, such as in the formula of Rouhnia [46]
d S h 1 A d t = ω C A
where h 1 is the depth of the selected layer, t is time, and A is the cross-sectional area of the upper part of the container
The OBS is capable of measuring high-resolution data within the range of 0.1 to 200 g/L. However, at higher concentrations, varying degrees of multiple scattering and absorption must be taken into account [47]. OBS demonstrates resilience in harsh environmental conditions, including the deep sea or lake bottoms, enabling continuous monitoring of particulate matter concentrations. This feature proves invaluable for long-term or large-scale monitoring projects. Nevertheless, OBS does possess certain limitations. Firstly, it solely provides measurements for the total concentration of particulate matter, lacking information regarding particle size or shape. Secondly, its sensitivity to the color and composition of the particles may impact the accuracy of the measurement results.
(2)
LISST
LISST employs laser diffraction principles to measure particle size. This method involves directing a laser beam onto particles within the water, causing a portion of the light to deviate from its original path. Subsequently, the redirected light is focused through a lens onto a detector ring within the monitoring apparatus. By analyzing a narrow range of scattering angles, particle size can be determined. The spatial distribution of particles is derived from the observed pattern on the detector ring. The volume concentration within specific particle size intervals is then calculated by multiplying the area associated with each interval by its corresponding median diameter. Cumulatively, the total volume concentration across the sample is determined by summing these individual volume distributions [48]. Agrawal [48] initially proposed employing LISST for sedimentation velocity determination. Utilizing an inversion algorithm, he optimized the conversion of sedimentation histories for each particle size interval into sedimentation velocities. Subsequent scholars have iteratively refined algorithms for calculating sedimentation velocities based on particle size and volume concentration. These enhancements, such as Pedocchi’s improved projection algorithm [49] and Ahn’s maximum entropy classification [50], have contributed to the improved accuracy of LISST in assessing particle size and sediment concentration distributions.
Although the LISST instrument is capable of capturing the sedimentation velocity of sediment particles in three spatial dimensions, over time, across particle volumes, and within multiple particle size ranges, it is also associated with certain limitations. Firstly, LISST is susceptible to turbidity interference. When light transmittance falls below 30%, the phenomenon of multiple scattering begins to manifest, wherein scattered light undergoes rescattering. Consequently, as transmittance decreases, the intensity of multiple scattering increases. Theoretical analyses of multiple scattering indicate that neglecting these effects tends to result in underestimated particle size distributions. Secondly, LISST may be susceptible to rupture in cases where aggregates are not firmly bound [49]. Thirdly, while LISST is capable of measuring particle size and settling velocity, it does not provide information regarding the path of settling, nor can it measure the vertical settling velocities of sediment in water. Finally, one challenge in estimating volume concentration using LISST lies in the difficulty of determining the volume calibration constant of particles due to their size–density dependence and susceptibility, coupled with the possibility of misalignment or other physical interferences with the laser beam during deployment [51]. For precise measurements of aggregate size in aquatic environments, techniques involving video and still photography remain preferable [35].
In field measurements, a combination of LISST and OBS can be utilized to calculate the sediment settling velocity [52,53]. The suspended sediment concentration (SSC) and volume concentrations (VC) obtained from OBS and LISST are employed to estimate particle density. Subsequently, the effective density estimation is applied within Stokes’ law and Equation (13) to derive the average sediment settling velocity [54].
ρ = S S C V C
ω = D m 2 ρ g 18 μ
where D m is the average grain size of particle distribution and ρ is the difference between the particle density and water density.
(3)
Optical Remote Sensing Method
Nasiha [55] proposed a model utilizing optical measurements for sedimentation velocity assessment. This research uncovered a notable correlation between particle shape, size, and composition and the backscattering and attenuation coefficients. These optical properties can be derived from remote sensing reflection data [56]. By integrating the derived parameter formula and numerical values into the model, the sedimentation velocity is determined, followed by model evaluation using independent datasets. The results demonstrate that the remote sensing inversion algorithm for intermediate model parameters, such as the sediment sedimentation velocity, exhibits low error rates and high correlation coefficients. However, it is important to note that this method applies solely to non-cohesive sediments, excluding flocculated or cohesive sediments, thus posing challenges in extending the model to other regional waters [57]. Consequently, the utilization of optical remote sensing methods should evolve towards addressing flocculation or viscous sediments, necessitating the development of corresponding models.
ω s = 42 × 10 6 D 50 + 0.176 × 10 8 D 50 2 + 290.93 D 50 S G 10.1148 C S F 44.57 D 50 S G l n C S F + 8.543 D 50 S G 1 2 × 11.135 × 10.1148 C S F 1.706 l n C S F + 0.327 1
where D 50 is the median particle size, C S F is the shape factor, and S G is the specific gravity of sediment.

2.3.3. Imaging Method

(1)
PTV + PIV Method
Particle tracking velocimetry (PTV) enables the tracking of particles in the video, extracting data such as the size, shape, position, and velocity of individual particles (with a diameter greater than or equal to 30μm) from one frame to another within the image sequence. This information serves as a foundation for establishing the correlation between the particle size and shape and the sedimentation velocity [58]. Subsequently, the fluid velocity is determined via particle image velocimetry (PIV), while the sedimentation velocity (the vertical component of particle velocity relative to the fluid) is calculated using a specific formula.
ω = z t ω f
where z is the vertical displacement of the center of mass,   t is the time of tracking the center of mass, and ω f is the vertical fluid velocity component.
The advantages of employing particle tracking velocimetry (PTV) and particle image velocimetry (PIV) for measuring sediment settling velocity lie in their ability to swiftly sample during field experiments, rapidly analyze water columns using image sequences recorded at 2 min intervals, and track a large number of particles. This approach yields improved statistical characteristics regarding particle size, settling velocity, and suspended particle density, thereby significantly reducing the uncertainty associated with settling velocity measurement. Nonetheless, PIV and PTV may encounter similar hydrodynamic deviations as sediment traps during particle collection, as the data are only acquired after the sediment column captures the particles [59]. Simoncelli [59] introduced a 3D-PTV method for determining the particle settling velocity. In comparison to the PICS method, this alternative is more cost effective and simpler to purchase, assemble, and operate, offering enhanced automation. It eliminates the need for collecting, processing, and analyzing samples.
(2)
PICS method
PICS shares conceptual similarities with INSSEV (in situ settling velocity instrument) [60], VIS (video system) [61], and other video equipment used for on-site particle sedimentation measurement. PICS is specifically designed for high-quality in situ image sequence acquisition within water bodies. Its sample collection, optical, and lighting design aim to generate precise images, while automatic image processing programs are developed to enhance digital images and identify and track particles across consecutive frames. Subsequently, image analysis enables the determination of particle characteristics such as projection area, centroid position, short and long axis lengths, and eccentricity. Based on these observed characteristics, the sedimentation velocity is calculated [62] by:
ω = θ g 18 μ ρ 0 ρ w d 0 3 n f D f n f 1 1 + 0.15 R e p 0.687
where θ is the particle shape factor (1 is the sphere), ρ 0 is the primary particle density, ρ w is the water density, d 0 is the primary particle size, d f is floc diameter, n f is the parting dimension, and R e p is the floc Reynolds number.
The PICS system integrates particle image velocimetry (PIV) and particle tracking velocimetry (PTV). PIV tracks the velocity of small particles, also serving as a proxy for fluid velocity, while PTV tracks the velocity of larger particles [63]. Nonetheless, PICS is a manual tracking method, which proves cumbersome, labor intensive, and prone to relatively large errors in estimating the settling velocity.
Currently, both the domestic and international research on sediment settling velocity predominantly relies on field instruments. Despite some advancements, the outcomes are not entirely satisfactory. This is chiefly attributed to several factors:
  • The introduction of instruments into the water interferes with the natural settlement state.
  • Submerging the instrument in water often disrupts the original floc structure, leading to floc deposition or rupture during sedimentation.
  • In situ measurements typically rely on instrument-measured sediment characteristics such as particle size, density, and concentration, subsequently employing empirical formulas to calculate sediment settling velocity. The accuracy of these calculations hinges on the formula’s applicability to the specific area.
  • On-site testing necessitates advanced precision instruments, most of which are costly and often single function. Measuring the sediment settling velocity entails the utilization of various equipment, which is further complicated by the challenging on-site environment, susceptibility to instrument damage, and inconvenient maintenance, thereby driving up costs.
Hence, achieving a more precise on-site measurement of sedimentation velocity hinges on the invention and innovation of scientific and technological means.

3. Influencing Factors

Sediment deposition occurs in natural water bodies, which harbor various substances including sediment, protozoa, algae, bacteria, viruses, high-molecular organic matter, salts, colloids, and water temperature. These factors inevitably influence the natural sedimentation process to varying degrees. Below, we delve into the effects of sediment concentration, temperature, salinity, organic matter content, and particle size and shape on the sediment settling velocity.

3.1. Soil Properties

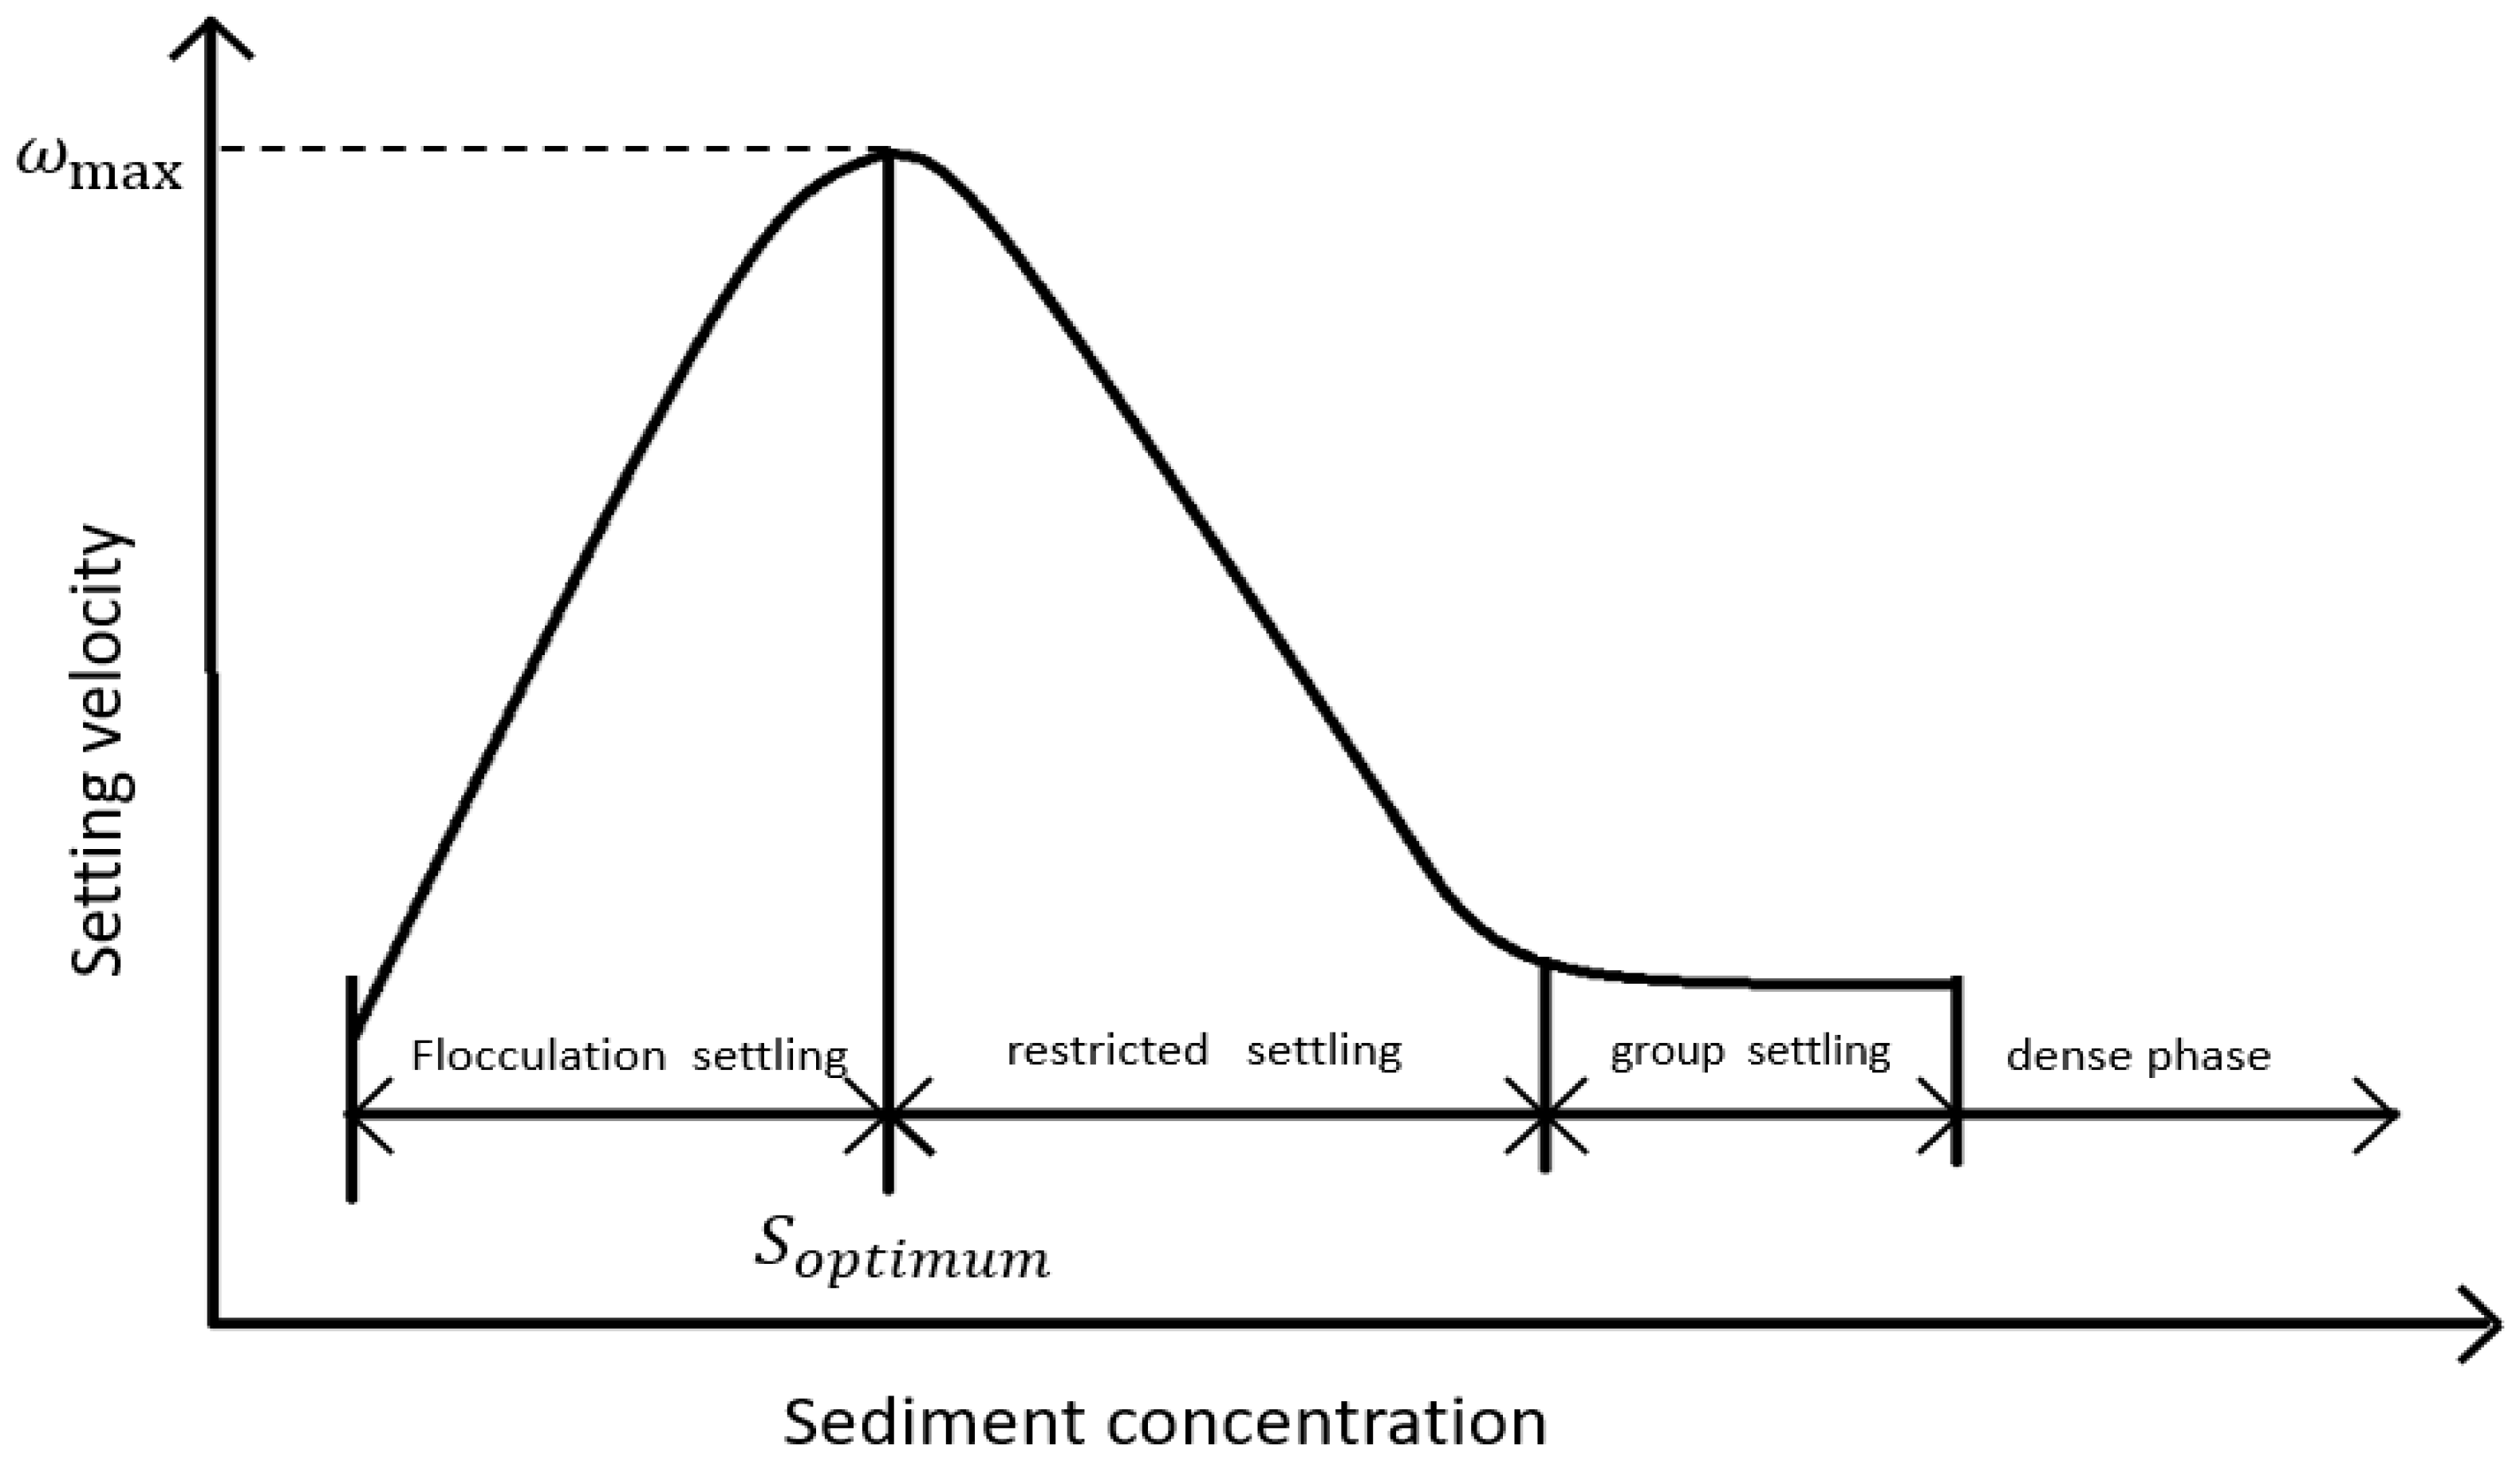
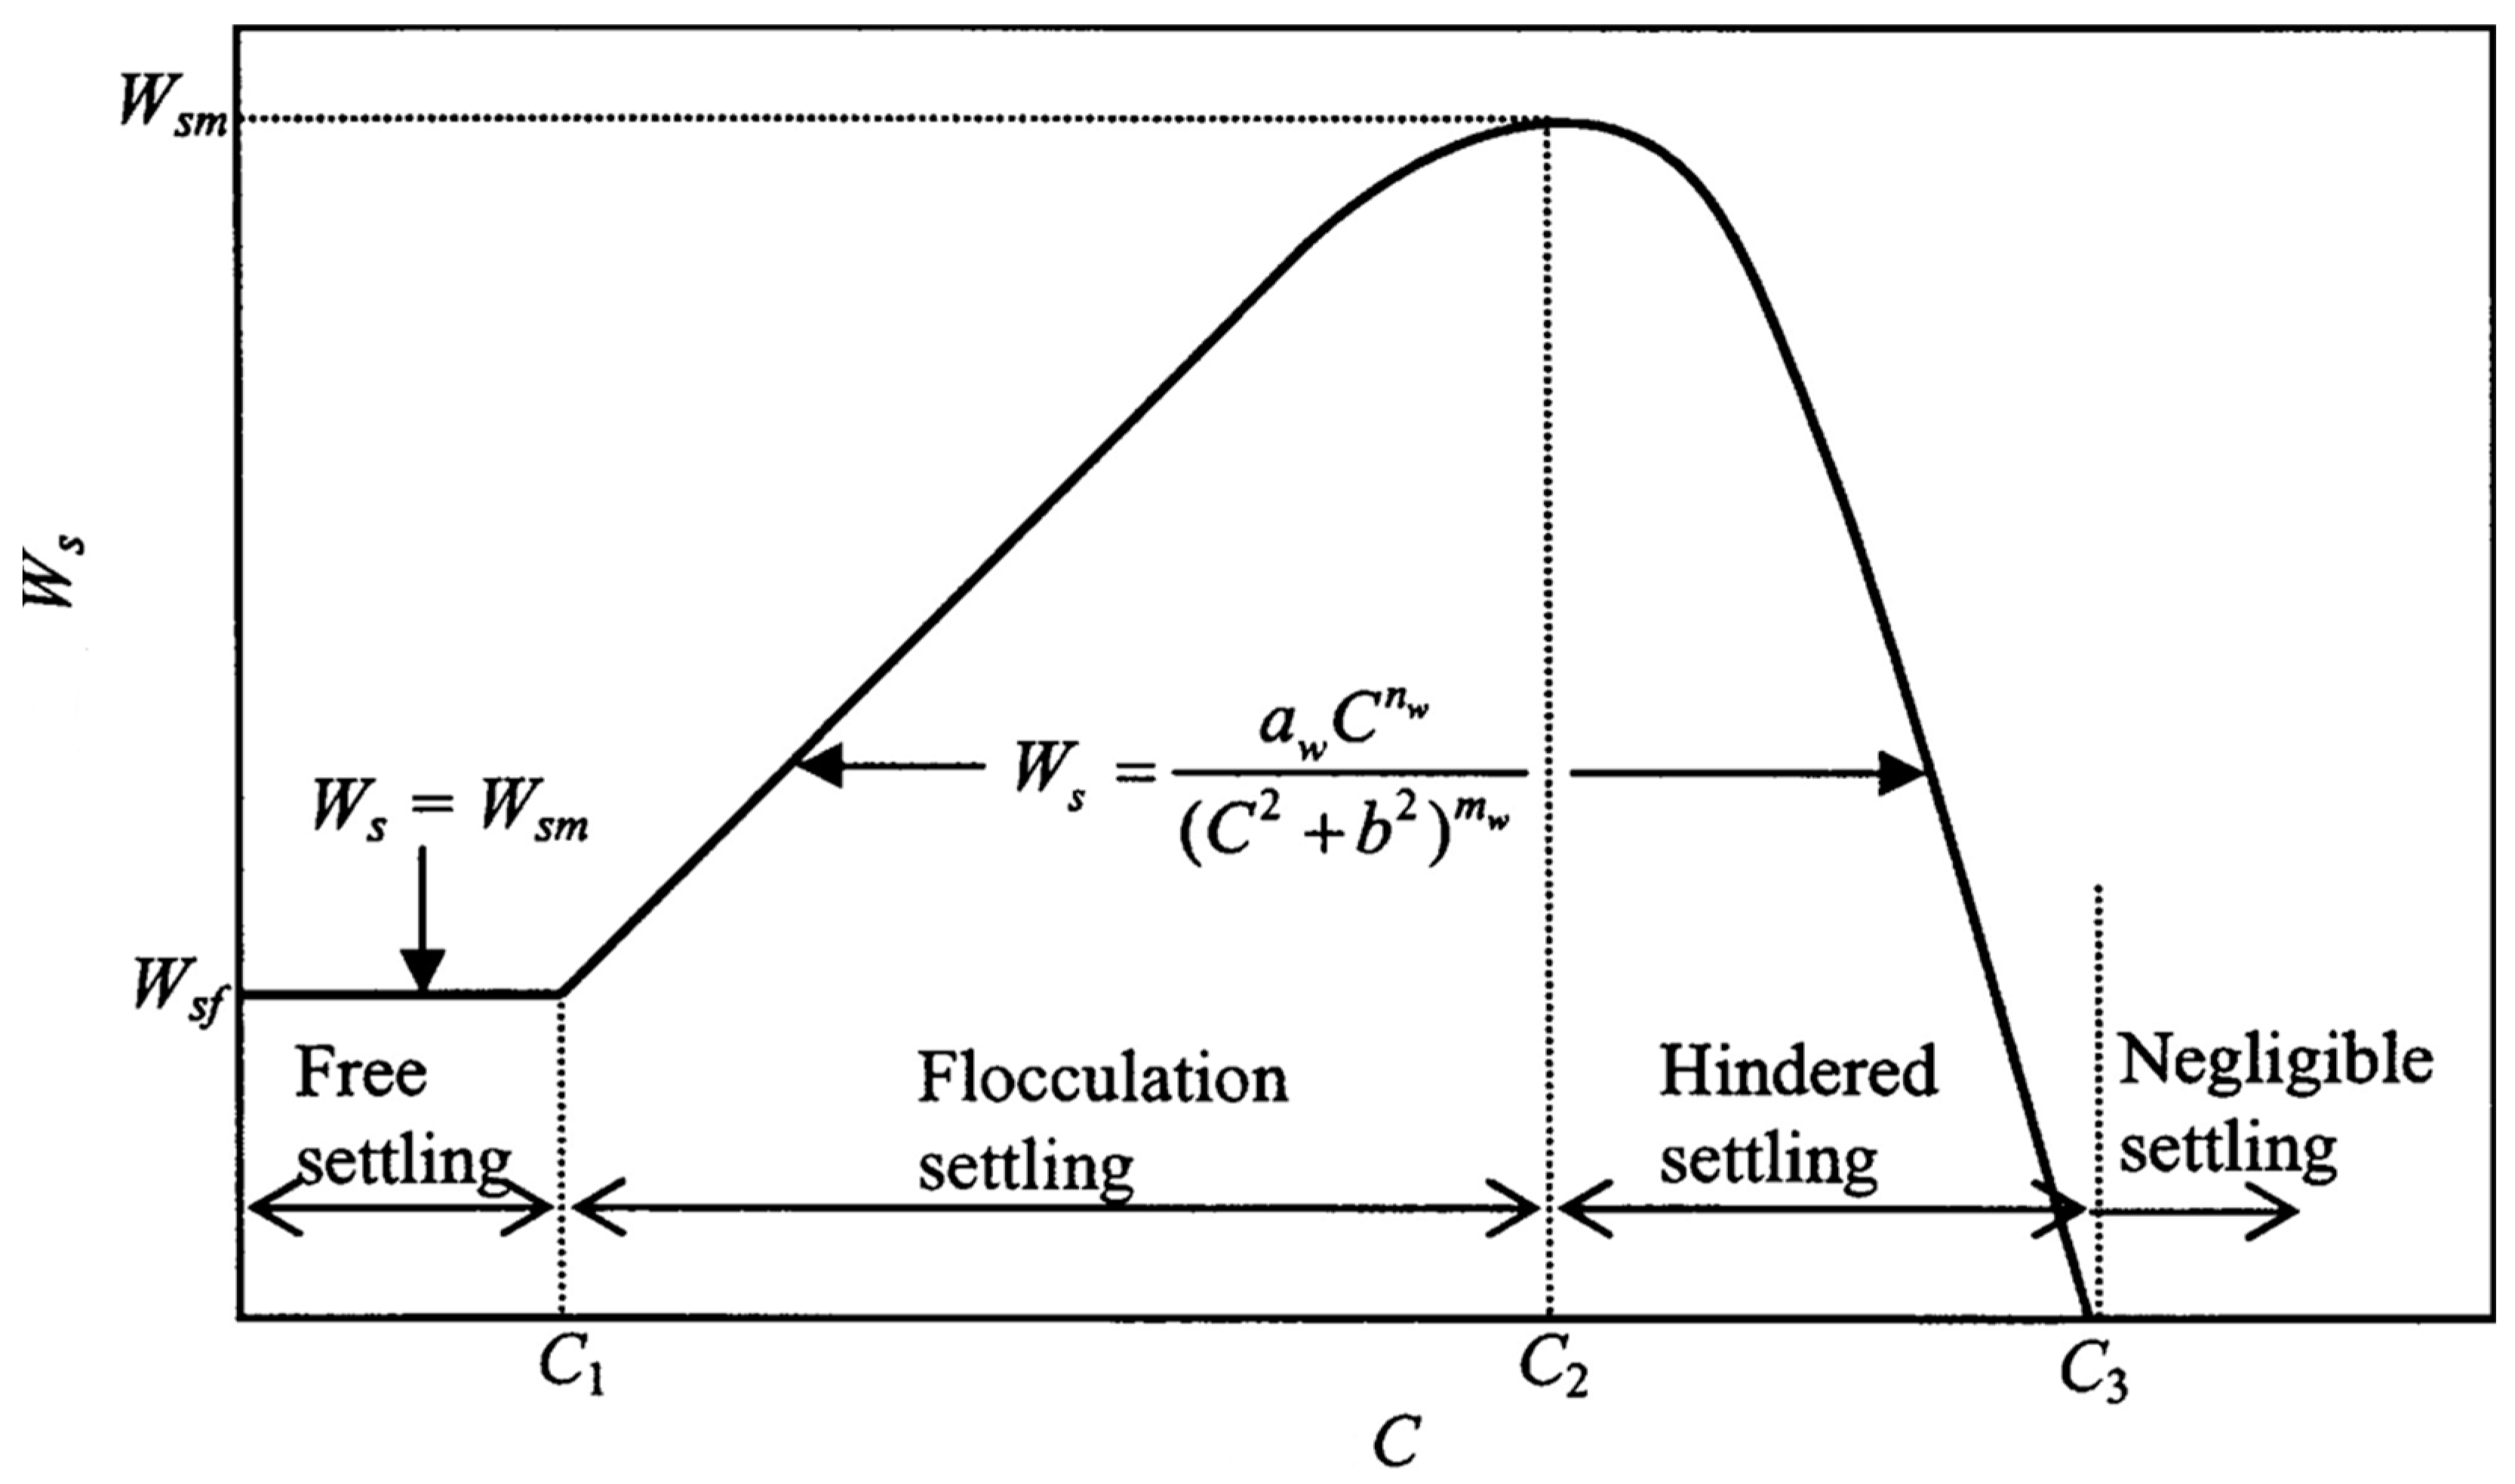
3.1.1. Suspended Sediment Concentration (SSC)

The influence of suspended sediment concentration (SSC) on settling velocity can be categorized into the effects of viscous and non-viscous sediments. Non-cohesive sediment undergoes free and compression sedimentation based on the forces acting on particles during settling. Free settlement refers to the independent subsidence of sediment particles, while compression sedimentation involves force transfer between particles, leading to pore reduction, increased concentration, and structural deformation [64]. The transition from free to compression sedimentation occurs at the critical concentration where sedimentation units begin connecting. In the free settling stage, the settling velocity of non-cohesive sediment increases with a rising SSC. However, during compression settlement, the settling velocity distribution becomes uneven. Due to discontinuous channel distribution and a varying concentration, some particles settle smoothly, while others encounter significant resistance or are supported by structures, sinking only with them.
The sedimentation of cohesive sediment in quiescent water is significantly more intricate than that of non-cohesive sediment, involving not only physical mechanical forces but also colloidal chemistry. Huang [65] conducted hydrostatic sedimentation experiments on cohesive sediment in various ports and estuaries, identifying four distinct stages of sedimentation: flocculation settling, restricted settling, group settling, and dense phase (Figure 2). Mehta [66] synthesized previous research on the relationship between the suspended sediment’s average settling velocity and concentration. According to the findings, the change in settling velocity with the suspended sediment concentration (SSC) can be delineated into four stages: free settling, flocculation settling, hindered settling, and negligible settling (Figure 3). Generally, the relationship between the settling velocity and SSC comprises a positive correlation stage followed by a negative correlation stage. Within a certain SSC range, the settling velocity increases with SSC; however, upon surpassing a threshold, increasing the SSC leads to a decreased settling velocity. There exists an optimal SSC range for flocculation and a limit to settling velocity. Due to variations in the regions, sediment samples, properties, and experimental methodologies employed by researchers, the optimal flocculation SSC range and ultimate settling velocity obtained may vary.
The flocculation settling stage is when the SSC is low, and the SSC can both slow down the settling velocity and accelerate sedimentation due to flocculation, with the latter effect being greater than the former.
The restricted settling stage occurs when the initial SSC exceeds a certain level, at which point the hindering effect of the SSC quantitatively exceeds the accelerating effect of flocculation.
The group settling stage is when the SSC further increases and the viscous sediment flocculates to form a larger integral structure, maintaining a relatively stable state in the water body. In the dense phase, constant velocity sedimentation does not exist; it gradually consolidates as the pore water between particles overflows, and the flow state evolves from a plastic state to a solid state.
Free settling stage: When the SSC is very low, the sedimentation is mainly single-particle sedimentation and the sedimentation velocity is mainly affected by the particle size. In a certain range of SSC, the sedimentation velocity is basically unchanged.
Flocculation settling stage: When the SSC continues to increase, single-particle sediment begins to flocculate, or small flocs gradually form large flocs. At this time, the settling velocity is obviously accelerated compared with the free setting stage and greatly exceeds the former. At the end of the flocculation setting stage, the settling velocity will increase with the SSC to a certain limit value.
Hindered settling: Due to the continuous increase in SSC beyond a certain extent, it will lead to the restriction effect on the turbulence of water flow beyond the flocculation acceleration effect. At this time, some flocs will even disintegrate and the settling velocity is negatively correlated with the SSC.
Negligible settling: With the increase in SSC and the decrease in settling velocity, it belongs to the drainage compaction stage and the settling velocity is very small, which can be ignored [67].

3.1.2. Particle Size

The settling velocity of sediment particles varies with their particle sizes. According to Stokes’ law, particles or flocs with larger sizes settle more rapidly compared to those with smaller sizes, provided they have the same composition and density. Conversely, when considering flocs and solid non-porous particles of identical size, flocs exhibit reduced resistance during sedimentation due to their porous structure, which contains internal water. Consequently, flocs settle faster than solid particles of the same size [68]. Data from Tan [69] illustrate that the sedimentation velocity of pure clay flocs notably exceeds that of porous lightweight clay particles of equivalent size. Moreover, for initially dispersed fine particles, larger flocs experience a significant increase in settling velocity.
However, sediment particles do not continuously flocculate; rather, there exists a critical particle size for flocculation. Upon reaching this critical size, flocculation ceases and the particle size either remains unchanged or leads to dispersion through collisions with other particles or flocs. Previous research has demonstrated the presence of such a critical flocculation particle size, with flocculation occurring only when the particle size is smaller than this critical value. Chien [1] suggested a critical particle size of 0.01 mm for flocculation, while Zhang [70] indicated a value of 0.03 mm for natural sand in actual water. Tang [71], through experimental analysis, determined critical flocculation particle sizes of 0.0325 mm and 0.02 mm for the Yangtze River Estuary and Hangzhou Bay, respectively. It is important to note that particle size, being one of the fundamental characteristics of sediment, is highly susceptible to various factors such as sediment concentration, salinity, regional sediment properties, temperature, and others. In practical research and engineering applications, these factors must be comprehensively considered to provide a more accurate description of the influence of particle size on the sediment settling velocity.

3.1.3. Particle Shape

In estimating the settling velocity of sediment particles, the particle shape factor is frequently disregarded due to our limited understanding of how particle size impacts the sedimentation process [72]. Spherical particles typically settle faster in water owing to their relatively low resistance to fluid, aligning with the principles of Stokes’ law. In contrast, non-spherical particles, such as platy or elongated ones, may encounter greater fluid resistance, affecting their settling velocity. This is because non-spherical particles in water may undergo rotation, rolling, or other complex motions, thereby increasing resistance. Slender particles generally exhibit slower settling velocities as they tend to rotate and roll in water, leading to increased fluid resistance. Studies have shown [73] that non-spherical particles, in comparison to smooth spherical ones, follow longer trajectories during settling (which may be spiral, diagonal, or other paths [64]), resulting in reduced settling velocities in the fluid. While some researchers have incorporated the shape factor into settling formulas, these are predominantly tailored for particles of specific shapes. For instance, Komar [74] exclusively focused on ellipsoidal particles, while Gabitto’s [75] model for settlement velocity solely addressed cylindrical particles. Consequently, the Corey shape factor (CSF) is introduced to encompass the shapes of most particles, aiming to represent their influence on sediment settling velocity. Komar [74] compared the shape factors of Wadell sphericity (WSF) and CSF using the resistance coefficient of gravel, concluding that the Corey shape factor provides a better prediction of shape influence on the resistance coefficient, thus facilitating the prediction of settling velocity. Nasiha [55] utilized this parameter to develop a model for sediment settling velocity, whereas Francalanci [76] employed it to predict the settling velocity of plastic particles. Overall, the impact of particle shape on the sediment settling velocity is multifaceted and governed by various factors. In practical research and engineering endeavors, it becomes imperative to consider numerous factors, including particle shape, size, and density, for a more accurate depiction of particle settlement behavior in water.

3.2. Environmental Factor

3.2.1. Temperature

Owen [77] suggested that the impact of temperature on the floc settling velocity is primarily dependent on the viscosity of the suspending liquid. According to the Stokes equation, higher temperatures correspond to lower kinematic viscosity coefficients, resulting in faster sediment settling velocities. However, the applicability of the Stokes equation is limited to hydrostatic settling. Lau [78] observed that as the temperature increased in turbulent conditions, the repulsive force between particles rose while the attraction remained unchanged, leading to easier floc breakage and a greater sedimentation effect compared to the decrease in the kinematic viscosity coefficient. Consequently, the sediment settling velocity decreased with rising temperature, contrary to Owen’s conclusion. Fitzpatrick [79] investigated the impact of temperature on kaolin flocs using various coagulants and determined that the flocs formed at higher temperatures were larger yet more prone to breakage than those formed at lower temperatures. Burdukova [80] posited that within a specific temperature range, aggregate particle sizes break up beyond a certain threshold, leading to a slowdown in aggregate sedimentation velocity. Wan [67] suggested the existence of an optimal flocculation temperature range, beyond which higher temperatures inhibit sediment settling. In experiments on tailings flocculation and sedimentation, Wang [81] observed that the maximum sedimentation velocity occurred between 5 and 15 °C, increased with temperature up to 20 °C, reached its peak, then rapidly declined to a minimum at 25 °C before gradually increasing again. In summary, the impact of temperature on sediment deposition characteristics remains inconclusive, highlighting the need for further research into this topic.

3.2.2. Salinity

The theoretical formulas and laboratory experiments for measuring the sediment settling velocity are typically conducted or calculated using distilled water or deionized water. However, in natural environments such as rivers, lakes, reservoirs, and oceans, salt is invariably present, exerting a certain influence on the settling velocity. It is commonly assumed that the sediment particle size and settling velocity increase in the transition from freshwater to saltwater conditions. Nevertheless, this notion contradicts findings from several field studies [82,83]. Winkler [84] observed a decrease in settling velocity with an increasing salt concentration. Portela’s settling column experiment [85] demonstrated a 6.5-fold increase in settling velocity under marine compared to freshwater conditions. Additionally, Sutherland [86] and Krahl [87] argue that the settling velocity rises with increasing salinity until reaching the critical coagulation salinity; beyond this point, further increases in salinity do not alter the settling velocity.
Zhu [88], in sedimentation experiments with equivalent concentrations of Na⁺, Ca2⁺, and Al3⁺, concluded that the higher the valence of the cation, the more effective the flocculation and efficiency, resulting in faster sedimentation velocities and an earlier onset of decline. Jin [89] suggested that the degree of difficulty in flocculating sediment particles correlated with the cation type. Through experimentation, the correlation degrees of various cation types with cohesive sediment flocculation and sedimentation were determined. The sequence from the least to greatest effect was: Na⁺ < K⁺ < H⁺ < Mg2⁺ < Ca2⁺ < Al3⁺ < Fe3⁺. In summary, it is observed that under low salinity conditions, the sedimentation velocity increases with salinity and also with cation valence until reaching critical coagulation salinity. Beyond this point, further increases in salinity do not alter the sedimentation velocity. Future research could focus on understanding the pattern of sedimentation velocity changes beyond the critical flocculation salinity and investigate the potential correlations between experimental discrepancies and other factors.

3.2.3. Organic Matter

The presence of organic matter significantly influences the sedimentation velocity of sediment. This is primarily due to alterations in the buoyancy, viscosity, density, and other properties of the water body caused by organic matter. Additionally, the adsorption properties and surface chemical characteristics of sediment particles can either promote [90] or inhibit [91] sedimentation. The organic matter in water bodies typically originates from two main sources: firstly, external inputs such as humus, substances, pesticides, fertilizers, urban sewage, industrial wastewater, and atmospheric precipitation and secondly, organic matter generated by aquatic biological organisms and organic matter released from sediment. However, this latter source generally contributes a smaller proportion to the total organic matter content. Chen [92] observed that following the removal of organic matter, flocculation sedimentation is accelerated, leading to a notable increase in the average sedimentation velocity of sediment particles under equivalent electrolyte concentrations.
Ye [93] introduced extracellular polymeric substances (EPS) into the water, resulting in a significant reduction in the sedimentation rate of the flocs. For a more accurate understanding of the specific effects of organic matter on sediment settling velocity, field measurements or simulations are typically necessary in practical applications. Furthermore, the impact of organic matter on sediment suspension and sedimentation processes may interact with other environmental factors. Consequently, it can be inferred that organic matter does influence the sedimentation velocity of sediment, albeit with variations in sedimentation behavior due to differing organic matter compositions and water conditions. Hence, there remains ample room for exploration in studying the influence of organic matter on the sediment settling velocity.

4. Conclusions and Prospects

The sediment settling velocity is a significant parameter of sediment sedimentation in water and has a certain direct relationship with particle size (Stokes’ law) [94]. However, the phenomenon of flocculation induces particle aggregation, thereby altering the morphology, storage, and density of flocs. Furthermore, the sedimentation of both individual sediment particles and flocs in water is subject to external influences such as concentration, organic matter content, salinity, and temperature, which exhibit temporal and spatial variations. Given the variability in shape and size of sediment particles throughout the sedimentation process, existing methodologies possess inherent limitations. Thus, it is recommended that future research in the sediment settling velocity focuses on the following two areas.
(1) Developing a novel approach to measure the sediment settling velocity. The settling tanks used for laboratory measurements of the sediment settling velocity are typically categorized into three methods: continuous settlement method, MBWT, and McLaughlin method. In the continuous settlement method, the sedimentation process within the sedimentation tube exhibits minimal correlation with the sediment quantity, hence failing to accurately represent the influence of sediment concentration on the sedimentation rate. The MBWT obviates the need for direct measurements of particle diameter, as diameter can be inferred directly from particle deceleration measurements. However, sediment particles of small sizes tend to remain suspended in water during sampling, thereby affecting the subsequent sampling results. This leads to a discrepancy between the particle size of the sampled material and the derived particle size measured by the apparatus. The McLaughlin method necessitates multiple sampling efforts, with even minor disturbances potentially impacting the aquatic environment.
Currently, settling tanks have undergone enhancements derived from these three initial models to facilitate automated sampling and minimize the sidewall effects. However, the fundamental mechanism for measuring the settling velocity using settling tanks remains unimproved. Therefore, future laboratory measurements of the sediment settling velocity should focus on addressing the existing limitations of sedimentation cylinders and innovating new designs. Furthermore, leveraging machine learning and data analysis techniques to synthesize the effects of various influencing factors on sedimentation processes can enable realistic laboratory simulations of sediment settling.
(2) Employing advanced scientific and technological methods for on-site settlement velocity measurement. The size and settling velocities of sediment particles or flocs measured in laboratory settings may be one to two orders of magnitude smaller than those measured in the field, as sediment particles are prone to damage during sampling (e.g., via traditional sampling bottles or pumping) and handling (e.g., suspension distribution) [95,96]. Consequently, replicating natural environmental conditions in the laboratory becomes unfeasible. Hence, it is imperative to measure the settling velocity of sediment particles or flocs in situ.
Currently, numerous methods exist for field measurements, yet most necessitate submerging equipment into the water, thereby disrupting natural sedimentation processes. Consequently, the optical remote sensing method leverages the optical properties of sediment particles and flocs to ascertain their physical characteristics, such as size and shape. This method establishes models to derive sedimentation rates, offering heightened reliability. As science and technology progress, additional technical means and equipment will be employed for on-site sedimentation velocity measurements. For instance, radar, satellite imagery, and ultra-high-speed cameras, among others, integrate modern technology through method fusion. Subsequently, machine learning, numerical simulation, and other analytical techniques process extensive experimental data to discern patterns and trends, refining the prediction models for calculating the sediment settling velocity. These methodologies will enhance the accuracy of sediment settling velocity measurements and furnish more dependable data support for soil and water conservation, river management, and environmental science.

Author Contributions

Y.L. and Z.X. collected the literature and prepared a rough draft of the manuscript; Y.L., X.Z. and T.Z. completed the manuscript writing—review and editing; Funding acquisition, X.Z. All authors have read and agreed to the published version of the manuscript.

Funding

This research was funded by the National Key R&D Program of China (2022YFF1300104, 2022YFC3204504), the Innovation Capability Support Program of Shaanxi (2022PT-23), and the Strategic Priority Research Program of the Chinese Academy of Sciences (Pan-Third Pole Environment Study for a Green Silk Road, XDA20040202).

Data Availability Statement

Not applicable.

Acknowledgments

The authors would like to thank Minghang Guo and Jun Zhao for their guidance and financial support for this paper. The authors would like to thank the Northwest A&F University (NWAFU), State Key Laboratory of Soil Erosion and Dryland Farming on the Loess Plateau, College of Soil and Water Conservation Science and Engineering (Institute of Soil and Water Conservation), Northwest A&F University, lnstitute of Soil and Water Conservation, Chinese Academy of Sciences and Ministry of Water Resource.

Conflicts of Interest

The authors declare no conflicts of interest.

References

  1. Chien, N.; Wan, Z.H. Mechanics of Sediment Transport; Science Press: Beijing China, 1983. [Google Scholar]
  2. Li, K.Q. Experimental Study on Correction Method of Grading Results of Coarse Sand Samples Analyzed by Particle Size Analyzer. J. Sediment. Res. 1985, 85–89. [Google Scholar] [CrossRef]
  3. Cao, R.X.; Qian, S.Q.; Chen, W. Sedimentation Characteristics of Muddy Water with Coarse Sand and High Sand Content and the Group Sinking Velocity of Coarse Sediment. Yellow River 1995, 14, 1–4+61. [Google Scholar]
  4. Zhang, R.J. River Sediment Dynamics; China Water Power Press: Beijing, China, 1998. [Google Scholar]
  5. Wang, D.W.; Yang, G.L.; Yu, M.H. Method to Deter Mine the Maxi Mal Diameter of Fine Sedi Ment Aggregation and Influence Factors Analysis. J. Sediment. Res. 2009, 74–80. [Google Scholar] [CrossRef]
  6. Stokes, G.G. On the Effect of the Internal Friction of Fluids on the Motion of Pendulums. In Mathematical and Physical Papers. Cambridge Library Collection-Mathematics; Cambridge University Pre: Cambridge, UK, 2009; pp. 1–10. [Google Scholar] [CrossRef]
  7. Yang, J.; Tang, L.; She, Y.; Sun, J. Laboratory Measurements of the Fall Velocity of Fine Sediment in an Estuarine Environment. Int. J. Sediment Res. 2020, 35, 217–226. [Google Scholar] [CrossRef]
  8. Zheng, F.; Zhang, J.F.; Fu, J.N. Experiment Study on the Effects of Temperature on the Flocculation and Settling of Kaolinite in the Settling Column. Chin. J. Hydrodyn. 2018, 33, 801–806. [Google Scholar]
  9. Wan, Y.Y.; Wu, H.L.; Shen, Q.; Gu, F.F. Experimental Study on the Settling Velocity of Suspended Sediment in the Yangtze River Estuary. Mar. Sci. 2015, 39, 78–85. [Google Scholar]
  10. Manning, A.; Langston, W.; Jonas, P. A Review of Sediment Dynamics in the Severn Estuary: Influence of Flocculation. Marine Pollut. Bull. 2010, 61, 37–51. [Google Scholar] [CrossRef] [PubMed]
  11. Eisma, D.; Bale, A.; Dearnaley, M.; Fennessy, M.; Van Leussen, W.; Maldiney, M.-A.; Pfeiffer, A.; Wells, J. Intercomparison of in Situ Suspended Matter (Floc) Size Measurements. J. Sea Res. 1996, 36, 3–14. [Google Scholar] [CrossRef]
  12. Zhan, Y.; Wang, H.M.; Zeng, M.W. Research Progress of Sediment Settling Velocity and Its Influencing Factors Analysis. Yangtze River 2001, 23–24+41. [Google Scholar] [CrossRef]
  13. Ueber, A.O. Stationäre Flüssigkeitsbewegungen Mit Berücksichtigung Der Inneren Reibung. J. Für Die Reine Und Angew. Math. 1876, 81, 62–80. [Google Scholar]
  14. Cheng, N.-S. Simplified Settling Velocity Formula for Sediment Particle. J. Hydraul. Engineering. 1997, 123, 149–152. [Google Scholar] [CrossRef]
  15. Riazi, A.; Türker, U. The Drag Coefficient and Settling Velocity of Natural Sediment Particles. Comput. Part. Mech. 2019, 6, 427–437. [Google Scholar] [CrossRef]
  16. Richardson, J. Sedimentation and Fluidization Part Iii the Sedimentation of Uniform Fine Particles and of Two-Component Mixtures of Solids. Trans Inst. Chem. Eng. 1961, 39, 348–356. [Google Scholar]
  17. Li, Y.G. On Group Setting Velocity of Fine Sediment. Ocean Eng. 1990, 60–68. [Google Scholar] [CrossRef]
  18. Qian, Y.Y.; Yang, W.H.; Zhao, W.L. Basic Characteristics of High Sediment Concentration Flow. In Proceedings of the International Symposium on River Sedimentation, Beijing, China, 24–29 March 1980; Yellow River Institute of Hydraulic Research: Zhengzhou, China; pp. 175–184. [Google Scholar]
  19. Chu, J.D. Settling Laws of a Swarm of Particles in Sediment-Water Mixture. J. Hohai Univ. (Nat. Sci.) 1982, 28–36. Available online: http://www.en.cnki.com.cn/Article_en/CJFDTOTAL-HHDX198201002.htm (accessed on 15 March 2024).
  20. Meng, R.L.; Zhang, G.G.; Ma, L.; Zhang, X.M. Study on Population Settlement of Viscous Fine Sediment in Muddy Water. J. Sediment. Res. 2022, 47, 9–14. [Google Scholar]
  21. Cole, R.C.; Edlefsen, N. A Sedimentation Tube for Analyzing Water-Stable Soil Aggregates. Soil Sci. 1935, 40, 473–480. [Google Scholar] [CrossRef]
  22. Rigler, J.; Collins, M.; Williams, S. A High Precision, Digital-Recording Sedimentation Tower for Sands: Research-Method Paper. J. Sediment. Res. 1981, 51, 642–644. [Google Scholar] [CrossRef]
  23. Hu, Y.; Fister, W.; Rüegg, H.R.; Kinnell, P.; Kuhn, N.J. The Use of Equivalent Quartz Size and Settling Tube Apparatus to Fractionate Soil Aggregates by Settling Velocity. In Geomorphological Techniques; British Society for Geomorphology: London, UK, 2013. [Google Scholar]
  24. Hairsine, P.; McTainsh, G. The Griffith Tube: A Simple Settling Tube for the Measurement of Settling Velocity of Aggregates; School of Australian Environmental Studies, Griffith University: Brisbane City, Australia, 1986. [Google Scholar]
  25. Loch, R. Settling Velocity–a New Approach to Assessing Soil and Sediment Properties. Comput. Electron. Agric. 2001, 31, 305–316. [Google Scholar] [CrossRef]
  26. Sven, O. The Size Distribution of Particles in Soils and the Experimental Methods of Obtaining Them. Soil Sci. 1925, 19, 1–36. [Google Scholar] [CrossRef]
  27. Pang, L.; Zhang, K.L.; Zhu, M.; Xu, X.L. Review and Comment on Experimental Research Methods of Sediment Settling Velocity. Yellow River 2006, 28, 50–52. (In Chinese) [Google Scholar]
  28. Anon A Study of New Methods of Size Analysis of Suspended Sediment Samples. 1943, Rep.No.7. Available online: https://water.usgs.gov/fisp/docs/Report_12.pdf (accessed on 15 March 2024).
  29. Lovell, C.; Rose, C. Measurement of Soil Aggregate Settling Velocities. 1. A Modified Bottom Withdrawal Tube Method. Soil Res. 1988, 26, 55–71. [Google Scholar] [CrossRef]
  30. Mulqueen, J.; Rodgers, M.; Marren, N.; Healy, M.G. Erodibility of Hill Peat. Ir. J. Agric. Food Res. 2006, 45, 103–114. [Google Scholar]
  31. Wu, S.N.; Fu, S.H. Effects of Soil Aggregates on Settling Velocity of Sediment. Sci. Soil Water Conserv. 2019, 17, 78–84. [Google Scholar]
  32. Liu, C.; Li, Z.; Fu, S.; Ding, L.; Wu, G. Influence of Soil Aggregate Characteristics on the Sediment Transport Capacity of Overland Flow. Geoderma 2020, 369, 114338. [Google Scholar] [CrossRef]
  33. McLaughlin, R.T., Jr. The Settling Properties of Suspensions. J. Hydraul. Div. 1959, 85, 9–41. [Google Scholar] [CrossRef]
  34. McLaughlin, R.T. Settling Properties of Suspensions. Trans. Am. Soc. Civ. Eng. 1961, 126, 1734–1766. [Google Scholar] [CrossRef]
  35. Fugate, D.C.; Friedrichs, C.T. Determining Concentration and Fall Velocity of Estuarine Particle Populations Using Adv, Obs and Lisst. Cont. Shelf Res. 2002, 22, 1867–1886. [Google Scholar] [CrossRef]
  36. Kwon, J.I. Simulation of Turbidity Maximums in the York River, Virginia; The College of William and Mary: Williamsburg, VA, USA, 2005. [Google Scholar]
  37. Ha, H.; Hsu, W.Y.; Maa, J.-Y.; Shao, Y.; Holland, C. Using Adv Backscatter Strength for Measuring Suspended Cohesive Sediment Concentration. Cont. Shelf Res. 2009, 29, 1310–1316. [Google Scholar] [CrossRef]
  38. Gao, X.; Li, Y.; Tang, C.; Acharya, K.; Du, W.; Wang, J.; Luo, L.; Li, H.; Dai, S.; Yu, Z. Using Adv for Suspended Sediment Concentration and Settling Velocity Measurements in Large Shallow Lakes. Environ. Sci. Pollut. Res. 2017, 24, 2675–2684. [Google Scholar] [CrossRef]
  39. Moura, M.G.; Quaresma, V.S.; Bastos, A.C.; Veronez, P. Field Observations of Spm Using Adv, Adp, and Obs in a Shallow Estuarine System with Low Spm Concentration—Vitória Bay, Se Brazil. Ocean Dyn. 2011, 61, 273–283. [Google Scholar] [CrossRef]
  40. Chanson, H.; Takeuchi, M.; Trevethan, M. Using Turbidity and Acoustic Backscatter Intensity as Surrogate Measures of Suspended Sediment Concentration in a Small Subtropical Estuary. J. Environ. Manag. 2008, 88, 1406–1416. [Google Scholar] [CrossRef] [PubMed]
  41. Li, W.; Yang, S.; Hu, J.; Fu, X.; Zhang, P. Field Measurements of Settling Velocities of Fine Sediments in Three Gorges Reservoir Using Adv. Int. J. Sediment Res. 2016, 31, 237–243. [Google Scholar] [CrossRef]
  42. Maa, J.-Y.; Kwon, J.-I. Using Adv for Cohesive Sediment Settling Velocity Measurements. Estuar. Coast. Shelf Sci. 2007, 73, 351–354. [Google Scholar] [CrossRef]
  43. Ha, H.K.; Maa, J.P.-Y. Effects of Suspended Sediment Concentration and Turbulence on Settling Velocity of Cohesive Sediment. Geosci. J. 2010, 14, 163–171. [Google Scholar] [CrossRef]
  44. Cartwright, G.M.; Friedrichs, C.T.; Smith, S.J. A Test of the Adv-Based Reynolds Flux Method for in Situ Estimation of Sediment Settling Velocity in a Muddy Estuary. Geo-Mar. Lett. 2013, 33, 477–484. [Google Scholar] [CrossRef]
  45. Bian, C.; Mao, X.; Jiang, W.; Gu, Y. Adv-Based Estimates of Sediment Settling Velocity on the Shelf of the Yellow and East China Seas: Evidence of Marked Seasonal and Intra-Tidal Variations. Geo-Mar. Lett. 2015, 35, 53–60. [Google Scholar] [CrossRef]
  46. Rouhnia, M.; Strom, K. Sedimentation from Flocculated Suspensions in the Presence of Settling-Driven Gravitational Interface Instabilities. J. Geophys. Res. Ocean 2015, 120, 6384–6404. [Google Scholar] [CrossRef]
  47. Mantovanelli, A.; Ridd, P.V. Devices to Measure Settling Velocities of Cohesive Sediment Aggregates: A Review of the in Situ Technology. J. Sea Res. 2006, 56, 199–226. [Google Scholar] [CrossRef]
  48. Agrawal, Y.C.; Pottsmith, H.C. Instruments for Particle Size and Settling Velocity Observations in Sediment Transport. Mar. Geol. 2000, 168, 89–114. [Google Scholar] [CrossRef]
  49. Pedocchi, F.; García, M.H. Evaluation of the Lisst-St Instrument for Suspended Particle Size Distribution and Settling Velocity Measurements. Cont. Shelf Res. 2006, 26, 943–958. [Google Scholar] [CrossRef]
  50. Ahn, J.H. Size Distribution and Settling Velocities of Suspended Particles in a Tidal Embayment. Water Res. 2012, 46, 3219–3228. [Google Scholar] [CrossRef]
  51. Fettweis, M.; Baeye, M. Seasonal Variation in Concentration, Size, and Settling Velocity of Muddy Marine Flocs in the Benthic Boundary Layer. J. Geophys. Res. Ocean 2015, 120, 5648–5667. [Google Scholar] [CrossRef]
  52. Chapalain, M.; Verney, R.; Fettweis, M.; Jacquet, M.; Le Berre, D.; Le Hir, P. Investigating Suspended Particulate Matter in Coastal Waters Using the Fractal Theory. Ocean Dyn. 2019, 69, 59–81. [Google Scholar] [CrossRef]
  53. Shao, Y.; Yan, Y.; Maa, J.P.-Y. In Situ Measurements of Settling Velocity near Baimao Shoal in Changjiang Estuary. J. Hydraul. Eng. 2011, 137, 372–380. [Google Scholar] [CrossRef]
  54. Voulgaris, G.; Meyers, S.T. Temporal Variability of Hydrodynamics, Sediment Concentration and Sediment Settling Velocity in a Tidal Creek. Cont. Shelf Res. 2004, 24, 1659–1683. [Google Scholar] [CrossRef]
  55. Nasiha, H.J.; Shanmugam, P. Estimation of Settling Velocity of Sediment Particles in Estuarine and Coastal Waters. Estuar. Coast. Shelf Sci. 2018, 203, 59–71. [Google Scholar] [CrossRef]
  56. Vadakke-Chanat, S.; Shanmugam, P. Modeling the Contributions of Phytoplankton and Non-Algal Particles to Spectral Scattering Properties in near-Shore and Lagoon Waters. Cont. Shelf Res. 2017, 135, 35–46. [Google Scholar] [CrossRef]
  57. Nasiha, H.J.; Shanmugam, P.; Sundaravadivelu, R. Estimation of Sediment Settling Velocity in Estuarine and Coastal Waters Using Optical Remote Sensing Data. Adv. Space Res. 2019, 63, 3473–3488. [Google Scholar] [CrossRef]
  58. Smith, S.J.; Friedrichs, C.T. Image Processing Methods for in Situ Estimation of Cohesive Sediment Floc Size, Settling Velocity, and Density. Limnol. Oceanogr. Methods 2015, 13, 250–264. [Google Scholar] [CrossRef]
  59. Simoncelli, S.; Kirillin, G.; Tolomeev, A.P.; Grossart, H.P. A Low-Cost Underwater Particle Tracking Velocimetry System for Measuring in Situ Particle Flux and Sedimentation Rate in Low-Turbulence Environments. Limnol. Oceanogr. Methods 2019, 17, 665–681. [Google Scholar] [CrossRef]
  60. Fennessy, M.; Dyer, K.; Huntley, D. Inssev: An Instrument to Measure the Size and Settling Velocity of Flocs in Situ. Mar. Geol. 1994, 117, 107–117. [Google Scholar] [CrossRef]
  61. Van Leussen, W.; Cornelisse, J.M. The Determination of the Sizes and Settling Velocities of Estuarine Flocs by an Underwater Video System. Neth. J. Sea Res. 1993, 31, 231–241. [Google Scholar] [CrossRef]
  62. Smith, S.J.; Friedrichs, C.T. Size and Settling Velocities of Cohesive Flocs and Suspended Sediment Aggregates in a Trailing Suction Hopper Dredge Plume. Cont. Shelf Res. 2011, 31, S50–S63. [Google Scholar] [CrossRef]
  63. Shen, X.; Maa, J.P.Y. A Camera and Image Processing System for Floc Size Distributions of Suspended Particles. Mar. Geol. 2016, 376, 132–146. [Google Scholar] [CrossRef]
  64. Xia, Z.H.; Wang, G. The Setting of Non-Cohesive Particles in a Flocculated Suspension. J. Sediment. Res. 1982, 14–23. [Google Scholar]
  65. Huang, J.H. Experimental Study of Settling Properties of Cohesive Sediment in Stil1 Water. J. Sediment. Res. 1981, 30–41. [Google Scholar]
  66. McAnally, W.H.; Friedrichs, C.; Hamilton, D.; Hayter, E.; Shrestha, P.; Rodriguez, H.; Sheremet, A.; Teeter, A.; Mud, A.T.C.o.M.o.F. Management of Fluid Mud in Estuaries, Bays, and Lakes. I: Present State of Understanding on Character and Behavior. J. Hydraul. Eng. 2007, 133, 9–22. [Google Scholar] [CrossRef]
  67. Wan, Y.Y.; Wu, H.L.; Shen, Q.; Gu, F.F. Reviews on Settling Velocity of Fine Sediment in Tidal Environment 3: Controlling Factors. Port Waterw. Eng. 2014, 21–25. [Google Scholar]
  68. Huang, H. Porosity-Size Relationship of Drilling Mud Flocs: Fractal Structure. Clays Clay Miner. 1993, 41, 373–379. [Google Scholar] [CrossRef]
  69. Tan, X.-L.; Zhang, G.-P.; Hang, Y.; Furukawa, Y. Characterization of Particle Size and Settling Velocity of Cohesive Sediments Affected by a Neutral Exopolymer. Int. J. Sediment Res. 2012, 27, 473–485. [Google Scholar] [CrossRef]
  70. Zhang, D.R.; Liang, Z.Y. Experimetn Study of Effect of Nonuniform Fine Sediment on Flocculation. Hydro-Sci. Eng. 1994, 1, 11–17. [Google Scholar]
  71. Tang, J.H. Characteristics of Fine Cohesive Sediment’s Flocculation in the Changjiang Estuary and Its Adjacent Sea Area; East China Normal University: Shanghai, China, 2007; p. 57. [Google Scholar]
  72. Peng, H.F.; Kong, G.Q.; Liu, H.L.; Abuel-Naga, H.; Hao, Y.H. Thermo-Mechanical Behaviour of Floating Energy Pile Groups in Sand. J. Zhejiang Univ. SCIENCE A 2018, 19, 638–649. [Google Scholar] [CrossRef]
  73. Mohammed, M.A.; Halagy, D.A.E. Studying the Factors Affecting the Settling Velocity of Solid Particles in Non-Newtonian Fluids. Al-Nahrain J. Eng. Sci. 2013, 16, 41–50. [Google Scholar]
  74. Komar, P.D.; Reimers, C. Grain Shape Effects on Settling Rates. J. Geol. 1978, 86, 193–209. [Google Scholar] [CrossRef]
  75. Gabitto, J.; Tsouris, C. Drag Coefficient and Settling Velocity for Particles of Cylindrical Shape. Powder Technol. 2008, 183, 314–322. [Google Scholar] [CrossRef]
  76. Francalanci, S.; Paris, E.; Solari, L. On the Prediction of Settling Velocity for Plastic Particles of Different Shapes. Environ. Pollut. 2021, 290, 118068. [Google Scholar] [CrossRef] [PubMed]
  77. Owen, M. The Effect of Temperature on the Settling Velocities of an Estuary Mud. 1972. Available online: https://eprints.hrwallingford.com/1528/1/IT106.pdf (accessed on 15 March 2024).
  78. Lau, Y. Temperature Effect on Settling Velocity and Deposition of Cohesive Sediments. J. Hydraul. Res. 1994, 32, 41–51. [Google Scholar] [CrossRef]
  79. Fitzpatrick, C.; Fradin, E.; Gregory, J. Temperature Effects on Flocculation, Using Different Coagulants. Water Sci. Technol. 2004, 50, 171–175. [Google Scholar] [CrossRef]
  80. Burdukova, E.; Ishida, N.; Shaddick, T.; Franks, G.V. The Size of Particle Aggregates Produced by Flocculation with Pnipam, as a Function of Temperature. J. Colloid Interface Sci. 2011, 354, 82–88. [Google Scholar] [CrossRef]
  81. Wang, D.-L.; Zhang, Q.-L.; Chen, Q.-S.; Qi, C.-C.; Feng, Y.; Xiao, C.-C. Temperature Variation Characteristics in Flocculation Settlement of Tailings and Its Mechanism. Int. J. Miner. Metall. Mater. 2020, 27, 1438–1448. [Google Scholar] [CrossRef]
  82. Eisma, D.; Bernard, P.; Cadée, G.; Ittekkot, V.; Kalf, J.; Laane, R.; Martin, J.; Mook, W.; Van Put, A.; Schuhmacher, T. Suspended-Matter Particle Size in Some West-European Estuaries; Part II: A Review on Floc Formation and Break-Up. Neth. J. Sea Res. 1991, 28, 215–220. [Google Scholar] [CrossRef]
  83. Eisma, D.; Bernard, P.; Cadee, G.; Ittekkot, V.; Kalf, J.; Laane, R.; Martin, J.M.; Mook, W.; Van Put, A.; Schuhmacher, T. Suspended-Matter Particle Size in Some West-European Estuaries; Part I: Particle-Size Distribution. Neth. J. Sea Res. 1991, 28, 193–214. [Google Scholar] [CrossRef]
  84. Winkler, M.-K.; Bassin, J.; Kleerebezem, R.; Van der Lans, R.; Van Loosdrecht, M. Temperature and Salt Effects on Settling Velocity in Granular Sludge Technology. Water Res. 2012, 46, 5445–5451. [Google Scholar] [CrossRef]
  85. Portela, L.I.; Ramos, S.; Teixeira, A.T. Effect of Salinity on the Settling Velocity of Fine Sediments of a Harbour Basin. J. Coast. Res. 2013, 165, 1188–1193. [Google Scholar] [CrossRef]
  86. Sutherland, B.R.; Barrett, K.J.; Gingras, M.K. Clay Settling in Fresh and Salt Water. Environ. Fluid Mech. 2015, 15, 147–160. [Google Scholar] [CrossRef]
  87. Krahl, E.; Vowinckel, B.; Ye, L.; Hsu, T.-J.; Manning, A.J. Impact of the Salt Concentration and Biophysical Cohesion on the Settling Behavior of Bentonites. Front. Earth Sci. 2022, 10, 886006. [Google Scholar] [CrossRef]
  88. Zhu, Z.; Xiong, X.; Liang, C.; Zhao, M. On the Flocculation and Settling Characteristics of Low-and High-Concentration Sediment Suspensions: Effects of Particle Concentration and Salinity Conditions. Environ. Sci. Pollut. Res. 2018, 25, 14226–14243. [Google Scholar] [CrossRef] [PubMed]
  89. Jin, Y.; Wang, Y.G.; Li, Y. Experimental Study on Flocculation of Cohesive Fine Grain Sediment at Yangtze River Estuary. J. Hohai Univ. (Nat. Sci.) 2002, 30, 61–63. [Google Scholar]
  90. Guo, L.; He, Q. Freshwater Flocculation of Suspended Sediments in the Yangtze River, China. Ocean Dyn. 2011, 61, 371–386. [Google Scholar] [CrossRef]
  91. Gibbs, R.J. Effect of Natural Organic Coatings on the Coagulation of Particles. Environ. Sci. Technol. 1983, 17, 237–240. [Google Scholar] [CrossRef] [PubMed]
  92. Chen, H.S.; Shao, M.A. Effects of Organic Matter on Flocculation and Settling Properties of Fine Sedi Ment in Still Water. J. Sediment. Res. 2001, 3, 35–39. [Google Scholar]
  93. Ye, L.; Penaloza-Giraldo, J.; Manning, A.; Holyoke, J.; Hsu, T.-J. Biophysical Flocculation Reduces Variability of Cohesive Sediment Settling Velocity. Commun. Earth Environ. 2023, 4, 138. [Google Scholar] [CrossRef]
  94. Berlamont, J.; Ockenden, M.; Toorman, E.; Winterwerp, J. The Characterisation of Cohesive Sediment Properties. Coast. Eng. 1993, 21, 105–128. [Google Scholar] [CrossRef]
  95. Owen, M. The Effect of Turbulence on the Settling Velocities of Silt Flocs. In Proceedings of the Fourteenth Congress of IAHR. 1971, 4, 27–32. Available online: https://scholar.google.com/scholar?q=Owen%2C%20M.W.%2C%201971.%20The%20effects%20of%20turbulence%20on%20the%20settling%20velocity%20of%20silt%20flocs.%20Proc.%2014th%20Cong.%20Int.%20Assoc.%20Hydraul.%20Res.%20Paris%2C%20pp.%20D4-1%E2%80%93D4-6 (accessed on 15 March 2024).
  96. Manning, A. Observations of the Properties of Flocculated Cohesive Sediment in Three Western European Estuaries. J. Coast. Res. 2004, 70–81. Available online: http://www.jstor.org/stable/25736632 (accessed on 15 March 2024).
Figure 1. (a) The settling cylinder of Hu [23]; (b) The MBWT tube; (c) The McLaughlin method.
Water 16 00938 g001
Figure 2. Variation in sedimentation velocity with sediment concentration [65].
Water 16 00938 g002
Figure 3. Variation in sedimentation velocity with sediment concentration [66].
Water 16 00938 g003
Table 1. Sedimentation velocity of fine particles previously studied using ADV.
InvestigatorTimePlaceSSCmg/LFormulaSettling Velocity mm/s
David C. Fugate [35]2002Chesapeake Bay3–5 ω S = v S ¯ 1–1.5
J.P.Y. Maa [42]2007The York River, Virginia.3–70 ω = m S n 1 0.15–0.7
Ho Kyung Ha [43]2010York River estuary, Virginia300–700 ω = m S n 1 10–55
Grace M [44]2013York River estuary, Virginia30–100 ω ( S ¯ S w a s h ) = v S ¯ 0.48 ± 0.04
Changwei Bian [45]2015Yellow Sea-A020.9–1.2 ω S = v S ¯ 0.07 ± 0.05
The East China Sea-E021–41.88 ± 1.76
Wenjie Li [41]2016Three Gorges Reservoir100–2000 ω S = v S ¯ 0.1-10
XiaoMeng Gao [38]2017Taihu40–242 ω S = v S ¯ 0.12
ω s n S n = K d S n d z 0.11
ω = m S n 1 ω = 1.85 × 10 3 S 1.04 1
Note(s): In the table: S w a s h is a washload component, ω s n is the settling velocity of particle type n , C n is the concentration of particle type n , and K is the eddy diffusivity.
Disclaimer/Publisher’s Note: The statements, opinions and data contained in all publications are solely those of the individual author(s) and contributor(s) and not of MDPI and/or the editor(s). MDPI and/or the editor(s) disclaim responsibility for any injury to people or property resulting from any ideas, methods, instructions or products referred to in the content.

