Article

Seasonal Freezing Drives Spatiotemporal Dynamics of Dissolved Organic Matter (DOM) and Microbial Communities in Reclaimed Water-Recharged River

1
School of Environment, Northeast Normal University, Changchun 130117, China
2
Science and Technology Innovation Center for Municipal Wastewater Treatment and Water Quality Protection, Northeast Normal University, Changchun 130117, China
3
Center for Advanced Optoelectronic Functional Materials Research, Key Laboratory of UV Light-Emitting Materials and Technology of Ministry of Education, Northeast Normal University, Changchun 130024, China
4
Key Laboratory of Songliao Aquatic Environment, Ministry of Education, Jilin Jianzhu University, Changchun 130118, China
*
Author to whom correspondence should be addressed.
Water 2024, 16(6), 906; https://doi.org/10.3390/w16060906
Submission received: 19 February 2024 / Revised: 16 March 2024 / Accepted: 18 March 2024 / Published: 21 March 2024
(This article belongs to the Special Issue DOM Distribution and Nutrient Dynamics in Freshwater Systems)

Abstract

:
Although reclaimed water (RW) has become a promising alternative source for alleviating water shortage in arid and semiarid regions, the ecological risks it poses to the receiving water bodies remain largely unknown. Dissolved organic matter (DOM) is crucial for affecting the quality of RW and strongly influences bacterial communities (BCs) in aquatic ecosystems. In this study, we aimed to unravel the role of DOM signatures on the spatiotemporal composition of microbial communities (MCs) in a seasonally ice-sealed urban river that had been chronically replenished by RW. We found that discharging RW resulted in elevated DOM levels in the receiving river. Notably, an increase of 10% in protein-like substances was revealed. The differences between compositional characteristics of DOM and the abundance of riverine BCs between freezing and non-freezing periods were revealed. In the freezing season, humic-like components, aromaticity, and hydrophobicity of DOM were more significant, and bacterial taxa such as Bacteriodetes and Flavobacterium were increased, while Proteobacteria was decreased. Similarly, co-occurrence network analysis revealed an enhanced interplay between DOM and BCs at the same time. However, Klebsiella pneumoniae markedly decreased during the ice-sealed period. These results suggest that variations in DOM characteristics have remarkable impacts on the dynamics of aquatic BCs, which points to the need for a DOM−oriented RW quality monitoring strategy.

1. Introduction

The scarcity of freshwater resources and the intensified pollution in urban rivers are prevalent challenges faced by regions across the globe. There are 44% to 53% of global rivers enduring dry periods lasting a minimum of one month annually [1], most of which are located in the Northern Hemisphere where there is little precipitation [2,3]. To overcome this challenge, China has proposed that by the year 2025, the utilization of unconventional water sources nationwide will exceed 17 billion m3. Reclaimed water (RW) is one of the most representative unconventional water sources derived from advanced treatment from wastewater treatment plants (WWTPs) [4,5]. In recent years, RW has become a feasible strategy for river water replenishment and helps alleviate water scarcity problems [6,7].
Owing to the complex components of RW, its introduction remains widely recognized as the primary risk to the receiving lotic ecosystems [8,9]. Aquatic microbial communities (MCs) are susceptible to changes in water environment [10], which impact their multiple ecosystem functions such as carbon cycling and pollutant degradation processes [11,12,13,14]. Introduction of WWTP effluent to the receiving water bodies has significantly altered the composition of BCs, such as increases in Acidobacteria, Firmicutes and Bacillus [15,16,17]. Notably, RW facilitated the exposure of pathogenic microorganisms such as human adenoviruses and Streptococcus pneumoniae [18,19].
Serving as one of the largest carbon pools in aquatic ecosystems, DOM is responsible for the transport, bioavailability, and toxicity of pollutants [20,21]. Studies have shown that DOM affects the fate of contaminants in the environment and ecological risk. Increased DOM exogenous input also significantly inhibits the degradation of pharmaceutical and personal care products (PPCPs) [22,23,24]. Moreover, DOM supports the heterotrophic microbial metabolism, which determines the integrity and function of the aquatic ecosystem [25]. The amount and composition of DOM are intimately associated with the structure of MCs and vice versa [26,27]. For instance, nitrogenous organic matter was revealed to promote bacterial diversity in both a lake environment and wastewater, while MCs are also responsible for increased nitrogenous organic matter [28,29]. Other studies demonstrated that Proteobacteria and Actinobacteria were important for degrading humic-like DOM, which helped lipid and carbon metabolic processes regulated by MCs at urban river confluences [25]. However, whether and how RW recharge affects the distribution pattern and interaction between DOM and MCs in receiving rivers, which is essential for low-risk external water supplementation as well as river water management, remains poorly understood.
The distribution patterns and interactions of DOM composition and MCs vary with different ecosystems and inherent environmental conditions [30]. For rivers experiencing a freezing period, it is hypothesized that a decreased opportunity of exogenous inputs of DOM and other pollutants and the low flow rate during an ice-sealed period in the ice may result in variation in their transportation. Research has demonstrated the role of ice in modulating the temporal variability of pollutants and the level of ecological risk during the freezing and thawing periods of rivers [24]. Moreover, the abundance and diversity of MCs in rivers exhibited significant seasonal variations, such as higher bacterial diversity in winter than in summer [31,32]. Therefore, it should be noted that RW recharge during the ice-free and ice-sealed periods can be highly influenced by the distribution patterns and interplay between DOM and MCs.
To address this knowledge gap, we conducted a survey on a stretch of an urban river in both ice-free and ice-sealed periods to investigate variations in spatiotemporal DOM characteristics and riverine MC composition. Accordingly, the main purposes of this study are: (1) to explore changes in the distribution and compositional characteristics of DOM and MCs during the ice-free and ice-sealed periods of rivers under RW recharge; and (2) to elucidate the relationships among water quality indicators, composition traits of DOM, and diversity of MCs. These results will help us to comprehend the ecological processes and impact of RW replenishment, which may contribute to improving the integrity of river ecosystems in the context of better RW quality.

2. Materials and Methods

2.1. Study Area and Sample Collection

The Yitong River is a constituent of the secondary system of the Songhua River, which is the most extensive water system in northeast China. The Yitong River spans an area of 343 km2 and encompasses a watershed of 8440 km2. The annual flow rate of the system remains constant at 3.2 m3/s. The ecological water demand for the year is roughly 5.66 billion m3, and there is an average annual water deficit of around 18 million m3. The watershed experiences an average annual rainfall of 593.8 mm, accompanied by a freezing period from December to March. To investigate the changes before and after river freezing, sampling activities were carried out in October 2022 (ice-free) and February 2023 (ice-sealed). Due to the thick ice on the surface of the river, we were able to collect only 7 of 10 samples during the ice-sealed period. Figure 1 illustrates the sampling locations [33,34], and the longitude and latitude information for each point is provided in Table S1.
We positioned ten sampling sites throughout a 29.5 km section of the Yitong River in the city of Changchun (43°71′ N to 43°97′ N, 125°34′ E to 125°36′ E). The primary treatment process of WWTP A employs the oxidation ditch method, with disinfection performed through ultraviolet irradiation. It serves a population exceeding 300,000 individuals. The principal treatment method utilized at WWTP B is the A2/O (anaerobic–anoxic–oxic) process, with disinfection achieved through liquid chlorine treatment. It caters to a populace exceeding 1.5 million individuals. Approximately 100,000 m3·d−1 and 80,000 m3·d−1 of RW, which has undergone treatment, is discharged into the Yitong River as ecological replenishment. For each sampling site, a one-off sample of 4.75 L (4 L + 250 mL × 3) comprising one 4 L container and three 250 mL bottles as replicates was obtained. At each site, the water sample comprised two subsamples, collected at a 30 s interval. Following collection, the samples were promptly transported to the laboratory and stored at a temperature of 4 °C, shielded from light. They were then analyzed within 1–3 days.

2.2. Detection of Water Quality Parameters

The collected samples were analyzed for temperature and pH values on-site using a multiparameter water quality analyzer (Ultrameter II™ 6PFCE, Myron Co., Carlsbad, CA, USA). After bringing the water samples back to the laboratory, various materials of the samples were promptly analyzed using specific instruments. Ammonia nitrogen (NH4+-N), total phosphorus (TP), total nitrogen (TN), nitrite nitrogen (NO2-N), and nitrate nitrogen (NO3-N), were immediately analyzed using a DR3900 visible spectrophotometer (HACH Co., Loveland, CO, USA). Additionally, dissolved organic carbon (DOC) was measured by a total organic carbon analyzer (TOC-5000A, Shimadzu Co., Kyoto, Japan).

2.3. Optical Spectroscopy Measurements and Analysis

The water samples were filtered with a 0.45 μm nylon fiber filter membrane. Excitation–emission fluorescence spectroscopy of the filtrate was conducted using a fluorescence spectrophotometer (Hitachi F-2700, Tokyo, Japan). The parameters were set as follows: the voltage was 700 V; the scanning speed was 3000 nm/min; the excitation wavelength range was 220–450 nm; the emission wavelength range was 220–550 nm; and the slit width was 10 nm. Prior to the measurement, Milli-Q ultrapure water was utilized as a blank to eliminate the impact of Rayleigh and Raman scattering. PARAFAC analysis was performed using the DOMFluor toolbox in MATLAB software (MATLAB 2018a) [35].
The ultraviolet-visible (UV-vis) absorption spectra characteristics were determined by a UV-vis spectrophotometer (Genesys 10S, Thermo Scientific Co., Lenexa, CO, USA) using a 10 mm quartz cuvette for water samples in the wavelength range of 200–800 nm with the scan interval set at 1 nm. The spectral parameters are calculated to characterize the structural features of DOM.
The identification of the functional groups present in the samples of DOM was accomplished through the utilization of Fourier-transform infrared spectroscopy (FT-IR) (Nicolet IS50, Thermo Scientific Co., Lenexa, CO, USA). The 50 mL water samples were placed in centrifuge tubes, frozen at −20 °C, subjected to freezing at a temperature of −20 °C, and subsequently put into a freeze-dryer operating at a temperature of −80 °C for a duration of 72 h. The dried material was combined with 100 mg of spectrally pure KBr at a ratio of 1 mg to 100 mg. The mixture was then compressed into thin slices at a pressure of 10 MPa and left for 2 min. The wavelength range used for analysis was 400–4000 cm−1, with a total of 32 scans and a resolution of 4 cm−1.

2.4. DNA Extraction and 16S rRNA Gene High-Throughput Sequencing

Each sampling point’s water samples were filtered using a 0.45 μm nylon fiber filter membrane, with approximately 500 mL to 1 L of water filtered for each sample. The filter membranes were collected and stored in a refrigerator at −80 °C. A DNeasy Power Water Kit (Qiagen Co., Germantown, MD, USA) was used to extract DNA from the samples following the instructions provided by the manufacturer. The DNA concentration was determined using a NanoPhotometer (N50, IMPLEN Co., Westlake Village, Germany). Sequencing was performed using the Illumina MiSeq PE300 sequencing platform with a paired double-end 250 bp strategy. The 16S rRNA gene V4 region was amplified using the forward primer 515F (GTGYCAGCMGCCGCGGTAA) and reverse primer 806R (GGACTACNVGGGTWTCTAAT). Raw read files were uploaded to the National Center for Biotechnology Information Sequencing Read Archive database (SRA; https://trace.ncbi.nlm.nih.gov/Traces/sra/, The ice-free period samples were accessed on 11 September 2023 and the ice-sealed period samples were accessed on 22 November 2023) with the BioProject Accession ID PRJNA1015121. A list of the sample names and their corresponding BioSample Accession IDs is shown in Table S2.

2.5. Pathogen Quantification Using High-Throughput Quantitative PCR (HT-qPCR)

The quantification and identification of pathogens were carried out using a TaqMan probe-based HT-qPCR assay (Magigene, Guangzhou, China). The assay was completed utilizing a WaferGen smart-chip real-time PCR system. HT-qPCR reactions were performed in triplicate, with sterilized water serving as the negative control with no template. HT-qPCR was performed in a 100 nL reaction system using the TaqMan®® gene expression master mix kit’s optimal reaction system. It included 1 × TaqMan gene expression master mix, 1 × ROX (6-carboxyl-X-rhodamine) reference dye, bovine serum ampere (1 mg/mL), forward and reverse primers (0.9 μmol/L), probe (0.25 μmol/L), DNA (5 ng/μL) and nuclease-free water [36]. The following procedure was formulated: initial denaturation (95 °C, 10 min), followed by 40 cycles (i.e., denaturation at 95 °C for 30 s, annealing treatment at 60 °C for 30 s), and finally the absolute quantitative information of the sample genes was acquired by melting curve analysis automatically generated by the program.

2.6. Bioinformatics and Statistical Analysis

The data obtained through Illumina-Miseq high-throughput sequencing were subjected to base calling, resulting in the generation of raw paired-end sequences (raw data). The raw data obtained in the previous step underwent processing: using the cutadapt software (v1.9.3), primer sequences were trimmed (with a maximum allowed mismatch rate set at 15%). Subsequently, DADA2 was employed to process the qualified paired-end raw data using default parameters in QIIME2, followed by a series of analyses including denoising: first, a quality filtering process is applied, followed by denoising, merging, and ultimately removing chimeras [37,38,39]. After deduplication, the resulting feature sequences are referred to as amplified sequence variants (ASVs). Subsequently, an abundance table was generated that represents both the ASVs and their corresponding representative sequences. Diversity analysis was conducted to uncover disparities in species composition among the samples and community structure between samples, as well as to undertake tailored analysis and extensive data mining.
The sampling point distribution map was created using ArcGIS 10.5 (ESRI, Redlands, CA, USA), and statistical analysis was carried out in R 4.2.3. The study aimed to investigate the proportion of BCs in receiving rivers derived from sewage treatment plant BCs using Source Tracker analysis [40]. Additionally, co-occurrence network analysis with the R package “Hmisc” was used to probe the link between 200 microbial ASVs and DOM components and fluorescence signature parameters [41,42]. Furthermore, Spearman correlation analysis was conducted to thoroughly explore the correlations of bacterial pathogens with DOM and environmental factors. The flowchart of the experimental content is shown in Figure S1.

3. Results and Discussion

3.1. Variation in River Water Physicochemical Characteristics

The concentration of TN was higher in the ice-sealed period, potentially owing to the lower water temperature (Table 1). This led to a decrease in microbial metabolism and rate of TN degradation [43]. Higher concentrations of NO3-N, NO2-N, TN, and TP were found at WWTP effluent discharge and downstream, which might indicate nonnegligible pollution. As shown in Figure S2, it is evident that the water temperature is significantly positively correlated with NO2-N, while it is significantly negatively correlated with DO. DO exhibits a significant negative correlation with NO2-N, as well as a significant negative correlation with water temperature. The effluent from the WWTP exhibits elevated water temperatures, resulting in an increase in NO2-N levels and a decrease in DO. Oxygen needed for biological metabolism is reduced and nitrifying bacteria proliferate. This results in a deterioration in water quality downstream from the WWTP.
DOM concentration (represented as DOC levels) also showed a significant increase at WWTP effluent discharge and downstream, while it was lightly affected by river freezing. RW had a substantial impact on the water quality indicators of the river during the ice-free and ice-sealed periods. The DOM in the receiving river originated primarily from RW. In addition, we found that the amount of DOM in the upstream river was small, the amount of DOM in the RW was large, and the amount of DOM in the downstream was gradually increasing. This suggests that in addition to the discharge of reclaimed water increasing the levels of DOM in the river, the downstream river itself is being organically polluted.

3.2. Spectral Characteristics and Source Identification of DOM

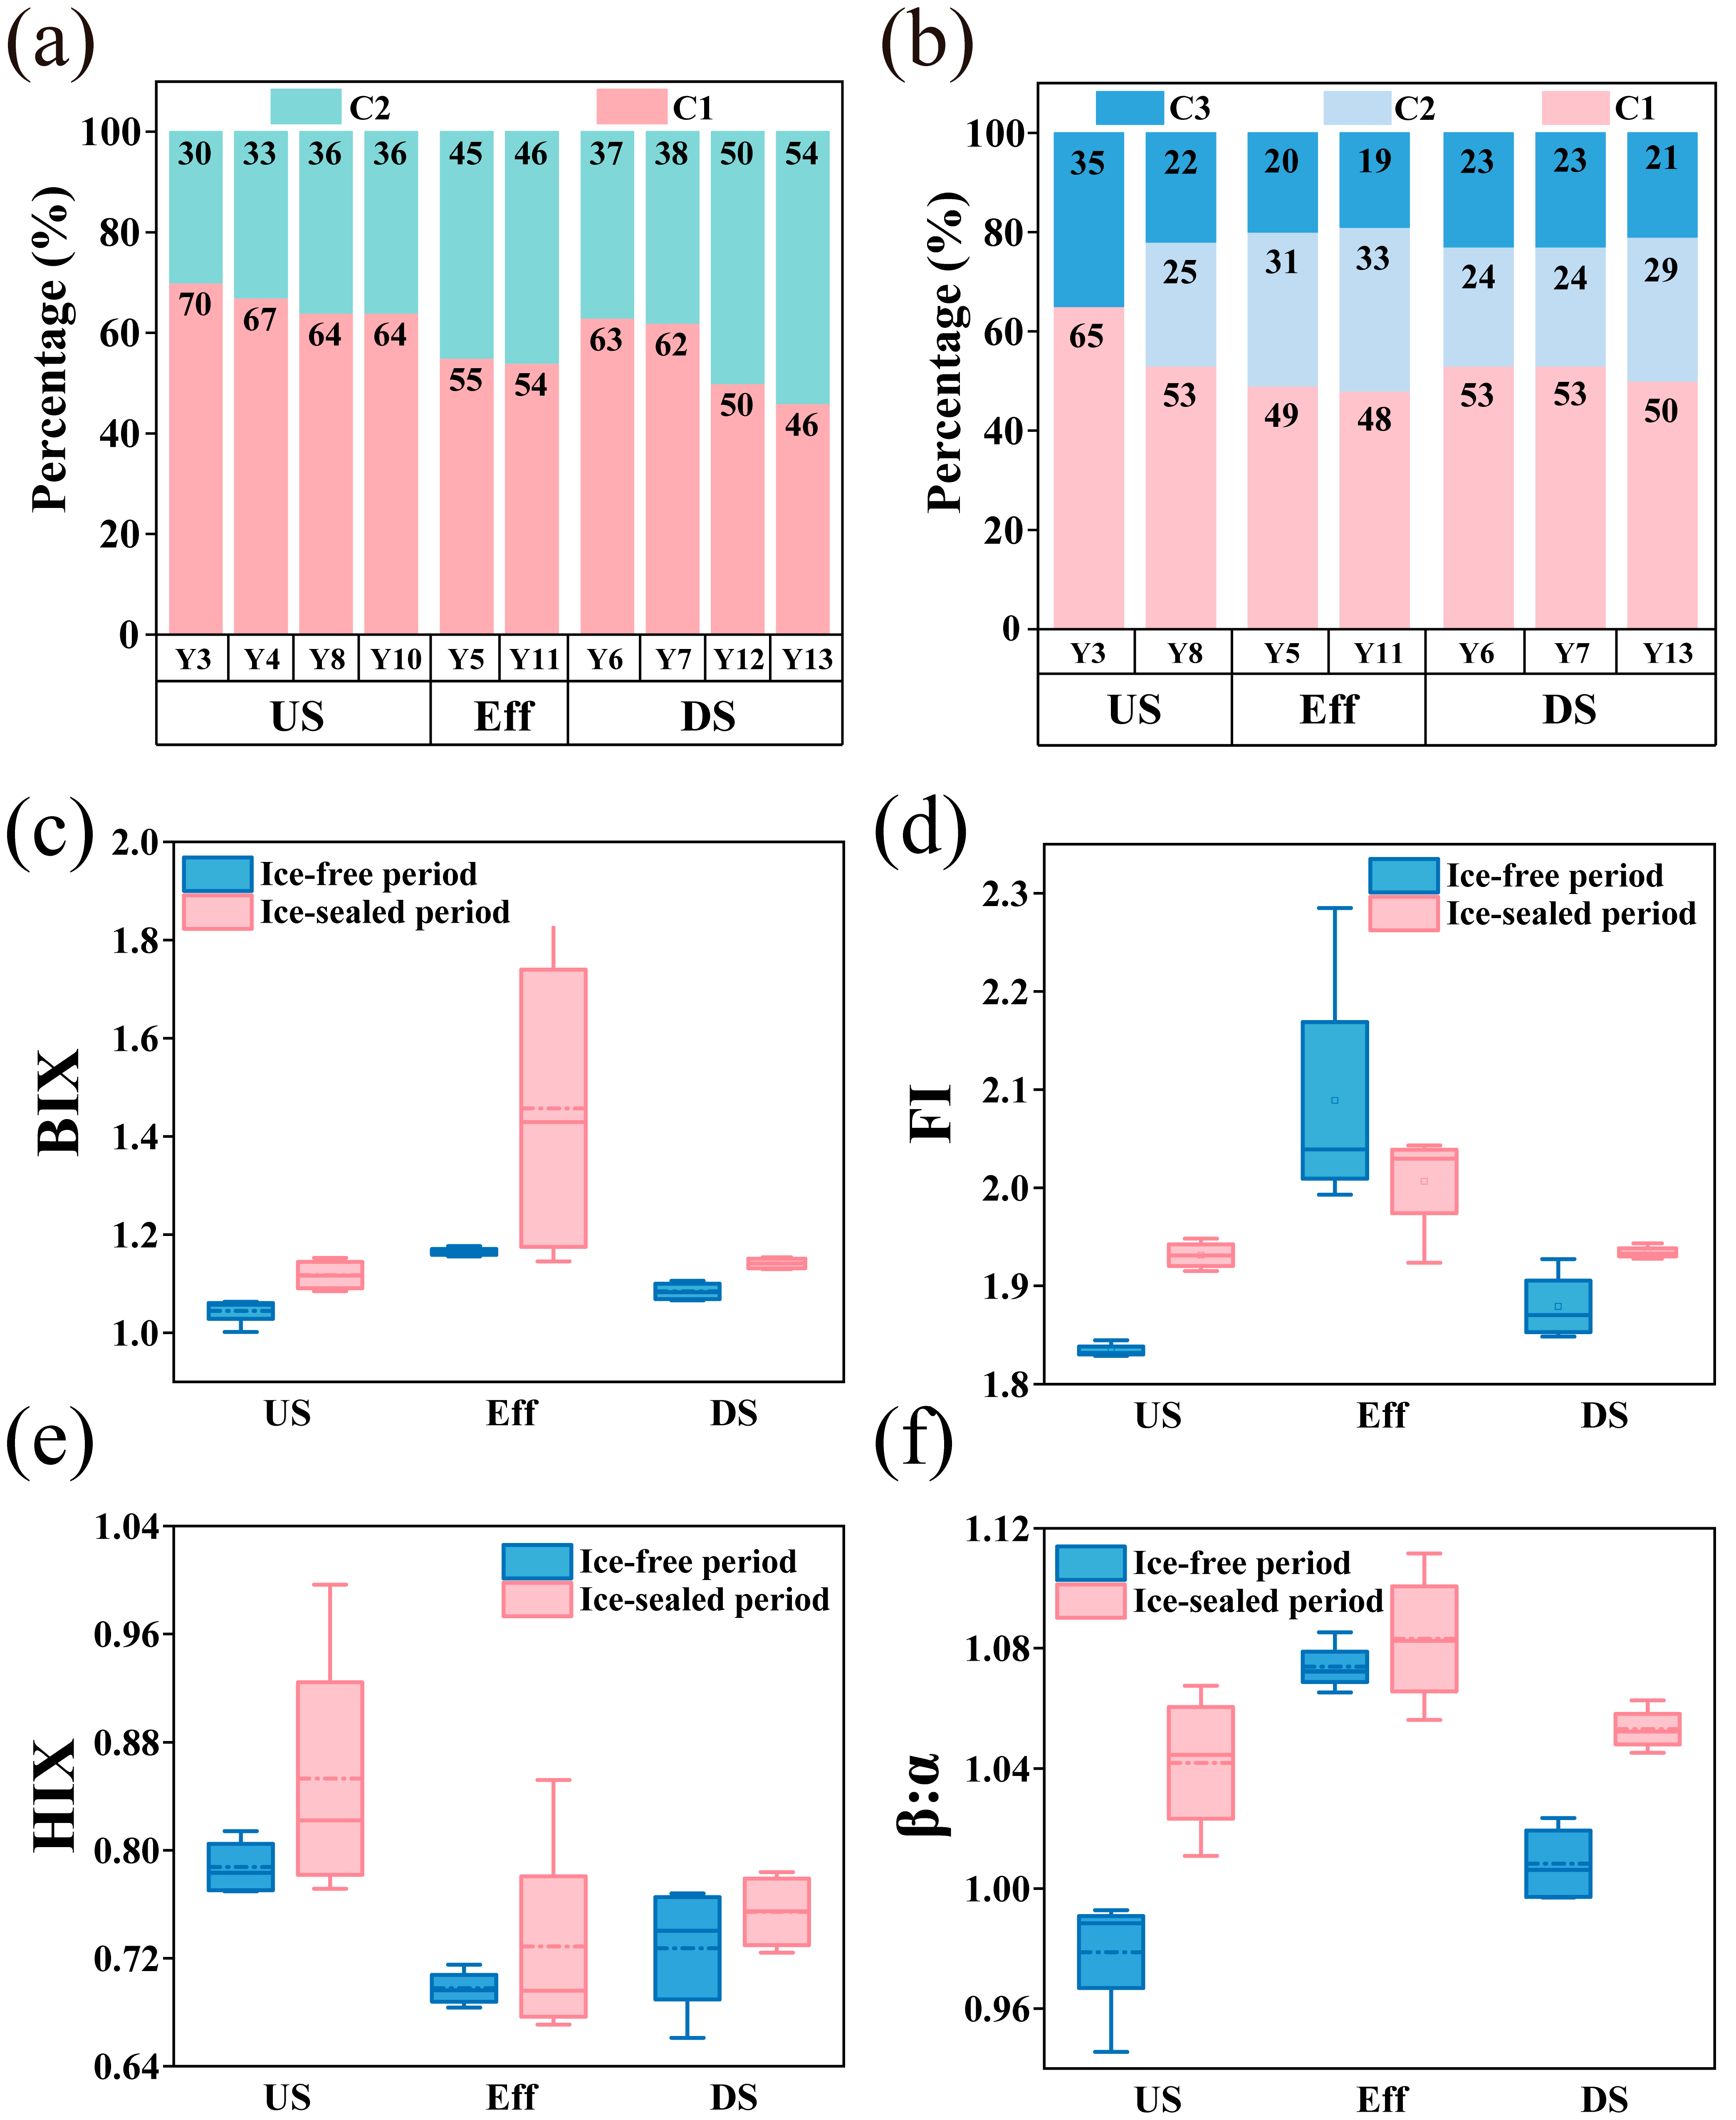
Figure 2 presents three-dimensional fluorescence spectra and maximal excitation–emission wavelength distribution curves for two periods. Component 1 (C1) and component 2 (C2) were found in the ice-free period and C1, C2, and component 3 (C3) were identified in the ice-sealed period. Among them, C1 and C3 were humic-like substances, and C2 was a protein-like substance (Figure 2b). Figure 3a,b shows the relative proportions of DOM fluorescence components during the ice-free and ice-sealed periods. In the effluent and downstream of the WWTP, the recharge of RW led to a substantial increase in protein-like substances, exceeding 10%. In water bodies contaminated with sewage, the proportion of protein-like substances in fluorescent fractions increased substantially [44,45]. The humic-like C1 occupied over 50% of the content in both periods. This indicates that the river was mainly composed of humic substances. During the ice-sealed period, the humic-like components of the river significantly increased by over 10%. This phenomenon was likely due to the seasonal control exerted by temperature and light conditions, influencing the composition of DOM [46].
During the ice-sealed period, the fluorescence index (FI) value indicates that the river exhibited significant autotrophic characteristics. On the contrary, the ice-free period displayed a confluence of endogenous and exogenous sources (Figure 3d) [47]. The highest concentrations of the biological index (BIX) and freshness index (β:α) were found at the effluent discharge site of the WWTP, which suggested that microbial activity plays a critical role in the production of DOM in RW (Figure 3c,f). Elevated humification index (HIX) values indicated a reduced concentration of humic substances in the RW. Additionally, during the ice-sealed period, the values of BIX, HIX (Figure 3e), and β:α were greater than those during the ice-free period. This finding suggested that microbial activity was more significant in the production of DOM, with an increased prevalence of aromatic compounds, during the ice-sealed period.
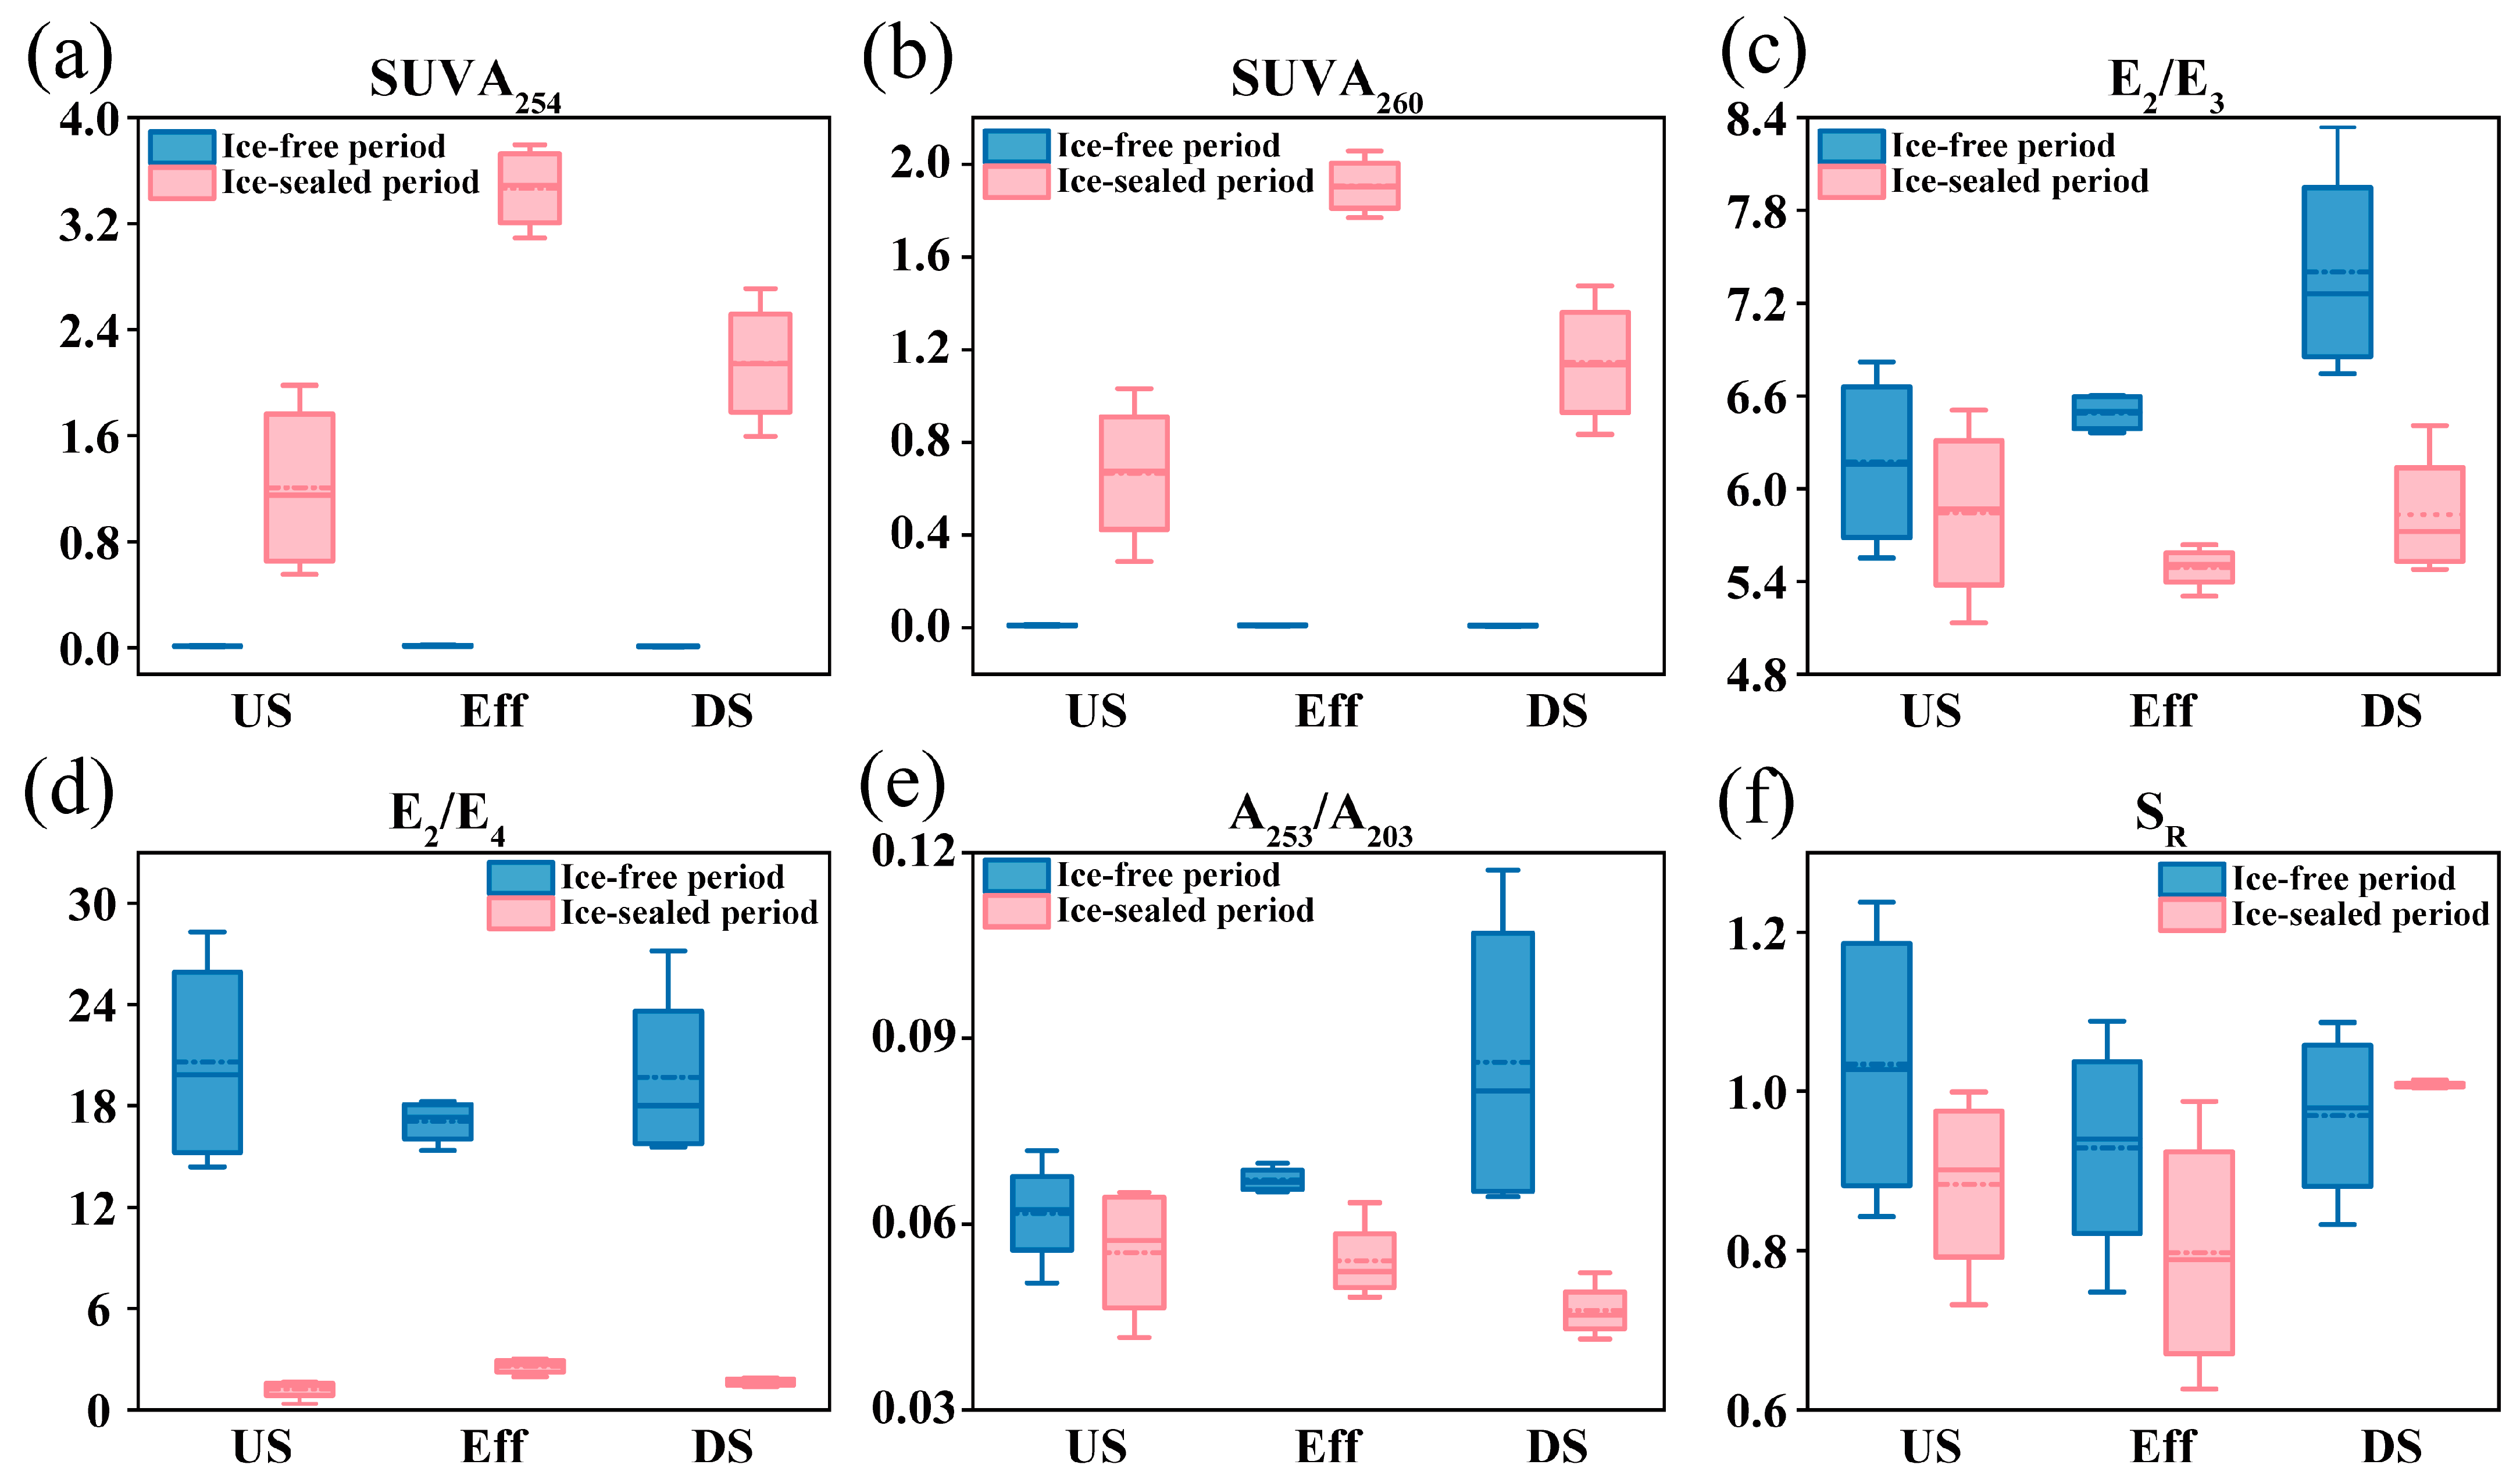
The UV fluorescence spectral parameters are defined as shown in Table S3. SUVA254 and SUVA260 values were significantly higher during the ice-sealed period of the river than the ice-free period of the river (Figure 4a,b). Chemical structures that were more stable were those in which aromatic and hydrophobic groups were present. This may be due to an increase in humic-like substances during the ice-sealed period, with the humic-like substances exhibiting heightened stability [48]. The E2/E3 and E2/E4 values indicated that the river had a higher molecular weight and molecular condensation during the ice-sealed period [49,50]. The overall low A254/A203 value demonstrated that the substituents contained in the benzene ring in the structure of DOM in rivers were mainly non-polar functional groups (Figure 4e) [51]; SR values indicated a higher molecular contribution during the ice-sealed period of the river (Figure 4f) [52]. The SUVA254 value, along with the lower SR and E2/E3 values, suggested the presence of aromatic high molecular weight DOM, indicating the existence of aromatic high-molecular-weight DOM during the ice-sealed period. The research findings align with the literature, suggesting that aromatic high-molecular-weight molecules dominate the composition of DOM during the winter season [53].
The infrared spectra of DOM in river samples are shown in Figures S3a and S1b. Riverine DOM comprised an extensive array of components and functional groups that can interact with pollutants, thereby significantly influencing pollutant toxicity, distribution, and biological availability [54,55]. In conclusion, the replenishment of RW can alter the composition of DOM, according to our research. DOM also demonstrated pronounced seasonal variations. The significance of humic-like components, aromaticity, and hydrophobicity of DOM increased during the freezing season. This suggested that variations in temperature might incite the transformation of DOM from substances with lower molecular condensation, like fulvic acids, into substances with humic characteristics. Prior studies have documented that fulvic acid, a primary constituent of humic substances, is capable of undergoing non-biological transformation into substances that resemble humic substances [56].

3.3. BC Composition and Distribution Characteristics

During the ice-free and ice-sealed periods, a total of 2365 ASVs and 3940 ASVs were found. Alterations in Chao1 and the ACE indices suggested that the quantity of community species was greater during the ice-sealed period. The increases in the Shannon and Simpson indices at the effluent and downstream suggested that the recharge of RW contributed to a heightened diversity of species within the river community (Table S4). At the phylum level, the dominant phyla during the ice-free period of the river were Proteobacteria (average relative abundance: 50%), Bacteroidetes (15%), Actinobacteria (12.4%), and Cyanobacteria (12%) (Figure 5a). The dominant phyla during the ice-sealed period of the river were Proteobacteria (34%), Bacteroidetes (27%), and Actinobacteria (15%) (Figure 5c). At the genus level, the dominant genera during the ice-free period of the river were Flavobacterium (16%), Saccharibacteria_genera_incertae_sedis (2.7%), and Mycobacterium (2.7%) (Figure 5b). The dominant genera during the ice-sealed period of the river were Arcobacter (7.2%), Flavobacterium (6.4%), and Pseudarcobacter (2.6%) (Figure 5d). The composition of BCs at the genus level varied significantly between the ice-free and ice-sealed periods. Furthermore, the PCoA results unveiled noteworthy variations in the composition of BCs in the ice-free and ice-sealed periods. (Figure 6a). The composition of MCs has been demonstrated to be influenced by seasonal variations, such as temperature [42].
The relative abundance of Proteobacteria and Bacteroidetes in the receiving rivers increased significantly. Compared to the ice-free period, Proteobacteria exhibited a significant reduction of 16%, Bacteroidetes exhibited a notable increase of 12%, and Flavobacterium exhibited a noteworthy increase of 10% during the ice-sealed period. The freezing of the river markedly altered the composition of BCs. This indicated that both temporal and spatial variations influence the composition of BCs. Research has revealed that Proteobacteria and Bacteroidota play indispensable roles in the biogeochemical cycles of Earth [57]. Proteobacteria and Bacteroidetes demonstrated remarkable abilities in the degradation of a wide range of macromolecular organic substances, thereby performing an essential function in the material cycling of riverine ecosystem environments [58,59]. Flavobacterium plays a vital role in the microbial food web [60]. It has been shown that the abundance of Proteobacteria increases with increasing temperature, while the abundance of Bacteroidetes decreases. Flavobacterium can tolerate lower temperatures [61]. Research suggested that the relative abundance of Bacteroidetes significantly increases during winter, potentially due to the enhanced nitrification capacity of winter systems [62], wherein Bacteroidetes play a crucial role in organic matter nitrification, reflected in the decrease in effluent ammonia nitrogen concentrations. The increase in the relative abundance of Flavobacterium is associated with the elevation of water body eutrophication. Flavobacterium predominantly accumulates during winter, when river flow is reduced, potentially leading to the retention of pollutants. Flavobacterium belongs to the class of typical denitrifying bacteria, with the increase in winter TN leading to an augmentation in the relative abundance of Flavobacterium [63].
The possible contribution of WWTP effluent to the BCs of the receiving river was identified using source tracker analysis (Figure 6b). Overall, 89% of the BCs in river water originated from WWTP effluent. This finding indicated that WWTP effluent significantly influenced the diversity of BC in the receiving river. River pollution was more likely as a result of the RW discharge [64,65,66]. This showed the potential dangers of RW discharge into river ecosystems.

3.4. Distribution Characteristics of Pathogenic Bacteria

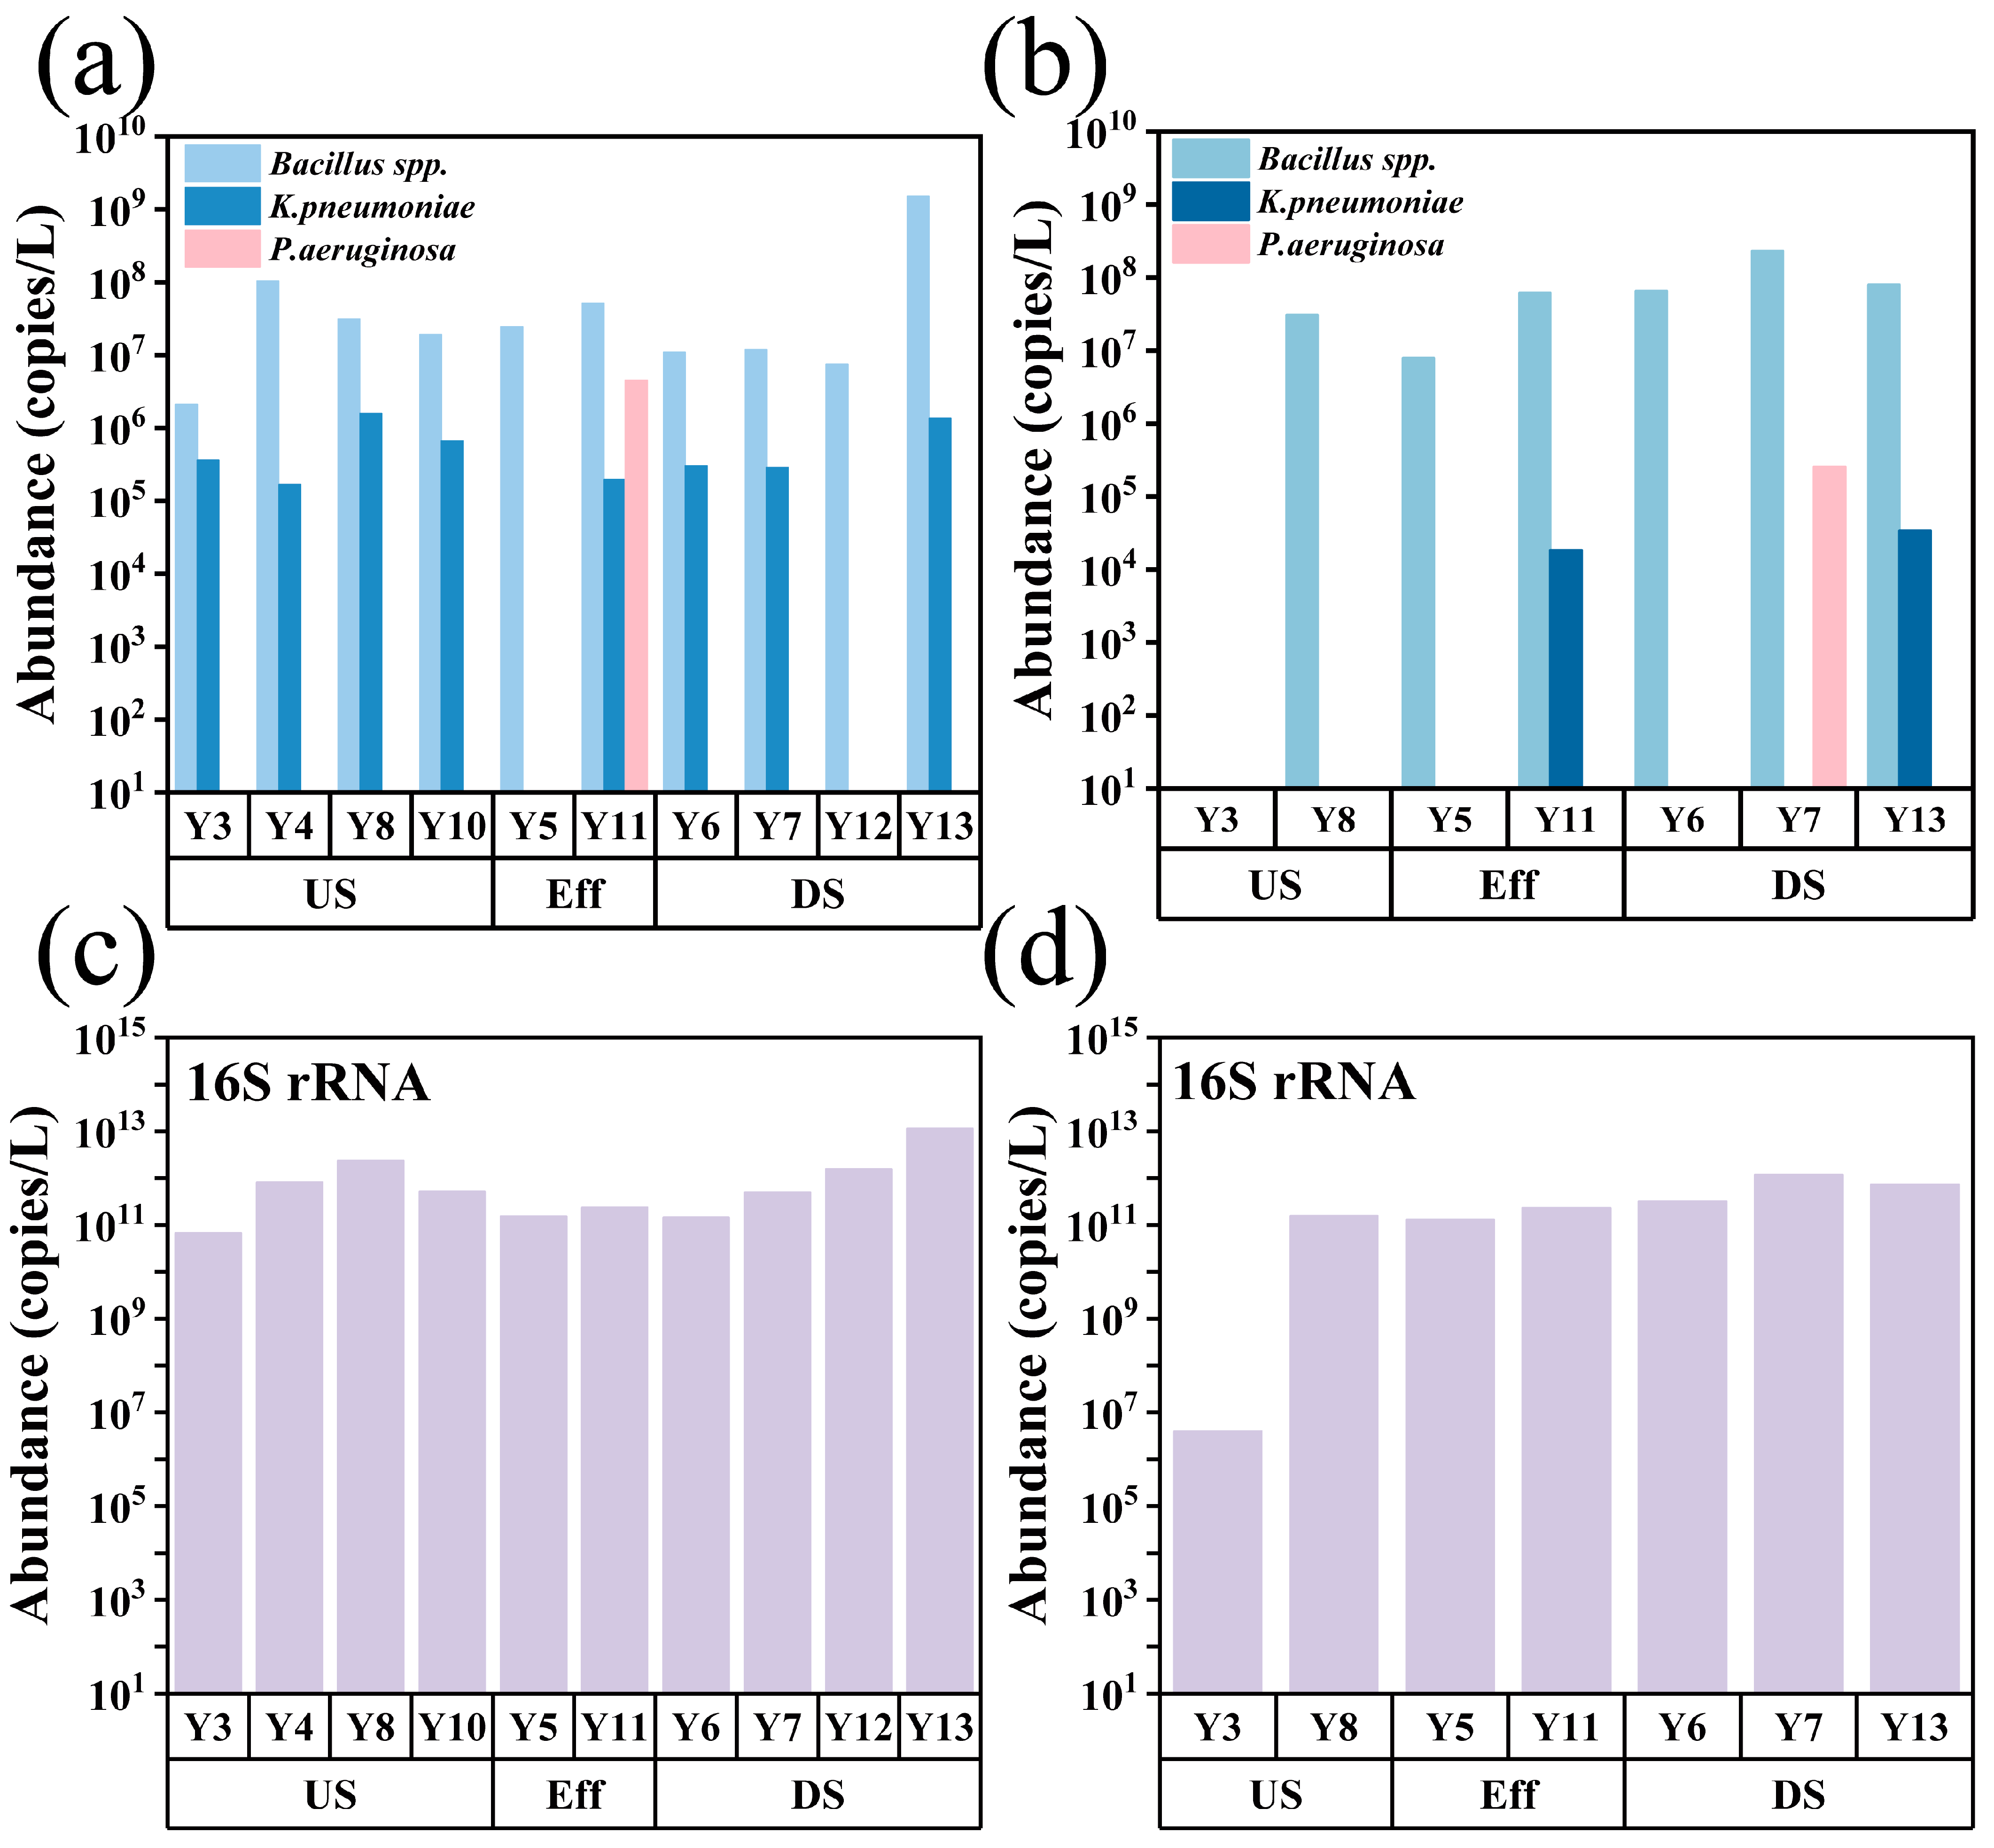
Three predominant pathogenic bacteria—Klebsiella pneumoniae (K. pneumoniae), Pseudomonas aeruginosa (P. aeruginosa), and Bacillus spp.—were identified in samples collected in the ice-free and ice-sealed periods (Figure 7a,b). We detected Bacillus spp. in all 10 sampling sites during the ice-free period of the river, with an abundance of 2.1 × 10⁶–1.5 × 10⁹ copies/L; K. pneumoniae was detected in 8 of the 10 sampling sites, with an abundance of 1.7 × 10⁵–1.6 × 10⁶ copies/L; and P. aeruginosa was detected only in the effluent, with an abundance of 4.5 × 10⁶ copies/L (Figure 7a). Bacillus spp. were not detected at Y3 only during the ice-sealed period of the river, with an abundance range of 7.9 × 10⁶–2.3 × 10⁸ copies/L; K. pneumoniae was detected in the effluent and downstream of the WWTP B, with an abundance of 1.8 × 10⁴–3.4 × 10⁴ copies/L, and P. aeruginosa was detected only downstream, with an abundance of 2.5 × 10⁵ copies/L (Figure 7b).
Figure 7a,b reveals that the detection rate and abundance of Bacillus spp. were highest in the river samples. This ubiquitous occurrence in detecting pathogenic bacteria in river environments can be ascribed to the robust vitality and rapid reproductive rate of Bacillus spp. Prior studies have established the active involvement of Bacillus spp. in nitrification and denitrification processes, thereby establishing the genus as a significant functional entity in the cycling of carbon and nitrogen [67]. In addition, many studies have shown that Bacillus spp., P. aeruginosa, and K. pneumoniae were the dominant pathogens in rivers and WWTPs.
The abundance of the total bacterial 16S rRNA genes in the ice-free period ranged from 6.7 × 10¹⁰ to 1.1 × 10¹³ copies/L (Figure 7c) and 4.0 × 10⁶ to 1.2 × 10¹² copies/L in the ice-sealed period (Figure 7d). The 16S rRNA genes exhibited minimal variation between the two periods. In addition, we found that the abundance and detection rate of K. pneumoniae were much higher during the ice-free than ice-sealed period of the river. This may be due to the lower temperatures during the ice-sealed period of the rivers. Previous studies have indicated a potentially significant positive correlation between temperature and the detection rate of K. pneumoniae and that excessively high temperature may influence the antibiotic resistance of K. pneumoniae [68]. Compared to the ice-sealed period, the content of 16S rRNA genes was greater during the ice-free period of the river. We concluded that the increase in temperature-induced promotion of bacterial growth could be the cause of this phenomenon. The activity of specific enzymes within microbial cells was the primary mechanism by which temperature impacted the growth and metabolic rates of microorganisms [69].

3.5. Co-Occurrence Patterns among Bacterial Community and Their Interactions with Environmental Factors

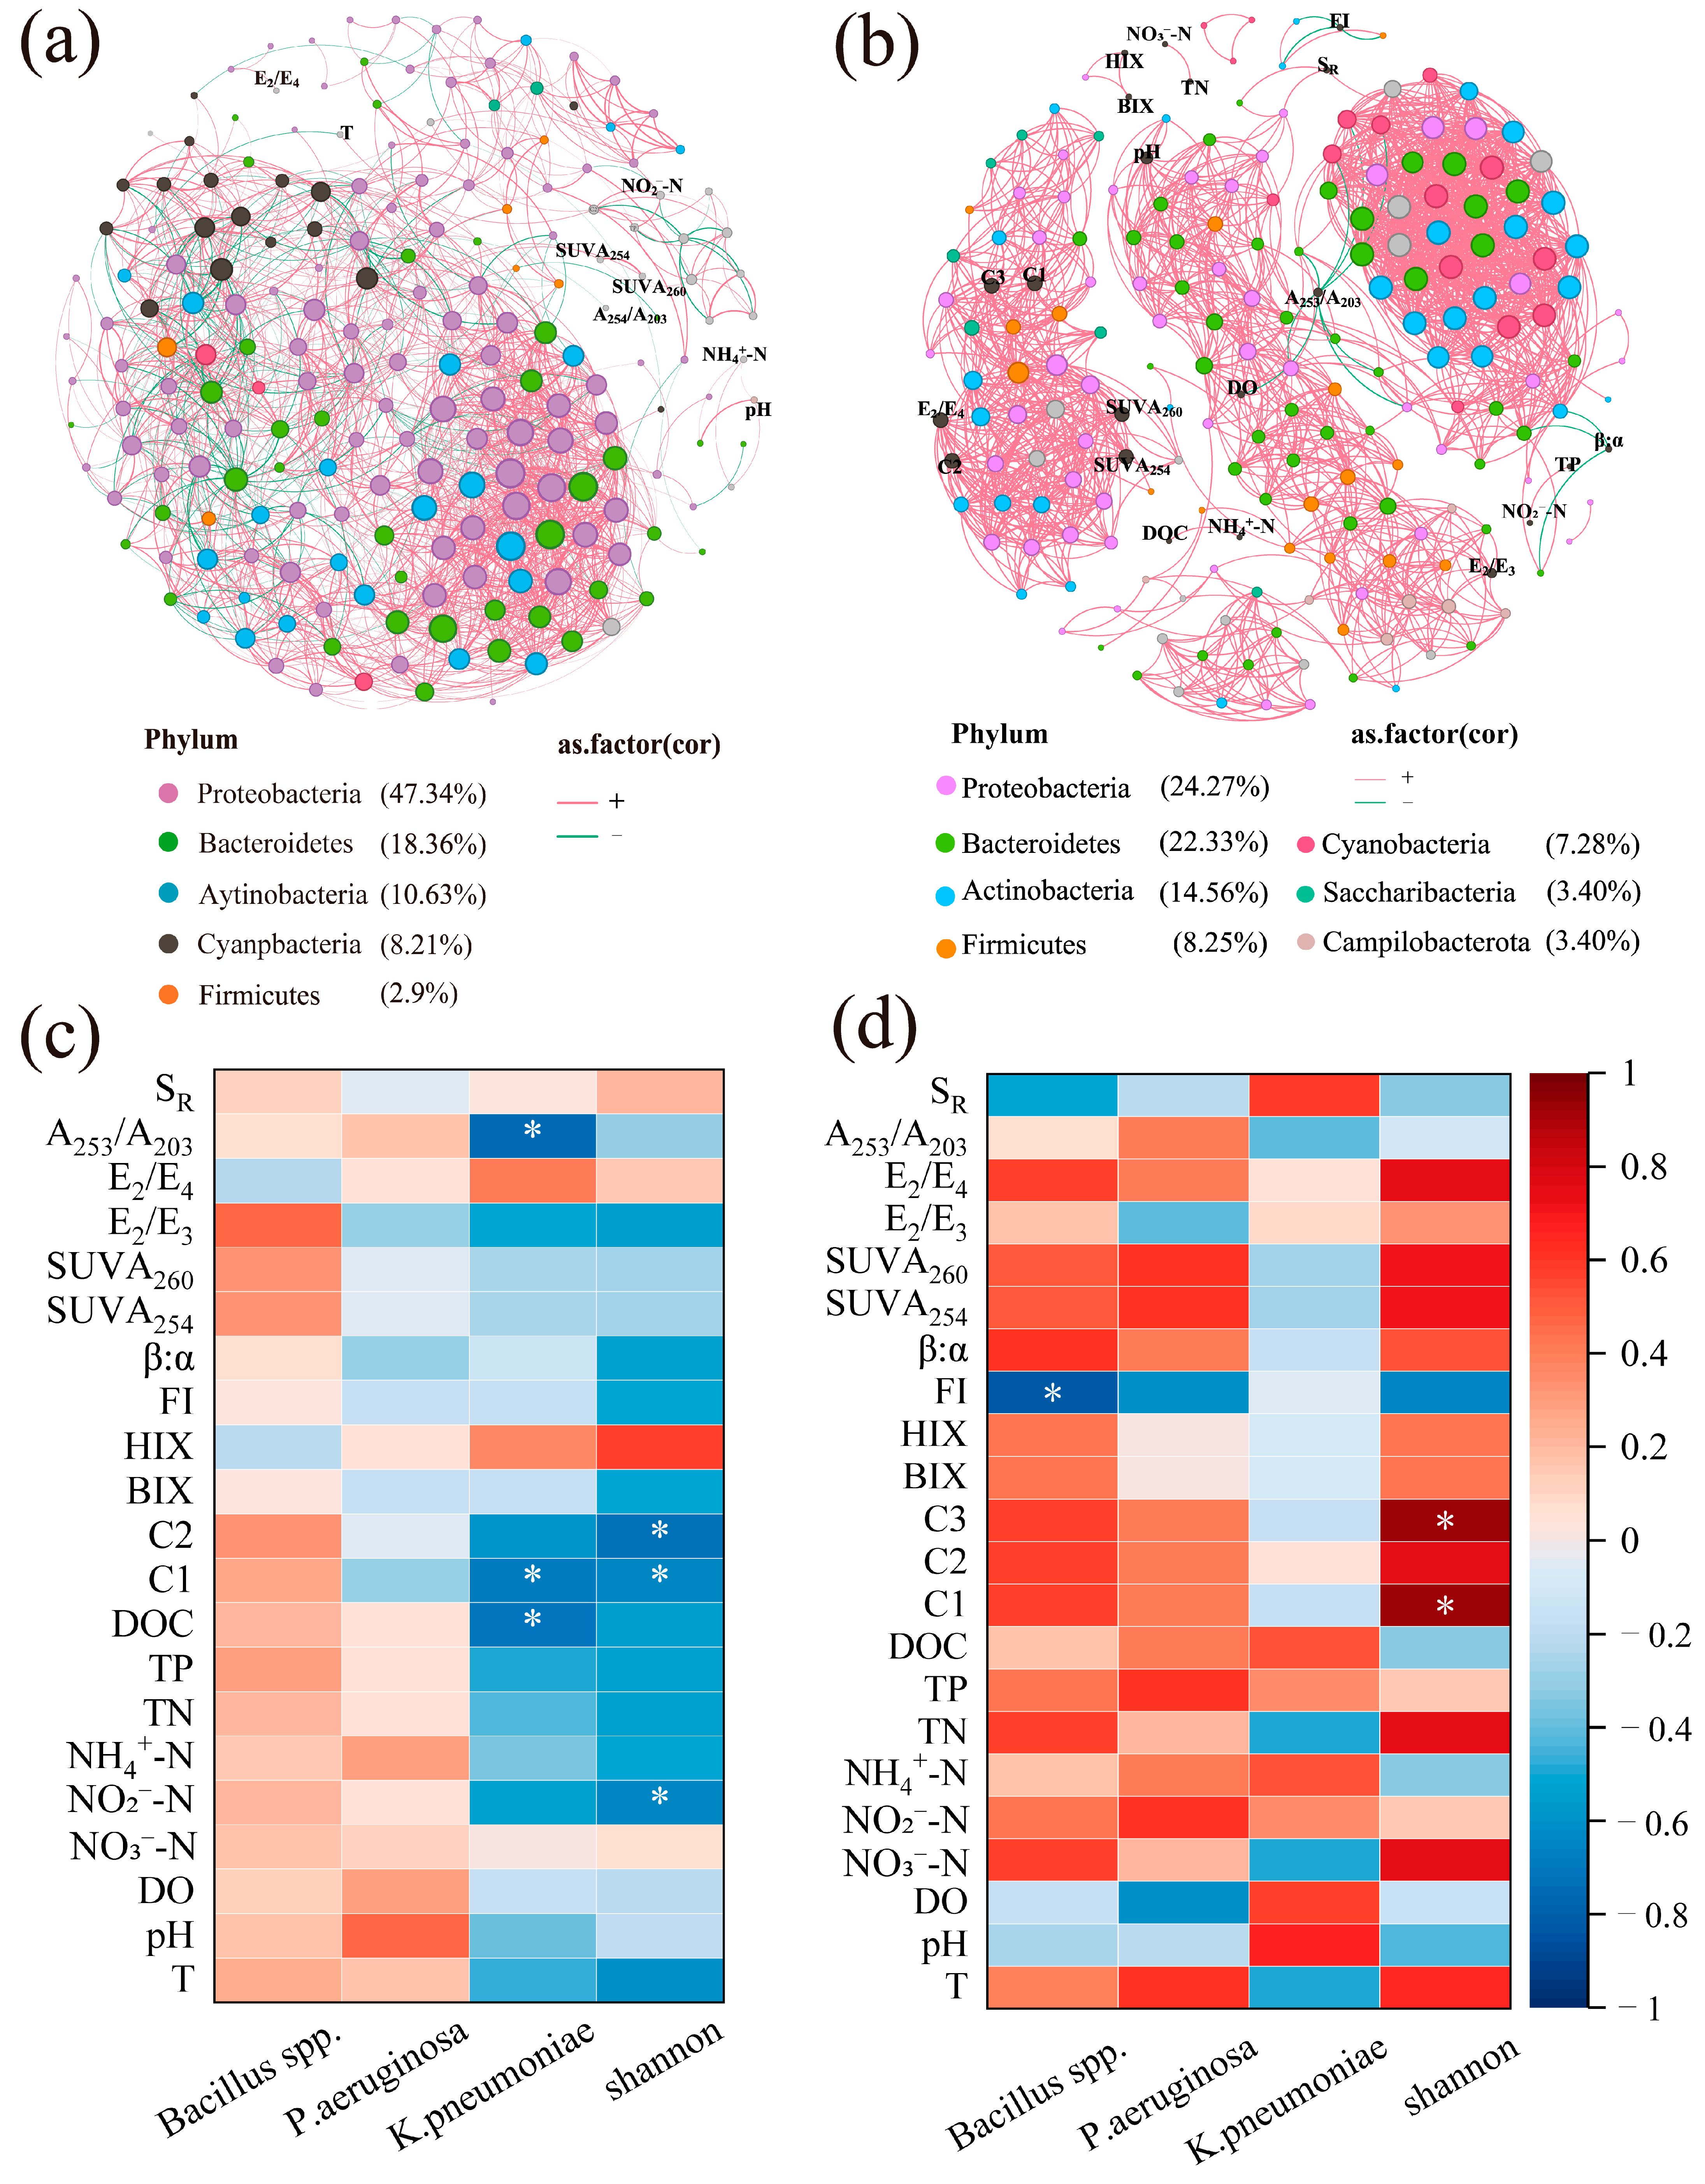
Co-occurrence patterns were analyzed based on the 200 ASVs with the highest relative abundance and environmental variables. Co-occurrence networks between BCs and environmental variables during the ice-free period of the river were constructed (Spearman |r| > 0.6, p < 0.1), and the network consisted of 207 nodes and 1797 edges (Figure 8a). Based on the correlation analysis (Spearman |r| > 0.8) and significance (p < 0.05), co-occurrence patterns between BCs and environmental variables during the ice-sealed period of the river were constructed, and the network consisted of 217 nodes and 4229 edges (Figure 8b). The nodes in the network indicated dominant phyla of Proteobacteria, Bacteroidetes, Actinobacteria and Cyanobacteria. As shown in Figure 8a,b, the environmental variables correlating with the bacterial community (ASVs) during the ice-free and ice-sealed periods of the river were NH4+-N, NO2-N, A253/A203, SUVA254, SUVA260 E2/E4, and DOM components.
The primary nutritional substance that regulates the constraints on life processes on Earth is nitrogen, which is a fundamental constituent of all living organisms [70]. This indicates that nitrogen compounds are the main drivers of the river bacterial community. Research indicated that Proteobacteria can degrade aromatic compounds [71]. Therefore, this suggested that functional groups have a possible influence on the diversity of the phylum Proteobacteria. During the ice-sealed period, there were significant correlations with the C1, C2, and C3 components of DOM (Figure 8b). DOM, the most sizable mobile organic carbon reservoir globally, augmented the carbon source necessary for BC growth in tandem with the proliferation of humic-like substances [72,73,74]. Furthermore, correlations were significantly stronger during the ice-sealed period than the ice-free period. This may be as a result of the higher aromaticity of DOM during the ice-sealed period: high DOM aromaticity resulted in more complex and connected networks of bacteria [75].
Spearman correlation analysis showed that during the ice-free period of the river, the Shannon index exhibited a significant correlation with C1 (r = −0.65, p = 0.05), C2 (r = −0.72, p = 0.038), and NO2-N (r = −0.65, p = 0.043) (Figure 8c). On the other hand, it demonstrated substantial correlations with C1 (r = 0.93, p = 0.0025) and C3 (r = 0.91, p = 0.0022) during the ice-sealed period (Figure 8d). The lack of a considerable impact on bacterial diversity resulting from the river freezing (Table S4) suggested that alterations in DOM might have played a role in the substantial variation in the correlation between DOM and bacterial community diversity (Figure 8c,d). This indicated that river freezing has a substantial impact on the correlation between DOM components and BC diversity. Seasonal variations may be noticeable in the correlation between DOM and BCs.
Furthermore, Spearman correlation analysis revealed that during the ice-free period of the river, K. pneumoniae exhibited significant correlations with C1 (r = −0.68, p = 0.046), DOC (r = −0.7, p = 0.023), and A253/A203 (r = −0.75, p = 0.012) (Figure 8c). This suggested that the augmentation in the components and concentration of humic substances during the ice-free period may lead to a reduction in the abundance of K. pneumoniae. Bacillus spp. were significantly correlated with FI (r = −0.82, p = 0.023) during the ice-sealed period (Figure 8d). The change in the source of river DOM during the ice-sealed period may affect changes in the abundance of Bacillus spp. During the ice-sealed period of the river, endogenous sources constituted the predominant source of DOM (Figure 3d). This suggested that an increase in endogenous DOM may lead to a decrease in the abundance of Bacillus spp. Studies have shown that the composition of DOM is largely influenced by its sources and that these sources influence BC variation through bottom-up processes based on metabolic preferences and capabilities [76].

4. Conclusions

Our study revealed that ice-sealed RW recharge has resulted in spatial and temporal distribution patterns of DOM and MCs from aquatic ecosystems in seasonally ice-sealed urban rivers. We found that discharges of RW affected water quality in receiving rivers and dramatically increased the protein-like substance of DOM by 10%. During the ice-sealed period, the aromaticity and hydrophobicity of DOM increased significantly in comparison to the ice-free period. Simultaneously, the concentration of humic-like components increased substantially. During the ice-sealed period, Proteobacteria were significantly reduced by 16%, while Bacteroidetes and Flavobacterium were significantly increased by more than 10%. K. pneumoniae decreased significantly during the ice-sealed period. This demonstrated the presence of pronounced seasonal disparities in both DOM and MCs. In addition, co-occurrence network analysis revealed a more significant correlation between BCs and DOM during the ice-sealed period. This revealed the possibility of a more robust correlation between highly aromatic and hydrophobic DOM and BCs. The findings of the Spearman correlation analysis indicated that there was a significant relationship between the abundance variation of pathogenic bacteria and the components and compositional characteristics of DOM, which exhibited a high degree of variability during the ice-free and ice-sealed periods. In the future, if DOM can be used to indicate RW sources and contamination levels, this will greatly reduce detection time and testing costs. Furthermore, comprehending the correlation between RW components, including DOM and MCs, will not only be essential for forecasting the transmission of waterborne diseases in conjunction with natural water bodies but will also facilitate the enhancement of RW quality to foster greener aquatic ecosystems with reduced anthropogenic risk.

Supplementary Materials

The following supporting information can be downloaded at https://www.mdpi.com/article/10.3390/w16060906/s1. Figure S1: Flowchart of experimental content; Figure S2: Spearman correlation analysis of water quality indicators; Figure S3: Region between 4000 and 400 cm−1 of typical FT-IR absorbance: (a) ice-free period; (b) ice-sealed period; Table S1: The latitude and longitude information of each sampling sites; Table S2: Accession Identifiers for the raw reads uploaded to the National Center for Biotechnology Information (NCBI) Sequencing Read Archive (SRA); Table S3: Meaning of the characteristic parameters of the UV spectra; Table S4: Alpha diversity indexes of the river; Reference [77] is citied in the Supplementary Materials.

Author Contributions

Conceptualization, Y.H., Y.Z. and Z.H.; data curation, Y.Z. and Z.H.; funding acquisition, Y.H.; investigation, J.Z.; resources, Z.Z., W.F. and Z.G.; software, J.Z.; supervision, M.H.; validation, Y.H., Z.Z., W.F. and Z.G.; writing—original draft, J.Z. All authors have read and agreed to the published version of the manuscript.

Funding

This study was financially supported by the National Natural Science Foundation of China (grants 52270197, 52000085, and U20A20322), the Science and Technology Development Program of Jilin Province (Grant Nos. 20220101182JC and 20220508121RC), and the Key Laboratory of Songliao Aquatic Environment, Ministry of Education (SLLY2020002).

Data Availability Statement

The data are available from the corresponding author on reasonable request.

Conflicts of Interest

The authors declare that they have no known competing financial interests or personal relationships that could have appeared to influence the work reported in this paper.

References

  1. Messager, M.L.; Lehner, B.; Cockburn, C.; Lamouroux, N.; Pella, H.; Snelder, T.; Tockner, K.; Trautmann, T.; Watt, C.; Datry, T. Global prevalence of non-perennial rivers and streams. Nature 2021, 594, 391–397. [Google Scholar] [CrossRef]
  2. Grill, G.; Lehner, B.; Thieme, M.; Geenen, B.; Tickner, D.; Antonelli, F.; Babu, S.; Borrelli, P.; Cheng, L.; Crochetiere, H.; et al. Mapping the world’s free-flowing rivers. Nature 2019, 569, 215–221. [Google Scholar] [CrossRef]
  3. Tao, J.; Bond, N.; Tun, N.N.; Ding, C. Keep the Salween River free-flowing. Science 2023, 381, 383–384. [Google Scholar] [CrossRef] [PubMed]
  4. Xia, Q.W.; He, J.T.; Li, B.H.; He, B.A.; Huang, J.X.; Guo, M.L.; Luo, D. Hydrochemical evolution characteristics and genesis of groundwater under long-term infiltration (2007–2018) of reclaimed water in Chaobai River, Beijing. Water Res. 2022, 226, 119222. [Google Scholar] [CrossRef] [PubMed]
  5. Qi, H.; Zeng, S.Y.; Shi, L.; Dong, X. What the reclaimed water use can change: From a perspective of inter-provincial virtual water network. J. Environ. Manag. 2021, 287, 112350. [Google Scholar] [CrossRef]
  6. Munné, A.; Solà, C.; Ejarque, E.; Sanchís, J.; Serra, P.; Corbella, I.; Aceves, M.; Galofré, B.; Boleda, M.R.; Paraira, M.; et al. Indirect potable water reuse to face drought events in Barcelona city. Setting a monitoring procedure to protect aquatic ecosystems and to ensure a safe drinking water supply. Sci. Total Environ. 2023, 866, 161339. [Google Scholar] [CrossRef]
  7. An, S.Q.; Song, Y.; Fu, Q.; Qi, R.; Wu, Z.H.; Ge, F.Y.; Lu, X.Q.; An, W.; Han, W.X. Reclaimed water use improved polluted water’s self-purification capacity—Evidenced by water quality factors and bacterial community structure. J. Clean. Prod. 2023, 386, 135736. [Google Scholar] [CrossRef]
  8. Huo, Y.; Bai, Y.; Qu, J. Unravelling riverine microbial communities under wastewater treatment plant effluent discharge in large urban areas. Appl. Microbiol. Biotechnol. 2017, 101, 6755–6764. [Google Scholar] [CrossRef]
  9. Bai, Y.; Huo, Y.; Liao, K.; Qu, J. Influence of microbial community diversity and function on pollutant removal in ecological wastewater treatment. Appl. Microbiol. Biotechnol. 2017, 101, 7293–7302. [Google Scholar] [CrossRef]
  10. Liao, K.; Bai, Y.; Huo, Y.; Jian, Z.; Hu, W.; Zhao, C.; Qu, J. Integrating microbial biomass, composition and function to discern the level of anthropogenic activity in a river ecosystem. Environ. Int. 2018, 116, 147–155. [Google Scholar] [CrossRef]
  11. CastellanoHinojosa, A.; GallardoAltamirano, M.J.; GonzálezLópez, J.; GonzálezMartínez, A. Anticancer drugs in wastewater and natural environments: A review on their occurrence, environmental persistence, treatment, and ecological risks. J. Hazard. Mater. 2023, 447, 130818. [Google Scholar] [CrossRef]
  12. Zhang, Q.Q.; Jian, S.L.; Li, K.M.; Wu, Z.B.; Guan, H.T.; Hao, J.W.; Wang, S.Y.; Lin, Y.Y.; Wang, G.J.; Li, A.H. Community structure of bacterioplankton and its relationship with environmental factors in the upper reaches of the Heihe River in Qinghai Plateau. Environ. Microbiol. 2021, 23, 1210–1221. [Google Scholar]
  13. Sun, C.X.; Zhang, B.; Ning, D.L.; Zhang, Y.; Dai, T.J.; Wu, L.; Li, T.L.; Liu, W.; Zhou, J.Z.; Wen, X.H. Seasonal dynamics of the microbial community in two full-scale wastewater treatment plants: Diversity, composition, phylogenetic group based assembly and co-occurrence pattern. Water Res. 2021, 200, 117295. [Google Scholar] [CrossRef] [PubMed]
  14. Liu, S.W.; Yu, H.; Yu, Y.H.; Huang, J.; Zhou, Z.Y.; Zeng, J.X.; Chen, P.B.; Xiao, F.S.; He, Z.L.; Yan, Q.Y. Ecological stability of microbial communities in Lake Donghu regulated by keystone taxa. Ecol. Indic. 2022, 136, 108904. [Google Scholar] [CrossRef]
  15. Tang, J.Y.; Bu, Y.Q.; Zhang, X.X.; Huang, K.L.; He, X.W.; Ye, L.; Shan, Z.J.; Ren, H.Q. Metagenomic analysis of bacterial community composition and antibiotic resistance genes in a wastewater treatment plant and its receiving surface water. Ecotox. Environ. Safe 2016, 132, 260–269. [Google Scholar] [CrossRef] [PubMed]
  16. Proia, L.; Osorio, V.; Soley, S.; Köck-Schulmeyer, M.; Perez, S.; Barcelo, D.; Romani, A.M.; Sabater, S. Effects of pesticides and pharmaceuticals on biofilms in a highly impacted river. Environ. Pollut. 2013, 178, 220–228. [Google Scholar] [CrossRef] [PubMed]
  17. Wang, J.W.; Chen, Y.; Cai, P.G.; Gao, Q.; Zhong, H.H.; Sun, W.L.; Chen, Q. Impacts of municipal wastewater treatment plant discharge on microbial community structure and function of the receiving river in Northwest Tibetan Plateau. J. Hazard. Mater. 2022, 423, 127170. [Google Scholar] [CrossRef] [PubMed]
  18. Rusiñol, M.; Hundesa, A.; Cárdenas-Youngs, Y.; Fernández-Bravo, A.; Pérez-Cataluña, A.; Moreno-Mesonero, L.; Moreno, Y.; Calvo, M.; Alonso, J.L.; Figueras, M.J.; et al. Microbiological contamination of conventional and reclaimed irrigation water: Evaluation and management measures. Sci. Total Environ. 2020, 710, 136298. [Google Scholar] [CrossRef] [PubMed]
  19. Zhang, G.J.; Guan, Y.T.; Zhao, R.X.; Feng, J.; Huang, J.; Ma, L.P.; Li, B. Metagenomic and network analyses decipher profiles and co-occurrence patterns of antibiotic resistome and bacterial taxa in the reclaimed wastewater distribution system. J. Hazard. Mater. 2020, 400, 123170. [Google Scholar] [CrossRef] [PubMed]
  20. Artifon, V.; Zanardi-Lamardo, E.; Fillmann, G. Aquatic organic matter: Classification and interaction with organic microcontaminants. Sci. Total Environ. 2019, 649, 1620–1635. [Google Scholar] [CrossRef]
  21. Yu, M.D.; He, X.S.; Xi, B.D.; Gao, R.T.; Zhao, X.W.; Zhang, H.; Huang, C.H.; Tan, W.B. Investigating the composition characteristics of dissolved and particulate/colloidal organic matter in effluent-dominated stream using fluorescence spectroscopy combined with multivariable analysis. Environ. Sci. Pollut. Res. 2018, 25, 9132–9144. [Google Scholar] [CrossRef] [PubMed]
  22. Yao, W.R.; Qi, Y.L.; Han, Y.F.; Ge, J.F.; Dong, Y.Y.; Wang, J.W.; Yi, Y.B.; Volmer, D.A.; Li, S.L.; Fu, P.Q. Seasonal variation and dissolved organic matter influence on the distribution, transformation, and environmental risk of pharmaceuticals and personal care products in coastal zone: A case study of Tianjin, China. Water Res. 2023, 249, 120881. [Google Scholar] [CrossRef] [PubMed]
  23. Zhang, L.W.; Li, H.; Liu, D.P.; Wang, L.T.; Dong, D.M.; Guo, Z.Y. Antibiotics in a seasonal ice-sealed reservoir: Occurrence, temporal variation, prioritization, and source apportionment. Sci. Total. Environ. 2023, 857, 159469. [Google Scholar] [CrossRef] [PubMed]
  24. Zhang, L.W.; Du, S.Y.; Zhang, X.; Lyu, G.Z.; Dong, D.M.; Hua, X.Y.; Zhang, W.M.; Guo, Z.Y. Occurrence, distribution, and ecological risk of pharmaceuticals in a seasonally ice-sealed river: From ice formation to melting. J. Hazard. Mater. 2020, 389, 122083. [Google Scholar] [CrossRef] [PubMed]
  25. Li, Y.; Xu, C.; Zhang, L.W.; Lin, L.; Wang, L.F.; Niu, L.H.; Zhang, H.J.; Wang, P.F.; Wang, C. Response of bacterial community in composition and function to the various DOM at river confluences in the urban area. Water Res. 2020, 169, 115293. [Google Scholar] [CrossRef] [PubMed]
  26. Hu, A.; Choi, M.; Tanentzap, A.J.; Liu, J.F.; Jang, K.S.; Lennon, J.T.; Liu, Y.Q.; Soininen, J.; Lu, X.C.; Zhang, Y.L.; et al. Ecological networks of dissolved organic matter and microorganisms under global change. Nat. Commun. 2022, 13, 3600. [Google Scholar] [CrossRef] [PubMed]
  27. Kellerman, A.M.; Dittmar, T.; Kothawala, D.N.; Tranvik, L.J. Chemodiversity of dissolved organic matter in lakes driven by climate and hydrology. Nat. Commun. 2014, 5, 3804. [Google Scholar] [CrossRef] [PubMed]
  28. Zhang, L.; Liu, Y.J.; Ge, F.J.; Peng, X.; Li, X.; Zhang, X.Y.; Zhang, S.X.; Zhou, Q.H.; Wu, Z.B.; Liu, B.Y. Spatial characteristics of nitrogen forms in a large degenerating lake: Its relationship with dissolved organic matter and microbial community. J. Clean. Prod. 2022, 371, 133617. [Google Scholar] [CrossRef]
  29. Ding, N.; Ji, Y.; Kuang, Q.; Wang, X.; Zhou, Z.; Zhang, Z. Changes in shale gas produced water DOM during its early storage period: Molecular composition correlated with microbial functions. Process Saf. Environ. 2022, 165, 851–859. [Google Scholar] [CrossRef]
  30. Logue, J.B.; Stedmon, C.A.; Kellerman, A.M.; Nielsen, N.J.; Andersson, A.F.; Laudon, H.; Lindstrom, E.S.; Kritzberg, E.S. Experimental insights into the importance of aquatic bacterial community composition to the degradation of dissolved organic matter. ISME J. 2016, 10, 533–545. [Google Scholar] [CrossRef]
  31. Song, X.Y.; Zhao, Y.; Zhang, L.Y.; Xie, X.Y.; Wu, J.Q.; Wei, Z.M.; Yang, H.Y.; Zhang, S.B.; Song, C.H.; Jia, L.M. Photodegradation, bacterial metabolism, and photosynthesis drive the dissolved organic matter cycle in the Heilongjiang River. Chemosphere 2022, 295, 133923. [Google Scholar] [CrossRef] [PubMed]
  32. Shang, Y.Q.; Wu, X.Y.; Wang, X.B.; Wei, Q.G.; Ma, S.C.; Sun, G.L.; Zhang, H.X.; Wang, L.D.; Dou, H.S.; Zhang, H.H. Factors affecting seasonal variation of microbial community structure in Hulun Lake, China. Sci. Total Environ. 2022, 805, 150294. [Google Scholar] [CrossRef] [PubMed]
  33. Zhang, Y.; Huo, Y.; Zhang, Z.R.; Zhu, S.Y.; Fan, W.; Wang, X.Z.; Huo, M.X. Deciphering the influence of multiple anthropogenic inputs on taxonomic and functional profiles of the microbial communities in Yitong River, Northeast China. Environ. Sci. Pollut. Res. 2022, 29, 39973–39984. [Google Scholar] [CrossRef] [PubMed]
  34. Zhang, Y.; Huo, Y.; Zhang, Z.; Fan, W.; Zhao, J.; Hou, Z.; Wang, X. Wastewater Deterministically Impacts the Composition and Assembly of Planktonic Microorganisms in the River Ecosystem. ACS EST Water 2024, 4, 388–398. [Google Scholar] [CrossRef]
  35. Murphy, K.R.; Stedmon, C.A.; Graeber, D.; Bro, R. Fluorescence spectroscopy and multi-way techniques. PARAFAC. Anal. Methods 2013, 5, 6557–6566. [Google Scholar] [CrossRef]
  36. An, X.L.; Wang, J.Y.; Pu, Q.; Li, H.; Pan, T.; Li, H.Q.; Pan, F.X.; Su, J.Q. High-throughput diagnosis of human pathogens and fecal contamination in marine recreational water. Environ. Res. 2020, 190, 109982. [Google Scholar] [CrossRef]
  37. Bolyen, E.; Rideout, J.R.; Dillon, M.R.; Bokulich, N.A.; Abnet, C.C.; Al-Ghalith, G.A.; Alexander, H.; Alm, E.J.; Arumugam, M.; Asnicar, F.; et al. Reproducible, interactive, scalable and extensible microbiome data science using QIIME 2. Nat. Biotechnol. 2019, 37, 852–857. [Google Scholar] [CrossRef]
  38. Callahan, B.J.; McMurdie, P.J.; Rosen, M.J.; Han, A.W.; Johnson, A.J.; Holmes, S.P. DADA2: High-resolution sample inference from Illumina amplicon data. Nat. Methods 2016, 13, 581–583. [Google Scholar] [CrossRef]
  39. Quast, C.; Pruesse, E.; Yilmaz, P.; Gerken, J.; Schweer, T.; Yarza, P.P.; Peplies, J.; Glockner, F.O. The SILVA ribosomal RNA gene database project: Improved data processing and web-based tools. Nucleic Acids Res. 2012, 41, D590–D596. [Google Scholar] [CrossRef]
  40. Knights, D.; Kuczynski, J.; Charlson, E.S.; Zaneveld, J.; Mozer, M.C.; Collman, R.G.; Bushman, F.D.; Knight, R.; Kelley, S.T. Bayesian community-wide culture-independent microbial source tracking. Nat. Methods 2011, 8, 761–763. [Google Scholar] [CrossRef]
  41. Zheng, H.O.; Yang, T.J.; Bao, Y.Z.; He, P.P.; Yang, K.M.; Mei, X.L.; Wei, Z.; Xu, Y.C.; Shen, Q.R.; Banerjee, S. Network analysis and subsequent culturing reveal keystone taxa involved in microbial litter decomposition dynamics. Soil Biol. Biochem. 2021, 157, 108230. [Google Scholar] [CrossRef]
  42. Wang, S.L.; Xiong, W.; Wang, Y.Q.; Nie, Y.; Wu, Q.; Xu, Y.; Geisen, S. Temperature-induced annual variation in microbial community changes and resulting metabolome shifts in a controlled fermentation system. mSystems 2020, 5, e00555-20. [Google Scholar] [CrossRef]
  43. Sollinger, A.; Seneca, J.; Dahl, M.B.; Motleleng, L.L.; Prommer, J.; Verbruggen, E.; Sigurdsson, B.D.; Janssens, I.; Penuelas, J.; Urich, T.; et al. Down-regulation of the bacterial protein biosynthesis machinery in response to weeks, years, and decades of soil warming. Sci. Adv. 2022, 8, eabm3230. [Google Scholar] [CrossRef] [PubMed]
  44. Leenheer, J.A.; Croué, J.P. Characterizing aquatic dissolved organic matter. Environ. Sci. Technol. 2003, 37, 18A–26A. [Google Scholar] [CrossRef] [PubMed]
  45. Chen, W.; Westerhoff, P.; Leenheer, J.A.; Karl, B. Fluorescence excitation—Emission matrix regional integration to quantify spectra for dissolved organic matter. Environ. Sci. Technol. 2003, 37, 5701–5710. [Google Scholar] [CrossRef] [PubMed]
  46. Boodoo, K.S.; Fasching, C.; Battin, T.J. Sources, Transformation, and Fate of Dissolved Organic Matter in the Gravel Bar of a Prealpine Stream. J. Geophys. Res. Biogeosci. 2020, 125, e2019JG005604. [Google Scholar] [CrossRef]
  47. McKnight, D.M.; Boyer, E.W.; Westerhoff, P.K.; Doran, P.T.; Kulbe, T.; Andersen, D.T. Spectrofluorometric characterization of dissolved organic matter for indication of precursor organic material and aromaticity. Limnol. Oceanogr. 2001, 46, 38–48. [Google Scholar] [CrossRef]
  48. Jorgensen, L.; Stedmon, C.A.; Granskog, M.A.; Middelboe, M. Tracing the long-term microbial production of recalcitrant fluorescent dissolved organic matter in seawater, Geophysical Research Letters. Nat. Rev. Microbiol. 2014, 8, 593–599. [Google Scholar]
  49. Peuravuori, J.; Pihlaja, K. Molecular size distribution and spectroscopic properties of aquatic humic substances. Anal. Chim. Acta 1997, 337, 133–149. [Google Scholar] [CrossRef]
  50. Helms, J.R.; Stubbins, A.; Ritchie, J.D.; Minor, E.C.; Kieber, D.J.; Mopper, K. Absorption spectral slopes and slope ratios as indicators of molecular weight, source, and photobleaching of chromophoric dissolved organic matter. Limnol. Oceanogr. 2009, 53, 955–969. [Google Scholar] [CrossRef]
  51. Ming, X.L.; He, X.S.; Liu, J.; Bei, D.X.; Zhao, Y.; Wei, M.Z.; Jiang, Y.H.; Su, J.; Hu, C.M. Study on the Characteristic UV Absorption Parameters of Dissolved Organic Matter Extracted from Chicken Manure during Composting. Spectrosc. Spect. Anal. 2010, 30, 3081–3085. [Google Scholar]
  52. Praise, S.; Ito, H.; An, Y.; Watanabe, K.; Watanabe, T. Dissolved organic matter characteristics along sabo dammed streams based on ultraviolet visible and fluorescence spectral properties. Environ. Monit. Assess. 2018, 190, 146. [Google Scholar] [CrossRef]
  53. Wang, Y.; Yin, H.; Wang, Z.; Li, Y.; Wang, P.; Wang, L. Prediction of dissolved organic nitrogen via spectroscopic fingerprint in the shallow riverbed sediments of effluent-dominated rivers: A case study in Xi’an, northwest China. J. Hydrol. 2024, 628, 130533. [Google Scholar] [CrossRef]
  54. Chen, J.; Li, K.; Hu, A.; Fu, Q.; He, H.; Wang, D.; Shi, J.; Zhang, W. The molecular characteristics of DOMs derived from bio-stabilized wastewater activated sludge and its effect on alleviating Cd-stress in rice seedlings (Oryza sativa L.). Sci. Total Environ. 2022, 845, 157157. [Google Scholar] [CrossRef] [PubMed]
  55. Su, Z.; Wang, K.; Yang, F.; Zhuang, T. Antibiotic pollution of the Yellow River in China and its relationship with dissolved organic matter: Distribution and Source identification. Water Res. 2023, 235, 119867. [Google Scholar] [CrossRef]
  56. Huang, F.; Liu, H.; Wen, J.; Zhao, C.; Dong, L.; Liu, H. Underestimated humic acids release and influence on anaerobic digestion during sludge thermal hydrolysis. Water Res. 2021, 201, 117310. [Google Scholar] [CrossRef]
  57. Koirala, A.; Brozel, V.S. Phylogeny of Nitrogenase Structural and Assembly Components Reveals New Insights into the Origin and Distribution of Nitrogen Fixation across Bacteria and Archaea. Microorganisms 2021, 9, 1662. [Google Scholar] [CrossRef]
  58. Li, Q.; Zhang, Y.; Hu, J.; Dai, Q. Response of bacterial communities and nitrogen-cycling genes in newly reclaimed mudflat paddy soils to nitrogen fertilizer gradients. Environ. Sci. Pollut. Res. 2022, 29, 71113–71123. [Google Scholar] [CrossRef]
  59. Han, Q.; Mu, X.; Gan, X.; Wang, S.; Yu, Q.; Li, H. Temperature rise alters phosphorus pool in corpse polluted water by inhibiting organic phosphorus mineralization and phosphorus transports. J. Clean. Prod. 2024, 434, 140161. [Google Scholar] [CrossRef]
  60. Yuan, C.; Sun, F.; Zhang, J.; Feng, L.; Tu, H.; Li, A. Low-temperature-resistance granulation of activated sludge and the microbial responses to the granular structural stabilization. Chemosphere 2023, 311, 137146. [Google Scholar] [CrossRef]
  61. Yang, S.; Zheng, Y.; Mao, Y.; Xu, L.; Jin, Z.; Zhao, M.; Kong, H.; Huang, X.; Zheng, X. Domestic wastewater treatment for single household via novel subsurface wastewater infiltration systems (SWISs) with NiiMi process: Performance and microbial community. J. Clean. Prod. 2021, 279, 123434. [Google Scholar] [CrossRef]
  62. Liu, M.; Chen, Y.; Wei, Y.; Qi, R.; Zhong, H.; Chai, Y.; Chen, Y.; Chen, M. Analysis of seasonal variation characteristics of nitrogen transformation functional bacteria and functional genes in urban sewage treatment plants in cold regions. Water Wastewater Eng. 2023, 49, 38–43+52. [Google Scholar]
  63. Song, S.; Yang, F.; Gao, X.; Ma, L. Effects of sewage treatment on microbial community structure of surface water in Xiantao wetland. Microbiol. China 2019, 46, 512–521. [Google Scholar] [CrossRef]
  64. Li, S.; Wang, S.; Wong, M.H.; Zaynab, M.; Wang, K.; Zhong, L.; Ouyang, L. Changes in the composition of bacterial communities and pathogen levels during wastewater treatment. Environ. Sci. Pollut. Res. 2023, 30, 1232–1243. [Google Scholar] [CrossRef] [PubMed]
  65. Shen, W.; Chen, Y.; Wang, N.; Wan, P.; Peng, Z.; Zhao, H.; Wang, W.; Xiong, L.; Zhang, S.; Liu, R. Seasonal variability of the correlation network of antibiotics, antibiotic resistance determinants, and bacteria in a wastewater treatment plant and receiving water. J. Environ. Manag. 2022, 317, 115362. [Google Scholar] [CrossRef]
  66. Tyagi, I.; Tyagi, K.; Chandra, K.; Kumar, V. Characterization of bacterial diversity in wastewater of Indian paper industries with special reference to water quality. Int. J. Environ. Sci. Technol. 2022, 19, 3669–3684. [Google Scholar] [CrossRef]
  67. Veloso, S.; Amouroux, D.; Lanceleur, L.; Cagnon, C.; Monperrus, M.; Deborde, J.; Laureau, C.C.; Duran, R. Keystone microbial taxa organize micropollutant-related modules shaping the microbial community structure in estuarine sediments. J. Hazard. Mater. 2023, 448, 130858. [Google Scholar] [CrossRef]
  68. Zeng, Y.; Li, W.; Zhao, M.; Li, J.; Liu, X.; Shi, L.; Yang, X.; Xia, H.; Yang, S.; Yang, L. The association between ambient temperature and antimicrobial resistance of Klebsiella pneumoniae in China: A difference-in-differences analysis. Front. Public. Health 2023, 11, 1158762. [Google Scholar] [CrossRef]
  69. Li, W.; Liu, C.; Ho, H.C.; Shi, L.; Zeng, Y.; Yang, X.; Huang, Q.; Pei, Y.; Huang, C.; Yang, L. Association between antibiotic resistance and increasing ambient temperature in China: An ecological study with nationwide panel data. Lancet Reg. Health West. Pac. 2023, 30, 100628. [Google Scholar] [CrossRef]
  70. Kuypers, M.M.M.; Marchant, H.K.; Kartal, B. The microbial nitrogen-cycling network. Nat. Rev. Microbiol. 2018, 16, 263–276. [Google Scholar] [CrossRef]
  71. Kraiem, K.; Wahab, M.A.; Kallali, H.; Fra-vazquez, A.; Pedrouso, A.; Mosquera-Corral, A.; Jedidi, N. Effects of short- and long-term exposures of humic acid on the Anammox activity and microbial community. Environ. Sci. Pollut. Res. 2019, 26, 19012–19024. [Google Scholar] [CrossRef]
  72. Li, W.; Siddique, M.S.; Liu, M.; Graham, N.; Yu, W. The migration and microbiological degradation of dissolved organic matter in riparian soils. Water Res. 2022, 224, 119080. [Google Scholar] [CrossRef]
  73. Wang, Y.; Gao, Y.; Ye, T.; Hu, Y.; Yang, C. Dynamic variations of dissolved organic matter from treated wastewater effluent in the receiving water: Photo- and bio-degradation kinetics and its environmental implications. Environ. Res. 2021, 194, 110709. [Google Scholar] [CrossRef] [PubMed]
  74. Wang, Z.; Hu, X.; Kang, W.; Qu, Q.; Feng, R.; Mu, L. Interactions between dissolved organic matter and the microbial community are modified by microplastics and heat waves. J. Hazard. Mater. 2023, 448, 130868. [Google Scholar] [CrossRef] [PubMed]
  75. Zhou, L.; Wu, Y.; Zhou, Y.; Zhang, Y.; Xu, H.; Jang, K.-S.; Dolfing, J.; Spencer, R.G.M.; Jeppesen, E. Terrestrial dissolved organic matter inputs drive the temporal dynamics of riverine bacterial ecological networks and assembly processes. Water Res. 2023, 249, 120955. [Google Scholar] [CrossRef] [PubMed]
  76. Tanentzap, A.J.; Fitch, A.; Orland, C.; Emilson, E.J.S.; Yakimovich, K.M.; Osterholz, H.; Dittmar, T. Chemical and microbial diversity covary in fresh water to influence ecosystem functioning. Proc. Natl. Acad. Sci. USA 2019, 116, 24689–24695. [Google Scholar] [CrossRef]
  77. Niu, C.; Zhang, Y.; Zhu, G.; Wang, M.; Zhou, Y.; Liu, X. Comparison of optical properties of DOM and CDOM in lake Tianmuhu catchment. Res. Environ. Sci. 2014, 27, 998–1007. [Google Scholar]
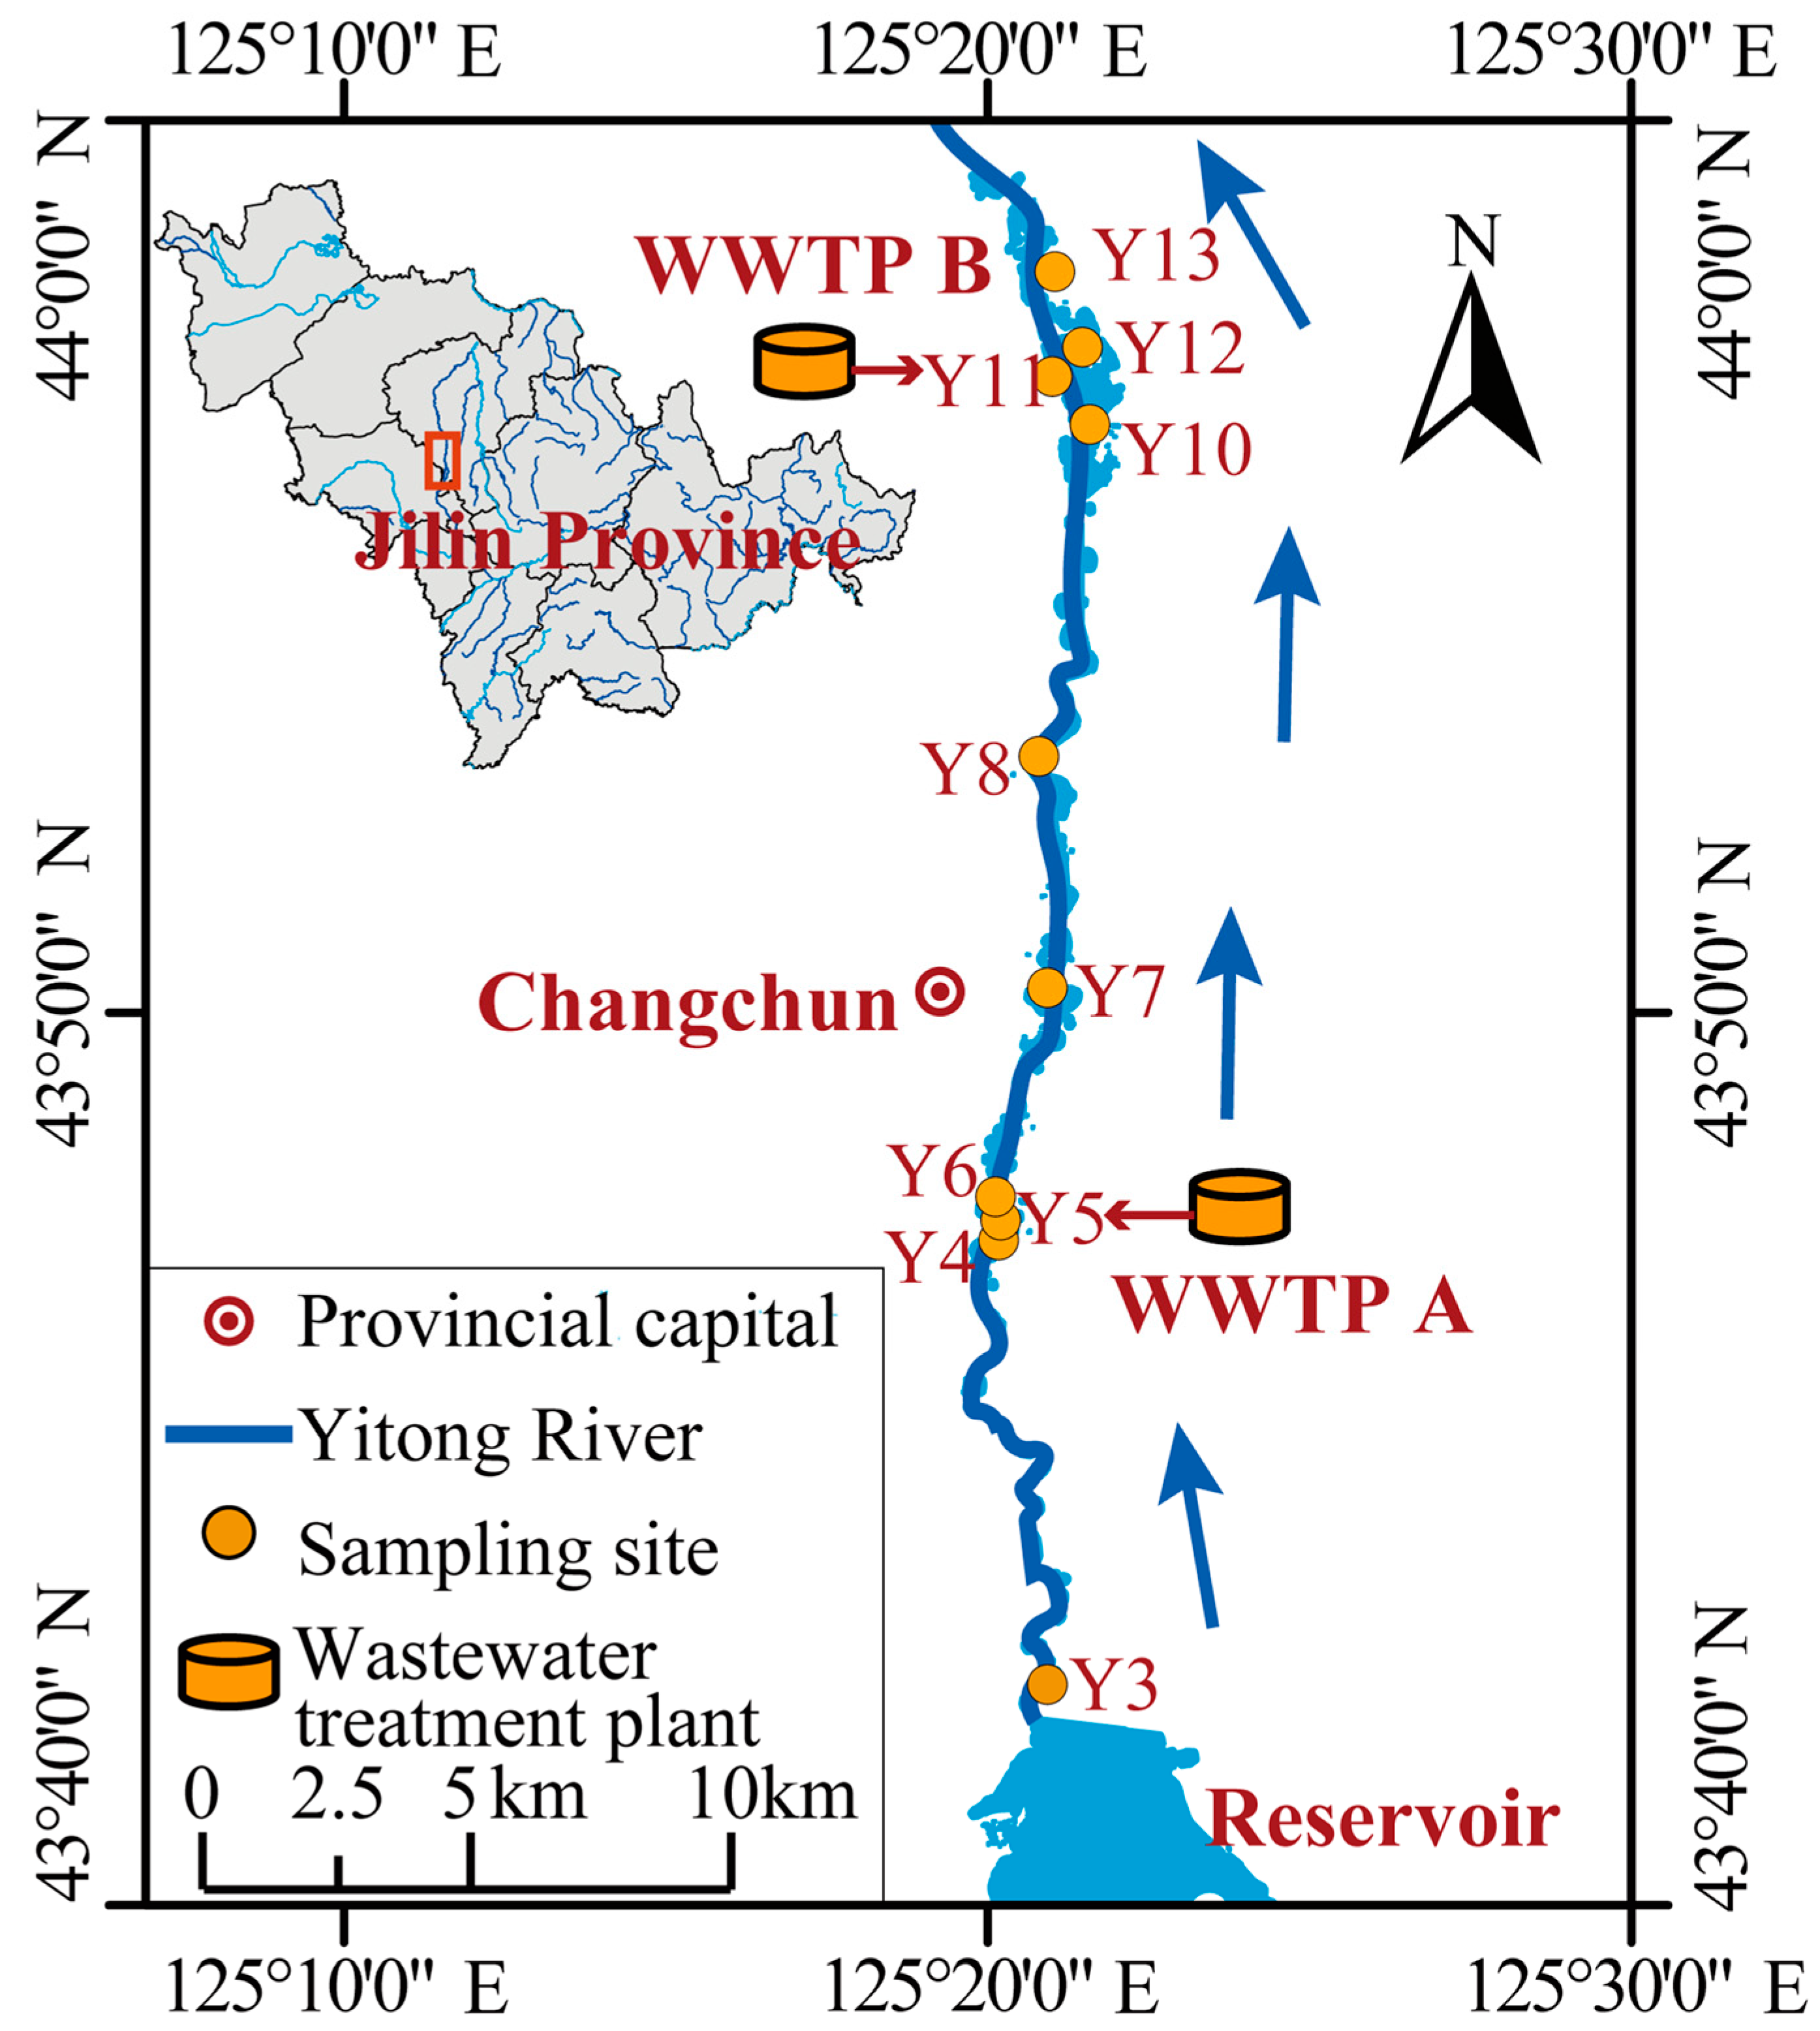
Figure 1. Map of river with sampling locations. Y3 is the reservoir outlet, which is at 9.7 km upstream of WWTP A (Y5) and is the control sample obtained in the field; Y11 (WWTP B) is located 18 km downstream of Y5; and Y4–Y13 comprise urban areas positioned both upstream (US) and downstream (DS).
Water 16 00906 g001
Figure 2. EEM contours, excitation and emission loadings of the two components identified by DOMFlour PARAFAC analysis: (a) ice-free period; (b) ice-sealed period.
Water 16 00906 g002
Figure 3. The Fmax value of the two fluorescence components identified by parallel factor analysis: (a) ice-free period; (b) ice-sealed period. The fluorescence parameter of DOM during the ice-free and ice-sealed periods changes: (c) BIX; (d) FI; (e) HIX; (f) β:α. Distribution patterns of fluorescence spectral parameters in the Eff, US, and DS water bodies of the WWTP.
Water 16 00906 g003
Figure 4. The UV characteristic parameters during the ice-free and ice-sealed periods changes: (a) SUVA254; (b) SUVA260; (c) E2/E3; (d) E2/E4; (e) A254/A203; (f) SR. Distribution patterns of fluorescence spectral parameters in the Eff, US, and DS water bodies of the WWTP.
Water 16 00906 g004
Figure 5. Sankey diagrams illustrating the relative abundance of the enriched genera among the US, Eff, and DS samples at phylum (a) and genus (b) levels during the ice-free period. Sankey diagrams illustrating the relative abundance of the enriched genera among the US, Eff, and DS samples at phylum (c) and genus (d) levels during the ice-sealed period.
Water 16 00906 g005
Figure 6. PCoA ordination plot showing bacterial community composition (beta diversity) based on the Bray-Curtis distance during the ice-free and ice-sealed periods (a); contribution of the WWTP source to microbial communities in the river revealed by the source tracker during the ice-free and ice-sealed periods (b).
Water 16 00906 g006
Figure 7. Abundance of pathogen marker genes detected in rivers using HT-qPCR assay: (a) ice-free period; (b) ice-sealed period. Abundance of total bacterial 16S rRNA genes detected in rivers using HT-qPCR assay: (c) ice-free period; (d) ice-sealed period. The values presented are log-transformed.
Water 16 00906 g007
Figure 8. Co-occurrence networks of microbial communities and environment variables. Connections represents robust (r > 0.6) and significant (p < 0.1) correlations during the ice-free period of the river (a) and robust (r > 0.8) and significant (p < 0.05) correlations during the ice-sealed period of the river (b). Nodes represent individual ASVs and are colored according to phylum. The red edges indicate a positive relationship, and green edges denote a negative relationship; Spearman correlations between environmental factors, DOM and Shannon index: ice-free period (c); ice-sealed period (d). * p < 0.05.
Water 16 00906 g008
Table 1. Water quality parameters of surface water in the river.
T
(°C)
pHDO
(mg/L)
NO3-N
(mg/L)
NO2-N
(mg/L)
NH4+-N
(mg/L)
TN
(mg/L)
TP
(mg/L)
DOC
(mg/L)
Y3O5.25.476.661.220.0210.021.230.056.078
Y4O4.75.457.031.540.0290.721.920.089.708
Y5O13.35.516.083.760.0522.963.950.1711.57
Y6O7.85.476.513.350.0331.883.670.0510.66
Y7O8.85.486.193.120.050.663.370.138.92
Y8O8.27.485.872.450.0631.133.000.179.003
Y10O12.28.115.442.140.115N2.530.288.086
Y11O15.17.365.743.520.091.633.880.329.908
Y12O13.97.895.842.960.1673.253.430.1012.61
Y13O13.28.025.321.230.1164.61.571.2524.63
Y3F3.47.476.161.540.0080.01N0.088.629
Y5F8.27.426.473.770.0190.023.54011.74
Y6F3.57.576.793.460.01403.620.0310.78
Y7F2.87.616.973.050.0230.373.350.2310.32
Y8F1.97.676.832.330.0310.522.660.3210.04
Y11F9.87.535.553.550.1270.972.740.2015.58
Y13F2.77.696.812.140.0551.642.370.1512.55
Notes: N represents the concentration was under the limit of determination. The ice-free period and the ice-sealed periods are distinguished by O and F, with O representing during the ice-free period and F representing during the ice-sealed period.
Disclaimer/Publisher’s Note: The statements, opinions and data contained in all publications are solely those of the individual author(s) and contributor(s) and not of MDPI and/or the editor(s). MDPI and/or the editor(s) disclaim responsibility for any injury to people or property resulting from any ideas, methods, instructions or products referred to in the content.