Article

Stability of Expansive Soil Slopes under Wetting–Drying Cycles Based on the Discrete Element Method

School of Mechanics and Engineering Science, Shanghai University, Shanghai 200444, China
*
Author to whom correspondence should be addressed.
Water 2024, 16(6), 861; https://doi.org/10.3390/w16060861
Submission received: 4 February 2024 / Revised: 9 March 2024 / Accepted: 12 March 2024 / Published: 16 March 2024
(This article belongs to the Section Soil and Water)

Abstract

:
The swelling-shrinkage behavior of expansive soils under climate changes will cause the crack development, which can be destructive of expansive soil slopes. This study investigated the effect of drying/wetting cycles on the stability of an expansive soil slope using the discrete element method (DEM), in consideration of the crack development induced by climate changes. The strength reduction method was adopted in the DEM calculations, which was coupled with the unsaturated seepage analysis given by the finite element method. The slope stability and the failure model of the slope after different times of wetting–drying cycles were analyzed, and the results were compared with those calculated by the limit equilibrium method and the finite element method. The results indicated that the failure pattern of the expansive soil slope was strongly influenced by the wetting–drying cycles. A shallow sliding surface of the expansive soil slope occurred after several wetting–drying cycles. Similarly, the safety factor of the expansive soil slope decreased gradually with the wetting–drying cycles. Considering the cracks’ evolution inside the expansive soil slope from the drying/wetting cycles, a shallower sliding surface with a smaller safety factor was obtained from the strength reduction method of the DEM, in comparison with the two conventional methods of the Limit equilibrium method and finite element method. Therefore, cracks play an essential role in the expansive soil slope stability. The strength reduction method of the DEM, which considers the cracks’ evolution during drying/wetting cycles, is more reliable.

1. Introduction

Expansive soil is a problematic soil that swells when it absorbs water and shrinks when it loses water, leading to cracks. This behavior often triggers geological disasters and engineering problems, causing significant economic losses and even threatening people’s lives [1,2]. The engineering properties of expansive soil are very sensitive to external climate and environmental changes. Expansive soil slopes are exposed to climate changes in the long term. The wetting–-drying cycles induced by climate changes not only deteriorate the engineering properties of expansive soil but also exacerbate crack formation due to expansion and shrinkage of the soil [3,4]. Cracks break the integrity of slope soil, significantly reduce its shear strength, and provide pathways for rainwater infiltration [5,6]. Therefore, it is essential to evaluate the long-term stability of expansive soil slopes under climate changes [7,8,9].
In recent decades, scholars worldwide have conducted comprehensive studies on the development of cracks in expansive soil slopes under the influence of wetting–drying cycles. Various studies have explored the failure mechanisms of these slopes using methods such as centrifugal or shrinkage model tests [10,11,12,13]. For instance, Cai et al. [14] conducted a centrifugal model test to examine crack development in expansive soil slopes under wetting–drying cycles. The results indicated that crack extension increased with each cycle, correlating to the expansive strength of the foundation soil. However, this method has a significant size effect and struggles to accurately simulate the impact of rainfall on expansive soil slopes. To address these limitations, some researchers have constructed full-sized slope models aimed at analyzing crack patterns, formation, and mitigation in expansive soil slopes subjected to alternating drying and wetting conditions [15,16,17]. The process of rainwater infiltration and its influence on crack formation is a key focus of these studies. Zhang et al. [18] conducted a comprehensive full-scale model test under conditions of rainfall and evaporation, providing detailed insights into the relationship between crack parameters and the number of wetting–drying cycles. This research emphasized the role of matrix suction in crack formation and concluded that composite cracks significantly contribute to the destabilization of slope. The aforementioned work has laid a solid foundation for further research.
At present, numerical simulation methods are widely applied for studying the stability of expansive soil slopes. Continuum methods, such as the finite element method (FEM) [19,20], finite difference method (FDM) [21], material point method (MPM) [22,23,24], and numerical manifold method (NMM) [25], have demonstrated their effectiveness in analyzing slope stability. Zhou et al. [26] observed that wetting–drying cycles significantly reduce the shear strength and safety factor of expansive soil slopes by altering soil structure and pore water dynamics. However, the finite element analysis method is not suitable for dealing with the problems of crack simulations in expansive soil under wetting/drying cycles. The discrete element method has been accepted by many researchers and used for slope stability studies [27,28,29]. Ma et al. [30] implemented moisture migration in soil through thermal coupling and calibrated the swelling–shrinkage coefficients through laboratory tests to simulate the cracking and shrinking of expansive soil using discrete element simulation. Chen et al. [31] investigated the development of cracks in expansive soil slopes and their impact on slope stability under the wetting–drying cycle through large-scale indoor slope tests and numerical simulations. However, the simulations only examined the effect of different initial numbers of cracks on slope stability and could not reveal the pattern of crack development. Current studies do not consider the evolutionary nature of crack formation and its cumulative effect on the stability of expansive soil slopes under periodic environmental conditions. This dynamic process is crucial for understanding all the factors contributing to slope failure and remains an area for further exploration. Therefore, this study investigates the stability of expansive soil slopes with emphasis on the evolution of cracks induced by the wetting/drying cycles through the discrete element method.
This study proposed a discrete element model for analyzing the stability of the expansive soil slopes. This model coupled the unsaturated seepage simulation with the discrete element strength subtraction method to calculate the safety factors of the expansive soil slopes during wetting–drying cycles. To validate the proposed model, a discrete element simulation was conducted using the high-performance discrete element software MatDEM version 1.32 [32,33,34,35,36]. Furthermore, this discrete element method was also validated through a comparison with the limit equilibrium method and finite element strength reduction method.

2. Discrete Element Model of Expansive Soil Slopes

2.1. Basic Discrete Element Model

In MatDEM, a soil block model is created using randomly compacted spherical elements. These particles interact through normal and tangential connections based on the linear elastic particle contact model, as depicted in Figure 1. The normal force F n and normal deformation X n are transmitted through the normal connections, which are governed by Equation (1):
F n = K n X n                               X n < X b , i n t a c t   b o n d K n X n                           X n < 0 , b r o k e n   b o n d 0                                                         b r o k e n   b o n d
where F n = normal force; K n = normal stiffness; X n = the normal relative displacement; and X b = the breaking displacement, respectively. When X n is less than X b , the tension or pressure can exist on the connection until X n exceeds the X b , which means the normal connection breaks. After the breakage of the normal connection, only compression force works.
The shear force F s is transmitted through the tangential connection mechanism.
F s = K s X s  
where F s = tangential force; K s = tangential stiffness; and X s = the tangential displacement, respectively.
The failure criterion for a connection in the tangential direction is based on the Mohr-Coulomb criterion:
F s m a x = F s 0 μ p F s  
where F s m a x = the maximum shear force; F s 0 = initial shear resistance; and μ p = interparticle friction coefficient, respectively. When F s exceeds F s m a x , the tangential connection breaks and only sliding friction exists between particles.
In MatDEM, five macro parameters are used, including Young’s modulus E, Poisson’s ratio V, tensile strength T u , compressive strength C u , and internal friction coefficient μ i . The intergranular mesoscopic parameters, such as Normal stiffness K n , tangential stiffness K s , normal fracture displacement X b , initial shear resistance F s 0 , and particle friction coefficient μ p , can be calculated using the derivation formulae in reference [37]:
K n = 2 E d 4 1 2 v
K s = 2 1 5 v E d 4 ( 1 + v ) 1 2 v
X b = 3 K n + K s 6 2 ( K n + K s ) · T u · d 2
F s 0 = 1 2 μ p 6 · C u · d 2
μ p = 2 2 + 2 I 2 + 2 I ,         I = [ 1 + μ i 2 + μ i ] 2
where d = particle unit diameter. The closest packing, which was used in the above macroscopical transformation formula, was not the same as the input macroscopical parameters. Therefore, it is necessary to calibrate the microscopical parameters again in practice.
The damping setting method in MatDEM differs from that of PFC. In MatDEM, global damping is utilized to dissipate kinetic energy, as shown in Equation (9):
F v = η v
where F v = damping force; η = damping coefficient; and v = velocity, respectively. The damping force is proportional to the particle velocity, but it is inversely proportional to the direction of the velocity. In MatDEM, the optimal damping coefficient is calculated using the semi-empirical formula derived by Liu Chun et al. [33] with Equation (10). This allows the kinetic energy of the system to be dissipated rapidly, leading to improved computational efficiency and enabling quasi-static simulation.
η = 8 m k · d / V 3
where m = particle mass; k = particle stiffness coefficient; D = particle diameter; and V = the volume of the model, respectively.
In the DEM, an essential assumption is that the velocity and acceleration of each element remain constant within very small time steps. This fundamental concept forms the basis for employing an iterative algorithm, which adheres to Newton’s law of motion. Through this algorithm, the resultant force—comprising connection forces, damping forces, and gravity forces in all directions—is calculated. These forces enable the dynamic simulation of discrete elements within the system.

2.2. Discrete Element Simulation Method of Crack Evolution

Previous researchers have investigated the mechanism of crack evolutions in expansive soil [31,38,39]. Generally, the tensile stress develops as the water content of the soil decreases, leading to increased suction and volume reduction. Cracks occur when the tensile stress within the soil exceeds its tensile strength and lateral pressure. Water infiltration into expansive soil can cause cracks to shrink or close completely.
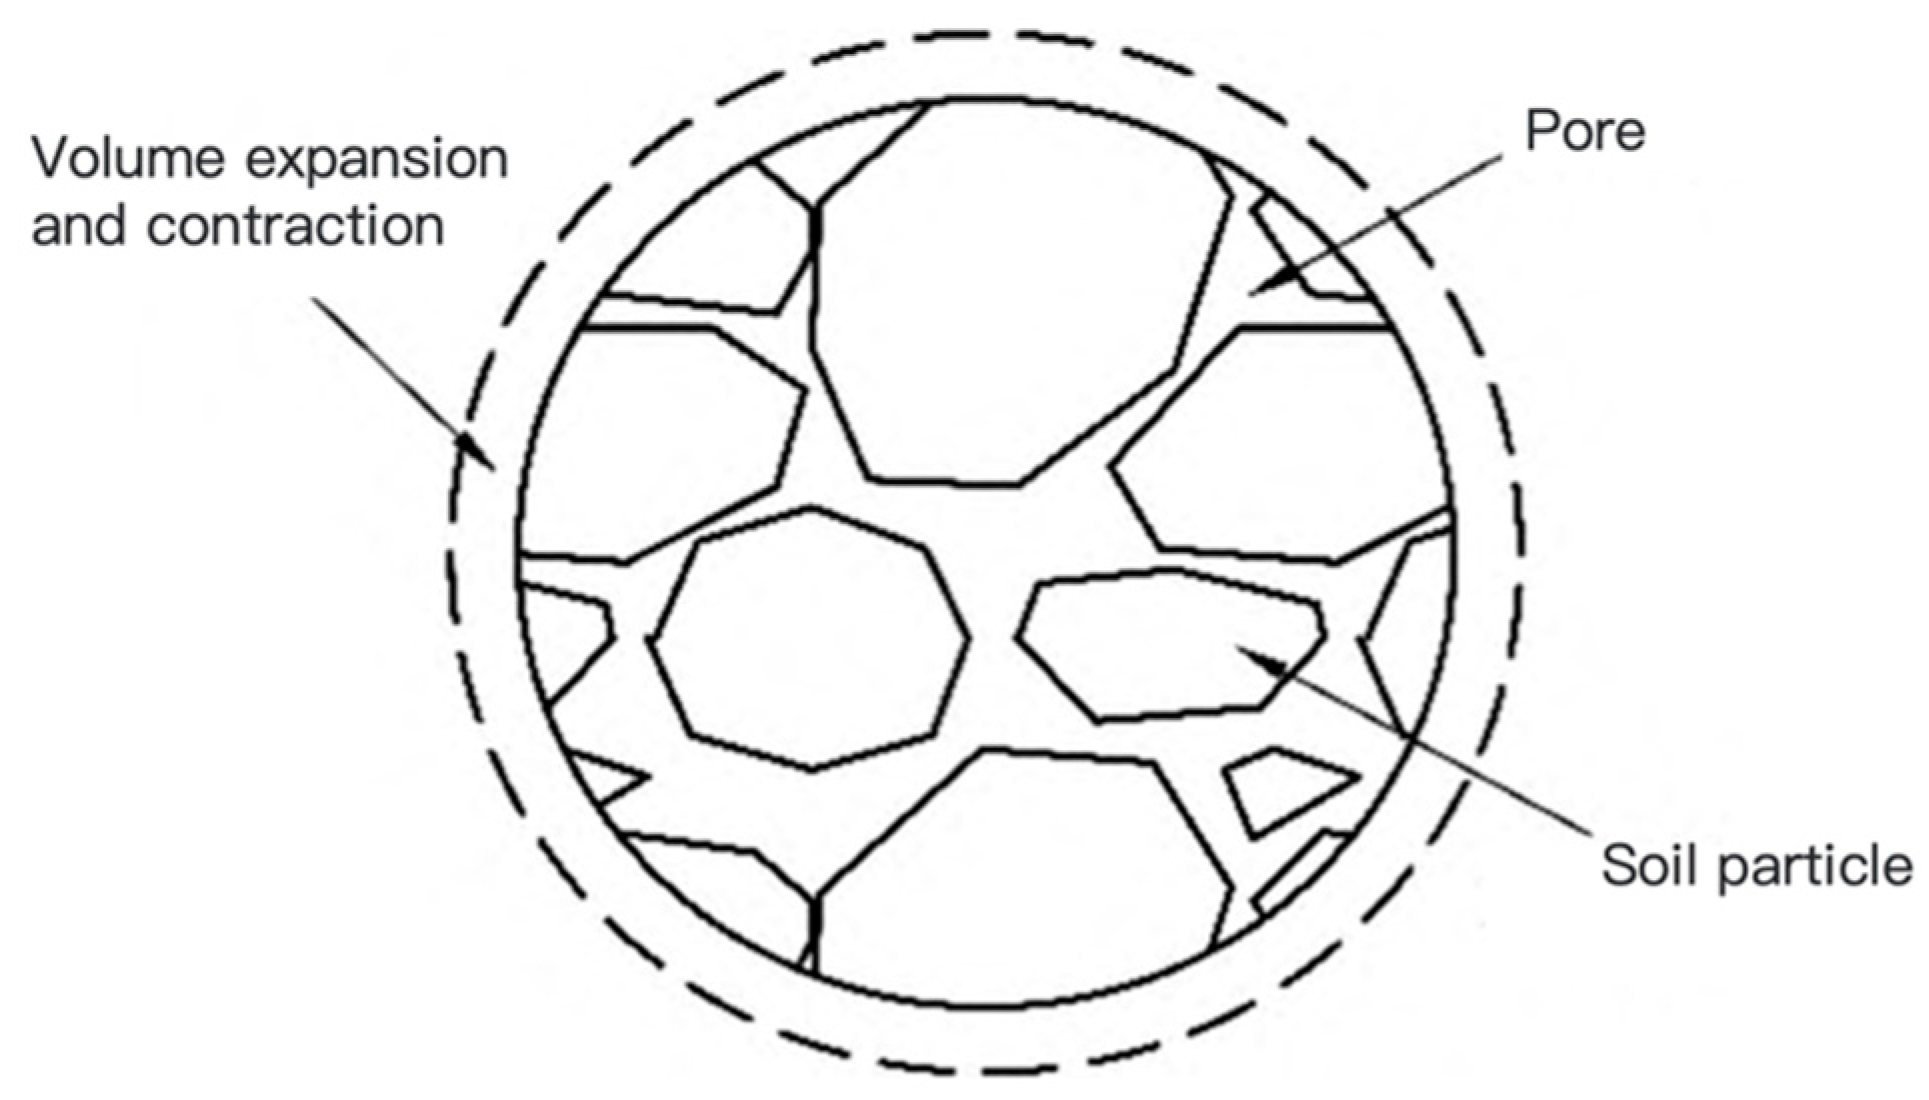
In the discrete element method (DEM), each particle unit is represented as a combination of soil particles and pores, as shown in Figure 2. This approach enables the monitoring of changes in particle unit volume, which reveals the swelling and shrinkage processes of expansive soil. For two-dimensional particle elements, the equation is provided in Equation (11).
R = α R 0
where R = particle radius and R 0 = initial particle radius; α is the expansion/contraction coefficient, which can be calculated according to Equations (12) or (13):
α = 1 + ε v
α = e + 1 e 0 + 1
where ε v = the volumetric strain from the initial water content to the target water content; e = the pore ratios corresponding to the target water content; and e 0 = the pore ratios corresponding to the initial water content, respectively. During discrete element simulation, α was calibrated by the results of laboratory swelling contraction tests.
Based on the above method, the crack development process of the expansive soil slope is simulated. Firstly, the unsaturated seepage of the expansive soil slope under atmospheric action is calculated by the finite element method, and the change in water content of the slope during the evaporation–rainfall process is obtained. Secondly, based on the finite element calculation results, the discrete element method is used to simulate the soil swelling and drying shrinkage and crack development process of the expansive soil slope. The specific steps are as follows:
(1) The finite element method was used to simulate the unsaturated seepage analysis of expansive soil slope soil under the action of evaporation–rainfall, and the water content of each part of the soil at different times was obtained by taking evaporation for 14 days and then rainfall for 1 day as a wetting–drying cycle. The two-dimensional seepage partial differential governing equation is as follows:
x k x H x + y k y H y + Q = m w γ w H t
where H = the total head; k x = and the permeability coefficients in x direction; k y = the permeability coefficients in y direction; Q = the boundary flow; m w = the slope of soil water characteristic curve; γ w = the bulk density of water; and t = time, respectively.
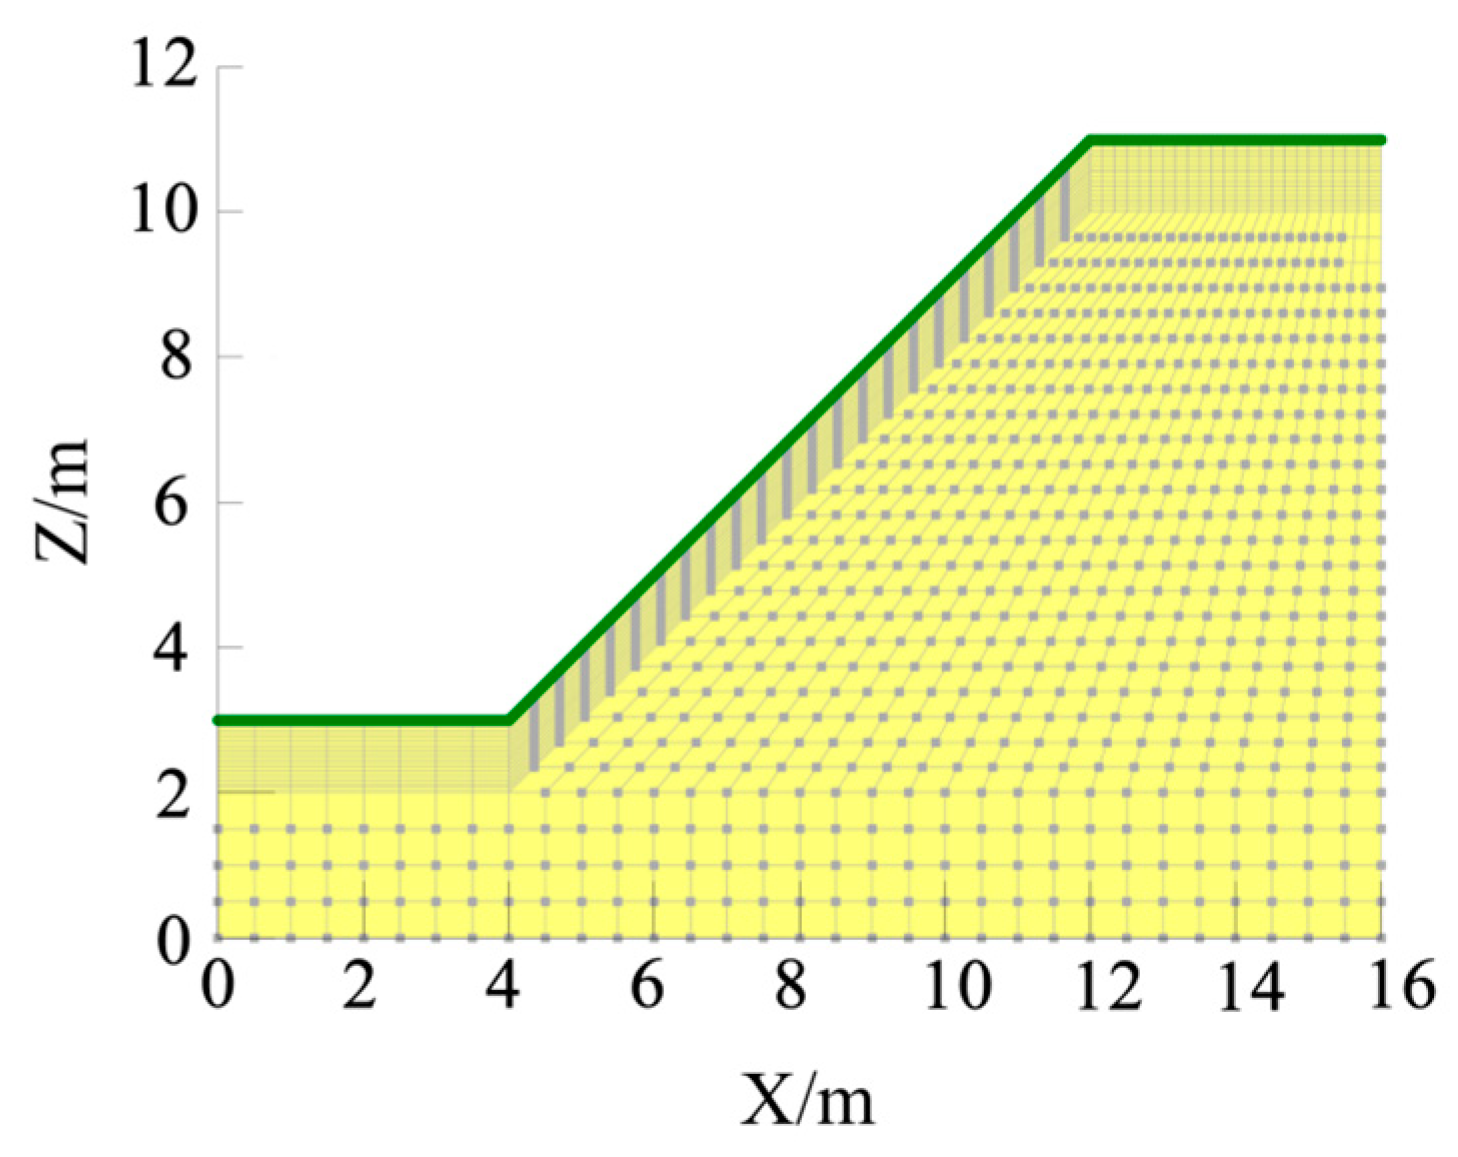
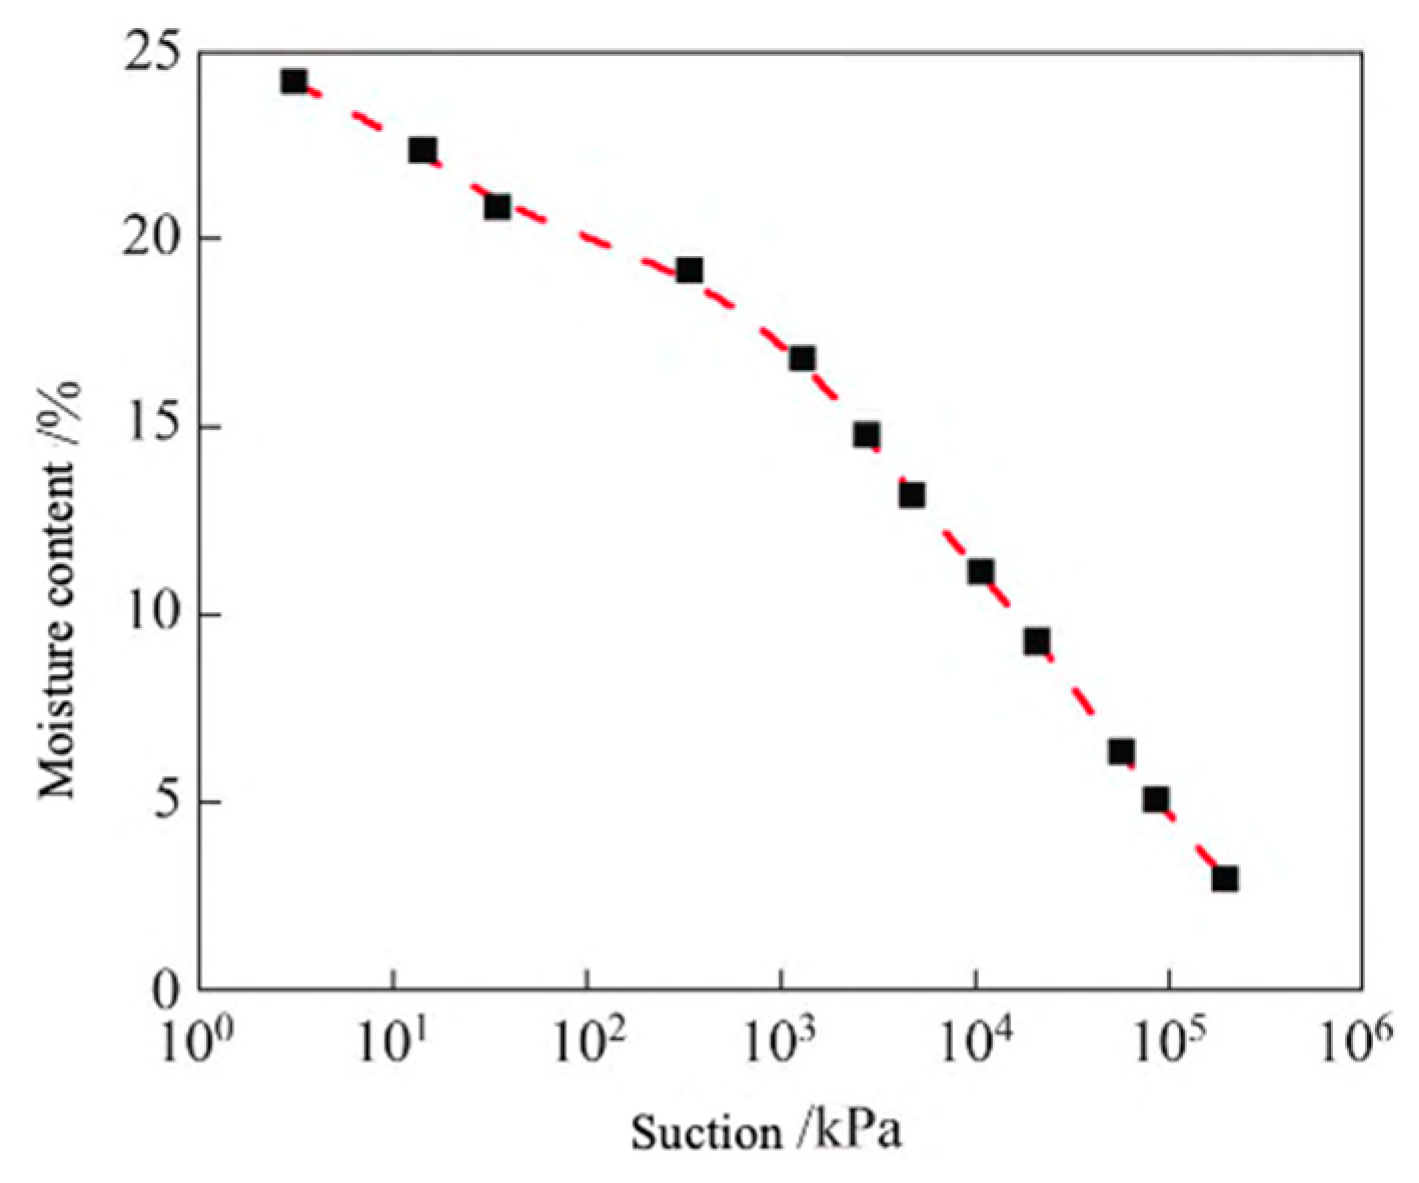
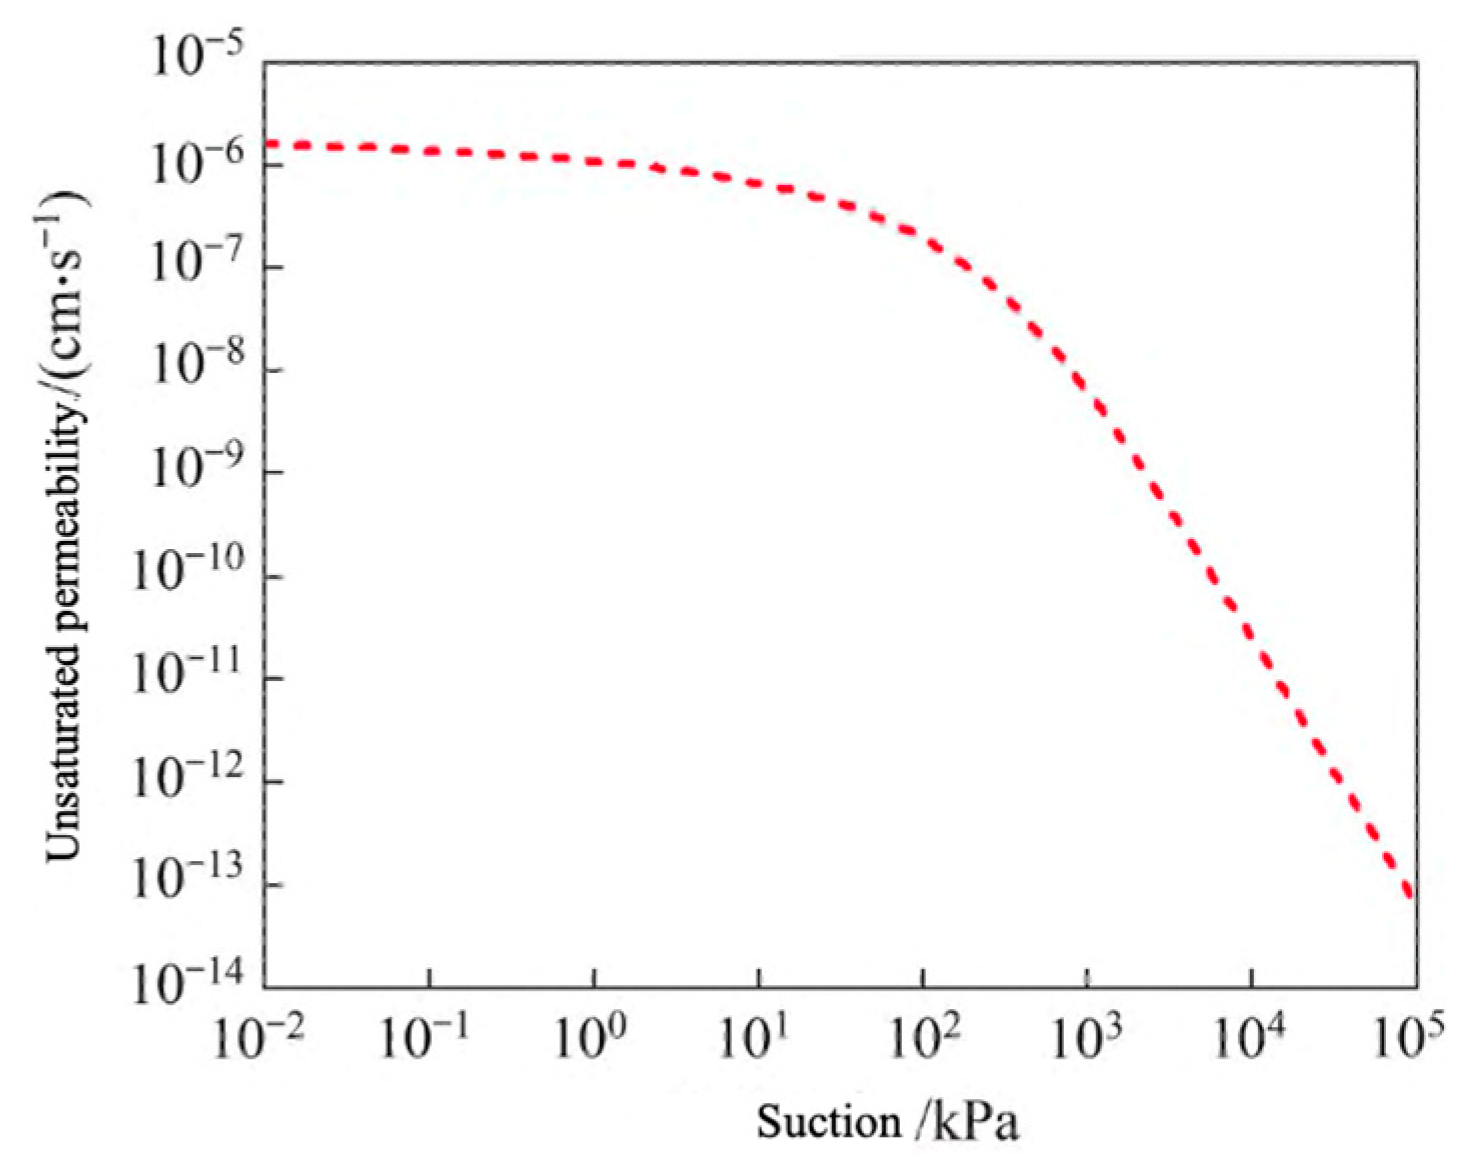
The calculation model is shown in Figure A1. Considering the intense exchange of water between the surface soil and the atmosphere, the grid elements within 1 m of the surface are refined, and a total of 1780 units are obtained. The initial water content of the slope soil is 20%. The soil–water characteristic curve (SWCC) and saturated permeability coefficient of the soil are shown in Figure A2 and Figure A3. According to the measured soil–water characteristic curve, the pore water pressure in the slope is set to −387.9 k P a , without considering the effect of groundwater. The boundary conditions are set as follows: the left, right, and bottom of the slope are impermeable boundaries (total flow Q = 0), and the surface of the slope (green line part) is set as the surface atmospheric interaction boundary.
(2) The same slope model is established in the discrete element software MatDEM 2.0, and the moisture content parameters are set for the particles. According to the coordinates of the particle center point, the moisture content at the corresponding position of the finite element calculation result is obtained as the average moisture content of the particle unit. In the process of particle expansion and contraction, it is assumed that each particle remains unchanged at the corresponding position in the finite element model.
(3) Assuming that the expansion–shrinkage coefficient of particles in each stage remains unchanged, the expansion–shrinkage coefficient of each particle in this stage is calculated based on laboratory tests. Taking the adjacent time as a stage, according to the change in particle moisture content in each stage, the discrete element method is used to simulate the evolution process of soil cracks.

2.3. Principle and Method of Discrete Element Slope Stability Calculation

The model applied the discrete element strength reduction method to analyze the stability of slopes made of expansive soil, considering the development of cracks during wetting–drying cycles. Previous researchers [40,41] have highlighted the crucial role of connection strength and particle friction coefficients in determining the stability of discrete element slopes.
Consequently, the normal breaking force b f (normal breaking displacement x b ), initial shear resistance f s 0 , and particle friction coefficient μ p in the linear elastic model are systematically reduced using a consistent reduction coefficient. For this purpose, critical values are defined for normal fracture force ( b ) f c r , critical initial shear resistance ( f s 0 ) c r , and critical friction coefficient ( μ p ) c r . When the conditions b f b f c r , f s 0 ( f s 0 ) c r , and μ p ( μ p ) c r are met, it indicates that the slope displacement surpasses the critical displacement, signifying slope instability. Conversely, when b f > b f c r , f s 0 > ( f s 0 ) c r , μ p > ( μ p ) c r , the slope displacement remains below the critical displacement, indicating slope stability.
The assessment of slope stability relies on the relationship between displacement at the characteristic position and critical displacement. Therefore, the reduction factor for slope instability serves as the safety factor of the slope with Equation (15).
F O S = b f b f c r = f s 0 f s 0 c r = μ p μ p c r
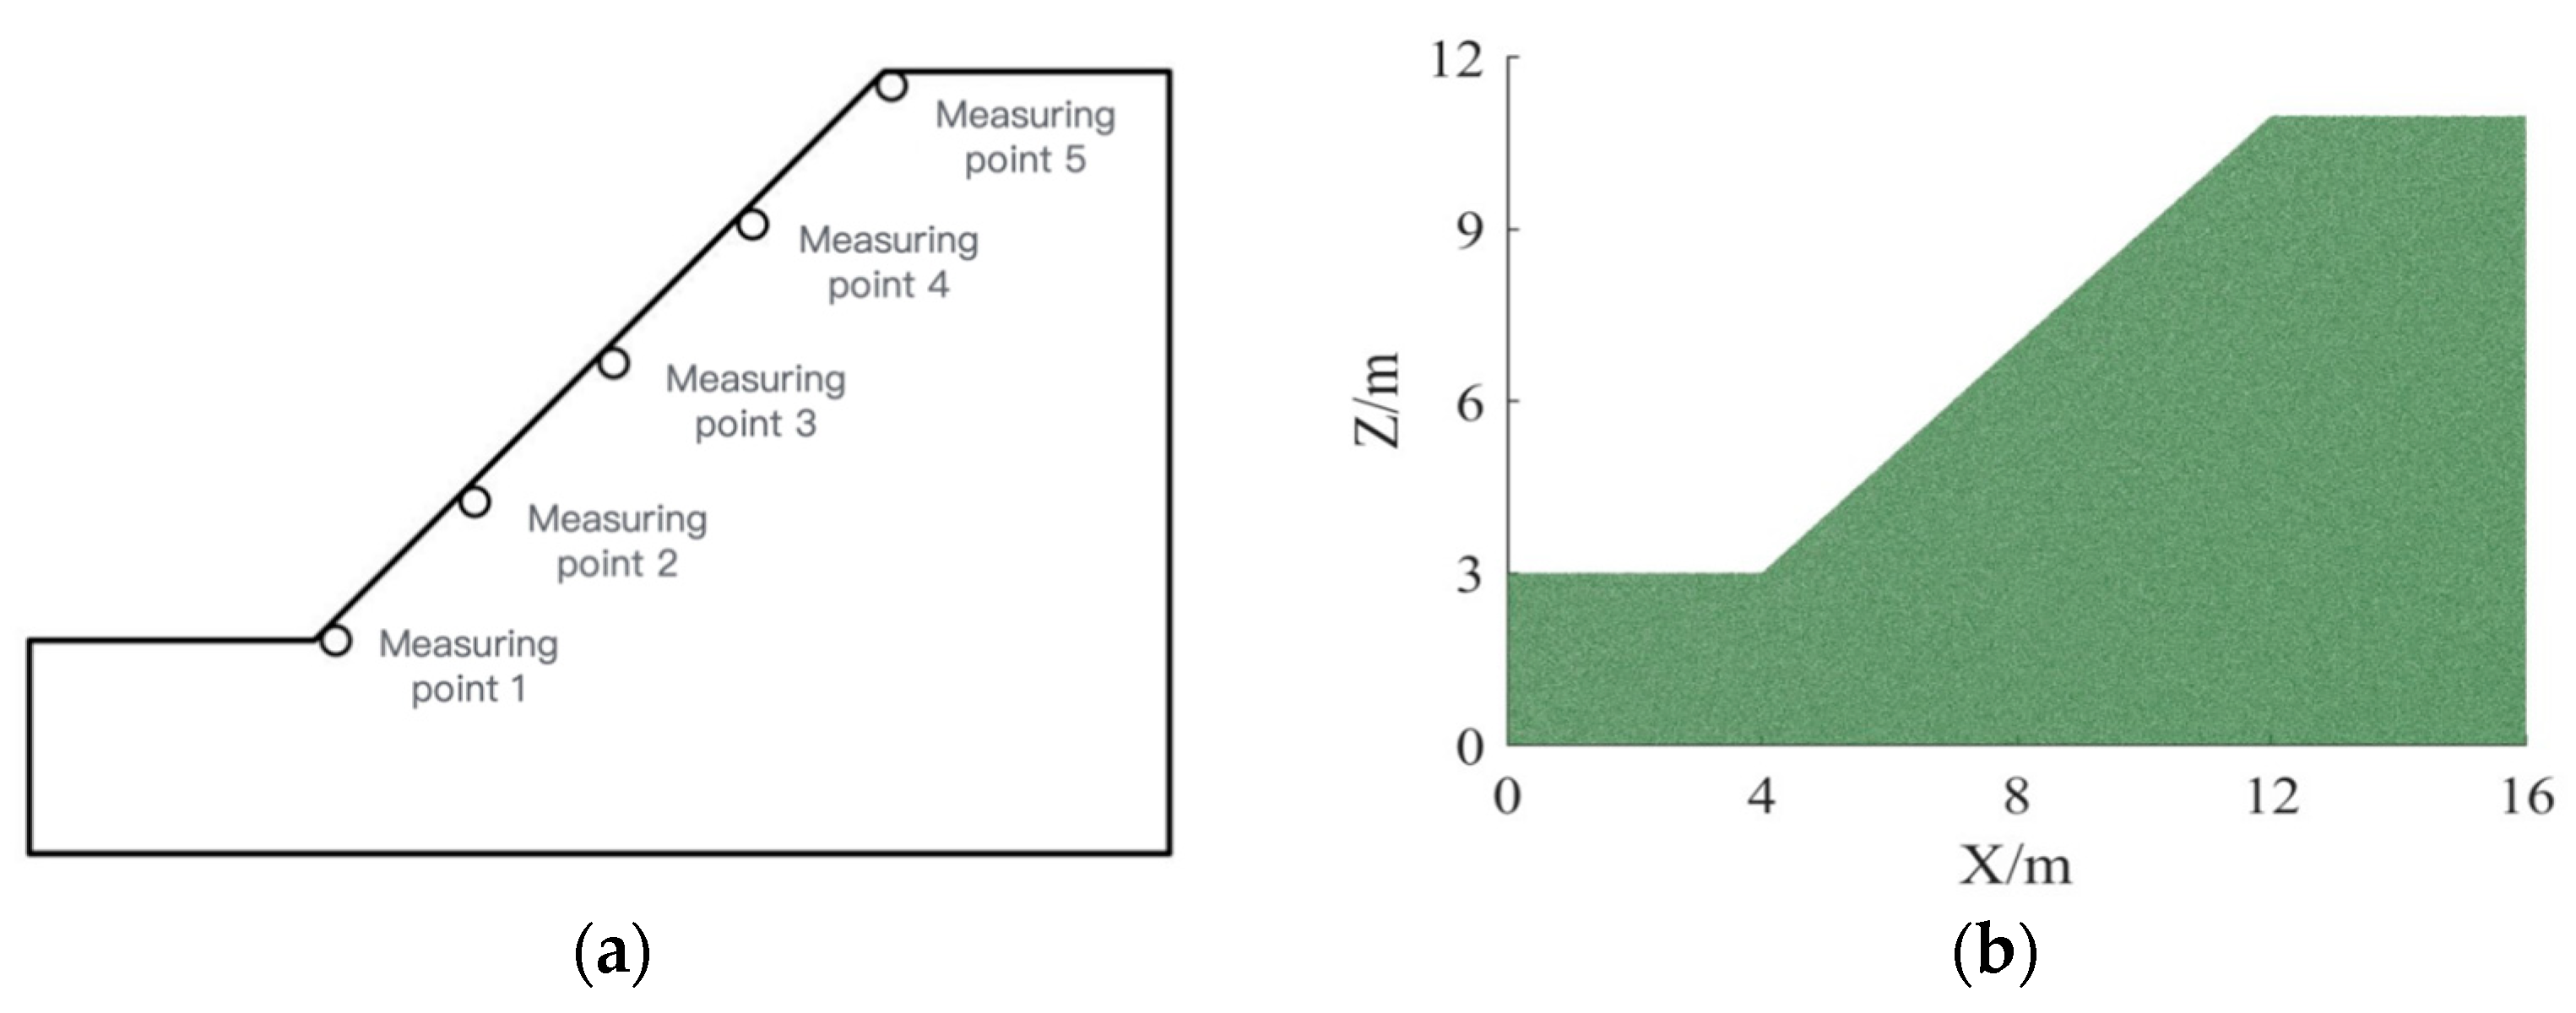
where F O S = the safety factor; b f c r = the critical normal fracture force of particles; f s 0 c r = the critical initial shear resistance of particles; and ( μ p ) c r = the critical friction coefficient of particles, respectively. Based on the secondary development functionality of MatDEM, the function of automatic calculation of slope safety factor is programmed. The slope safety factor can be calculated automatically by inputting the calculation range of the safety factor. In the discrete element slope model, five monitoring points have been strategically positioned to track the displacement of various sections of the slope during iterative calculations. The layout positions of these monitoring points are depicted in Figure 3a.

3. Discrete Element Simulation of Expansive Soil Slopes Cracks in Wetting–Drying Cycle

3.1. Initial Model Establishment

The average particle radius was set as 1 cm with a particle size distribution coefficient of 0.2, weighing both the accuracy and efficiency of calculations. This coefficient implies that the particle radius follows a normal distribution ranging from 0.836 cm to 1.204 cm. The discrete element slope accumulation model, depicted in Figure 3b, consists of a total of 294,183 particles.

3.2. Material Setting and Parameter Determination

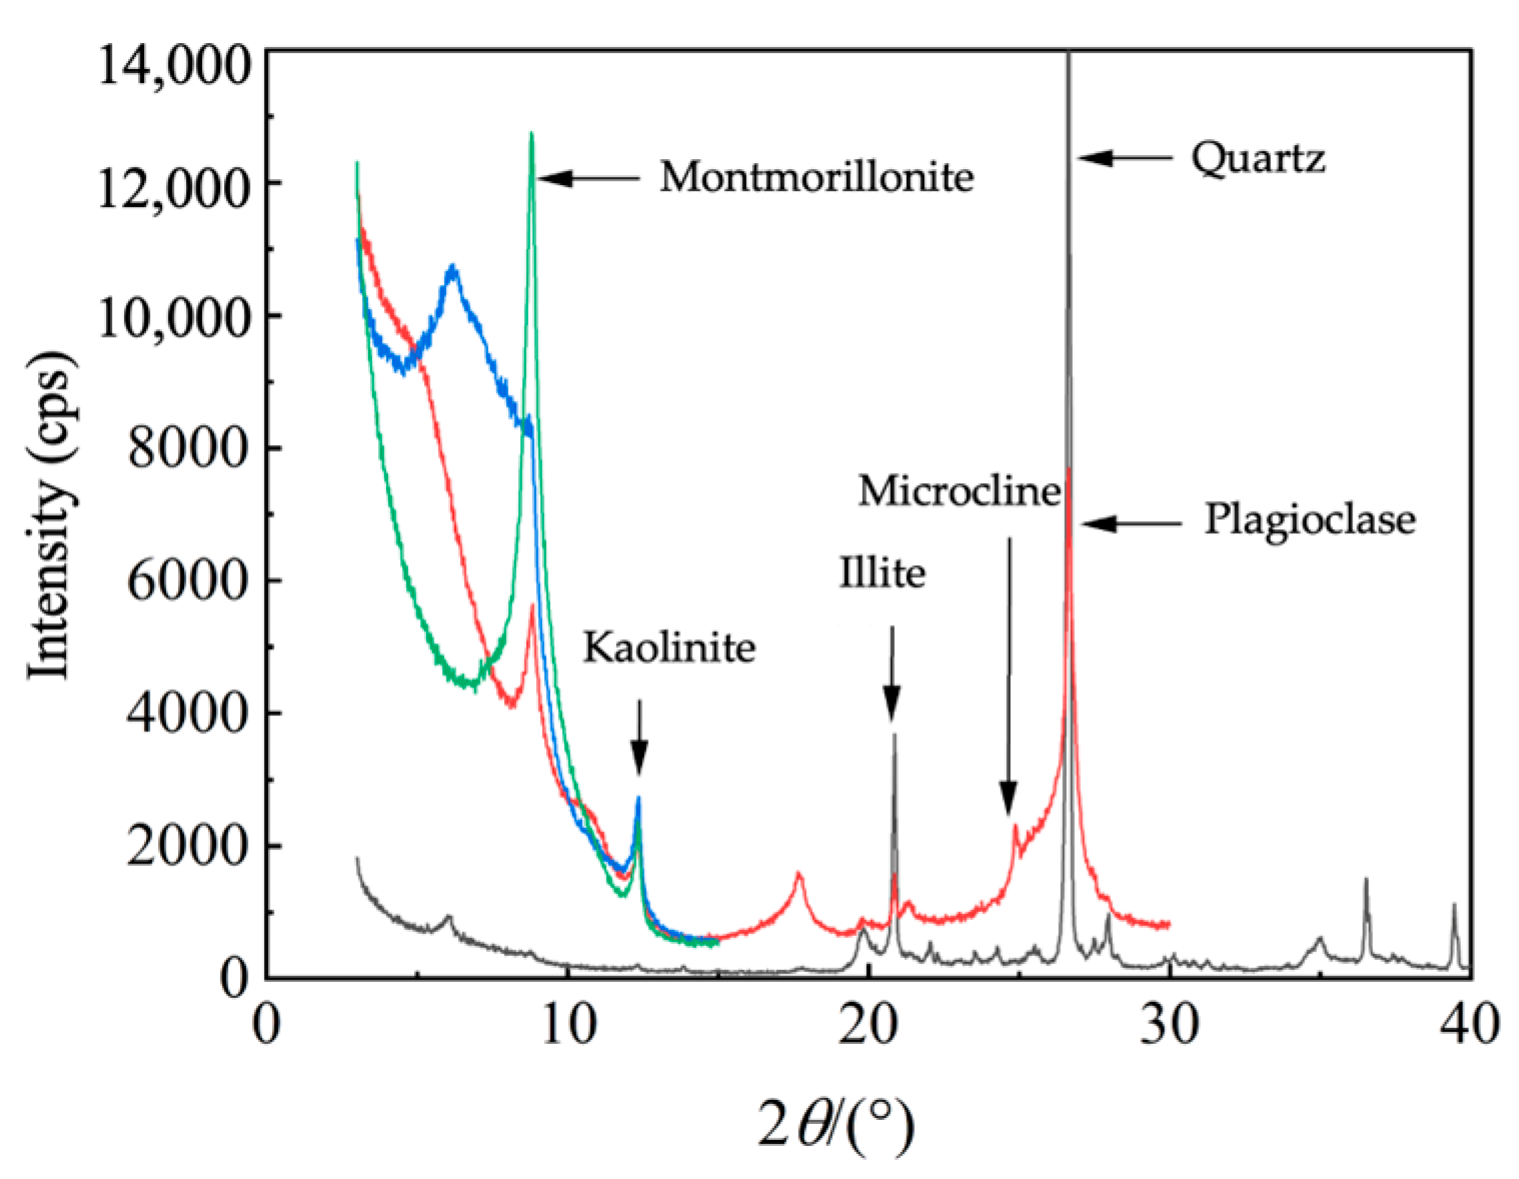
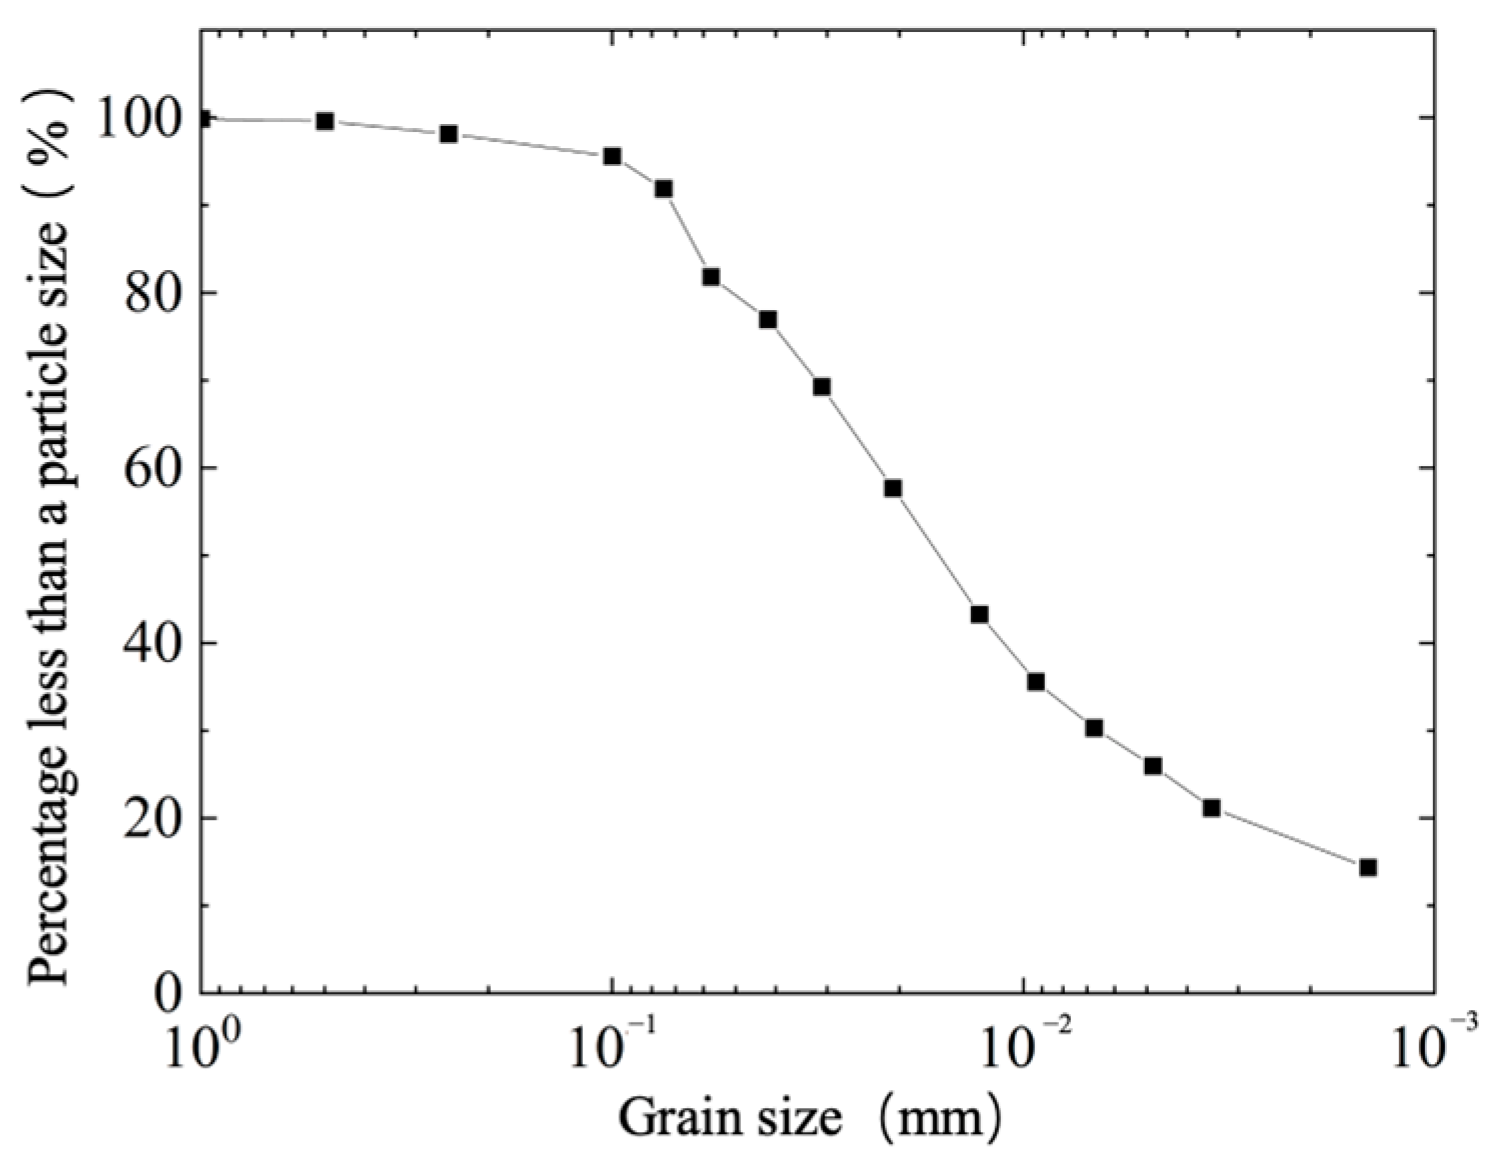
The particle mesoscopic parameters of the discrete element slope model were calibrated using the biaxial compression test, taking into account the physical and mechanical properties and the macroscopic parameters of Nanyang expansive soil, as shown in Table 1 and Table 2, respectively, after subjecting it to wetting–drying cycles. The mineral composition of Nanyang expansive soil is illustrated in Figure A4 and Table A1 and Table A2, and the particle grading curve is shown in Figure A5. To enhance the analysis, the following assumptions were made.
(1) The elastic modulus, Poisson’s ratio, and tensile strength of expansive soil are invariant, irrespective of variations in water content and the number of wetting–drying cycles.
(2) The normal stiffness k n , the tangential stiffness k s , and the normal fracture displacement x b (the normal fracture force F n ) were calculated using the macro and micro transformation equation. Nevertheless, the initial shear resistance and particle friction coefficient necessitate calibration.
The calibration process yielded particles of the same size and distribution in the biaxial compression test as in the slope model. The biaxial compression model had dimensions of 1 m in width and 2 m in height, consisting of a total of 5202 particle units. The confining pressures applied during the biaxial compression test matched the laboratory test conditions, set as 50, 100, 150, and 200 kPa, respectively, in accordance with the laboratory test conditions. The mesoscopic parameters of the particle obtained from the final calibration are presented in Table 3.

3.3. The Effects of Crack on the Stability of Expansive Soil Slopes

The discrete element model presented in this study examines the impact of cracks on the stability of expansive soil slopes, focused on two crucial factors:
(1) Slope model with cracks: The discrete element model accurately simulated the development of cracks during wetting–drying cycles. During the rainfall infiltration process, certain cracks may partially close as soil particles expand, while others remain open.
(2) Strength parameters for soil with cracks: In order to consider the effect of cracks on the simulation of unsaturated seepage, slopes made of expansive soil are divided into two zones: crack zone and no-crack zone. This division is based on different depths of cracks, as shown in Figure 4. Varying permeability coefficients are established within these zones. Additionally, the particle characteristics of the soil in the crack zone are established by analyzing the shear strength properties of samples that have undergone various cycles of drying and wetting. In contrast, the strength characteristics of the soil in the no-crack zone are not influenced by the process of drying and wetting.
It is worth noting that the depth of the crack area is determined based on the average maximum crack depth observed from the expansive soil slopes throughout various wetting–drying cycles, as presented in Table 4.

4. Results Analysis

4.1. Failure Model

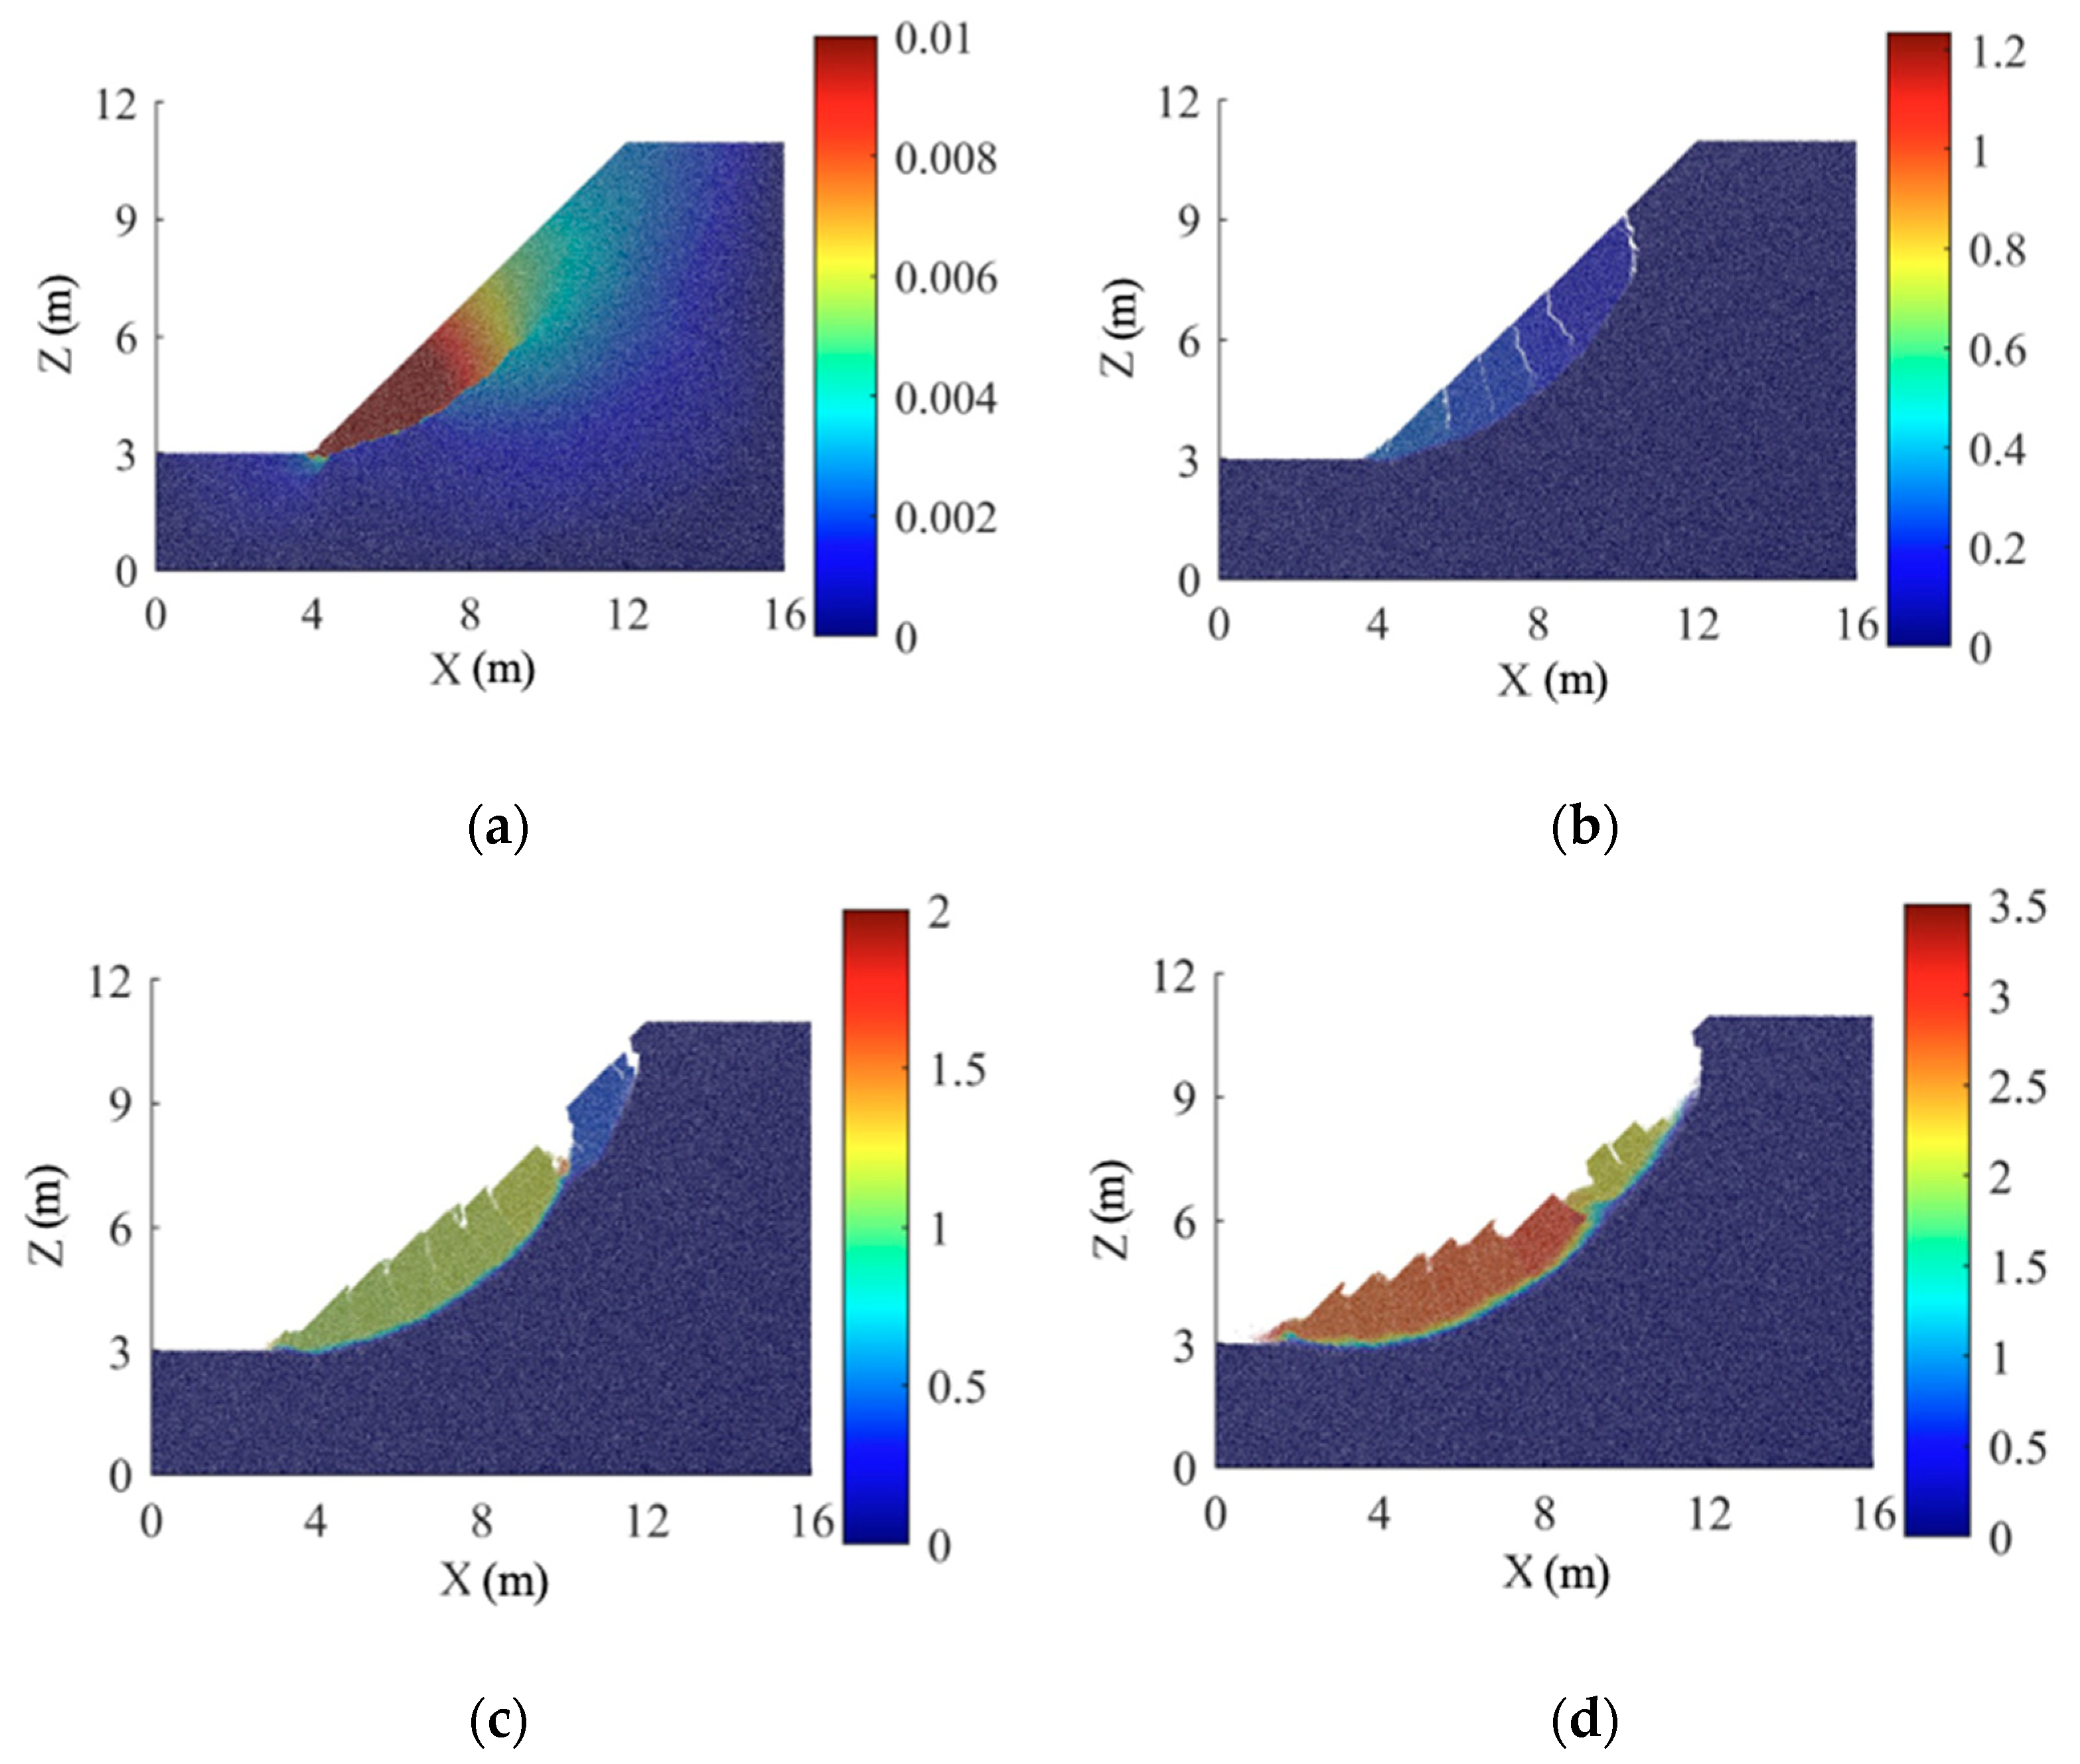
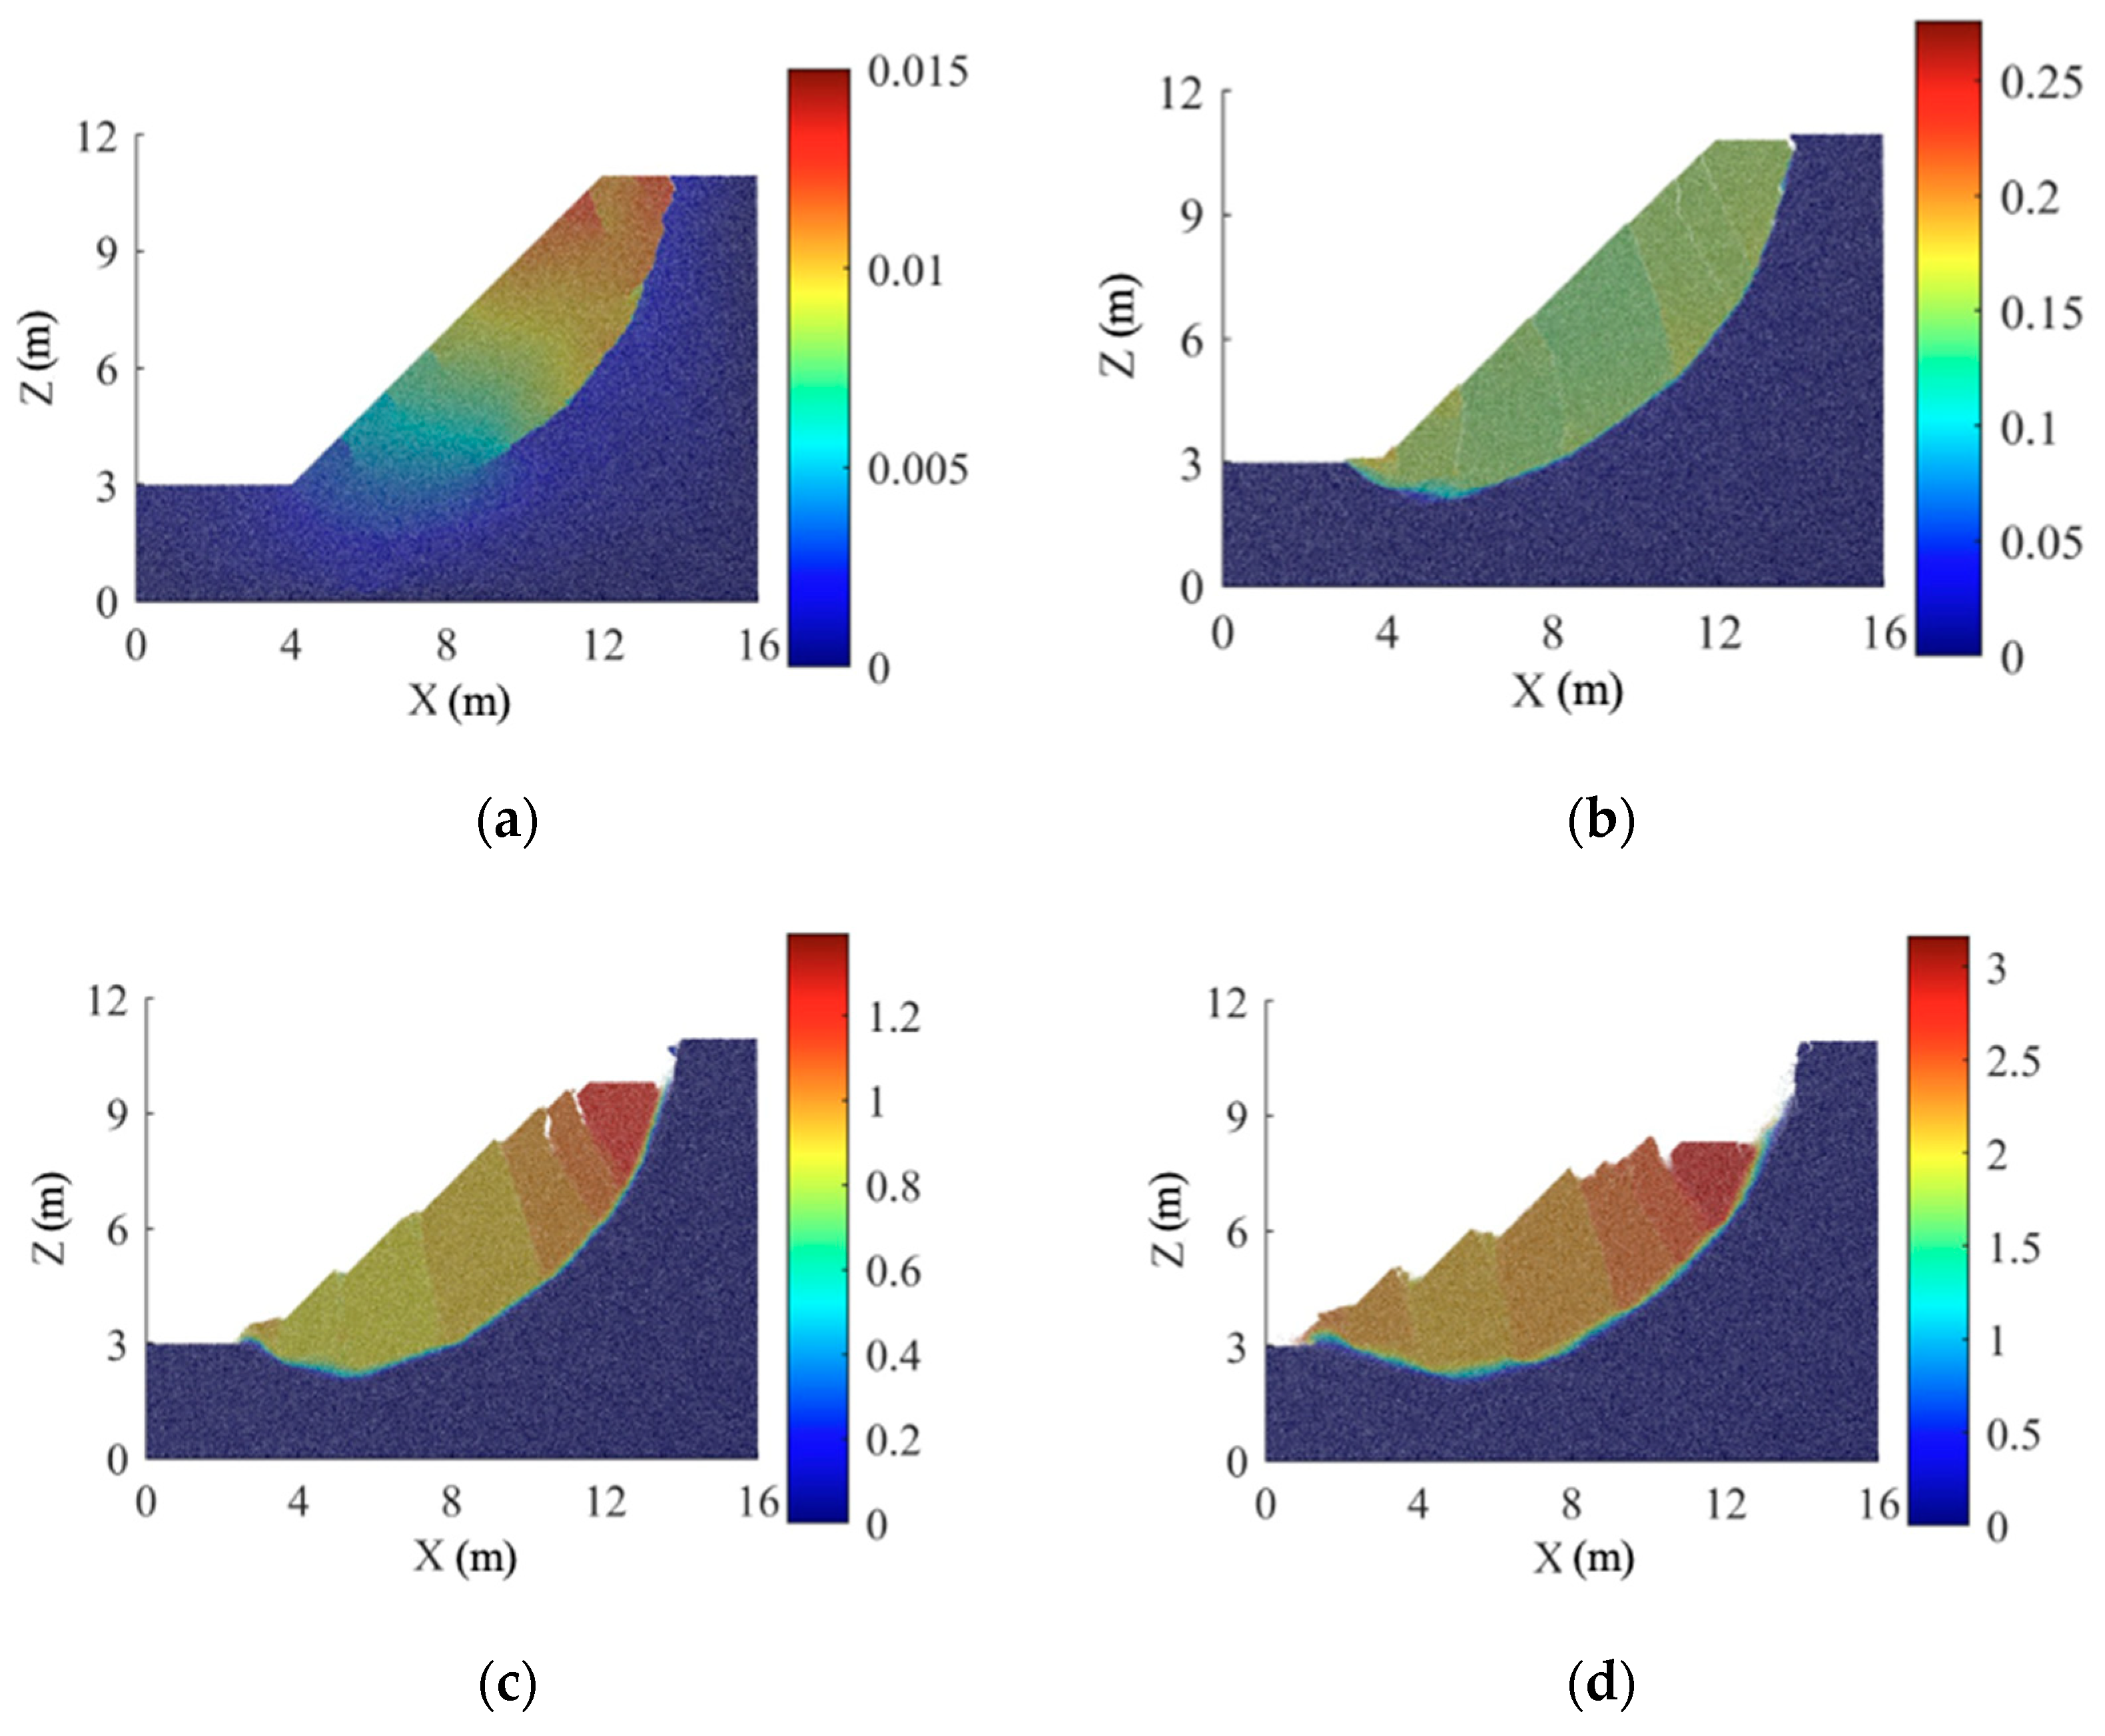
The displacement diagrams (Figure 5, Figure 6, Figure 7, Figure 8, Figure 9 and Figure 10) show that the displacement changes in the expansive soil slopes over various wetting–drying cycles. Figure 5 shows the displacement diagram without any wetting–drying cycle. After 25,000 time steps, the slope remains stable, but a noticeable crack zone appears at the base of the slope. At 50,000 time steps, the sliding surface forms in the initial section, causing a portion of the soil to detach from the slope. Furthermore, at 75,000 time steps, the sliding distance of the first section exceeds 1 m, which suggests the progression of the landslide into a deeper stage.
The behavior of expansive soil slopes after one and two cycles of wetting and drying, is depicted in Figure 6 and Figure 7, respectively. At 25,000 time steps, there is no clear evidence of any slippage in these slopes. Nevertheless, cracks emerge and a sliding surface forms at the higher section of the slope, progressively expanding in a circular manner within the slope. After 50,000 time steps, the sliding crack plane achieves complete connectivity, which signifies a profound circular slide.
In the early stage of the wetting–drying cycle, although the shear strength of expansive soil decreases rapidly, the number of slope cracks and the depth of crack development is still small, resulting in a similar pattern to that without any wetting–drying cycles. Due to the expansion and contraction cracks caused by atmospheric action in all parts of the slope after the wetting–drying cycle, the slope soil mass will continue to develop along the existing cracks at the top of the slope under the action of gravity, and the slope sliding surface will first develop into the crack at the top of the slope, and finally form a circular arc overall sliding.
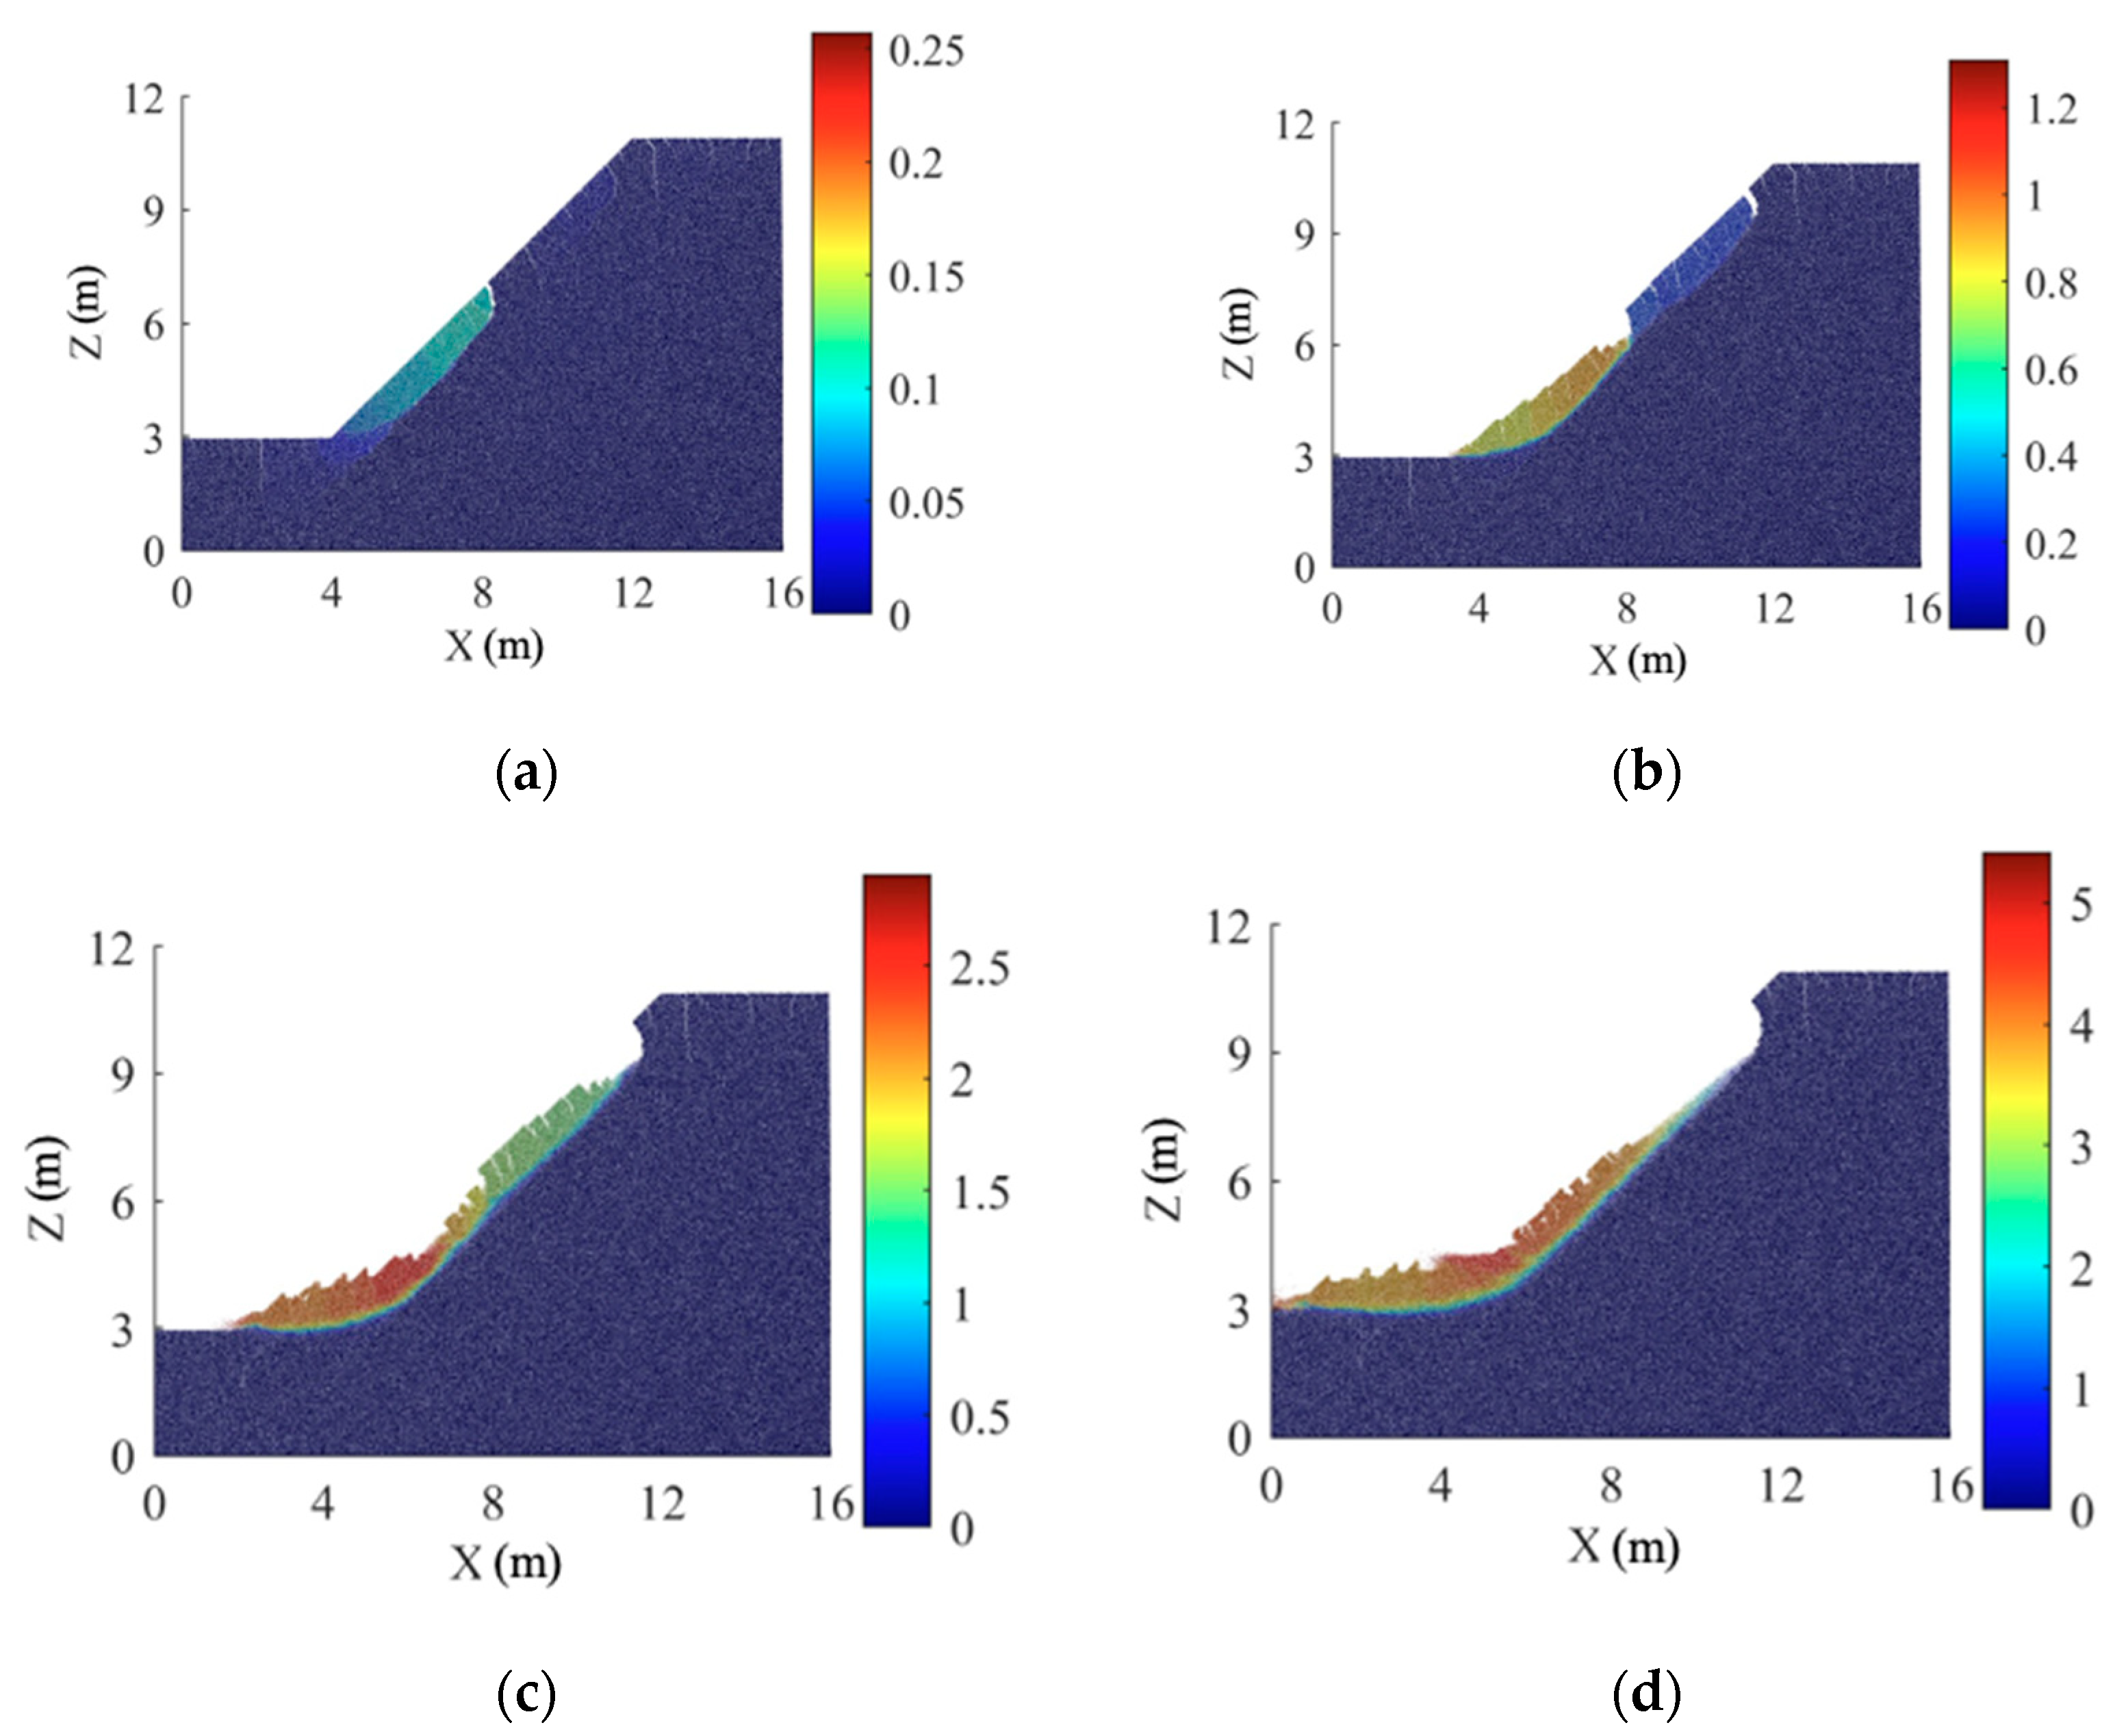
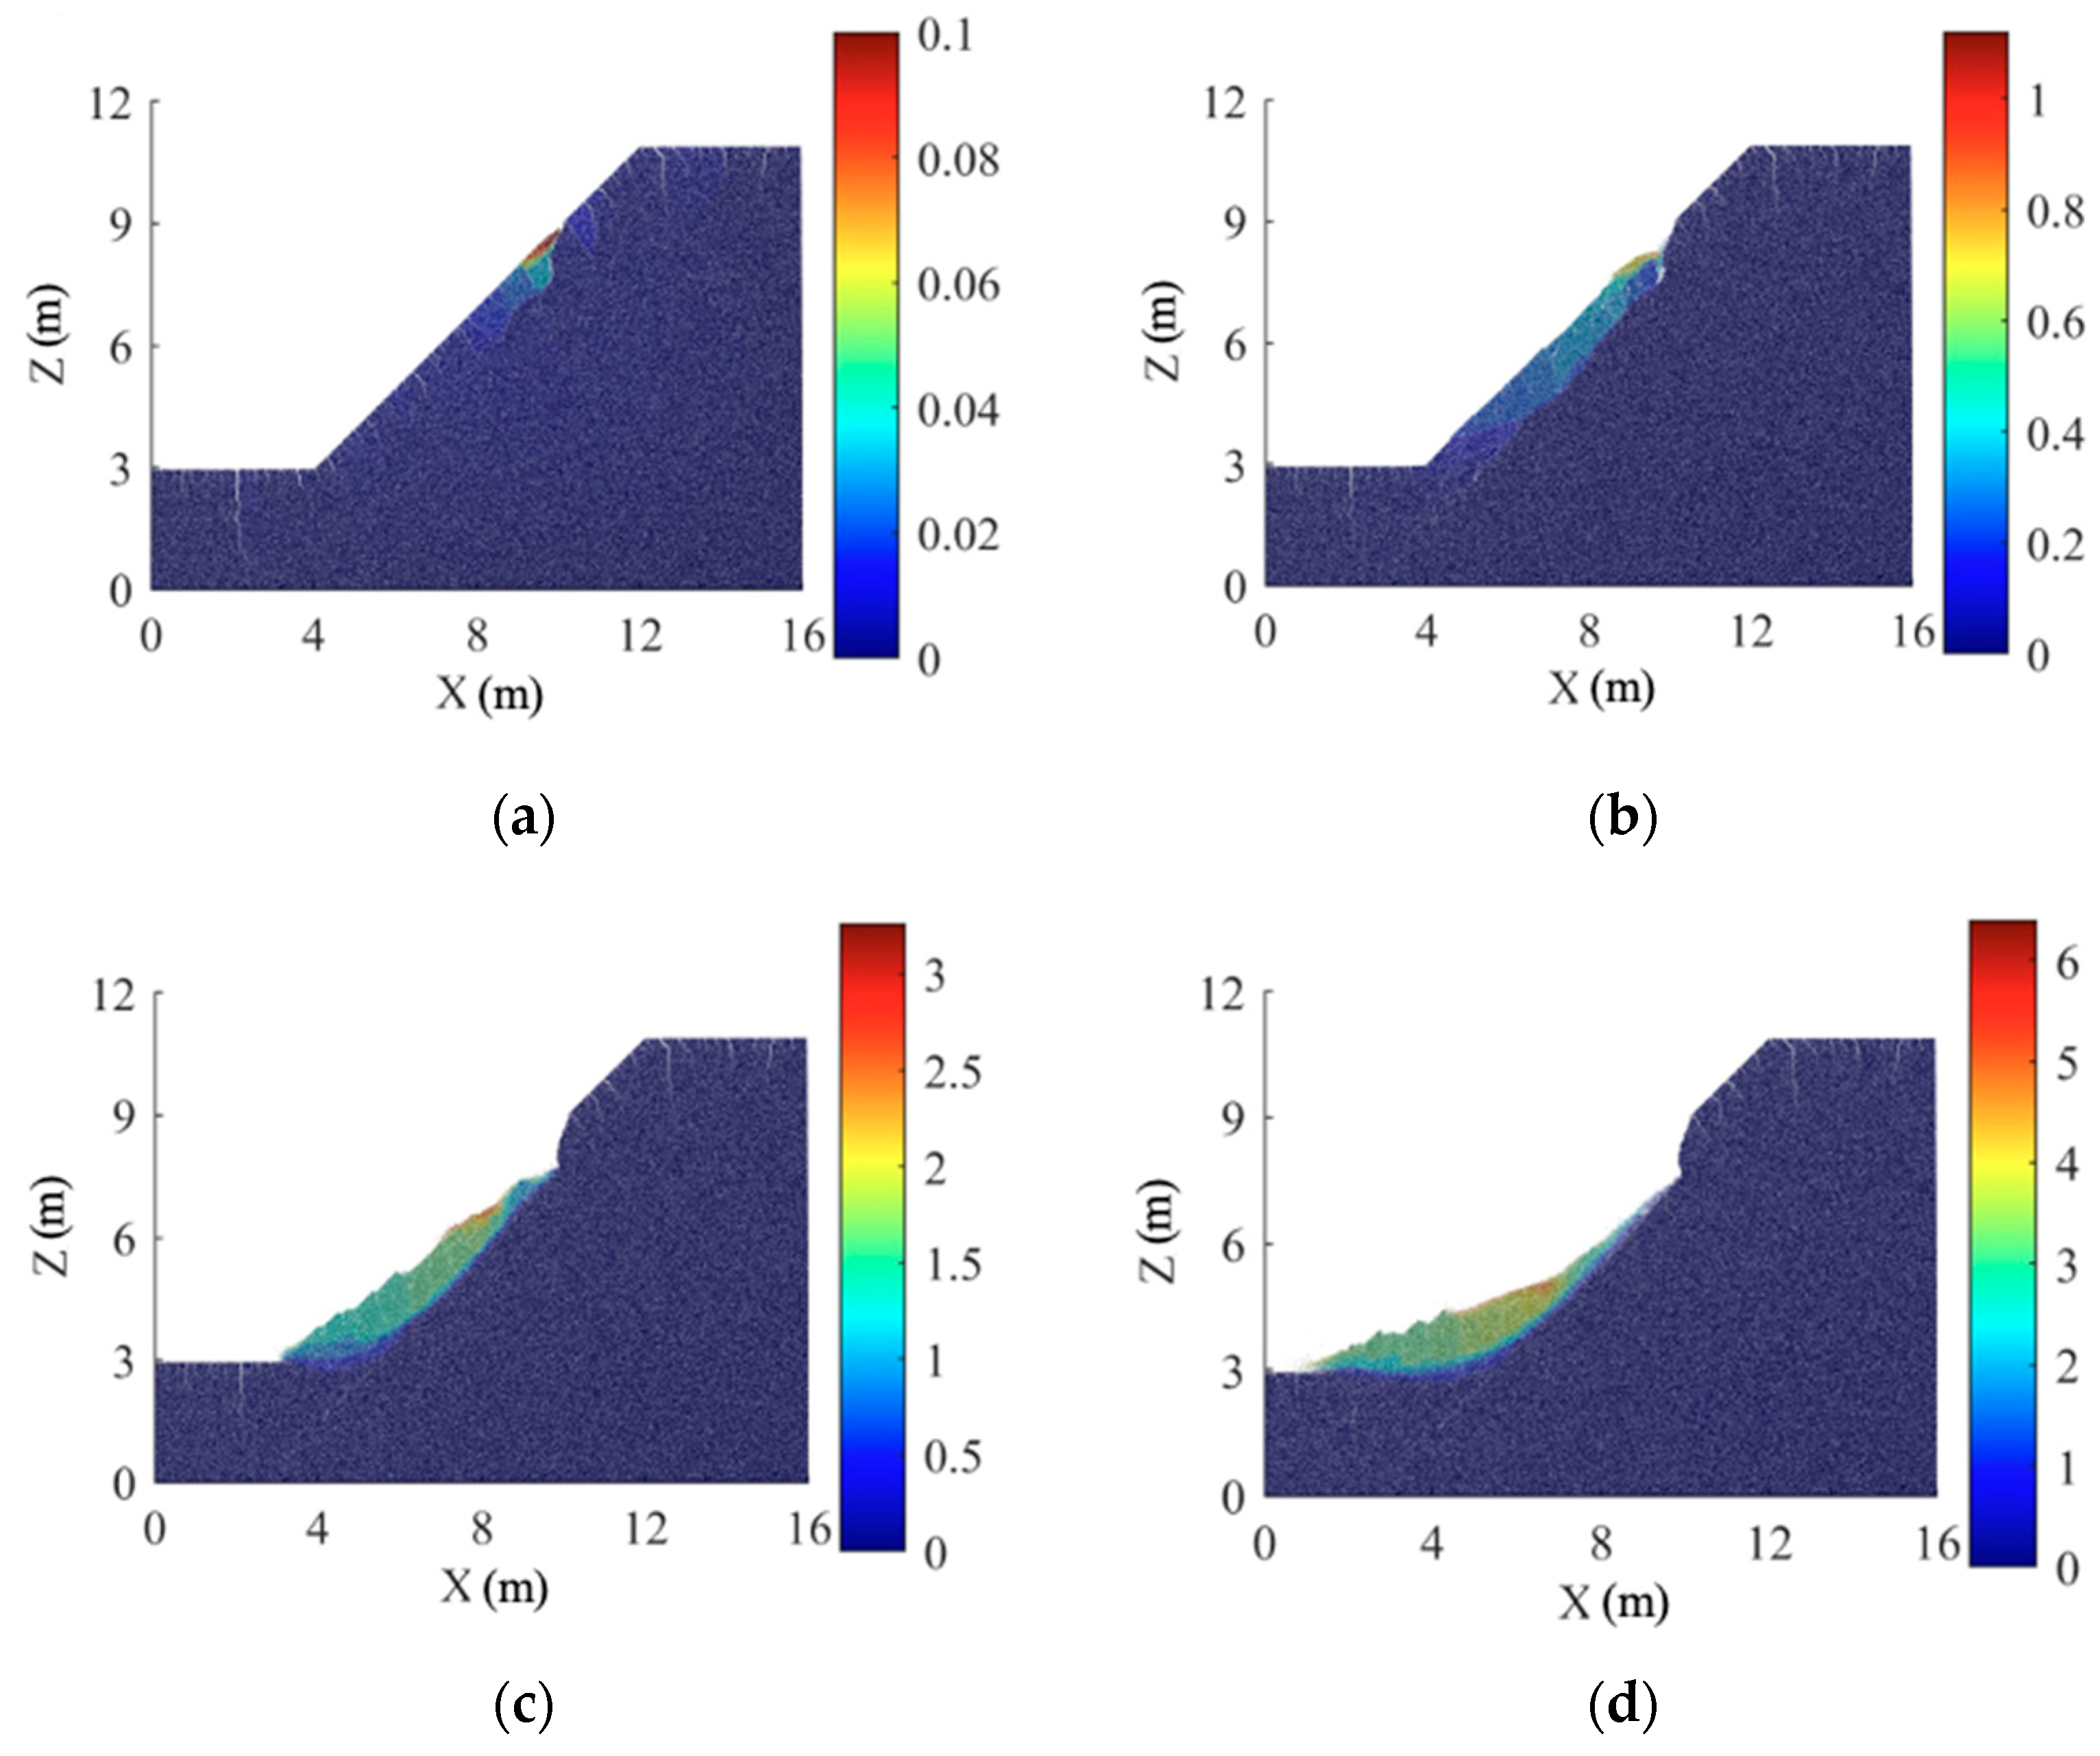
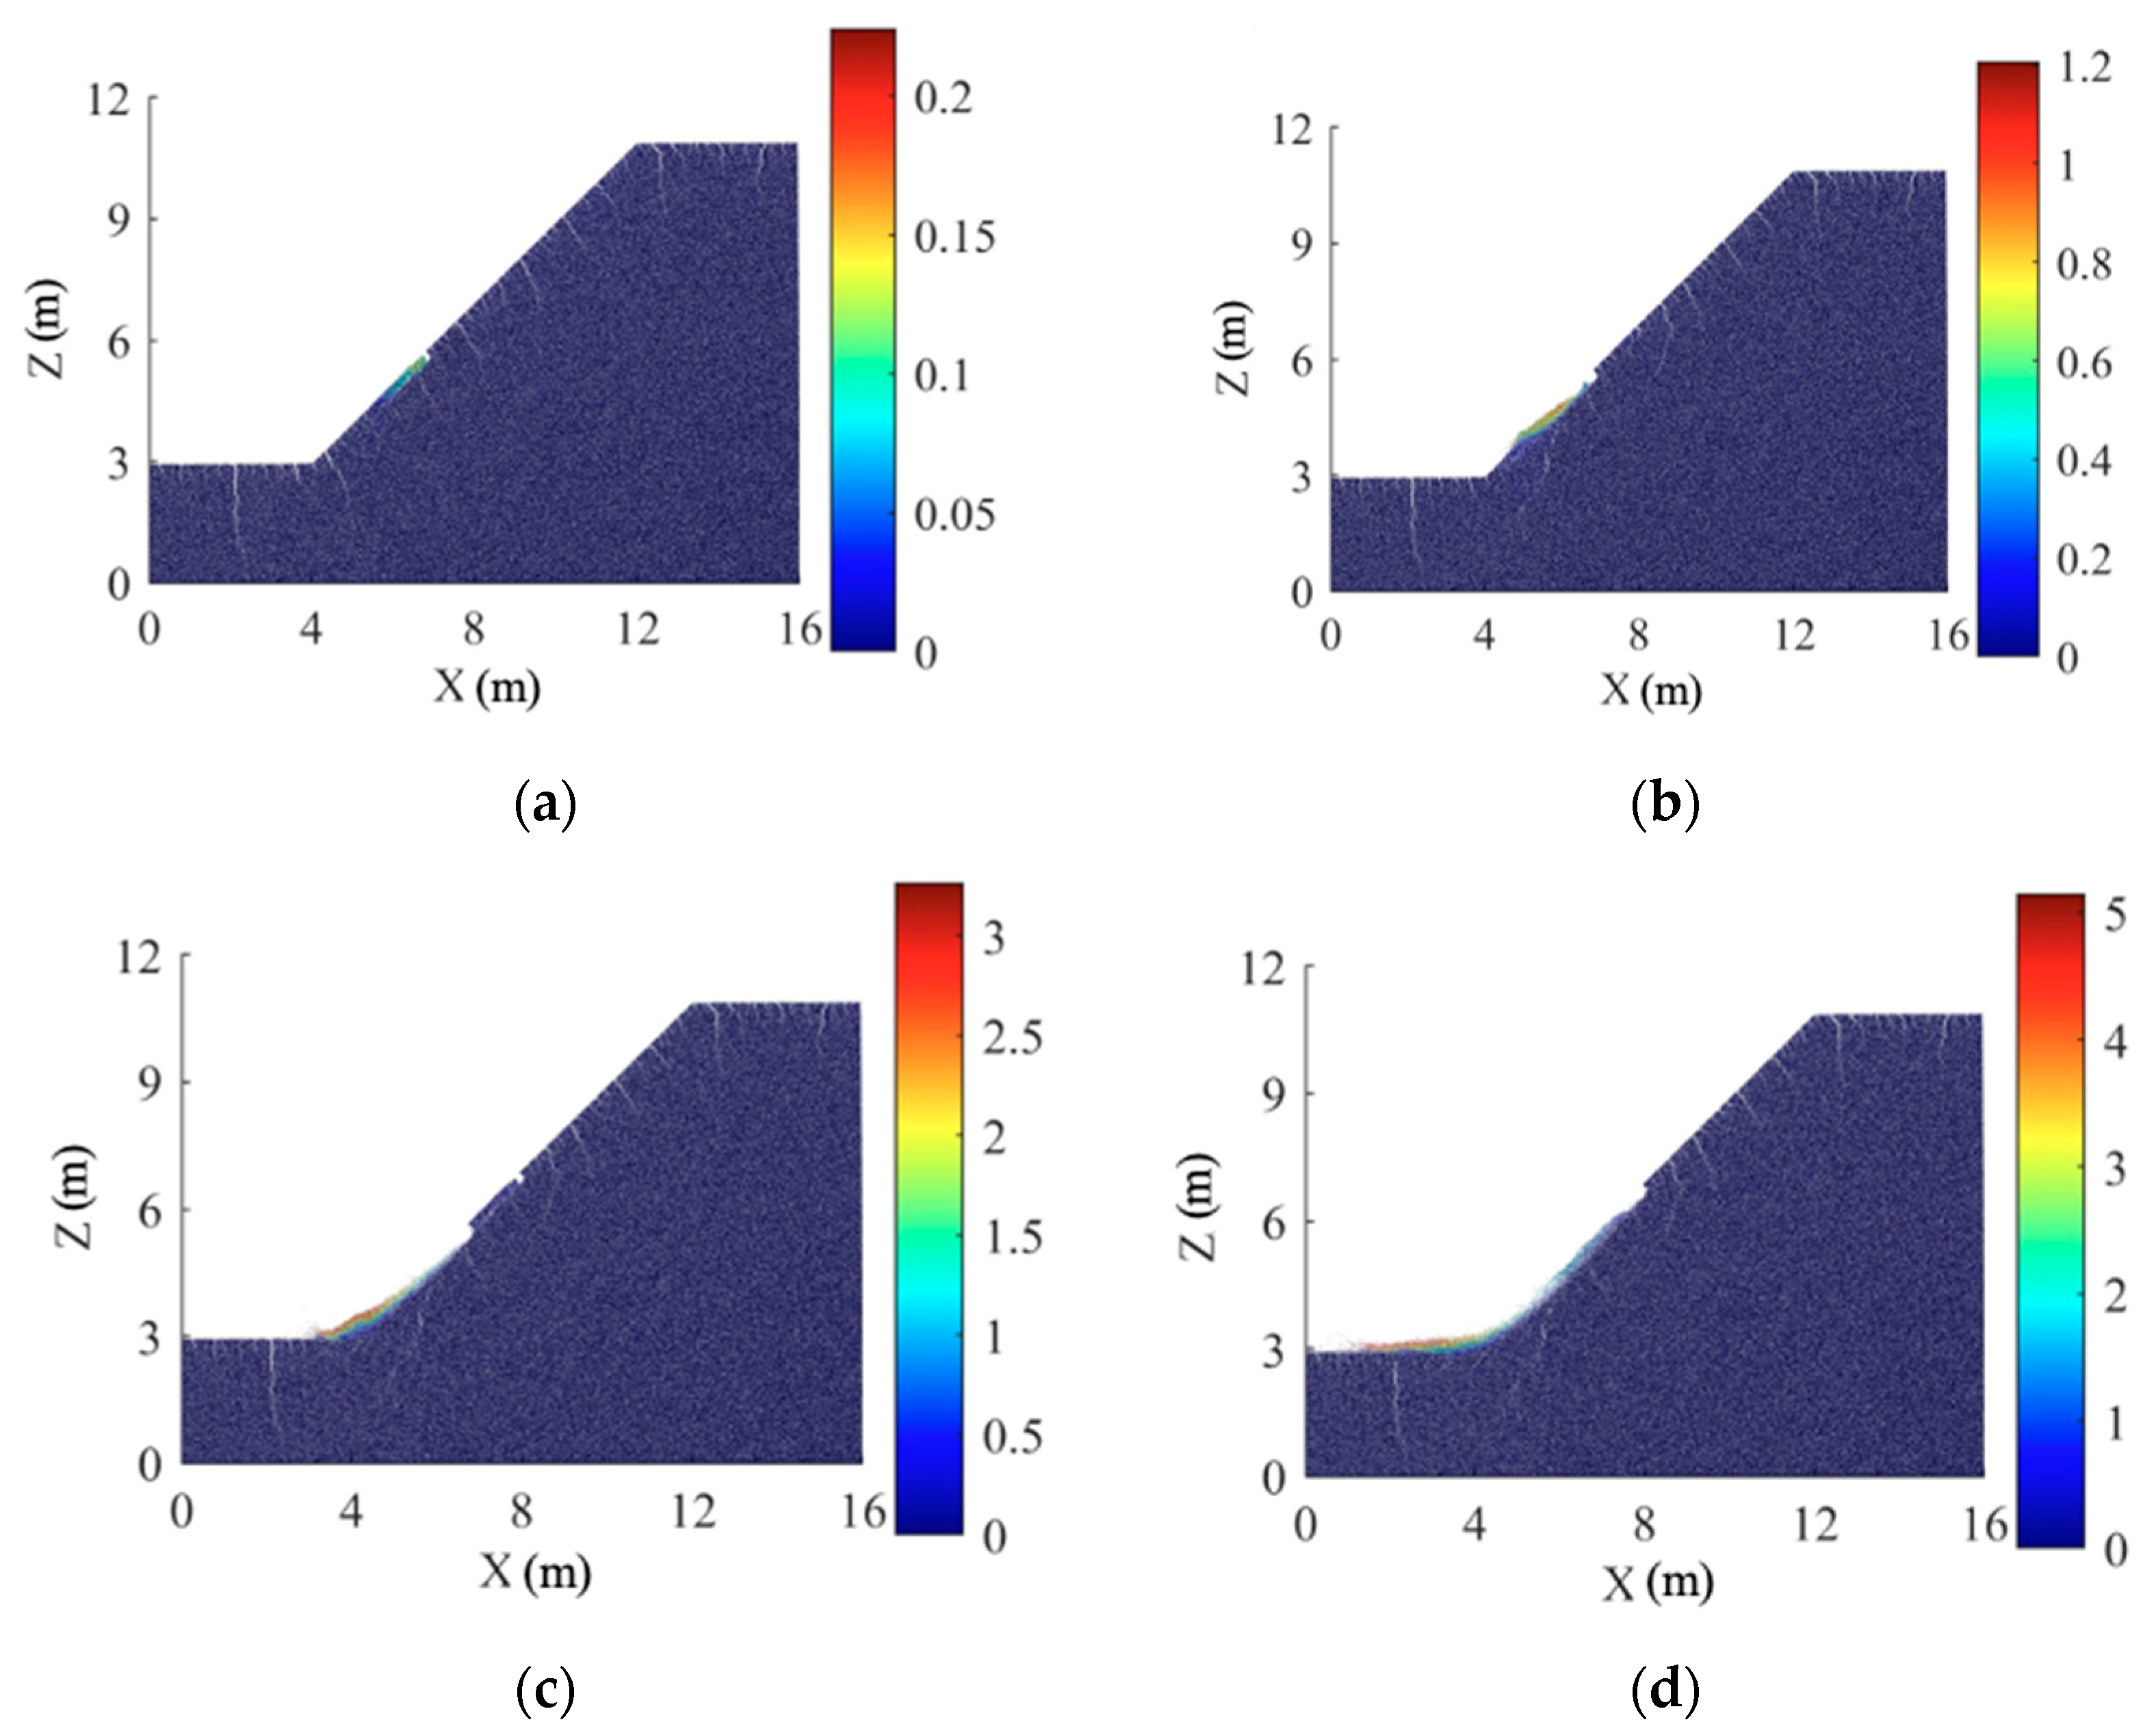
The expansive soil slopes after three to five wetting–drying cycles exhibit similar patterns of shallow failure, as shown in Figure 8, Figure 9 and Figure 10. At 25,000 time steps, shallow cracks contribute to the formation of a sliding surface. By 50,000 time steps, this sliding crack plane becomes fully connected, resulting in a shallow landslide.
During the later stage of the wetting–drying cycle (3–5 times), the shear strength of the expansive soil decreases, increasing the number and depth of cracks in the slope. The lower soil strength and increased expansion and contraction cracks on the surface of the slope are the main causes of shallow failure. There are differences in the morphology of shallow failure on expansive soil slopes after 3–5 wetting–drying cycles: (1) There are variations in the starting position of the sliding surface. (2) As the number of wetting–drying cycles increases, the depth of the shallow sliding surface decreases gradually, and the volume of the sliding body also decreases. This is because in the later stage of wetting–drying cycle, the difference in soil strength parameters is not large, and the increase in the number of surface expansion and contraction cracks is the main reason for the above phenomenon. As the number of wetting–drying cycles increases, the number of cracks on the slope surface also increases. Most of the newly formed cracks are shallow in depth. The increased number of cracks divides the surface layer of the slope into smaller soil blocks, further reducing the integrity of the soil. The slope sliding will initially occur in the area with more surface cracks, i.e., weak parts. Therefore, the depth of the slope sliding surface gradually decreases.

4.2. Slope Stability

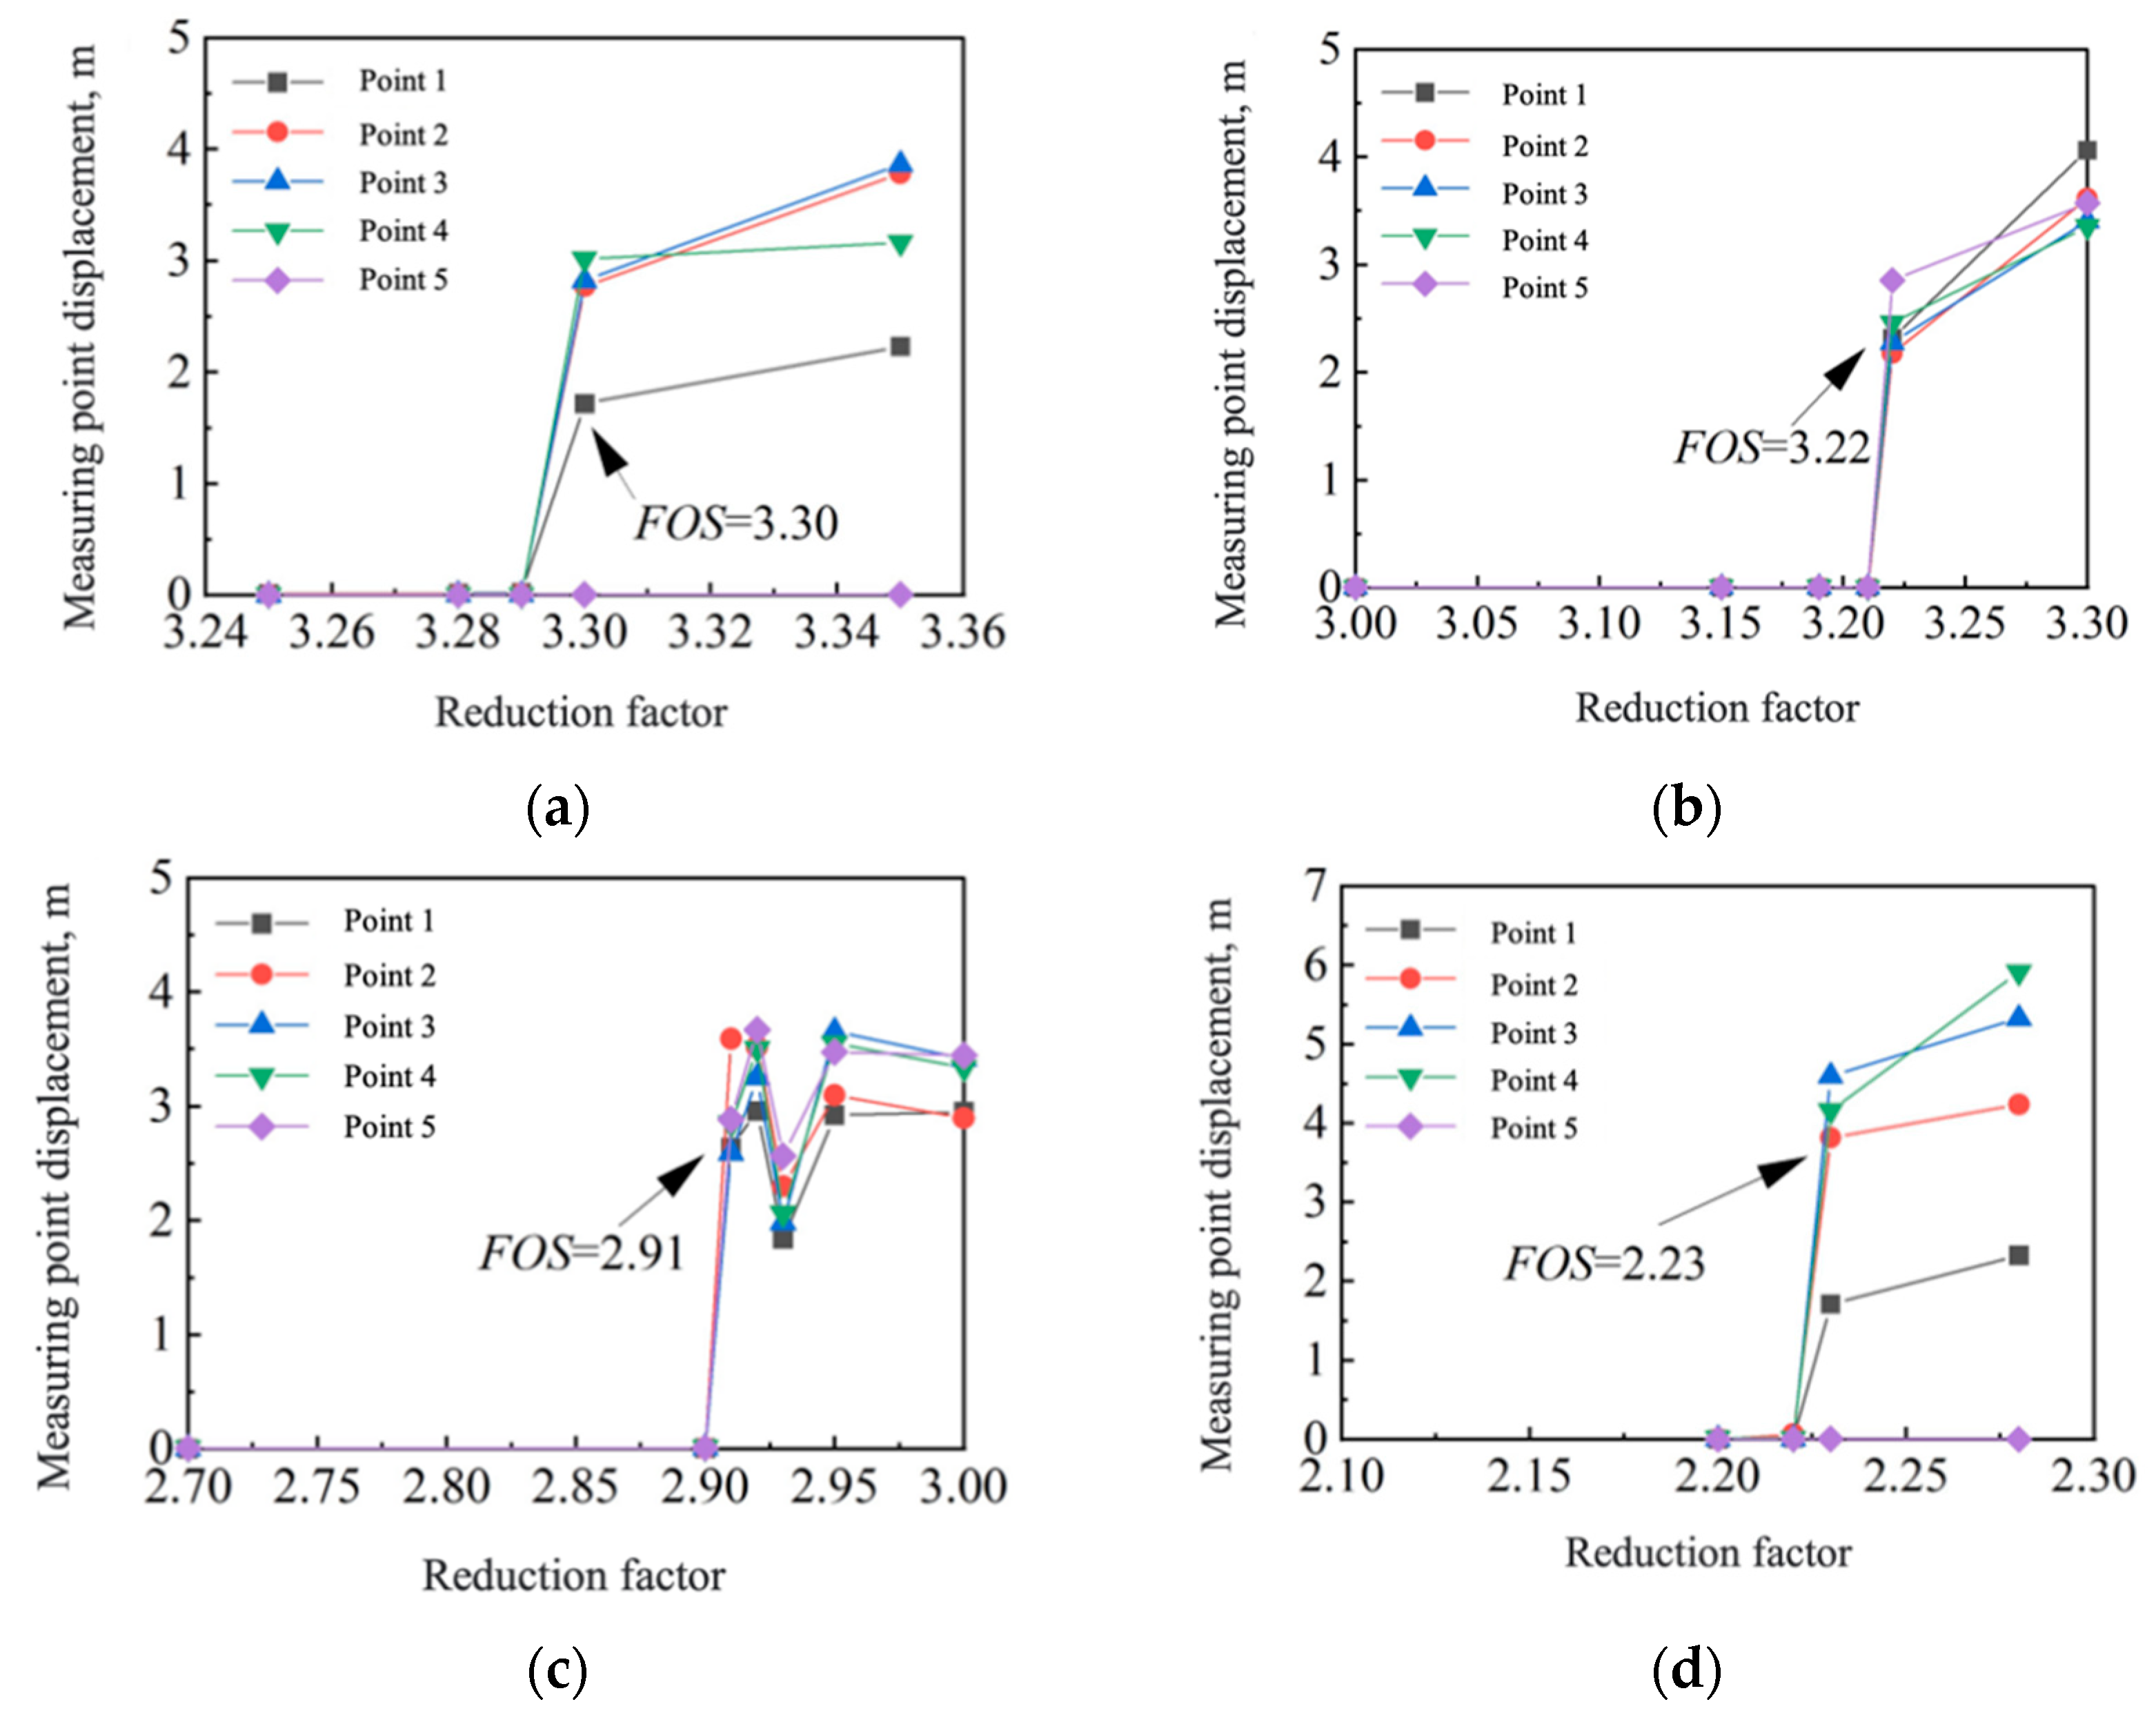
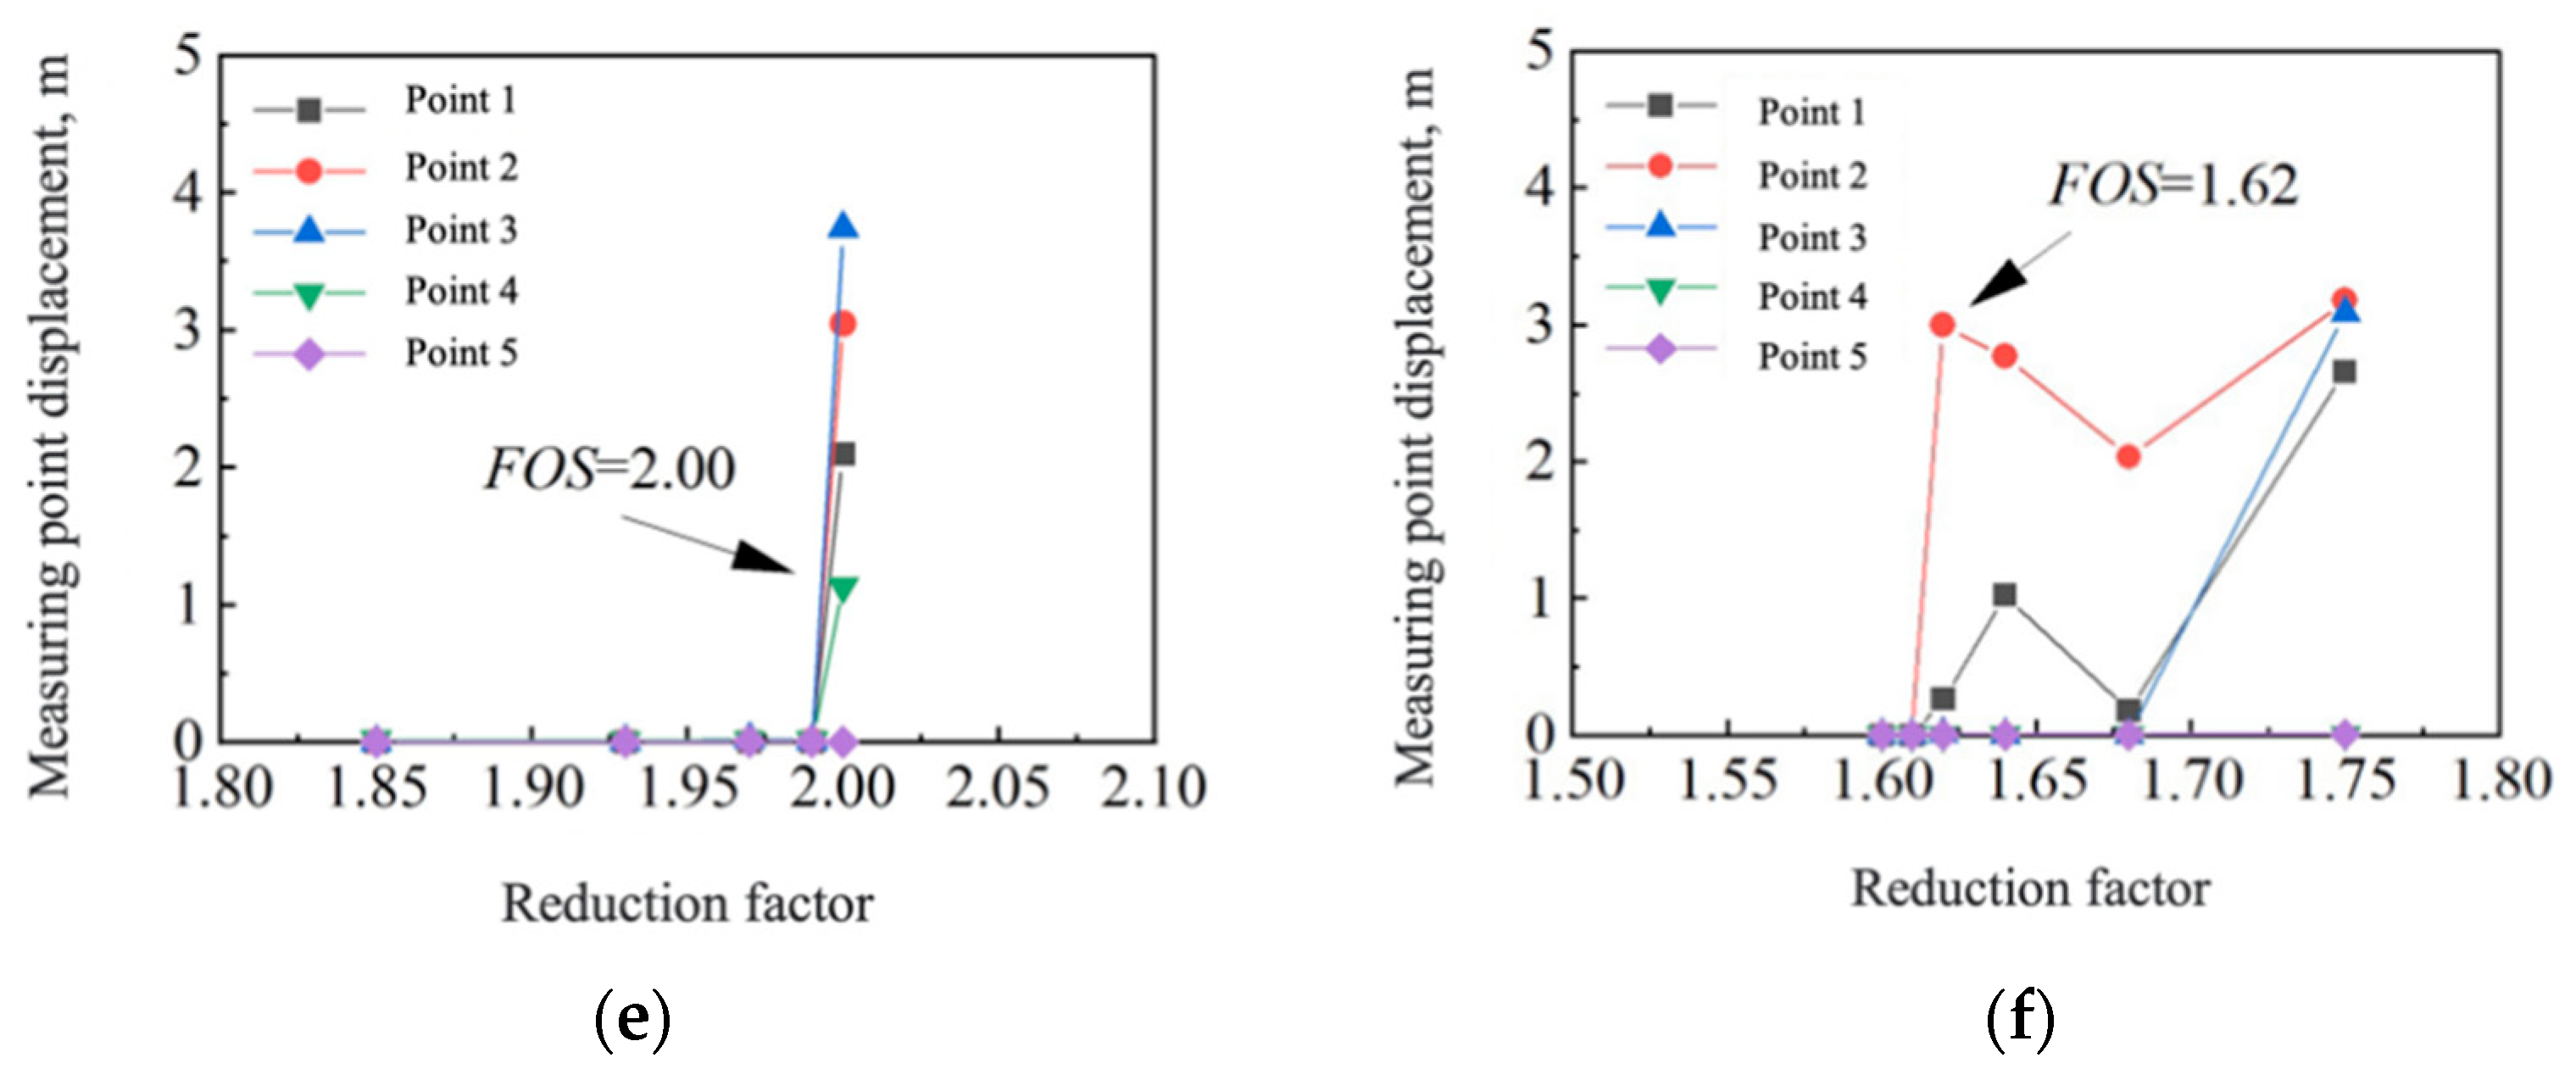
The analysis shows that the displacements at the measuring points, evaluated after 100,000 iterations, accurately indicate the instability of the slope in relation to the corresponding reduction factor. Hence, the number of iterations following each reduction is set as 100,000. Figure 11 illustrates the displacement of individual measuring points on the slope of the expansive soil at different stages throughout the wetting–drying cycle. The data indicate a significant increase in in the displacement at each measurement point when the strength reduction coefficient approaches the critical value. The safety factor of the slope can be calculated using these displacement data.
Table 5 provides a comprehensive overview of the safety factors associated with expansive soil slopes under various wetting–drying cycles. Initially, the safety factor of the expansive soil slopes without any wetting–drying cycle is about 3.30. After the first wetting–drying cycle, it decreases to 3.22. The safety factor decreases to 2.91 after the second cycle, and subsequently drops to 2.23 after three cycles. These findings suggest that the safety factor decreases at an increasing rate as the number of wetting–drying cycles increases. After undergoing four to five cycles, the decrease in the safety factor becomes less significant, with respective reductions of 0.23 and 0.38.
During the initial wetting–drying process, a noticeable decrease in the strength of the expansive soil is seen. Simultaneously, a large quantity of cracks and crack connections take place, which leads to a faster deterioration in the slope’s safety factor. However, after three to five cycles of wetting and drying, the shear strength of the soil begins to reach a stable value, with a decreasing rate of crack development. Consequently, the safety factor of the slope decreases at a lower rate.

4.3. Comparison between the Limit Equilibrium Method and the Finite Element Method

4.3.1. The Slope Failure Pattern

The sliding patterns of expansive soil slopes during wetting–drying cycles were analyzed using three different methods: the limit equilibrium method, the finite element strength reduction method, and the discrete element method (DEM). The analyses presented in Figure 12, Figure 13, Figure 14 and Figure 15 offer valuable insights into the behavior of soil slopes under varying conditions.
During the initial 0 to 1 wetting–drying cycles, all three methods indicated a uniform occurrence of profound circular sliding during the initial wetting–drying cycles. The small number of wetting–drying cycles has resulted in a limited number and depth of cracks in the DEM. As a result, the integrity of the shallow soil of the slope remains high. The presence of these cracks has little effect on the safety factor or sliding surface of the slope. The various calculation methods used indicate similar sliding conditions for expansive soil slopes.
After three wetting–drying cycles, the DEM simulations revealed an obvious occurrence of cracks in the slope, which had a substantial impact on the properties of the sliding surface. More precisely, the DEM showed a relatively shallow sliding pattern, which differed from the deep circular sliding pattern that was still evident in the limit equilibrium and finite element strength reduction methods.
After five wetting–drying cycles, shallow landslides occurred in all three methods. This highlights the pronounced effect of multiple wetting–drying cycles on the stability and failure mechanisms of expansive soil slopes.

4.3.2. The Slope Safety Factor

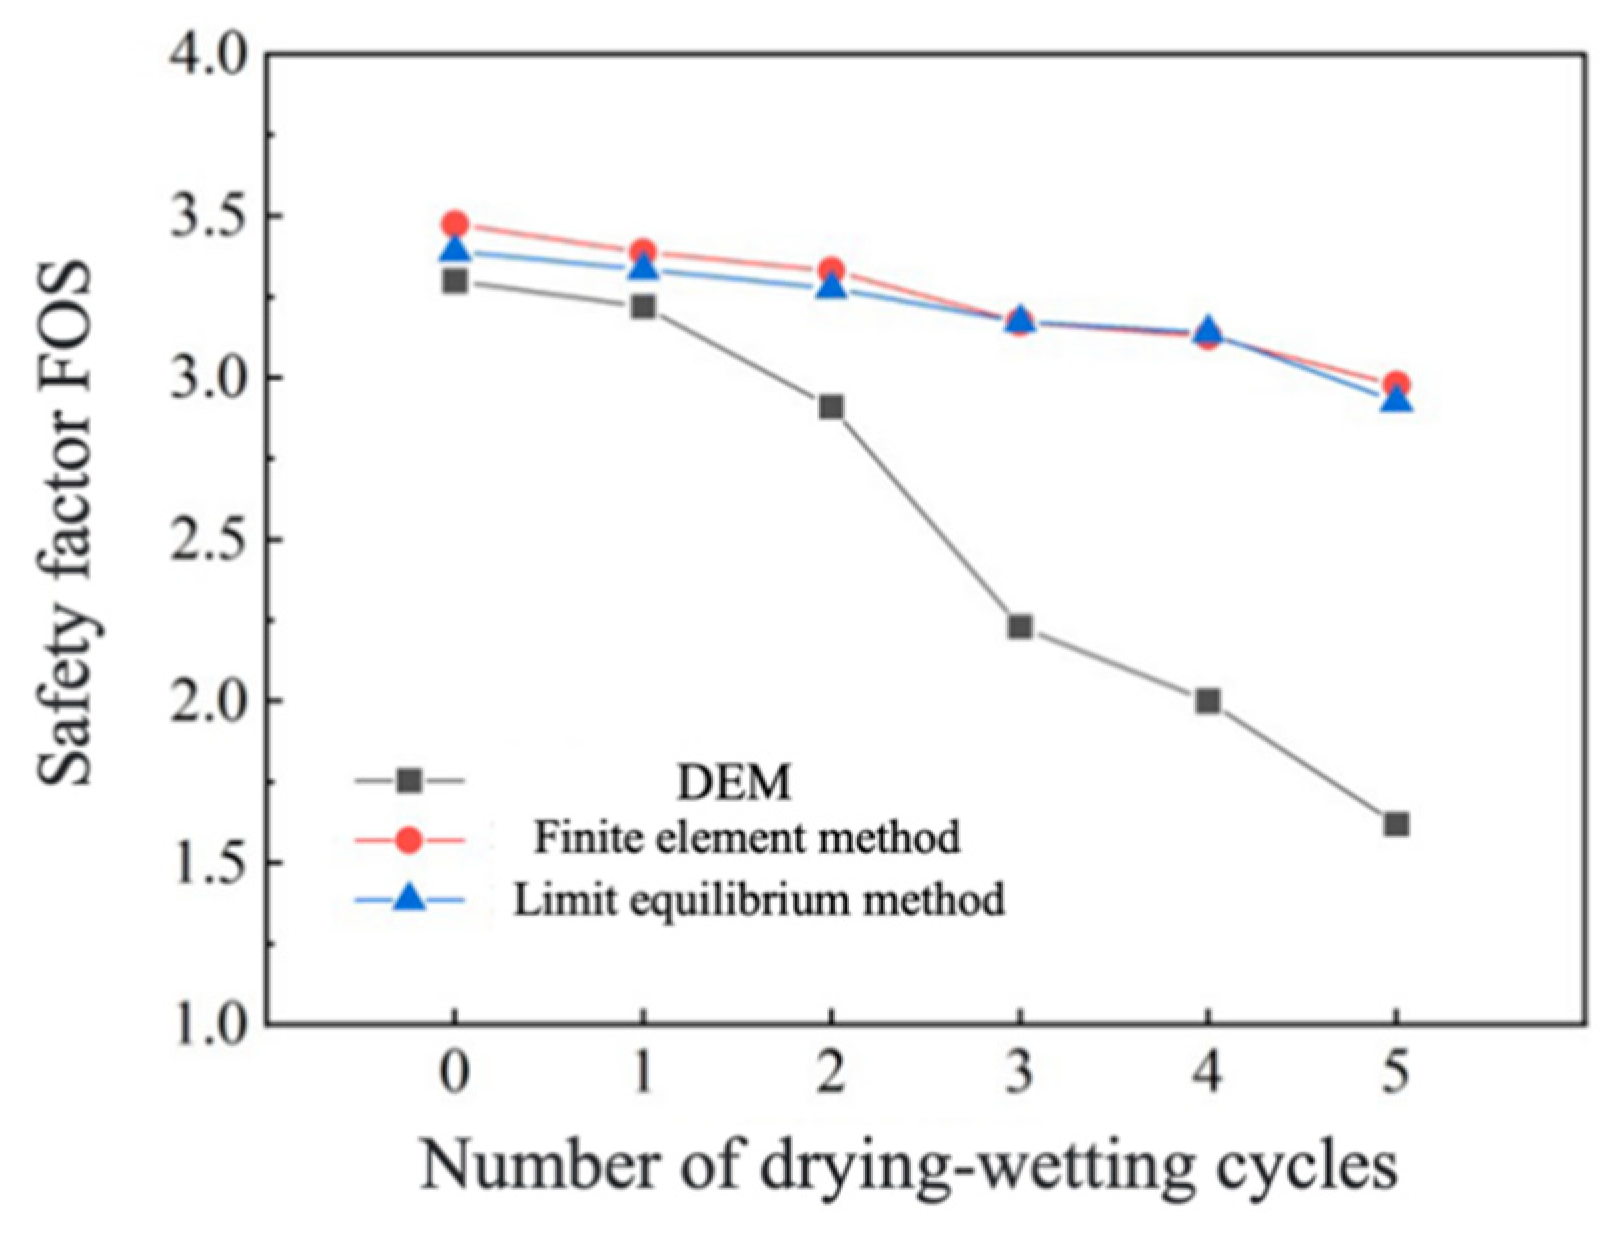
The safety factors of expansive soil slopes, as obtained from different methods, are presented in Figure 16 and summarized in Table 6. The DEM yields a smaller safety factor, decreasing from 3.30 to 1.68. Similar trends are observed with the limit equilibrium method and the finite element strength reduction method, starting with initial values of 3.385 and 3.475, respectively. With an increase in the number of wetting–drying cycles, the safety coefficient gradually decreases with minimal variations. Specifically, the results of the limit equilibrium method decrease by 0.459, from 3.385 to 2.926, while the results of the finite element method decrease by 0.459, from 3.475 to 2.978.
In the case of the expansive soil slopes without any wetting–drying cycles, the slope safety factors obtained by the DEM were similar to those obtained by the limit equilibrium method and finite element method. Note that the model parameters in the DEM are calibrated through biaxial tests. The macro and micro transformation formula in the material training function is specifically applicable to the compact regular packing model of spheroidal elements. Randomly packed particles typically exhibit macro mechanical properties that are lower than the values predicted by the other two methods. Additionally, the calculation results of the DEM are still comparable to those of the other methods, with only a negligible discrepancy. This validates the effectiveness of the discrete element strength reduction technique in computing slope safety factors.
Comparatively, in the case of the expansive soil slopes undergoing several cycles of wetting–drying cycles, similar results were obtained by the limit equilibrium method and finite element strength reduction method: the safety factor slightly decreased as the increasing number of wetting–drying cycles did. However, the reduction in soil strength was only considered in the crack zone. Conversely, the DEM took into account both the reduction in soil strength and the evolution of cracks in the soil slope during the drying and wetting cycles. Therefore, the safety factor determined by the DEM is considerably lower than that of the other two methods. The results indicate that when dealing with the stability analysis of expansive soil slopes, it is essential to study the impact of swelling and shrinking cracks on slope stability.

5. Conclusions

This study investigated the crack evolution in the expansive soil slopes during the wetting–drying cycles by the discrete element method. Coupled with the strength discount method, the stability of expansive soil slopes under climate changes was computed in the discrete element model. The following results can be obtained:
  • The slope stability can be obtained by the discrete element strength reduction method. Compared with the calculation results of the limit equilibrium method and finite element method, a much lower stability was computed in the DEM considering the crack evolutions in the expansive soil slopes, and the effectiveness of the discrete element strength reduction method is verified.
  • The safety factor of an expansive soil slope, calculated by the discrete element strength reduction method, gradually decreases with an increase in the number of wetting–drying cycles. The decrease rate of the slope safety factor increases gradually when the number of wetting–drying cycles is between 0 and 3. However, during three to five wetting–drying cycles, the reduction rate of the slope safety factor gradually decreases and tends to stabilize. The trend in variation in the safety factor, as calculated by the DEM, differs significantly from that of the limit equilibrium method and the finite element method. As the number of wetting–drying cycles increases, the calculation results of the discrete element method are much smaller than those of the other two methods.
  • Following 0–2 wetting–drying cycles, the discrete element slope reaches a critical state, presenting a deep arc-shaped sliding surface. The sliding surface initially develops at the foot of the slope without wetting–drying cycles, and after 1–2 wetting–drying cycles, it begins with the expansion and contraction cracks at the top of the slope. After 3–5 wetting–drying cycles, the discrete element slope reaches a critical state of shallow sliding. As the number of wetting–drying cycles increases, the volume of shallow sliding soil gradually decreases, and the depth of the sliding surface decreases accordingly. There is a significant discrepancy between the sliding surface calculated using the DEM and the results obtained from the limit equilibrium method and the finite element method.
  • The study put emphasis on the evolution of cracks in the stability analysis of expansive soil slopes. Important factors were considered: not only the reduction in soil strength but also the presence, number, depth, and distribution of cracks. These factors greatly influence the stability of expansive soil slopes.

Author Contributions

Software, F.J.; Writing—original draft, H.W.; Writing—review & editing, Y.W. All authors have read and agreed to the published version of the manuscript.

Funding

The authors gratefully acknowledge the financial supports from National Key Research and Development Program of China (2019YFC1509800).

Data Availability Statement

The data presented in this study are available on request from the corresponding author.

Conflicts of Interest

The authors declare no conflicts of interest.

Appendix A

Figure A1. Schematic diagram of unsaturated seepage calculation model.
Water 16 00861 g0a1
Figure A2. SWCC of remolded expensive soil.
Water 16 00861 g0a2
Figure A3. Permeability coefficient of unsaturated expansive soil.
Water 16 00861 g0a3
Figure A4. X-ray diffraction results of Nanyang expansive soil.
Water 16 00861 g0a4
Table A1. Mineral Composition of Nanyang expansive Soil.
Description of SampleQuartzPlagioclaseMicroclineTotal Amount of Clay Minerals
Nanyang expansive soil61%8%5%26%
Table A2. Clay minerals of Nanyang expansive soil.
Description of SampleRelative Content of Clay MineralsRatio of Mixed-Layer
SI/SItKaoCC/SI/SC/S
Nanyang expansive soil-9352--40-
Note: S is montmorillonite, It is illite, Kao is kaolinite, C is chlorite, I/S is illite-montmorillonite mixed layer, C/S is green-montmorillonite mixed layer.
Figure A5. Grain size distribution curve of Nanyang expansive soil.
Water 16 00861 g0a5

References

  1. Leng, T.; Tang, C.S.; Xu, D.; Li, Y.S.; Zhang, Y.; Wang, J.; Shi, B. Advance on the Engineering Geological Characteristics of Expansive Soil. J. Eng. Geol. 2018, 26, 112–128. [Google Scholar] [CrossRef]
  2. Tiwari, N.; Satyam, N. Coupling Effect of Pond Ash and Polypropylene Fiber on Strength and Durability of Expansive Soil Subgrades: An Integrated Experimental and Machine Learning Approach. Rock Mech. Geotech 2021, 13, 1101–1112. [Google Scholar] [CrossRef]
  3. Tang, C.S.; Shi, B.; Liu, C. Study on Desiccation Cracking Behavior of Expansive Soil. J. Eng. Geol. 2012, 20, 663–673. [Google Scholar] [CrossRef]
  4. Cao, L.; Wang, Z.J.; Zhang, Z.H. Experimental Research of the Cracking Process of Expansive Soil under Rainfall Infiltration and Evaporation. Chin. J. Rock Mech. Eng. 2016, 35, 413–421. [Google Scholar] [CrossRef]
  5. Xu, B.; Yin, Z.Z.; Liu, S.L. Experimental Study of Factors Influencing Expansive Soil Strength. Rock Soil Mech. 2011, 32, 44–50. [Google Scholar] [CrossRef]
  6. Lu, Y.; Liu, S.; Weng, L.; Wang, L.; Li, Z.; Xu, L. Fractal Analysis of Cracking in a Clayey Soil under Freeze–Thaw Cycles. Eng. Geol. 2016, 208, 93–99. [Google Scholar] [CrossRef]
  7. Khan, M.S.; Hossain, S.; Ahmed, A.; Faysal, M. Investigation of a Shallow Slope Failure on Expansive Clay in Texas. Eng. Geol. 2016, 219, 118–129. [Google Scholar] [CrossRef]
  8. Xie, C.R.; Ni, P.P.; Xu, M.J.; Mei, G.X.; Zhao, Y.L. Combined Measure of Geometry Optimization and Vegetation for Expansive Soil Slopes. Comput. Geotech. 2020, 123, 103588. [Google Scholar] [CrossRef]
  9. Zhang, J.M.; Luo, Y.; Zhou, Z.; Chong, L.; Victor, C.; Zhang, Y.F. Effects of Preferential Flow Induced by Desiccation Cracks on Slope Stability. Eng. Geol. 2021, 288, 106164. [Google Scholar] [CrossRef]
  10. Wang, G.L.; Chen, S.S.; Xu, G.M. Centrifuge Model Test on Stability of Expansive Soil Slope under Alternation between Drying and Wetting. Hydro-Sci. Eng. 2005, 2005, 6–10. [Google Scholar] [CrossRef]
  11. Chen, S.S.; Zheng, C.F.; Wan, G.L. Researches on Long-Term Strength Deformation Characteristics and Stability of Expansive Soil Slopes. Chin. J. Geotech. Eng. 2007, 29, 795–799. [Google Scholar] [CrossRef]
  12. Cui, W.; Zhang, Z.G.; Yan, S.W. Cyclic Behavior of Expansive Soils and Its Application in Slope Stability Analysis. J. Water Resour. Archit. Eng. 2010, 8, 4. [Google Scholar] [CrossRef]
  13. Fan, Q.Y.; Liu, J.Q.; Yang, D.S.; Yuan, J.Q. Model Test Study of Expansive Rock Slope under Different Types of Precipitation. Rock Soil Mech. 2016, 37, 3401–3409. [Google Scholar] [CrossRef]
  14. Cai, Z.Y.; Chen, H.; Huang, Y.H.; Zhang, C. Failure Mechanism of Canal Slopes of Expansive Soils Considering Action of Wetting-Drying Cycles. Chin. J. Geotech. Eng. 2019, 41, 1977–1982. [Google Scholar] [CrossRef]
  15. Luo, Y.; Zhang, J.M.; Zhi, Z.; Victor, C.; Shen, J. Evolution Law of Critical Moisture Content of Soil Cracking under Rainfall-Evaporation Conditions. Rock Soil Mech. 2020, 41, 2592–2600. [Google Scholar] [CrossRef]
  16. Zhou, Z.; Zhang, J.M.; Ning, F.L.; Luo, Y.; Wang, J.L. Temporal and Spatial Characteristics of Moisture Migration and Instability Mechanism of Cracked Soil Slope under Rainfall Infiltration. Traffic Transp. Eng. 2020, 20, 107–119. [Google Scholar] [CrossRef]
  17. Zhang, H.; Yang, J.; Wang, L.; Xu, Y. Model Test on the Dynamic Characteristics of Crack Formation in Expansive Soil Slopes under Alternate Drying and Wetting. Acta Geotech. 2022, 18, 2097–2115. [Google Scholar] [CrossRef]
  18. Zhang, J.M.; Luo, Y.; Zhou, Q.; Victor, C.; Yuan, C.; Wang, S.F. Evolution Law of Cracks Based on Full-Scale Model Test of Slope. J. Cent. South Univ. 2021, 51, 1037–1048. [Google Scholar] [CrossRef]
  19. Yao, Z.; Chen, Z.H.; Fang, X.F.; Huang, X.F. Elastoplastic Damage Seepage-Consolidation Coupled Model of Unsaturated Intact Loess and Its Application. Rock Soil Mech. 2019, 40, 216–226. [Google Scholar] [CrossRef]
  20. Jin, Y.F.; Yin, Z.Y.; Yuan, W.H. Simulating Retrogressive Slope Failure Using Two Different Smoothed Particle Finite Element Methods: A Comparative Study. Eng. Geol. 2020, 279, 105870. [Google Scholar] [CrossRef]
  21. Shen, J.; Karakus, M. Three-Dimensional Numerical Analysis for Rock Slope Stability Using Shear Strength Reduction Method. Can. Geotech. J. 2014, 51, 164–172. [Google Scholar] [CrossRef]
  22. Qu, C.X.; Wang, G.; Feng, K.; Xia, Z.D. Large Deformation Analysis of Slope Failure Using Material Point Method with Cross-Correlated Random Fields. J. Zhejiang Univ. Sci. A 2021, 22, 856–869. [Google Scholar] [CrossRef]
  23. Feng, K.; Huang, D.; Wang, G. Two-Layeer Material Point Method for Modeling Soil-Water Interaction in Unsaturated Soils and Rainfall-Induced Slope Failure. Acta Geotech. 2021, 16, 2529–2551. [Google Scholar] [CrossRef]
  24. Feng, K.; Wang, G.; Huang, D.; Jin, F. Material Point Method for Large-Deformation Modeling of Coseismic Landslide and Liquefaction-Induced Dam Failure. Soil Dyn. Earthq. Eng. 2021, 150, 106907. [Google Scholar] [CrossRef]
  25. Yang, Y.; Xu, D.; Liu, F.; Zheng, H. Modeling the Entire Progressive Failure Process of Rock Slopes Using a Strength-Based Criterion. Comput. Geotech. 2020, 126, 103726. [Google Scholar] [CrossRef]
  26. Zhou, J.; Xu, H.Z.; Hu, W.J. Impact of Wetting-Drying Cycle Effects on Stability of Expansive Soil Slopes. Chin. J. Geotech. Eng. 2013, 35, 152–156. [Google Scholar]
  27. Zhou, J.; Wang, J.Q.; Zeng, Y.; Jia, M.C. Slope Safety Factor by Methods of Particle Flow Code Strength Reduction and Gravity Increase. Rock Soil Mech. 2009, 30, 1549–1554. [Google Scholar] [CrossRef]
  28. Liao, J.W. Slope Stability Analysis of Silty Clay Particle Flow Based on Strength Reduction Method; Chongqing University: Chongqing, China, 2014. [Google Scholar]
  29. Song, K.; Wu, S.G.; Zhang, S.P. Progressive Failure Analysis of Accumulation Slope Based on Discrete Element Strength Reduction Method; Springer: Singapore, 2018; pp. 873–881. [Google Scholar]
  30. Ma, X. Numerical Simulation of Desiccation Cracking in the Cross Section of Clay Soil; Wuhan University: Wuhan, China, 2018. [Google Scholar]
  31. Chen, X.; Jing, X.; Li, X.; Chen, J.; Ma, Q.; Liu, X. Slope Crack Propagation Law and Numerical Simulation of Expansive Soil under Wetting–Drying Cycles. Sustainability 2023, 15, 5655. [Google Scholar] [CrossRef]
  32. Liu, C.; David, D.P.; Gu, K.; Shi, B. Mechanism of Formation of Wiggly Compaction Bands in Porous Sandstone: 2. Numerical Simulation Using Discrete Element Method. J. Geophys. Res. Solid Earth 2015, 120, 8153–8168. [Google Scholar] [CrossRef]
  33. Gianvito, S.; Fan, X.M.; Xu, Q.; Liu, C.; Chaojun, O.Y.; Guillem, D.; Fan, Y.; Dai, L.X. Some Considerations on the Use of Numerical Methods to Simulate Past Landslides and Possible New Failures: The Case of the Recent Xinmo Landslide (Sichuan, China). Landslides 2018, 15, 1359–1375. [Google Scholar] [CrossRef]
  34. Qin, Y.; Liu, C.; Zhang, X.Y.; Wang, X.G.; Deng, S. A Three-Dimensional Discrete Element Model of Triaxial Tests Based on a New Flexible Membrane Boundary. Sci. Rep. 2021, 11, 4753. [Google Scholar] [CrossRef] [PubMed]
  35. Luo, H.; Xing, A.; Jin, K.; Xu, S.M.; Zhuang, Y. Discrete Element Modeling of the Nayong Rock Avalanche, Guizhou, China Constrained by Dynamic Parameters from Seismic Signal Inversion. Rock Mech. Rock Eng. 2021, 54, 1629–1645. [Google Scholar] [CrossRef]
  36. Xue, Y.; Zhou, J.; Liu, C.; Far, M.S.; Zhang, J. Rock Fragmentation Induced by a TBM Disc-Cutter Considering the Effects of Joints: A Numerical Simulation by DEM. Comput. Geotech. 2021, 136, 104230. [Google Scholar] [CrossRef]
  37. Liu, C. Discrete Element Analysis of Geological and Geotechnical Engineering Matrix; Science Press: Beijing, China, 2019. [Google Scholar]
  38. Yin, Z.Z.; Wei, J.; Yuan, J.P.; Cao, X.S. Mechanism of Slope Slide of Expansive Soil and Reinforcement for the Slope. J. Hydraul. Eng. 2010, 41, 1–6. [Google Scholar] [CrossRef]
  39. Yin, Z.Z.; Yuan, J.P.; Wei, J.; Cao, X.S.; Liu, H.Q.; Xu, B. Influences of Cracks on Slope Stability of Expansive Soil. Chin. J. Geotech. Eng. 2012, 34, 2155–2161. [Google Scholar]
  40. Zeng, Y. Microscopic Mechanics of Soil Failure and PFC Numerical Simulation; Tongji University: Shanghai, China, 2006. [Google Scholar]
  41. Zhan, L.T.; Ng Charles, W.W.; Fredlund Del, G. Field Study of Rainfall Infiltration into a Grassed Unsaturated Expansive Soil Slope. Can. Geotech. J. 2007, 44, 392–408. [Google Scholar] [CrossRef]
Figure 1. (a) Normal connection between elements; (b) tangential connection between elements.
Water 16 00861 g001
Figure 2. Discrete element particles simulate the swelling and shrinkage of expansive soil in the wetting–drying cycle.
Water 16 00861 g002
Figure 3. (a) Measuring points layout of the discrete element slope model; (b) discrete element slope model.
Water 16 00861 g003
Figure 4. Division of crack area of expansive soil slopes.
Water 16 00861 g004
Figure 5. Displacement diagrams of expansive soil slopes without wetting–drying cycle: (a) at 25,000 time steps, (b) at 50,000 time steps, (c) at 75,000 time steps, (d) at 100,000 time steps.
Water 16 00861 g005
Figure 6. Displacement diagrams of expansive soil slopes after one cycle of wetting–drying: (a) at 25,000 time steps, (b) at 50,000 time steps, (c) at 75,000 time steps, (d) at 100,000 time steps.
Water 16 00861 g006
Figure 7. Displacement diagrams of expansive soil slopes after two cycles of wetting–drying: (a) at 25,000 time steps, (b) at 50,000 time steps, (c) at 75,000 time steps, (d) at 100,000 time steps.
Water 16 00861 g007
Figure 8. Displacement diagrams of expansive soil slopes after three cycles of wetting–drying: (a) at 25,000 time steps, (b) at 50,000 time steps, (c) at 75,000 time steps, (d) at 100,000 time steps.
Water 16 00861 g008
Figure 9. Displacement diagrams of expansive soil slopes after four cycles of wetting–drying: (a) at 25,000 time steps, (b) at 50,000 time steps, (c) at 75,000 time steps, (d) at 100,000 time steps.
Water 16 00861 g009
Figure 10. Displacement diagrams of expansive soil slopes after five cycles of wetting–drying: (a) at 25,000 time steps, (b) at 50,000 time steps, (c) at 75,000 time steps, (d) at 100,000 time steps.
Water 16 00861 g010
Figure 11. Relationship between displacement and reduction coefficient of slope measuring points after different times of wetting–drying cycles: (a) without wetting–drying cycle, (b) the first cycle of wetting–drying, (c) the second cycle of wetting–drying, (d) the third cycle of wetting–drying, (e) the fourth cycle of wetting–drying, (f) the fifth cycle of wetting–drying.
Water 16 00861 g011aWater 16 00861 g011b
Figure 12. Position of sliding surface of expansive soil slopes without wetting–drying cycle: (a) DEM, (b) limit equilibrium method, (c) finite element method.
Water 16 00861 g012
Figure 13. Position of sliding surface of expansive soil slopes after one wetting–drying cycle: (a) DEM, (b) limit equilibrium method, (c) finite element method.
Water 16 00861 g013
Figure 14. Position of sliding surface of expansive soil slopes after three wetting–drying cycle: (a) DEM, (b) limit equilibrium method, (c) finite element method.
Water 16 00861 g014
Figure 15. Position of sliding surface of expansive soil slopes after five wetting–drying cycles: (a) DEM, (b) limit equilibrium method, (c) finite element method.
Water 16 00861 g015
Figure 16. Variation trend of safety factors of expansive soil slopes after different times of wetting–drying cycles.
Water 16 00861 g016
Table 1. Basic physical properties of Nanyang expansive soil.
PropertiesValues
Specific gravity ( g · c m 3 ) 2.74
Liquid limit ( % ) 47.4
Plastic limit ( % ) 25.3
Plasticity index22.1
Undisturbed soil dry density ( g · c m 3 ) 1.60
Undisturbed soil moisture content (w/ % )20.0
Free swelling rate ( % )52.0
Table 2. Macroscopic mechanical parameters of Nanyang expansive soil.
Density
ρ / ( g · c m 3 )
Young’s Modulus E/(Mpa)Poisson Ratio
v
Tensile Strength
T u /(kpa)
Compressive Strength
C u /(kpa)
Coefficient   of   Internal   Friction   μ i
1.9212.00.3107.38192.260.4006
Table 3. Granular meso-parameters of slope model.
Time of Wetting–Drying Cycle K u /(kPa) K s /(kPa) X b /mm F s 0 /N u p
0673.83116.180.122055.900.1772
134.980.1910
226.270.1761
325.190.1472
424.510.1462
522.610.1457
Table 4. Depth of crack area in the model.
Time of Wetting–Drying CycleDepth of Crack Zone/mm
00
1450
2800
31450
41600
51900
Table 5. Calculation results of the safety factor of expansive soil slope in DEM.
Time of Wetting-Drying CycleSlope Safety Factor
03.30
13.22
22.91
32.23
42.00
51.62
13.30
Table 6. The values of safety factor of expansive soil slopes.
Time of Wetting-Drying CycleDEMLimit Equilibrium MethodThe Finite Element Method
03.303.3853.475
13.223.3403.388
22.913.2753.331
32.233.1743.172
42.003.1403.128
51.622.9262.978
Disclaimer/Publisher’s Note: The statements, opinions and data contained in all publications are solely those of the individual author(s) and contributor(s) and not of MDPI and/or the editor(s). MDPI and/or the editor(s) disclaim responsibility for any injury to people or property resulting from any ideas, methods, instructions or products referred to in the content.