Research on the Characteristics of Flow Velocity of a Piped Car when Starting in a Straight Pipe Section under Different Loads
Abstract
1. Introduction
2. Experimental Design
2.1. Structure of the Piped Car
2.2. Test System
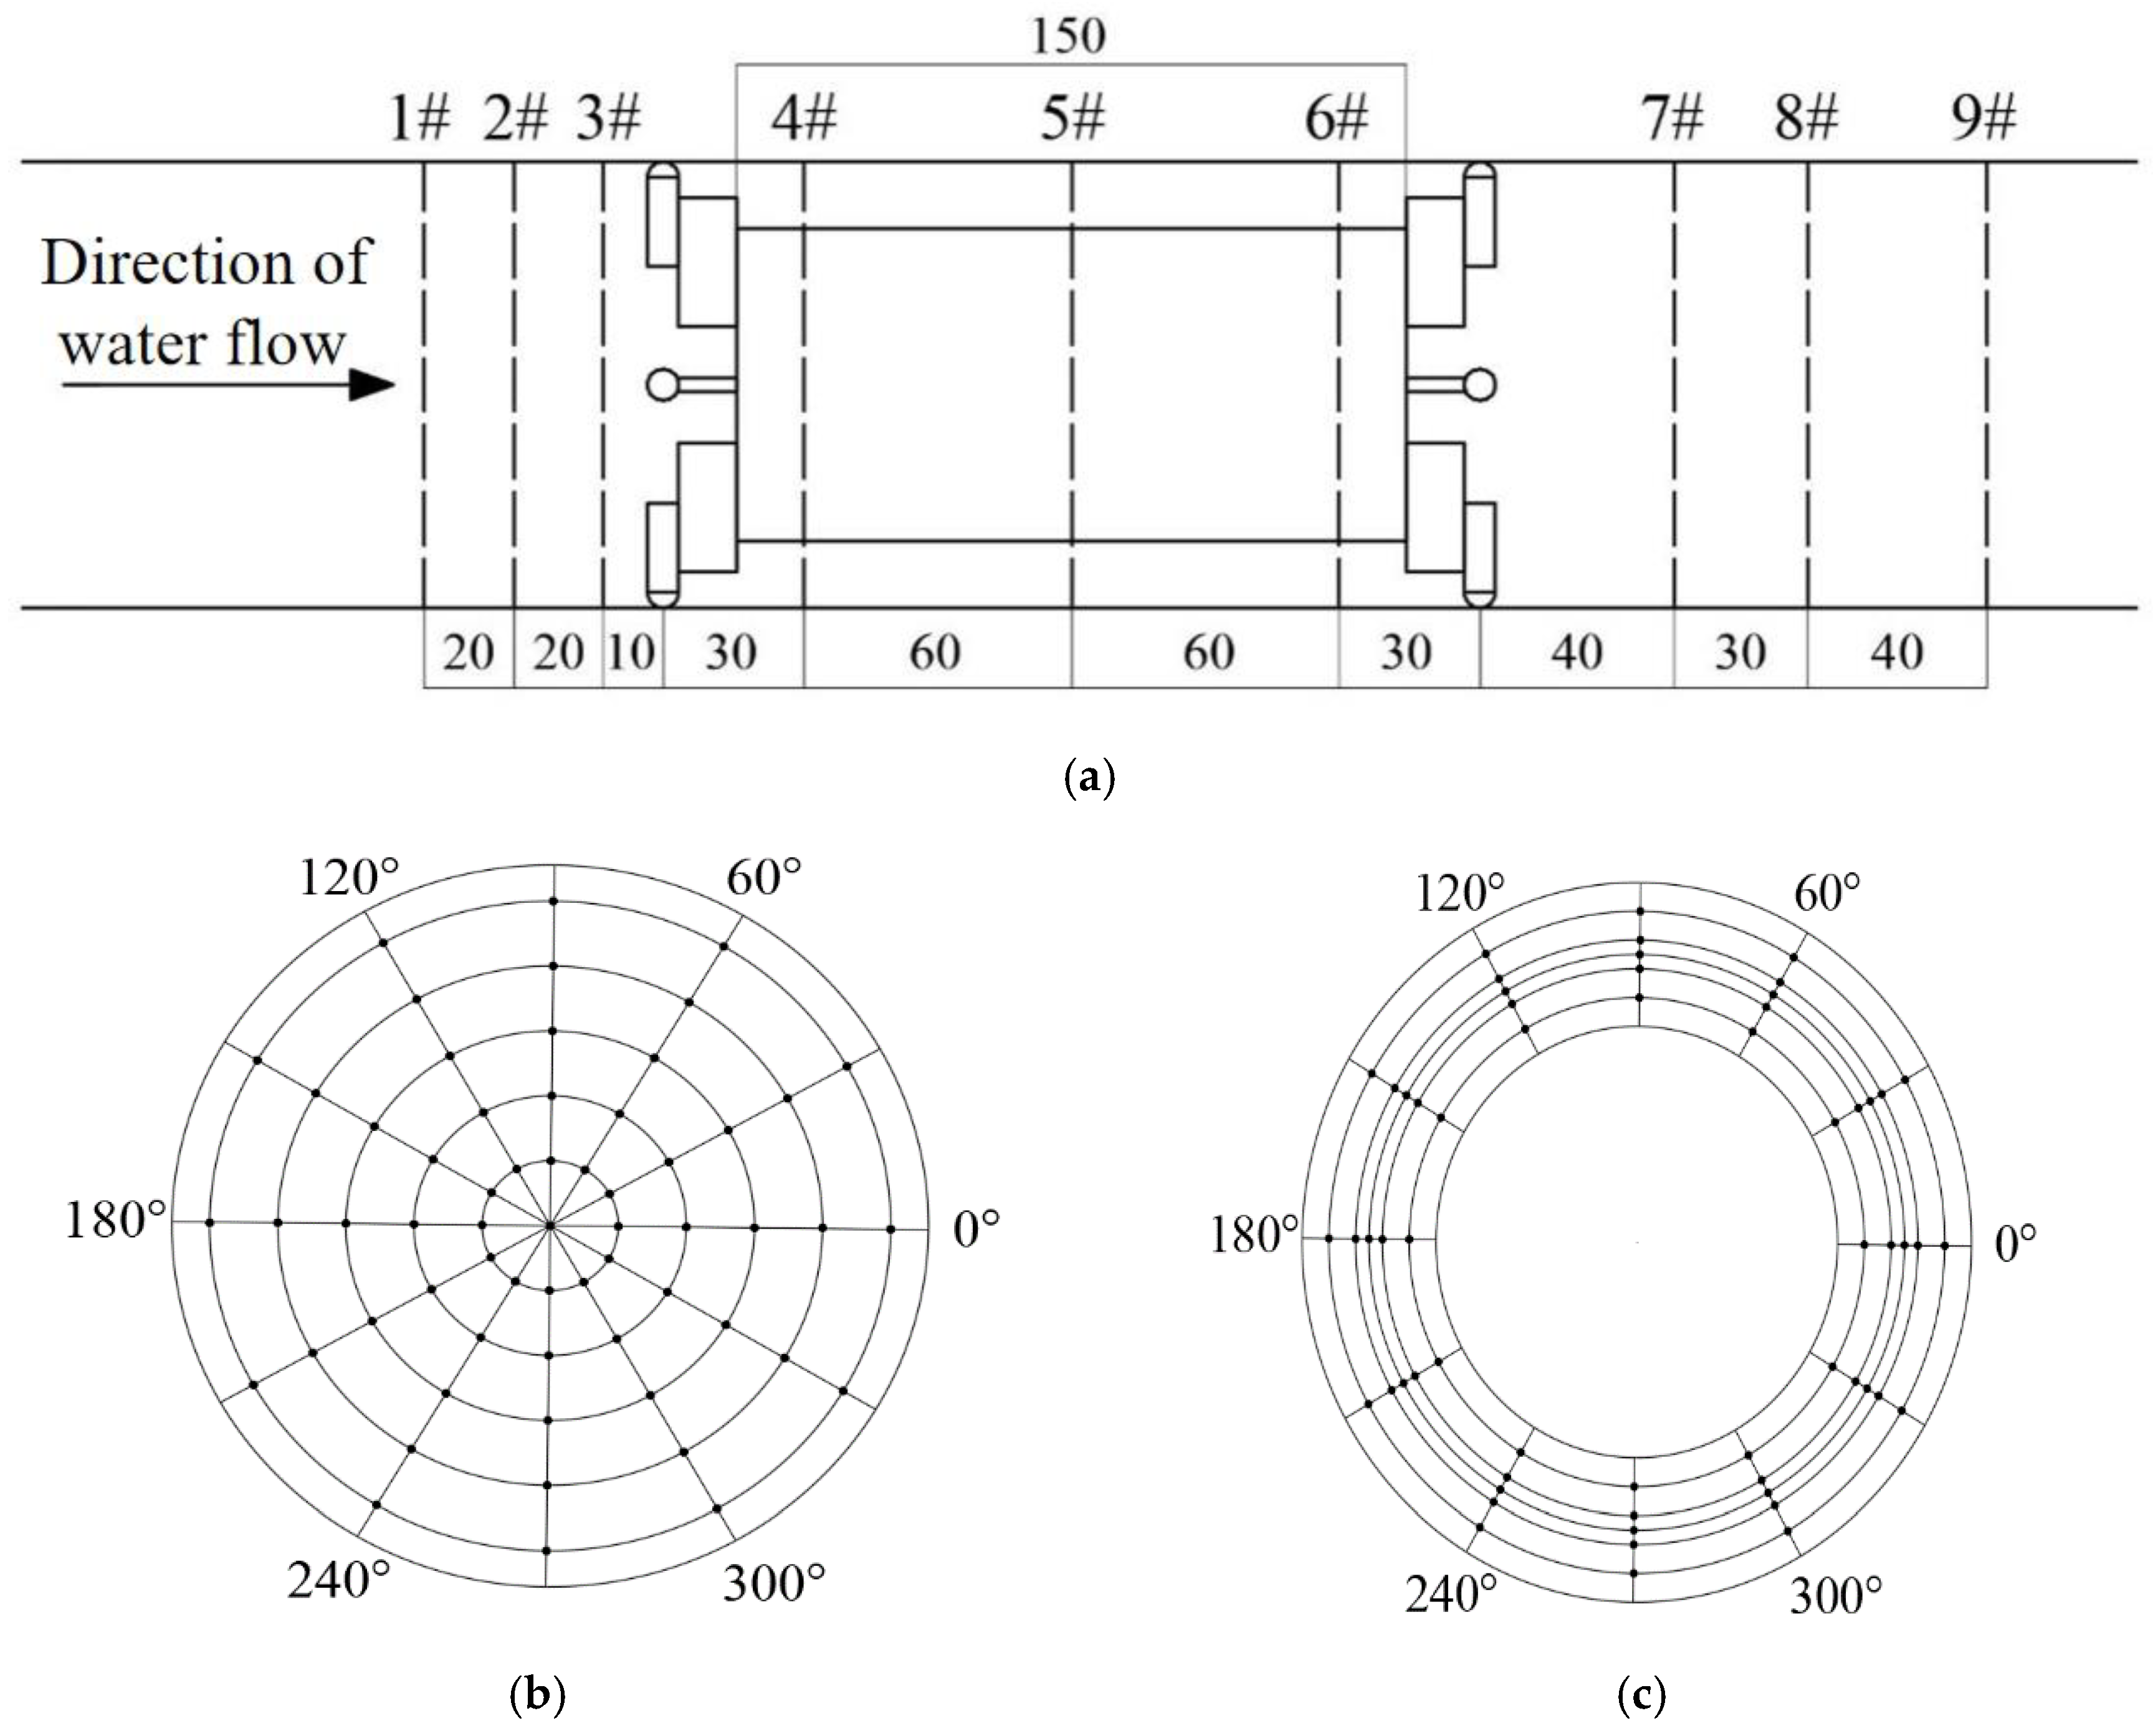
2.3. Test Section and Point Placement
2.4. Test Conditions
3. Analysis of the Test Results
3.1. Characteristics of Flow Velocity in the Front Section of the Piped Car When Starting under Different Loads
- (1)
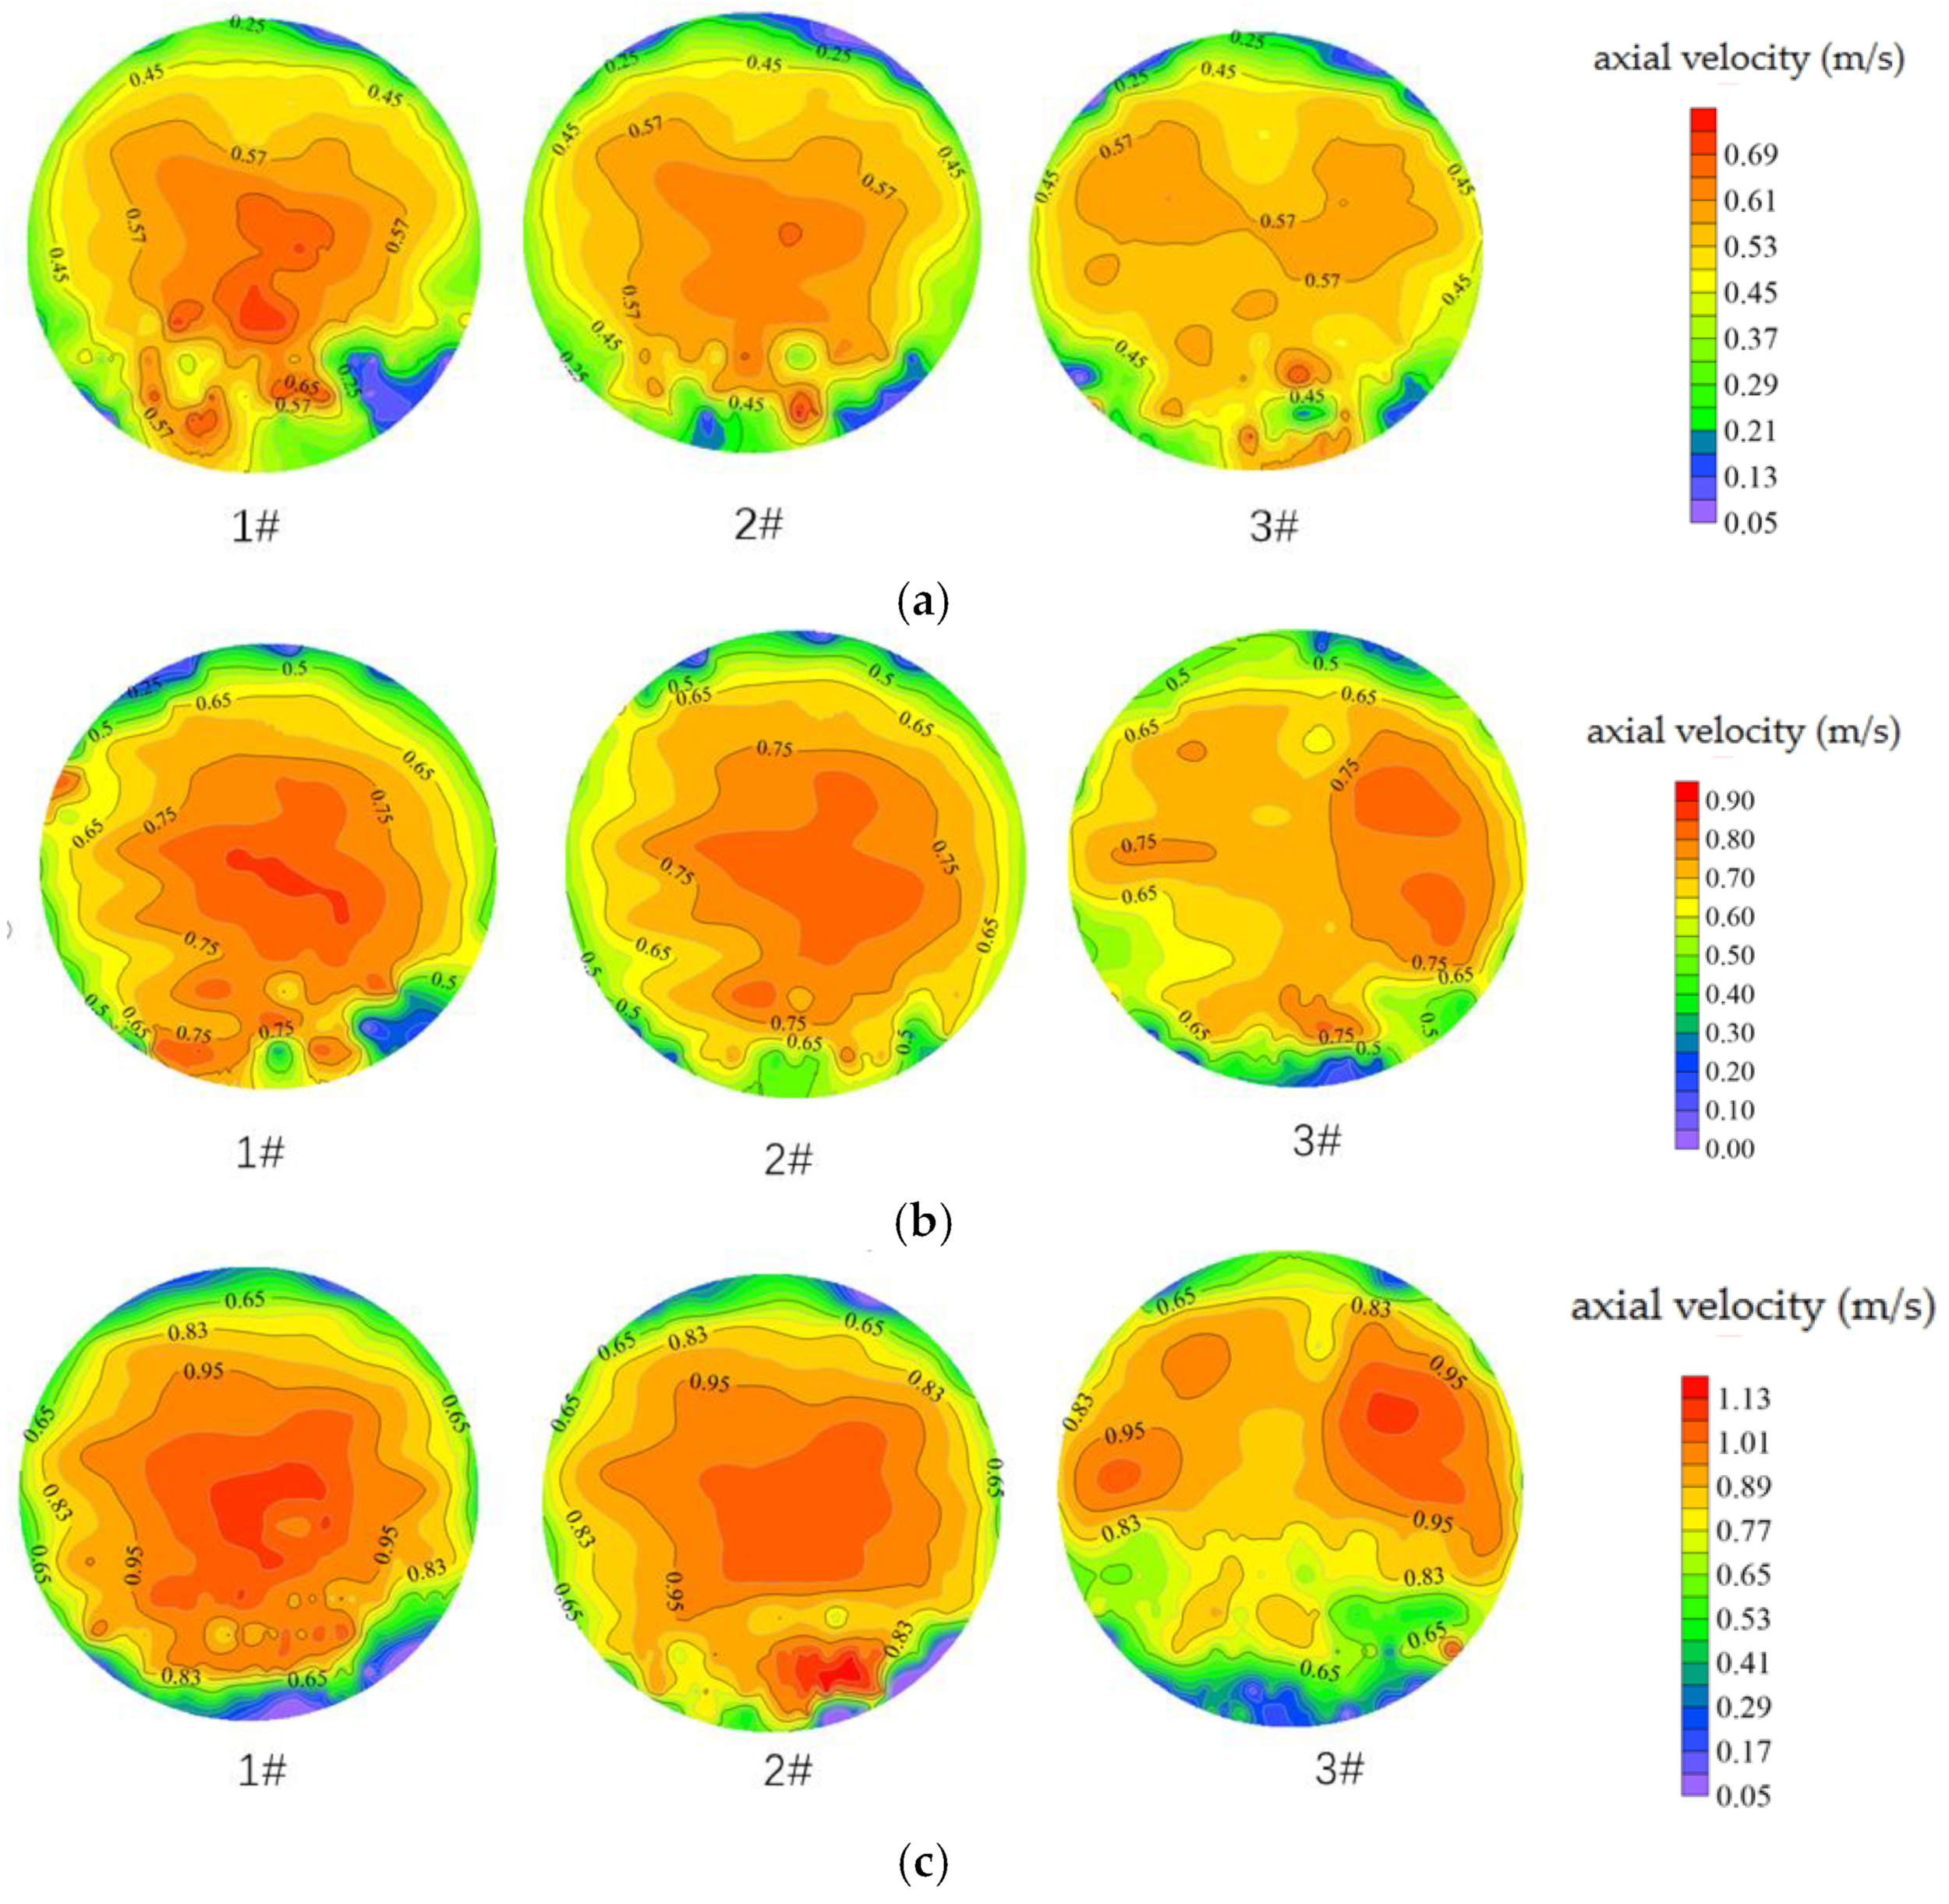
- The axial velocity distribution in the front section of the piped car is between 0.00 m/s and 1.13 m/s, and all the values are positive, indicating that the axial velocity in front of the car is the same as that in the water flow direction when the piped car starts. At the positions of section #1 and section #2 in front of the car, the axial velocity had an approximately concentric-ring-shaped distribution, the axial velocity was the largest at the center of the pipe axis, the axial velocity gradually decreased from the center of the pipe axis along the pipeline radius direction, and the axial velocity was the smallest at the wall of the pipe. This result is due to the fact that near the wall of the pipe, the flow velocity of the water is reduced due to viscous forces. When the piped car starts, the water flows into the downstream section of the pipe from the front of the car, and the water does not flow back, so the axial flow rate is less affected by the pipeline car in the positions of section #1 and section #2 in front of the car. In the position of section #3 in front of the car, the axial velocity has a rotationally symmetric distribution and is higher in the region with a measuring ring radius of 18 mm–36 mm and a polar axis of 0°–60°, while it is lower in the region with a measuring ring radius of 27 mm–36 mm and polar axes of 85°–95°, 205°–215°, and 325°–335°. Since section #3 is located 10 mm from the front foot of the piped car, the water flow is blocked by the foot of the piped car and the barrel, converting part of the kinetic energy into pressure energy, causing the axial velocity to decrease, and changing the distribution law of the flow velocity, so at the position of section #3, the piped car has a greater impact on axial velocity when it is started. For the piped car with model characteristics of L × D = 150 mm × 75 mm, the axial velocity in section #1, section #2, and section #3 in front of the car increases when the load is increased, and the gradient of the flow velocity change increases. When the load of the piped car increases from 1.5 kg to 2.3 kg, the maximum value of axial flow velocity increases by 57.53%, and the maximum value of flow velocity gradient increases by 77.1%, indicating that the increase in load has a greater effect on the axial velocity in the section in front of the car when the piped car is started.
- (2)
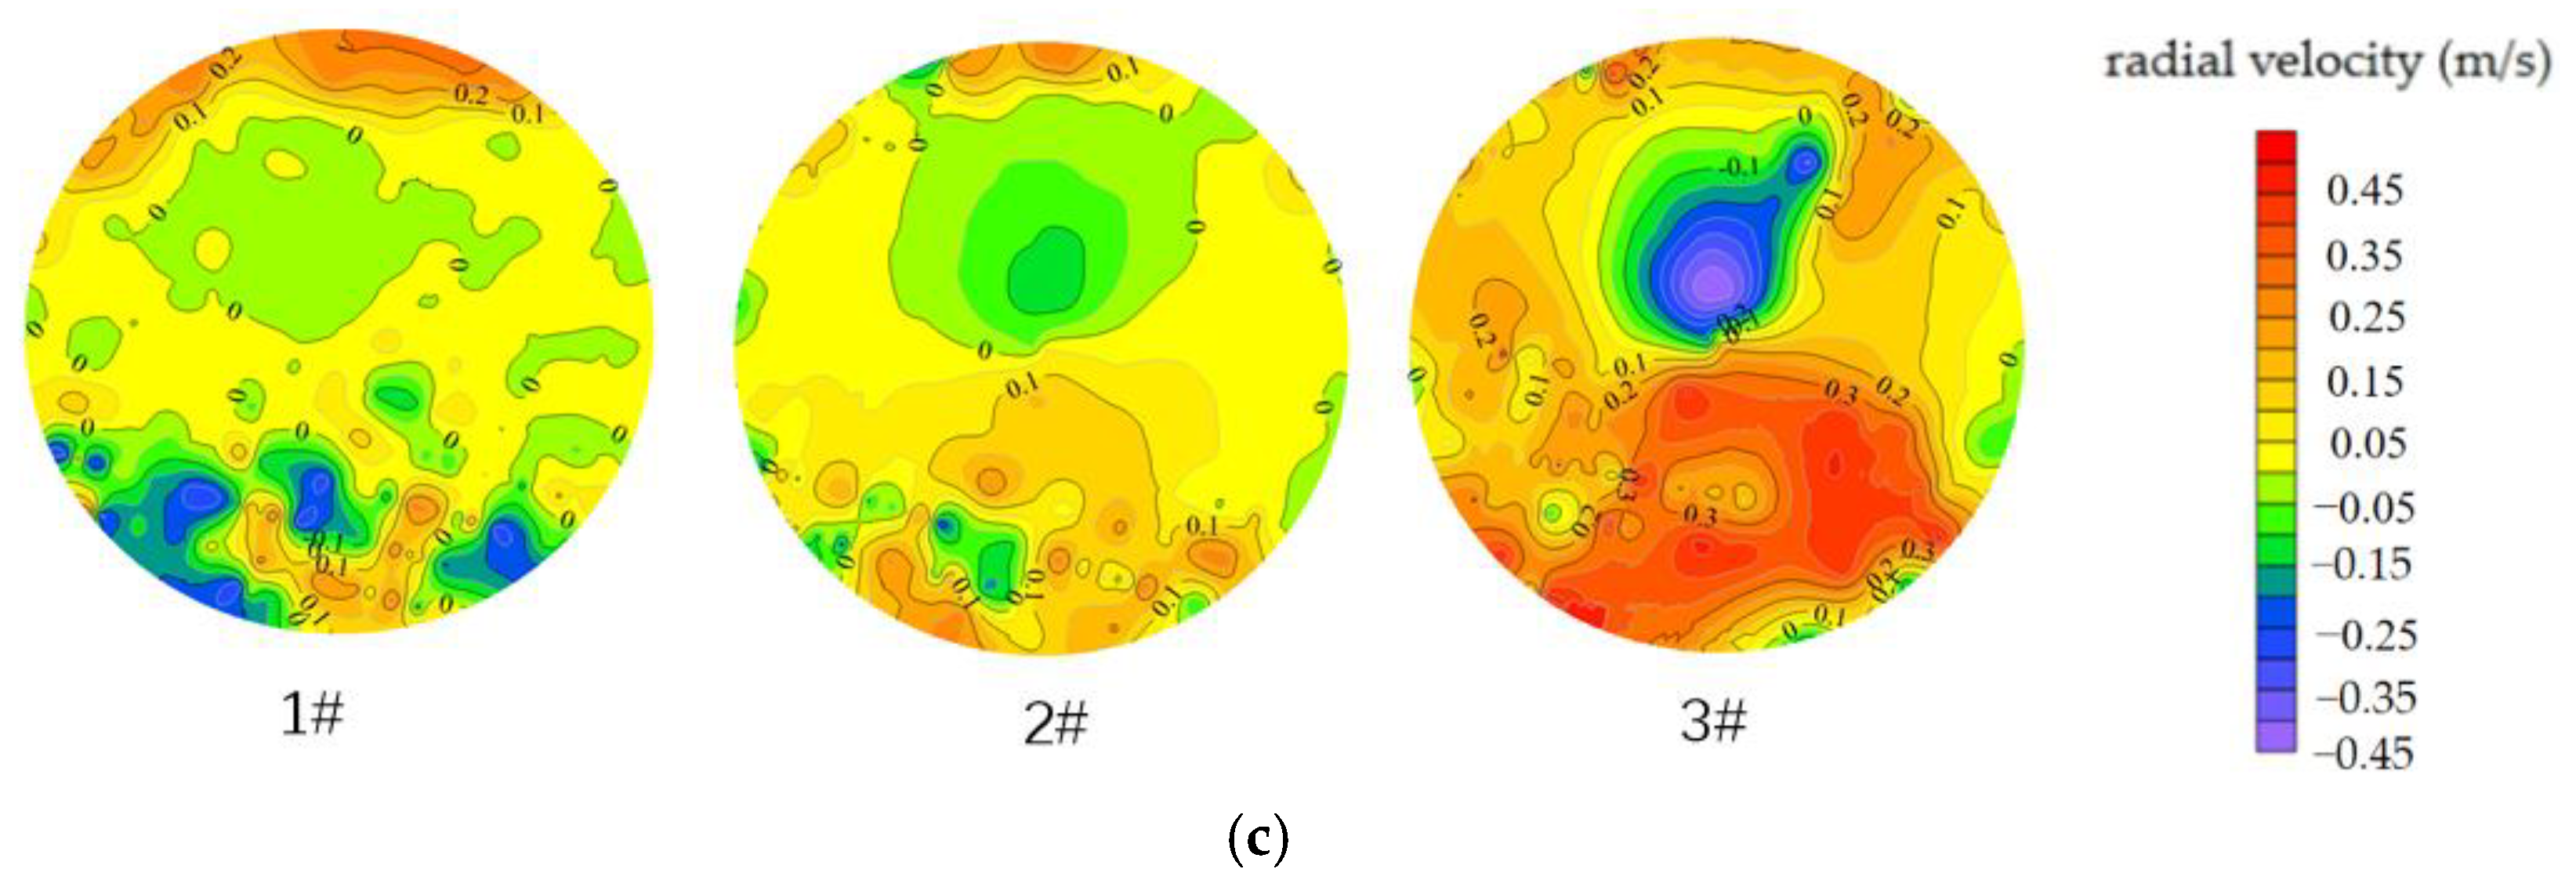
- The radial velocity distribution in the front section of the piped car is between −0.45 m/s and 0.50 m/s, and the flow velocity is both positive and negative. The positive radial velocity ranges from the center of the section along the radius to the wall of the pipeline, and the negative radial velocity ranges from the wall of the pipeline to the center of the section. At the position of section #1 and section #2 in front of the car, the positive radial velocity at the center of the sections is larger, and the negative radial velocity is smaller. Along the radius of the section from the center of the circle to the pipe wall, the absolute value of the radial velocity gradually decreases due to the influence of the viscous force on the pipe wall. At the position of section #3 in front of the car, the absolute value of radial velocity increases significantly, and the maximum radial velocity increases by 76.47% compared with the maximum radial velocity of section #2. The positive flow velocity area of the radial velocity of section #3 increases, which accounts for about 77.93% of the total area of section #3. For the piped car with L × D = 150 mm × 75 mm, when the values of load are 1.9 kg and 2.3 kg, the positive radial velocity of section #1, section #2, and section #3 in front of the car is centrally distributed in the lower side area of the sections, the negative radial velocity is centrally distributed in the upper side area of the sections, and water flows from the upper side of the pipeline to the lower side of the pipeline; when the load is 1.5 kg, the distribution of positive and negative areas of radial flow velocity is opposite: the radial flow velocity in the upper side area of section #1, section #2, and section #3 in front of the car is positive; the radial flow velocity in the lower side area is negative; and water flows from the lower side of the pipeline to the upper side of the pipeline. When the piped car models are the same and the load is increased, the absolute value of radial velocity in section #1, section #2, and section #3 increases, and the positive radial velocity area increases. At the position of section #1 and section #2, with the increase in the load of the piped car, the boundary of the distribution of the positive and negative radial flow velocity area gradually becomes fuzzy. At the position of section #3, when the load was increased from 1.5 kg to 1.9 kg, the absolute value of radial flow velocity increased by 0.02 m/s, and the change in flow velocity was small; when the load was increased from 1.9 kg to 2.3 kg, the absolute value of radial velocity increased by 0.15 m/s, and the change in flow velocity was significant. These results show that the increase in load has a greater effect on the radial velocity in the section in front of the car when the piped car starts.
- (3)
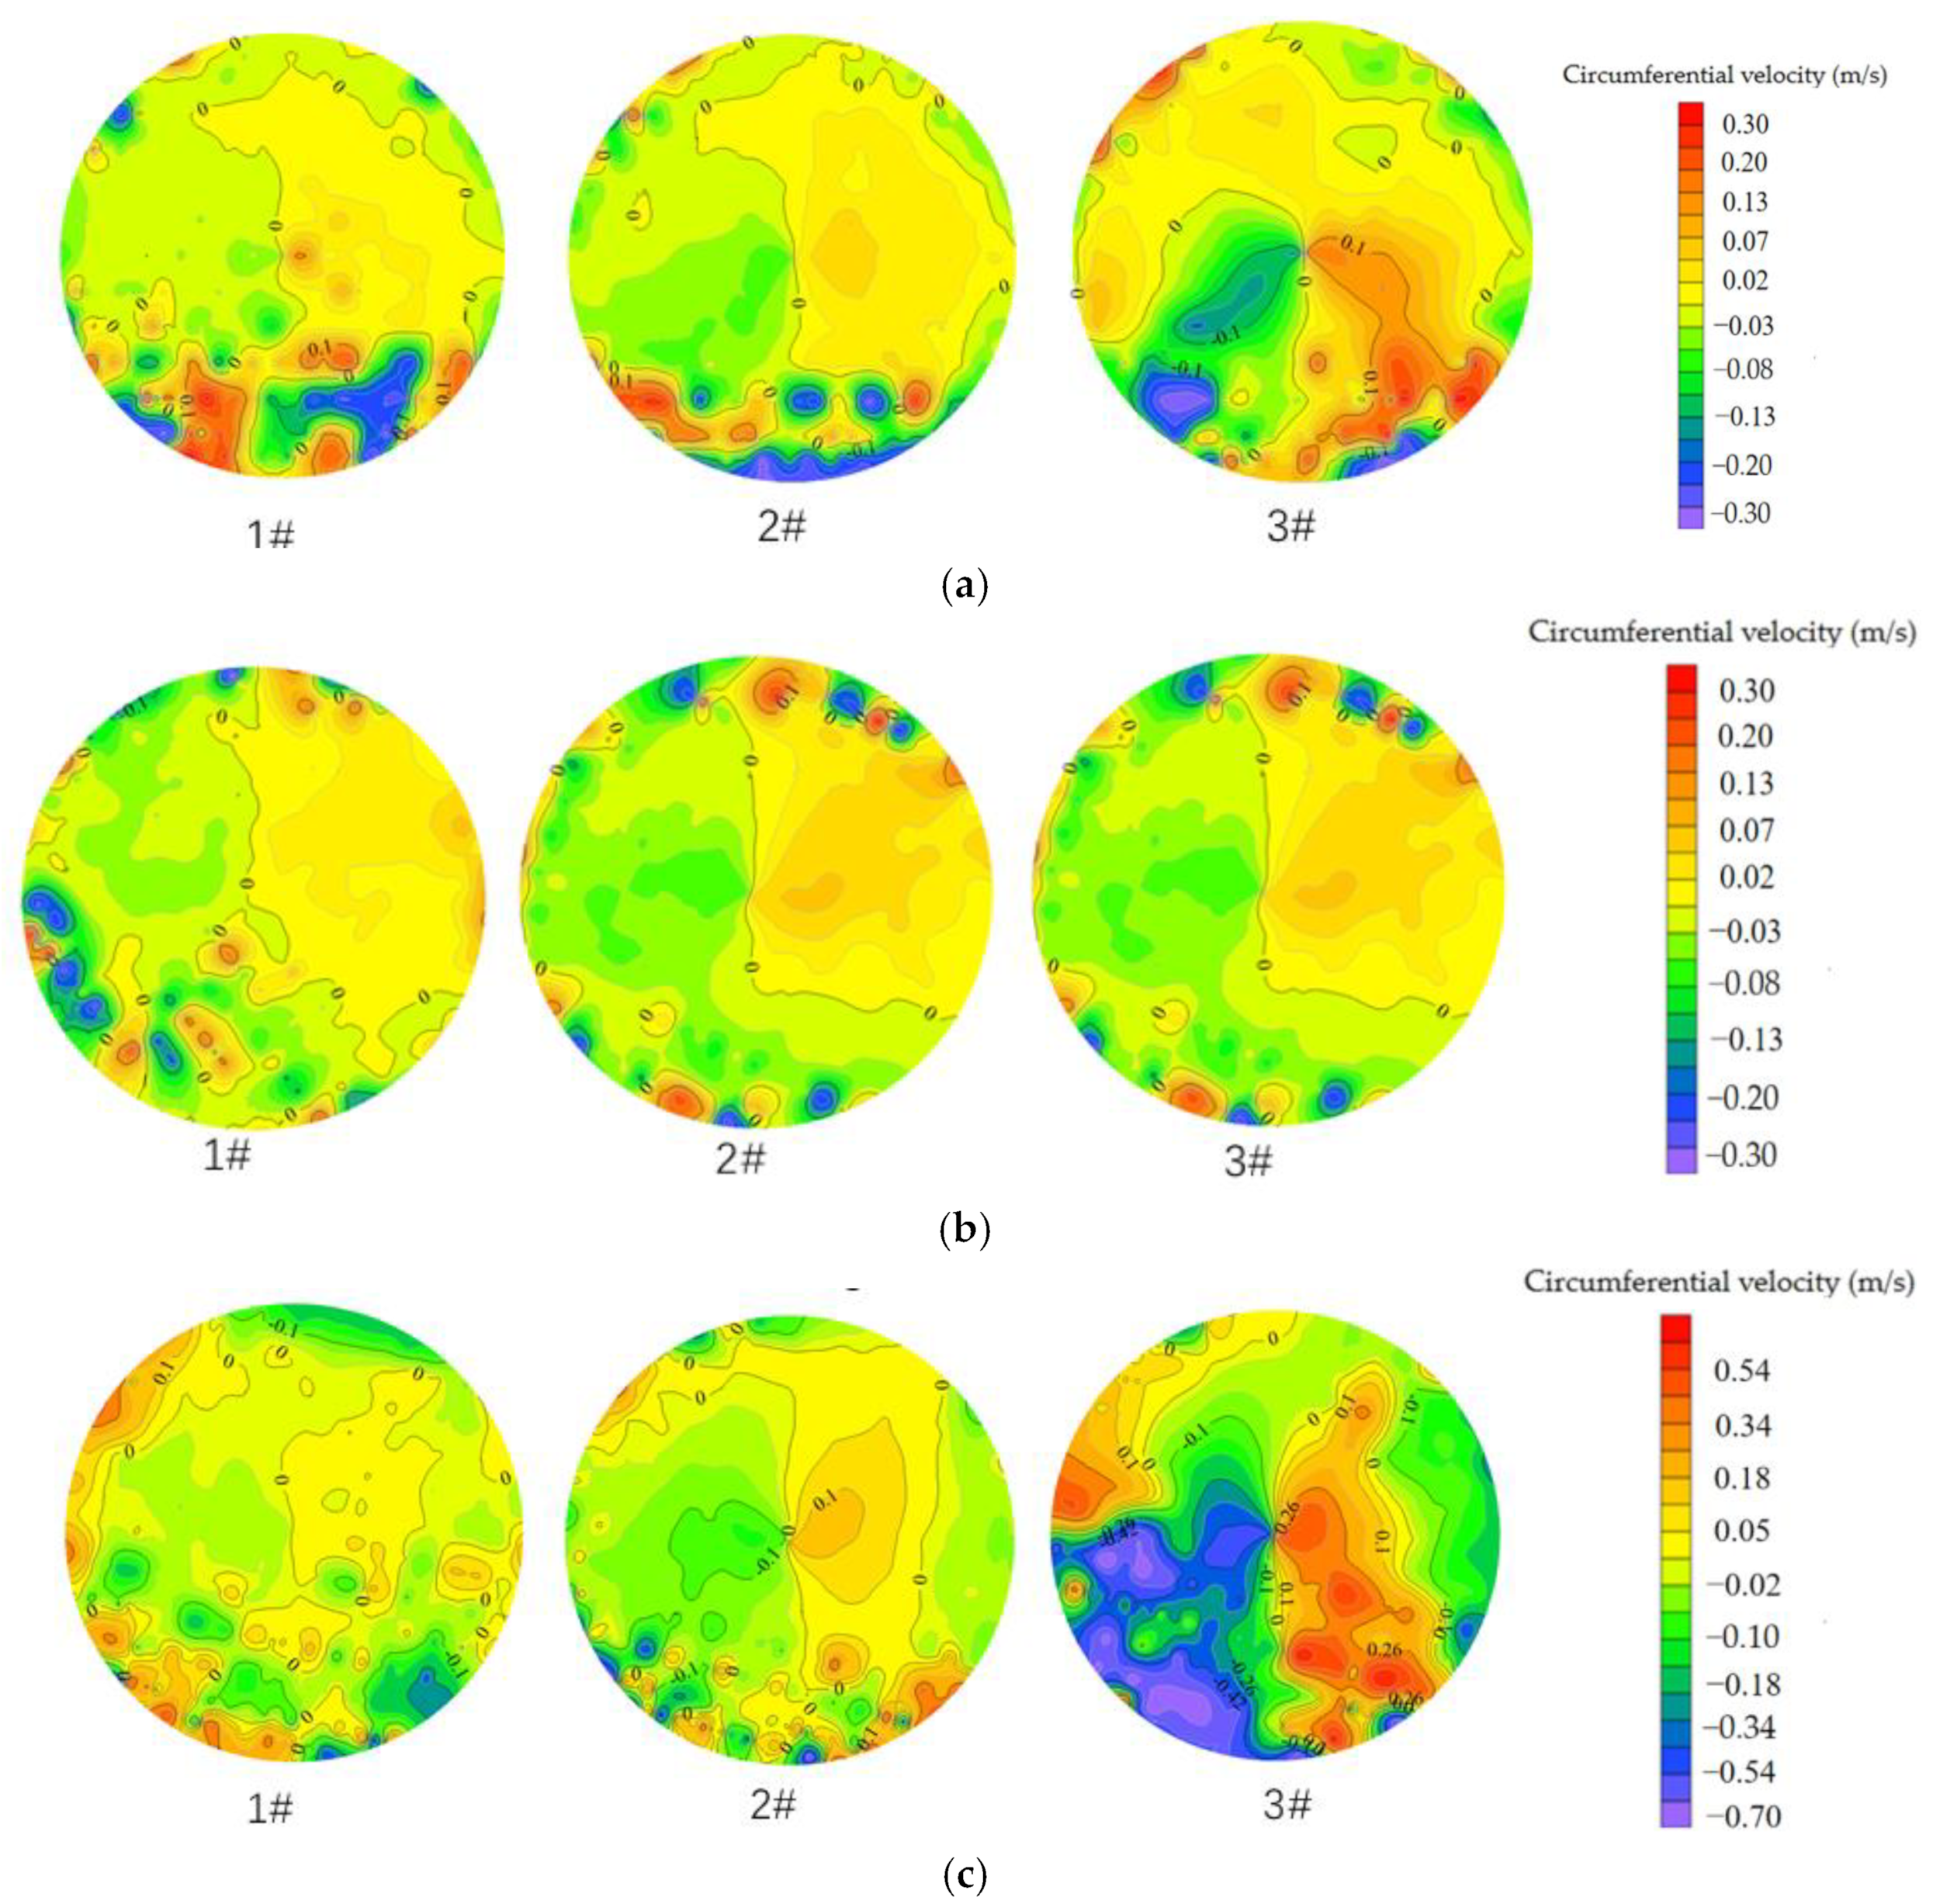
- The circumferential velocity distribution in the front section of the piped car is between −0.70 m/s and 0.62 m/s, and the variation in circumferential velocity is larger than that for radial velocity. The absolute value of the circumferential velocity is the largest at the center of the pipe axis, and the absolute value of the velocity gradually decreases when moving from the center of the pipe axis to the pipe wall along the radius direction. At the position of section #1 and section #2, the sections are divided into two areas with the 90° polar axis and 270° polar axis as the dividing line, defining the area from 90° to 270° along the anticlockwise direction of the polar axis as the left area and the area from 270° to 90° along the anticlockwise direction of the polar axis as the right area. The negative circumferential velocity of section #1 and section #2 is mainly distributed in the left area, and the flow is in the anticlockwise direction; the positive circumferential velocity is mainly distributed in the right area, and the flow is in the clockwise direction. At the position of section #3 in front of the car, the absolute value of the circumferential velocity increases significantly, and the variation gradient of velocity is larger. When the piped car types are the same and the load increases, the absolute value of the circumferential velocity increases, and the variation gradient of velocity Increases in section #1, section #2, and section #3. At the position of section #1 in front of the car, when the values of load are 1.5 kg and 1.9 kg, the circumferential velocity is distributed between −0.30 m/s and 0.30 m/s, the positive circumferential velocity is mainly distributed in the right area, and the negative circumferential velocity is mainly distributed in the left area; when the load is 2.3 kg, the circumferential velocity is distributed between −0.70 m/s and 0.70 m/s, the trend of increasing flow velocity is significant, and the region of negative circumferential velocity increases. At the position of section #2 and section #3 in front of the car, the distribution law of circumferential velocity is similar, the absolute value of circumferential velocity increases, and the variation gradient of velocity increases. The positive circumferential velocity area of section #2 increases by 46%, and the flow tends to increase in the clockwise direction. The negative circumferential flow velocity area of section #3 increases by 34%, and the flow tends to increase in the counterclockwise direction. These results show that the increase in load has a greater effect on the circumferential velocity in front of the piped car when the piped car starts.
3.2. Characteristics of Flow Velocity in the Ring Gap Section when Starting the Piped Cars with Different Loads
- (1)
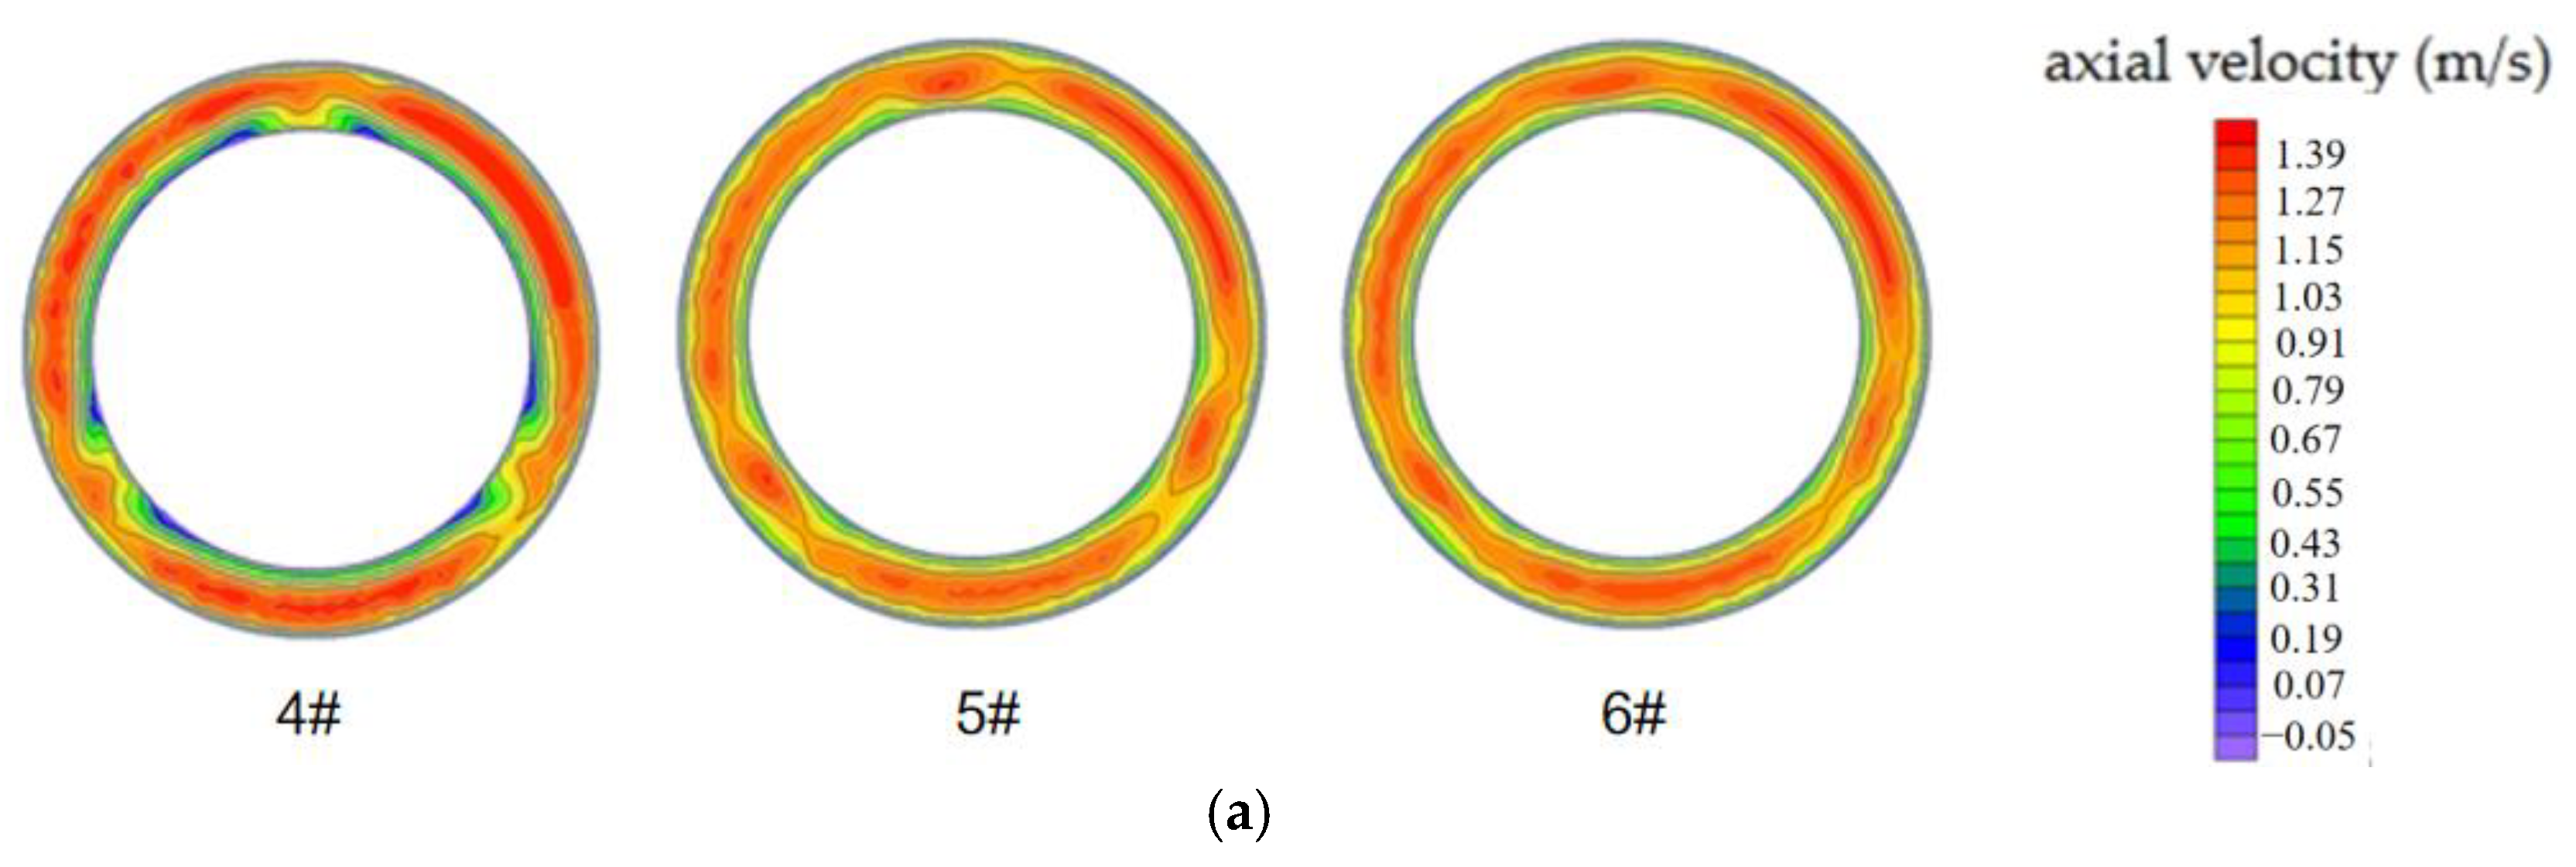
- The axial velocity in the ring gap section is distributed between −0.20 m/s and 2.37 m/s, the positive axial velocity is the same as that in the water flow direction, and the negative axial velocity is opposite to the water flow direction. The axial velocity is symmetrically distributed around the center of the section at 120°, and the flow velocity distribution is regionally obvious, with the maximum axial velocity in the center of the ring gap, which gradually decreases along the radius to the outer wall of the piped car and the inner wall of the pipeline. When the water flows from the front of the car area into the ring gap area, the direction of water flow changes due to the blocking effect of the piped car barrel, the water cross section decreases, and the axial velocity in the ring gap increases and is significantly larger than the axial velocity of the front section of the car. At the position of section #4 of the ring gap, the water flow just enters the ring gap area, the development is not sufficient over a short period of time, and the variation gradient of axial velocity is larger. The axial velocity is distributed between 1.39 m/s and 2.37 m/s; the axial velocity near the wall of the piped car body is smaller and has a negative value, and the flow velocity is distributed between −0.20 m/s and 0.68 m/s. The water flow is blocked by the barrel of the piped car, the cross section of the water suddenly shrinks, and the axial velocity in the center of the ring gap increases; the water flow near the wall of the piped car body is closer to the front legs of the pipeline car, and the formation of disturbed flow velocity under the influence of the legs is small. At the position of section #5 of the ring gap, the water flow develops more fully, the positive axial velocity decreases, the negative axial flow velocity disappears, and the variation gradient of velocity decreases. At the position of section #6 of the ring gap, the axial velocity decreases, and the regional distribution of flow velocity becomes more obvious. For the piped car for which L × D = 150 mm × 75 mm, when the load is increased from 1.5 kg to 2.3 kg, the average axial flow velocity of sections #4, #5, and #6 increases by about 55%, and the average flow velocity gradient increases by about 63%. Furthermore, the maximum value of axial velocity increases, the minimum value changes less, the variation gradient of velocity increases, and the contour spacing becomes smaller and has a more intense distribution. These results show that the increase in load has a greater effect on the axial velocity in the ring gap section when the piped car starts.
- (2)
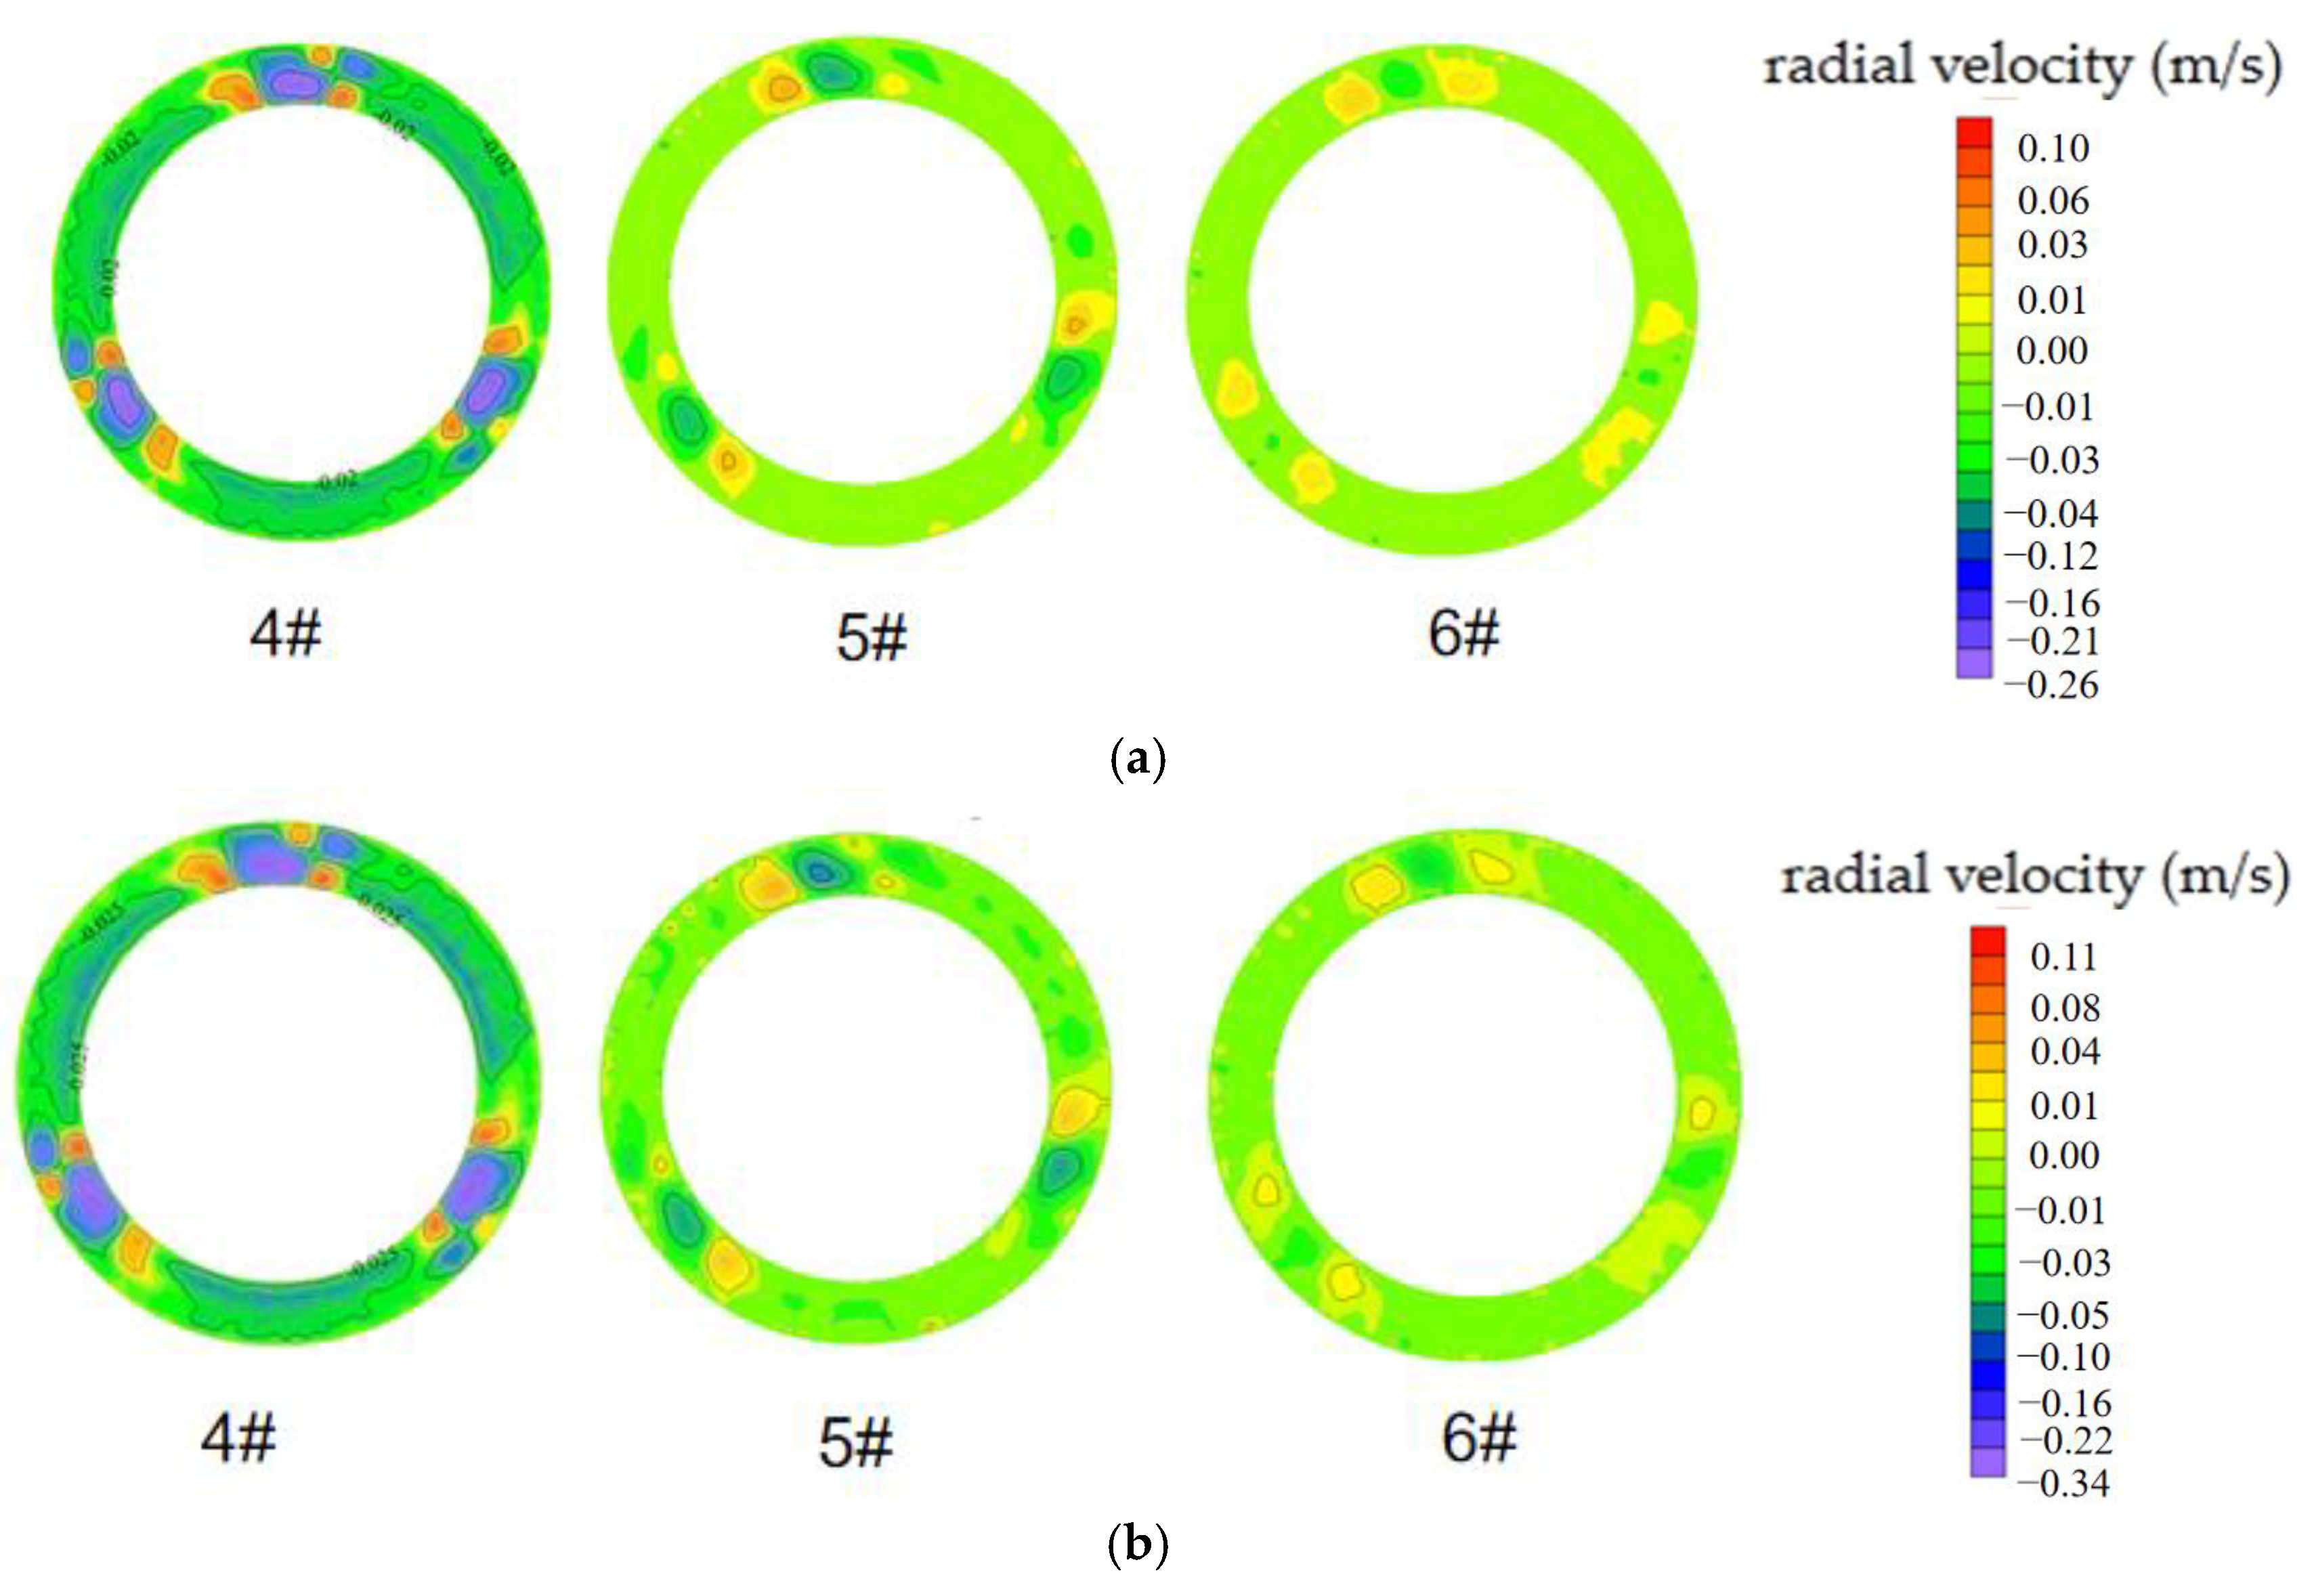
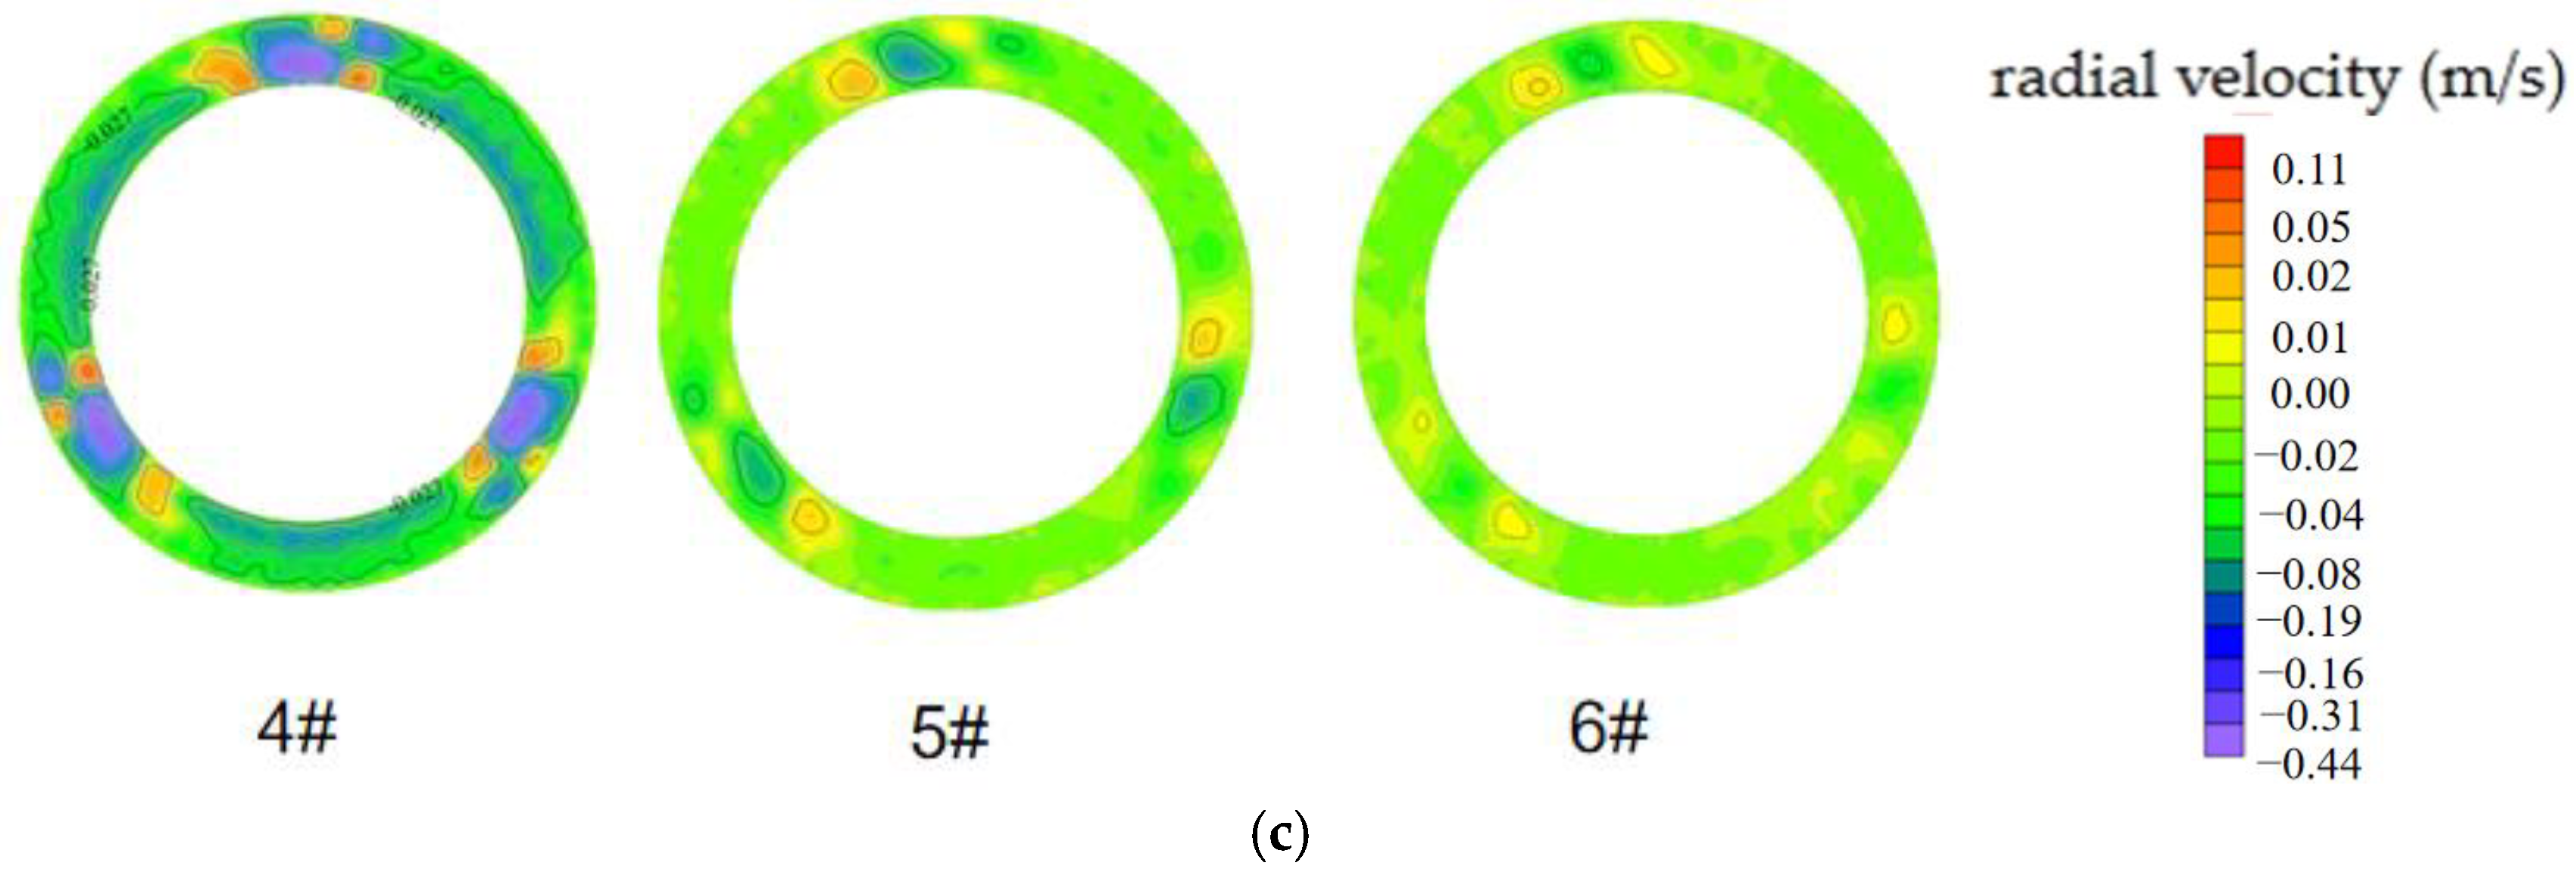
- The radial velocity in the ring gap section is distributed between −0.55 m/s and 0.19 m/s, the positive radial velocity ranges from the center of the section along the radius to the position of the pipeline wall, and the negative radial velocity ranges from the position of the pipeline wall to the position of the center of the section. Negative radial velocity accounted for a larger area of the ring gap section, indicating that most of the water flowed from the piped car body wall to the inner wall of the pipeline. At the position of section #4 of the ring gap, the difference between the maximum and minimum values of radial velocity is large, and the variation gradient of velocity is large. At the position of section #5 in the ring gap, the magnitude of the change in radial velocity decreases, and the distribution of flow contours is more sparse, indicating that the flow is more fully developed by the time it reaches section #5. At the position of section #6 in the ring gap, the variation gradient of radial velocity decreases, and the flow velocity is mainly negative, indicating that the radial velocity is directed toward the center of the circle along the radius direction. At this time, the water flow is about to flow out of the ring gap region, a process that is strongly influenced by the piped car barrel. The piped car’s rear-facing legs will also have a disruptive effect at the same time, causing the section of the ring gap flow radial velocity to be directed toward the center of the circle. For the piped car model for which L × D = 150 mm × 75 mm, the negative radial velocity decreases with the increase in load at the position of section #4, and the trend of decreasing gradually increases. At the positions of section #5 and section #6, the radial velocity increases as the piped car load increases, and the variation gradient of velocity increases. This shows that the increase in load has a greater effect on the radial velocity in the ring gap section when the piped car starts.
- (3)
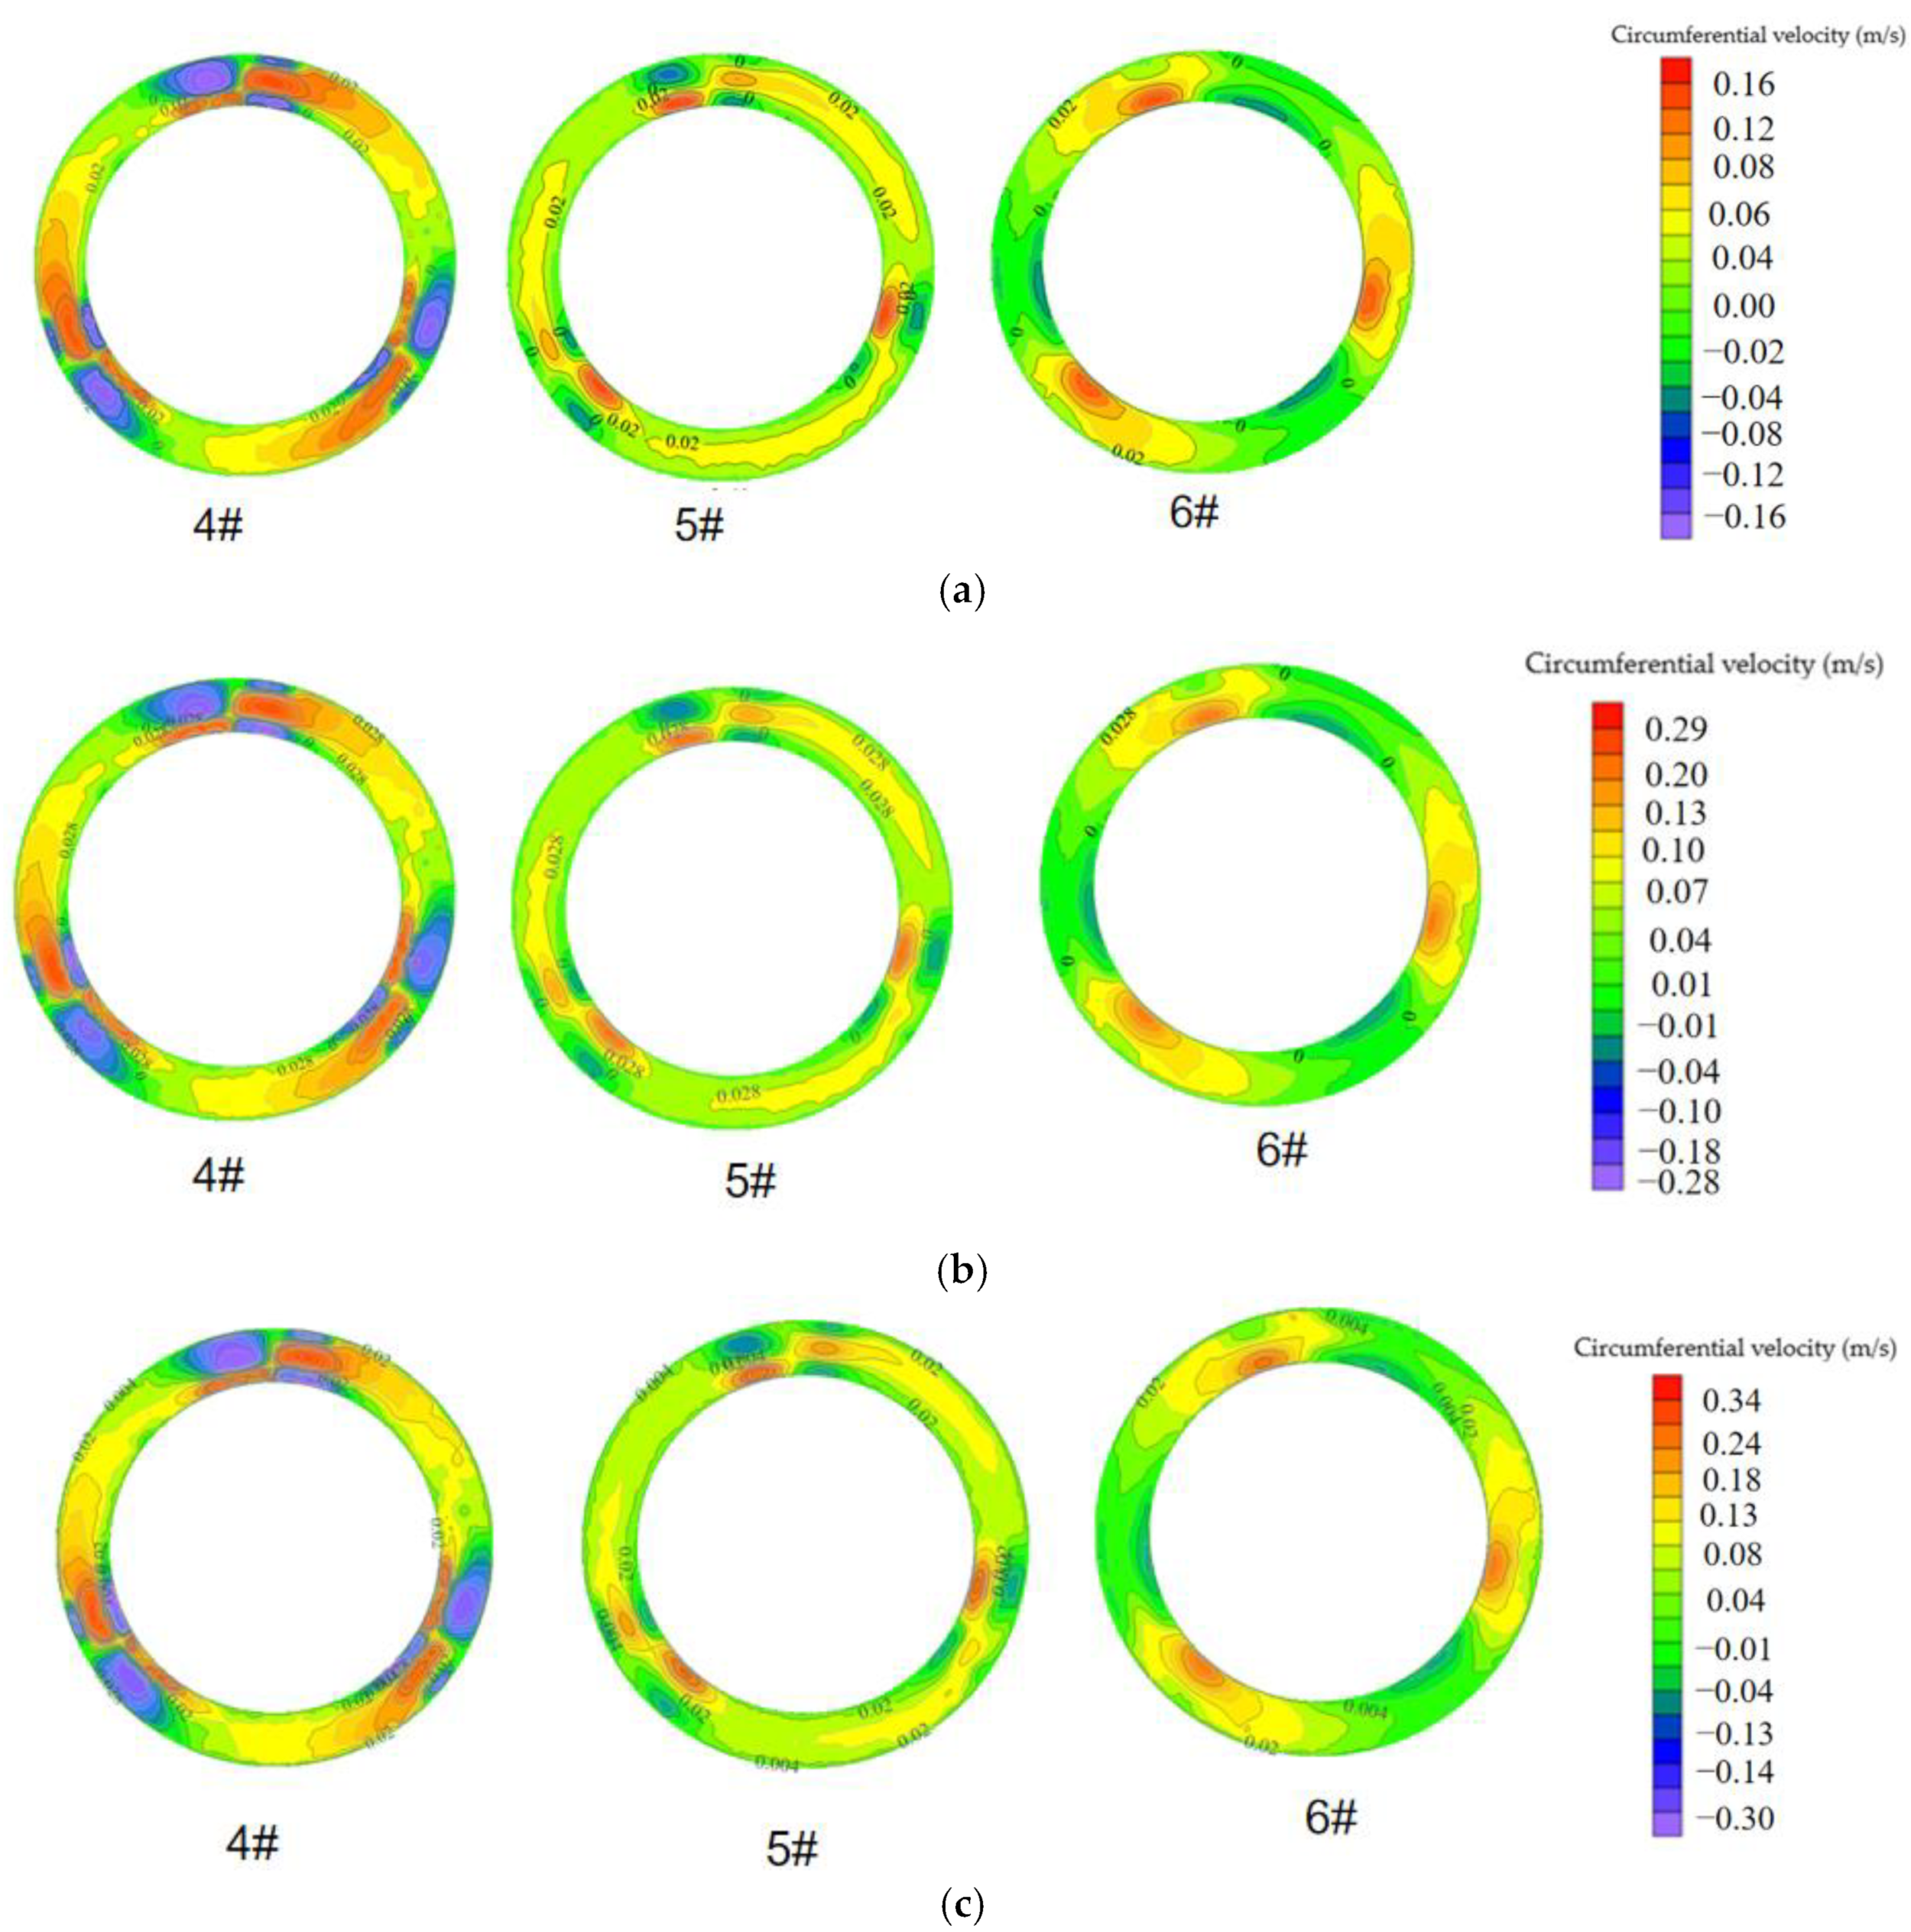
- The circumferential velocity in the ring gap section is distributed between −0.30 m/s and 0.34 m/s. The circumferential velocity in the ring gap area is mainly positive, and most of the water flows in the clockwise direction along the circumferential tangent. The circumferential velocity at sections #4, #5, and #6 of the ring gap is symmetrically distributed, with a rotation of 120° around the centers of the sections. At the position of section #4 in the ring gap, the variation gradient of circumferential velocity is larger, and the water flow, when entering the ring gap area of the piped car, collides with the connection between the front support piece and the legs of the piped car, greatly impacting the circumferential rate. As section #4 is the section at the position where the water flow just enters the ring gap area, the water flow is not yet fully developed, and the change in circumferential velocity is drastic. At the position of section #5 in the ring gap, the distribution law of circumferential velocity is similar to that of section #4, the negative circumferential velocity area decreases, the variation gradient of velocity decreases, and the influence of the piped car’s front legs and material barrel on the circumferential velocity decreases. At section #6, where the water is about to flow out of the ring gap area, the circumferential velocity is mainly affected by the rear legs of the piped car, causing the positive and negative circumferential velocity distribution areas to change significantly. For the pipeline car model for which L × D = 150 mm × 75 mm, with the increase in load, the piped car has a greater impact on the circumferential velocity in the ring gap section when starting.
3.3. Characteristics of Flow Velocity in the Rear Section of the Piped Car When Starting under Different Loads
- (1)
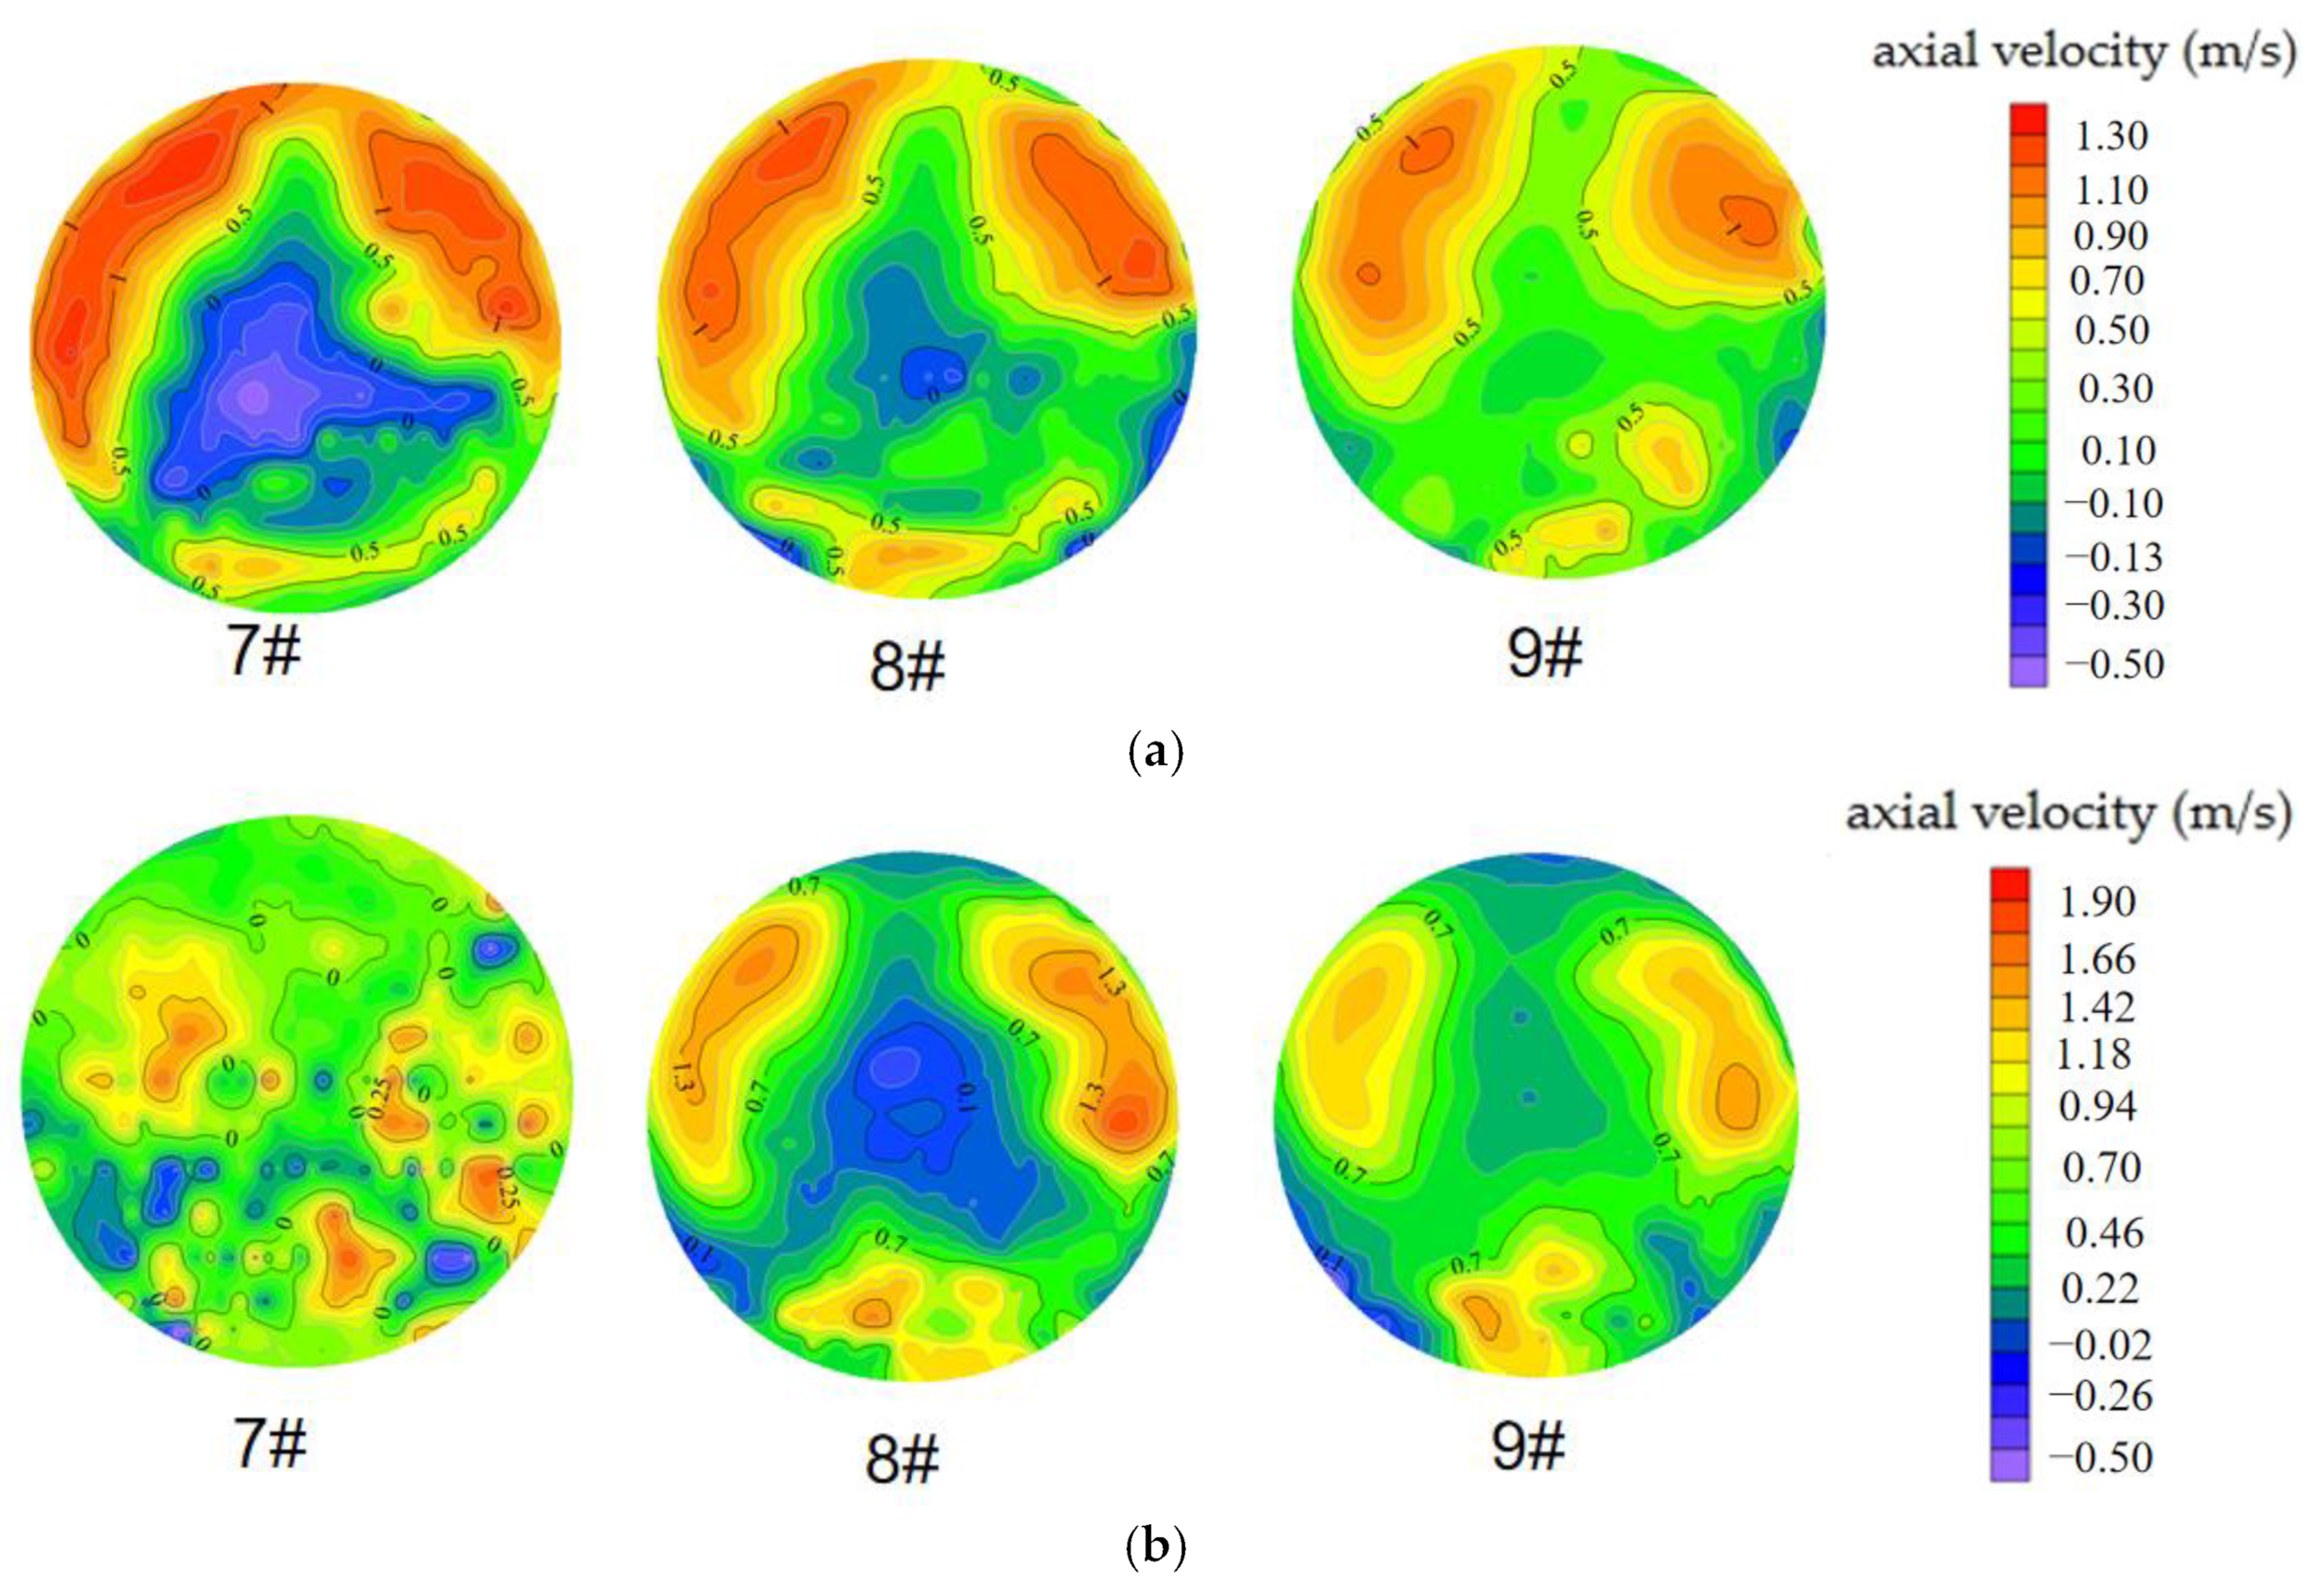
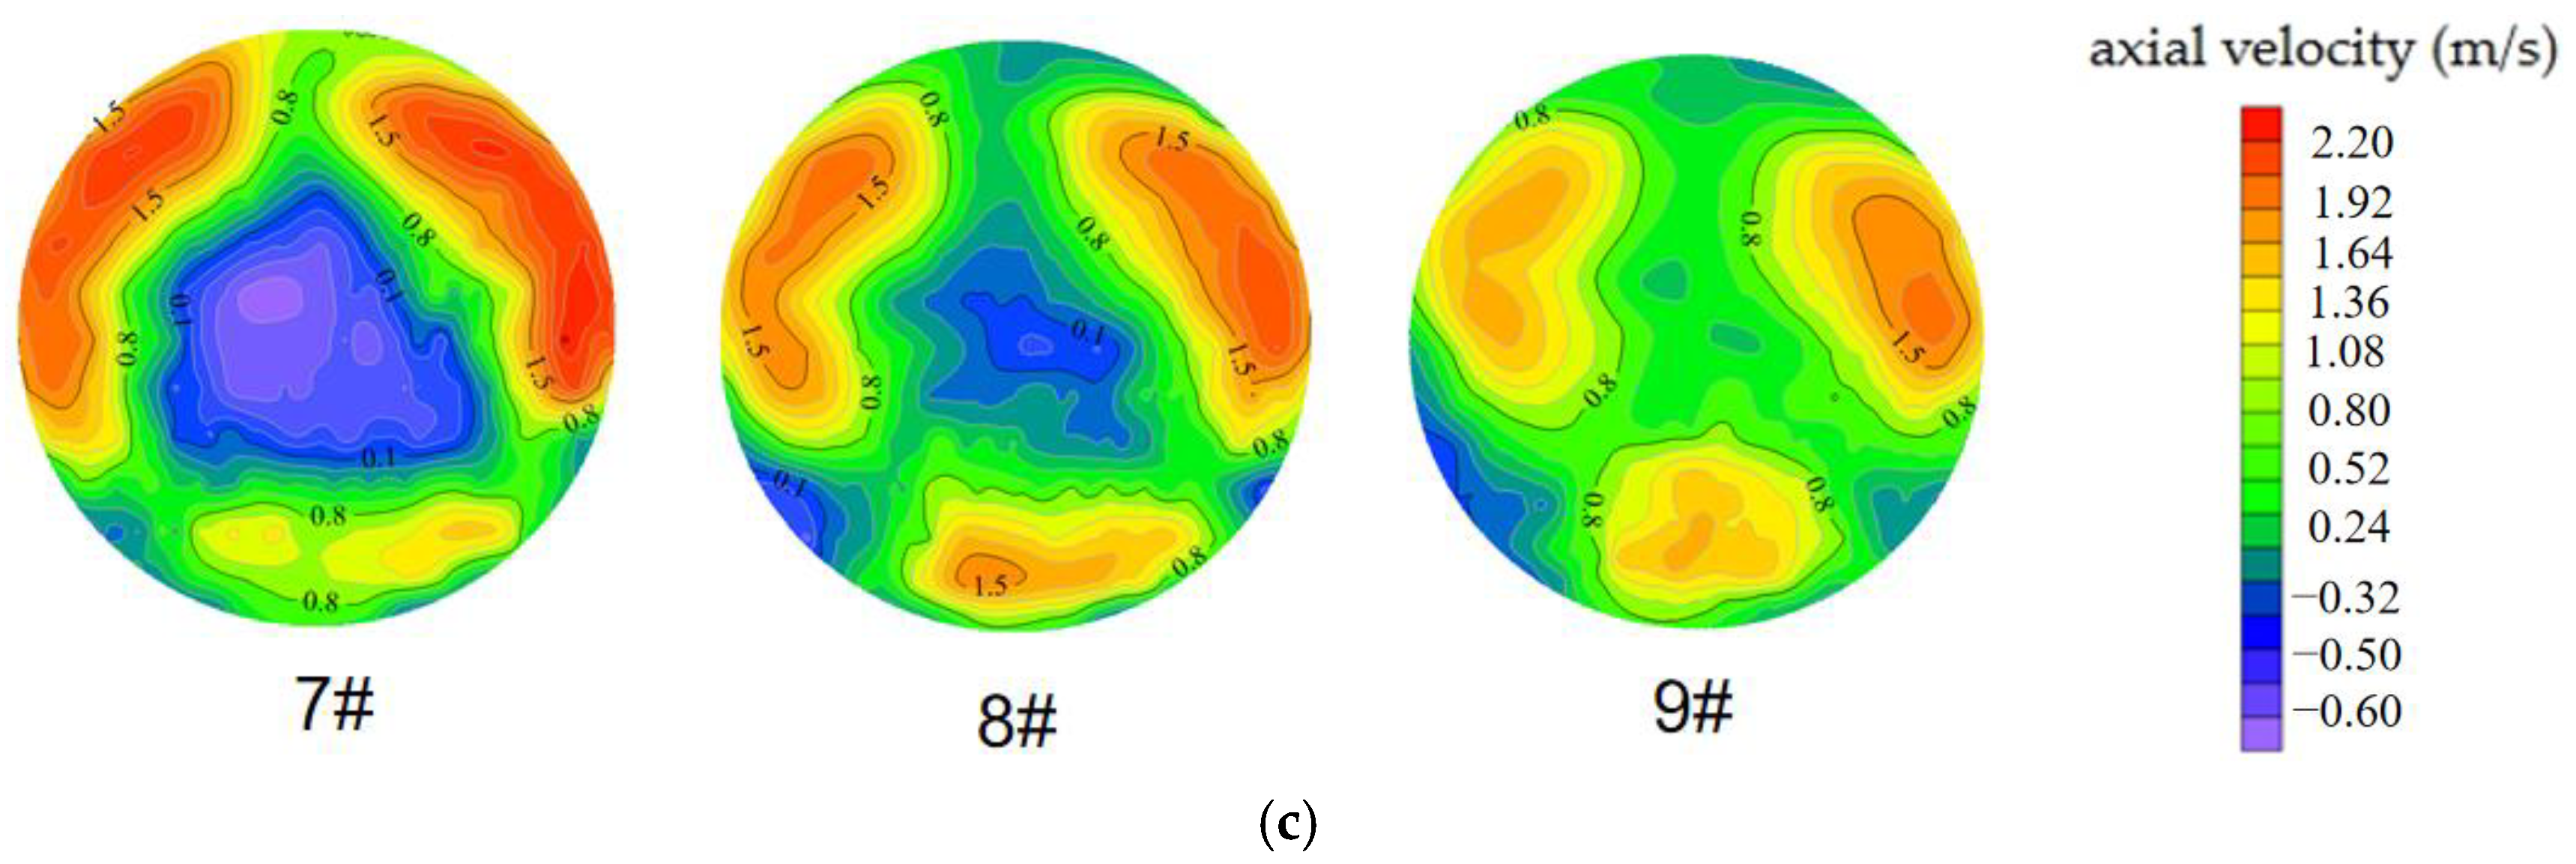
- The axial velocity in the rear section of the piped car is distributed between −0.60 m/s and 2.20 m/s, the positive axial velocity is the same as the water flow direction, and the negative axial velocity is the opposite of the water flow direction. The axial velocities in section #7, section #8, and section #9 are basically rotationally symmetric around the sections’ centers at 120°. When the water flows into the area at the rear of the car, the water cross section increases, and the average axial velocity of section #7, section #8, and section #9 behind the car is larger than the starting flow velocity of the piped car, and the axial flow velocity in the low-flow zone of section #7 at the rear of the car is distributed between −0.60 m/s and 0.00 m/s, which accounts for about 19% of the total area of section #7. When the water flows into the area at the rear of the car, the average axial velocity in section #7, section #8, and section #9 behind the car is larger than that of the water flow when the piped car starts because of the increase in the water cross section, and the axial velocity in the low-flow zone at section #7 is distributed between −0.60 m/s and 0.00 m/s, which accounts for about 19% of the total area of section #7. This indicates that as the water flow enters the rear area of the car, the water cross section increases, and a portion of the water flowing in will flow back behind the piped car, resulting in a negative axial velocity. At the position of section #8 at the rear of the car, the average axial velocity decreases in the high-flow-velocity zone, while the average axial velocity increases in the low-flow-velocity zone, and the variation gradient of velocity decreases. At the position of section #9 at the rear of the car, the average axial velocity in the high-flow-velocity zone at the rear of the car decreases, the negative axial velocity disappears, the variation gradient of velocity decreases, and the demarcation between the zones is gradually blurred. For the piped car for which L × D = 150 mm×75 mm, the load increased from 1.5 kg to 2.3 kg, the average axial flow velocity in the high-flow-velocity area behind the vehicle increased by 47.63%, and the average flow velocity gradient increased by 55.5%. Additionally, the average value of axial velocity in the low-flow velocity zone at the rear of the car changed less, and the variation gradient of velocity change increased. This shows that the increase in load has a greater effect on the axial velocity at the rear of the car when the piped car starts.
- (2)
- The radial velocity in the rear section of the piped car is distributed between −0.45 m/s and 0.50 m/s, the positive radial velocity ranges from the center of the section along the radius to the pipe wall position, and the negative radial velocity spans from the pipe wall position to the center of the section. At the position of section #7 at the rear of the piped car, the water flow just enters the area behind the car; at this time, the water flow is affected by the piped car’s rear-facing legs and the piped car ring gap area, the absolute value of radial flow rate is large, the flow rate changes drastically, and there is no obvious regional distribution of positive and negative radial velocity. At the positions of section #8 and section #9 at the rear of the car, the absolute value of radial velocity decreases, and the variation gradient of velocity decreases. For the piped car for which L × D = 100 mm × 75 mm, the regional distribution of positive and negative radial velocity is obvious with the increase in the load of the pipeline car. This indicates that the increase in load has a greater effect on the radial velocity at the rear of the car when the piped car starts.
- (3)
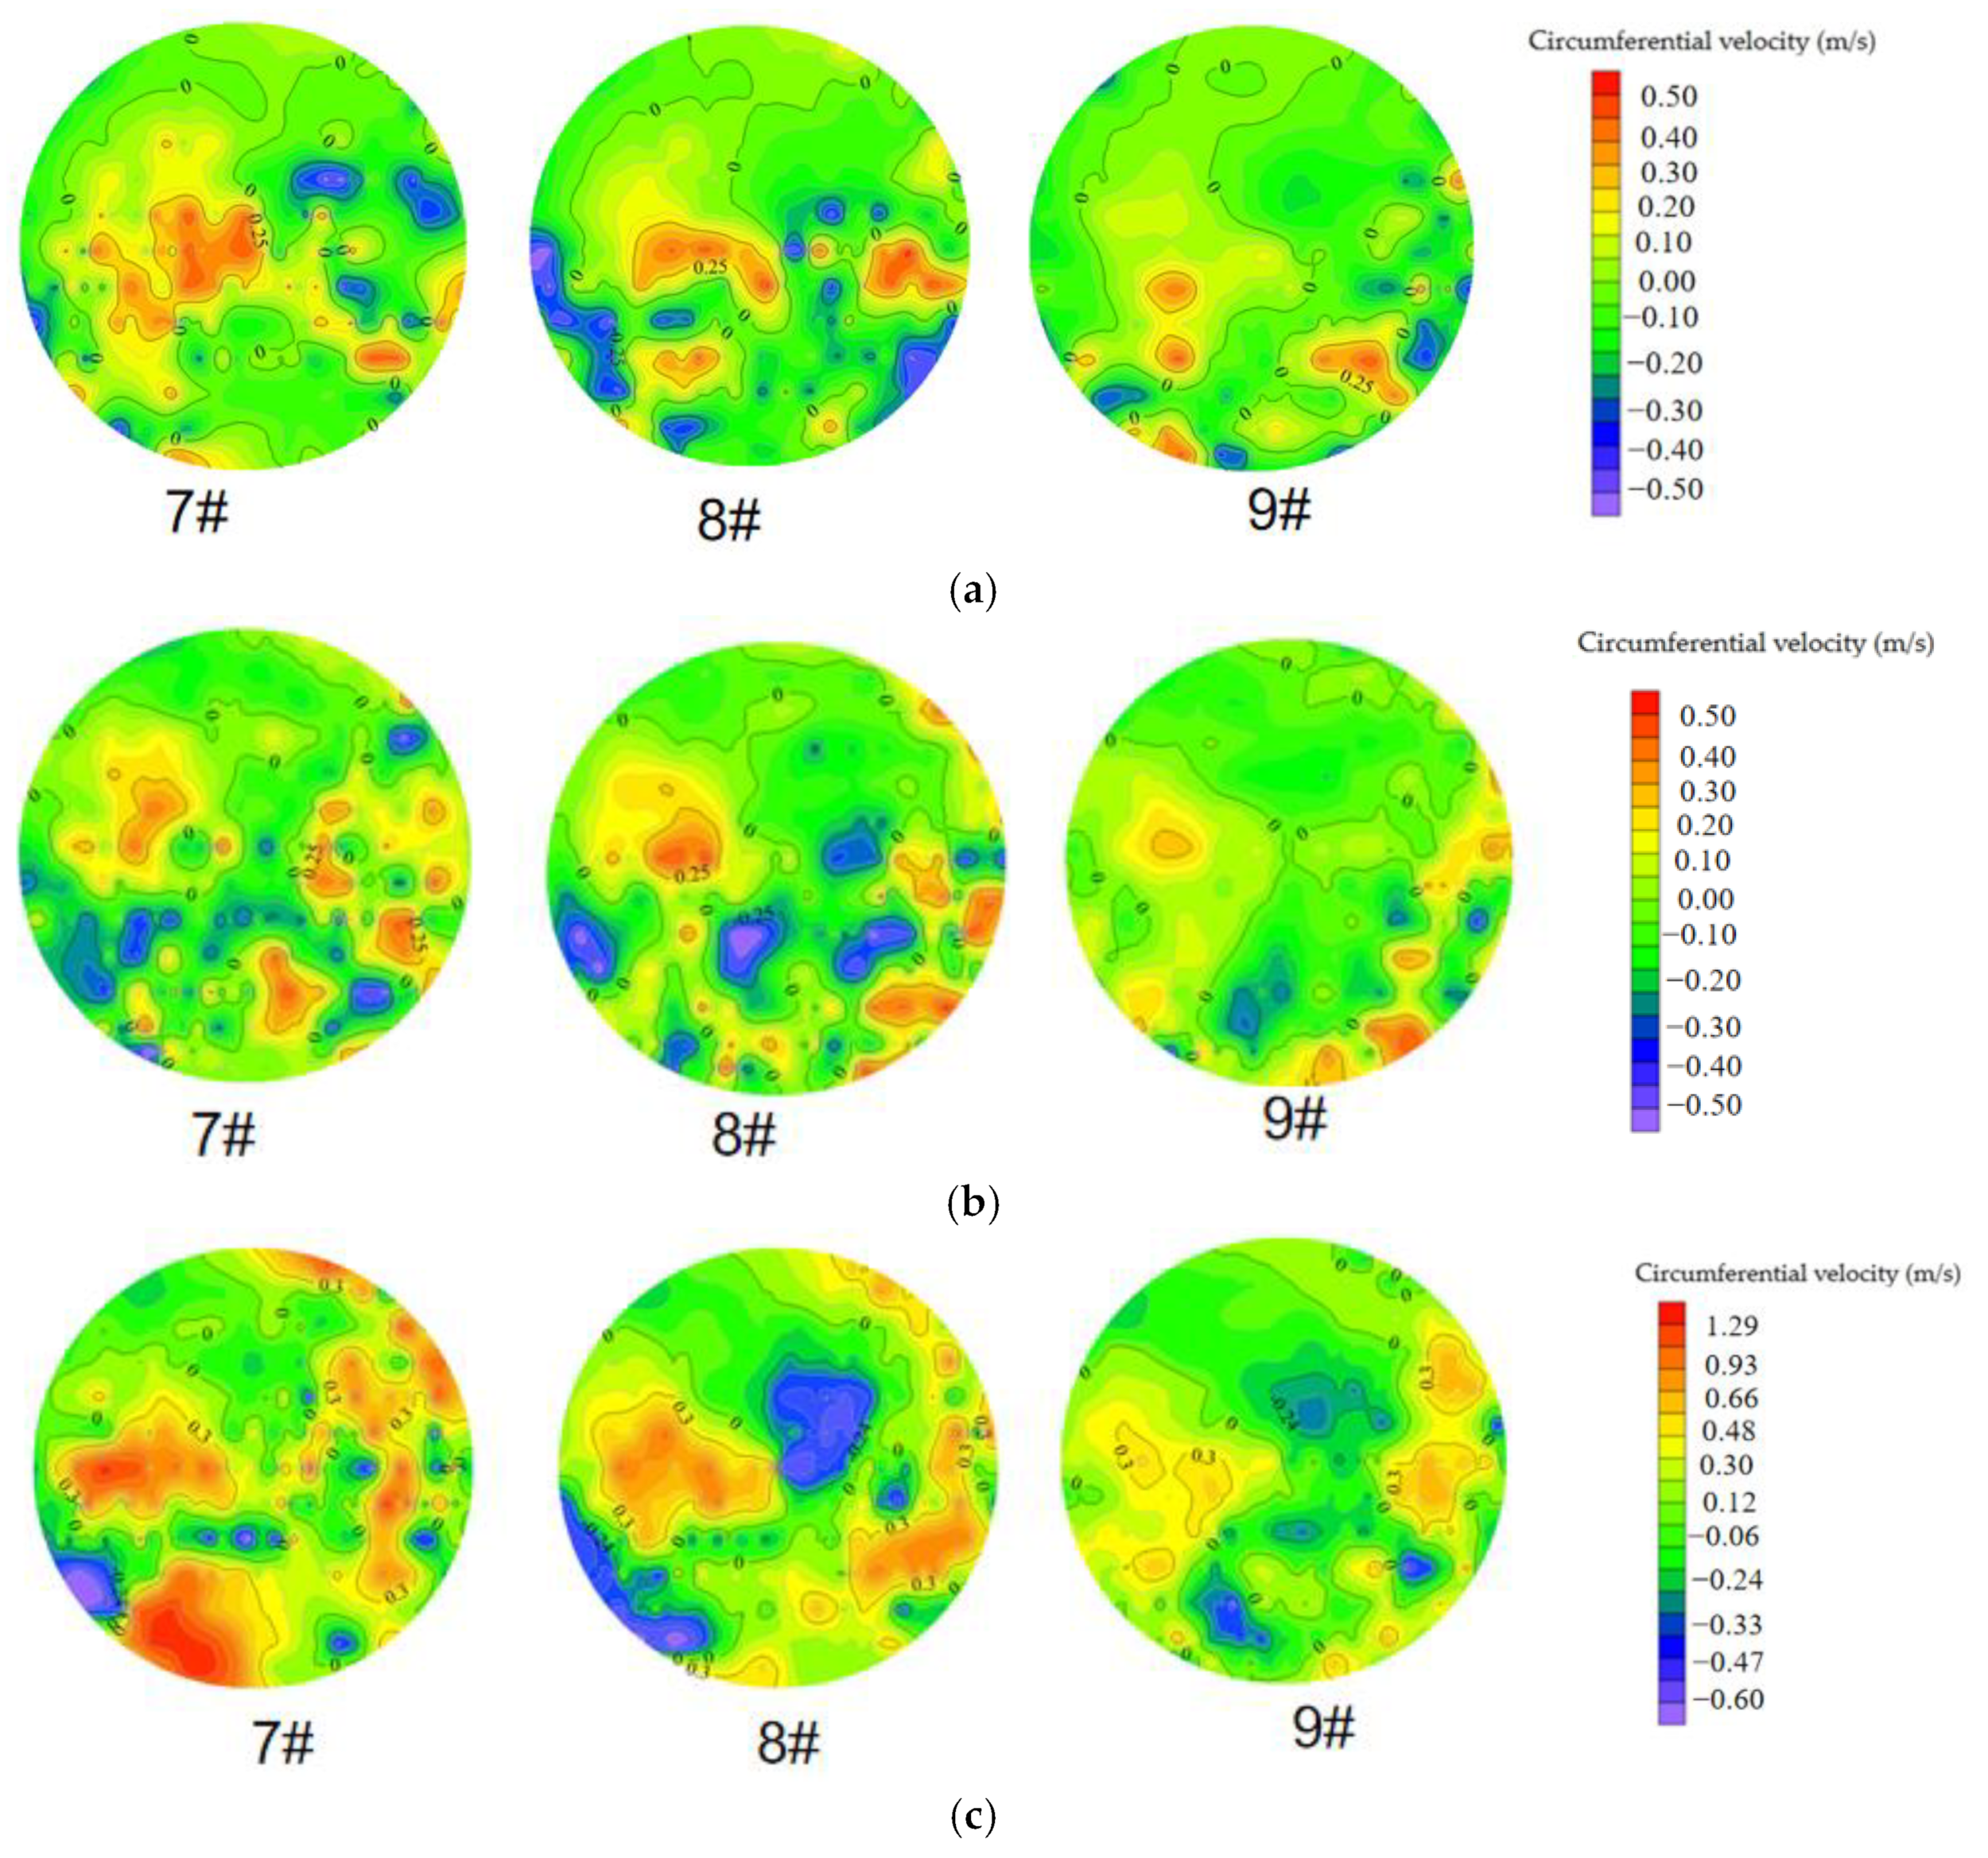
- The circumferential velocity in the rear section of the piped car is distributed between −0.60 m/s and 1.29 m/s. When the value of the circumferential velocity is positive, the water flows clockwise along the circumferential tangent line; when the value of the circumferential velocity is negative, the water flows anti-clockwise along the circumferential tangent line. Due to the sudden expansion of the water cross section, the water flow is blocked by the legs of the piped car, resulting in large disturbances, and the change in circumferential velocity becomes more intense. At the position of section #7 at the rear of the piped car, the variation gradient of the circumferential velocity is larger. The absolute value of the circumferential velocity at section #8 decreases, and the variation gradient of the circumferential velocity decreases; the change rule of the circumferential velocity at section #9 is similar to that at section #8. This shows that as the distance from the piped car increases, the influence of the piped cars’ legs on circumferential velocity gradually decreases. For the piped car for which L × D = 150 mm × 75 mm, as the piped car load increases, the area of the positive circumferential velocity region increases, and the regional distribution of the flow velocity is more obvious. This shows that the increase in load has a greater effect on the circumferential velocity at the rear of the car when the piped car starts.
4. Conclusions
- Characteristics of flow velocity in front of the car: The axial velocity of the front section is distributed between 0.00 m/s and 1.13 m/s, and all of these values are positive. When the load of the piped car increases, the axial velocity increases, and the variation gradient of velocity increases. The radial flow velocity of the front section is distributed between −0.45 m/s and 0.50 m/s, and the flow velocity is both positive and negative. When the load of the piped car increases, the absolute value of the radial velocity increases, the variation gradient of velocity increases, the positive radial velocity area increases, and the boundary of the positive and negative radial velocity area distribution gradually becomes fuzzy. The circumferential flow velocity of the front section is distributed between −0.70 m/s and 0.62 m/s. When the load of the piped car increases, the absolute value of the circumferential velocity increases, the variation gradient of velocity increases, the distribution of the positive and negative circumferential velocity is regionally obvious, and the negative circumferential velocity area increases. The increase in load has a greater effect on axial velocity, radial velocity, and circumferential velocity when the piped car starts.
- Characteristics of flow velocity in the ring gap section: When the piped car models are the same, axial velocity, radial velocity, and circumferential velocity have a 120° rotational symmetric distribution around the center of the cross section. The axial flow velocities of the annulus sections are all distributed in the range of −0.20 m/s to 2.37 m/s. When the load increases, the axial velocity increases, the variation gradient of velocity increases, and the contour spacing becomes smaller and more densely distributed. The radial flow velocity of the annular section is distributed between −0.55 m/s and 0.19 m/s. When the load of the piped car increases, the positive radial velocity increases, the negative radial velocity decreases, and the variation gradient of velocity increases. The circumferential flow velocity in the annular region of the annular section is distributed between −0.30 m/s and 0.34 m/s. When the load of the piped car increases, the absolute value of circumferential velocity increases, the variation gradient of velocity increases, and the flow velocity contour becomes densely distributed. The increase in load has a greater effect on axial velocity, radial velocity, and circumferential velocity when the piped car starts.
- Characteristics of flow velocity in the rear of the car: The axial velocity of the rear section is distributed between −0.60 m/s and 2.20 m/s. When the piped car load increases, the axial velocity presents a symmetric distribution of a 120° rotation around the center of the cross section, and the regional demarcation of the velocity is more obvious. Furthermore, the average value of the axial velocity in the high-flow-velocity area behind the car increases, and the variation gradient of velocity increases. The radial flow velocity of the rear section is distributed between −0.45 m/s and 0.50 m/s. When the load of the piped car increases, the absolute value of the radial velocity increases, and the positive and negative flow velocity distributions are obvious in this region. The circumferential flow velocity of the rear section is distributed between −0.60 m/s and 1.29 m/s. When the load of the piped car increases, the absolute value of the circumferential velocity increases, the variation gradient of velocity increases, and the positive circumferential velocity area increases. The regional distribution of flow velocity is more obvious. The increase in load has a greater effect on axial velocity, radial velocity, and circumferential velocity when the piped car starts.
Author Contributions
Funding
Data Availability Statement
Acknowledgments
Conflicts of Interest
References
- Zhang, W.; Wu, S.; Ji, H.; Kolbe, H. Estimation of Agricultural Non-Point Source Pollution in China and the Alleviating StrategiesI. Estimation of Agricultural Non-Point Source Pollution in China in Early 21 Century. Sci. Agric. Sin. 2004, 7, 1008–1017. [Google Scholar]
- Wang, Y.; Sheng, L.; Li, K.; Sun, H. Analysis of present situation of water resources and countermeasures for sustainble development in China. J. Water Resour. Water Eng. 2008, 3, 10–14. [Google Scholar]
- Han, Y. Weak Magnetic Technology and Application on Pipeline Ontology Defect Testing. Pipeline Tech. Equip. 2019, 3, 27–30. [Google Scholar]
- Li, Y.; Pang, Y.; Song, X.; Jia, X.; Lu, Y.; Sun, X.; Zhang, X. Influence of setting angle for guide bar on velocity characteristics of spiral flow in cross-sections between piped carriages. Trans. Chin. Soc. Agric. Eng. 2021, 37, 87–94. [Google Scholar]
- Sun, X.; Li, Y.; Yan, Q. Experimental study on the starting conditions of hydraulic conveying piped car for cylinder loading pipelines. National Symposium Hydrodynamics 2006, 8, 417–423. [Google Scholar]
- Ellis, H. The pipeline flow of capsules: Part 3-An experimental investigation of the transport by water of single cylindrical and spherical capsules with density equal to that of the water. Can. J. Chem. Eng. 1964, 42, 1–8. [Google Scholar] [CrossRef]
- Kroonenberg, H. A mathematical model for concentric horizontal capsule transport. Can. J. Chem. Eng. 1978, 56, 538–543. [Google Scholar] [CrossRef]
- Ma, H.; Kuo, C. Control of boundary layer flow and lock-on of wake behind a circular cylinder with a normal slit. Eur. J. Mech. B-Fluids 2016, 59, 99–114. [Google Scholar] [CrossRef]
- Ihab, G.; Sadek, Z.; Mohamed, F.; Mohamed, A. Turbulent flow around single concentric long capsule in a pipe. Appl. Math. Model. 2010, 34, 2000–2017. [Google Scholar]
- Ivanov, V.; Sokolov, S.; Ogudova, E. Methods of increasing efficiency and maintainability of pipeline systems. IOP Conf. Ser. Mater. Sci. Eng. 2018, 357, 012016. [Google Scholar] [CrossRef]
- Sultan, A.; Rahman, A.; Rushd, S. Validation of CFD model of multiphase flow through pipeline and annular geometries. Part. Sci. Technol. 2019, 37, 681–693. [Google Scholar] [CrossRef]
- Peng, W.; Xu, K.; Miao, Y. Experimental and CFD investigation of flow behavior and sand erosion pattern in a horizontal pipe bend under annular flow. Particuology 2023, 75, 11–25. [Google Scholar] [CrossRef]
- Cheng, Z.; Li, J.; Chen, Z.; Chen, J.; Fan, R.; Liu, H. Study on numerical simulation of fluid flow in a sudden shrinking circular tube. Chem. Eng. Equip. 2021, 11, 3–6. [Google Scholar]
- Jiang, F.; Huang, H.; Chen, M.; Huang, H. Study on Interfacial Fluctuation of Oil-water Annular Flow in Sudden Contraction Pipe. J. Ningxia Univ. (Nat. Sci. Ed.) 2023, 44, 226–233. [Google Scholar]
- Paul, A.; Bhattacharyya, S. Analysis and Design for Hydraulic Pipeline Carrying Capsule Train. J. Pipeline Syst. Eng. Pract. 2021, 12, 04021003. [Google Scholar] [CrossRef]
- Asim, T.; Mishra, R. Computational fluid dynamics based optimal design of hydraulic capsule pipelines transporting cylindrical capsules. Powder Technol. 2016, 295, 180–201. [Google Scholar] [CrossRef]
- Asim, T.; Mishra, R.; Abushaala, S.; Jain, A. Development of a design methodology for hydraulic pipelines carrying rectangular capsules. Int. J. Press. Vessel. Pip. 2016, 146, 111–128. [Google Scholar] [CrossRef]
- Lenau, C.; El-Bayya, M. Unsteady flow in hydraulic capsule pipeline. J. Eng. Mech. 1996, 122, 1168–1173. [Google Scholar] [CrossRef]
- Zhang, C.; Sun, X.; Li, Y.; Zhang, X. Numerical simulation of hydraulic characteristics of cyclical slit flow with moving boundary of tube-contained raw materials pipelines hydraulic transportation. Trans. Chin. Soc. Agric. Eng. 2017, 30, 76–85. [Google Scholar]
- Zhao, Y.; Li, Y.; Sun, X. Transient Model for the Hydrodynamic Force in a Hydraulic Capsule Pipeline Transport System. Sustainability 2023, 15, 15575. [Google Scholar] [CrossRef]
- Zhao, Y.; Li, Y.; Sun, X. Modal Analysis of the Hydrodynamic Force of a Capsule in a Hydraulic Capsule Pipeline. J. Mar. Sci. Eng. 2023, 11, 1738. [Google Scholar] [CrossRef]
- Turkowski, M.; Szudarek, M. Pipeline system for transporting consumer goods, parcels and mail in capsules. Tunn. Undergr. Space Technol. Inc. Trenchless Technol. Res. 2019, 93, 103057. [Google Scholar] [CrossRef]
- Asim, T.; Algadi, A.; Mishra, R. Effect of capsule shape on hydrodynamic characteristics and optimal design of hydraulic capsule pipelines. J. Pet. Sci. Eng. 2018, 161, 390–408. [Google Scholar] [CrossRef]
- Yang, X.; Ma, J. The Wall Stress of the Capsule Surface in the Straight Pipe. Water 2020, 12, 242. [Google Scholar] [CrossRef]
- Taimoor, A.; Rakesh, M.; Kuldip, U. Optimal Design of Capsule Transporting Pipeline carrying Spherical Capsules. J. Phys. 2012, 364, 012070. [Google Scholar]
- Ulusarslan, D.; Teke, I. Comparison of Pressure Gradient Correlations for the Spherical Capsule Train Flow. Part. Sci. Technol. 2008, 26, 285–295. [Google Scholar] [CrossRef]
- Ulusarslan, D. Analysis of the Pressure Gradients According to Capsule Flow Mechanism. Part. Part. Syst. Charact. 2012, 29, 167–177. [Google Scholar] [CrossRef]
- Deniz, U. Effect of Capsule Density and Concentration on Pressure Drops of Spherical Capsule Train Conveyed by Water. J. Fluids Eng. 2010, 132, 011304. [Google Scholar]





| Experimental Setting | Main Parameter |
|---|---|
| Illumination | Dual Power Nd-YLF Laser (2 × 30 mJ) |
| Camera lens | 2 Imager pro HS cameras |
| Image dimension | 2016 × 2016 pixels |
| Interrogation area | 32 × 32 pixels |
| Time between pulses | 5 × 10³ µs |
| Seeding material | Polystyrene particles diameter 55 µm |
| Resolution ratio | 39.68 µm/pixel |
Disclaimer/Publisher’s Note: The statements, opinions and data contained in all publications are solely those of the individual author(s) and contributor(s) and not of MDPI and/or the editor(s). MDPI and/or the editor(s) disclaim responsibility for any injury to people or property resulting from any ideas, methods, instructions or products referred to in the content. |
© 2024 by the authors. Licensee MDPI, Basel, Switzerland. This article is an open access article distributed under the terms and conditions of the Creative Commons Attribution (CC BY) license (https://creativecommons.org/licenses/by/4.0/).
Share and Cite
Lu, Y.; Sun, X.; Li, Y.; Wang, C.; Tao, S. Research on the Characteristics of Flow Velocity of a Piped Car when Starting in a Straight Pipe Section under Different Loads. Water 2024, 16, 840. https://doi.org/10.3390/w16060840
Lu Y, Sun X, Li Y, Wang C, Tao S. Research on the Characteristics of Flow Velocity of a Piped Car when Starting in a Straight Pipe Section under Different Loads. Water. 2024; 16(6):840. https://doi.org/10.3390/w16060840
Chicago/Turabian StyleLu, Yifan, Xihuan Sun, Yongye Li, Cheng Wang, and Siyuan Tao. 2024. "Research on the Characteristics of Flow Velocity of a Piped Car when Starting in a Straight Pipe Section under Different Loads" Water 16, no. 6: 840. https://doi.org/10.3390/w16060840
APA StyleLu, Y., Sun, X., Li, Y., Wang, C., & Tao, S. (2024). Research on the Characteristics of Flow Velocity of a Piped Car when Starting in a Straight Pipe Section under Different Loads. Water, 16(6), 840. https://doi.org/10.3390/w16060840


